Embed Size (px)
Citation preview

1
UNCTAD
REGIONAL VALUE CHAINS
BACKGROUND PAPER
Experiences of Sri Lanka in the Sri Lanka –
India FTA and the Sri Lanka – Pakistan FTA
Saman Kelegama and Chandana Karunaratne
Institute of Policy Studies
BACKGROUND PAPER NO. RVC-10
This study was prepared for UNCTAD as a background paper for to the ECIDC Report 2012. The financial

2
Experiences of Sri Lanka in the Sri Lanka –
India FTA and the Sri Lanka – Pakistan FTA
Saman Kelegama and Chandana Karunaratne
UNCTAD
JANUARY 2013
Executive Director, Institute of Policy Studies, Sri Lanka
Research Officer, IPS
3
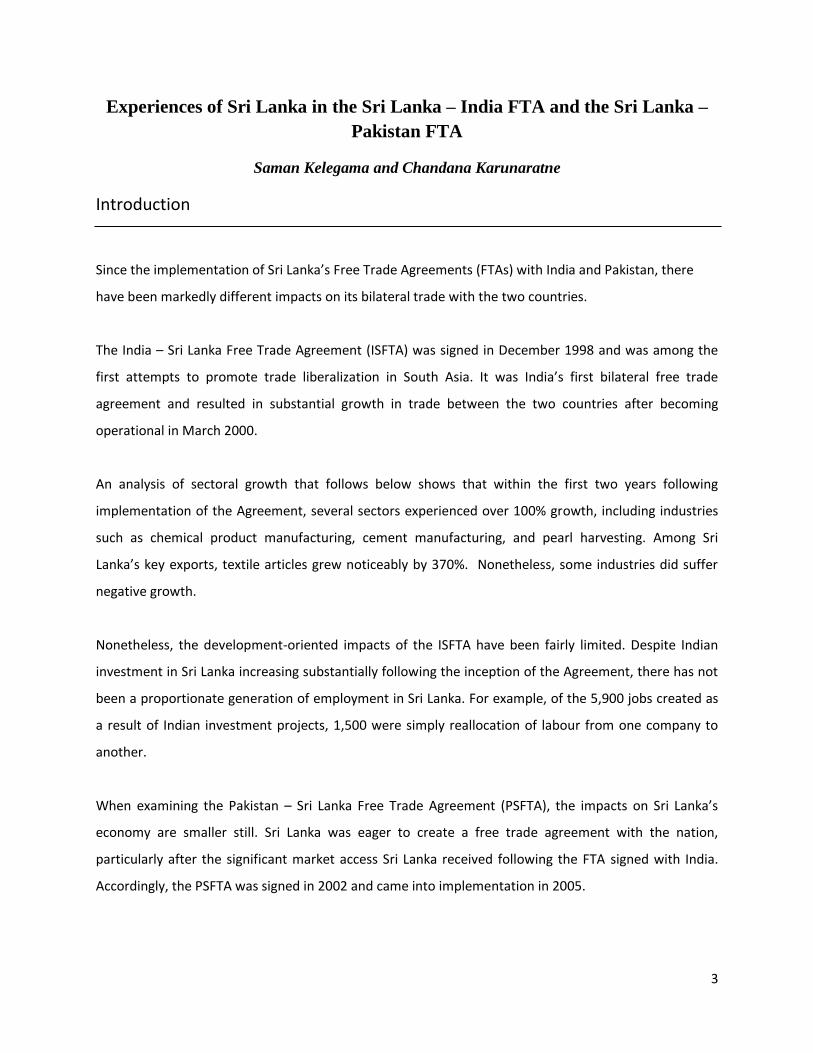
Experiences of Sri Lanka in the Sri Lanka – India FTA and the Sri Lanka –
Pakistan FTA
Saman Kelegama and Chandana Karunaratne
Introduction
Since the implementation of Sri Lanka’s Free Trade Agreements (FTAs) with India and Pakistan, there
have been markedly different impacts on its bilateral trade with the two countries.
The India – Sri Lanka Free Trade Agreement (ISFTA) was signed in December 1998 and was among the
first attempts to promote trade liberalization in South Asia. It was India’s first bilateral free trade
agreement and resulted in substantial growth in trade between the two countries after becoming
operational in March 2000.
An analysis of sectoral growth that follows below shows that within the first two years following
implementation of the Agreement, several sectors experienced over 100% growth, including industries
such as chemical product manufacturing, cement manufacturing, and pearl harvesting. Among Sri
Lanka’s key exports, textile articles grew noticeably by 370%. Nonetheless, some industries did suffer
negative growth.
Nonetheless, the development-oriented impacts of the ISFTA have been fairly limited. Despite Indian
investment in Sri Lanka increasing substantially following the inception of the Agreement, there has not
been a proportionate generation of employment in Sri Lanka. For example, of the 5,900 jobs created as
a result of Indian investment projects, 1,500 were simply reallocation of labour from one company to
another.
When examining the Pakistan – Sri Lanka Free Trade Agreement (PSFTA), the impacts on Sri Lanka’s
economy are smaller still. Sri Lanka was eager to create a free trade agreement with the nation,
particularly after the significant market access Sri Lanka received following the FTA signed with India.
Accordingly, the PSFTA was signed in 2002 and came into implementation in 2005.

4
However, the impact of the PSFTA on the value of Sri Lanka’s exports to Pakistan is negligible. The value
of Sri Lanka’s exports to Pakistan did not grow considerably but instead fluctuated over the 2006 to
2010 period. The value of exports to Pakistan as a percentage of Sri Lanka’s total exports remained
throughout the 5 year period following the implementation of the Agreement and failed to rise above
1%, indicating that Pakistan is not a significant destination for Sri Lankan exports.
What follows is a brief analysis of the two agreements. The paper aims to address the impact of the two
FTAs on Sri Lanka’s economy through an evaluation of key exports and imports, investment projects,
and negotiating experiences.
India-Sri Lanka Free Trade Agreement
The development-oriented impacts of the ISFTA have been fairly limited. Despite Indian investment in
Sri Lanka increasing substantially following the inception of the Agreement, there has not been a
proportionate generation of employment in Sri Lanka.
To illustrate, from 1978 – 1995, India contributed a mere 1.2 per cent of total FDI in Sri Lanka, whereas
after the implementation of the ISFTA, foreign investment from India rose significantly and has reached
a point where India is currently Sri Lanka’s second biggest foreign investor1. However, the number of
jobs created as a result of the signing of the ISFTA has been disproportionately small. Despite the Board
of Investment (BOI) of Sri Lanka reporting the creation of 5,900 jobs as a result of Indian investment
from 1993 – 2007, many of these jobs were simply reallocations of previously existing jobs. For example,
1,500 employees of the Ceylon Petroleum Corporation were transferred to retail outlets of Indian oil
firms. Rather than the generation of new jobs, this was more an exercise in the reallocation of labour.
Furthermore, a rigorous analysis of the impact of the ISFTA on job creation in Sri Lanka has not been
conducted. Questions regarding the number of overall jobs created and lost, how many new jobs were
created as a result of the loss of other jobs, whether Sri Lankans or Indians were the primary
1 Kelegama, S., 2009, ‘India-Sri Lanka Bilateral Free Trade Agreement: Sri Lankan Perspective and Implications’,
Presentation to the ‘Asian Regional Workshop on Free Trade Agreements: Towards Inclusive Trade Policies in Post-Crisis Asia’, jointly organized by IDEAS, GSEI, & ITD, Bangkok, 8-9 December, available: [networkideas.org/ideasact/dec09/ppt/Saman_Kelegama.ppt].

5
beneficiaries of this employment generation, and the types and quality of employment arising from the
Agreement have not been answered by existing literature on the ILFTA.
The India-Sri Lanka Free Trade Agreement was signed in December 1998 and was among the first
attempts to promote trade liberalization in South Asia. It was India’s first bilateral free trade agreement
and resulted in substantial growth in trade between the two countries after becoming operational in
March 2000.
By this point, India had committed to a 100% tariff cut for 1,351 items. By March 2003, India had
concluded a tariff phase out for 2,797 items, with these items having 100% preference.2 This was
conducted in two stages, with the applicable tariffs reaching zero by the end of the phase out. Following
this reduction of tariffs in 2003, Sri Lankan exports to India surged by over 200% in the two years that
followed.
India’s commitments also included a tariff rate quota for tea, reaching 50% preferential market access
by 2000 with a MFN rate being applied to an amount of 15mn kg per year. Garments also enjoyed a 50%
preferential market access for an amount of 8mn pieces, of which a minimum of 6mn pieces must
contain Indian fabric. The requirement that no category of garments can go beyond an amount of 1.5
million pieces a year was made during the negotiation process. A Margin of Preference (MOP) was
applied to textiles, which enjoyed a 25% preferential duty margin for 553 textile products without any
limit on quantity. The negative list includes 429 items, including 231 garment items. India’s Rules of
Origin are such that items must have 35% domestic value added or 25% Sri Lankan value added if using
10% Indian inputs.
Sri Lanka’s commitments to India are different. Sri Lanka committed to a 100% tariff cut for 319 items
(6-digit HS code) by March 2000, and implemented a tariff phase out in the following manner: in March
2000, Sri Lanka committed to a 50% reduction on 889 items, followed by a 70% reduction one year later,
a 90% reduction two years later, and a 100% reduction (implying duty-free status) three years later. By
March 2003, the remaining 2,779 items would experience a reduction of at least 35%, followed by a
reduction of at least 70% three years later, and a reduction of at least 100% two years later (by 2008).
2 Yatawara, Ravindra A., 2007, Exploiting Sri Lanka’s Free Trade Agreements with India and Pakistan: An Exporter’s
Perspective, South Asia Economic Journal, Sage Publications.

6
Sri Lanka’s Negative List includes 1,220 items, and its Rules of Origin state that 35% of items must be
domestic value-added or 25% Indian value-added if using 10% Sri Lankan inputs.
In an analysis3 conducted in 2007 of Sri Lanka’s trade with India, specific items were allocated a number
of preference points based on competitive advantage. The analysis uncovered that 100 preference
points (the maximum number possible) were awarded each to sunflower seed, peanut and palm oil,
sugar, coffee, wheat, sausages, motorcycles, and motor cars. However, out of these nine products, only
sausages, palm oil, and vegetable oil were exported to India. The remaining 100-point products were not
at all exported to India. The analysis also examined the value of these preferred items and concluded
that the only items worth more than $1 million of exports were cloves, pepper, palm oil, and cardamom,
which as of 2005, contributed the following in terms of exports to India: $16.50Mn, $10.79Mn,
$5.21Mn, $3.72Mn.
Despite exporting 3,173 products (6-digit HS level) around the world, Sri Lanka exports only 887
products to India. Yatawara (2007) shows that Sri Lanka exports only 121 ‘High Preference Point goods’
to India while exporting 578 items of the same preference globally. Yatawara (2007) argues that, while
Sri Lanka has the capacity to produce these ‘High Preference Point’ products, it has yet to fully exploit
the Indian market. Sri Lanka’s top 50 exports to India in 2005 ranked by value consist of copper
products, animal fats, vegetable oils, aluminum, pharmaceuticals, cloves, pepper, nutmeg, scrap metal
and paper, diamonds, rubber products, tea, wall tiles, wooden furniture, and white goods such as air
conditioners and refrigerators.
Following the 100% tariff reduction in March 2003, translated into complete free trade for 2,797 items,
trade between the two countries surged. Sri Lanka’s exports enjoyed an increase of 107% from $245
million in 2003 to $506 million in 2006. However, this growth came primarily from a handful of items,
including animal fats, vegetable oils, copper and aluminum products, and pharmaceuticals, contributing
77% of the surge in exports. A look at these products indicates that exporters are predominantly
focusing on conducting light processing on imported goods. The case of vanaspati (a type of vegetable
oil) sparked some controversy, as it was established that Indian investors were setting up processing
plants in Sri Lanka that converted imported crude palm oil into vanaspati and then exporting this to
3 Yatawara, Ravindra A., 2007, Exploiting Sri Lanka’s Free Trade Agreements with India and Pakistan: An Exporter’s
Perspective, South Asia Economic Journal, Sage Publications.

7
India, in order to avoid the 80% Indian tariff rate on the product (whereas Sri Lankan tariffs amounted to
only 15%). Processing palm oil into vanaspati in Sri Lanka made further financial sense to these Indian
exporters because the product enjoyed a zero duty rate under the ISFTA.
In terms of employment generation, vanaspati processing offered limited benefits and did not offer
large-scale employment to Sri Lankans. Following protests by vanaspati manufacturers in India who
complained about the Sri Lankan product flooding their markets, the Indian government imposed a
quota and a canalization policy on this import, leading to many of the vanaspati manufacturers in Sri
Lanka to shut down. During such closure, it was estimated that close to 4,000 jobs were at stake.4
Impact on Trade
Table 1: Top 5 Exports to India
1999 2005 2011
Product Value (SL
Rupees)
Product Value (SL
Rupees)
Product Value (SL
Rupees)
Whole pepper 695 million Vegetable fats
and oils
12 billion Animal feed 5.2 billion
Arecanuts 382 million Refined copper
and copper
alloys
7.9 billion Insulated wires &
cables
4.7 billion
Scrap iron 272 million Copper wire 4.1 billion Cloves 3.8 billion
Dried fruit 214 million Aluminum wire 3.1 billion Waste & scrap
paper
3.2 billion
Cloves 199 million Antibiotics 2.2 billion Garments 3.2 billion
Source: Calculated using data from the Department of Commerce, Sri Lanka
4 Kelegama, S. and Indra Nath Mukherji, 2007, India – Sri Lanka Bilateral Free Trade Agreement: Six Years
Performance and Beyond, RIS Discussion Papers, New Delhi: RIS.

8
The above table attempts to gauge the impact of the ISFTA on Sri Lanka’s top exports to India. Data was
compiled for the following years: 1999 (the year immediately before the implementation of the
agreement), 2005 (two years after India implements full liberalization), and 2011 (the year for which the
latest data was available). One can see that in 2005, following the year the ISFTA was put into operation,
vegetable fats and oils were the prime export, followed by copper products and pharmaceutical goods.
One reason why vegetable oils were such a key export in 2005 may rely on the high quantity of exports
of Vanaspati, a type of vegetable oil, for which tariff concessions were made under the ISFTA.
Table 2: Top 5 Imports from India
1999 2005 2011
Product Value (SL
Rupees)
Product Value (SL
Rupees)
Product Value (SL
Rupees)
Lentils 2.1 billion Refined
petroleum oil
16 billion Gas oil and diesel 47 billion
Ayurvedic
medicine
1.4 billion Motorcycles 8 billion White cane sugar 35 billion
Motor cars 1.3 billion Motor cars 6.3 billion Petrol 32 billion
Milled rice 1.3 billion Medicaments 5.3 billion Motorcycles 19 billion
Pepper 1.2 billion Crude petroleum
oil
4.1 billion Auto-trishaws 18.8 billion
Source: Calculated using data from the Department of Commerce, Sri Lanka
The above table shows the top 5 imports from India for the same years as previously mentioned. One
may note that, following the implementation of the agreement, petroleum products and motor vehicles
have become among the top imports to Sri Lanka in 2005 and 2011. This is potentially due to the tariff
concessions made in the ISFTA that promote the importing of these items.

9
Sectoral Analysis of ISFTA
Figure 1: Impact of ISFTA on Sri Lankan Exports to India (2000-01 to 2001-02)
Source: Mukherji, Indra Nath, Tilani Jayawardhana, and Saman Kelegama, 2002, Indo-Sri Lanka Free
Trade Agreement: An Assessment of Potential and Impact.
The above graph shows the percentage growth from 2000-01 to 2001-02 in Sri Lankan exports to India.
One can see that most sectors experienced growth above 100%, with industries such as chemical
product manufacturing, cement manufacturing, and pearl harvesting reaching above 300% growth.
Nonetheless, several industries did suffer negative growth, including the exports of live animals and
animal products, prepared food items, and wood products contracting by 100%, 75%, and 100%,
respectively. Among Sri Lanka’s key exports, textile articles grew noticeably by 370%.
Special and Differential Treatment under the ISFTA
Considering the substantial asymmetry between the economies of the two countries, key allowances
were made to help Sri Lanka. Among them, a more extensive negative list was created for Sri Lanka to
help its economy protect its most sensitive industries, including agriculture and livestock items, rubber
products, paper products, iron and steel, machinery, and electrical items. Sri Lanka’s negative list

10
features 1,180 items (or tariff lines), whereas India’s numbers only 429 items. India’s negative list
includes those items which are most sensitive to its own industries, including garments, plastic, and
rubber products.
In addition, Sri Lanka was granted a much longer period for liberalization of its tariff lines, as shown in
the below table. A period of eight years was given to Sri Lanka to phase out its tariffs, while India was
given a period of only three years to do the same. Obligations regarding duty concessions for Sri Lanka
were split into three stages, with 35% at the time of implementation of the agreement, 70% in 2006,
and 100% in 2008. India, on the other hand, was to grant 100% of its duty concessions in 2003.5
Table 3: Tariff Phasing Out Period and Duty Concessions
Tariff Phasing Out
List
Period Duty Concession
India 3 years 100% in March 2003
Sri Lanka 8 years 35%
At present
70%
in March 2006
100%
in March 2008
Source: Board of Investment of Sri Lanka, “Services Provided by BOI: Indo-Sri Lanka FTA,” available
[http://www.investsrilanka.com/international_agreement/indo_sri_lanka_fta_agreement.html#1.3].
Furthermore, the Rules of Origin (ROO) criteria are more flexible for Sri Lanka. Items that are produced
entirely from local sources, such as tea, fish, and certain spices6, are permitted duty-free concessions as
long as they are not on India’s negative list.
Tariff concessions under these ROO rules, along with other concessions offered under the ISFTA, have
encouraged several key industries in Sri Lanka to thrive. Some industries that were already established
prior to the ISFTA, such as the processing of spices and manufacturing of garments, saw a surge in
5 Board of Investment of Sri Lanka, “Services Provided by BOI: Indo-Sri Lanka FTA,” available
[http://www.investsrilanka.com/international_agreement/indo_sri_lanka_fta_agreement.html#1.3]. 6 Nonetheless, pepper has been a contentious item that has seen Indian authorities demand a cap on imports of
the item to 2,000 metric tonnes per annum, down from the 6,000 metric tonnes per annum that were being shipped from Sri Lanka to India as of 2007 (Kelegama and Mukherji 2007).

11
exports to India. Sri Lanka’s exports to India of cloves experienced almost a 20-fold increase from 1999
to 2011, from LKR 199 million to LKR 3.8 billion.7 Garments exports, which has risen in prominence in
terms of exports to India and was among Sri Lanka’s top five exports to the country as of 2011, recorded
a value of LKR 3.2 billion of exports to India in 2011.8
On the other hand, industries which were not particularly well-established prior to the ISFTA have also
experienced a surge in growth. The exporting of animal feed, insulated wires and cables, and waste and
scrap paper were among the top five exports to India as of 2011 and recorded export revenue of LKR 5.2
billion, 4.7 billion, and 3.2 billion in 2011, respectively.9
Extensions of the ISFTA to Areas beyond Trade in Goods
In addition to increases in the exports of goods, the ISFTA has also led to an increase in the number of
Indian investments in Sri Lanka. From 1998 to 2008, the value of these investments jumped from US$
1.4 million to US$ 125.9 million, contributing to 14 per cent of total foreign direct investment in Sri
Lanka.10 Furthermore, 63 per cent of these Indian investments have been in the services sector, an area
which has seen a significant expansion following the implementation of the ISFTA. Companies such as
Bharti Airtel, Apollo Hospitals, Lanka Oil Company, Taj Hotels, and Jet Airways have contributed to the
70 Indian investment projects that had been set up as of 2007 and which were employing 6,747 people
at the time in Sri Lanka. Several Sri Lankan IT companies have ventured into the Indian market,
providing internet-related services (as in the case of Interblocks providing services to Indian banks) and
mobile phone services (as in the case of Microimage providing Tamil sms services to Airtel). Tourism
companies based in Sri Lanka, including Aitken Spence and Jetwing, have begun operations in India.11
The ISFTA has also led to better connectivity with India, resulting in an expansion in the number of
flights and tourist arrivals from the northerly neighbour. As of 2011, the Department of Immigration and
Emigration of Sri Lanka registered 171,374 arrivals from India, translating to 20 per cent of all tourist
7 Calculated using data from the Department of Commerce, Sri Lanka.
8 Calculated using data from the Department of Commerce, Sri Lanka.
9 Calculated using data from the Department of Commerce, Sri Lanka.
10 Daniel, Devan, (undated), “Indo-Lanka FTA is 10 Years Old,” The Island Online, available:
[http://www.island.lk/2010/03/15/business1.html]. 11
Daniel, Devan, (undated), “Indo-Lanka FTA is 10 Years Old,” The Island Online, available: [http://www.island.lk/2010/03/15/business1.html].

12
arrivals and over 50 per cent of tourists from Asia for 2011.12 Furthermore, this improved connectivity
with India through expansion of airline services has led to an increase of 64% of tourist arrivals from
India from 2004.13
Negotiations under the ISFTA
The ISFTA came into operation on 1st March 2000 following the exchange of letters between the
Secretary of Commerce of India and the Secretary of Finance of Sri Lanka. However, the agreement was
renegotiated following discussions between the Secretaries of Commerce on 6th June 2002, a Joint
Ministerial Committee Meeting on 7th June 2002, and a Senior Officials Meeting on 4th July 2002.
Both sides had made a number of requests that were instated in the agreement following negotiations.
These requests revolved primarily around tea, garments, and bulk cement. Sri Lankan authorities had
called for more entry ports to deliver their shipments of tea, with the Indian government responding
positively and allocating an additional two ports (Mumbai in the West and Vishakhapatnam on the East)
in addition to the originally allocated ports of Cochin and Kolkata. Indian authorities, on the other hand,
requested permission to export tea to Sri Lanka, specifically for home consumption, with Sri Lanka
agreeing to this request upon the conditions that the Indian tea met certain quality standards and India
paid its remaining MFN duty.
Sri Lanka submitted several requests regarding garment exports. Sri Lankan authorities had called for an
increase in duty tariff concessions on 51 tariff lines from 50% to 75%, to which India agreed14.
Nonetheless, ad valorem duty concessions would remain at 50%. Another request submitted by Sri
Lanka was to increase the quota of fabric of non-Indian origin, with India agreeing and subsequently
increasing the quota from 2 million pieces per annum to 4 million pieces. India also consented to an
increase in quota per garment category from 1.5 million pieces per annum to 2 million pieces per
annum. Sri Lankan authorities had also called for more ports to deliver shipments of garments, to which
India agreed and provided Kolkata and Mumbai as additional entry points.
12
Central Bank of Sri Lanka, 2012, Annual Report 2011. 13
Central Bank of Sri Lanka, 2012, Annual Report 2011. 14
Mukherji, Indra Nath, Tilani Jayawardhana, and Saman Kelegama, 2002, Indo-Sri Lanka Free Trade Agreement: An Assessment of Potential and Impact.

13
Indian authorities had called for an increase in the Margin of Preference (MOP) from 20% to 50% for Sri
Lanka’s imports of bulk cement from India. Sri Lankan government officials responded to this request by
increasing the MOP to 35%.
Despite these developments in negotiations, India initially took a rather cautious approach when
negotiating the FTA. Specifically, the primary concern among Indian authorities was that transit trade
would unfairly benefit from the zero duty concessions of the FTA. India has stated that that any violation
of the rules of origin or the 40% local value addition clause on goods exported to India could open up
possibilities of transit trade taking advantage of the zero duty concessions15. The secretary-general of
the Federation of Indian Chambers of Commerce and Industry (FICCI) pointed out that Sri Lanka was
being used as a trade corridor through which Chinese goods were being imported into India, particularly
with copper and electronic components. Another case of trade diversion was China’s use of Thailand as
a transit point, through which cheap electronics, consumer goods, clothes, and silk were exported to
India.
These concerns were reflected in the subsequent negotiations of the South Asian Free Trade Agreement
(SAFTA) which included member countries Sri Lanka, India, Pakistan, Nepal, Bangladesh, Bhutan, and the
Maldives. When delegates from the member countries met for the first round of negotiations in early
March 2004, the primary concerns included developing the rules of origin criteria and agreeing upon
tariff liberalization measures, as well as deliberating on the list of the most sensitive products16.
Following the positive impact of the ILFTA on Sri Lanka’s exports to India and overall trade volume, the
two governments decided to expand economic cooperation and develop a Comprehensive Economic
Partnership Agreement (CEPA). The Joint Study Group (JSG) , a committee delegated with examining the
costs and benefits of the potential agreement and which included representatives from the public and
private sectors in both countries, was formed thereafter and published its report in October 2003. The
purposes of the CEPA included expanding on the economic cooperation already established by the ILFTA
through further liberalization of trade in goods, as well as liberalization of trade in services and
investment17.
15
“India’s Cautious Approach Slows FTA Negotiations,” Daily Mirror, 23rd
November 2004. 16
“Road Map Created for SAFTA Negotiations,” Daily Mirror, 6th
March 2004. 17
de Mel, Deshal, 2009, The Role of Stakeholders in the Formulation of Inclusive Trade Policies: What Went Wrong with the Indo-Lanka CEPA Negotiations?, United Nations Economic and Social Commission for the Asia Pacific.

14
The further liberalization of trade in goods was to take place through eliminating certain items on the
negative lists to widen the selection of goods subject to liberalization. An increase in investment in Sri
Lanka was expected to take place through the security and predictability that was to be offered to
Indian investors through the CEPA. Perhaps most importantly, the opening up of trade in services was
expected to take advantage of the rapidly growing demand for services (brought about by rapid
economic growth) in India at the time, with the cost of services offered by Sri Lanka being relatively
competitive due to the higher wages in India and appreciation of the Indian rupee18. Considering India’s
vast and growing middle class, the implementation of the CEPA would have enabled Sri Lankan firms to
tap into the country’s substantial demand for Sri Lanka’s burgeoning services industry. Services such as
accounting and book keeping, architecture, computer services, research and development, and travel
agency and management consultancy services are already being provided on a small scale to markets in
more developed countries. Other sectors such as construction and engineering, financial services
(including banking, insurance, leasing, and asset management), and maritime services (including ship
building and repair) may also see vast potential in India’s markets19.
Following 13 rounds of negotiations and subsequent to recommendations from the JSG, the CEPA was
ready to be signed in July 2008. However, a few weeks prior to this, key details of the negotiations were
made public through a seminar and disseminated through extensive media coverage. An immediate and
vocal reaction was made by a group of domestic Sri Lankan industrialists, and subsequently picked up by
the media and debated by civil society, stating there was a lack of public awareness and highlighting
concerns about the Agreement.
The primary concern of the first group, a small number of business people who had faced difficulties in
penetrating the Indian market under the ILFTA, was that the problems of the FTA should be dealt with
before moving on to signing the CEPA. De Mel (2009), however, argues that with any trade agreement
come weaknesses and minor setbacks, particularly in its early stages. The CEPA was not to be seen as a
new agreement, but rather as a development of the existing FTA. In fact, many of the problems brought
up by the small group of industrialists were addressed during the CEPA negotiations. For example, port
restrictions on tea were eased, the rules of origin concerning garment exports from Sri Lanka to India
18
de Mel, Deshal, 2009, The Role of Stakeholders in the Formulation of Inclusive Trade Policies: What Went Wrong with the Indo-Lanka CEPA Negotiations?, United Nations Economic and Social Commission for the Asia Pacific. 19
de Mel, Deshal, 2009, The Role of Stakeholders in the Formulation of Inclusive Trade Policies: What Went Wrong with the Indo-Lanka CEPA Negotiations?, United Nations Economic and Social Commission for the Asia Pacific.

15
were simplified, and various quotas and restrictions on Sri Lankan exports were removed during the
CEPA negotiations. Moreover, the CEPA included a provision which called for bi-annual meetings
between trade secretaries to address further issues with the Agreement.
The main concern among civil society was that there was inadequate national level consultation prior to
signing the Agreement. Only one month elapsed since the draft schedules of the Agreement were made
public and the Agreement was scheduled for signing. As such, there was widespread public perception
that the CEPA negotiating process had been rushed, when, in fact, it had taken close to three years.
According to de Mel (2009), negotiators did not make it public any earlier because discussions were still
going on. Making details of the process available to the public before finalization would have
compromised Sri Lanka’s negotiating position. However, as suggested by de Mel (2009), the public
backlash may have been avoided by disseminating draft schedules of the Agreement after negotiations
had been finalized, but with ample time before the Agreement was signed. This may have helped
address the public’s view that there was a lack of transparency with the whole process. Following this
backlash, the Sri Lankan government decided to pull out of negotiations and delay the signing of the
Agreement. Since then, the Indo-Lanka CEPA has remained unsigned.

16
Pakistan-Sri Lanka Free Trade Agreement (PSFTA)
As Pakistan represents Sri Lanka’s second largest trading partner in the SAARC region, Sri Lanka was
eager to create a free trade agreement with the nation, particularly after the significant market access
Sri Lanka received following the FTA signed with India. Accordingly, the PSFTA was signed in 2002 and
came into implementation in 2005. The PSFTA takes in to account the asymmetries between the two
nations and thus provides each country with a different negative list and time frame for trade
liberalization. As stated in article I of the agreement the objectives of the PSFTA are:20
i. To promote through the expansion of trade in goods and services the harmonious
development of the economic relations between Pakistan and Sri Lanka.
ii. To promote fair conditions for competition for trade in goods and services between
Pakistan and Sri Lanka.
iii. To contribute in this way, by the removal of barriers to trade in goods and services, to
the harmonious development and expansion of bilateral as well as world trade.
The duty concessions of the Pakistan-Sri Lanka FTA are given in the table below:
Table 4: Duty Concessions
Duty Concessions Pakistan’s Commitments
(number of tariff lines)
Sri Lanka’s Commitments
(number of tariff lines)
No concessions (Negative List)
Immediate zero duty concessions
Tariff rate quotas
Tea: duty free 10,000 MT
Apparel: 35% MOP million pieces
Basmati: duty free 6,000 MT
Potatoes: duty free 1,200 MT
540
206
4
21
697
102
1
1
20
Department of Commerce, PSFTA, Framework Agreement.

17
Products entitled to Margin of Preference:
Betel: 20% MOP
Cosmetics: 50% MOP
Trade Liberalization Program
1
11
34, 67, 100 % reduction
over 3 years
20, 40, 60, 80, 100 %
reduction over 5 years
Source: Table 4, de Mel, Deshal, undated, India – Sri Lanka, Pakistan – Sri Lanka Bilateral Free Trade
Agreements, Institute of Policy Studies of Sri Lanka. Based on Department of Commerce figures.
Initially Pakistan and Sri Lanka offered only 206 and 102 tariff lines respectively for immediate zero duty.
However, Pakistan liberalized the remaining products over a three year period ending June 2008,
effectively giving Sri Lanka duty free market access to more than 4500 products. Sri Lanka too liberalized
its remaining products, excluding those on the negative list, over a five year period ending November
2010.
The Pakistani negative list which consists of 540 products contains many of Sri Lanka’s main exports to
Pakistan including tea, rubber products, certain ceramics, paper products and several textile and
garment products. Yet, as a result of PSFTA a range of new Sri Lankan products have penetrated the
Pakistani market. These products include fresh pineapple, sports goods, tamarind with seeds, edible oil,
porcelain tableware & kitchenware, ceramic tiles, furniture, electrical switches & sockets, herbal
cosmetic products, plastic articles, paints, glass paintings, leather products, frozen fish, prawns, lobsters,
crabs, cut flowers & foliage, gems & Jewellery and aquarium fish.21 The Sri Lankan negative list on the
other hand consisting of 697 products contains most of the agriculture sector, rubber, products, paper
products, footwear, ceramic products, many motor vehicles & part, along with several metal products.
21
Indo-Sri Lanka Free Trade Agreement (ISFTA), Bilateral Affairs, Department of Commerce. [http://www.doc.gov.lk/web/index.php?option=com_content&view=article&id=62%3Abilateral-affairs&catid=38%3Aservices&Itemid=75&lang=en]

18
Impact on Trade
Initially the impact of the PSFTA on the value of Sri Lanka’s exports to Pakistan seemed negligible. In
2003 the value of Sri Lankan exports to Pakistan was US$ 36 million (0.7 percent of total exports). 2007
saw this figure rise to US $ 56 million, but this figure still accounted only for 0.7 percent of Sri Lanka’s
total export. Over the same period Pakistan experienced growth in exports to Sri Lanka at a much faster
rate, with Sri Lankan imports from Pakistan rising from US$ 71 million in 2003 (1 percent of total
imports), to US$ 178 million in 2007 (1.6 percent of total imports). Further, the growth in Sri Lankan
exports to Pakistan was seen mainly in the same goods exported to Pakistan before the agreement.22
However, even with both nations liberalizing all products not on the negative list, the expected major
increase in Sri Lanka’s exports to Pakistan have not been seen. Sri Lanka’s exports to Pakistan did rise
from US$ 26 million during the January to May period in 2010, to US$ 34 million in the corresponding
period of 2011, representing a growth of 30.8 %. This rise was mainly due to a significant increase in
exports such as natural rubber, vegetable products, desiccated coconut, new pneumatic tires, MDF
boards , dried leguminous vegetables, copra, natural graphite, woven fabric etc. Yet, over the same
period, exports of certain goods such as oil-cake and other solid residues, sewing thread of man-made
staple fibers, tea, nutmeg, pepper, rubber strips, coconut oil and its fractions have actually decreased.23
Thus, the overall impact of PSFTA on trade has been limited as Pakistan has continued to represent only
a minute market for Sri Lankan exports.
22
de Mel, Deshal, undated, India – Sri Lanka, Pakistan – Sri Lanka Bilateral Free Trade Agreements, Institute of Policy Studies of Sri Lanka. 23
Overview: Pakistan – Sri Lanka Free Trade Agreement (PSFTA). [http://www.doc.gov.lk/web/index.php?option=com_content&view=article&id=114&Itemid=117&lang=en]

19
Table 5: Exports to Pakistan
Source: Department of Commerce, Sri Lanka
As shown in the table above, the value of Sri Lanka’s exports to Pakistan did not grow considerably but
instead fluctuated over the 2006 to 2010 period, with growth in 2008 and 2010 alternating with lower
levels of exports in 2007 and 2009. A most noticeable feature of the above table however, is the value of
exports to Pakistan as a percentage of Sri Lanka’s total exports. This figure has remained very low
throughout the 5 year period and has failed to rise above 1% indicating that Pakistan is not a significant
destination for Sri Lankan exports. Consequently, the table further re-iterates the limited impact the
PSFTA has had on trade between the two economies.
Impact on Investment
While the FTA would not have a direct impact on the flow of investment between the two economies,
looking at the foreign direct investment (FDI) coming from Pakistan over a period of years, we could
assess the possibility of the PSFTA indirectly increasing the level of FDI coming to Sri Lanka from
Pakistan. In order to do so the table below lists out the level of FDI from Pakistan in 2006, the year
immediately following the implementation of the PSFTA, 2009, the year immediately following
Pakistan’s liberalization of remaining products and 2011, the year immediately following Sri Lanka’s
liberalization of remaining products.
Year Export value to Pakistan ( US$ million) % of total exports
2006
2007
2008
2009
2010
58
55
71
55
60
0.8
0.7
0.9
0.8
0.7

20
Table 6: FDI from Pakistan
Source: Board of Investment of Sri Lanka.
While FDI from Pakistan was at US$ 1.123 million in 2006, three years later in 2009 following Pakistan’s
liberalization of remaining tariff lines the level of FDI had significantly reduced by 52.8% to US$ 0.53
million. This indicates the fact that PSFTA did not have a significant impact on the flow of investment
from Pakistan to Sri Lanka and that other factors play a more crucial role in influencing the level of
investment. 2011 however, saw a remarkable increase in the level of FDI incoming from Pakistan, which
had grown by 480% since 2009, to US$ 3.078 million. Yet, at this juncture we are unable to know how
much or if any of this increased FDI can be attributed to the PSFTA.
The major Pakistani investment projects that have commenced in Sri Lanka over the 2006-2011 period
are given below along with the project description and the value of the total investment.24
Table 7: Pakistani FDI Projects in Sri Lanka
Project Name Project Description Investment Amount (Rs. Million)
Agro Farm Lanka (Pvt) Ltd
Standard Vanguard Services (Pvt)
Ltd
Z M Kasuals (Pvt) Ltd
Z M Vision (Pvt) Ltd
Mushtaq Impex (Pvt) Ltd
Cultivate fruits and vegetables
Business process outsourcing
center
Garments
Readymade garments
Potatoes and vegetables
17.25
17.10
120.00
50.00
30.00
Source: Board of Investment of Sri Lanka.
24
Board of Investment of Sri Lanka.
Year FDI from Pakistan (US$ Million)
2006
2009
2011
1.123
0.53
3.078

21
Although large scale investment projects such as those mentioned above have commenced over the
2006-2011 period, the value of the investments from Pakistan are significantly lower than that from Sri
Lanka’s major trading partners such as China and India. This too suggests that the effectiveness of the
PSFTA in indirectly encouraging investment is restricted by the fact that Pakistan even after the
implementation of the FTA does not represent a major trading partner for Sri Lanka.
An analysis25 of the PSFTA shows that items that with the highest preference that Sri Lanka could export
to Pakistan include ceramic goods, fabric, safes, prefabricated buildings, food preparations, and
motorcycles. However, as of 2005, Sri Lanka was not exporting any high-preference point goods over $1
million. The highest-earning high-preference point goods were coconut ekel products (used in brooms
and brushes) (valued at $830,000), vehicle parts ($40,000), rubber sheets ($30,000), twine ($30,000),
iron and steel household products ($30,000), and prefabricated buildings ($30,000). As of 2005, Sri
Lanka exported only 156 products (6-digit HS code) to Pakistan, indicating much potential for expanding
the basket of export goods. Out of these goods, there are only eight items that are classified high-
preference goods, with more than two-thirds of exports being classified as low-preference. Since many
of the goods that Sri Lanka exports to Pakistan have low preference, there may not be a significant
expansion in traded volume of exports in the near future, unless Sri Lanka diversifies its basket of goods
to higher-preference point items.
Sri Lankan exports receiving duty-free concessions account for 80% of exports to Pakistan. However,
these goods account for only 32 items out of the total 156 exported to Pakistan. The major exports
include copra, rubber products, tea, coconuts and coconut products, rice, nutmeg, cinnamon, cloves,
pepper, and textiles like tarpaulins. The only goods that were in the top 50% of exports in terms of value
and that scored high-preference points were coconut ekel products, prefabricated buildings, and food
preparations.
25
Yatawara, Ravindra A., 2007, Exploiting Sri Lanka’s Free Trade Agreements with India and Pakistan: An Exporter’s Perspective, South Asia Economic Journal, Sage Publications.

22
Table 8: Top 5 Exports to Pakistan
2003 2007 2011
Product Value (SL
Rupees)
Product Value (SL
Rupees)
Product Value (SL
Rupees)
Copra 1.1 billion Copra 1.2 billion Rubber sheets 2.1 billion
Fermented black
tea
591 million Rubber sheets 1.1 billion Vegetable
products
708 million
Rubber sheets 571 million Rubber latex 543 million Fermented black
tea
526 million
Vegetable
products
274 million Vegetable
products
498 million Dessicated
coconut
524 million
Natural rubber 232 million Dessicated
coconut
481 million Rubber latex 517 million
Source: Calculated using data from the Department of Commerce, Sri Lanka
An examination of the top five exports to Pakistan shows little change in the primary products before
and after the agreement was implemented in 2005. In both 2003 and 2007, copra was the largest
export, as shown above, with negligible difference in export receipts earned. Even after both countries
fully liberalized trade, earnings did not see a dramatic increase.
Table 9: Top 5 Imports from Pakistan
2003 2007 2011
Product Value (SL
Rupees)
Product Value (SL
Rupees)
Product Value (SL
Rupees)
Woven cotton
fabric
1.96 billion Woven cotton
fabric
5.2 billion Wheat grain 4.2 billion
Dried fish 635 million Potatoes 1.6 billion Woven cotton
fabric
3.5 billion
Potatoes 367 million Milled rice 1.2 billion Welded iron or
steel tubing
2.3 billion

23
Milled rice 347 million Welded iron or
steel tubing
855 million Onions 2.1 billion
Medicaments 345 million Dried fish 723 million Portland cement 1.9 billion
Source: Calculated using data from the Department of Commerce, Sri Lanka
Sri Lanka’s top five imports from Pakistan indicate that the variety of key imports remained similar
throughout the pre- and post-implementation period. Woven cotton fabric stayed among the top two
imports between 2003 and 2011. Other products that were heavily imported and stayed among the top
five include potatoes and milled rice, both in 2003 and 2007.
Sectoral Analysis of PSFTA
Figure 2: Impact of Full Trade Liberalization on Exports from Sri Lanka and Pakistan, 2010
Source: Ahmed, Saira, Vaqar Ahmed, Irfan Sarfaz, and Safdar A. Sohail, 2010, Trade Agreements between
Developing Countries: A Case Study of Pakistan – Sri Lanka FTA, IMT Institute for Advanced Studies.

24
The above graph shows the various sectors on which the PSFTA has had an impact. One can see that,
with full trade liberalization, exports for both countries increased dramatically for several sectors. Sri
Lankan exports to Pakistan surged in the textiles and clothing industries by 88%, wood products
increased by 124%, and metal products increased by 116%. Pakistani exports also experienced
substantial increases, with grains crops surging by 131%, vegetables and fruits increasing by 73%, and
beverages and tobacco products increasing 70%.
A survey conducted by Ahmed et al. (2010)26 looked at various sectors of the Pakistani economy to
gauge the impact of the PSFTA. Exporters and importers in Pakistan were interviewed to obtain
information on how effective the PSFTA was perceived to be among the business community.
Importers of Sri Lankan goods in Pakistan were interviewed in the sectors of rubber and plastics,
electronic equipment, and chemical products. Those involved in the importing of rubber and plastics
reported that imports had increased by an average of 5% following the implementation of the PSFTA.
However, they complained that non-registered business operators were also taking part in the
importing of Sri Lankan goods. Furthermore, importers were concerned that Sri Lankan exports may
soon be diverted to Malaysia, Indonesia, or Vietnam which reportedly have no sales tax on the imports
of rubber and plastics, while Pakistan charges a relatively high sales tax.
Importers in the electronic goods sector reported an increase of an average of 5% in the post-FTA
period, following implementation in 2005. Importers in this sector in Pakistan are relieved with the
decrease in the number of documents required for importing, but are concerned about the remaining
complex filing requirements. As such, they have called upon government trade bodies in both countries
to simplify existing requirements.
The chemical products sector reported an increase in imports of 15% following the implementation of
the PSFTA. However, importers have called for more effective pre and post delivery checks at ports to
ensure high quality and improved port storage facilities for chemical products.
26
Ahmed, Saira, Vaqar Ahmed, Irfan Sarfaz, and Safdar A. Sohail, 2010, Trade Agreements between Developing Countries: A Case Study of Pakistan – Sri Lanka FTA, IMT Institute for Advanced Studies.

25
The key complaint among exporters was that they felt the government did not play a strong enough role
with regard to spreading awareness of the FTA. Furthermore, exporters complained about the difficulty
in obtaining a certificate of origin. Many exporters also stated that the average time taken for each stage
in the export process, including acquiring licenses, processing shipping bills, and obtaining customs
clearances, was higher than the time taken in competing economies like China and East Asia.
Exporters in the fabric sector reported an increase of only 0.3% of export receipts in the post-FTA
period. They insist that there is a need for greater coordination between trade associations in the two
countries and also between government trade bodies in the respective countries. Exporters are also
concerned about the increasing competiveness of businesses in China and India and call for greater
support from the Pakistani government. Exporters in the spinning and weaving sectors indicated that
exports to Sri Lanka had decreased from roughly 7% to 6% after the implementation of the FTA. Several
factors have been attributed to this decrease, including Sri Lanka’s FTA with India which may have
displaced some of the Pakistani exports, in addition to a domestic regulatory requirements regime in Sri
Lanka which has been deemed complicated to the point of acting as a non-tariff barrier.27 Sri Lankan
government trade bodies have been called upon to increase domestic awareness in Sri Lanka about the
benefits of the FTA.
Negotiations under the PSFTA
Sri Lanka and Pakistan signed the PSFTA in Colombo on 1st August 2002, with implementation taking
place on 12th June 2005. The two sides agreed to remove all non-tariff barriers on goods and services,
halt any increase in existing para tariffs, and prevent any introduction of new para tariffs without the
consent of both sides. Following the implementation of the agreement, there has been interest from
both countries to expand trade and investment to cover more sectors in agriculture and industry.
Taking into account the economic asymmetries that exist between the two countries, the PSFTA accords
Sri Lanka with the obligation to offer only 102 items on a duty-free basis, while Pakistan has offered 206
items. Sri Lanka’s Negative List consists of 697 items while Pakistan’s List consists of 540 items.
Unfortunately, there is very little information available about Sri Lanka’s negotiating experiences under
the PSFTA.
27
Ahmed, Saira, Vaqar Ahmed, Irfan Sarfaz, and Safdar A. Sohail, 2010, Trade Agreements between Developing Countries: A Case Study of Pakistan – Sri Lanka FTA, IMT Institute for Advanced Studies.

26
References:
Ahmed, Saira, Vaqar Ahmed, Irfan Sarfaz, and Safdar A. Sohail, 2010, Trade Agreements between
Developing Countries: A Case Study of Pakistan – Sri Lanka FTA, IMT Institute for Advanced Studies.
Board of Investment of Sri Lanka, “Services Provided by BOI: Indo-Sri Lanka FTA,” available
[http://www.investsrilanka.com/international_agreement/indo_sri_lanka_fta_agreement.html#1.3].
Central Bank of Sri Lanka, 2012, Annual Report 2011.
Daniel, Devan, (undated), “Indo-Lanka FTA is 10 Years Old,” The Island Online, available:
[http://www.island.lk/2010/03/15/business1.html].
de Mel, Deshal, 2009, The Role of Stakeholders in the Formulation of Inclusive Trade Policies: What Went
Wrong with the Indo-Lanka CEPA Negotiations?, United Nations Economic and Social Commission for
the Asia Pacific.
de Mel, Deshal, undated, India – Sri Lanka, Pakistan – Sri Lanka Bilateral Free Trade Agreements,
Institute of Policy Studies of Sri Lanka.
Department of Commerce, PSFTA, Framework Agreement.
Customs Data, Department of Commerce of Sri Lanka (1999 – 2011).
Kelegama, S., 2009, ‘India-Sri Lanka Bilateral Free Trade Agreement: Sri Lankan Perspective and
Implications’, Presentation to the ‘Asian Regional Workshop on Free Trade Agreements: Towards
Inclusive Trade Policies in Post-Crisis Asia’, jointly organized by IDEAS, GSEI, & ITD, Bangkok, 8-9
December, available: [networkideas.org/ideasact/dec09/ppt/Saman_Kelegama.ppt].
Kelegama, S. and Indra Nath Mukherji, 2007, India – Sri Lanka Bilateral Free Trade Agreement: Six Years
Performance and Beyond, RIS Discussion Papers, New Delhi: RIS.
“India’s Cautious Approach Slows FTA Negotiations,” Daily Mirror, 23rd November 2004.
Indo-Sri Lanka Free Trade Agreement (ISFTA), Bilateral Affairs, Department of Commerce, available:
[http://www.doc.gov.lk/web/index.php?option=com_content&view=article&id=62%3Abilateral-
affairs&catid=38%3Aservices&Itemid=75&lang=en].
Mukherji, Indra Nath, Tilani Jayawardhana, and Saman Kelegama, 2002, Indo-Sri Lanka Free Trade
Agreement: An Assessment of Potential and Impact.
Overview: Pakistan – Sri Lanka Free Trade Agreement (PSFTA).
[http://www.doc.gov.lk/web/index.php?option=com_content&view=article&id=114&Itemid=117&lang=
en]
“Road Map Created for SAFTA Negotiations,” Daily Mirror, 6th March 2004.

27
Table 4, “India-Sri Lanka, Pakistan-Sri Lanka, Bilateral Free Trade Agreements”, Deshal De Mel, Institute
of Policy Studies of Sri Lanka (IPS), based on Department of Commerce figures.
Yatawara, Ravindra A., 2007, Exploiting Sri Lanka’s Free Trade Agreements with India and Pakistan: An
Exporter’s Perspective, South Asia Economic Journal, Sage Publications.