Embed Size (px)
Citation preview

?
EXPLORE ACTIVITY
ESSENTIAL QUESTIONHow can you use a sample to gain information about a population?
Random and Non-Random SamplingWhen information is being gathered about a group, the entire group of objects,
individuals, or events is called the population. A sample is part of the
population that is chosen to represent the entire group.
A vegetable garden has 36 tomato plants
arranged in a 6-by-6 array. The gardener
wants to know the average number of
tomatoes on the plants. Each white cell
in the table represents a plant. The number
in the cell tells how many tomatoes are on
that particular plant.
Because counting the number of tomatoes on all
of the plants is too time-consuming, the gardener
decides to choose plants at random to find the
average number of tomatoes on them.
To simulate the random selection, roll two number
cubes 10 times. Find the cell in the table identified
by the first and second number cubes. Record the
number in each randomly selected cell.
What is the average number of tomatoes
on the 10 plants that were randomly
selected?
Alternately, the gardener decides to choose the plants in the first
row. What is the average number of tomatoes on these plants?
A
B
L E S S O N
12.1Populations and Samples
First Number
Cube
8 9 13 18 24 15 1
34 42 46 20 13 41 2
29 21 14 45 27 43 3
22 45 46 41 22 33 4
12 42 44 17 42 11 5
18 26 43 32 33 26 6
Second Number
Cube
1 2 3 4 5 6
Math TalkMathematical Processes
7.6.F
Proportionality—7.6.F Use data from a random sample…
How do the averages you got with each sampling
method compare?
373Lesson 12.1
© H
ough
ton
Miff
lin H
arco
urt P
ublis
hing
Com
pany
Math On the Spotmy.hrw.com
EXPLORE ACTIVITY (cont’d)
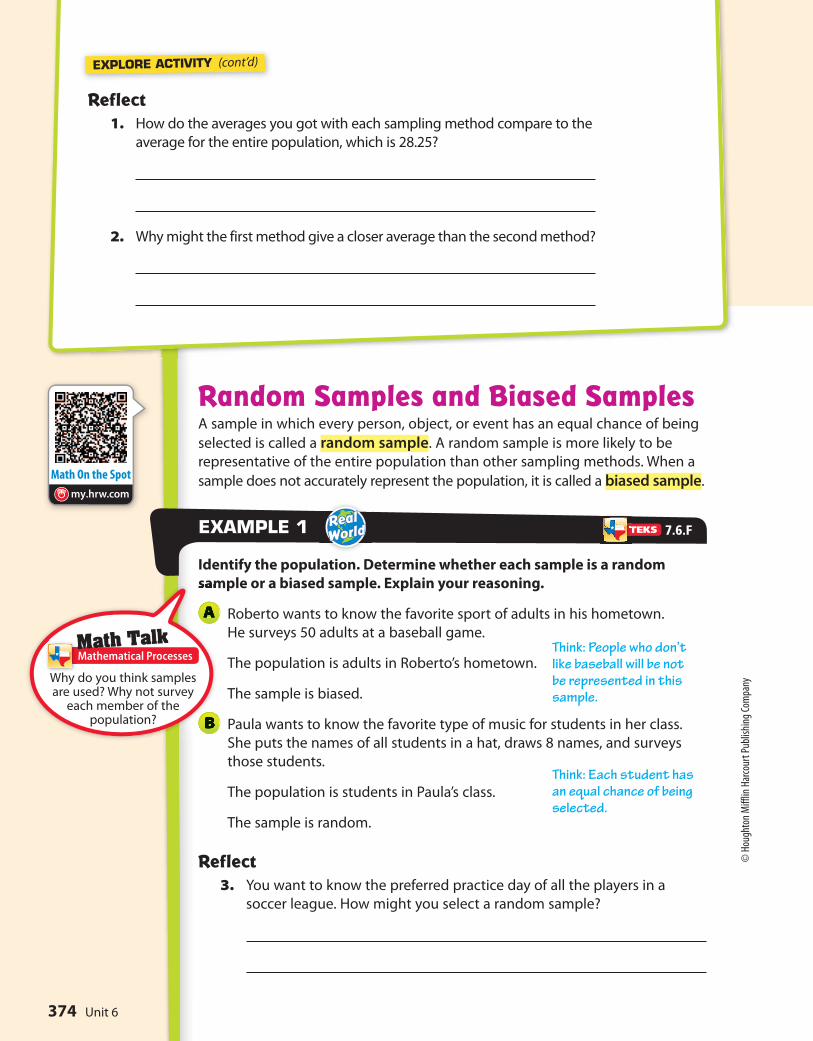
Random Samples and Biased SamplesA sample in which every person, object, or event has an equal chance of being
selected is called a random sample. A random sample is more likely to be
representative of the entire population than other sampling methods. When a
sample does not accurately represent the population, it is called a biased sample.
Identify the population. Determine whether each sample is a random
sample or a biased sample. Explain your reasoning.
Roberto wants to know the favorite sport of adults in his hometown.
He surveys 50 adults at a baseball game.
The population is adults in Roberto’s hometown.
The sample is biased.
Paula wants to know the favorite type of music for students in her class.
She puts the names of all students in a hat, draws 8 names, and surveys
those students.
The population is students in Paula’s class.
The sample is random.
Reflect 3. You want to know the preferred practice day of all the players in a
soccer league. How might you select a random sample?
EXAMPLE 1
A
B
Reflect 1. How do the averages you got with each sampling method compare to the
average for the entire population, which is 28.25?
2. Why might the first method give a closer average than the second method?
Math TalkMathematical Processes
7.6.F
Why do you think samples are used? Why not survey
each member of the population?
Think: People who don’t like baseball will be not be represented in this sample.
Think: Each student has an equal chance of being selected.
Unit 6374
© H
ough
ton
Miff
lin H
arco
urt P
ublis
hing
Com
pany
Math On the Spot
my.hrw.com
Math Trainer
Online Assessment and Intervention
Personal
my.hrw.com
Math Trainer
Online Assessment and Intervention
Personal
my.hrw.com
Bias in Survey QuestionsOnce you have selected a representative sample of the population, be sure
that the data is gathered without bias. Make sure that the survey questions
themselves do not sway people to respond a certain way.
In Madison County, residents were surveyed about a new skateboard park.
Determine whether each survey question may be biased. Explain.
Would you like to waste the taxpayers’ money to build a frivolous
skateboard park?
This question is biased. It discourages residents from saying yes to a new
skateboard park by implying it is a waste of money.
Do you favor a new skateboard park?
This question is not biased. It does not include an opinion on the
skateboard park.
Studies have shown that having a safe place to go keeps kids out
of trouble. Would you like to invest taxpayers’ money to build a
skateboard park?
This question is biased. It leads people to say yes because it mentions
having a safe place for kids to go and to stay out of trouble.
EXAMPLEXAMPLE 2
A
B
C
Determine whether each sample is a random or biased sample. Explain
your reasoning.
4. A librarian randomly chooses 100 books from the library’s database to
calculate the average length of a library book.
YOUR TURN
Determine whether each question may be biased. Explain.
5. When it comes to pets, do you prefer cats?
6. What is your favorite season?
YOUR TURN
7.6.F
375Lesson 12.1
© Houghton Miff
lin Harcourt Pub
lishing
Company
• Image Credits:
Photo
Spin
, Inc
./Alamy Limited

Random Sample of SeventhGrade Male Students
Student Shoe Size
1. Follow each method described below to collect data to estimate the
average shoe size of seventh grade boys. (Explore Activity)
Method 1
Randomly select 6 seventh grade boys
and ask each his shoe size. Record your
results in a table like the one shown.
Find the mean of this data. Mean:
Method 2
Find the 6 boys in your math class with the largest shoes and ask their
shoe size. Record your results in a table like the one shown in Method 1.
Find the mean of this data. Mean:
2. Method 1 produces results that are more / less representative of the
entire student population because it is a random / biased sample.
(Example 1)
3. Method 2 produces results that are more / less representative of the
entire student population because it is a random / biased sample.
(Example 1)
4. Heidi decides to use a random sample to determine her classmates’
favorite color. She asks, “Is green your favorite color?” Is Heidi’s question
biased? If so, give an example of an unbiased question that would serve
Heidi better. (Example 2)
A
B
A
B
Guided Practice
5. How can you select a sample so that the information gained represents
the entire population?
ESSENTIAL QUESTION CHECK-IN??
Unit 6376
© Houghton Miff
lin Harcourt Pub
lishing
Company
Personal Math Trainer
Online Assessment and
Interventionmy.hrw.com
Name Class Date
Independent Practice12.1
6. Paul and his friends average their test
grades and find that the average is 95.
The teacher announces that the average
grade of all of her classes is 83. Why are the
averages so different?
7. Nancy hears a report that the average
price of gasoline is $2.82. She averages the
prices of stations near her home. She finds
the average price of gas to be $3.03. Why
are the averages different?
For 8–11, determine whether each sample is a
random sample or a biased sample. Explain.
8. Carol wants to find out the favorite foods
of students at her middle school. She asks
the boys’ basketball team about their
favorite foods.
9. Dallas wants to know what elective
subjects the students at his school like
best. He surveys students who are leaving
band class.
10. Karim wants to know what day of the week
students at his school prefer. He randomly
asks students each day in the cafeteria.
11. Members of a polling organization
survey 700 registered voters by randomly
choosing names from a list of all registered
voters.
Determine whether each question may be
biased. Explain.
12. Joey wants to find out what sport seventh
grade girls like most. He asks girls, “Is
basketball your favorite sport?”
13. Jae wants to find out what type of art her
fellow students enjoy most. She asks her
classmates, “What is your favorite type of
art?”
7.6.F
377Lesson 12.1
© H
ough
ton
Miff
lin H
arco
urt P
ublis
hing
Com
pany

Work Area
14. Draw Conclusions Determine which sampling method will better
represent the entire population. Justify your answer.
Student Attendance at Football Games
Sampling Method Results of Survey
Collin surveys 78 students by randomly choosing names from the school directory.
63% attend football games.
Karl surveys 25 students that were sitting near him during lunch.
82% attend football games.
15. Multistep Barbara surveyed students in her school by looking at an
alphabetical list of the 600 student names, dividing them into groups of 10,
and randomly choosing one from each group.
a. How many students did she survey? What type of sample is this?
b. Barbara found that 35 of the survey participants had pets. About
what percent of the students she surveyed had pets? Is it safe to
believe that about the same percent of students in the school have
pets? Explain your thinking.
16. Communicating Mathematical Ideas Carlo said a population can have
more than one sample associated with it. Do you agree or disagree with
his statement? Justify your answer.
FOCUS ON HIGHER ORDER THINKING
Unit 6378
© Houghton Miff
lin Harcourt Pub
lishing
Company