Embed Size (px)
Citation preview

TLIM
Triodos SICAV IAnnual report 2019
are actively selected listed stocks and bonds of companies that solve global sustainability challenges through their business models.
Impact Equities & Bonds
Société d’Investissement à Capital Variable organised under the laws
of the Grand Duchy of Luxembourg.
Triodos Investment Management BV, a wholly-owned subsidiary of
Triodos Bank NV, is the management company of Triodos SICAV I.
The value of the investments may fluctuate. Past performance is no
guarantee of future results.
No subscription can be accepted on the basis of financial reports.
Subscriptions are only valid if they are made on the basis of the latest
published prospectus, as well as the latest annual report and the
most recent semi-annual report, if published since the latest annual
report. The prospectus and Key Investor Information Documents
(KIIDs) are available free of charge at the registered office of Triodos
SICAV I in Luxembourg and via Triodos Investment Management BV:
www.triodos-im.com.
TriodosSICAV IAnnualreport 2019
4
Key figures
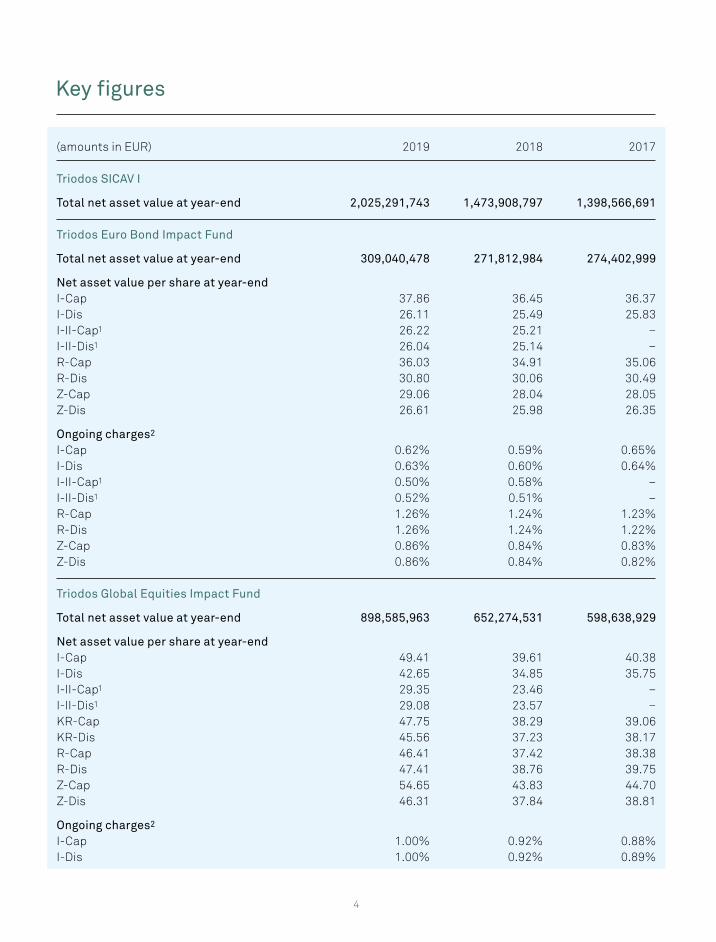
(amounts in EUR) 2019 2018 2017
Triodos SICAV I
Total net asset value at year-end 2,025,291,743 1,473,908,797 1,398,566,691
Triodos Euro Bond Impact Fund
Total net asset value at year-end 309,040,478 271,812,984 274,402,999
Net asset value per share at year-endI-Cap 37.86 36.45 36.37I-Dis 26.11 25.49 25.83I-II-Cap1 26.22 25.21 –I-II-Dis1 26.04 25.14 –R-Cap 36.03 34.91 35.06R-Dis 30.80 30.06 30.49Z-Cap 29.06 28.04 28.05Z-Dis 26.61 25.98 26.35
Ongoing charges2
I-Cap 0.62% 0.59% 0.65%I-Dis 0.63% 0.60% 0.64%I-II-Cap1 0.50% 0.58% –I-II-Dis1 0.52% 0.51% –R-Cap 1.26% 1.24% 1.23%R-Dis 1.26% 1.24% 1.22%Z-Cap 0.86% 0.84% 0.83%Z-Dis 0.86% 0.84% 0.82%
Triodos Global Equities Impact Fund
Total net asset value at year-end 898,585,963 652,274,531 598,638,929
Net asset value per share at year-endI-Cap 49.41 39.61 40.38I-Dis 42.65 34.85 35.75I-II-Cap1 29.35 23.46 –I-II-Dis1 29.08 23.57 –KR-Cap 47.75 38.29 39.06KR-Dis 45.56 37.23 38.17R-Cap 46.41 37.42 38.38R-Dis 47.41 38.76 39.75Z-Cap 54.65 43.83 44.70Z-Dis 46.31 37.84 38.81
Ongoing charges2
I-Cap 1.00% 0.92% 0.88%I-Dis 1.00% 0.92% 0.89%
5
Key figures (continued)
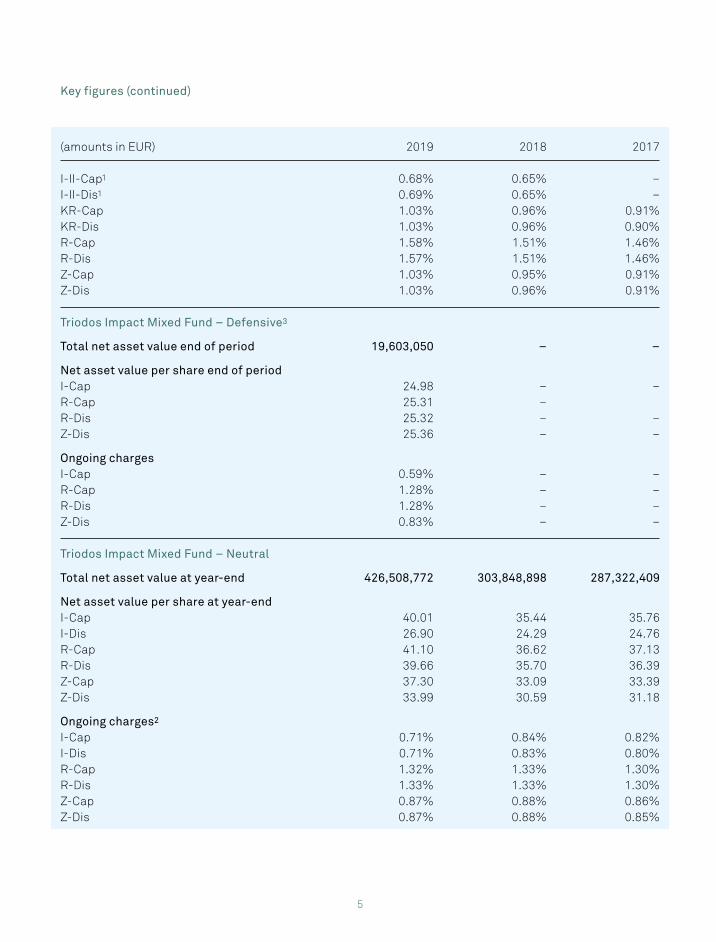
(amounts in EUR) 2019 2018 2017
I-II-Cap1 0.68% 0.65% –I-II-Dis1 0.69% 0.65% –KR-Cap 1.03% 0.96% 0.91%KR-Dis 1.03% 0.96% 0.90%R-Cap 1.58% 1.51% 1.46%R-Dis 1.57% 1.51% 1.46%Z-Cap 1.03% 0.95% 0.91%Z-Dis 1.03% 0.96% 0.91%
Triodos Impact Mixed Fund – Defensive3
Total net asset value end of period 19,603,050 – –
Net asset value per share end of periodI-Cap 24.98 – –R-Cap 25.31 –R-Dis 25.32 – –Z-Dis 25.36 – –
Ongoing chargesI-Cap 0.59% – –R-Cap 1.28% – –R-Dis 1.28% – –Z-Dis 0.83% – –
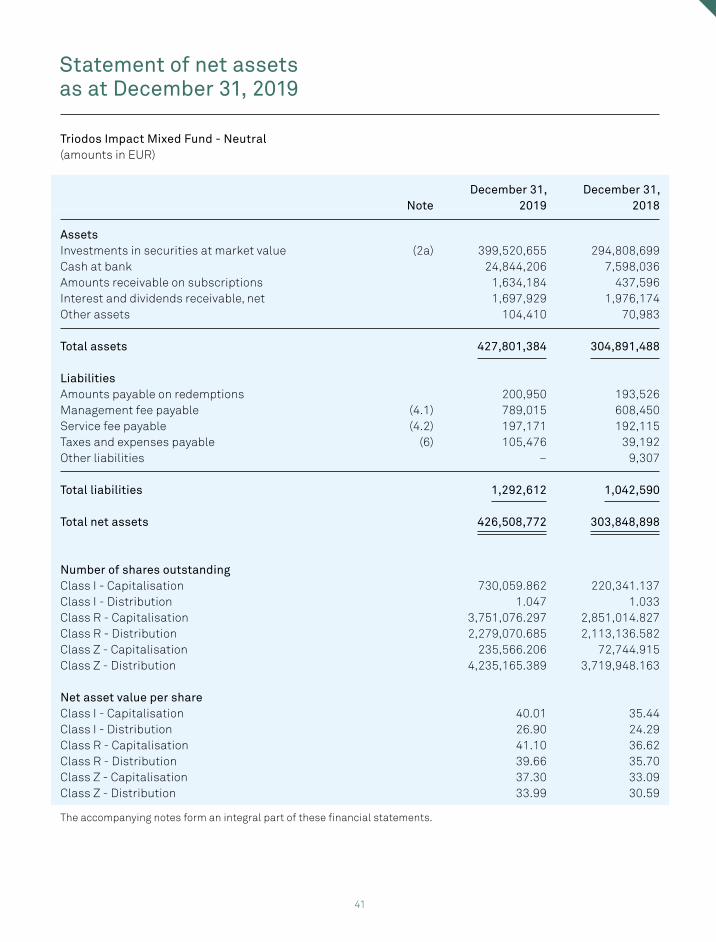
Triodos Impact Mixed Fund – Neutral
Total net asset value at year-end 426,508,772 303,848,898 287,322,409
Net asset value per share at year-endI-Cap 40.01 35.44 35.76I-Dis 26.90 24.29 24.76R-Cap 41.10 36.62 37.13R-Dis 39.66 35.70 36.39Z-Cap 37.30 33.09 33.39Z-Dis 33.99 30.59 31.18
Ongoing charges2
I-Cap 0.71% 0.84% 0.82%I-Dis 0.71% 0.83% 0.80%R-Cap 1.32% 1.33% 1.30%R-Dis 1.33% 1.33% 1.30%Z-Cap 0.87% 0.88% 0.86%Z-Dis 0.87% 0.88% 0.85%
6
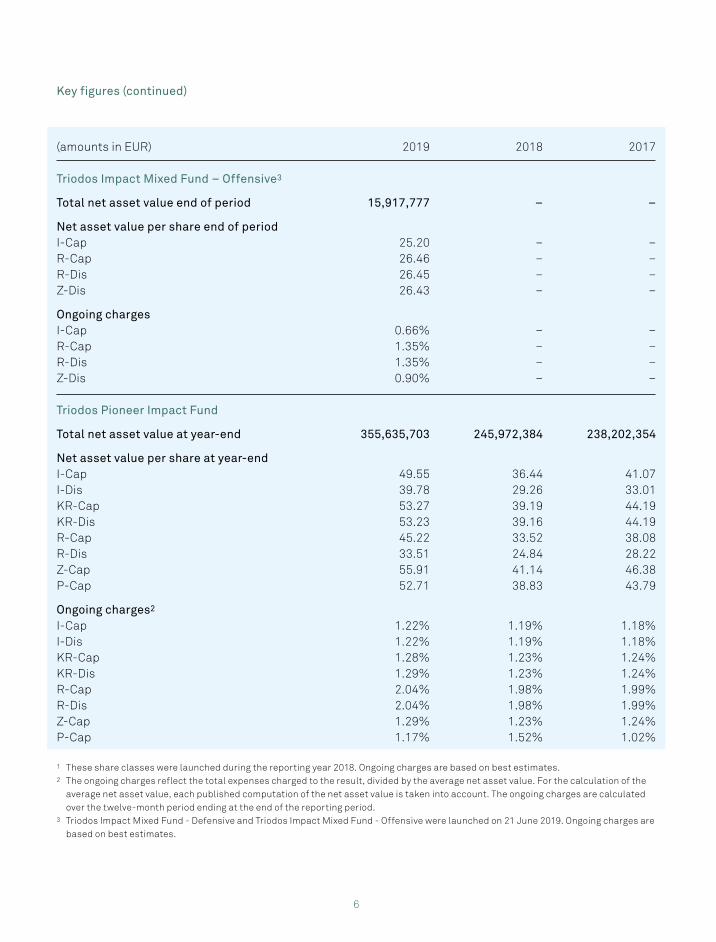
(amounts in EUR) 2019 2018 2017
Triodos Impact Mixed Fund – Offensive3
Total net asset value end of period 15,917,777 – –
Net asset value per share end of periodI-Cap 25.20 – –R-Cap 26.46 – –R-Dis 26.45 – –Z-Dis 26.43 – –
Ongoing chargesI-Cap 0.66% – –R-Cap 1.35% – –R-Dis 1.35% – –Z-Dis 0.90% – –
Triodos Pioneer Impact Fund
Total net asset value at year-end 355,635,703 245,972,384 238,202,354
Net asset value per share at year-endI-Cap 49.55 36.44 41.07I-Dis 39.78 29.26 33.01KR-Cap 53.27 39.19 44.19KR-Dis 53.23 39.16 44.19R-Cap 45.22 33.52 38.08R-Dis 33.51 24.84 28.22Z-Cap 55.91 41.14 46.38P-Cap 52.71 38.83 43.79
Ongoing charges2
I-Cap 1.22% 1.19% 1.18%I-Dis 1.22% 1.19% 1.18%KR-Cap 1.28% 1.23% 1.24%KR-Dis 1.29% 1.23% 1.24%R-Cap 2.04% 1.98% 1.99%R-Dis 2.04% 1.98% 1.99%Z-Cap 1.29% 1.23% 1.24%P-Cap 1.17% 1.52% 1.02%
1 These share classes were launched during the reporting year 2018. Ongoing charges are based on best estimates.2 The ongoing charges reflect the total expenses charged to the result, divided by the average net asset value. For the calculation of the
average net asset value, each published computation of the net asset value is taken into account. The ongoing charges are calculated over the twelve-month period ending at the end of the reporting period.
3 Triodos Impact Mixed Fund - Defensive and Triodos Impact Mixed Fund - Offensive were launched on 21 June 2019. Ongoing charges are based on best estimates.
Key figures (continued)
7
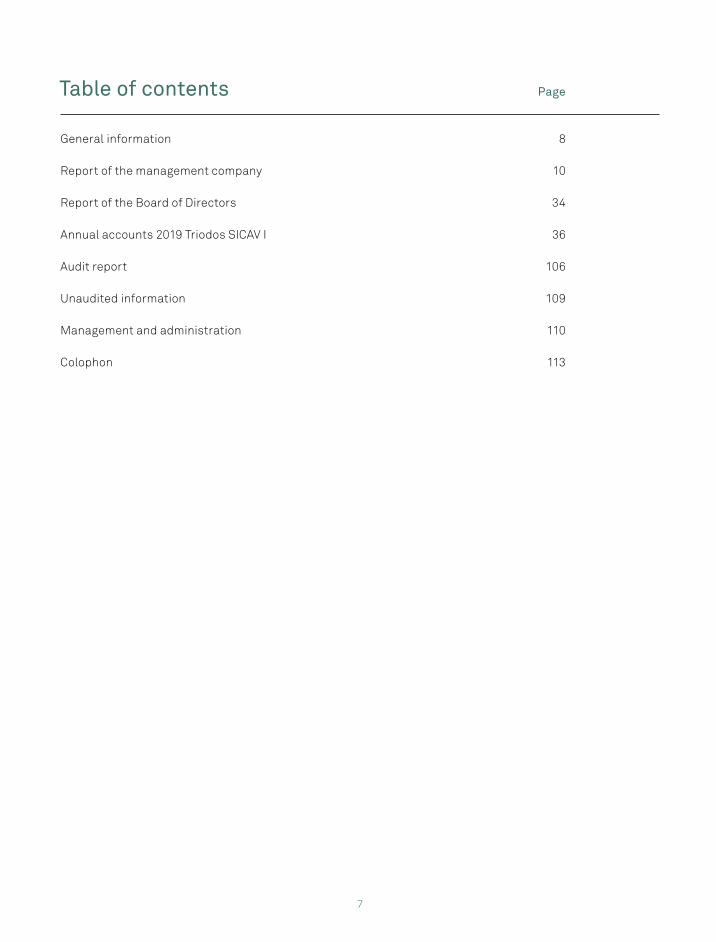
Table of contents Page
General information 8
Report of the management company 10
Report of the Board of Directors 34
Annual accounts 2019 Triodos SICAV I 36
Audit report 106
Unaudited information 109
Management and administration 110
Colophon 113
8
General information
Legal structure
Triodos SICAV I (the fund) is an open-ended investment company, incorporated in 2006 under the laws of the Grand Duchy of Luxembourg as a “Société d’Investissement à Capital Variable” (SICAV) in the form of a “société anonyme” for an unlimited period. Triodos SICAV I is governed by the law of the Grand Duchy of Luxembourg of August 10, 1915 on commercial companies, as amended, and by part I of the law of December 17, 2010 on Undertakings for Collective Investment, as amended. The fund merged in 2010 with Triodos Meerwaardefonds NV, a Dutch investment company incorporated in 1997 and consisting of three sub-funds.Triodos SICAV I, including its sub-funds, is supervised by the Luxembourg regulator, the Commission de Surveillance du Secteur Financier (CSSF). The registered office of Triodos SICAV I is established at 11-13, boulevard de la Foire, L-1528 Luxembourg.
Triodos SICAV I is structured as an umbrella fund, which may provide investors access to a variety of sub-funds. Currently, Triodos SICAV I offers the following sub-funds:
• Triodos Euro Bond Impact Fund, previously named Triodos Sustainable Bond Fund
(launched on July 16, 2007);• Triodos Global Equities Impact Fund, previously named Triodos Sustainable Equity Fund
(launched on July 16, 2007);• Triodos Impact Mixed Fund – Defensive,
(launched on June 21, 2019);• Triodos Impact Mixed Fund – Neutral, previously named Triodos Sustainable Mixed Fund
(launched on June 25, 2010);• Triodos Impact Mixed Fund – Offensive,
(launched on June 21, 2019);• Triodos Pioneer Impact Fund, previously named Triodos Sustainable Pioneer
Fund (launched on March 12, 2007).
Management company
The Board of Directors of Triodos SICAV I has appointed Triodos Investment Management BV (Triodos Investment Management) as its authorised UCITS management company of Triodos SICAV I. Triodos Investment Management is incorporated under the laws of the Netherlands and is a wholly-owned subsidiary of Triodos Bank NV (Triodos Bank).
Triodos Investment Management is supervised by the Dutch regulator, Autoriteit Financiële Markten. The Management Board of Triodos Investment Management consists of:Jacco Minnaar (Chair, as of January 1, 2019)Kor BosscherDick van Ommeren
Investment manager
Triodos Investment Management is the investment manager of the fund.Triodos Investment Management has appointed:• William de Vries as fund manager of Triodos Euro
Bond Impact Fund;• Pieter-Jan Hüsken as fund manager of Triodos
Global Equities Impact Fund;• Ruth van de Belt as fund manager of Triodos
Impact Mixed Fund (Defensive – Neutral – Offensive);
• Dirk Hoozemans as fund manager of Triodos Pioneer Impact Fund.
Depositary
RBC Investor Services Bank SA (RBC Investor Services Bank) has been appointed as depositary for Triodos SICAV I. Additionally, RBC Investor Services Bank fulfils the roles of administrative agent, registrar and transfer agent, domiciliary agent and paying agent for the fund.
9
Board of Directors
The Board of Directors consists of: Garry Pieters (Chair)Monique BachnerMarilou van Golstein Brouwers (until February 1, 2020)Corinne MolitorDick van Ommeren
10
Report of the management company
The fund invests worldwide in stock market listed companies and/or euro-denominated (sub-) sovereign bonds that have a positive impact on the transition to a sustainable world. Investments in the fund address seven sustainable transition themes that contribute to solving global challenges posed by structural trends such as ageing population, resource scarcity, inequality and social exclusion. Each sub-fund has its own risk-return profile, applies a long-term strategy and has a concentrated portfolio.
On May 15, 2019, the Triodos SICAV I sub-funds were renamed to more effectively and accurately convey their impact approach. Also, the fund announced the launch of two new mixed equity and bond funds that are managed to defensive and offensive risk-return profiles. The new mixed funds are variations of the original Triodos Sustainable Mixed Fund (changed to Triodos Impact Mixed Fund – Neutral), with the original fund being converted into the neutral profile fund. The two new sub-funds were launched on 21 June 2019.
In 2019, all Triodos SICAV I sub-funds earned the highest possible FNG-Siegel label (German fund sustainability label) and were part of the first cohort to receive the Towards Sustainability Label (Belgian fund sustainability label).
Additionally, Triodos Global Equities Impact Fund won “Best Sustainable Investment Fund” and the strategy’s whitepaper Impact Investing through Listed Equities and Bonds was nominated for “Best ESG Thought Leadership Paper” by Investment Week in the UK. Additionally, the fund’s impact reports won “Best ESG Reporting by a Small- and Mid-Sized Asset Manager” from Environmental Finance.
Impact investment approach
The fund distinguishes itself through its impact mandate, strict principles and active dialogue with companies. The investment process starts with a long-term vision for the transition towards a more sustainable society. The fund invests in companies that progress seven sustainable transition themes:
• Sustainable Food and Agriculture;• Sustainable Mobility and Infrastructure;• Renewable Resources;• Circular Economy;• Social Inclusion and Empowerment;• Innovation for Sustainability; and• Prosperous and Healthy People.
These transition themes are the cornerstone of our stock selection process, as each company in the portfolio must positively contribute to these through their commercial propositions. In addition, all investments must meet strict Triodos group-wide Minimum Standards.
The fund invests for positive change alongside a financial return in line with the broader market at acceptable risk levels, using strict investment criteria and a fully integrated investment and stewardship approach.
For a more extensive overview of the fund’s positive impact, an annual impact report will be published in the first half of 2020, as well as regular updates via www.triodos-im.com.
Macro-economy
The stock market ended the year in style, with rallying equity markets throughout the fourth quarter. Global stock markets reached record highs, which resulted in the best global annual performance since the Great Financial Crisis a decade ago. The main reason for the positive investor sentiment during 2019 was the synchronised global dovish turn in central banking policies at the beginning of the year. This overly positive investor sentiment did not, however, reflect the underlying weak fundamentals.
In 2019, the US – again – experienced the strongest growth of all major developed economies. However, US GDP growth is slowing, partly due to the escalation of trade war tensions between the US and China and the fading effects of earlier tax cuts. Positive news on the finalisation of the ‘phase one’ trade deal between the US and China somewhat
11
reduced tensions and drove up equity markets. In the eurozone, global trade weakness was the main reason for a year of subpar economic growth. Brexit uncertainty also hampered growth in both the eurozone and the UK. However, the withdrawal deal between both parties somewhat reduced investor fears of a hard Brexit.
China is experiencing a structural slowdown and the country felt the negative effects of the trade dispute with the US. Other Asian countries, such as Japan, were also affected by the global growth slowdown and trade uncertainty, whereas economic growth in Latin American countries was severely hampered by political unrest.
To counter a further slowdown (and, in some cases, boost inflation), the Federal Reserve, the European Central Bank (ECB) and the People’s Bank of China all cut interest rates in 2019, while the Bank of Japan prolonged its ultra-loose monetary policy. In combination with geopolitical uncertainty, this resulted in declining bonds yields – although, towards the end of the year, reduced tensions led to a modest uptick. Both developed and emerging equity markets benefited from the loose monetary policy environment that fuelled optimistic investor sentiment.
Market developments
In 2019, equity markets continued rising and valuations became loftier, driven largely by accommodative monetary policies pursued by global central banks. Meanwhile, earnings growth stalled and macroeconomic indicators continued to deteriorate.
For bond investors, 2019 proved to be a surprising year. Despite very low bond yields at the start of the year, the total return for fixed income markets was positive. A decade-long gradual downward move of interest rates culminated in a fully negative yield curve during the summer of this year, which has never been witnessed before, not even in Japan or Switzerland. During the summer, it became apparent that the ECB was willing to restart its
bond-buying programme, in order to support the Eurozone economy. At the same time, resistance against the unconventional monetary policy has been growing, and the capital markets are wondering whether the central banks are running out of levers to pull. That sentiment, in combination with a growing supply of bond issues, was reflected in a gradual rise of bond yields over the last four months of 2019.
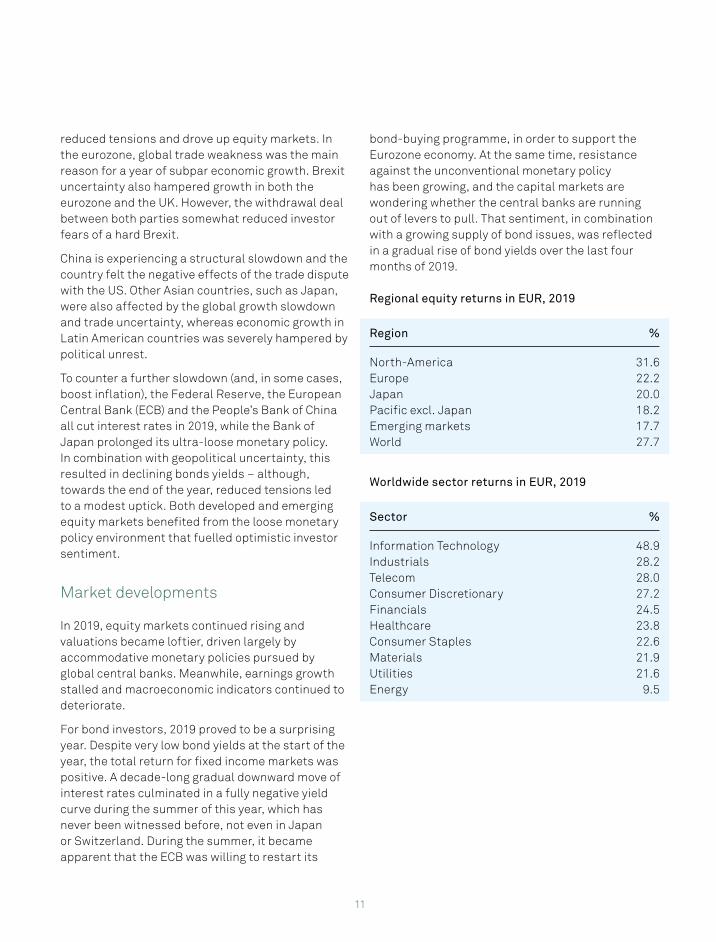
Regional equity returns in EUR, 2019
Region %
North-America 31.6Europe 22.2Japan 20.0Pacific excl. Japan 18.2Emerging markets 17.7World 27.7
Worldwide sector returns in EUR, 2019
Sector %
Information Technology 48.9Industrials 28.2Telecom 28.0Consumer Discretionary 27.2Financials 24.5Healthcare 23.8Consumer Staples 22.6Materials 21.9Utilities 21.6Energy 9.5
12
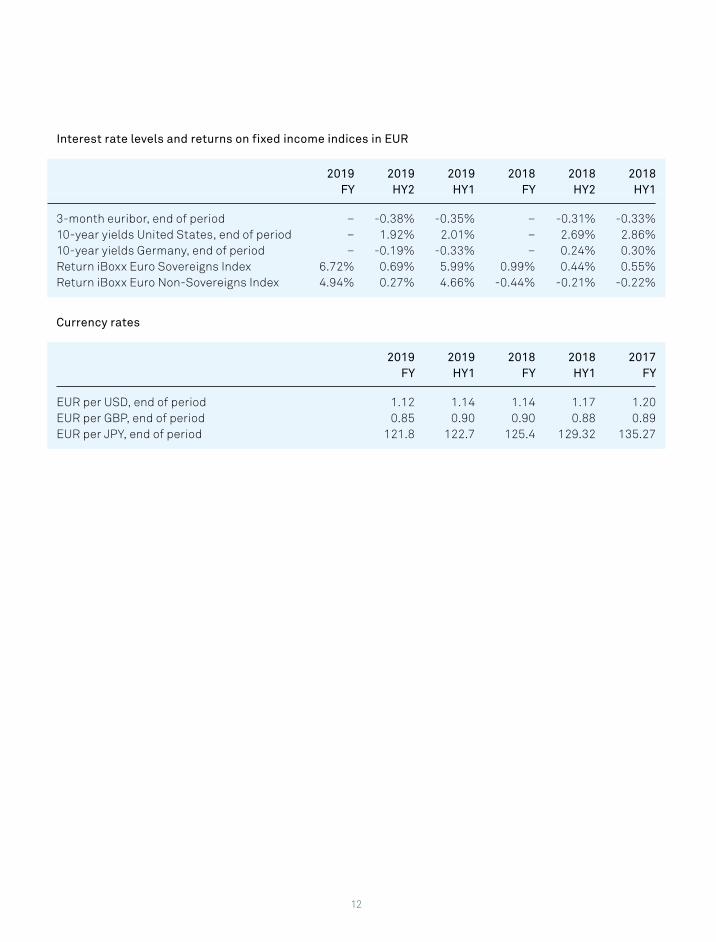
Interest rate levels and returns on fixed income indices in EUR
2019FY
2019 HY2
2019 HY1
2018FY
2018 HY2
2018 HY1
3-month euribor, end of period – -0.38% -0.35% – -0.31% -0.33%10-year yields United States, end of period – 1.92% 2.01% – 2.69% 2.86%10-year yields Germany, end of period – -0.19% -0.33% – 0.24% 0.30%Return iBoxx Euro Sovereigns Index 6.72% 0.69% 5.99% 0.99% 0.44% 0.55%Return iBoxx Euro Non-Sovereigns Index 4.94% 0.27% 4.66% -0.44% -0.21% -0.22%
Currency rates
2019 FY
2019 HY1
2018 FY
2018 HY1
2017 FY
EUR per USD, end of period 1.12 1.14 1.14 1.17 1.20EUR per GBP, end of period 0.85 0.90 0.90 0.88 0.89EUR per JPY, end of period 121.8 122.7 125.4 129.32 135.27
13
Triodos Euro Bond Impact Fund
Investment strategy
During the year, the investment strategy of the sub-fund was aimed at enabling more positive impact through the portfolio, by targeting new investments in designated green and social bonds, as well as in corporate bonds of companies that make a positive contribution to the sub-fund’s transition themes.
The portfolio’s allocation to corporate and green and social impact bonds was gradually increased, while sovereign bond allocations were reduced. The market saw a large number of sovereign green and social bond issues in 2019, and the sub-fund participated in several of these. Thus, the weight of impact bonds in the portfolio increased to more than 30% of the net asset value.
For example, positions were established in green and social bonds issued by the Flemish government,
the Basque region, Société du Grand Paris, Adif-Alta Velocidad, La Banque Postale, Société Transport de Ile-de-France, Nordrhein Westphalia, Action Logement Service and Instituto Credito Official. Other names added include Baxter, Zimmer Biomet, Telenor, RATP, Eurofima, Nordic Investment Bank, Stedin and Deutsche Kreditbank. Most of these new positions were established by participating in new issuances.
Positions in Heineken, Sodexo, UPS and Verizon were removed because they lacked a thematic fit. Furthermore, positions in ASML, SAP and DSM were reduced as the weight of these positions had become relatively large during the year.
Before the summer, the average duration of the portfolio was kept slightly below benchmark level, mostly by maintaining a somewhat higher cash level. Since August, the portfolio duration has
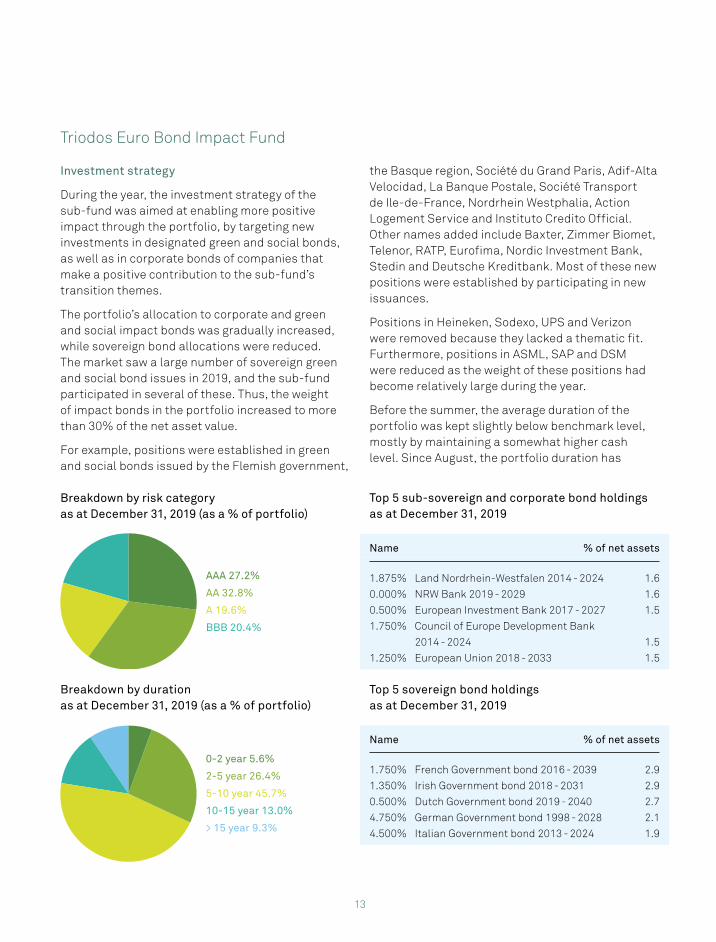
Top 5 sub-sovereign and corporate bond holdings as at December 31, 2019
Name % of net assets
1.875% Land Nordrhein-Westfalen 2014 - 2024 1.6
0.000% NRW Bank 2019 - 2029 1.6
0.500% European Investment Bank 2017 - 2027 1.5
1.750% Council of Europe Development Bank
2014 - 2024 1.5
1.250% European Union 2018 - 2033 1.5
Top 5 sovereign bond holdings as at December 31, 2019
Name % of net assets
1.750% French Government bond 2016 - 2039 2.9
1.350% Irish Government bond 2018 - 2031 2.9
0.500% Dutch Government bond 2019 - 2040 2.7
4.750% German Government bond 1998 - 2028 2.1
4.500% Italian Government bond 2013 - 2024 1.9
Breakdown by risk category as at December 31, 2019 (as a % of portfolio)
AAA 27.2%
AA 32.8%
A 19.6%
BBB 20.4%
Breakdown by duration as at December 31, 2019 (as a % of portfolio)
0-2 year 5.6%
2-5 year 26.4%
5-10 year 45.7%
10-15 year 13.0%
> 15 year 9.3%
14
been neutral to slightly longer than that of the benchmark, while the cash level has been reduced to close to zero.
Performance
In 2019, the total net assets of Triodos Euro Bond Impact Fund grew from EUR 271.8 million to EUR 309.0 million. During this period, the sub-fund (R-Dis) achieved a return of 3.2% (net of fees, including reinvestment of dividends), while the benchmark yielded 5.7%.
The underperformance can be attributed to four main factors. First, the underweight position in Italian sovereigns caused a strong negative selection effect. This (second) was also the case for the underweight position in lower-rated corporate bonds. Third, the underweight position in sovereigns resulted in a negative contribution, and, fourth, the overweight position in cash had a smaller but negative allocation effect.
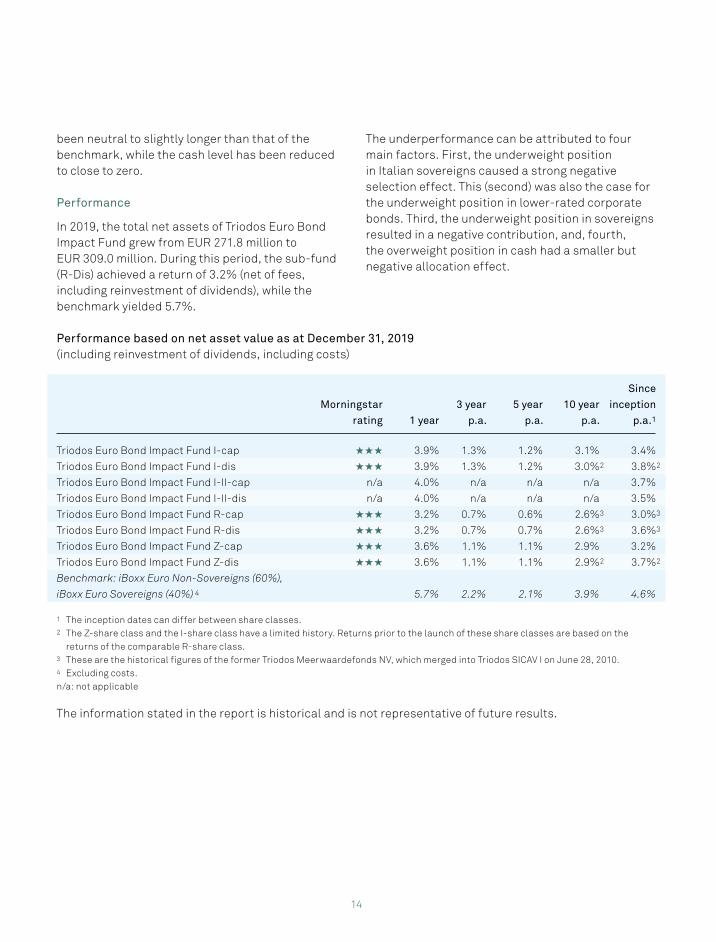
Performance based on net asset value as at December 31, 2019(including reinvestment of dividends, including costs)
Morningstar
rating 1 year
3 year
p.a.
5 year
p.a.
10 year
p.a.
Since
inception
p.a.1
Triodos Euro Bond Impact Fund I-cap ★ ★ ★ 3.9% 1.3% 1.2% 3.1% 3.4%
Triodos Euro Bond Impact Fund I-dis ★ ★ ★ 3.9% 1.3% 1.2% 3.0%2 3.8%2
Triodos Euro Bond Impact Fund I-II-cap n/a 4.0% n/a n/a n/a 3.7%
Triodos Euro Bond Impact Fund I-II-dis n/a 4.0% n/a n/a n/a 3.5%
Triodos Euro Bond Impact Fund R-cap ★ ★ ★ 3.2% 0.7% 0.6% 2.6%3 3.0%3
Triodos Euro Bond Impact Fund R-dis ★ ★ ★ 3.2% 0.7% 0.7% 2.6%3 3.6%3
Triodos Euro Bond Impact Fund Z-cap ★ ★ ★ 3.6% 1.1% 1.1% 2.9% 3.2%
Triodos Euro Bond Impact Fund Z-dis ★ ★ ★ 3.6% 1.1% 1.1% 2.9%2 3.7%2
Benchmark: iBoxx Euro Non-Sovereigns (60%),
iBoxx Euro Sovereigns (40%) 4 5.7% 2.2% 2.1% 3.9% 4.6%
1 The inception dates can differ between share classes.2 The Z-share class and the I-share class have a limited history. Returns prior to the launch of these share classes are based on the
returns of the comparable R-share class.3 These are the historical figures of the former Triodos Meerwaardefonds NV, which merged into Triodos SICAV I on June 28, 2010.4 Excluding costs. n/a: not applicable
The information stated in the report is historical and is not representative of future results.
15
Triodos Global Equities Impact Fund
Investment strategy
Over the year, the sub-fund continued to reduce its exposure to the US, while increasing its exposure to Japan. It also focused increasingly on investment opportunities in companies with decent cash flow visibility, strong balance sheets, supportive valuations and a clear fit with the sub-fund’s transition themes.
In 2019, ten companies were removed from the portfolio, whereas eleven positions in new companies were initiated. Heineken was sold in line with the sub-fund’s strategy to focus on the impact of companies and phase out all best-in-class names that do not positively contribute to our transition themes. Several companies were removed from the portfolio due to a breach of the Triodos Minimum Standards (Rockwell, Verizon and Waste Management), while Canadian Natural Railway was sold due to a conflicting exposure to fossil energy. Additionally, Becton Dickinson and DS Smith were sold in order to reduce the portfolio’s overlap with Triodos Pioneer Impact Fund, and ASML, Keyence and Waters Corp were sold for valuation reasons.
Cardboard manufacturer Smurfit Kappa (Ireland) and paper company International Paper (US) were added to the portfolio and fit in with the Circular Economy theme. French food producer Danone, Japanese cosmetics and food supplement company Fancl, and Irish food ingredients company Kerry Group were added to the Sustainable Food and Agriculture segment of the portfolio. Danish hearing aid supplier Demant and Japanese movie and theatre company Toho were added to the sub-fund's Prosperous and Healthy People allocation. Finally, the following Japanese companies were added: car manufacturer Toyota and electric traction motor company Nidec, which fit with the Sustainable Mobility and Infrastructure theme, and passive component manufacturer Murata and Shin Etsu Chemical, which contribute to the Innovation for Sustainability theme.
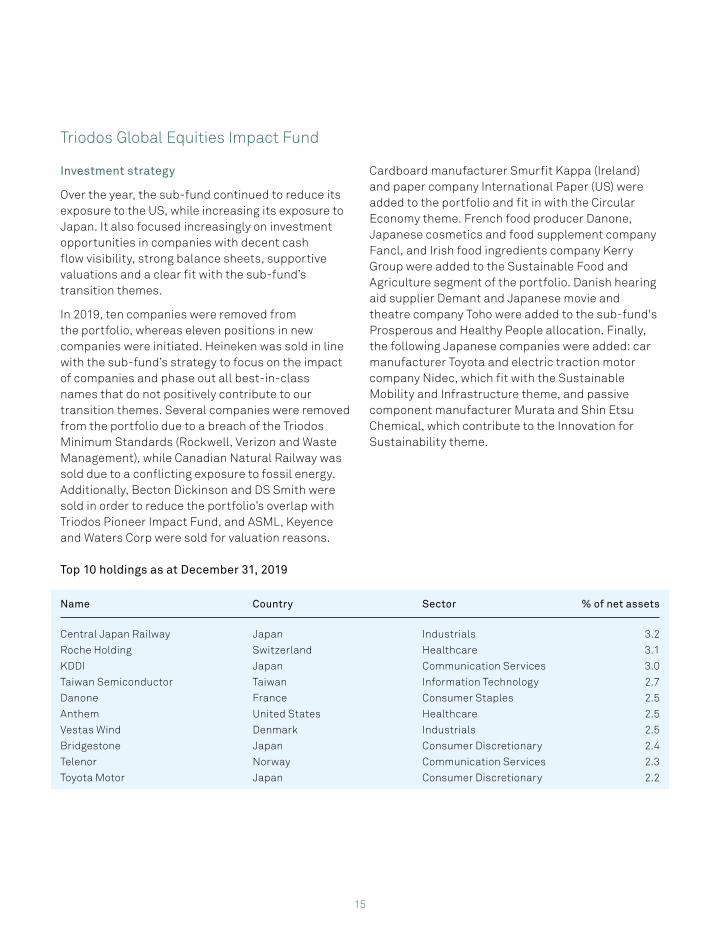
Top 10 holdings as at December 31, 2019
Name Country Sector % of net assets
Central Japan Railway Japan Industrials 3.2
Roche Holding Switzerland Healthcare 3.1
KDDI Japan Communication Services 3.0
Taiwan Semiconductor Taiwan Information Technology 2.7
Danone France Consumer Staples 2.5
Anthem United States Healthcare 2.5
Vestas Wind Denmark Industrials 2.5
Bridgestone Japan Consumer Discretionary 2.4
Telenor Norway Communication Services 2.3
Toyota Motor Japan Consumer Discretionary 2.2
16
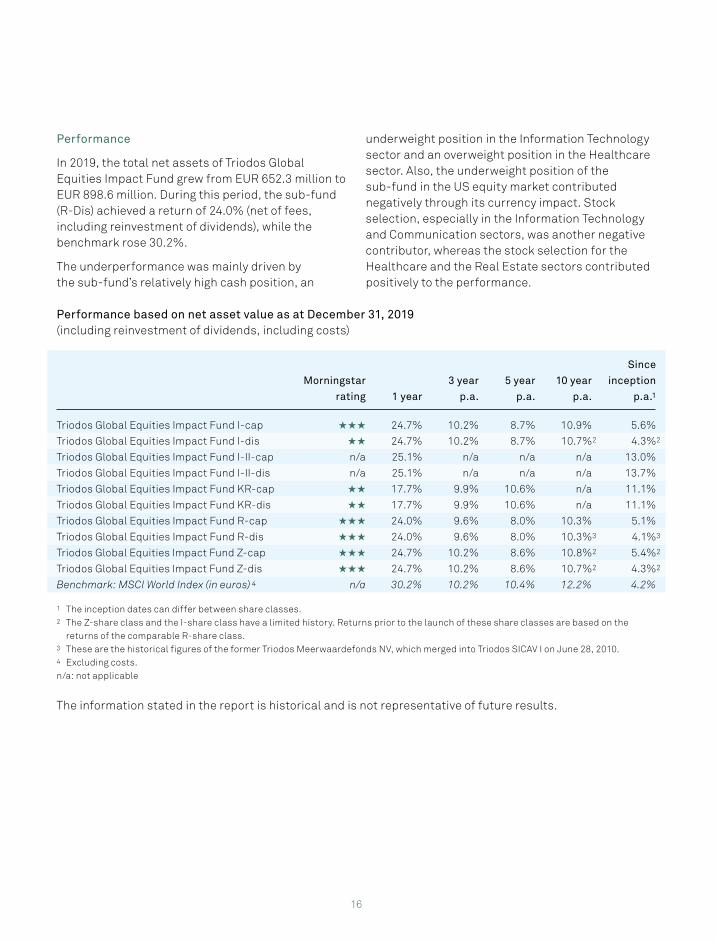
Performance
In 2019, the total net assets of Triodos Global Equities Impact Fund grew from EUR 652.3 million to EUR 898.6 million. During this period, the sub-fund (R-Dis) achieved a return of 24.0% (net of fees, including reinvestment of dividends), while the benchmark rose 30.2%.
The underperformance was mainly driven by the sub-fund’s relatively high cash position, an
underweight position in the Information Technology sector and an overweight position in the Healthcare sector. Also, the underweight position of the sub-fund in the US equity market contributed negatively through its currency impact. Stock selection, especially in the Information Technology and Communication sectors, was another negative contributor, whereas the stock selection for the Healthcare and the Real Estate sectors contributed positively to the performance.
Performance based on net asset value as at December 31, 2019(including reinvestment of dividends, including costs)
Morningstar
rating 1 year
3 year
p.a.
5 year
p.a.
10 year
p.a.
Since
inception
p.a.1
Triodos Global Equities Impact Fund I-cap ★ ★ ★ 24.7% 10.2% 8.7% 10.9% 5.6%
Triodos Global Equities Impact Fund I-dis ★ ★ 24.7% 10.2% 8.7% 10.7%2 4.3%2
Triodos Global Equities Impact Fund I-II-cap n/a 25.1% n/a n/a n/a 13.0%
Triodos Global Equities Impact Fund I-II-dis n/a 25.1% n/a n/a n/a 13.7%
Triodos Global Equities Impact Fund KR-cap ★ ★ 17.7% 9.9% 10.6% n/a 11.1%
Triodos Global Equities Impact Fund KR-dis ★ ★ 17.7% 9.9% 10.6% n/a 11.1%
Triodos Global Equities Impact Fund R-cap ★ ★ ★ 24.0% 9.6% 8.0% 10.3% 5.1%
Triodos Global Equities Impact Fund R-dis ★ ★ ★ 24.0% 9.6% 8.0% 10.3%3 4.1%3
Triodos Global Equities Impact Fund Z-cap ★ ★ ★ 24.7% 10.2% 8.6% 10.8%2 5.4%2
Triodos Global Equities Impact Fund Z-dis ★ ★ ★ 24.7% 10.2% 8.6% 10.7%2 4.3%2
Benchmark: MSCI World Index (in euros) 4 n/a 30.2% 10.2% 10.4% 12.2% 4.2%
1 The inception dates can differ between share classes.2 The Z-share class and the I-share class have a limited history. Returns prior to the launch of these share classes are based on the
returns of the comparable R-share class.3 These are the historical figures of the former Triodos Meerwaardefonds NV, which merged into Triodos SICAV I on June 28, 2010.4 Excluding costs.n/a: not applicable
The information stated in the report is historical and is not representative of future results.
17
Triodos Impact Mixed Fund (TIMF) – Defensive, Neutral, Offensive
Investment strategy
At the beginning of 2019, valuations were high, economic growth and earnings were expected to fall back and risks were expected to continue escalating. As a result, the sub-funds were positioned defensively, underweighting equities and overweighting cash.
Within the portfolios’ equity holdings, exposure to the US was decreased and exposure to Japan was increased. In the bond holdings, the allocation to corporate and designated green and social bonds gradually increased, while exposure to “plain vanilla” sovereign bonds was reduced.
In 2019, eight equity names and seven bond names were removed from the TIMF-Neutral portfolio. Heineken was sold in line with the sub-fund’s strategy to focus on the impact of companies and phase out all best-in-class names that do not make a positive contribution to our transition themes. Several companies were removed from the portfolio due to a breach of the Triodos Minimum Standards (Rockwell, Verizon and Waste Management), while Canadian Natural Railway was sold due to a conflicting exposure to fossil energy.
During the year, positions in 11 new equity and 26 bond holdings were initiated.
On the equity side, cardboard manufacturer Smurfit Kappa (Ireland) and paper company International Paper (US) were added to the portfolio. These companies fit in with the Circular Economy theme. French food producer Danone, Japanese cosmetics and food supplement company Fancl, and Irish food ingredients company Kerry Group were added to the Sustainable Food and Agriculture segment of the portfolio. Danish hearing aid supplier Demant and Japanese movie and theatre company Toho were added to the sub-fund’s Prosperous and Healthy People allocation. Finally, the following Japanese companies were added: car manufacturer Toyota and electric traction motor company Nidec, which fit with the Sustainable Mobility and Infrastructure
theme, and passive component company manufacturer Murata and Shin Etsu Chemical, which contribute to the Innovation for Sustainability theme.
A large number of social and green bond issues have been added to the portfolio, including bonds issued by Instituto de Credito Oficial, Caisse Française de Financement Local, Nordic Investment Bank, Action Logement Services, Municipality Finance, NRW Bank, Régie Autonome des Transports Parisiens, SNCF Réseau and the Basque and Walloon regions.
As TIMF-Defensive and TIMF-Offensive were launched in June 2019, the portfolio was constructed in the second half of the year.
18
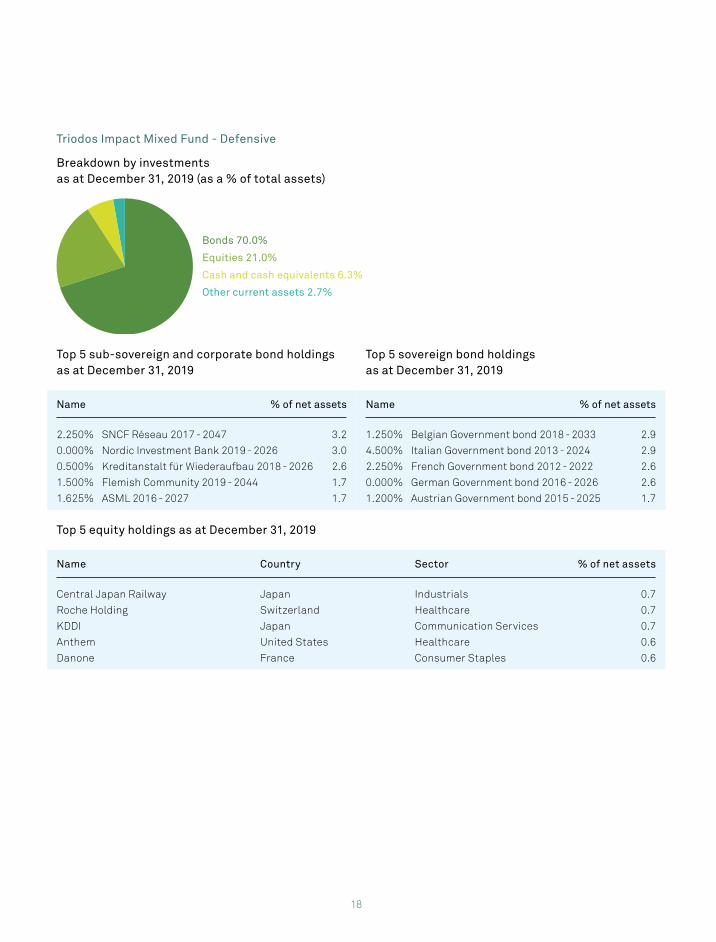
Triodos Impact Mixed Fund - Defensive
Breakdown by investments as at December 31, 2019 (as a % of total assets)
Bonds 70.0%
Equities 21.0%
Cash and cash equivalents 6.3%
Other current assets 2.7%
Top 5 sub-sovereign and corporate bond holdings as at December 31, 2019
Name % of net assets
2.250% SNCF Réseau 2017 - 2047 3.2
0.000% Nordic Investment Bank 2019 - 2026 3.0
0.500% Kreditanstalt für Wiederaufbau 2018 - 2026 2.6
1.500% Flemish Community 2019 - 2044 1.7
1.625% ASML 2016 - 2027 1.7
Top 5 equity holdings as at December 31, 2019
Name Country Sector % of net assets
Central Japan Railway Japan Industrials 0.7
Roche Holding Switzerland Healthcare 0.7
KDDI Japan Communication Services 0.7
Anthem United States Healthcare 0.6
Danone France Consumer Staples 0.6
Top 5 sovereign bond holdings as at December 31, 2019
Name % of net assets
1.250% Belgian Government bond 2018 - 2033 2.9
4.500% Italian Government bond 2013 - 2024 2.9
2.250% French Government bond 2012 - 2022 2.6
0.000% German Government bond 2016 - 2026 2.6
1.200% Austrian Government bond 2015 - 2025 1.7
19
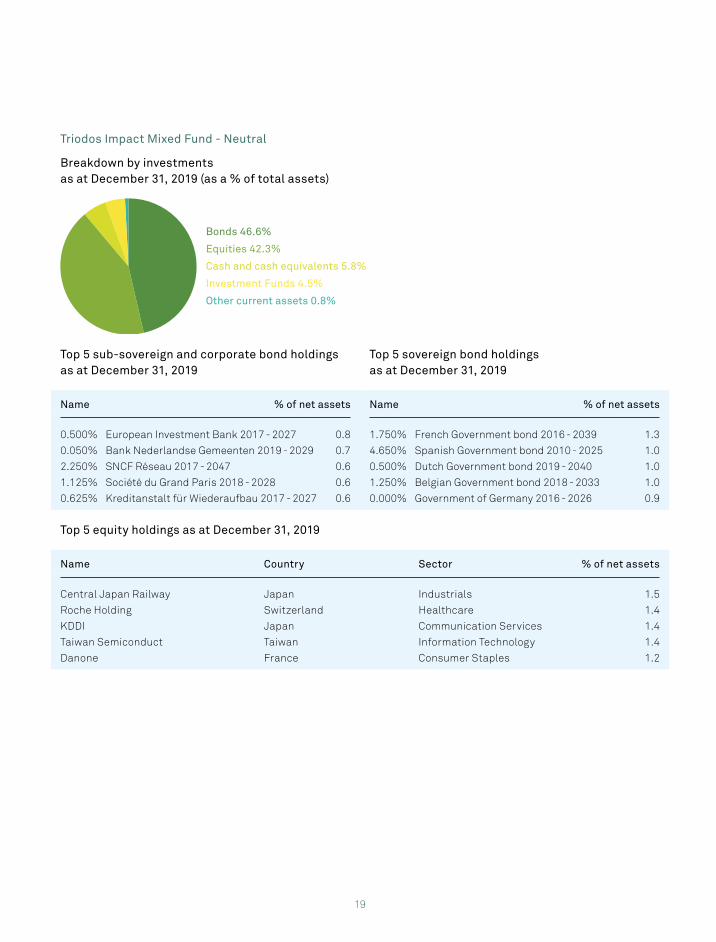
Triodos Impact Mixed Fund - Neutral
Breakdown by investments as at December 31, 2019 (as a % of total assets)
Bonds 46.6%
Equities 42.3%
Cash and cash equivalents 5.8%
Investment Funds 4.5%
Other current assets 0.8%
Top 5 sub-sovereign and corporate bond holdings as at December 31, 2019
Name % of net assets
0.500% European Investment Bank 2017 - 2027 0.8
0.050% Bank Nederlandse Gemeenten 2019 - 2029 0.7
2.250% SNCF Réseau 2017 - 2047 0.6
1.125% Société du Grand Paris 2018 - 2028 0.6
0.625% Kreditanstalt für Wiederaufbau 2017 - 2027 0.6
Top 5 equity holdings as at December 31, 2019
Name Country Sector % of net assets
Central Japan Railway Japan Industrials 1.5
Roche Holding Switzerland Healthcare 1.4
KDDI Japan Communication Services 1.4
Taiwan Semiconduct Taiwan Information Technology 1.4
Danone France Consumer Staples 1.2
Top 5 sovereign bond holdings as at December 31, 2019
Name % of net assets
1.750% French Government bond 2016 - 2039 1.3
4.650% Spanish Government bond 2010 - 2025 1.0
0.500% Dutch Government bond 2019 - 2040 1.0
1.250% Belgian Government bond 2018 - 2033 1.0
0.000% Government of Germany 2016 - 2026 0.9
20
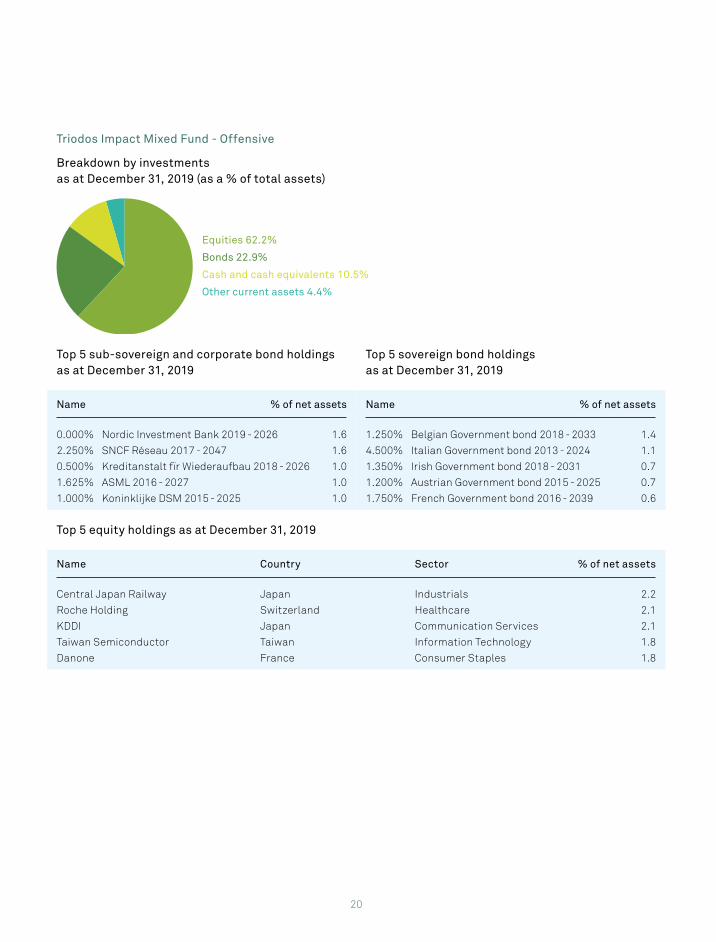
Triodos Impact Mixed Fund - Offensive
Breakdown by investments as at December 31, 2019 (as a % of total assets)
Equities 62.2%
Bonds 22.9%
Cash and cash equivalents 10.5%
Other current assets 4.4%
Top 5 sub-sovereign and corporate bond holdings as at December 31, 2019
Name % of net assets
0.000% Nordic Investment Bank 2019 - 2026 1.6
2.250% SNCF Réseau 2017 - 2047 1.6
0.500% Kreditanstalt fïr Wiederaufbau 2018 - 2026 1.0
1.625% ASML 2016 - 2027 1.0
1.000% Koninklijke DSM 2015 - 2025 1.0
Top 5 equity holdings as at December 31, 2019
Name Country Sector % of net assets
Central Japan Railway Japan Industrials 2.2
Roche Holding Switzerland Healthcare 2.1
KDDI Japan Communication Services 2.1
Taiwan Semiconductor Taiwan Information Technology 1.8
Danone France Consumer Staples 1.8
Top 5 sovereign bond holdings as at December 31, 2019
Name % of net assets
1.250% Belgian Government bond 2018 - 2033 1.4
4.500% Italian Government bond 2013 - 2024 1.1
1.350% Irish Government bond 2018 - 2031 0.7
1.200% Austrian Government bond 2015 - 2025 0.7
1.750% French Government bond 2016 - 2039 0.6
21
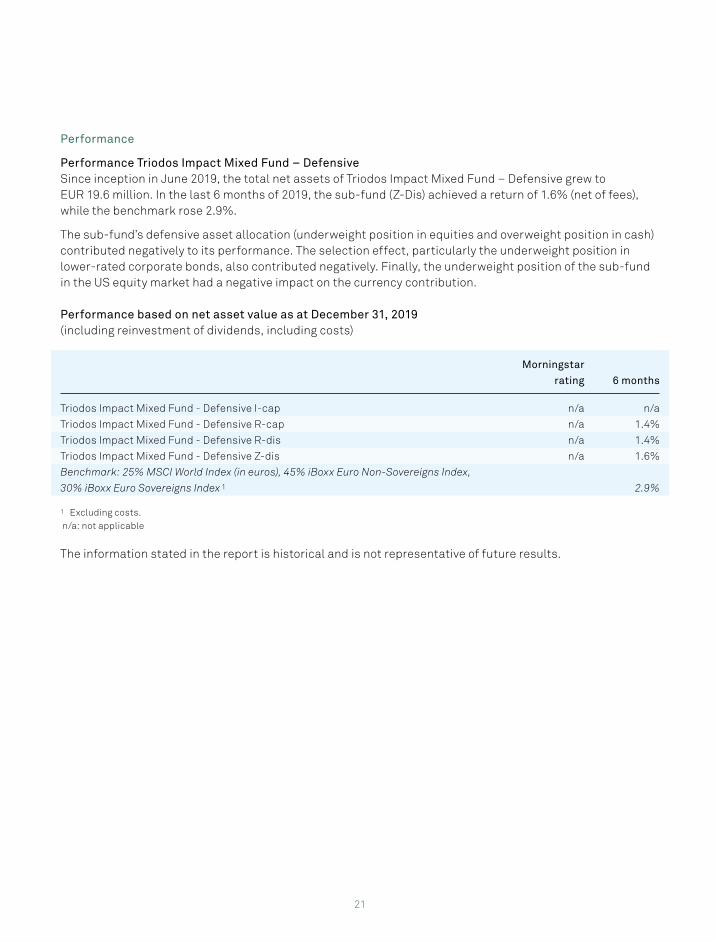
Performance
Performance Triodos Impact Mixed Fund – DefensiveSince inception in June 2019, the total net assets of Triodos Impact Mixed Fund – Defensive grew to EUR 19.6 million. In the last 6 months of 2019, the sub-fund (Z-Dis) achieved a return of 1.6% (net of fees), while the benchmark rose 2.9%.
The sub-fund’s defensive asset allocation (underweight position in equities and overweight position in cash) contributed negatively to its performance. The selection effect, particularly the underweight position in lower-rated corporate bonds, also contributed negatively. Finally, the underweight position of the sub-fund in the US equity market had a negative impact on the currency contribution.
Performance based on net asset value as at December 31, 2019(including reinvestment of dividends, including costs)
Morningstar
rating 6 months
Triodos Impact Mixed Fund - Defensive I-cap n/a n/a
Triodos Impact Mixed Fund - Defensive R-cap n/a 1.4%
Triodos Impact Mixed Fund - Defensive R-dis n/a 1.4%
Triodos Impact Mixed Fund - Defensive Z-dis n/a 1.6%
Benchmark: 25% MSCI World Index (in euros), 45% iBoxx Euro Non-Sovereigns Index,
30% iBoxx Euro Sovereigns Index 1 2.9%
1 Excluding costs. n/a: not applicable
The information stated in the report is historical and is not representative of future results.
22
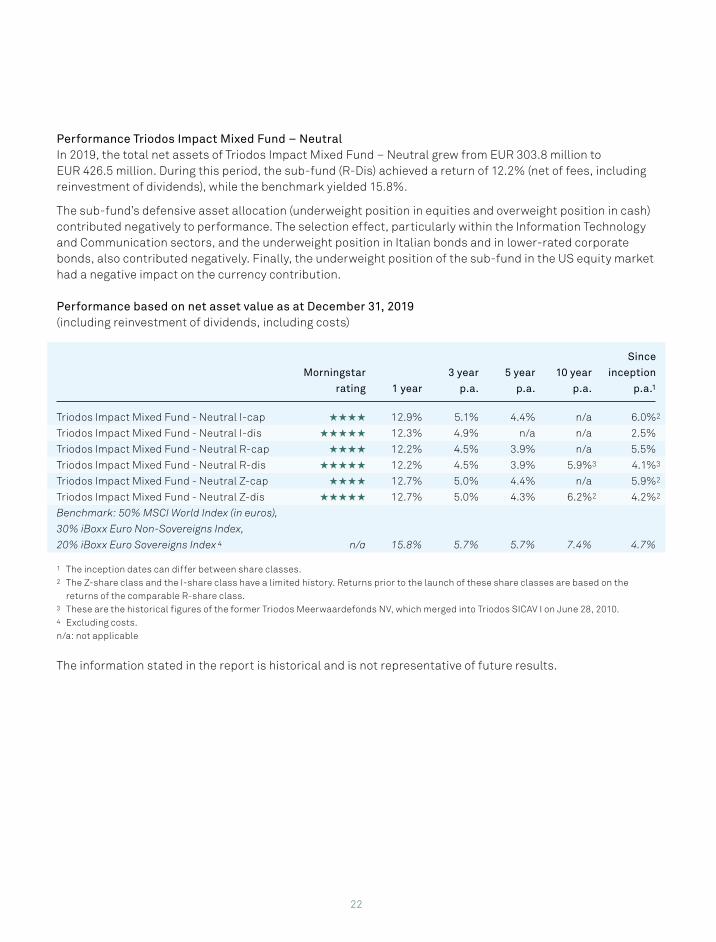
Performance Triodos Impact Mixed Fund – NeutralIn 2019, the total net assets of Triodos Impact Mixed Fund – Neutral grew from EUR 303.8 million to EUR 426.5 million. During this period, the sub-fund (R-Dis) achieved a return of 12.2% (net of fees, including reinvestment of dividends), while the benchmark yielded 15.8%.
The sub-fund’s defensive asset allocation (underweight position in equities and overweight position in cash) contributed negatively to performance. The selection effect, particularly within the Information Technology and Communication sectors, and the underweight position in Italian bonds and in lower-rated corporate bonds, also contributed negatively. Finally, the underweight position of the sub-fund in the US equity market had a negative impact on the currency contribution.
Performance based on net asset value as at December 31, 2019(including reinvestment of dividends, including costs)
Morningstar
rating 1 year
3 year
p.a.
5 year
p.a.
10 year
p.a.
Since
inception
p.a.1
Triodos Impact Mixed Fund - Neutral I-cap ★ ★ ★ ★ 12.9% 5.1% 4.4% n/a 6.0%2
Triodos Impact Mixed Fund - Neutral I-dis ★ ★ ★ ★ ★ 12.3% 4.9% n/a n/a 2.5%
Triodos Impact Mixed Fund - Neutral R-cap ★ ★ ★ ★ 12.2% 4.5% 3.9% n/a 5.5%
Triodos Impact Mixed Fund - Neutral R-dis ★ ★ ★ ★ ★ 12.2% 4.5% 3.9% 5.9%3 4.1%3
Triodos Impact Mixed Fund - Neutral Z-cap ★ ★ ★ ★ 12.7% 5.0% 4.4% n/a 5.9%2
Triodos Impact Mixed Fund - Neutral Z-dis ★ ★ ★ ★ ★ 12.7% 5.0% 4.3% 6.2%2 4.2%2
Benchmark: 50% MSCI World Index (in euros),
30% iBoxx Euro Non-Sovereigns Index,
20% iBoxx Euro Sovereigns Index 4 n/a 15.8% 5.7% 5.7% 7.4% 4.7%
1 The inception dates can differ between share classes.2 The Z-share class and the I-share class have a limited history. Returns prior to the launch of these share classes are based on the
returns of the comparable R-share class.3 These are the historical figures of the former Triodos Meerwaardefonds NV, which merged into Triodos SICAV I on June 28, 2010.4 Excluding costs.n/a: not applicable
The information stated in the report is historical and is not representative of future results.
23
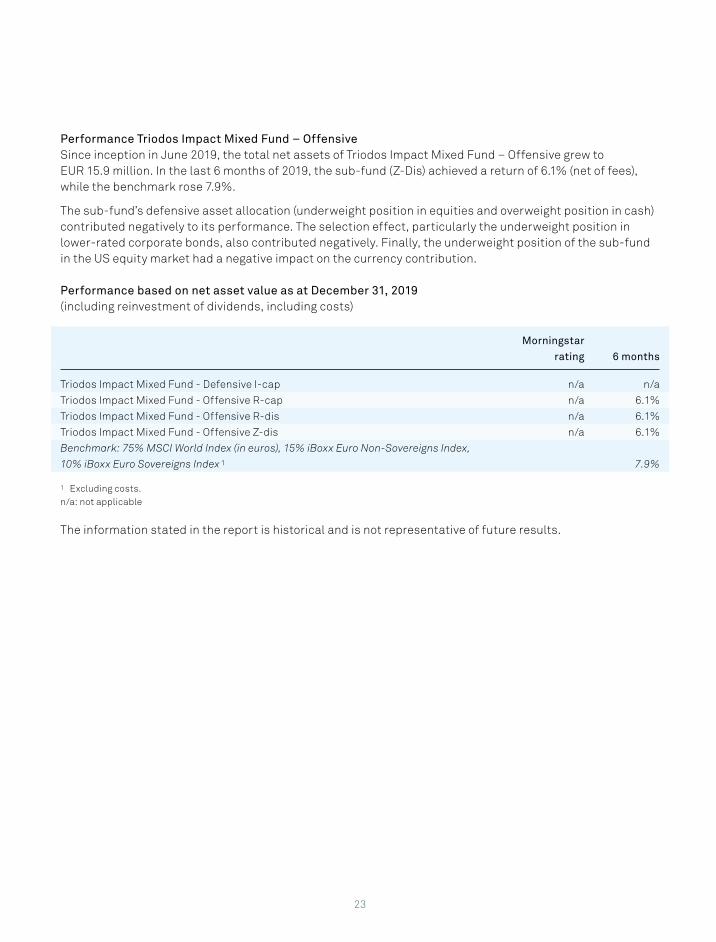
Performance Triodos Impact Mixed Fund – OffensiveSince inception in June 2019, the total net assets of Triodos Impact Mixed Fund – Offensive grew to EUR 15.9 million. In the last 6 months of 2019, the sub-fund (Z-Dis) achieved a return of 6.1% (net of fees), while the benchmark rose 7.9%.
The sub-fund’s defensive asset allocation (underweight position in equities and overweight position in cash) contributed negatively to its performance. The selection effect, particularly the underweight position in lower-rated corporate bonds, also contributed negatively. Finally, the underweight position of the sub-fund in the US equity market had a negative impact on the currency contribution.
Performance based on net asset value as at December 31, 2019(including reinvestment of dividends, including costs)
Morningstar
rating 6 months
Triodos Impact Mixed Fund - Defensive I-cap n/a n/a
Triodos Impact Mixed Fund - Offensive R-cap n/a 6.1%
Triodos Impact Mixed Fund - Offensive R-dis n/a 6.1%
Triodos Impact Mixed Fund - Offensive Z-dis n/a 6.1%
Benchmark: 75% MSCI World Index (in euros), 15% iBoxx Euro Non-Sovereigns Index,
10% iBoxx Euro Sovereigns Index 1 7.9%
1 Excluding costs.n/a: not applicable
The information stated in the report is historical and is not representative of future results.
24
Triodos Pioneer Impact Fund
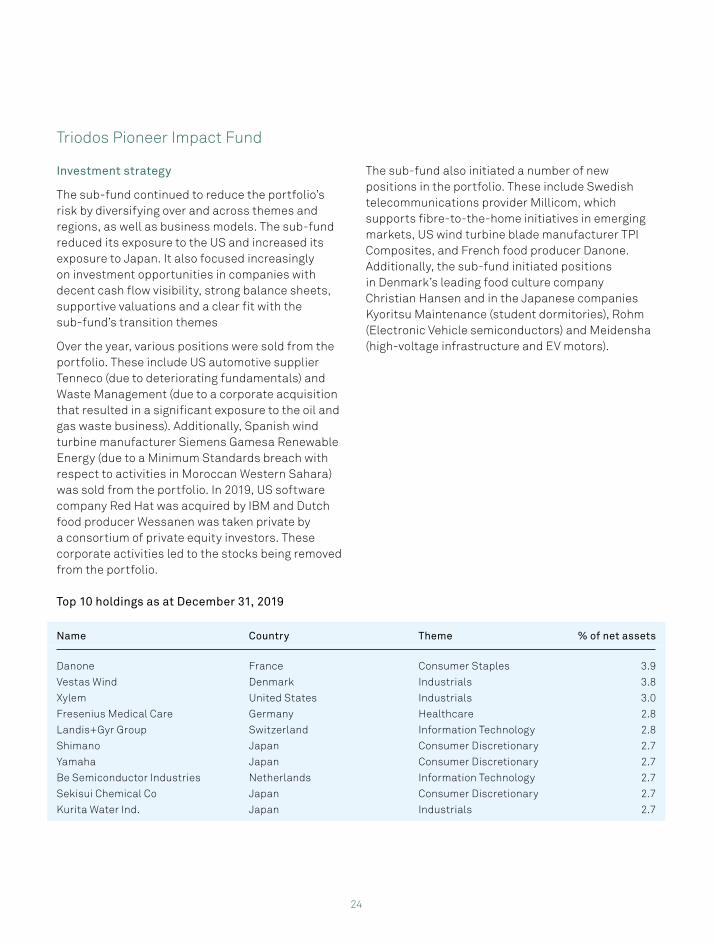
Investment strategy
The sub-fund continued to reduce the portfolio’s risk by diversifying over and across themes and regions, as well as business models. The sub-fund reduced its exposure to the US and increased its exposure to Japan. It also focused increasingly on investment opportunities in companies with decent cash flow visibility, strong balance sheets, supportive valuations and a clear fit with the sub-fund’s transition themes
Over the year, various positions were sold from the portfolio. These include US automotive supplier Tenneco (due to deteriorating fundamentals) and Waste Management (due to a corporate acquisition that resulted in a significant exposure to the oil and gas waste business). Additionally, Spanish wind turbine manufacturer Siemens Gamesa Renewable Energy (due to a Minimum Standards breach with respect to activities in Moroccan Western Sahara) was sold from the portfolio. In 2019, US software company Red Hat was acquired by IBM and Dutch food producer Wessanen was taken private by a consortium of private equity investors. These corporate activities led to the stocks being removed from the portfolio.
The sub-fund also initiated a number of new positions in the portfolio. These include Swedish telecommunications provider Millicom, which supports fibre-to-the-home initiatives in emerging markets, US wind turbine blade manufacturer TPI Composites, and French food producer Danone. Additionally, the sub-fund initiated positions in Denmark’s leading food culture company Christian Hansen and in the Japanese companies Kyoritsu Maintenance (student dormitories), Rohm (Electronic Vehicle semiconductors) and Meidensha (high-voltage infrastructure and EV motors).
Top 10 holdings as at December 31, 2019
Name Country Theme % of net assets
Danone France Consumer Staples 3.9
Vestas Wind Denmark Industrials 3.8
Xylem United States Industrials 3.0
Fresenius Medical Care Germany Healthcare 2.8
Landis+Gyr Group Switzerland Information Technology 2.8
Shimano Japan Consumer Discretionary 2.7
Yamaha Japan Consumer Discretionary 2.7
Be Semiconductor Industries Netherlands Information Technology 2.7
Sekisui Chemical Co Japan Consumer Discretionary 2.7
Kurita Water Ind. Japan Industrials 2.7
25
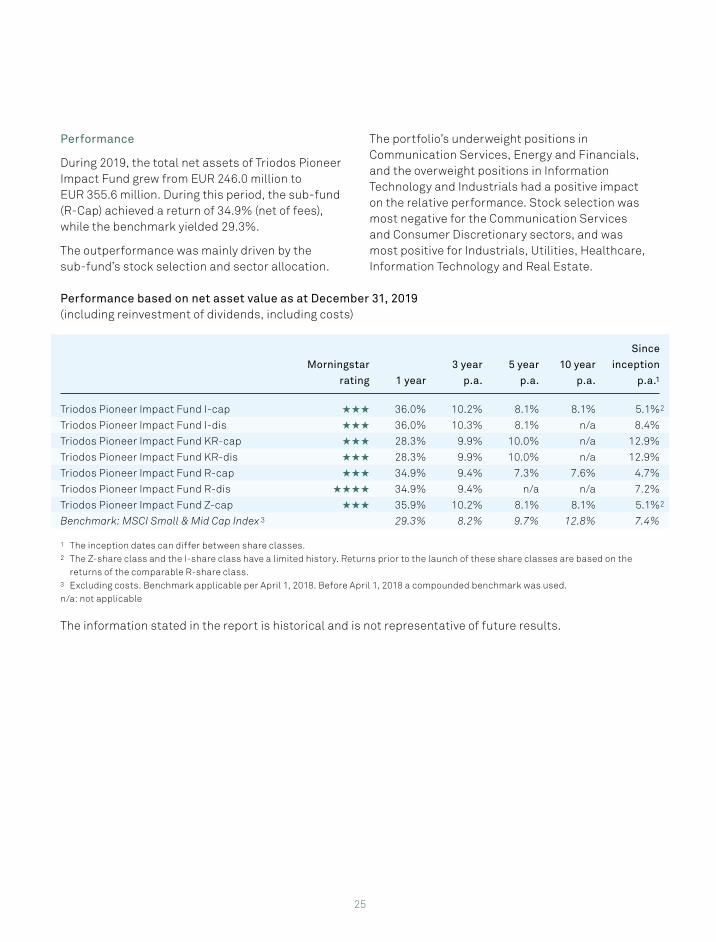
Performance
During 2019, the total net assets of Triodos Pioneer Impact Fund grew from EUR 246.0 million to EUR 355.6 million. During this period, the sub-fund (R-Cap) achieved a return of 34.9% (net of fees), while the benchmark yielded 29.3%.
The outperformance was mainly driven by the sub-fund’s stock selection and sector allocation.
The portfolio’s underweight positions in Communication Services, Energy and Financials, and the overweight positions in Information Technology and Industrials had a positive impact on the relative performance. Stock selection was most negative for the Communication Services and Consumer Discretionary sectors, and was most positive for Industrials, Utilities, Healthcare, Information Technology and Real Estate.
Performance based on net asset value as at December 31, 2019(including reinvestment of dividends, including costs)
Morningstar
rating 1 year
3 year
p.a.
5 year
p.a.
10 year
p.a.
Since
inception
p.a.1
Triodos Pioneer Impact Fund I-cap ★ ★ ★ 36.0% 10.2% 8.1% 8.1% 5.1%2
Triodos Pioneer Impact Fund I-dis ★ ★ ★ 36.0% 10.3% 8.1% n/a 8.4%
Triodos Pioneer Impact Fund KR-cap ★ ★ ★ 28.3% 9.9% 10.0% n/a 12.9%
Triodos Pioneer Impact Fund KR-dis ★ ★ ★ 28.3% 9.9% 10.0% n/a 12.9%
Triodos Pioneer Impact Fund R-cap ★ ★ ★ 34.9% 9.4% 7.3% 7.6% 4.7%
Triodos Pioneer Impact Fund R-dis ★ ★ ★ ★ 34.9% 9.4% n/a n/a 7.2%
Triodos Pioneer Impact Fund Z-cap ★ ★ ★ 35.9% 10.2% 8.1% 8.1% 5.1%2
Benchmark: MSCI Small & Mid Cap Index 3 29.3% 8.2% 9.7% 12.8% 7.4%
1 The inception dates can differ between share classes.2 The Z-share class and the I-share class have a limited history. Returns prior to the launch of these share classes are based on the
returns of the comparable R-share class.3 Excluding costs. Benchmark applicable per April 1, 2018. Before April 1, 2018 a compounded benchmark was used.n/a: not applicable
The information stated in the report is historical and is not representative of future results.
26
Risk management
The sub-funds of Triodos SICAV I and all their investments are exposed to a variety of risks. Each sub-fund is intended for long-term investors who can accept the risks associated with investing primarily in the securities of the type held in that sub-fund. In addition, investors should be aware of the risks associated with the active management techniques that may be employed by the management company. An investment in shares of a sub-fund does not constitute a complete investment programme. Investors may wish to complement an investment in a sub-fund with other types of investments.
Operational risks
Triodos Investment Management aims to maintain adequate control over relevant risks. The management company has therefore established an integral risk management system, which includes the risk management activities for each of the sub-funds of Triodos SICAV I and the risk management framework of the management company. The non-financial risks consist of operational risks and compliance risks. Operational risks are the risks of damage resulting from inadequate or failed internal processes, people and systems or from external events. Compliance risks are the risks related to failure to (timely) comply with laws and regulations. These risks are determined, measured, managed and monitored on an ongoing basis by means of appropriate procedures and reporting methods. For the risk assessment, Triodos Investment Management uses a risk appetite based on the risk appetite on Triodos group level.
The risk control framework was developed on the basis of the ‘three-lines-of-defence’ model. The executive function of the management company, the risk management function and the internal audit function operate independently. The risk management function is functionally and hierarchically separated from the portfolio management function.
Risk management function
Triodos Investment Management has a Risk & Compliance Management application which allows for an integral management of all risk related matters.
It holds our Risk and Control framework, our internal Control Testing and the outcomes thereof, our procedures regarding Risk Event Management, as well as the outcomes of our so-called “Risk and Control Self-Assessments”, including the translation of the outcomes of these sessions into our Risk and Control framework. The application provides an adequate audit trail on all fields mentioned above.
For new co-workers, Triodos Investment Management organizes knowledge sessions and an awareness training.
ISAE 3402
The objective of an ISAE 3402 Assurance Report is to provide assurance about the quality of the control measures related to the services provided. The ISAE 3402 guideline provides two types of reports. An ISAE 3402 type I report provides assurance about the design and the implementation of control measures. An ISAE 3402 type II report does not only provide assurance about the design and implementation of control measures, but also about the operating effectiveness (adequate functioning) of the implemented control measures. These reports are issued by an external auditor.
On March 5, 2019, Triodos Investment Management obtained an ISAE 3402 type II report for the period January 1, 2019 until December 31, 2019. During this period, a control measure regarding the timely review of investments made by the Alternative Investment Funds of Triodos Investment Management did not operate effectively. As a result, the auditor issued a qualified opinion related to the non-achievement of two control objectives. These control objectives do not apply to Triodos SICAV I. Triodos Investment Management has taken the necessary steps to perform timely review of the investments of the Alternative Investment Funds, in
27
accordance with the implemented control measures going forward.
Solvency
Triodos Investment Management meets the minimum solvency requirements for asset managers. This makes Triodos Investment Management a solid party that is sufficiently able to absorb setbacks.
COVID-19
Triodos Investment Management considers the COVID-19 Pandemic as a significant event after closing the Annual Accounts 2019. The impact of the pandemic on people, companies and the economy at large cannot be assessed in full depth at this stage. However, for 2020 we are expecting the impact of the COVID-19 pandemic to have a downward effect on the growth of our funds and the overall growth of Triodos Investment Management. The main identified risk for Triodos Investment Management is that a large number of employees or a highly concentrated group of employees become ill simultaneously and cannot perform their duties to the extent that (critical) processes cannot be performed. The management company has made an inventory of the critical processes and persons and has taken appropriate measures, including that employees work from home as much as possible and that (international) travel is prohibited.
As to the impact on our funds, Triodos Investment Management expects that the impact of COVID-19 will be concentrated on the valuations of the investments and the possible outflow of investors. A high level of outflow could lead to illiquidity of some of the funds, though it should be noted that the Impact Equities & Bonds funds maintain sufficient liquidity and currently have no illiquid positions in the portfolio. In general, these funds are well-positioned; a defensive positioning and a cautious asset allocation were already in place.
It should be noted that financial return is not the sole objective of the funds. The impact on people and nature prevails and this objective is often
accompanied by a long-term investment horizon. The management company therefore expects that the potential outflow of shareholders will be relatively limited.
For the above-mentioned reasons, the management company assumes that there is no material uncertainty regarding the continuity of its funds.
Financial risks per sub-fund
Triodos Euro Bond Impact Fund
Triodos Euro Bond Impact Fund primarily invests in euro-denominated corporate bonds, impact bonds, sovereign bonds and sub-sovereign bonds that comply with the sustainable investment strategy described in the general part of the prospectus of Triodos SICAV I (section on “Sustainability assessment”) and offer good investment prospects.
Interest rate riskInterest rate risk is the risk that interest rate changes on the financial markets have a negative impact on the profit and net asset value of the sub-fund. Values of fixed-income securities generally fluctuate in inverse proportion to changes in interest rates and such fluctuations may affect bond prices accordingly. Triodos Euro Bond Impact Fund is exposed to interest rate risk. This risk is reflected by the modified duration of the portfolio, which was 7.3 as at December 31, 2019. The modified duration of the benchmark was 6.7.
Credit default riskCredit default risk is the risk that a debt issuer defaults on its debt obligations towards the sub-fund, and the losses that might be incurred as a result. This risk is mitigated by carefully assessing the credit quality of the obligor when selecting a bond issue and is further limited by refraining from buying bonds below investment grade (BBB). In 2019, no defaults were reported for the portfolio of Triodos Euro Bond Impact Fund. The credit default risk of the sub-fund, measured in terms of the weighted average rating of the portfolio, is AA. The average rating of the benchmark is A.
28
Triodos Global Equities Impact Fund
Triodos Global Equities Impact Fund primarily invests in shares of large-cap companies that are listed on worldwide markets, comply with the sustainable investment strategy described in the general part of the prospectus of Triodos SICAV I (section on “Sustainability Assessment”) and offer good investment prospects.
Equity price riskEquity price risk is the risk that arises from security price volatility, the risk of a decline in the value of a security or a portfolio. Equity price risk can be either systematic or unsystematic risk. The unsystematic equity risk can be mitigated through diversification. The sub-fund avoids large exposures to any single issuer, sector or country. The diversification of the portfolio across these categories is shown on page 61 and further. The sub-funds do not use financial derivatives to hedge against systematic risk.
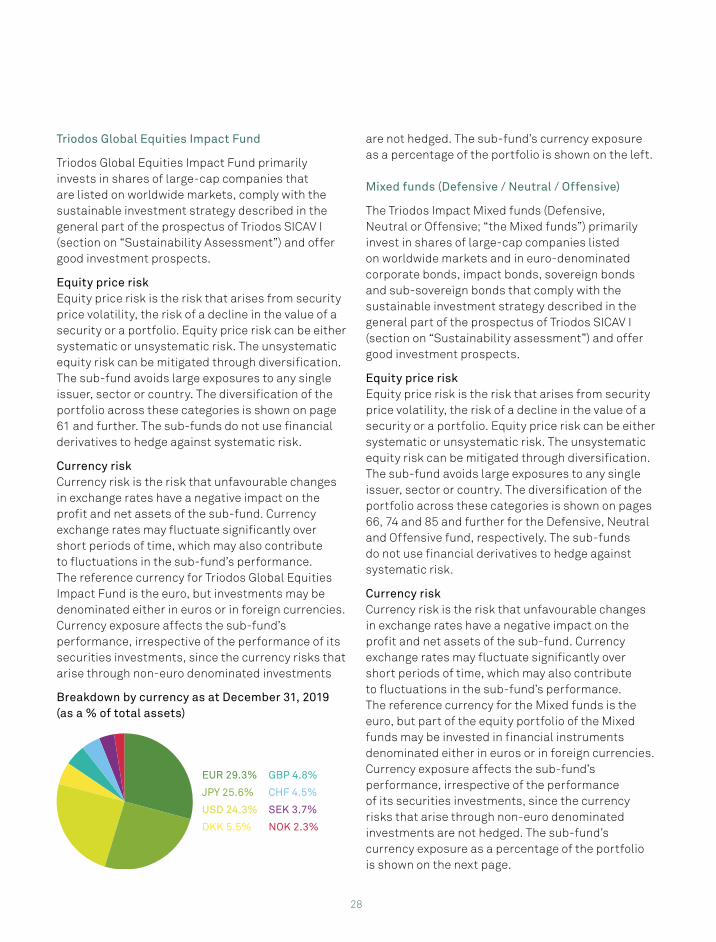
Currency riskCurrency risk is the risk that unfavourable changes in exchange rates have a negative impact on the profit and net assets of the sub-fund. Currency exchange rates may fluctuate significantly over short periods of time, which may also contribute to fluctuations in the sub-fund’s performance. The reference currency for Triodos Global Equities Impact Fund is the euro, but investments may be denominated either in euros or in foreign currencies. Currency exposure affects the sub-fund’s performance, irrespective of the performance of its securities investments, since the currency risks that arise through non-euro denominated investments
are not hedged. The sub-fund’s currency exposure as a percentage of the portfolio is shown on the left.
Mixed funds (Defensive / Neutral / Offensive)
The Triodos Impact Mixed funds (Defensive, Neutral or Offensive; “the Mixed funds”) primarily invest in shares of large-cap companies listed on worldwide markets and in euro-denominated corporate bonds, impact bonds, sovereign bonds and sub-sovereign bonds that comply with the sustainable investment strategy described in the general part of the prospectus of Triodos SICAV I (section on “Sustainability assessment”) and offer good investment prospects.
Equity price riskEquity price risk is the risk that arises from security price volatility, the risk of a decline in the value of a security or a portfolio. Equity price risk can be either systematic or unsystematic risk. The unsystematic equity risk can be mitigated through diversification. The sub-fund avoids large exposures to any single issuer, sector or country. The diversification of the portfolio across these categories is shown on pages 66, 74 and 85 and further for the Defensive, Neutral and Offensive fund, respectively. The sub-funds do not use financial derivatives to hedge against systematic risk.
Currency riskCurrency risk is the risk that unfavourable changes in exchange rates have a negative impact on the profit and net assets of the sub-fund. Currency exchange rates may fluctuate significantly over short periods of time, which may also contribute to fluctuations in the sub-fund’s performance. The reference currency for the Mixed funds is the euro, but part of the equity portfolio of the Mixed funds may be invested in financial instruments denominated either in euros or in foreign currencies. Currency exposure affects the sub-fund’s performance, irrespective of the performance of its securities investments, since the currency risks that arise through non-euro denominated investments are not hedged. The sub-fund’s currency exposure as a percentage of the portfolio is shown on the next page.
Breakdown by currency as at December 31, 2019 (as a % of total assets)
EUR 29.3%
JPY 25.6%
USD 24.3%
DKK 5.5%
GBP 4.8%
CHF 4.5%
SEK 3.7%
NOK 2.3%
29
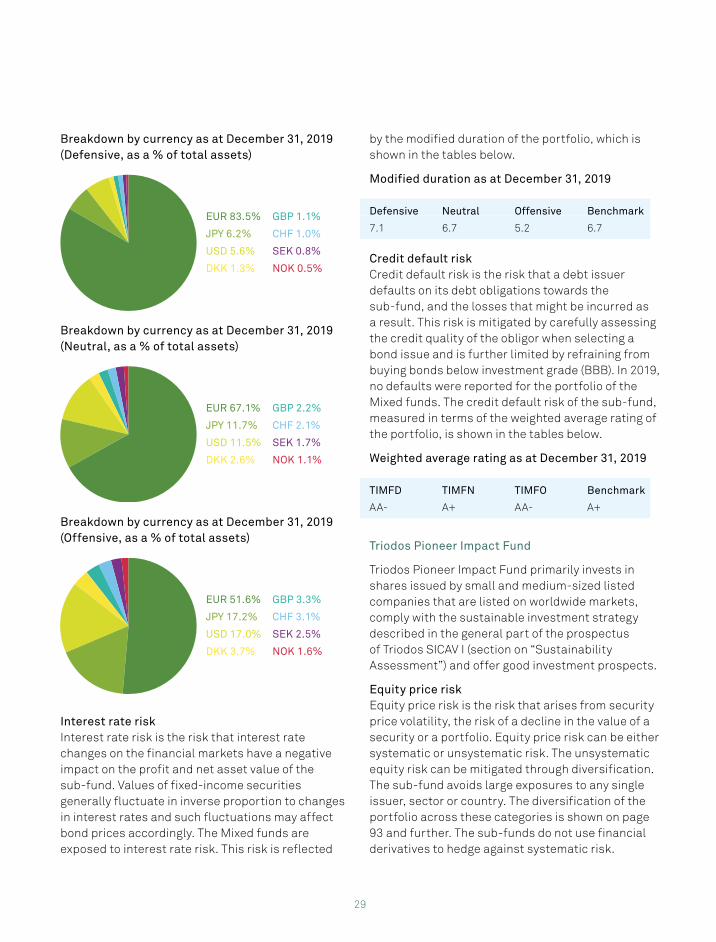
Breakdown by currency as at December 31, 2019 (Defensive, as a % of total assets)
Breakdown by currency as at December 31, 2019 (Neutral, as a % of total assets)
Breakdown by currency as at December 31, 2019 (Offensive, as a % of total assets)
Interest rate riskInterest rate risk is the risk that interest rate changes on the financial markets have a negative impact on the profit and net asset value of the sub-fund. Values of fixed-income securities generally fluctuate in inverse proportion to changes in interest rates and such fluctuations may affect bond prices accordingly. The Mixed funds are exposed to interest rate risk. This risk is reflected
by the modified duration of the portfolio, which is shown in the tables below.
Credit default riskCredit default risk is the risk that a debt issuer defaults on its debt obligations towards the sub-fund, and the losses that might be incurred as a result. This risk is mitigated by carefully assessing the credit quality of the obligor when selecting a bond issue and is further limited by refraining from buying bonds below investment grade (BBB). In 2019, no defaults were reported for the portfolio of the Mixed funds. The credit default risk of the sub-fund, measured in terms of the weighted average rating of the portfolio, is shown in the tables below.
Triodos Pioneer Impact Fund
Triodos Pioneer Impact Fund primarily invests in shares issued by small and medium-sized listed companies that are listed on worldwide markets, comply with the sustainable investment strategy described in the general part of the prospectus of Triodos SICAV I (section on “Sustainability Assessment”) and offer good investment prospects.
Equity price riskEquity price risk is the risk that arises from security price volatility, the risk of a decline in the value of a security or a portfolio. Equity price risk can be either systematic or unsystematic risk. The unsystematic equity risk can be mitigated through diversification. The sub-fund avoids large exposures to any single issuer, sector or country. The diversification of the portfolio across these categories is shown on page 93 and further. The sub-funds do not use financial derivatives to hedge against systematic risk.
EUR 83.5%
JPY 6.2%
USD 5.6%
DKK 1.3%
GBP 1.1%
CHF 1.0%
SEK 0.8%
NOK 0.5%
EUR 67.1%
JPY 11.7%
USD 11.5%
DKK 2.6%
GBP 2.2%
CHF 2.1%
SEK 1.7%
NOK 1.1%
EUR 51.6%
JPY 17.2%
USD 17.0%
DKK 3.7%
GBP 3.3%
CHF 3.1%
SEK 2.5%
NOK 1.6%
Modified duration as at December 31, 2019
Defensive Neutral Offensive Benchmark
7.1 6.7 5.2 6.7
Weighted average rating as at December 31, 2019
TIMFD TIMFN TIMFO Benchmark
AA- A+ AA- A+
30
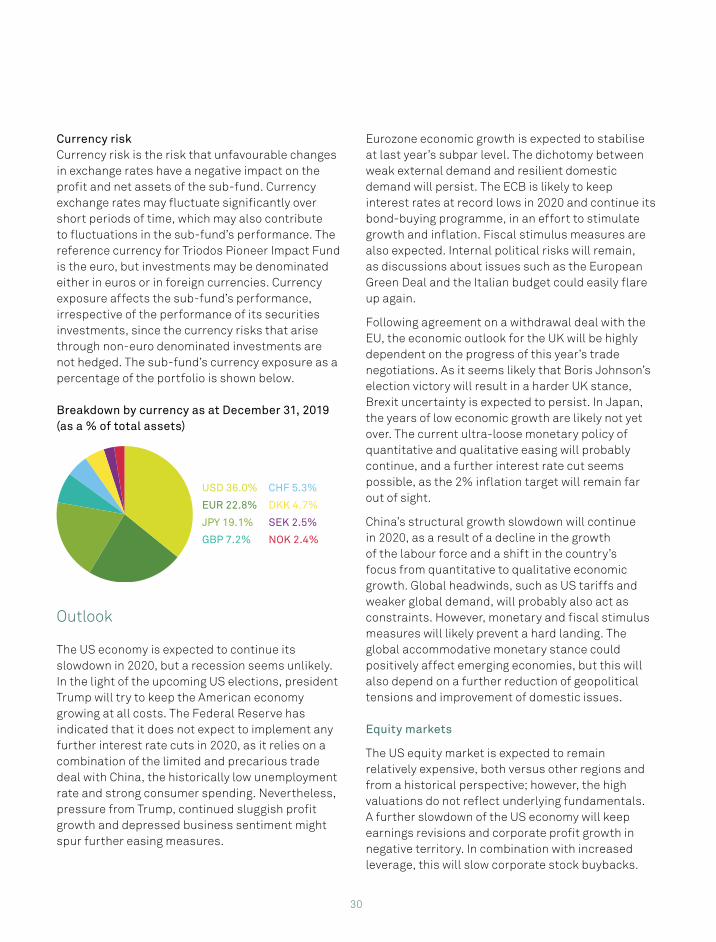
Currency riskCurrency risk is the risk that unfavourable changes in exchange rates have a negative impact on the profit and net assets of the sub-fund. Currency exchange rates may fluctuate significantly over short periods of time, which may also contribute to fluctuations in the sub-fund’s performance. The reference currency for Triodos Pioneer Impact Fund is the euro, but investments may be denominated either in euros or in foreign currencies. Currency exposure affects the sub-fund’s performance, irrespective of the performance of its securities investments, since the currency risks that arise through non-euro denominated investments are not hedged. The sub-fund’s currency exposure as a percentage of the portfolio is shown below.
Breakdown by currency as at December 31, 2019 (as a % of total assets)
USD 36.0%
EUR 22.8%
JPY 19.1%
GBP 7.2%
CHF 5.3%
DKK 4.7%
SEK 2.5%
NOK 2.4%
Outlook
The US economy is expected to continue its slowdown in 2020, but a recession seems unlikely. In the light of the upcoming US elections, president Trump will try to keep the American economy growing at all costs. The Federal Reserve has indicated that it does not expect to implement any further interest rate cuts in 2020, as it relies on a combination of the limited and precarious trade deal with China, the historically low unemployment rate and strong consumer spending. Nevertheless, pressure from Trump, continued sluggish profit growth and depressed business sentiment might spur further easing measures.
Eurozone economic growth is expected to stabilise at last year’s subpar level. The dichotomy between weak external demand and resilient domestic demand will persist. The ECB is likely to keep interest rates at record lows in 2020 and continue its bond-buying programme, in an effort to stimulate growth and inflation. Fiscal stimulus measures are also expected. Internal political risks will remain, as discussions about issues such as the European Green Deal and the Italian budget could easily flare up again.
Following agreement on a withdrawal deal with the EU, the economic outlook for the UK will be highly dependent on the progress of this year’s trade negotiations. As it seems likely that Boris Johnson’s election victory will result in a harder UK stance, Brexit uncertainty is expected to persist. In Japan, the years of low economic growth are likely not yet over. The current ultra-loose monetary policy of quantitative and qualitative easing will probably continue, and a further interest rate cut seems possible, as the 2% inflation target will remain far out of sight.
China’s structural growth slowdown will continue in 2020, as a result of a decline in the growth of the labour force and a shift in the country’s focus from quantitative to qualitative economic growth. Global headwinds, such as US tariffs and weaker global demand, will probably also act as constraints. However, monetary and fiscal stimulus measures will likely prevent a hard landing. The global accommodative monetary stance could positively affect emerging economies, but this will also depend on a further reduction of geopolitical tensions and improvement of domestic issues.
Equity markets
The US equity market is expected to remain relatively expensive, both versus other regions and from a historical perspective; however, the high valuations do not reflect underlying fundamentals. A further slowdown of the US economy will keep earnings revisions and corporate profit growth in negative territory. In combination with increased leverage, this will slow corporate stock buybacks.
31
Therefore, a continuation of the upward trend in US equity markets is mainly conditional on additional easing by the Federal Reserve. Since the Fed wants to keep rates unchanged in 2020, there seems to be little upward potential.
European equities will remain relatively cheap compared to their US counterparts. If the slowdown of eurozone economic growth bottoms out, European equities could benefit from accommodative monetary and fiscal policies. Japanese equities will also remain relatively cheap compared to their US and European counterparts. In combination with an accommodative Bank of Japan, this make Japanese equities appear to be the most attractive.
Bond markets
The ECB is expected to maintain its loose monetary stance in 2020, keeping European capital market rates low for longer. Geopolitical uncertainties will occasionally add to the appetite for safe-haven investments. However, a further de-escalation of some major global risks, such as Brexit and the US-China trade war, may reduce the likelihood of a further decline of interest rates. Overall, there is enough reason to maintain a neutral position in bonds.
Although a prolonged economic growth stagnation would normally increase the default risk and thereby widen credit spreads, it seems that the current investor landscape focuses predominantly on central bank measures. This means that the 2020 outlook of low interest rates and central bank bond purchases would imply a continued search for yield that leads to a further drop in corporate bond yields. Although the increase in central bank liquidity makes defaults less likely, high-quality credits with strong balance sheets are preferred in a low-growth environment.
COVID-19
The Risk management section refers to the impact of COVID-19 on Triodos Investment Management and its funds. Since the situation and the impact of COVID-19 may differ per day, the actual impact
that COVID-19 may have on the fund is difficult to predict and cannot be foreseen. At this point in time, the impact on the fund - and more specifically the fund’s operations - is assumed to be limited.
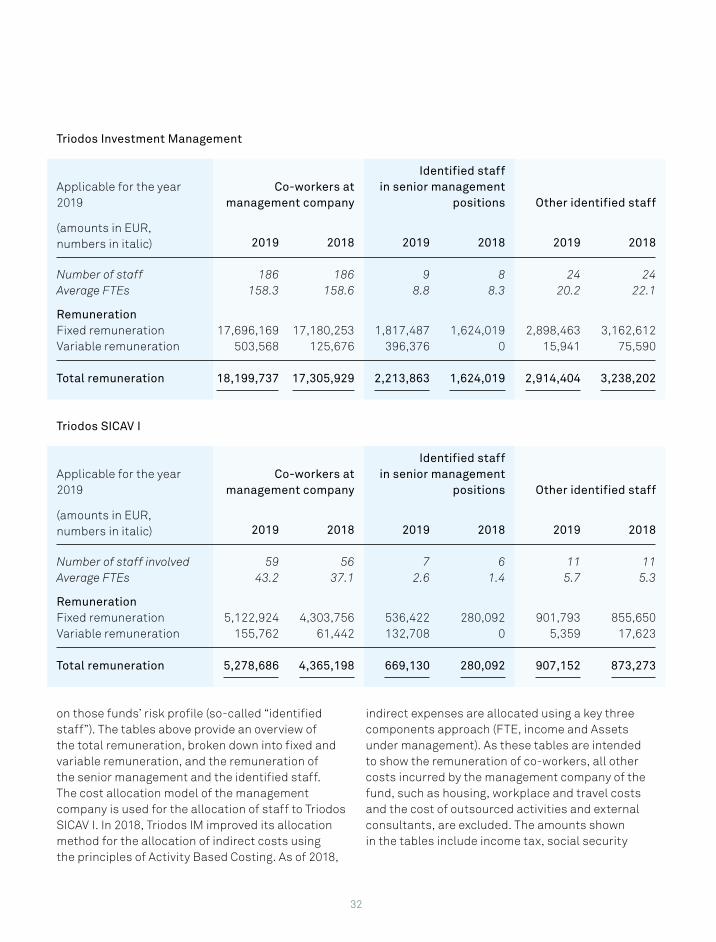
Remuneration policy
Triodos Bank and Triodos Investment Management believe good and appropriate remuneration for all its co-workers is very important. The core elements of the international remuneration policy of Triodos Bank are set out in the Principles of Fund Governance, which can be accessed via www.triodos-im.com. The wage system used by Triodos Bank and as per January 1, 2019 also used by Triodos Investment Management does not include bonuses or share option schemes. Financial incentives are considered an inappropriate way to motivate and reward co-workers. Variable remuneration is therefore limited. The Management Board of Triodos Investment Management annually assesses the remuneration policy. Identified staff include all co-workers who may influence the risk profile of the sub-funds. Besides the members of the Management Board of Triodos Investment Management, these include the fund manager and the managers of support departments.
In 2019, the total remuneration of the 186 co-workers working for Triodos Investment Management amounted to EUR 18,199,737 (2018: 186 co-workers, EUR 17,305,929). The increase in remuneration of 2019 versus 2018 can entirely be explained by a combination of a yearly increase in wages, a CLA impact and an increase in variable remuneration. The increase in variable remuneration is mainly caused by an increase in the number of one-off payments to leaving co-workers due to the termination of specific activities by the management company in 2019, and does not concern an increase in bonuses or distributions of profits.
Management companies of UCITS funds are required to at least disclose information about their remuneration practices for employees whose professional activities have a material impact
32
on those funds’ risk profile (so-called “identified staff”). The tables above provide an overview of the total remuneration, broken down into fixed and variable remuneration, and the remuneration of the senior management and the identified staff. The cost allocation model of the management company is used for the allocation of staff to Triodos SICAV I. In 2018, Triodos IM improved its allocation method for the allocation of indirect costs using the principles of Activity Based Costing. As of 2018,
indirect expenses are allocated using a key three components approach (FTE, income and Assets under management). As these tables are intended to show the remuneration of co-workers, all other costs incurred by the management company of the fund, such as housing, workplace and travel costs and the cost of outsourced activities and external consultants, are excluded. The amounts shown in the tables include income tax, social security
Triodos Investment Management
Applicable for the year 2019
Co-workers at management company
Identified staff in senior management
positions Other identified staff (amounts in EUR, numbers in italic) 2019 2018 2019 2018 2019 2018
Number of staff 186 186 9 8 24 24Average FTEs 158.3 158.6 8.8 8.3 20.2 22.1
Remuneration Fixed remuneration 17,696,169 17,180,253 1,817,487 1,624,019 2,898,463 3,162,612Variable remuneration 503,568 125,676 396,376 0 15,941 75,590 Total remuneration 18,199,737 17,305,929 2,213,863 1,624,019 2,914,404 3,238,202
Triodos SICAV I
Applicable for the year 2019
Co-workers at management company
Identified staff in senior management
positions Other identified staff (amounts in EUR, numbers in italic) 2019 2018 2019 2018 2019 2018
Number of staff involved 59 56 7 6 11 11Average FTEs 43.2 37.1 2.6 1.4 5.7 5.3
Remuneration Fixed remuneration 5,122,924 4,303,756 536,422 280,092 901,793 855,650Variable remuneration 155,762 61,442 132,708 0 5,359 17,623 Total remuneration 5,278,686 4,365,198 669,130 280,092 907,152 873,273
33
contributions, pension contributions and tokens of appreciation.
Triodos Investment Management may provide additional individual bonuses to co-workers up to a maximum of one month's salary. These so-called tokens of appreciation are for extraordinary achievements and are at the discretion of management in consultation with Human Resources. Such a token is not based on pre-set targets and is always offered in retrospect. An annual collective token of appreciation may be paid for the overall achievements and contribution of all co-workers. This very modest amount is the same for all co-workers, with a maximum of EUR 500 per co-worker. This amount may be paid in cash or in Triodos Bank NV depository receipts. In 2019 and 2018, no collective end-of-year token of appreciation was awarded. In 2018 and 2019, there are no co-workers at Triodos Investment Management with a total remuneration of EUR 1 million or more. Triodos SICAV I does not have any co-workers.
34
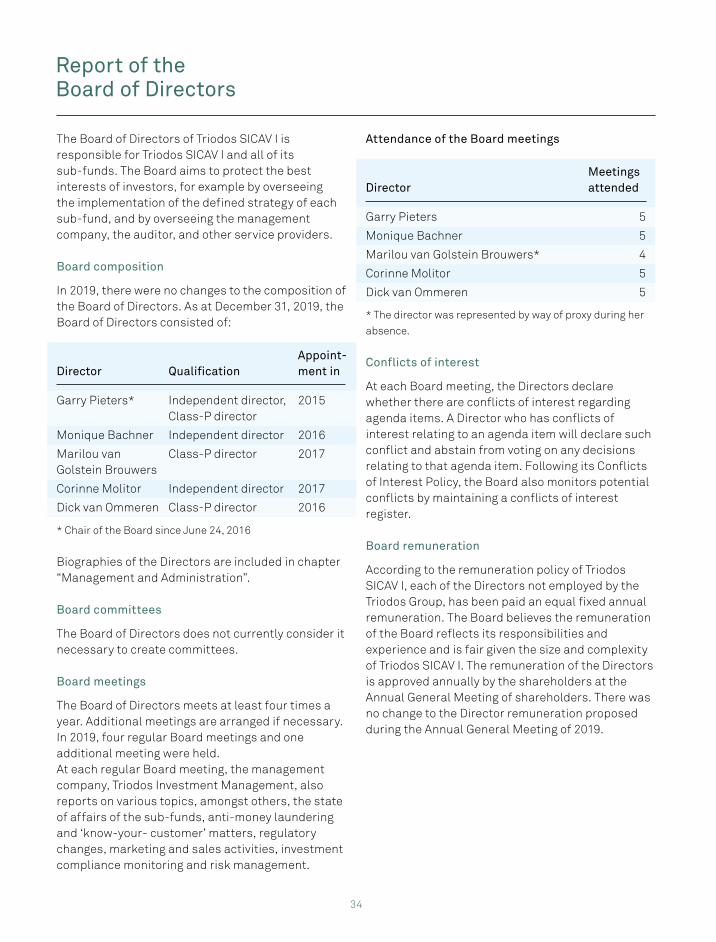
The Board of Directors of Triodos SICAV I is responsible for Triodos SICAV I and all of its sub-funds. The Board aims to protect the best interests of investors, for example by overseeing the implementation of the defined strategy of each sub-fund, and by overseeing the management company, the auditor, and other service providers.
Board composition
In 2019, there were no changes to the composition of the Board of Directors. As at December 31, 2019, the Board of Directors consisted of:
Director QualificationAppoint-ment in
Garry Pieters* Independent director, Class-P director
2015
Monique Bachner Independent director 2016
Marilou van Golstein Brouwers
Class-P director 2017
Corinne Molitor Independent director 2017
Dick van Ommeren Class-P director 2016
* Chair of the Board since June 24, 2016
Biographies of the Directors are included in chapter “Management and Administration”.
Board committees
The Board of Directors does not currently consider it necessary to create committees.
Board meetings
The Board of Directors meets at least four times a year. Additional meetings are arranged if necessary. In 2019, four regular Board meetings and one additional meeting were held.At each regular Board meeting, the management company, Triodos Investment Management, also reports on various topics, amongst others, the state of affairs of the sub-funds, anti-money laundering and ‘know-your- customer’ matters, regulatory changes, marketing and sales activities, investment compliance monitoring and risk management.
Report of the Board of Directors
Attendance of the Board meetings
DirectorMeetings attended
Garry Pieters 5
Monique Bachner 5
Marilou van Golstein Brouwers* 4
Corinne Molitor 5
Dick van Ommeren 5
* The director was represented by way of proxy during her
absence.
Conflicts of interest
At each Board meeting, the Directors declare whether there are conflicts of interest regarding agenda items. A Director who has conflicts of interest relating to an agenda item will declare such conflict and abstain from voting on any decisions relating to that agenda item. Following its Conflicts of Interest Policy, the Board also monitors potential conflicts by maintaining a conflicts of interest register.
Board remuneration
According to the remuneration policy of Triodos SICAV I, each of the Directors not employed by the Triodos Group, has been paid an equal fixed annual remuneration. The Board believes the remuneration of the Board reflects its responsibilities and experience and is fair given the size and complexity of Triodos SICAV I. The remuneration of the Directors is approved annually by the shareholders at the Annual General Meeting of shareholders. There was no change to the Director remuneration proposed during the Annual General Meeting of 2019.
35
Annual General Meeting of shareholders
The Annual General Meeting of shareholders was held in Luxembourg on April 24, 2019. During the meeting, the shareholders:• received the management report of the Board
of Directors and the report of the auditor for the financial year ended December 31, 2018;
• approved the audited financial statements for the financial year ended December 31, 2018;
• approved the allocation of the net results for the financial year ended December 31, 2018;
• granted full discharge to the members of the Board of Directors with respect to their performance of duties for all or part of the financial year ended December 31, 2018;
• re-elected the auditor, PricewaterhouseCoopers, to serve for the financial year 2019; and
• approved the remuneration of Directors for the financial year ending December 31, 2019.
No other meetings of shareholders were held in 2019.
Complaints handling policy
Triodos SICAV I has a complaints handling policy to ensure proper handling of complaints as and when they may arise. Triodos SICAV I has appointed a Complaints Handling Officer, who is responsible for implementation of the complaints handling policy.
The complaints handling policy is available upon request and available on www.triodos-im.com. During 2019, the Complaints Handling Officer did not receive any complaints relating to Triodos SICAV I.
Complaints can be submitted in writing to:Triodos SICAV IAttention: Complaints Handling Officer11-13, Boulevard de la FoireL-1528 LuxembourgGrand-Duché de LuxembourgE-mail address: [email protected]
Best practices
The Board of Directors aspires to best practices and good governance. For example, the Board has made efforts to ensure the diversity of its members, in terms of gender, complementary experience and expertise, and a good representation of independent Directors. The Board of Directors conducts periodic self-assessments in which it reflects on its performance and strategy.
The Board of Directors has adhered to the principles of the ALFI Code of Conduct and monitors its application.
Luxembourg, 26 March 2020
The Board of Directors of Triodos SICAV I
Garry Pieters (Chair)Monique BachnerMarilou van Golstein Brouwers (until February 1, 2020)Corinne MolitorDick van Ommeren

36
Statement of net assets Combined 37Triodos Euro Bond Impact Fund 38Triodos Global Equities Impact Fund 39Triodos Impact Mixed Fund - Defensive 40Triodos Impact Mixed Fund - Neutral 41Triodos Impact Mixed Fund - Offensive 42Triodos Pioneer Impact Fund 43
Statement of Operations and Changes in Net AssetsCombined 44Triodos Euro Bond Impact Fund 45Triodos Global Equities Impact Fund 46Triodos Impact Mixed Fund - Defensive 47Triodos Impact Mixed Fund - Neutral 48Triodos Impact Mixed Fund - Offensive 49Triodos Pioneer Impact Fund 50
Triodos Euro Bond Impact FundChanges in the Number of Shares 51Statement of Investments 53Geographical and Economic Investment Portfolio Breakdown 58
Triodos Global Equities Impact FundChanges in the Number of Shares 59Statement of Investments 61Geographical and Economic Investment Portfolio Breakdown 64
Triodos Impact Mixed Fund - DefensiveChanges in the Number of Shares 65Statement of Investments 66Geographical and Economic Investment Portfolio Breakdown 72
Triodos Impact Mixed Fund - NeutralChanges in the Number of Shares 73Statement of Investments 74Geographical and Economic Investment Portfolio Breakdown 83
Triodos Impact Mixed Fund - OffensiveChanges in the Number of Shares 84Statement of Investments 85Geographical and Economic Investment Portfolio Breakdown 90
Triodos Pioneer Impact FundChanges in the Number of Shares 91Statement of Investments 93Geographical and Economic Investment Portfolio Breakdown 96
Notes to the financial statements 97
Annual accounts 2019Triodos SICAV I Page
37
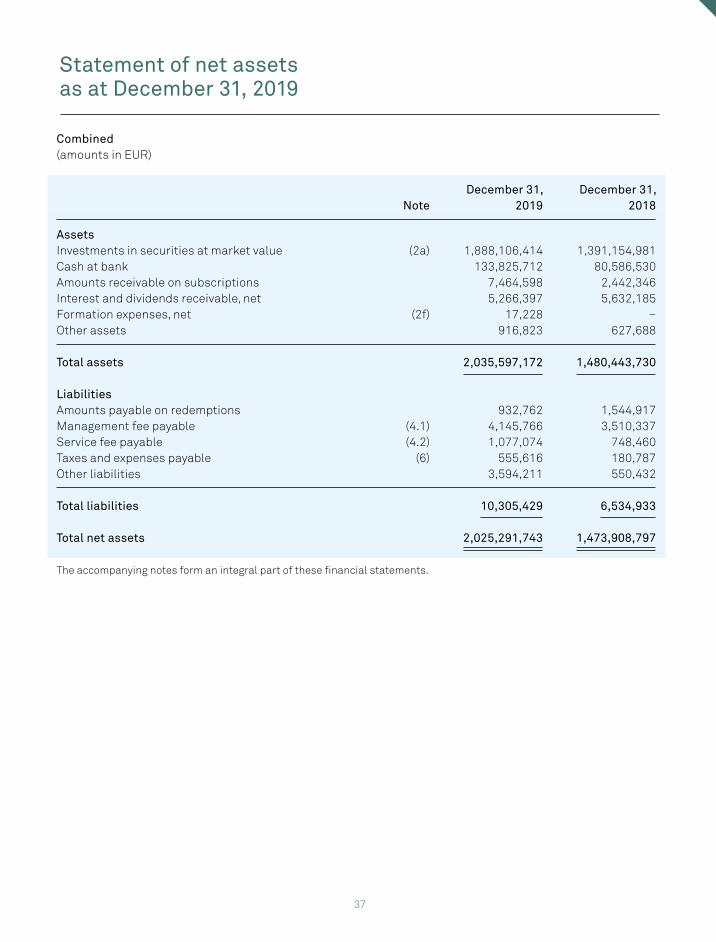
Statement of net assets as at December 31, 2019
Combined(amounts in EUR)
Note
December 31, 2019
December 31, 2018
AssetsInvestments in securities at market value (2a) 1,888,106,414 1,391,154,981Cash at bank 133,825,712 80,586,530Amounts receivable on subscriptions 7,464,598 2,442,346Interest and dividends receivable, net 5,266,397 5,632,185Formation expenses, net (2f) 17,228 –Other assets 916,823 627,688
Total assets 2,035,597,172 1,480,443,730
LiabilitiesAmounts payable on redemptions 932,762 1,544,917Management fee payable (4.1) 4,145,766 3,510,337Service fee payable (4.2) 1,077,074 748,460Taxes and expenses payable (6) 555,616 180,787Other liabilities 3,594,211 550,432
Total liabilities 10,305,429 6,534,933
Total net assets 2,025,291,743 1,473,908,797
The accompanying notes form an integral part of these financial statements.
38
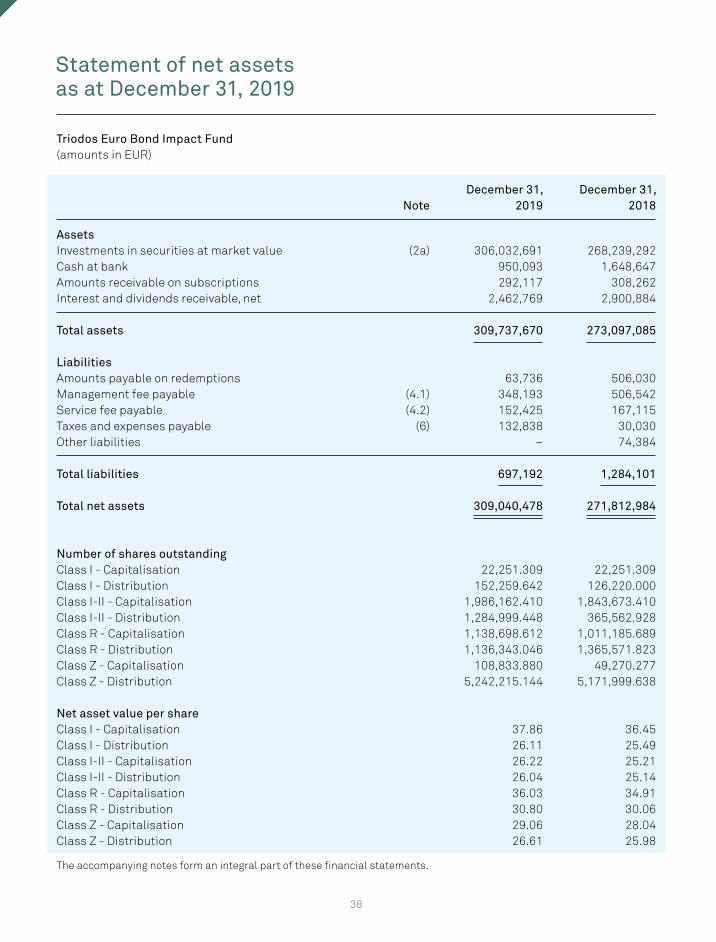
Statement of net assets as at December 31, 2019
Triodos Euro Bond Impact Fund(amounts in EUR)
NoteDecember 31,
2019December 31,
2018
AssetsInvestments in securities at market value (2a) 306,032,691 268,239,292Cash at bank 950,093 1,648,647Amounts receivable on subscriptions 292,117 308,262Interest and dividends receivable, net 2,462,769 2,900,884
Total assets 309,737,670 273,097,085
LiabilitiesAmounts payable on redemptions 63,736 506,030Management fee payable (4.1) 348,193 506,542Service fee payable (4.2) 152,425 167,115Taxes and expenses payable (6) 132,838 30,030Other liabilities – 74,384
Total liabilities 697,192 1,284,101
Total net assets 309,040,478 271,812,984
Number of shares outstandingClass I - Capitalisation 22,251.309 22,251.309Class I - Distribution 152,259.642 126,220.000Class I-II - Capitalisation 1,986,162.410 1,843,673.410Class I-II - Distribution 1,284,999.448 365,562.928Class R - Capitalisation 1,138,698.612 1,011,185.689Class R - Distribution 1,136,343.046 1,365,571.823Class Z - Capitalisation 108,833.880 49,270.277Class Z - Distribution 5,242,215.144 5,171,999.638
Net asset value per shareClass I - Capitalisation 37.86 36.45Class I - Distribution 26.11 25.49Class I-II - Capitalisation 26.22 25.21Class I-II - Distribution 26.04 25.14Class R - Capitalisation 36.03 34.91Class R - Distribution 30.80 30.06Class Z - Capitalisation 29.06 28.04Class Z - Distribution 26.61 25.98
The accompanying notes form an integral part of these financial statements.
39
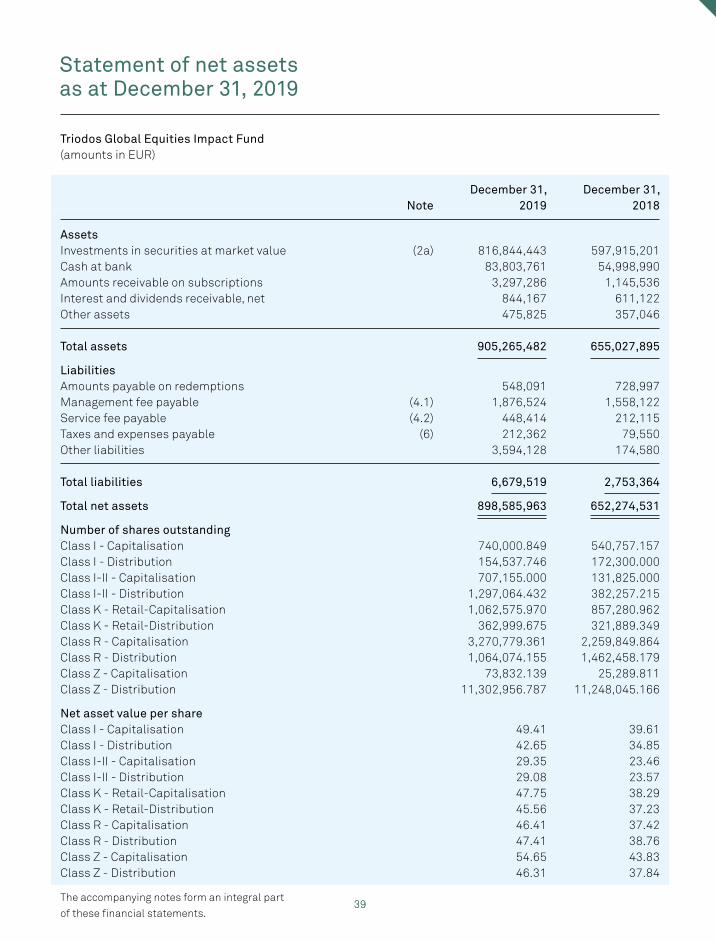
Statement of net assets as at December 31, 2019
Triodos Global Equities Impact Fund(amounts in EUR)
NoteDecember 31,
2019December 31,
2018
AssetsInvestments in securities at market value (2a) 816,844,443 597,915,201Cash at bank 83,803,761 54,998,990Amounts receivable on subscriptions 3,297,286 1,145,536Interest and dividends receivable, net 844,167 611,122Other assets 475,825 357,046
Total assets 905,265,482 655,027,895
LiabilitiesAmounts payable on redemptions 548,091 728,997Management fee payable (4.1) 1,876,524 1,558,122Service fee payable (4.2) 448,414 212,115Taxes and expenses payable (6) 212,362 79,550Other liabilities 3,594,128 174,580
Total liabilities 6,679,519 2,753,364
Total net assets 898,585,963 652,274,531
Number of shares outstandingClass I - Capitalisation 740,000.849 540,757.157Class I - Distribution 154,537.746 172,300.000Class I-II - Capitalisation 707,155.000 131,825.000Class I-II - Distribution 1,297,064.432 382,257.215Class K - Retail-Capitalisation 1,062,575.970 857,280.962Class K - Retail-Distribution 362,999.675 321,889.349Class R - Capitalisation 3,270,779.361 2,259,849.864Class R - Distribution 1,064,074.155 1,462,458.179Class Z - Capitalisation 73,832.139 25,289.811Class Z - Distribution 11,302,956.787 11,248,045.166
Net asset value per shareClass I - Capitalisation 49.41 39.61Class I - Distribution 42.65 34.85Class I-II - Capitalisation 29.35 23.46Class I-II - Distribution 29.08 23.57Class K - Retail-Capitalisation 47.75 38.29Class K - Retail-Distribution 45.56 37.23Class R - Capitalisation 46.41 37.42Class R - Distribution 47.41 38.76Class Z - Capitalisation 54.65 43.83Class Z - Distribution 46.31 37.84
The accompanying notes form an integral part
of these financial statements.39
40
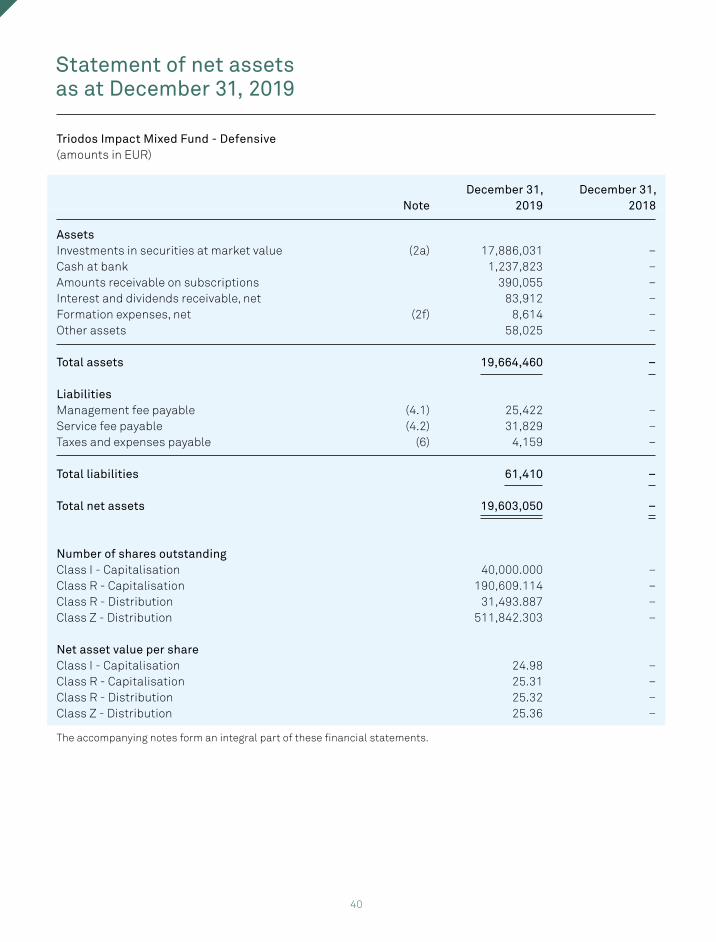
Triodos Impact Mixed Fund - Defensive(amounts in EUR)
NoteDecember 31,
2019December 31,
2018
AssetsInvestments in securities at market value (2a) 17,886,031 –Cash at bank 1,237,823 –Amounts receivable on subscriptions 390,055 –Interest and dividends receivable, net 83,912 –Formation expenses, net (2f) 8,614 –Other assets 58,025 –
Total assets 19,664,460 –
LiabilitiesManagement fee payable (4.1) 25,422 –Service fee payable (4.2) 31,829 –Taxes and expenses payable (6) 4,159 –
Total liabilities 61,410 –
Total net assets 19,603,050 –
Number of shares outstandingClass I - Capitalisation 40,000.000 –Class R - Capitalisation 190,609.114 –Class R - Distribution 31,493.887 –Class Z - Distribution 511,842.303 –
Net asset value per shareClass I - Capitalisation 24.98 –Class R - Capitalisation 25.31 –Class R - Distribution 25.32 –Class Z - Distribution 25.36 –
The accompanying notes form an integral part of these financial statements.
Statement of net assets as at December 31, 2019
41
Triodos Impact Mixed Fund - Neutral(amounts in EUR)
NoteDecember 31,
2019December 31,
2018
AssetsInvestments in securities at market value (2a) 399,520,655 294,808,699Cash at bank 24,844,206 7,598,036Amounts receivable on subscriptions 1,634,184 437,596Interest and dividends receivable, net 1,697,929 1,976,174Other assets 104,410 70,983
Total assets 427,801,384 304,891,488
LiabilitiesAmounts payable on redemptions 200,950 193,526Management fee payable (4.1) 789,015 608,450Service fee payable (4.2) 197,171 192,115Taxes and expenses payable (6) 105,476 39,192Other liabilities – 9,307
Total liabilities 1,292,612 1,042,590
Total net assets 426,508,772 303,848,898
Number of shares outstandingClass I - Capitalisation 730,059.862 220,341.137Class I - Distribution 1.047 1.033Class R - Capitalisation 3,751,076.297 2,851,014.827Class R - Distribution 2,279,070.685 2,113,136.582Class Z - Capitalisation 235,566.206 72,744.915Class Z - Distribution 4,235,165.389 3,719,948.163
Net asset value per shareClass I - Capitalisation 40.01 35.44Class I - Distribution 26.90 24.29Class R - Capitalisation 41.10 36.62Class R - Distribution 39.66 35.70Class Z - Capitalisation 37.30 33.09Class Z - Distribution 33.99 30.59
The accompanying notes form an integral part of these financial statements.
Statement of net assets as at December 31, 2019
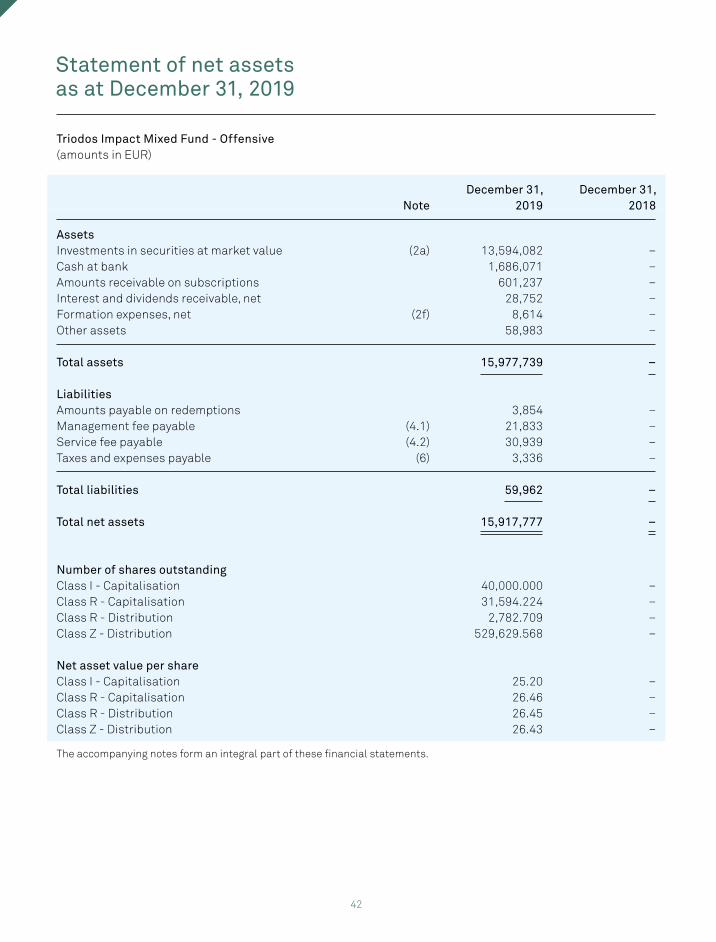
42
Triodos Impact Mixed Fund - Offensive(amounts in EUR)
NoteDecember 31,
2019December 31,
2018
AssetsInvestments in securities at market value (2a) 13,594,082 –Cash at bank 1,686,071 –Amounts receivable on subscriptions 601,237 –Interest and dividends receivable, net 28,752 –Formation expenses, net (2f) 8,614 –Other assets 58,983 –
Total assets 15,977,739 –
LiabilitiesAmounts payable on redemptions 3,854 –Management fee payable (4.1) 21,833 –Service fee payable (4.2) 30,939 –Taxes and expenses payable (6) 3,336 –
Total liabilities 59,962 –
Total net assets 15,917,777 –
Number of shares outstandingClass I - Capitalisation 40,000.000 –Class R - Capitalisation 31,594.224 –Class R - Distribution 2,782.709 –Class Z - Distribution 529,629.568 –
Net asset value per shareClass I - Capitalisation 25.20 –Class R - Capitalisation 26.46 –Class R - Distribution 26.45 –Class Z - Distribution 26.43 –
The accompanying notes form an integral part of these financial statements.
Statement of net assets as at December 31, 2019
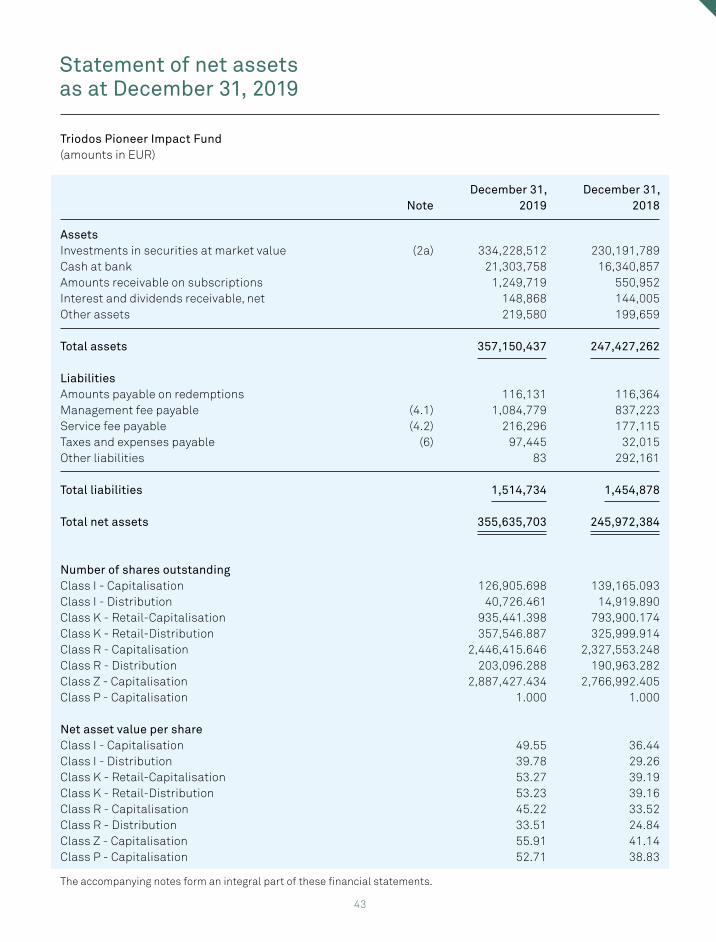
43
Triodos Pioneer Impact Fund(amounts in EUR)
NoteDecember 31,
2019December 31,
2018
AssetsInvestments in securities at market value (2a) 334,228,512 230,191,789Cash at bank 21,303,758 16,340,857Amounts receivable on subscriptions 1,249,719 550,952Interest and dividends receivable, net 148,868 144,005Other assets 219,580 199,659
Total assets 357,150,437 247,427,262
LiabilitiesAmounts payable on redemptions 116,131 116,364Management fee payable (4.1) 1,084,779 837,223Service fee payable (4.2) 216,296 177,115Taxes and expenses payable (6) 97,445 32,015Other liabilities 83 292,161
Total liabilities 1,514,734 1,454,878
Total net assets 355,635,703 245,972,384
Number of shares outstandingClass I - Capitalisation 126,905.698 139,165.093Class I - Distribution 40,726.461 14,919.890Class K - Retail-Capitalisation 935,441.398 793,900.174Class K - Retail-Distribution 357,546.887 325,999.914Class R - Capitalisation 2,446,415.646 2,327,553.248Class R - Distribution 203,096.288 190,963.282Class Z - Capitalisation 2,887,427.434 2,766,992.405Class P - Capitalisation 1.000 1.000
Net asset value per shareClass I - Capitalisation 49.55 36.44Class I - Distribution 39.78 29.26Class K - Retail-Capitalisation 53.27 39.19Class K - Retail-Distribution 53.23 39.16Class R - Capitalisation 45.22 33.52Class R - Distribution 33.51 24.84Class Z - Capitalisation 55.91 41.14Class P - Capitalisation 52.71 38.83
The accompanying notes form an integral part of these financial statements.
Statement of net assets as at December 31, 2019
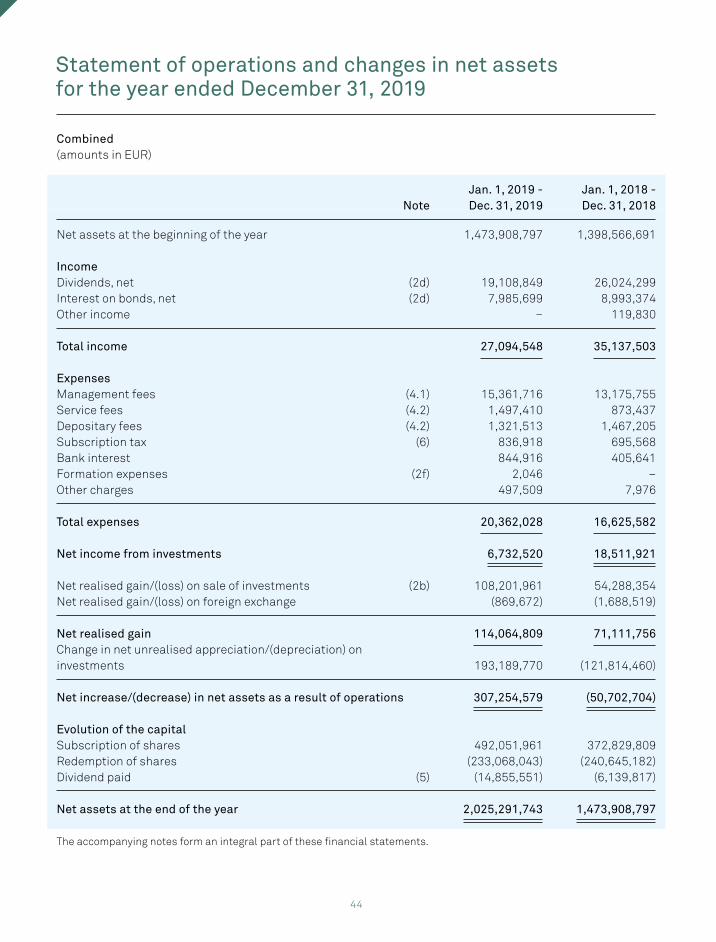
44
Statement of operations and changes in net assets for the year ended December 31, 2019
Combined(amounts in EUR)
Note
Jan. 1, 2019 -Dec. 31, 2019
Jan. 1, 2018 -Dec. 31, 2018
Net assets at the beginning of the year 1,473,908,797 1,398,566,691
IncomeDividends, net (2d) 19,108,849 26,024,299Interest on bonds, net (2d) 7,985,699 8,993,374Other income – 119,830
Total income 27,094,548 35,137,503
ExpensesManagement fees (4.1) 15,361,716 13,175,755Service fees (4.2) 1,497,410 873,437Depositary fees (4.2) 1,321,513 1,467,205Subscription tax (6) 836,918 695,568Bank interest 844,916 405,641Formation expenses (2f) 2,046 –Other charges 497,509 7,976
Total expenses 20,362,028 16,625,582
Net income from investments 6,732,520 18,511,921
Net realised gain/(loss) on sale of investments (2b) 108,201,961 54,288,354Net realised gain/(loss) on foreign exchange (869,672) (1,688,519)
Net realised gain 114,064,809 71,111,756Change in net unrealised appreciation/(depreciation) on investments 193,189,770 (121,814,460)
Net increase/(decrease) in net assets as a result of operations 307,254,579 (50,702,704)
Evolution of the capitalSubscription of shares 492,051,961 372,829,809Redemption of shares (233,068,043) (240,645,182)Dividend paid (5) (14,855,551) (6,139,817)
Net assets at the end of the year 2,025,291,743 1,473,908,797
The accompanying notes form an integral part of these financial statements.
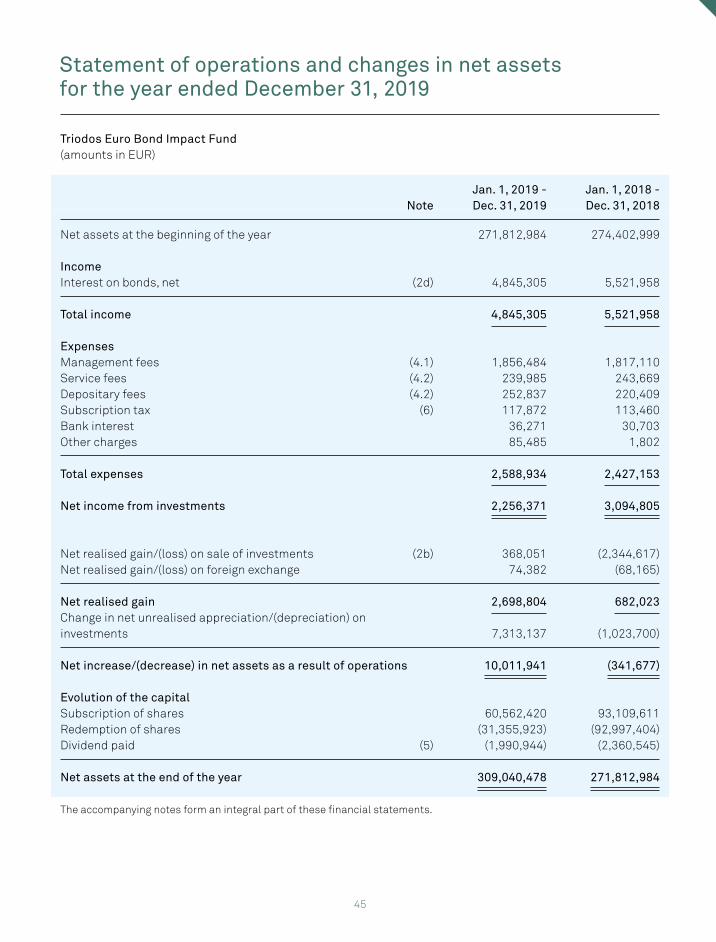
45
Statement of operations and changes in net assets for the year ended December 31, 2019
Triodos Euro Bond Impact Fund(amounts in EUR)
Note
Jan. 1, 2019 -Dec. 31, 2019
Jan. 1, 2018 -Dec. 31, 2018
Net assets at the beginning of the year 271,812,984 274,402,999
IncomeInterest on bonds, net (2d) 4,845,305 5,521,958
Total income 4,845,305 5,521,958
ExpensesManagement fees (4.1) 1,856,484 1,817,110Service fees (4.2) 239,985 243,669Depositary fees (4.2) 252,837 220,409Subscription tax (6) 117,872 113,460Bank interest 36,271 30,703Other charges 85,485 1,802
Total expenses 2,588,934 2,427,153
Net income from investments 2,256,371 3,094,805
Net realised gain/(loss) on sale of investments (2b) 368,051 (2,344,617)Net realised gain/(loss) on foreign exchange 74,382 (68,165)
Net realised gain 2,698,804 682,023Change in net unrealised appreciation/(depreciation) on investments 7,313,137 (1,023,700)
Net increase/(decrease) in net assets as a result of operations 10,011,941 (341,677)
Evolution of the capitalSubscription of shares 60,562,420 93,109,611Redemption of shares (31,355,923) (92,997,404)Dividend paid (5) (1,990,944) (2,360,545)
Net assets at the end of the year 309,040,478 271,812,984
The accompanying notes form an integral part of these financial statements.
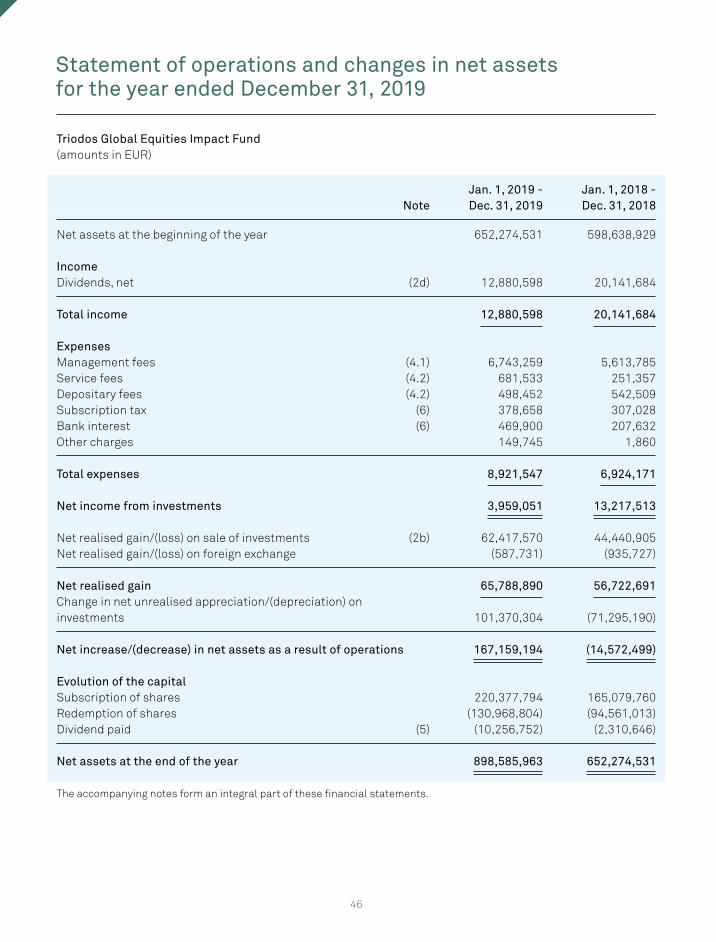
46
Triodos Global Equities Impact Fund(amounts in EUR)
Note
Jan. 1, 2019 -Dec. 31, 2019
Jan. 1, 2018 -Dec. 31, 2018
Net assets at the beginning of the year 652,274,531 598,638,929
IncomeDividends, net (2d) 12,880,598 20,141,684
Total income 12,880,598 20,141,684
ExpensesManagement fees (4.1) 6,743,259 5,613,785Service fees (4.2) 681,533 251,357Depositary fees (4.2) 498,452 542,509Subscription tax (6) 378,658 307,028Bank interest (6) 469,900 207,632Other charges 149,745 1,860
Total expenses 8,921,547 6,924,171
Net income from investments 3,959,051 13,217,513
Net realised gain/(loss) on sale of investments (2b) 62,417,570 44,440,905Net realised gain/(loss) on foreign exchange (587,731) (935,727)
Net realised gain 65,788,890 56,722,691Change in net unrealised appreciation/(depreciation) on investments 101,370,304 (71,295,190)
Net increase/(decrease) in net assets as a result of operations 167,159,194 (14,572,499)
Evolution of the capitalSubscription of shares 220,377,794 165,079,760Redemption of shares (130,968,804) (94,561,013)Dividend paid (5) (10,256,752) (2,310,646)
Net assets at the end of the year 898,585,963 652,274,531
The accompanying notes form an integral part of these financial statements.
Statement of operations and changes in net assets for the year ended December 31, 2019
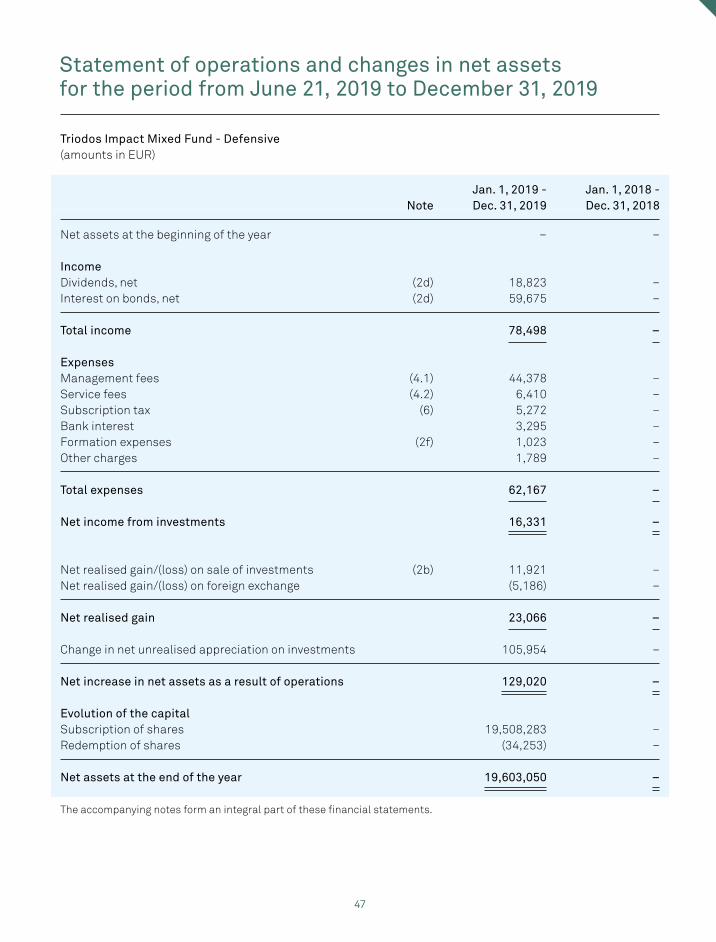
47
Triodos Impact Mixed Fund - Defensive(amounts in EUR)
Note
Jan. 1, 2019 -Dec. 31, 2019
Jan. 1, 2018 -Dec. 31, 2018
Net assets at the beginning of the year – –
IncomeDividends, net (2d) 18,823 –Interest on bonds, net (2d) 59,675 –
Total income 78,498 –
ExpensesManagement fees (4.1) 44,378 –Service fees (4.2) 6,410 –Subscription tax (6) 5,272 –Bank interest 3,295 –Formation expenses (2f) 1,023 –Other charges 1,789 –
Total expenses 62,167 –
Net income from investments 16,331 –
Net realised gain/(loss) on sale of investments (2b) 11,921 –Net realised gain/(loss) on foreign exchange (5,186) –
Net realised gain 23,066 – Change in net unrealised appreciation on investments 105,954 –
Net increase in net assets as a result of operations 129,020 –
Evolution of the capitalSubscription of shares 19,508,283 –Redemption of shares (34,253) –
Net assets at the end of the year 19,603,050 –
The accompanying notes form an integral part of these financial statements.
Statement of operations and changes in net assets for the period from June 21, 2019 to December 31, 2019
47
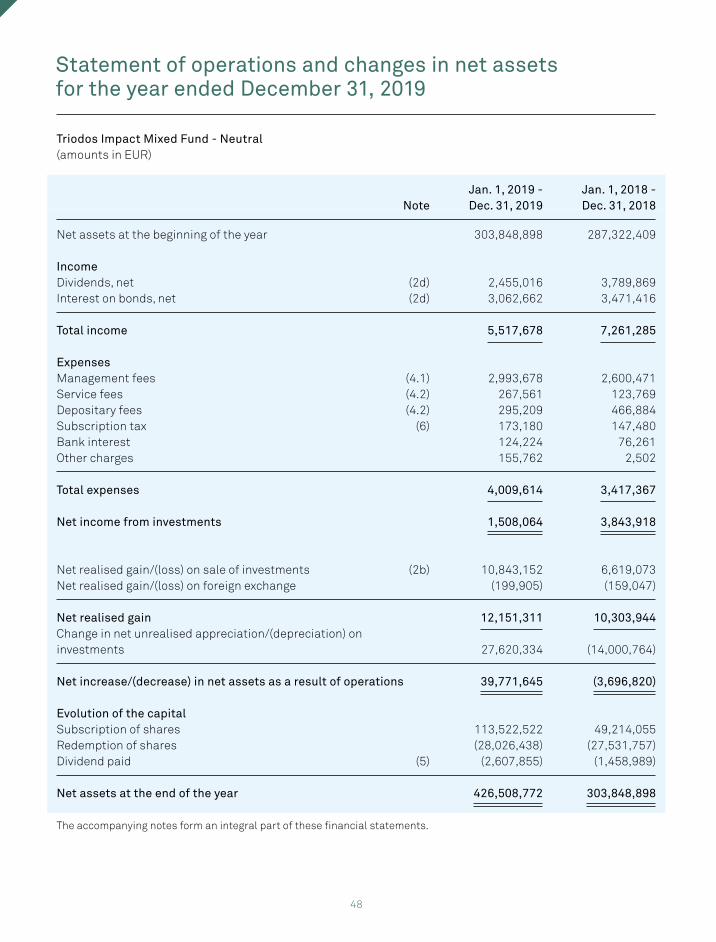
48
Triodos Impact Mixed Fund - Neutral(amounts in EUR)
Note
Jan. 1, 2019 -Dec. 31, 2019
Jan. 1, 2018 -Dec. 31, 2018
Net assets at the beginning of the year 303,848,898 287,322,409
IncomeDividends, net (2d) 2,455,016 3,789,869Interest on bonds, net (2d) 3,062,662 3,471,416
Total income 5,517,678 7,261,285
ExpensesManagement fees (4.1) 2,993,678 2,600,471Service fees (4.2) 267,561 123,769Depositary fees (4.2) 295,209 466,884Subscription tax (6) 173,180 147,480Bank interest 124,224 76,261Other charges 155,762 2,502
Total expenses 4,009,614 3,417,367
Net income from investments 1,508,064 3,843,918
Net realised gain/(loss) on sale of investments (2b) 10,843,152 6,619,073Net realised gain/(loss) on foreign exchange (199,905) (159,047)
Net realised gain 12,151,311 10,303,944Change in net unrealised appreciation/(depreciation) on investments 27,620,334 (14,000,764)
Net increase/(decrease) in net assets as a result of operations 39,771,645 (3,696,820)
Evolution of the capitalSubscription of shares 113,522,522 49,214,055Redemption of shares (28,026,438) (27,531,757)Dividend paid (5) (2,607,855) (1,458,989)
Net assets at the end of the year 426,508,772 303,848,898
The accompanying notes form an integral part of these financial statements.
Statement of operations and changes in net assets for the year ended December 31, 2019
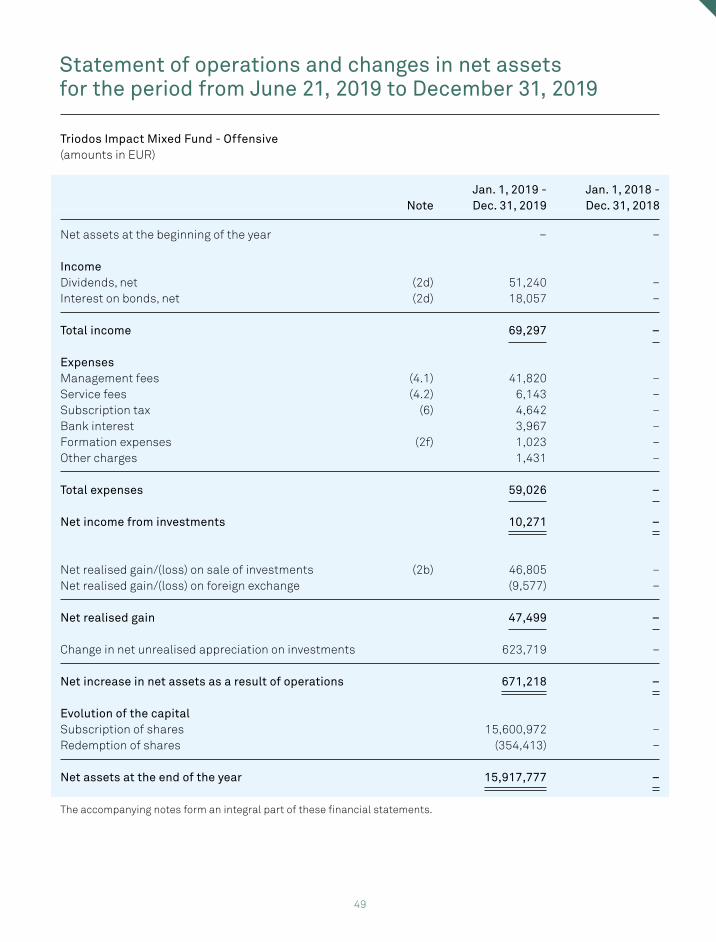
49
Triodos Impact Mixed Fund - Offensive(amounts in EUR)
Note
Jan. 1, 2019 -Dec. 31, 2019
Jan. 1, 2018 -Dec. 31, 2018
Net assets at the beginning of the year – –
IncomeDividends, net (2d) 51,240 –Interest on bonds, net (2d) 18,057 –
Total income 69,297 –
ExpensesManagement fees (4.1) 41,820 –Service fees (4.2) 6,143 –Subscription tax (6) 4,642 –Bank interest 3,967 –Formation expenses (2f) 1,023 –Other charges 1,431 –
Total expenses 59,026 –
Net income from investments 10,271 –
Net realised gain/(loss) on sale of investments (2b) 46,805 –Net realised gain/(loss) on foreign exchange (9,577) –
Net realised gain 47,499 – Change in net unrealised appreciation on investments 623,719 –
Net increase in net assets as a result of operations 671,218 –
Evolution of the capitalSubscription of shares 15,600,972 –Redemption of shares (354,413) –
Net assets at the end of the year 15,917,777 –
The accompanying notes form an integral part of these financial statements.
Statement of operations and changes in net assets for the period from June 21, 2019 to December 31, 2019
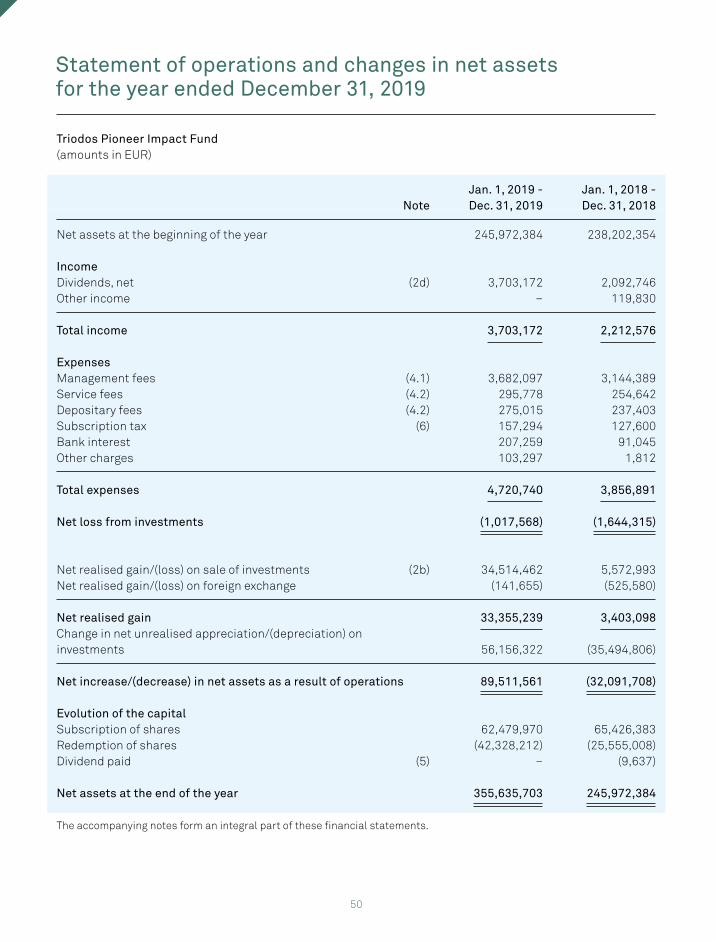
50
Triodos Pioneer Impact Fund(amounts in EUR)
Note
Jan. 1, 2019 -Dec. 31, 2019
Jan. 1, 2018 -Dec. 31, 2018
Net assets at the beginning of the year 245,972,384 238,202,354
IncomeDividends, net (2d) 3,703,172 2,092,746Other income – 119,830
Total income 3,703,172 2,212,576
ExpensesManagement fees (4.1) 3,682,097 3,144,389Service fees (4.2) 295,778 254,642Depositary fees (4.2) 275,015 237,403Subscription tax (6) 157,294 127,600Bank interest 207,259 91,045Other charges 103,297 1,812
Total expenses 4,720,740 3,856,891
Net loss from investments (1,017,568) (1,644,315)
Net realised gain/(loss) on sale of investments (2b) 34,514,462 5,572,993Net realised gain/(loss) on foreign exchange (141,655) (525,580)
Net realised gain 33,355,239 3,403,098Change in net unrealised appreciation/(depreciation) on investments 56,156,322 (35,494,806)
Net increase/(decrease) in net assets as a result of operations 89,511,561 (32,091,708)
Evolution of the capitalSubscription of shares 62,479,970 65,426,383Redemption of shares (42,328,212) (25,555,008)Dividend paid (5) – (9,637)
Net assets at the end of the year 355,635,703 245,972,384
The accompanying notes form an integral part of these financial statements.
Statement of operations and changes in net assets for the year ended December 31, 2019
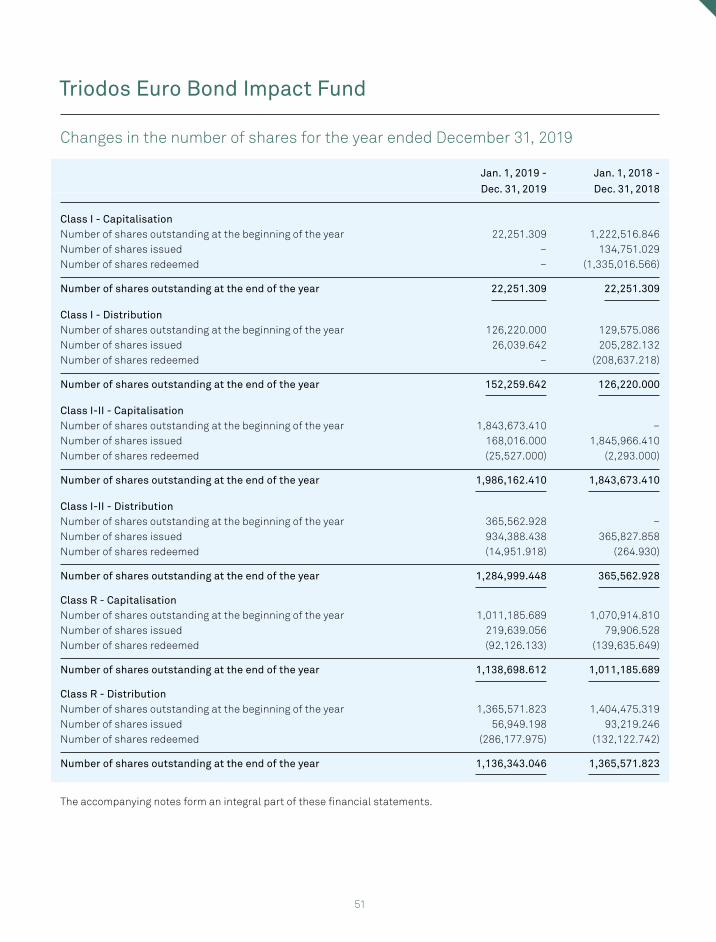
51
Triodos Euro Bond Impact Fund
Changes in the number of shares for the year ended December 31, 2019
Jan. 1, 2019 -
Dec. 31, 2019
Jan. 1, 2018 -
Dec. 31, 2018
Class I - CapitalisationNumber of shares outstanding at the beginning of the year 22,251.309 1,222,516.846Number of shares issued – 134,751.029Number of shares redeemed – (1,335,016.566)
Number of shares outstanding at the end of the year 22,251.309 22,251.309
Class I - DistributionNumber of shares outstanding at the beginning of the year 126,220.000 129,575.086Number of shares issued 26,039.642 205,282.132Number of shares redeemed – (208,637.218)
Number of shares outstanding at the end of the year 152,259.642 126,220.000
Class I-II - CapitalisationNumber of shares outstanding at the beginning of the year 1,843,673.410 –Number of shares issued 168,016.000 1,845,966.410Number of shares redeemed (25,527.000) (2,293.000)
Number of shares outstanding at the end of the year 1,986,162.410 1,843,673.410
Class I-II - DistributionNumber of shares outstanding at the beginning of the year 365,562.928 –Number of shares issued 934,388.438 365,827.858Number of shares redeemed (14,951.918) (264.930)
Number of shares outstanding at the end of the year 1,284,999.448 365,562.928
Class R - CapitalisationNumber of shares outstanding at the beginning of the year 1,011,185.689 1,070,914.810Number of shares issued 219,639.056 79,906.528Number of shares redeemed (92,126.133) (139,635.649)
Number of shares outstanding at the end of the year 1,138,698.612 1,011,185.689
Class R - DistributionNumber of shares outstanding at the beginning of the year 1,365,571.823 1,404,475.319Number of shares issued 56,949.198 93,219.246Number of shares redeemed (286,177.975) (132,122.742)
Number of shares outstanding at the end of the year 1,136,343.046 1,365,571.823
The accompanying notes form an integral part of these financial statements.
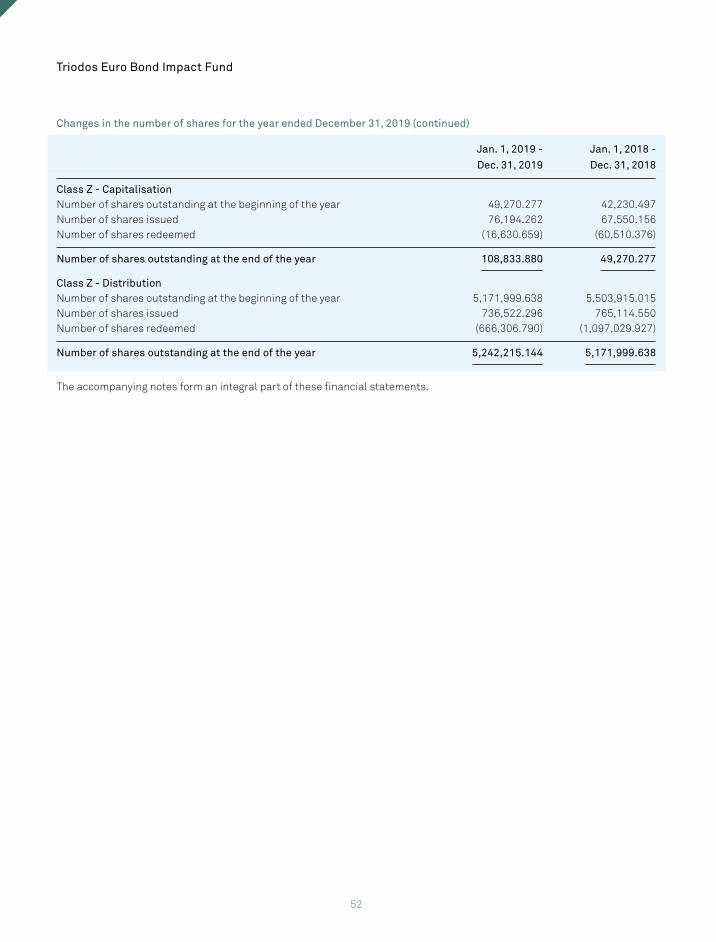
52
Triodos Euro Bond Impact Fund
Jan. 1, 2019 -
Dec. 31, 2019
Jan. 1, 2018 -
Dec. 31, 2018
Class Z - CapitalisationNumber of shares outstanding at the beginning of the year 49,270.277 42,230.497Number of shares issued 76,194.262 67,550.156Number of shares redeemed (16,630.659) (60,510.376)
Number of shares outstanding at the end of the year 108,833.880 49,270.277
Class Z - DistributionNumber of shares outstanding at the beginning of the year 5,171,999.638 5,503,915.015Number of shares issued 736,522.296 765,114.550Number of shares redeemed (666,306.790) (1,097,029.927)
Number of shares outstanding at the end of the year 5,242,215.144 5,171,999.638
The accompanying notes form an integral part of these financial statements.
Changes in the number of shares for the year ended December 31, 2019 (continued)
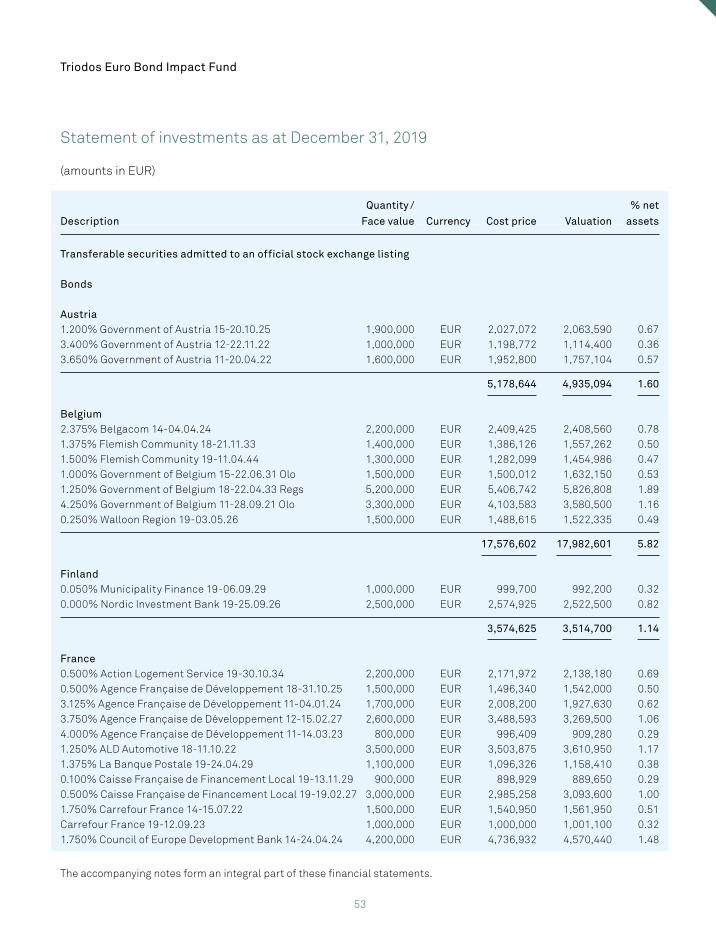
53
Statement of investments as at December 31, 2019
(amounts in EUR)
Description
Quantity /
Face value Currency Cost price Valuation
% net
assets
Transferable securities admitted to an official stock exchange listing
Bonds
Austria1.200% Government of Austria 15-20.10.25 1,900,000 EUR 2,027,072 2,063,590 0.673.400% Government of Austria 12-22.11.22 1,000,000 EUR 1,198,772 1,114,400 0.363.650% Government of Austria 11-20.04.22 1,600,000 EUR 1,952,800 1,757,104 0.57
5,178,644 4,935,094 1.60
Belgium2.375% Belgacom 14-04.04.24 2,200,000 EUR 2,409,425 2,408,560 0.781.375% Flemish Community 18-21.11.33 1,400,000 EUR 1,386,126 1,557,262 0.501.500% Flemish Community 19-11.04.44 1,300,000 EUR 1,282,099 1,454,986 0.471.000% Government of Belgium 15-22.06.31 Olo 1,500,000 EUR 1,500,012 1,632,150 0.531.250% Government of Belgium 18-22.04.33 Regs 5,200,000 EUR 5,406,742 5,826,808 1.894.250% Government of Belgium 11-28.09.21 Olo 3,300,000 EUR 4,103,583 3,580,500 1.160.250% Walloon Region 19-03.05.26 1,500,000 EUR 1,488,615 1,522,335 0.49
17,576,602 17,982,601 5.82
Finland0.050% Municipality Finance 19-06.09.29 1,000,000 EUR 999,700 992,200 0.320.000% Nordic Investment Bank 19-25.09.26 2,500,000 EUR 2,574,925 2,522,500 0.82
3,574,625 3,514,700 1.14
France0.500% Action Logement Service 19-30.10.34 2,200,000 EUR 2,171,972 2,138,180 0.690.500% Agence Française de Développement 18-31.10.25 1,500,000 EUR 1,496,340 1,542,000 0.503.125% Agence Française de Développement 11-04.01.24 1,700,000 EUR 2,008,200 1,927,630 0.623.750% Agence Française de Développement 12-15.02.27 2,600,000 EUR 3,488,593 3,269,500 1.064.000% Agence Française de Développement 11-14.03.23 800,000 EUR 996,409 909,280 0.291.250% ALD Automotive 18-11.10.22 3,500,000 EUR 3,503,875 3,610,950 1.171.375% La Banque Postale 19-24.04.29 1,100,000 EUR 1,096,326 1,158,410 0.380.100% Caisse Française de Financement Local 19-13.11.29 900,000 EUR 898,929 889,650 0.290.500% Caisse Française de Financement Local 19-19.02.27 3,000,000 EUR 2,985,258 3,093,600 1.001.750% Carrefour France 14-15.07.22 1,500,000 EUR 1,540,950 1,561,950 0.51Carrefour France 19-12.09.23 1,000,000 EUR 1,000,000 1,001,100 0.321.750% Council of Europe Development Bank 14-24.04.24 4,200,000 EUR 4,736,932 4,570,440 1.48
Triodos Euro Bond Impact Fund
The accompanying notes form an integral part of these financial statements.
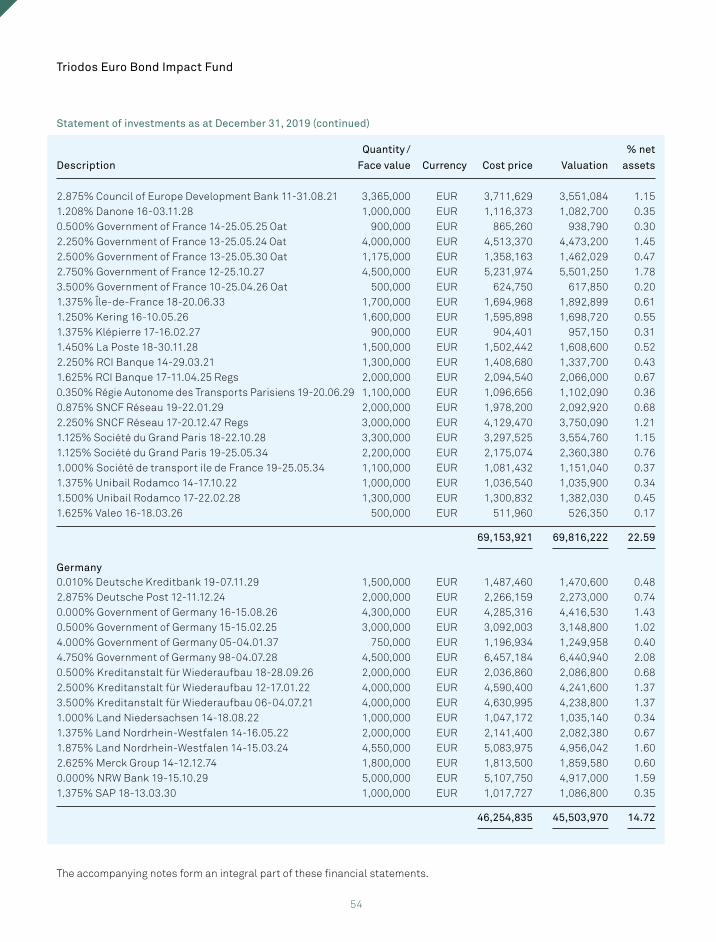
54
Description
Quantity /
Face value Currency Cost price Valuation
% net
assets
2.875% Council of Europe Development Bank 11-31.08.21 3,365,000 EUR 3,711,629 3,551,084 1.151.208% Danone 16-03.11.28 1,000,000 EUR 1,116,373 1,082,700 0.350.500% Government of France 14-25.05.25 Oat 900,000 EUR 865,260 938,790 0.302.250% Government of France 13-25.05.24 Oat 4,000,000 EUR 4,513,370 4,473,200 1.452.500% Government of France 13-25.05.30 Oat 1,175,000 EUR 1,358,163 1,462,029 0.472.750% Government of France 12-25.10.27 4,500,000 EUR 5,231,974 5,501,250 1.783.500% Government of France 10-25.04.26 Oat 500,000 EUR 624,750 617,850 0.201.375% Île-de-France 18-20.06.33 1,700,000 EUR 1,694,968 1,892,899 0.611.250% Kering 16-10.05.26 1,600,000 EUR 1,595,898 1,698,720 0.551.375% Klépierre 17-16.02.27 900,000 EUR 904,401 957,150 0.311.450% La Poste 18-30.11.28 1,500,000 EUR 1,502,442 1,608,600 0.522.250% RCI Banque 14-29.03.21 1,300,000 EUR 1,408,680 1,337,700 0.431.625% RCI Banque 17-11.04.25 Regs 2,000,000 EUR 2,094,540 2,066,000 0.670.350% Régie Autonome des Transports Parisiens 19-20.06.29 1,100,000 EUR 1,096,656 1,102,090 0.360.875% SNCF Réseau 19-22.01.29 2,000,000 EUR 1,978,200 2,092,920 0.682.250% SNCF Réseau 17-20.12.47 Regs 3,000,000 EUR 4,129,470 3,750,090 1.211.125% Société du Grand Paris 18-22.10.28 3,300,000 EUR 3,297,525 3,554,760 1.151.125% Société du Grand Paris 19-25.05.34 2,200,000 EUR 2,175,074 2,360,380 0.761.000% Société de transport ile de France 19-25.05.34 1,100,000 EUR 1,081,432 1,151,040 0.371.375% Unibail Rodamco 14-17.10.22 1,000,000 EUR 1,036,540 1,035,900 0.341.500% Unibail Rodamco 17-22.02.28 1,300,000 EUR 1,300,832 1,382,030 0.451.625% Valeo 16-18.03.26 500,000 EUR 511,960 526,350 0.17
69,153,921 69,816,222 22.59
Germany0.010% Deutsche Kreditbank 19-07.11.29 1,500,000 EUR 1,487,460 1,470,600 0.482.875% Deutsche Post 12-11.12.24 2,000,000 EUR 2,266,159 2,273,000 0.740.000% Government of Germany 16-15.08.26 4,300,000 EUR 4,285,316 4,416,530 1.430.500% Government of Germany 15-15.02.25 3,000,000 EUR 3,092,003 3,148,800 1.024.000% Government of Germany 05-04.01.37 750,000 EUR 1,196,934 1,249,958 0.404.750% Government of Germany 98-04.07.28 4,500,000 EUR 6,457,184 6,440,940 2.080.500% Kreditanstalt für Wiederaufbau 18-28.09.26 2,000,000 EUR 2,036,860 2,086,800 0.682.500% Kreditanstalt für Wiederaufbau 12-17.01.22 4,000,000 EUR 4,590,400 4,241,600 1.373.500% Kreditanstalt für Wiederaufbau 06-04.07.21 4,000,000 EUR 4,630,995 4,238,800 1.371.000% Land Niedersachsen 14-18.08.22 1,000,000 EUR 1,047,172 1,035,140 0.341.375% Land Nordrhein-Westfalen 14-16.05.22 2,000,000 EUR 2,141,400 2,082,380 0.671.875% Land Nordrhein-Westfalen 14-15.03.24 4,550,000 EUR 5,083,975 4,956,042 1.602.625% Merck Group 14-12.12.74 1,800,000 EUR 1,813,500 1,859,580 0.600.000% NRW Bank 19-15.10.29 5,000,000 EUR 5,107,750 4,917,000 1.591.375% SAP 18-13.03.30 1,000,000 EUR 1,017,727 1,086,800 0.35
46,254,835 45,503,970 14.72
Statement of investments as at December 31, 2019 (continued)
Triodos Euro Bond Impact Fund
The accompanying notes form an integral part of these financial statements.
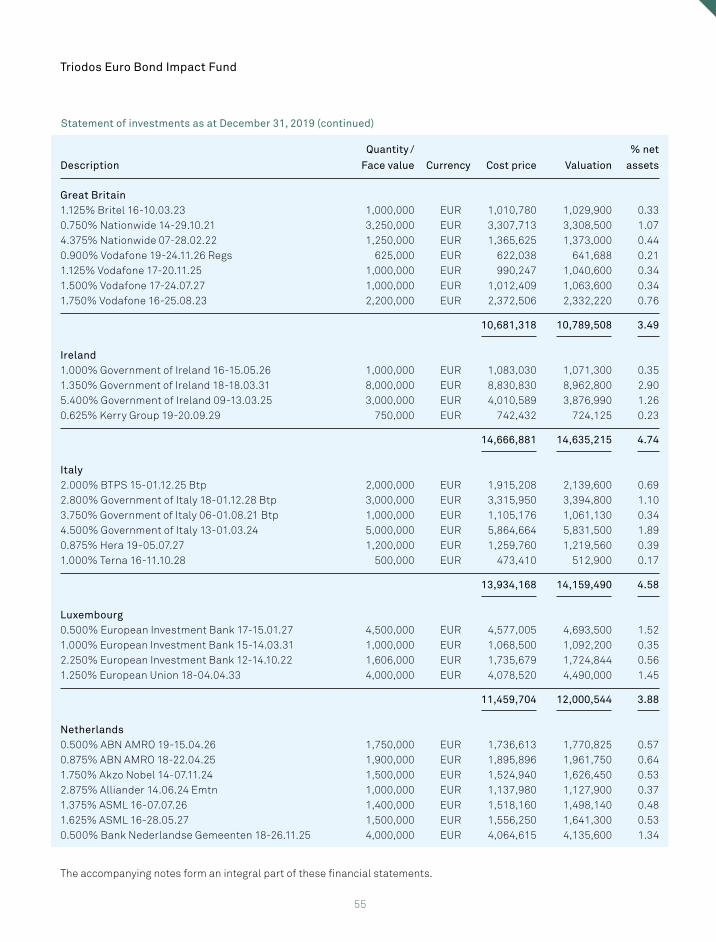
55
Description
Quantity /
Face value Currency Cost price Valuation
% net
assets
Great Britain1.125% Britel 16-10.03.23 1,000,000 EUR 1,010,780 1,029,900 0.330.750% Nationwide 14-29.10.21 3,250,000 EUR 3,307,713 3,308,500 1.074.375% Nationwide 07-28.02.22 1,250,000 EUR 1,365,625 1,373,000 0.440.900% Vodafone 19-24.11.26 Regs 625,000 EUR 622,038 641,688 0.211.125% Vodafone 17-20.11.25 1,000,000 EUR 990,247 1,040,600 0.341.500% Vodafone 17-24.07.27 1,000,000 EUR 1,012,409 1,063,600 0.341.750% Vodafone 16-25.08.23 2,200,000 EUR 2,372,506 2,332,220 0.76
10,681,318 10,789,508 3.49
Ireland1.000% Government of Ireland 16-15.05.26 1,000,000 EUR 1,083,030 1,071,300 0.351.350% Government of Ireland 18-18.03.31 8,000,000 EUR 8,830,830 8,962,800 2.905.400% Government of Ireland 09-13.03.25 3,000,000 EUR 4,010,589 3,876,990 1.260.625% Kerry Group 19-20.09.29 750,000 EUR 742,432 724,125 0.23
14,666,881 14,635,215 4.74
Italy2.000% BTPS 15-01.12.25 Btp 2,000,000 EUR 1,915,208 2,139,600 0.692.800% Government of Italy 18-01.12.28 Btp 3,000,000 EUR 3,315,950 3,394,800 1.103.750% Government of Italy 06-01.08.21 Btp 1,000,000 EUR 1,105,176 1,061,130 0.344.500% Government of Italy 13-01.03.24 5,000,000 EUR 5,864,664 5,831,500 1.890.875% Hera 19-05.07.27 1,200,000 EUR 1,259,760 1,219,560 0.391.000% Terna 16-11.10.28 500,000 EUR 473,410 512,900 0.17
13,934,168 14,159,490 4.58
Luxembourg0.500% European Investment Bank 17-15.01.27 4,500,000 EUR 4,577,005 4,693,500 1.521.000% European Investment Bank 15-14.03.31 1,000,000 EUR 1,068,500 1,092,200 0.352.250% European Investment Bank 12-14.10.22 1,606,000 EUR 1,735,679 1,724,844 0.561.250% European Union 18-04.04.33 4,000,000 EUR 4,078,520 4,490,000 1.45
11,459,704 12,000,544 3.88
Netherlands0.500% ABN AMRO 19-15.04.26 1,750,000 EUR 1,736,613 1,770,825 0.570.875% ABN AMRO 18-22.04.25 1,900,000 EUR 1,895,896 1,961,750 0.641.750% Akzo Nobel 14-07.11.24 1,500,000 EUR 1,524,940 1,626,450 0.532.875% Alliander 14.06.24 Emtn 1,000,000 EUR 1,137,980 1,127,900 0.371.375% ASML 16-07.07.26 1,400,000 EUR 1,518,160 1,498,140 0.481.625% ASML 16-28.05.27 1,500,000 EUR 1,556,250 1,641,300 0.530.500% Bank Nederlandse Gemeenten 18-26.11.25 4,000,000 EUR 4,064,615 4,135,600 1.34
Statement of investments as at December 31, 2019 (continued)
Triodos Euro Bond Impact Fund
The accompanying notes form an integral part of these financial statements.
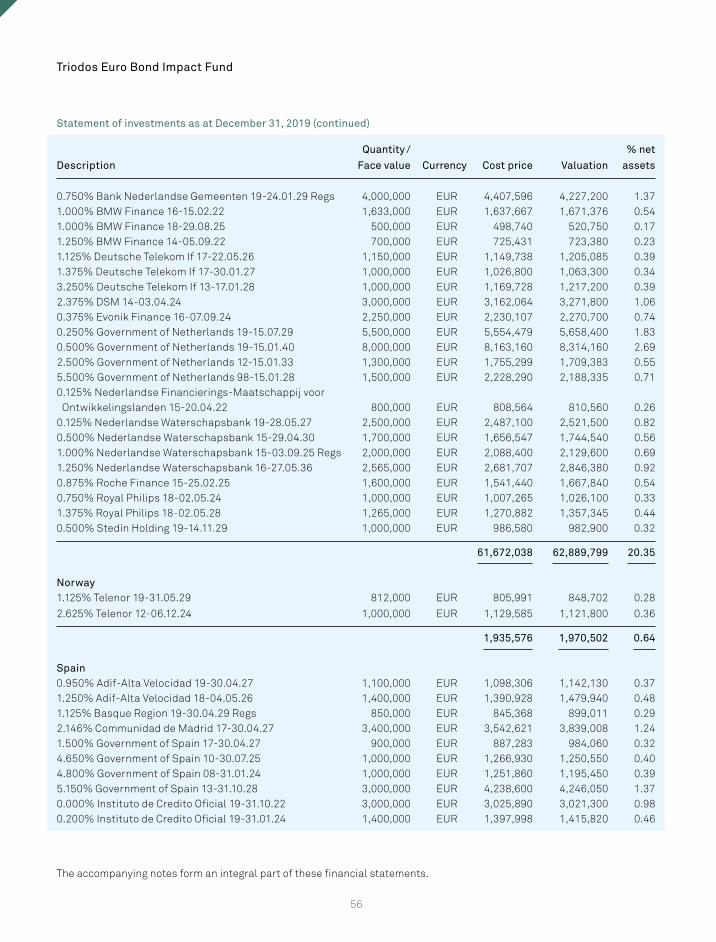
56
Description
Quantity /
Face value Currency Cost price Valuation
% net
assets
0.750% Bank Nederlandse Gemeenten 19-24.01.29 Regs 4,000,000 EUR 4,407,596 4,227,200 1.371.000% BMW Finance 16-15.02.22 1,633,000 EUR 1,637,667 1,671,376 0.541.000% BMW Finance 18-29.08.25 500,000 EUR 498,740 520,750 0.171.250% BMW Finance 14-05.09.22 700,000 EUR 725,431 723,380 0.231.125% Deutsche Telekom If 17-22.05.26 1,150,000 EUR 1,149,738 1,205,085 0.391.375% Deutsche Telekom If 17-30.01.27 1,000,000 EUR 1,026,800 1,063,300 0.343.250% Deutsche Telekom If 13-17.01.28 1,000,000 EUR 1,169,728 1,217,200 0.392.375% DSM 14-03.04.24 3,000,000 EUR 3,162,064 3,271,800 1.060.375% Evonik Finance 16-07.09.24 2,250,000 EUR 2,230,107 2,270,700 0.740.250% Government of Netherlands 19-15.07.29 5,500,000 EUR 5,554,479 5,658,400 1.830.500% Government of Netherlands 19-15.01.40 8,000,000 EUR 8,163,160 8,314,160 2.692.500% Government of Netherlands 12-15.01.33 1,300,000 EUR 1,755,299 1,709,383 0.555.500% Government of Netherlands 98-15.01.28 1,500,000 EUR 2,228,290 2,188,335 0.710.125% Nederlandse Financierings-Maatschappij voor Ontwikkelingslanden 15-20.04.22 800,000 EUR 808,564 810,560 0.260.125% Nederlandse Waterschapsbank 19-28.05.27 2,500,000 EUR 2,487,100 2,521,500 0.820.500% Nederlandse Waterschapsbank 15-29.04.30 1,700,000 EUR 1,656,547 1,744,540 0.561.000% Nederlandse Waterschapsbank 15-03.09.25 Regs 2,000,000 EUR 2,088,400 2,129,600 0.691.250% Nederlandse Waterschapsbank 16-27.05.36 2,565,000 EUR 2,681,707 2,846,380 0.920.875% Roche Finance 15-25.02.25 1,600,000 EUR 1,541,440 1,667,840 0.540.750% Royal Philips 18-02.05.24 1,000,000 EUR 1,007,265 1,026,100 0.331.375% Royal Philips 18-02.05.28 1,265,000 EUR 1,270,882 1,357,345 0.440.500% Stedin Holding 19-14.11.29 1,000,000 EUR 986,580 982,900 0.32
61,672,038 62,889,799 20.35
Norway1.125% Telenor 19-31.05.29 812,000 EUR 805,991 848,702 0.28
2.625% Telenor 12-06.12.24 1,000,000 EUR 1,129,585 1,121,800 0.36
1,935,576 1,970,502 0.64
Spain0.950% Adif-Alta Velocidad 19-30.04.27 1,100,000 EUR 1,098,306 1,142,130 0.371.250% Adif-Alta Velocidad 18-04.05.26 1,400,000 EUR 1,390,928 1,479,940 0.481.125% Basque Region 19-30.04.29 Regs 850,000 EUR 845,368 899,011 0.292.146% Communidad de Madrid 17-30.04.27 3,400,000 EUR 3,542,621 3,839,008 1.241.500% Government of Spain 17-30.04.27 900,000 EUR 887,283 984,060 0.324.650% Government of Spain 10-30.07.25 1,000,000 EUR 1,266,930 1,250,550 0.404.800% Government of Spain 08-31.01.24 1,000,000 EUR 1,251,860 1,195,450 0.395.150% Government of Spain 13-31.10.28 3,000,000 EUR 4,238,600 4,246,050 1.370.000% Instituto de Credito Oficial 19-31.10.22 3,000,000 EUR 3,025,890 3,021,300 0.980.200% Instituto de Credito Oficial 19-31.01.24 1,400,000 EUR 1,397,998 1,415,820 0.46
Statement of investments as at December 31, 2019 (continued)
Triodos Euro Bond Impact Fund
The accompanying notes form an integral part of these financial statements.
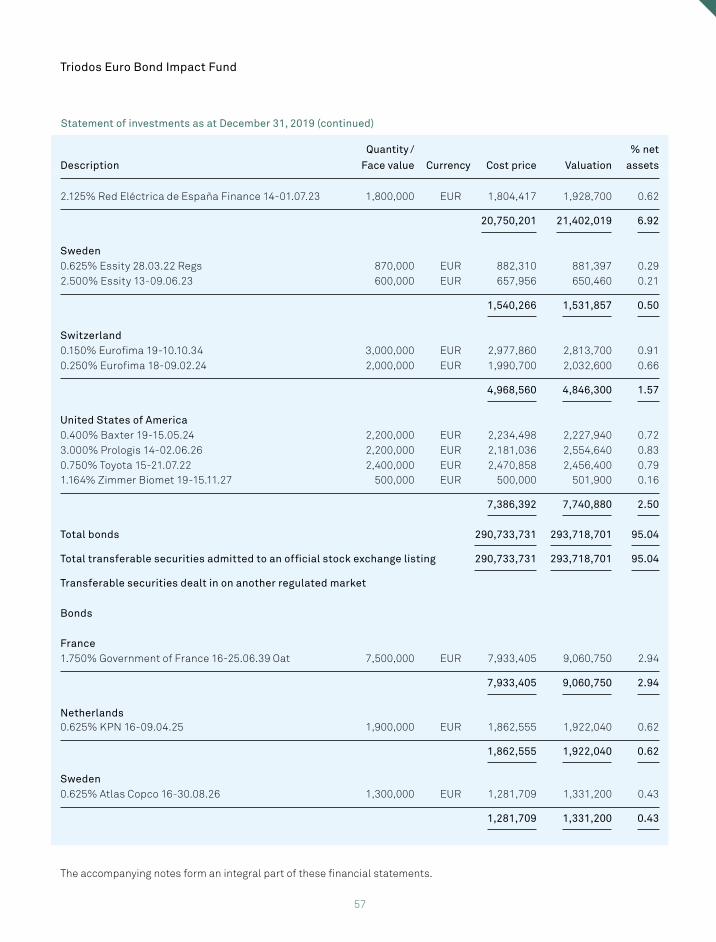
57
Triodos Euro Bond Impact Fund
Description
Quantity /
Face value Currency Cost price Valuation
% net
assets
2.125% Red Eléctrica de España Finance 14-01.07.23 1,800,000 EUR 1,804,417 1,928,700 0.62
20,750,201 21,402,019 6.92
Sweden0.625% Essity 28.03.22 Regs 870,000 EUR 882,310 881,397 0.292.500% Essity 13-09.06.23 600,000 EUR 657,956 650,460 0.21
1,540,266 1,531,857 0.50
Switzerland0.150% Eurofima 19-10.10.34 3,000,000 EUR 2,977,860 2,813,700 0.910.250% Eurofima 18-09.02.24 2,000,000 EUR 1,990,700 2,032,600 0.66
4,968,560 4,846,300 1.57 United States of America0.400% Baxter 19-15.05.24 2,200,000 EUR 2,234,498 2,227,940 0.723.000% Prologis 14-02.06.26 2,200,000 EUR 2,181,036 2,554,640 0.830.750% Toyota 15-21.07.22 2,400,000 EUR 2,470,858 2,456,400 0.791.164% Zimmer Biomet 19-15.11.27 500,000 EUR 500,000 501,900 0.16
7,386,392 7,740,880 2.50
Total bonds 290,733,731 293,718,701 95.04
Total transferable securities admitted to an official stock exchange listing 290,733,731 293,718,701 95.04
Transferable securities dealt in on another regulated market
Bonds
France1.750% Government of France 16-25.06.39 Oat 7,500,000 EUR 7,933,405 9,060,750 2.94
7,933,405 9,060,750 2.94
Netherlands0.625% KPN 16-09.04.25 1,900,000 EUR 1,862,555 1,922,040 0.62
1,862,555 1,922,040 0.62
Sweden0.625% Atlas Copco 16-30.08.26 1,300,000 EUR 1,281,709 1,331,200 0.43
1,281,709 1,331,200 0.43
Statement of investments as at December 31, 2019 (continued)
The accompanying notes form an integral part of these financial statements.
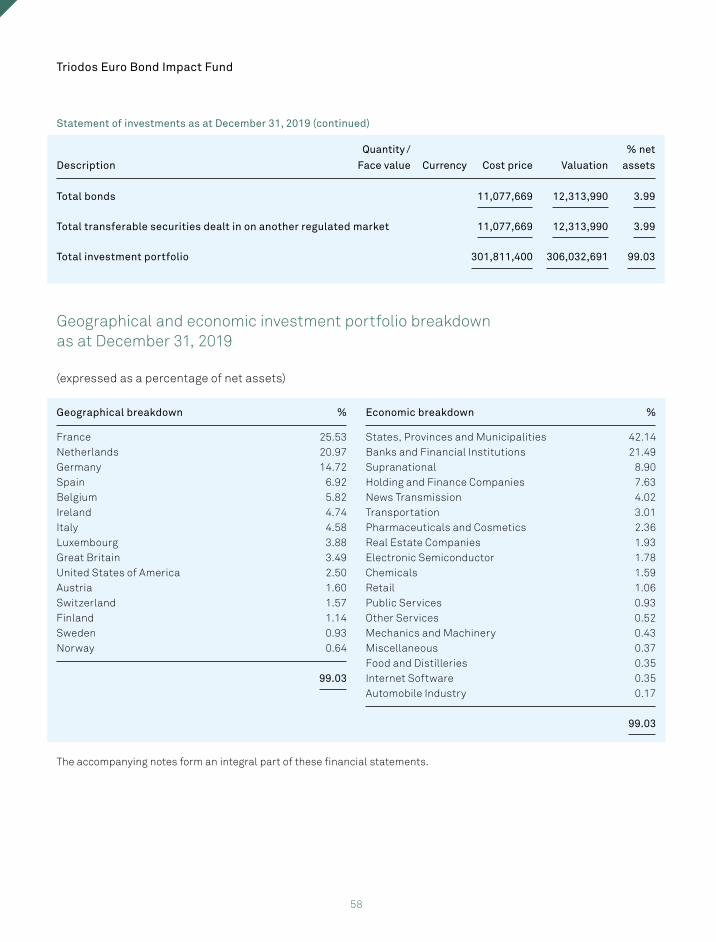
58
Triodos Euro Bond Impact Fund
Description
Quantity /
Face value Currency Cost price Valuation
% net
assets
Total bonds 11,077,669 12,313,990 3.99
Total transferable securities dealt in on another regulated market 11,077,669 12,313,990 3.99
Total investment portfolio 301,811,400 306,032,691 99.03
Geographical and economic investment portfolio breakdown as at December 31, 2019
(expressed as a percentage of net assets)
Geographical breakdown % Economic breakdown %
France 25.53 States, Provinces and Municipalities 42.14Netherlands 20.97 Banks and Financial Institutions 21.49Germany 14.72 Supranational 8.90Spain 6.92 Holding and Finance Companies 7.63Belgium 5.82 News Transmission 4.02Ireland 4.74 Transportation 3.01Italy 4.58 Pharmaceuticals and Cosmetics 2.36Luxembourg 3.88 Real Estate Companies 1.93Great Britain 3.49 Electronic Semiconductor 1.78United States of America 2.50 Chemicals 1.59Austria 1.60 Retail 1.06Switzerland 1.57 Public Services 0.93Finland 1.14 Other Services 0.52Sweden 0.93 Mechanics and Machinery 0.43Norway 0.64 Miscellaneous 0.37
Food and Distilleries 0.3599.03 Internet Software 0.35
Automobile Industry 0.17
99.03
The accompanying notes form an integral part of these financial statements.
Statement of investments as at December 31, 2019 (continued)
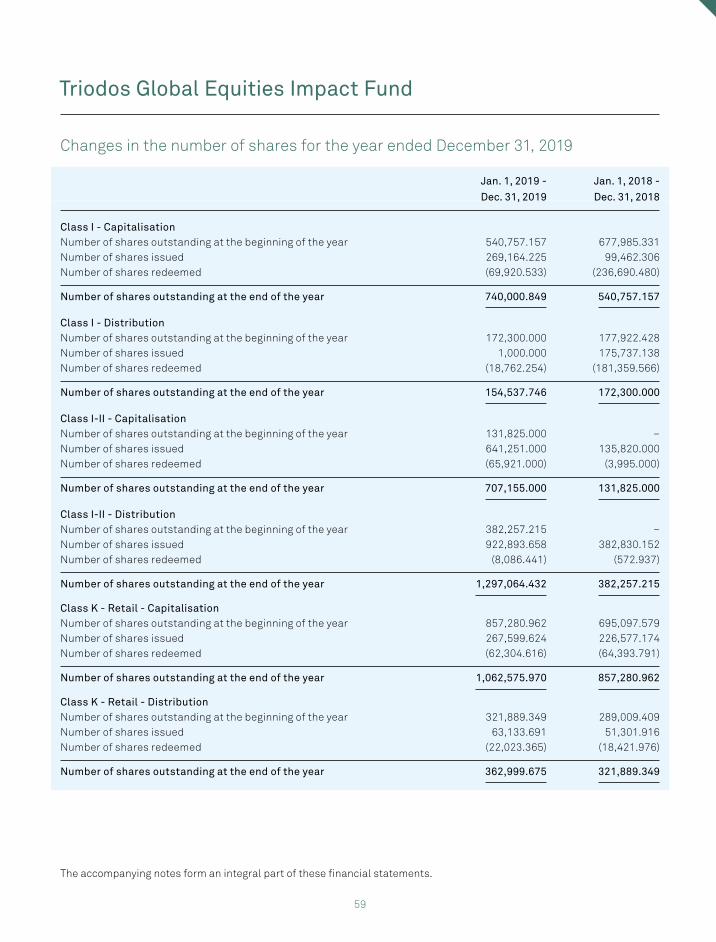
59
Triodos Global Equities Impact Fund
Changes in the number of shares for the year ended December 31, 2019
Jan. 1, 2019 -
Dec. 31, 2019
Jan. 1, 2018 -
Dec. 31, 2018
Class I - CapitalisationNumber of shares outstanding at the beginning of the year 540,757.157 677,985.331Number of shares issued 269,164.225 99,462.306Number of shares redeemed (69,920.533) (236,690.480)
Number of shares outstanding at the end of the year 740,000.849 540,757.157
Class I - DistributionNumber of shares outstanding at the beginning of the year 172,300.000 177,922.428Number of shares issued 1,000.000 175,737.138Number of shares redeemed (18,762.254) (181,359.566)
Number of shares outstanding at the end of the year 154,537.746 172,300.000
Class I-II - CapitalisationNumber of shares outstanding at the beginning of the year 131,825.000 –Number of shares issued 641,251.000 135,820.000Number of shares redeemed (65,921.000) (3,995.000)
Number of shares outstanding at the end of the year 707,155.000 131,825.000
Class I-II - DistributionNumber of shares outstanding at the beginning of the year 382,257.215 –Number of shares issued 922,893.658 382,830.152Number of shares redeemed (8,086.441) (572.937)
Number of shares outstanding at the end of the year 1,297,064.432 382,257.215
Class K - Retail - CapitalisationNumber of shares outstanding at the beginning of the year 857,280.962 695,097.579Number of shares issued 267,599.624 226,577.174Number of shares redeemed (62,304.616) (64,393.791)
Number of shares outstanding at the end of the year 1,062,575.970 857,280.962
Class K - Retail - DistributionNumber of shares outstanding at the beginning of the year 321,889.349 289,009.409Number of shares issued 63,133.691 51,301.916Number of shares redeemed (22,023.365) (18,421.976)
Number of shares outstanding at the end of the year 362,999.675 321,889.349
The accompanying notes form an integral part of these financial statements.
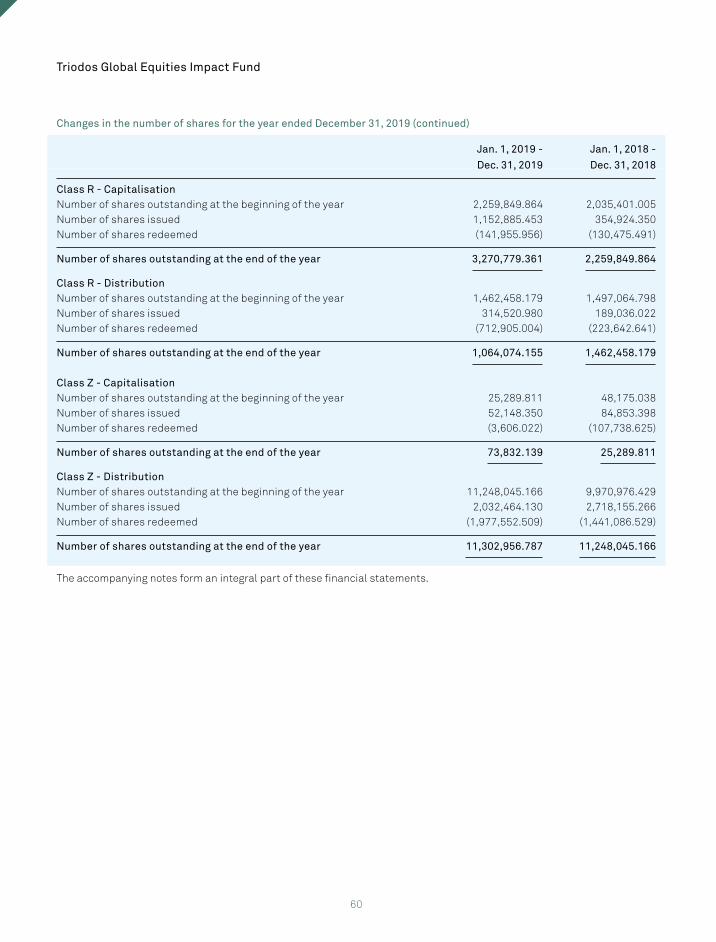
60
Jan. 1, 2019 -
Dec. 31, 2019
Jan. 1, 2018 -
Dec. 31, 2018
Class R - CapitalisationNumber of shares outstanding at the beginning of the year 2,259,849.864 2,035,401.005Number of shares issued 1,152,885.453 354,924.350Number of shares redeemed (141,955.956) (130,475.491)
Number of shares outstanding at the end of the year 3,270,779.361 2,259,849.864
Class R - DistributionNumber of shares outstanding at the beginning of the year 1,462,458.179 1,497,064.798Number of shares issued 314,520.980 189,036.022Number of shares redeemed (712,905.004) (223,642.641)
Number of shares outstanding at the end of the year 1,064,074.155 1,462,458.179
Class Z - CapitalisationNumber of shares outstanding at the beginning of the year 25,289.811 48,175.038Number of shares issued 52,148.350 84,853.398Number of shares redeemed (3,606.022) (107,738.625)
Number of shares outstanding at the end of the year 73,832.139 25,289.811
Class Z - DistributionNumber of shares outstanding at the beginning of the year 11,248,045.166 9,970,976.429Number of shares issued 2,032,464.130 2,718,155.266Number of shares redeemed (1,977,552.509) (1,441,086.529)
Number of shares outstanding at the end of the year 11,302,956.787 11,248,045.166
The accompanying notes form an integral part of these financial statements.
Triodos Global Equities Impact Fund
Changes in the number of shares for the year ended December 31, 2019 (continued)
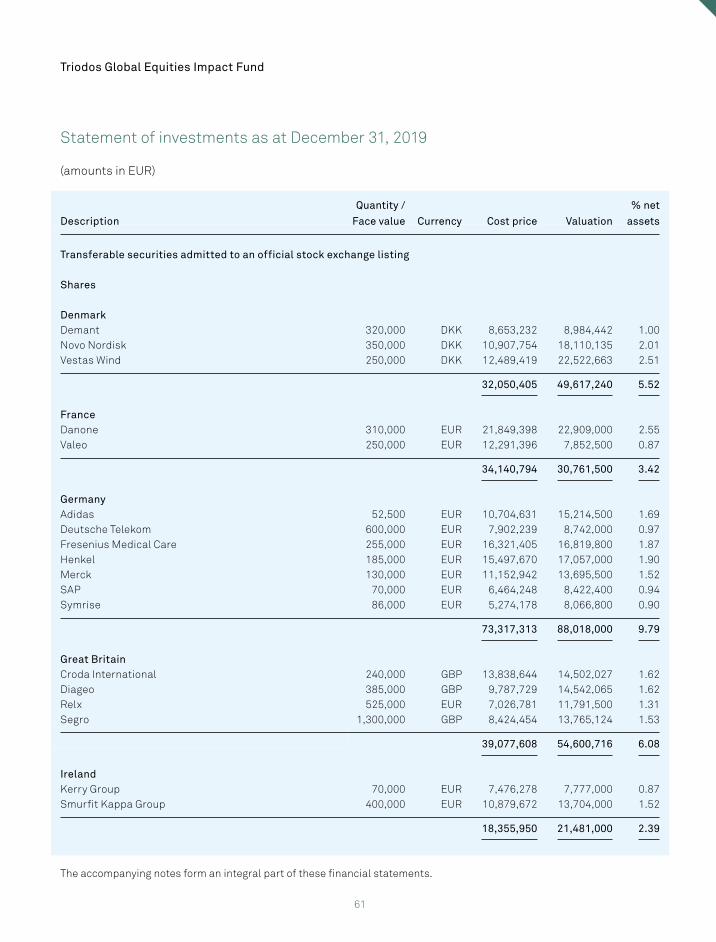
61
Statement of investments as at December 31, 2019
(amounts in EUR)
Description
Quantity /
Face value Currency Cost price Valuation
% net
assets
Transferable securities admitted to an official stock exchange listing
Shares
DenmarkDemant 320,000 DKK 8,653,232 8,984,442 1.00Novo Nordisk 350,000 DKK 10,907,754 18,110,135 2.01Vestas Wind 250,000 DKK 12,489,419 22,522,663 2.51
32,050,405 49,617,240 5.52
FranceDanone 310,000 EUR 21,849,398 22,909,000 2.55Valeo 250,000 EUR 12,291,396 7,852,500 0.87
34,140,794 30,761,500 3.42
GermanyAdidas 52,500 EUR 10,704,631 15,214,500 1.69Deutsche Telekom 600,000 EUR 7,902,239 8,742,000 0.97Fresenius Medical Care 255,000 EUR 16,321,405 16,819,800 1.87Henkel 185,000 EUR 15,497,670 17,057,000 1.90Merck 130,000 EUR 11,152,942 13,695,500 1.52SAP 70,000 EUR 6,464,248 8,422,400 0.94Symrise 86,000 EUR 5,274,178 8,066,800 0.90
73,317,313 88,018,000 9.79
Great BritainCroda International 240,000 GBP 13,838,644 14,502,027 1.62Diageo 385,000 GBP 9,787,729 14,542,065 1.62Relx 525,000 EUR 7,026,781 11,791,500 1.31Segro 1,300,000 GBP 8,424,454 13,765,124 1.53
39,077,608 54,600,716 6.08
IrelandKerry Group 70,000 EUR 7,476,278 7,777,000 0.87Smurfit Kappa Group 400,000 EUR 10,879,672 13,704,000 1.52
18,355,950 21,481,000 2.39
Triodos Global Equities Impact Fund
The accompanying notes form an integral part of these financial statements.
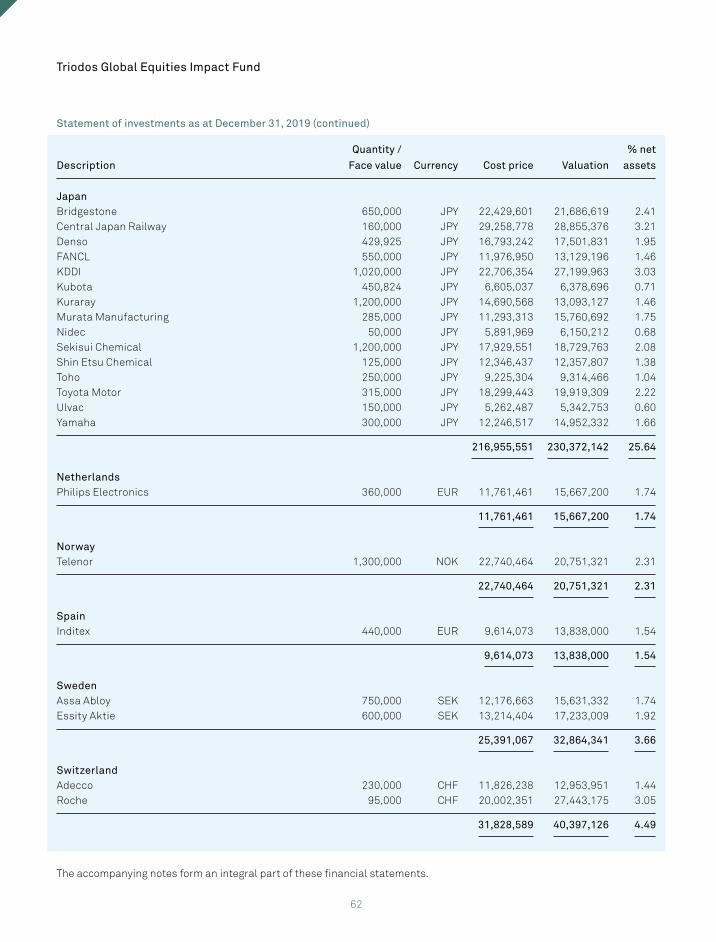
62
Description
Quantity /
Face value Currency Cost price Valuation
% net
assets
JapanBridgestone 650,000 JPY 22,429,601 21,686,619 2.41Central Japan Railway 160,000 JPY 29,258,778 28,855,376 3.21Denso 429,925 JPY 16,793,242 17,501,831 1.95FANCL 550,000 JPY 11,976,950 13,129,196 1.46KDDI 1,020,000 JPY 22,706,354 27,199,963 3.03Kubota 450,824 JPY 6,605,037 6,378,696 0.71Kuraray 1,200,000 JPY 14,690,568 13,093,127 1.46Murata Manufacturing 285,000 JPY 11,293,313 15,760,692 1.75Nidec 50,000 JPY 5,891,969 6,150,212 0.68Sekisui Chemical 1,200,000 JPY 17,929,551 18,729,763 2.08Shin Etsu Chemical 125,000 JPY 12,346,437 12,357,807 1.38Toho 250,000 JPY 9,225,304 9,314,466 1.04Toyota Motor 315,000 JPY 18,299,443 19,919,309 2.22Ulvac 150,000 JPY 5,262,487 5,342,753 0.60Yamaha 300,000 JPY 12,246,517 14,952,332 1.66
216,955,551 230,372,142 25.64
NetherlandsPhilips Electronics 360,000 EUR 11,761,461 15,667,200 1.74
11,761,461 15,667,200 1.74
NorwayTelenor 1,300,000 NOK 22,740,464 20,751,321 2.31
22,740,464 20,751,321 2.31
SpainInditex 440,000 EUR 9,614,073 13,838,000 1.54
9,614,073 13,838,000 1.54
SwedenAssa Abloy 750,000 SEK 12,176,663 15,631,332 1.74Essity Aktie 600,000 SEK 13,214,404 17,233,009 1.92
25,391,067 32,864,341 3.66
SwitzerlandAdecco 230,000 CHF 11,826,238 12,953,951 1.44Roche 95,000 CHF 20,002,351 27,443,175 3.05
31,828,589 40,397,126 4.49
Statement of investments as at December 31, 2019 (continued)
Triodos Global Equities Impact Fund
The accompanying notes form an integral part of these financial statements.
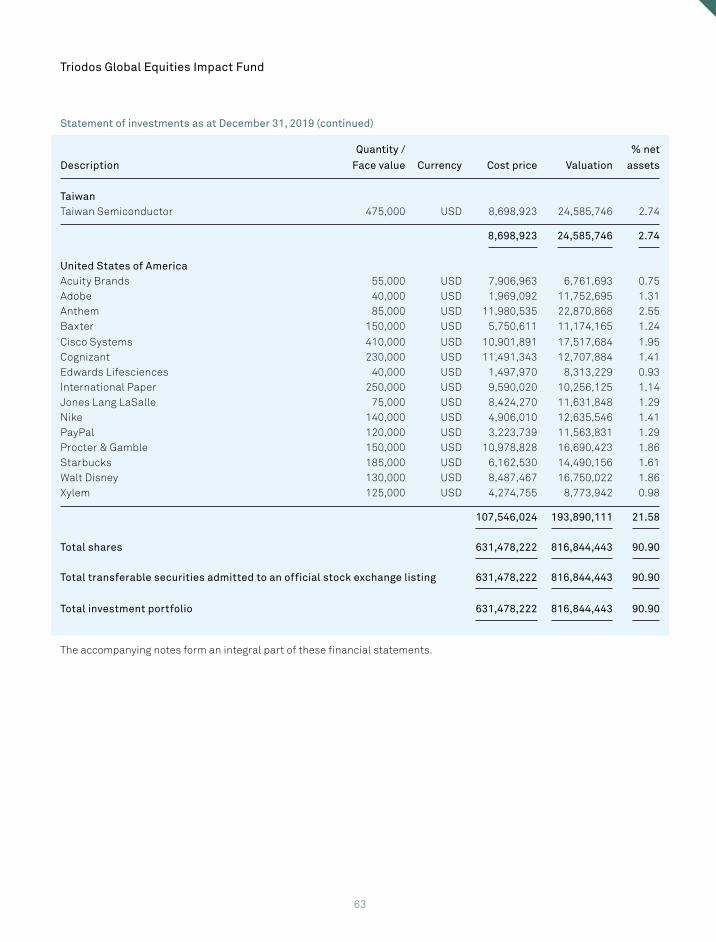
63
Description
Quantity /
Face value Currency Cost price Valuation
% net
assets
TaiwanTaiwan Semiconductor 475,000 USD 8,698,923 24,585,746 2.74
8,698,923 24,585,746 2.74
United States of AmericaAcuity Brands 55,000 USD 7,906,963 6,761,693 0.75Adobe 40,000 USD 1,969,092 11,752,695 1.31Anthem 85,000 USD 11,980,535 22,870,868 2.55Baxter 150,000 USD 5,750,611 11,174,165 1.24Cisco Systems 410,000 USD 10,901,891 17,517,684 1.95Cognizant 230,000 USD 11,491,343 12,707,884 1.41Edwards Lifesciences 40,000 USD 1,497,970 8,313,229 0.93International Paper 250,000 USD 9,590,020 10,256,125 1.14Jones Lang LaSalle 75,000 USD 8,424,270 11,631,848 1.29Nike 140,000 USD 4,906,010 12,635,546 1.41PayPal 120,000 USD 3,223,739 11,563,831 1.29Procter & Gamble 150,000 USD 10,978,828 16,690,423 1.86Starbucks 185,000 USD 6,162,530 14,490,156 1.61Walt Disney 130,000 USD 8,487,467 16,750,022 1.86Xylem 125,000 USD 4,274,755 8,773,942 0.98
107,546,024 193,890,111 21.58
Total shares 631,478,222 816,844,443 90.90
Total transferable securities admitted to an official stock exchange listing 631,478,222 816,844,443 90.90
Total investment portfolio 631,478,222 816,844,443 90.90
The accompanying notes form an integral part of these financial statements.
Statement of investments as at December 31, 2019 (continued)
Triodos Global Equities Impact Fund
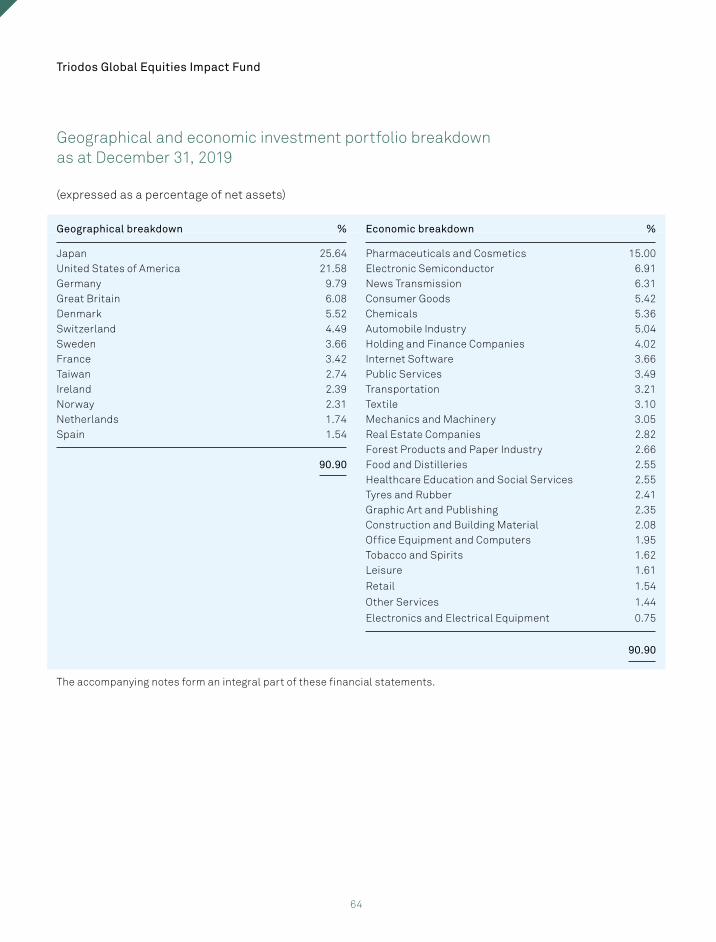
64
Geographical and economic investment portfolio breakdown as at December 31, 2019
(expressed as a percentage of net assets)
Geographical breakdown % Economic breakdown %
Japan 25.64 Pharmaceuticals and Cosmetics 15.00United States of America 21.58 Electronic Semiconductor 6.91Germany 9.79 News Transmission 6.31Great Britain 6.08 Consumer Goods 5.42Denmark 5.52 Chemicals 5.36Switzerland 4.49 Automobile Industry 5.04Sweden 3.66 Holding and Finance Companies 4.02France 3.42 Internet Software 3.66Taiwan 2.74 Public Services 3.49Ireland 2.39 Transportation 3.21Norway 2.31 Textile 3.10Netherlands 1.74 Mechanics and Machinery 3.05Spain 1.54 Real Estate Companies 2.82
Forest Products and Paper Industry 2.6690.90 Food and Distilleries 2.55
Healthcare Education and Social Services 2.55Tyres and Rubber 2.41Graphic Art and Publishing 2.35Construction and Building Material 2.08Office Equipment and Computers 1.95Tobacco and Spirits 1.62Leisure 1.61
Retail 1.54
Other Services 1.44
Electronics and Electrical Equipment 0.75
90.90
The accompanying notes form an integral part of these financial statements.
Triodos Global Equities Impact Fund
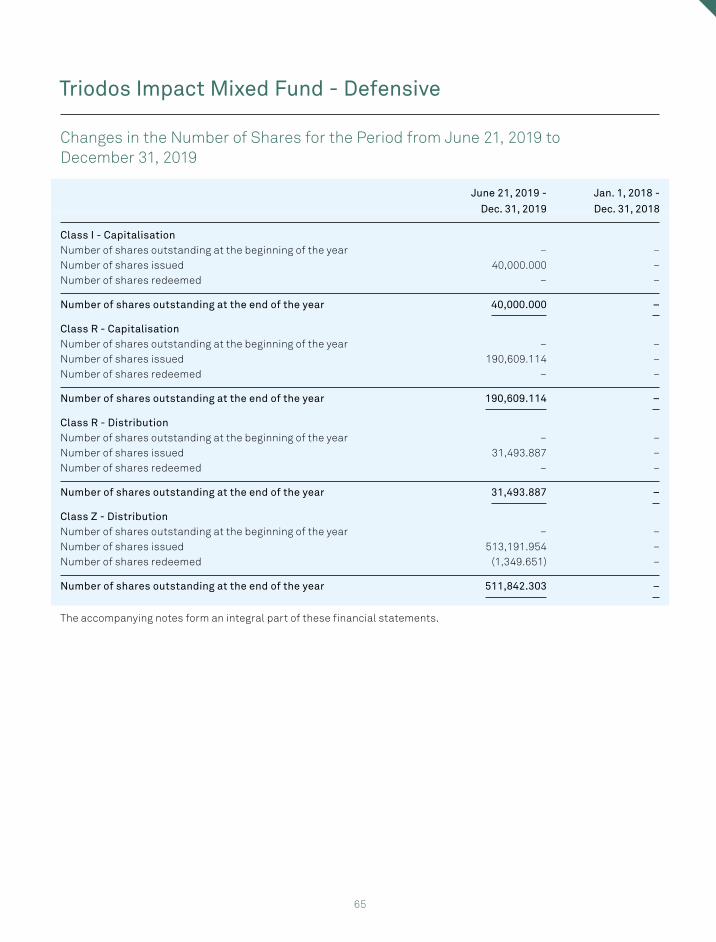
65
Changes in the Number of Shares for the Period from June 21, 2019 to December 31, 2019
June 21, 2019 -
Dec. 31, 2019
Jan. 1, 2018 -
Dec. 31, 2018
Class I - CapitalisationNumber of shares outstanding at the beginning of the year – –Number of shares issued 40,000.000 –Number of shares redeemed – –
Number of shares outstanding at the end of the year 40,000.000 –
Class R - CapitalisationNumber of shares outstanding at the beginning of the year – –Number of shares issued 190,609.114 –Number of shares redeemed – –
Number of shares outstanding at the end of the year 190,609.114 –
Class R - DistributionNumber of shares outstanding at the beginning of the year – –Number of shares issued 31,493.887 –Number of shares redeemed – –
Number of shares outstanding at the end of the year 31,493.887 –
Class Z - DistributionNumber of shares outstanding at the beginning of the year – –Number of shares issued 513,191.954 –Number of shares redeemed (1,349.651) –
Number of shares outstanding at the end of the year 511,842.303 –
The accompanying notes form an integral part of these financial statements.
Triodos Impact Mixed Fund - Defensive
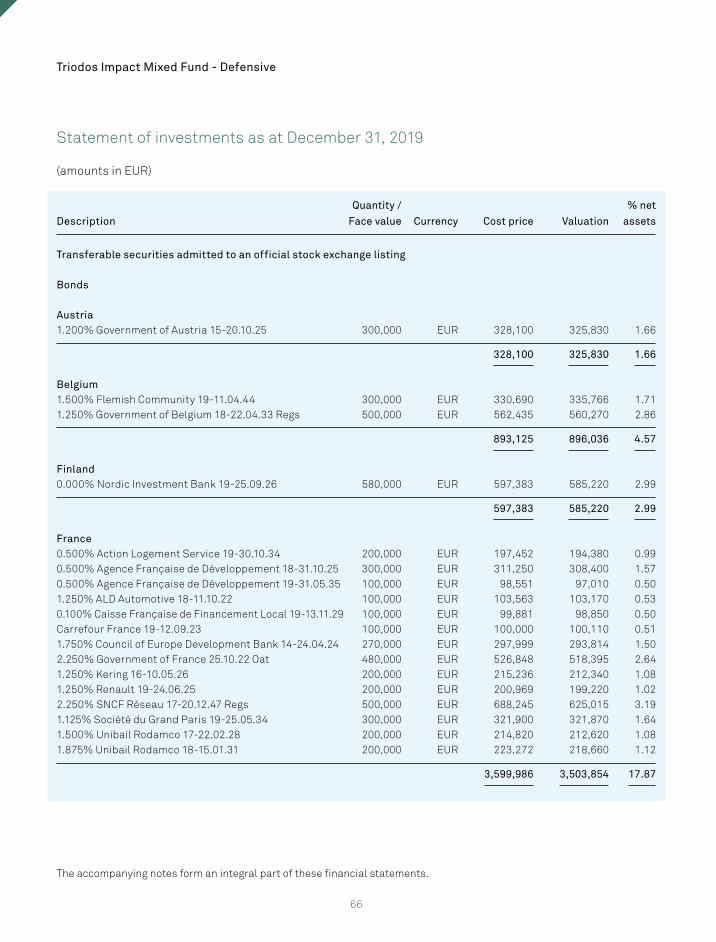
66
Statement of investments as at December 31, 2019
(amounts in EUR)
Description
Quantity /
Face value Currency Cost price Valuation
% net
assets
Transferable securities admitted to an official stock exchange listing
Bonds
Austria1.200% Government of Austria 15-20.10.25 300,000 EUR 328,100 325,830 1.66
328,100 325,830 1.66
Belgium1.500% Flemish Community 19-11.04.44 300,000 EUR 330,690 335,766 1.711.250% Government of Belgium 18-22.04.33 Regs 500,000 EUR 562,435 560,270 2.86
893,125 896,036 4.57
Finland0.000% Nordic Investment Bank 19-25.09.26 580,000 EUR 597,383 585,220 2.99
597,383 585,220 2.99
France0.500% Action Logement Service 19-30.10.34 200,000 EUR 197,452 194,380 0.990.500% Agence Française de Développement 18-31.10.25 300,000 EUR 311,250 308,400 1.570.500% Agence Française de Développement 19-31.05.35 100,000 EUR 98,551 97,010 0.501.250% ALD Automotive 18-11.10.22 100,000 EUR 103,563 103,170 0.530.100% Caisse Française de Financement Local 19-13.11.29 100,000 EUR 99,881 98,850 0.50Carrefour France 19-12.09.23 100,000 EUR 100,000 100,110 0.511.750% Council of Europe Development Bank 14-24.04.24 270,000 EUR 297,999 293,814 1.502.250% Government of France 25.10.22 Oat 480,000 EUR 526,848 518,395 2.641.250% Kering 16-10.05.26 200,000 EUR 215,236 212,340 1.081.250% Renault 19-24.06.25 200,000 EUR 200,969 199,220 1.022.250% SNCF Réseau 17-20.12.47 Regs 500,000 EUR 688,245 625,015 3.191.125% Société du Grand Paris 19-25.05.34 300,000 EUR 321,900 321,870 1.641.500% Unibail Rodamco 17-22.02.28 200,000 EUR 214,820 212,620 1.081.875% Unibail Rodamco 18-15.01.31 200,000 EUR 223,272 218,660 1.12
3,599,986 3,503,854 17.87
Triodos Impact Mixed Fund - Defensive
The accompanying notes form an integral part of these financial statements.
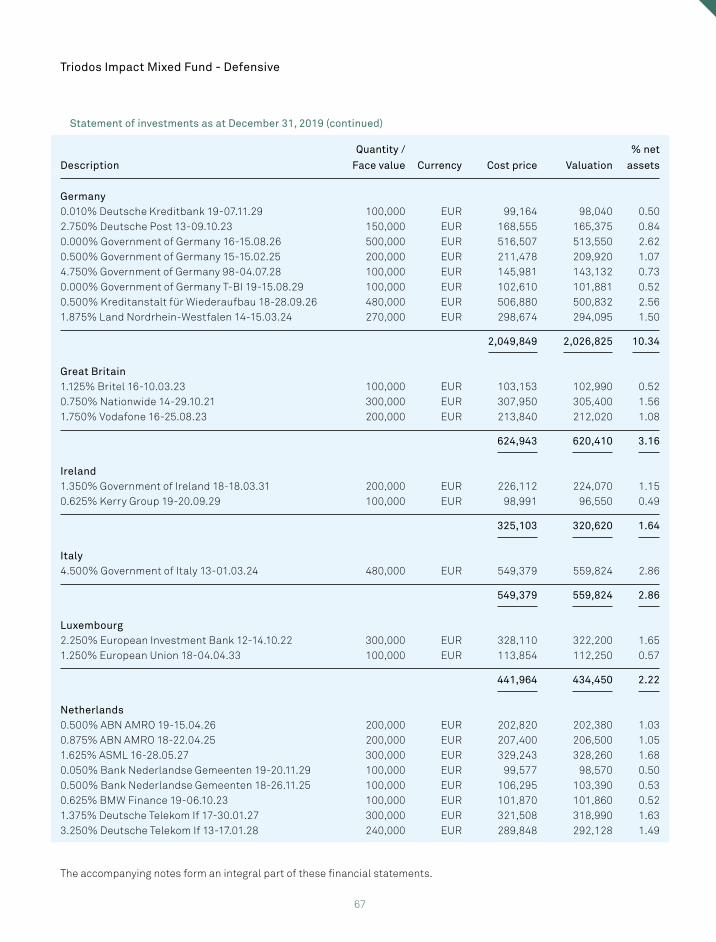
67
Description
Quantity /
Face value Currency Cost price Valuation
% net
assets
Germany0.010% Deutsche Kreditbank 19-07.11.29 100,000 EUR 99,164 98,040 0.502.750% Deutsche Post 13-09.10.23 150,000 EUR 168,555 165,375 0.840.000% Government of Germany 16-15.08.26 500,000 EUR 516,507 513,550 2.620.500% Government of Germany 15-15.02.25 200,000 EUR 211,478 209,920 1.074.750% Government of Germany 98-04.07.28 100,000 EUR 145,981 143,132 0.730.000% Government of Germany T-BI 19-15.08.29 100,000 EUR 102,610 101,881 0.520.500% Kreditanstalt für Wiederaufbau 18-28.09.26 480,000 EUR 506,880 500,832 2.561.875% Land Nordrhein-Westfalen 14-15.03.24 270,000 EUR 298,674 294,095 1.50
2,049,849 2,026,825 10.34
Great Britain1.125% Britel 16-10.03.23 100,000 EUR 103,153 102,990 0.520.750% Nationwide 14-29.10.21 300,000 EUR 307,950 305,400 1.561.750% Vodafone 16-25.08.23 200,000 EUR 213,840 212,020 1.08
624,943 620,410 3.16
Ireland1.350% Government of Ireland 18-18.03.31 200,000 EUR 226,112 224,070 1.150.625% Kerry Group 19-20.09.29 100,000 EUR 98,991 96,550 0.49
325,103 320,620 1.64
Italy4.500% Government of Italy 13-01.03.24 480,000 EUR 549,379 559,824 2.86
549,379 559,824 2.86
Luxembourg2.250% European Investment Bank 12-14.10.22 300,000 EUR 328,110 322,200 1.651.250% European Union 18-04.04.33 100,000 EUR 113,854 112,250 0.57
441,964 434,450 2.22
Netherlands0.500% ABN AMRO 19-15.04.26 200,000 EUR 202,820 202,380 1.030.875% ABN AMRO 18-22.04.25 200,000 EUR 207,400 206,500 1.051.625% ASML 16-28.05.27 300,000 EUR 329,243 328,260 1.680.050% Bank Nederlandse Gemeenten 19-20.11.29 100,000 EUR 99,577 98,570 0.500.500% Bank Nederlandse Gemeenten 18-26.11.25 100,000 EUR 106,295 103,390 0.530.625% BMW Finance 19-06.10.23 100,000 EUR 101,870 101,860 0.521.375% Deutsche Telekom If 17-30.01.27 300,000 EUR 321,508 318,990 1.633.250% Deutsche Telekom If 13-17.01.28 240,000 EUR 289,848 292,128 1.49
Triodos Impact Mixed Fund - Defensive
Statement of investments as at December 31, 2019 (continued)
The accompanying notes form an integral part of these financial statements.
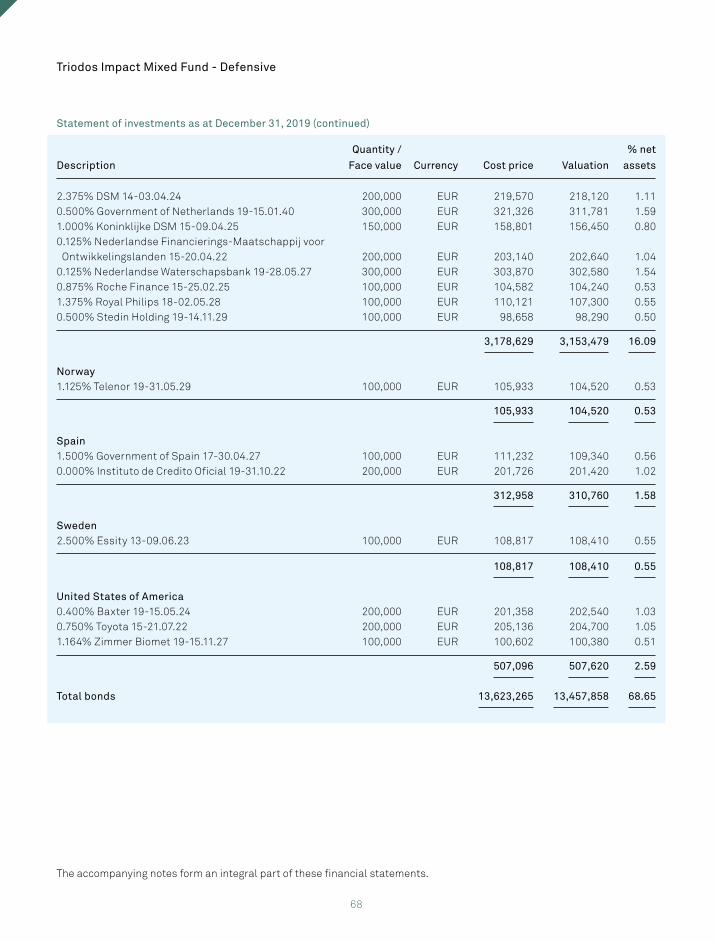
68
Description
Quantity /
Face value Currency Cost price Valuation
% net
assets
2.375% DSM 14-03.04.24 200,000 EUR 219,570 218,120 1.110.500% Government of Netherlands 19-15.01.40 300,000 EUR 321,326 311,781 1.591.000% Koninklijke DSM 15-09.04.25 150,000 EUR 158,801 156,450 0.800.125% Nederlandse Financierings-Maatschappij voor Ontwikkelingslanden 15-20.04.22 200,000 EUR 203,140 202,640 1.040.125% Nederlandse Waterschapsbank 19-28.05.27 300,000 EUR 303,870 302,580 1.540.875% Roche Finance 15-25.02.25 100,000 EUR 104,582 104,240 0.531.375% Royal Philips 18-02.05.28 100,000 EUR 110,121 107,300 0.550.500% Stedin Holding 19-14.11.29 100,000 EUR 98,658 98,290 0.50
3,178,629 3,153,479 16.09
Norway1.125% Telenor 19-31.05.29 100,000 EUR 105,933 104,520 0.53
105,933 104,520 0.53
Spain1.500% Government of Spain 17-30.04.27 100,000 EUR 111,232 109,340 0.560.000% Instituto de Credito Oficial 19-31.10.22 200,000 EUR 201,726 201,420 1.02
312,958 310,760 1.58
Sweden2.500% Essity 13-09.06.23 100,000 EUR 108,817 108,410 0.55
108,817 108,410 0.55
United States of America0.400% Baxter 19-15.05.24 200,000 EUR 201,358 202,540 1.030.750% Toyota 15-21.07.22 200,000 EUR 205,136 204,700 1.051.164% Zimmer Biomet 19-15.11.27 100,000 EUR 100,602 100,380 0.51
507,096 507,620 2.59
Total bonds 13,623,265 13,457,858 68.65
Statement of investments as at December 31, 2019 (continued)
Triodos Impact Mixed Fund - Defensive
The accompanying notes form an integral part of these financial statements.
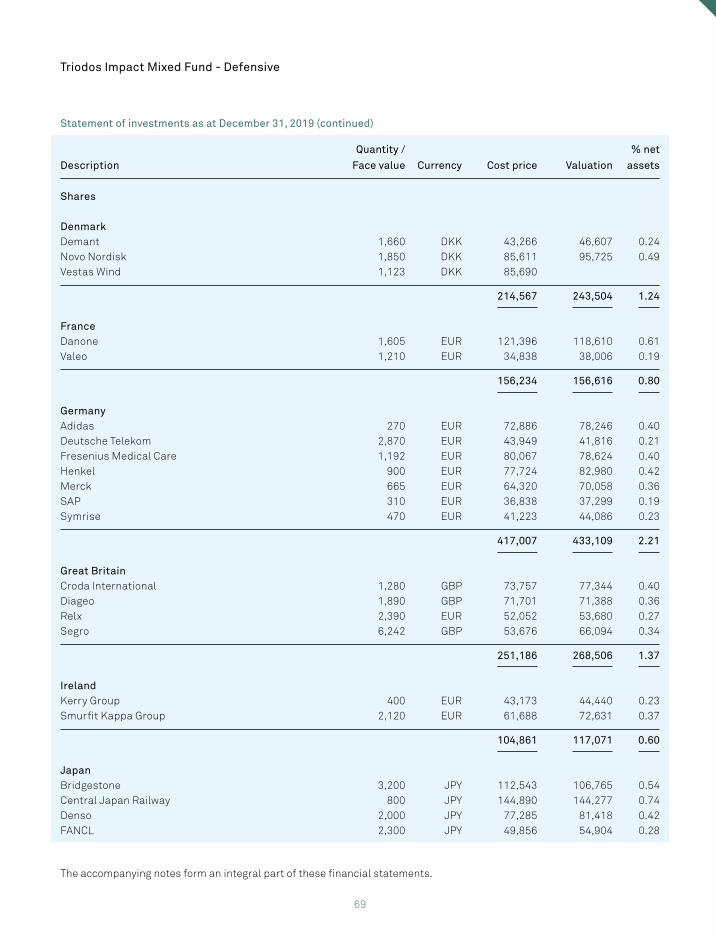
69
Description
Quantity /
Face value Currency Cost price Valuation
% net
assets
Shares
DenmarkDemant 1,660 DKK 43,266 46,607 0.24Novo Nordisk 1,850 DKK 85,611 95,725 0.49Vestas Wind 1,123 DKK 85,690
214,567 243,504 1.24
FranceDanone 1,605 EUR 121,396 118,610 0.61Valeo 1,210 EUR 34,838 38,006 0.19
156,234 156,616 0.80
GermanyAdidas 270 EUR 72,886 78,246 0.40Deutsche Telekom 2,870 EUR 43,949 41,816 0.21Fresenius Medical Care 1,192 EUR 80,067 78,624 0.40Henkel 900 EUR 77,724 82,980 0.42Merck 665 EUR 64,320 70,058 0.36SAP 310 EUR 36,838 37,299 0.19Symrise 470 EUR 41,223 44,086 0.23
417,007 433,109 2.21
Great BritainCroda International 1,280 GBP 73,757 77,344 0.40Diageo 1,890 GBP 71,701 71,388 0.36Relx 2,390 EUR 52,052 53,680 0.27Segro 6,242 GBP 53,676 66,094 0.34
251,186 268,506 1.37
IrelandKerry Group 400 EUR 43,173 44,440 0.23Smurfit Kappa Group 2,120 EUR 61,688 72,631 0.37
104,861 117,071 0.60
JapanBridgestone 3,200 JPY 112,543 106,765 0.54Central Japan Railway 800 JPY 144,890 144,277 0.74Denso 2,000 JPY 77,285 81,418 0.42FANCL 2,300 JPY 49,856 54,904 0.28
Statement of investments as at December 31, 2019 (continued)
Triodos Impact Mixed Fund - Defensive
The accompanying notes form an integral part of these financial statements.
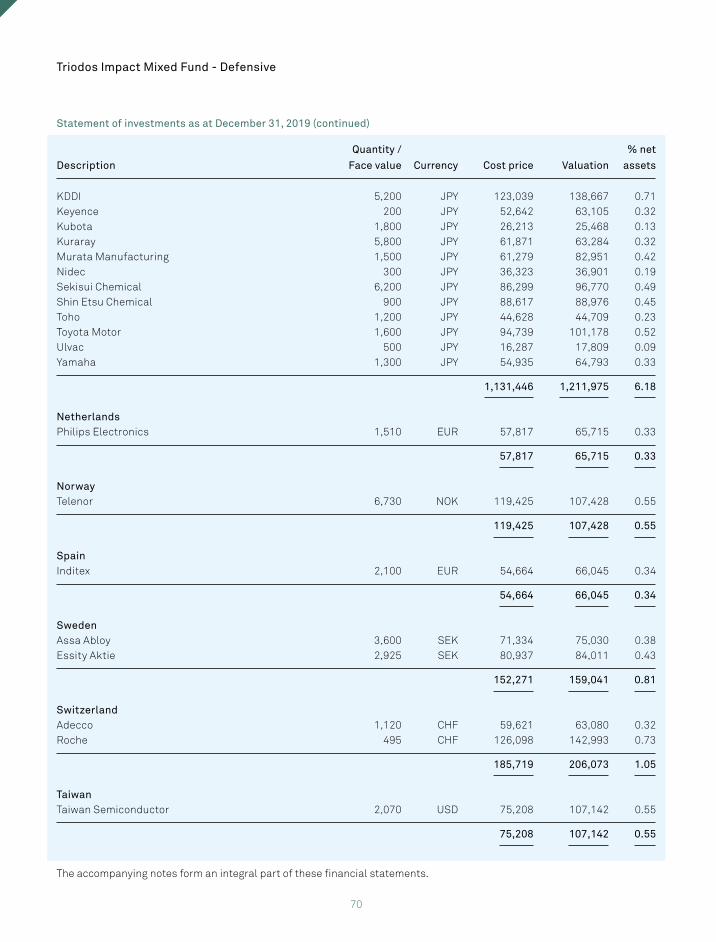
70
Description
Quantity /
Face value Currency Cost price Valuation
% net
assets
KDDI 5,200 JPY 123,039 138,667 0.71Keyence 200 JPY 52,642 63,105 0.32Kubota 1,800 JPY 26,213 25,468 0.13Kuraray 5,800 JPY 61,871 63,284 0.32Murata Manufacturing 1,500 JPY 61,279 82,951 0.42Nidec 300 JPY 36,323 36,901 0.19Sekisui Chemical 6,200 JPY 86,299 96,770 0.49Shin Etsu Chemical 900 JPY 88,617 88,976 0.45Toho 1,200 JPY 44,628 44,709 0.23Toyota Motor 1,600 JPY 94,739 101,178 0.52Ulvac 500 JPY 16,287 17,809 0.09Yamaha 1,300 JPY 54,935 64,793 0.33
1,131,446 1,211,975 6.18
NetherlandsPhilips Electronics 1,510 EUR 57,817 65,715 0.33
57,817 65,715 0.33
NorwayTelenor 6,730 NOK 119,425 107,428 0.55
119,425 107,428 0.55 SpainInditex 2,100 EUR 54,664 66,045 0.34
54,664 66,045 0.34
SwedenAssa Abloy 3,600 SEK 71,334 75,030 0.38Essity Aktie 2,925 SEK 80,937 84,011 0.43
152,271 159,041 0.81
SwitzerlandAdecco 1,120 CHF 59,621 63,080 0.32Roche 495 CHF 126,098 142,993 0.73
185,719 206,073 1.05
TaiwanTaiwan Semiconductor 2,070 USD 75,208 107,142 0.55
75,208 107,142 0.55
Statement of investments as at December 31, 2019 (continued)
Triodos Impact Mixed Fund - Defensive
The accompanying notes form an integral part of these financial statements.
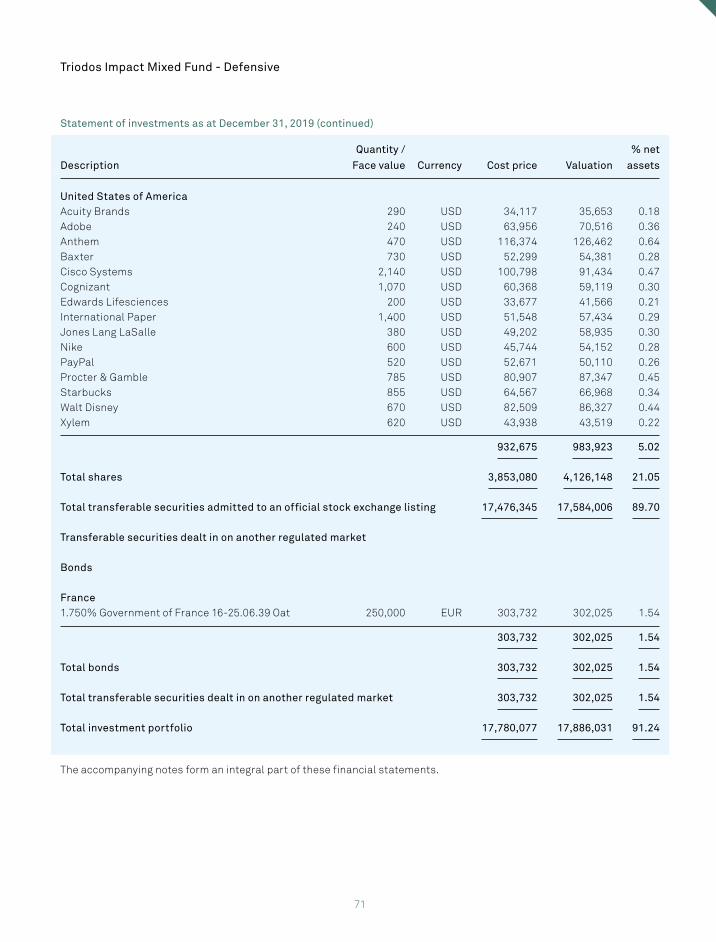
71
Description
Quantity /
Face value Currency Cost price Valuation
% net
assets
United States of AmericaAcuity Brands 290 USD 34,117 35,653 0.18Adobe 240 USD 63,956 70,516 0.36Anthem 470 USD 116,374 126,462 0.64Baxter 730 USD 52,299 54,381 0.28Cisco Systems 2,140 USD 100,798 91,434 0.47Cognizant 1,070 USD 60,368 59,119 0.30Edwards Lifesciences 200 USD 33,677 41,566 0.21International Paper 1,400 USD 51,548 57,434 0.29Jones Lang LaSalle 380 USD 49,202 58,935 0.30Nike 600 USD 45,744 54,152 0.28PayPal 520 USD 52,671 50,110 0.26Procter & Gamble 785 USD 80,907 87,347 0.45Starbucks 855 USD 64,567 66,968 0.34Walt Disney 670 USD 82,509 86,327 0.44Xylem 620 USD 43,938 43,519 0.22
932,675 983,923 5.02
Total shares 3,853,080 4,126,148 21.05
Total transferable securities admitted to an official stock exchange listing 17,476,345 17,584,006 89.70
Transferable securities dealt in on another regulated market
Bonds
France1.750% Government of France 16-25.06.39 Oat 250,000 EUR 303,732 302,025 1.54
303,732 302,025 1.54
Total bonds 303,732 302,025 1.54
Total transferable securities dealt in on another regulated market 303,732 302,025 1.54
Total investment portfolio 17,780,077 17,886,031 91.24
The accompanying notes form an integral part of these financial statements.
Statement of investments as at December 31, 2019 (continued)
Triodos Impact Mixed Fund - Defensive
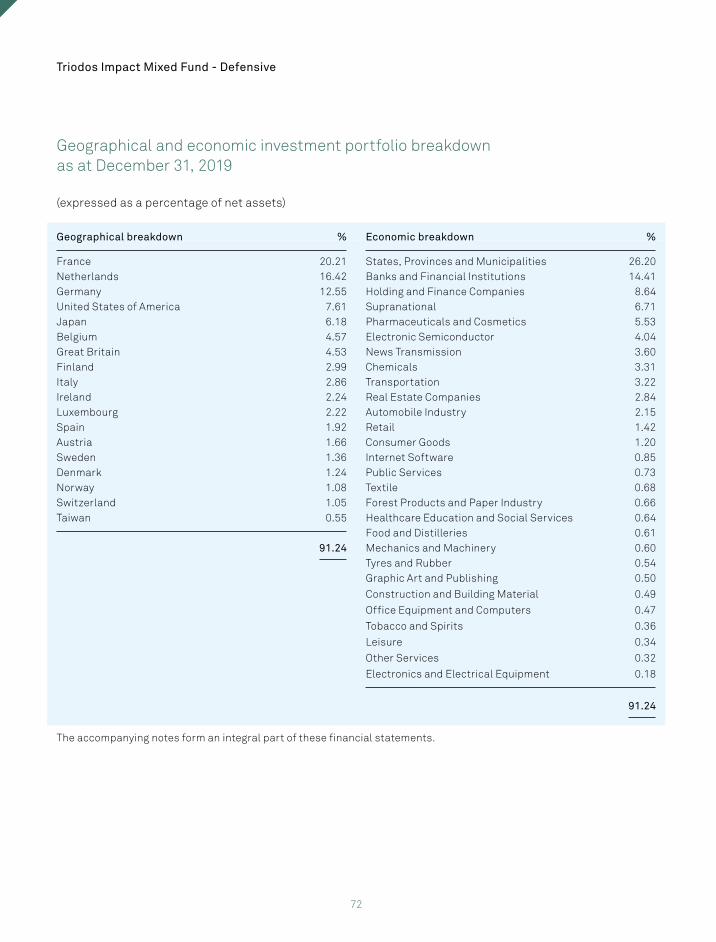
72
Geographical and economic investment portfolio breakdown as at December 31, 2019
(expressed as a percentage of net assets)
Geographical breakdown % Economic breakdown %
France 20.21 States, Provinces and Municipalities 26.20Netherlands 16.42 Banks and Financial Institutions 14.41Germany 12.55 Holding and Finance Companies 8.64United States of America 7.61 Supranational 6.71Japan 6.18 Pharmaceuticals and Cosmetics 5.53Belgium 4.57 Electronic Semiconductor 4.04Great Britain 4.53 News Transmission 3.60Finland 2.99 Chemicals 3.31Italy 2.86 Transportation 3.22Ireland 2.24 Real Estate Companies 2.84Luxembourg 2.22 Automobile Industry 2.15Spain 1.92 Retail 1.42Austria 1.66 Consumer Goods 1.20Sweden 1.36 Internet Software 0.85Denmark 1.24 Public Services 0.73Norway 1.08 Textile 0.68Switzerland 1.05 Forest Products and Paper Industry 0.66Taiwan 0.55 Healthcare Education and Social Services 0.64
Food and Distilleries 0.6191.24 Mechanics and Machinery 0.60
Tyres and Rubber 0.54Graphic Art and Publishing 0.50
Construction and Building Material 0.49
Office Equipment and Computers 0.47
Tobacco and Spirits 0.36
Leisure 0.34
Other Services 0.32
Electronics and Electrical Equipment 0.18
91.24
The accompanying notes form an integral part of these financial statements.
Triodos Impact Mixed Fund - Defensive
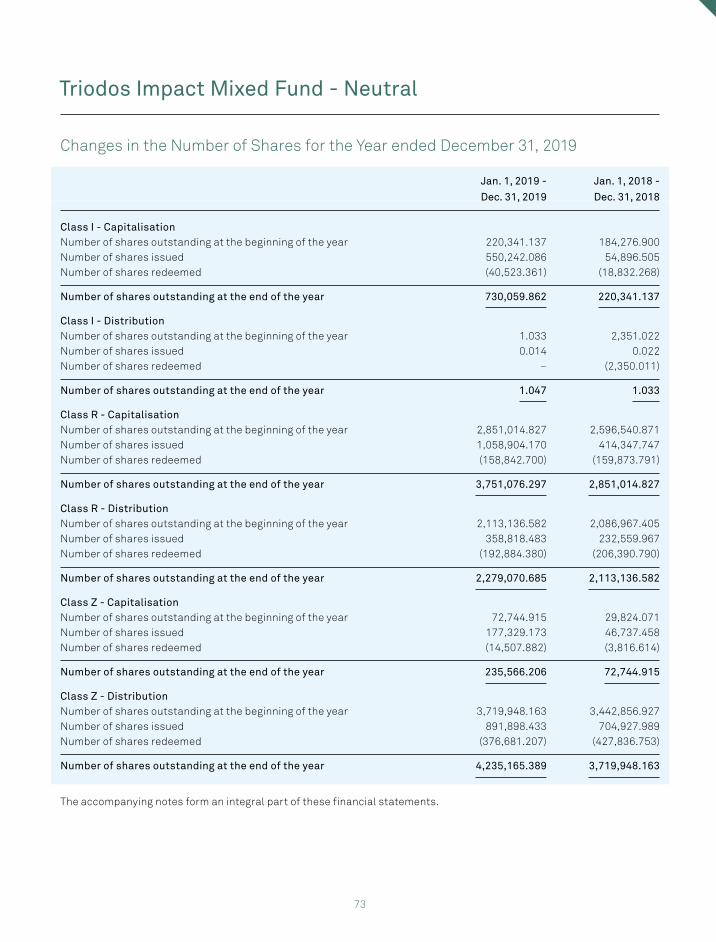
73
Changes in the Number of Shares for the Year ended December 31, 2019
Jan. 1, 2019 -
Dec. 31, 2019
Jan. 1, 2018 -
Dec. 31, 2018
Class I - CapitalisationNumber of shares outstanding at the beginning of the year 220,341.137 184,276.900Number of shares issued 550,242.086 54,896.505Number of shares redeemed (40,523.361) (18,832.268)
Number of shares outstanding at the end of the year 730,059.862 220,341.137
Class I - DistributionNumber of shares outstanding at the beginning of the year 1.033 2,351.022Number of shares issued 0.014 0.022Number of shares redeemed – (2,350.011)
Number of shares outstanding at the end of the year 1.047 1.033
Class R - CapitalisationNumber of shares outstanding at the beginning of the year 2,851,014.827 2,596,540.871Number of shares issued 1,058,904.170 414,347.747Number of shares redeemed (158,842.700) (159,873.791)
Number of shares outstanding at the end of the year 3,751,076.297 2,851,014.827
Class R - DistributionNumber of shares outstanding at the beginning of the year 2,113,136.582 2,086,967.405Number of shares issued 358,818.483 232,559.967Number of shares redeemed (192,884.380) (206,390.790)
Number of shares outstanding at the end of the year 2,279,070.685 2,113,136.582
Class Z - CapitalisationNumber of shares outstanding at the beginning of the year 72,744.915 29,824.071Number of shares issued 177,329.173 46,737.458Number of shares redeemed (14,507.882) (3,816.614)
Number of shares outstanding at the end of the year 235,566.206 72,744.915
Class Z - DistributionNumber of shares outstanding at the beginning of the year 3,719,948.163 3,442,856.927Number of shares issued 891,898.433 704,927.989Number of shares redeemed (376,681.207) (427,836.753)
Number of shares outstanding at the end of the year 4,235,165.389 3,719,948.163
The accompanying notes form an integral part of these financial statements.
Triodos Impact Mixed Fund - Neutral
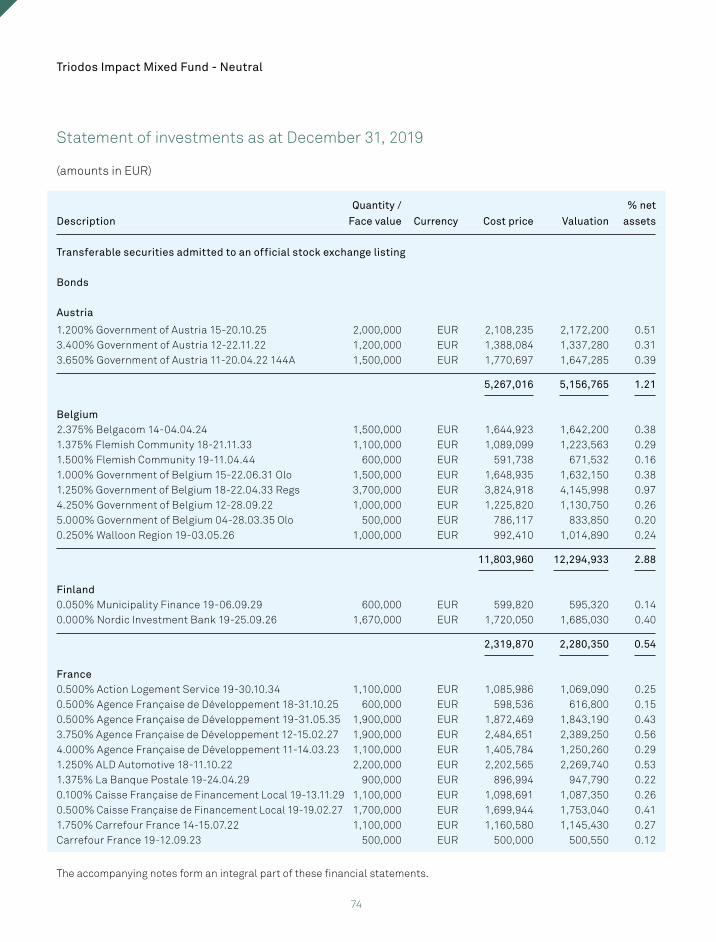
74
Statement of investments as at December 31, 2019
(amounts in EUR)
Description
Quantity /
Face value Currency Cost price Valuation
% net
assets
Transferable securities admitted to an official stock exchange listing
Bonds
Austria
1.200% Government of Austria 15-20.10.25 2,000,000 EUR 2,108,235 2,172,200 0.513.400% Government of Austria 12-22.11.22 1,200,000 EUR 1,388,084 1,337,280 0.313.650% Government of Austria 11-20.04.22 144A 1,500,000 EUR 1,770,697 1,647,285 0.39
5,267,016 5,156,765 1.21
Belgium2.375% Belgacom 14-04.04.24 1,500,000 EUR 1,644,923 1,642,200 0.381.375% Flemish Community 18-21.11.33 1,100,000 EUR 1,089,099 1,223,563 0.291.500% Flemish Community 19-11.04.44 600,000 EUR 591,738 671,532 0.161.000% Government of Belgium 15-22.06.31 Olo 1,500,000 EUR 1,648,935 1,632,150 0.381.250% Government of Belgium 18-22.04.33 Regs 3,700,000 EUR 3,824,918 4,145,998 0.974.250% Government of Belgium 12-28.09.22 1,000,000 EUR 1,225,820 1,130,750 0.265.000% Government of Belgium 04-28.03.35 Olo 500,000 EUR 786,117 833,850 0.200.250% Walloon Region 19-03.05.26 1,000,000 EUR 992,410 1,014,890 0.24
11,803,960 12,294,933 2.88
Finland0.050% Municipality Finance 19-06.09.29 600,000 EUR 599,820 595,320 0.140.000% Nordic Investment Bank 19-25.09.26 1,670,000 EUR 1,720,050 1,685,030 0.40
2,319,870 2,280,350 0.54
France0.500% Action Logement Service 19-30.10.34 1,100,000 EUR 1,085,986 1,069,090 0.250.500% Agence Française de Développement 18-31.10.25 600,000 EUR 598,536 616,800 0.150.500% Agence Française de Développement 19-31.05.35 1,900,000 EUR 1,872,469 1,843,190 0.433.750% Agence Française de Développement 12-15.02.27 1,900,000 EUR 2,484,651 2,389,250 0.564.000% Agence Française de Développement 11-14.03.23 1,100,000 EUR 1,405,784 1,250,260 0.291.250% ALD Automotive 18-11.10.22 2,200,000 EUR 2,202,565 2,269,740 0.531.375% La Banque Postale 19-24.04.29 900,000 EUR 896,994 947,790 0.220.100% Caisse Française de Financement Local 19-13.11.29 1,100,000 EUR 1,098,691 1,087,350 0.260.500% Caisse Française de Financement Local 19-19.02.27 1,700,000 EUR 1,699,944 1,753,040 0.411.750% Carrefour France 14-15.07.22 1,100,000 EUR 1,160,580 1,145,430 0.27Carrefour France 19-12.09.23 500,000 EUR 500,000 500,550 0.12
Triodos Impact Mixed Fund - Neutral
The accompanying notes form an integral part of these financial statements.
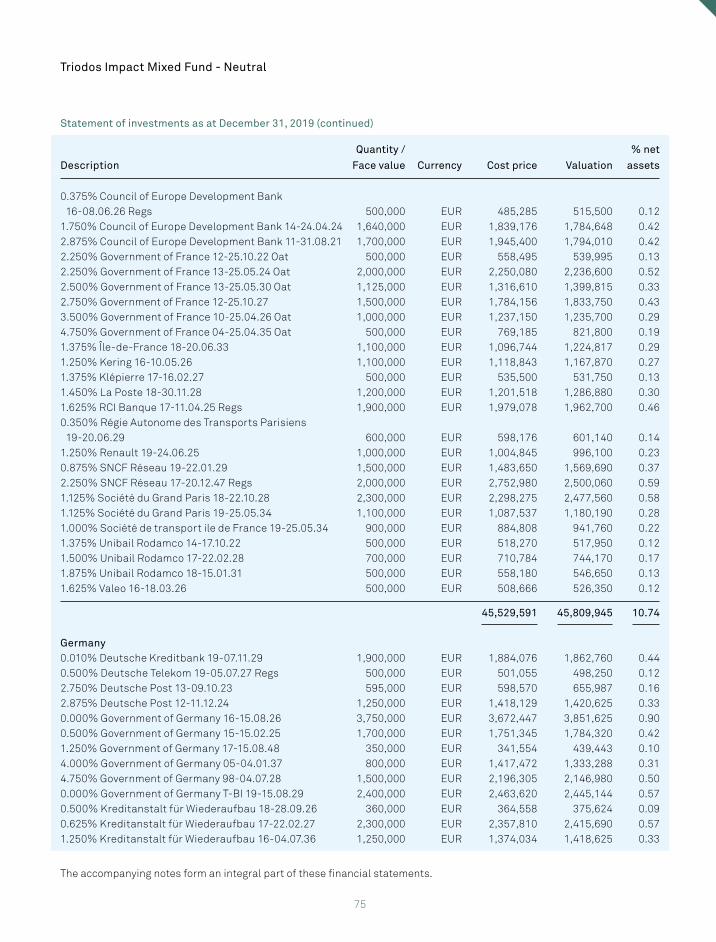
75
Description
Quantity /
Face value Currency Cost price Valuation
% net
assets
0.375% Council of Europe Development Bank 16-08.06.26 Regs 500,000 EUR 485,285 515,500 0.121.750% Council of Europe Development Bank 14-24.04.24 1,640,000 EUR 1,839,176 1,784,648 0.422.875% Council of Europe Development Bank 11-31.08.21 1,700,000 EUR 1,945,400 1,794,010 0.422.250% Government of France 12-25.10.22 Oat 500,000 EUR 558,495 539,995 0.132.250% Government of France 13-25.05.24 Oat 2,000,000 EUR 2,250,080 2,236,600 0.522.500% Government of France 13-25.05.30 Oat 1,125,000 EUR 1,316,610 1,399,815 0.332.750% Government of France 12-25.10.27 1,500,000 EUR 1,784,156 1,833,750 0.433.500% Government of France 10-25.04.26 Oat 1,000,000 EUR 1,237,150 1,235,700 0.294.750% Government of France 04-25.04.35 Oat 500,000 EUR 769,185 821,800 0.191.375% Île-de-France 18-20.06.33 1,100,000 EUR 1,096,744 1,224,817 0.291.250% Kering 16-10.05.26 1,100,000 EUR 1,118,843 1,167,870 0.271.375% Klépierre 17-16.02.27 500,000 EUR 535,500 531,750 0.131.450% La Poste 18-30.11.28 1,200,000 EUR 1,201,518 1,286,880 0.301.625% RCI Banque 17-11.04.25 Regs 1,900,000 EUR 1,979,078 1,962,700 0.460.350% Régie Autonome des Transports Parisiens 19-20.06.29 600,000 EUR 598,176 601,140 0.141.250% Renault 19-24.06.25 1,000,000 EUR 1,004,845 996,100 0.230.875% SNCF Réseau 19-22.01.29 1,500,000 EUR 1,483,650 1,569,690 0.372.250% SNCF Réseau 17-20.12.47 Regs 2,000,000 EUR 2,752,980 2,500,060 0.591.125% Société du Grand Paris 18-22.10.28 2,300,000 EUR 2,298,275 2,477,560 0.581.125% Société du Grand Paris 19-25.05.34 1,100,000 EUR 1,087,537 1,180,190 0.281.000% Société de transport ile de France 19-25.05.34 900,000 EUR 884,808 941,760 0.221.375% Unibail Rodamco 14-17.10.22 500,000 EUR 518,270 517,950 0.121.500% Unibail Rodamco 17-22.02.28 700,000 EUR 710,784 744,170 0.171.875% Unibail Rodamco 18-15.01.31 500,000 EUR 558,180 546,650 0.131.625% Valeo 16-18.03.26 500,000 EUR 508,666 526,350 0.12
45,529,591 45,809,945 10.74
Germany0.010% Deutsche Kreditbank 19-07.11.29 1,900,000 EUR 1,884,076 1,862,760 0.440.500% Deutsche Telekom 19-05.07.27 Regs 500,000 EUR 501,055 498,250 0.122.750% Deutsche Post 13-09.10.23 595,000 EUR 598,570 655,987 0.162.875% Deutsche Post 12-11.12.24 1,250,000 EUR 1,418,129 1,420,625 0.330.000% Government of Germany 16-15.08.26 3,750,000 EUR 3,672,447 3,851,625 0.900.500% Government of Germany 15-15.02.25 1,700,000 EUR 1,751,345 1,784,320 0.421.250% Government of Germany 17-15.08.48 350,000 EUR 341,554 439,443 0.104.000% Government of Germany 05-04.01.37 800,000 EUR 1,417,472 1,333,288 0.314.750% Government of Germany 98-04.07.28 1,500,000 EUR 2,196,305 2,146,980 0.500.000% Government of Germany T-BI 19-15.08.29 2,400,000 EUR 2,463,620 2,445,144 0.570.500% Kreditanstalt für Wiederaufbau 18-28.09.26 360,000 EUR 364,558 375,624 0.090.625% Kreditanstalt für Wiederaufbau 17-22.02.27 2,300,000 EUR 2,357,810 2,415,690 0.571.250% Kreditanstalt für Wiederaufbau 16-04.07.36 1,250,000 EUR 1,374,034 1,418,625 0.33
Statement of investments as at December 31, 2019 (continued)
Triodos Impact Mixed Fund - Neutral
The accompanying notes form an integral part of these financial statements.
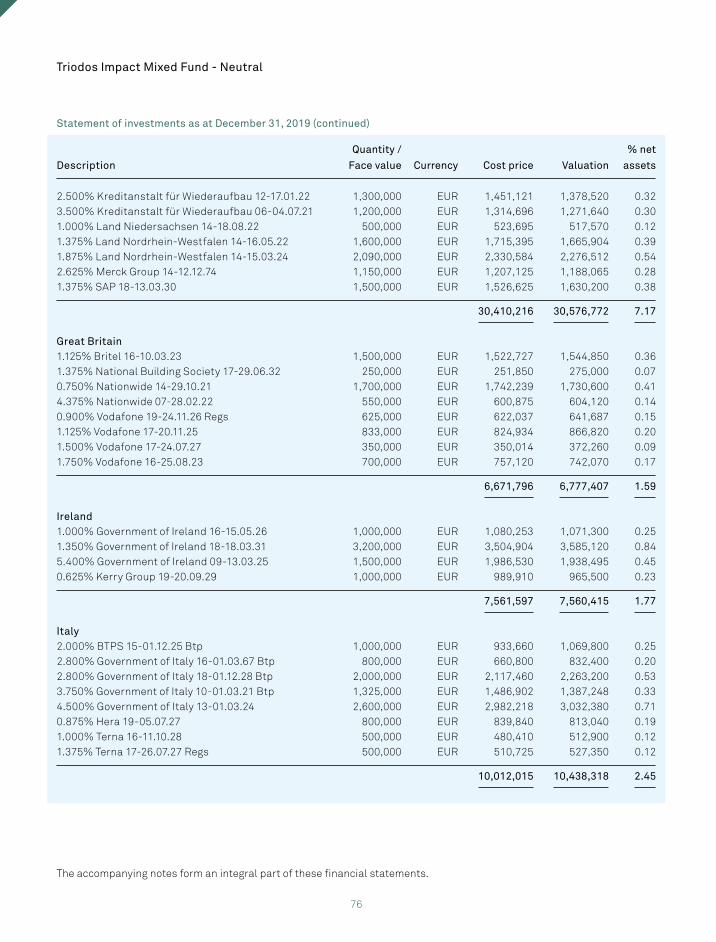
76
Description
Quantity /
Face value Currency Cost price Valuation
% net
assets
2.500% Kreditanstalt für Wiederaufbau 12-17.01.22 1,300,000 EUR 1,451,121 1,378,520 0.323.500% Kreditanstalt für Wiederaufbau 06-04.07.21 1,200,000 EUR 1,314,696 1,271,640 0.301.000% Land Niedersachsen 14-18.08.22 500,000 EUR 523,695 517,570 0.121.375% Land Nordrhein-Westfalen 14-16.05.22 1,600,000 EUR 1,715,395 1,665,904 0.391.875% Land Nordrhein-Westfalen 14-15.03.24 2,090,000 EUR 2,330,584 2,276,512 0.542.625% Merck Group 14-12.12.74 1,150,000 EUR 1,207,125 1,188,065 0.281.375% SAP 18-13.03.30 1,500,000 EUR 1,526,625 1,630,200 0.38
30,410,216 30,576,772 7.17
Great Britain1.125% Britel 16-10.03.23 1,500,000 EUR 1,522,727 1,544,850 0.361.375% National Building Society 17-29.06.32 250,000 EUR 251,850 275,000 0.070.750% Nationwide 14-29.10.21 1,700,000 EUR 1,742,239 1,730,600 0.414.375% Nationwide 07-28.02.22 550,000 EUR 600,875 604,120 0.140.900% Vodafone 19-24.11.26 Regs 625,000 EUR 622,037 641,687 0.151.125% Vodafone 17-20.11.25 833,000 EUR 824,934 866,820 0.201.500% Vodafone 17-24.07.27 350,000 EUR 350,014 372,260 0.091.750% Vodafone 16-25.08.23 700,000 EUR 757,120 742,070 0.17
6,671,796 6,777,407 1.59
Ireland1.000% Government of Ireland 16-15.05.26 1,000,000 EUR 1,080,253 1,071,300 0.251.350% Government of Ireland 18-18.03.31 3,200,000 EUR 3,504,904 3,585,120 0.845.400% Government of Ireland 09-13.03.25 1,500,000 EUR 1,986,530 1,938,495 0.450.625% Kerry Group 19-20.09.29 1,000,000 EUR 989,910 965,500 0.23
7,561,597 7,560,415 1.77
Italy2.000% BTPS 15-01.12.25 Btp 1,000,000 EUR 933,660 1,069,800 0.252.800% Government of Italy 16-01.03.67 Btp 800,000 EUR 660,800 832,400 0.202.800% Government of Italy 18-01.12.28 Btp 2,000,000 EUR 2,117,460 2,263,200 0.533.750% Government of Italy 10-01.03.21 Btp 1,325,000 EUR 1,486,902 1,387,248 0.334.500% Government of Italy 13-01.03.24 2,600,000 EUR 2,982,218 3,032,380 0.710.875% Hera 19-05.07.27 800,000 EUR 839,840 813,040 0.191.000% Terna 16-11.10.28 500,000 EUR 480,410 512,900 0.121.375% Terna 17-26.07.27 Regs 500,000 EUR 510,725 527,350 0.12
10,012,015 10,438,318 2.45
Statement of investments as at December 31, 2019 (continued)
Triodos Impact Mixed Fund - Neutral
The accompanying notes form an integral part of these financial statements.
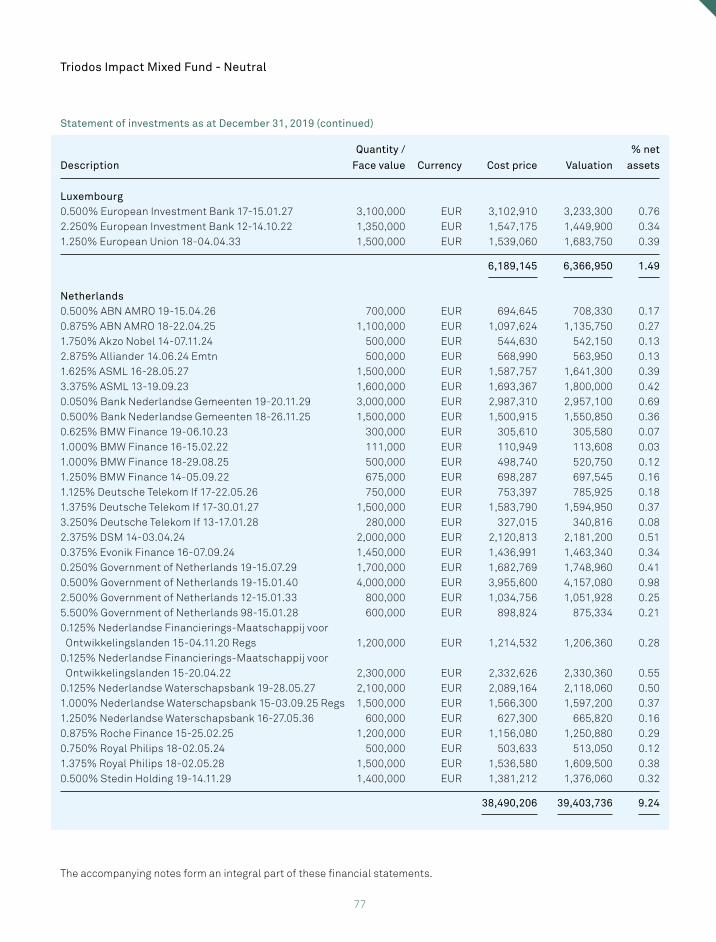
77
Description
Quantity /
Face value Currency Cost price Valuation
% net
assets
Luxembourg0.500% European Investment Bank 17-15.01.27 3,100,000 EUR 3,102,910 3,233,300 0.762.250% European Investment Bank 12-14.10.22 1,350,000 EUR 1,547,175 1,449,900 0.341.250% European Union 18-04.04.33 1,500,000 EUR 1,539,060 1,683,750 0.39
6,189,145 6,366,950 1.49
Netherlands0.500% ABN AMRO 19-15.04.26 700,000 EUR 694,645 708,330 0.170.875% ABN AMRO 18-22.04.25 1,100,000 EUR 1,097,624 1,135,750 0.271.750% Akzo Nobel 14-07.11.24 500,000 EUR 544,630 542,150 0.132.875% Alliander 14.06.24 Emtn 500,000 EUR 568,990 563,950 0.131.625% ASML 16-28.05.27 1,500,000 EUR 1,587,757 1,641,300 0.393.375% ASML 13-19.09.23 1,600,000 EUR 1,693,367 1,800,000 0.420.050% Bank Nederlandse Gemeenten 19-20.11.29 3,000,000 EUR 2,987,310 2,957,100 0.690.500% Bank Nederlandse Gemeenten 18-26.11.25 1,500,000 EUR 1,500,915 1,550,850 0.360.625% BMW Finance 19-06.10.23 300,000 EUR 305,610 305,580 0.071.000% BMW Finance 16-15.02.22 111,000 EUR 110,949 113,608 0.031.000% BMW Finance 18-29.08.25 500,000 EUR 498,740 520,750 0.121.250% BMW Finance 14-05.09.22 675,000 EUR 698,287 697,545 0.161.125% Deutsche Telekom If 17-22.05.26 750,000 EUR 753,397 785,925 0.181.375% Deutsche Telekom If 17-30.01.27 1,500,000 EUR 1,583,790 1,594,950 0.373.250% Deutsche Telekom If 13-17.01.28 280,000 EUR 327,015 340,816 0.082.375% DSM 14-03.04.24 2,000,000 EUR 2,120,813 2,181,200 0.510.375% Evonik Finance 16-07.09.24 1,450,000 EUR 1,436,991 1,463,340 0.340.250% Government of Netherlands 19-15.07.29 1,700,000 EUR 1,682,769 1,748,960 0.410.500% Government of Netherlands 19-15.01.40 4,000,000 EUR 3,955,600 4,157,080 0.982.500% Government of Netherlands 12-15.01.33 800,000 EUR 1,034,756 1,051,928 0.255.500% Government of Netherlands 98-15.01.28 600,000 EUR 898,824 875,334 0.210.125% Nederlandse Financierings-Maatschappij voor Ontwikkelingslanden 15-04.11.20 Regs 1,200,000 EUR 1,214,532 1,206,360 0.280.125% Nederlandse Financierings-Maatschappij voor Ontwikkelingslanden 15-20.04.22 2,300,000 EUR 2,332,626 2,330,360 0.550.125% Nederlandse Waterschapsbank 19-28.05.27 2,100,000 EUR 2,089,164 2,118,060 0.501.000% Nederlandse Waterschapsbank 15-03.09.25 Regs 1,500,000 EUR 1,566,300 1,597,200 0.371.250% Nederlandse Waterschapsbank 16-27.05.36 600,000 EUR 627,300 665,820 0.160.875% Roche Finance 15-25.02.25 1,200,000 EUR 1,156,080 1,250,880 0.290.750% Royal Philips 18-02.05.24 500,000 EUR 503,633 513,050 0.121.375% Royal Philips 18-02.05.28 1,500,000 EUR 1,536,580 1,609,500 0.380.500% Stedin Holding 19-14.11.29 1,400,000 EUR 1,381,212 1,376,060 0.32
38,490,206 39,403,736 9.24
Statement of investments as at December 31, 2019 (continued)
Triodos Impact Mixed Fund - Neutral
The accompanying notes form an integral part of these financial statements.
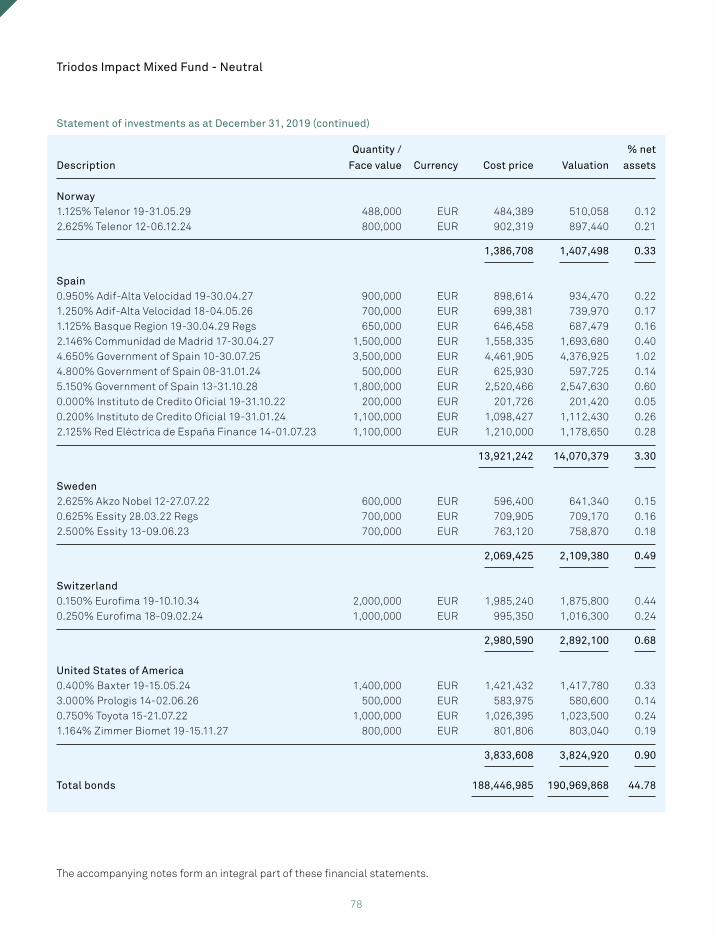
78
Description
Quantity /
Face value Currency Cost price Valuation
% net
assets
Norway1.125% Telenor 19-31.05.29 488,000 EUR 484,389 510,058 0.122.625% Telenor 12-06.12.24 800,000 EUR 902,319 897,440 0.21
1,386,708 1,407,498 0.33
Spain0.950% Adif-Alta Velocidad 19-30.04.27 900,000 EUR 898,614 934,470 0.221.250% Adif-Alta Velocidad 18-04.05.26 700,000 EUR 699,381 739,970 0.171.125% Basque Region 19-30.04.29 Regs 650,000 EUR 646,458 687,479 0.162.146% Communidad de Madrid 17-30.04.27 1,500,000 EUR 1,558,335 1,693,680 0.404.650% Government of Spain 10-30.07.25 3,500,000 EUR 4,461,905 4,376,925 1.024.800% Government of Spain 08-31.01.24 500,000 EUR 625,930 597,725 0.145.150% Government of Spain 13-31.10.28 1,800,000 EUR 2,520,466 2,547,630 0.600.000% Instituto de Credito Oficial 19-31.10.22 200,000 EUR 201,726 201,420 0.050.200% Instituto de Credito Oficial 19-31.01.24 1,100,000 EUR 1,098,427 1,112,430 0.262.125% Red Eléctrica de España Finance 14-01.07.23 1,100,000 EUR 1,210,000 1,178,650 0.28
13,921,242 14,070,379 3.30 Sweden2.625% Akzo Nobel 12-27.07.22 600,000 EUR 596,400 641,340 0.150.625% Essity 28.03.22 Regs 700,000 EUR 709,905 709,170 0.162.500% Essity 13-09.06.23 700,000 EUR 763,120 758,870 0.18
2,069,425 2,109,380 0.49
Switzerland0.150% Eurofima 19-10.10.34 2,000,000 EUR 1,985,240 1,875,800 0.440.250% Eurofima 18-09.02.24 1,000,000 EUR 995,350 1,016,300 0.24
2,980,590 2,892,100 0.68
United States of America0.400% Baxter 19-15.05.24 1,400,000 EUR 1,421,432 1,417,780 0.333.000% Prologis 14-02.06.26 500,000 EUR 583,975 580,600 0.140.750% Toyota 15-21.07.22 1,000,000 EUR 1,026,395 1,023,500 0.241.164% Zimmer Biomet 19-15.11.27 800,000 EUR 801,806 803,040 0.19
3,833,608 3,824,920 0.90
Total bonds 188,446,985 190,969,868 44.78
Statement of investments as at December 31, 2019 (continued)
Triodos Impact Mixed Fund - Neutral
The accompanying notes form an integral part of these financial statements.
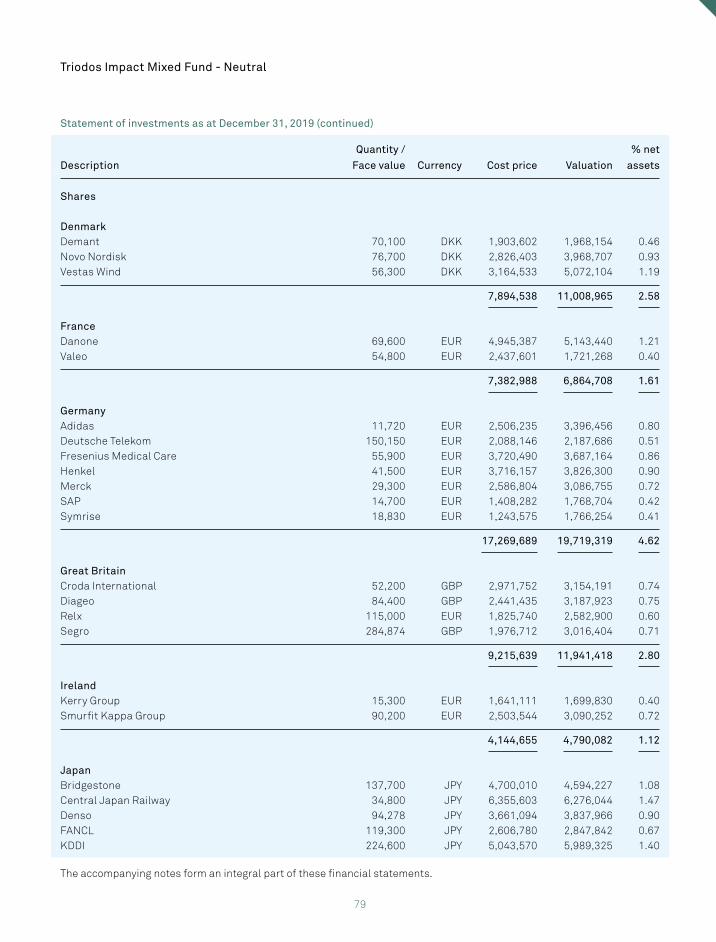
79
Description
Quantity /
Face value Currency Cost price Valuation
% net
assets
Shares
DenmarkDemant 70,100 DKK 1,903,602 1,968,154 0.46Novo Nordisk 76,700 DKK 2,826,403 3,968,707 0.93Vestas Wind 56,300 DKK 3,164,533 5,072,104 1.19
7,894,538 11,008,965 2.58
FranceDanone 69,600 EUR 4,945,387 5,143,440 1.21Valeo 54,800 EUR 2,437,601 1,721,268 0.40
7,382,988 6,864,708 1.61
GermanyAdidas 11,720 EUR 2,506,235 3,396,456 0.80Deutsche Telekom 150,150 EUR 2,088,146 2,187,686 0.51Fresenius Medical Care 55,900 EUR 3,720,490 3,687,164 0.86Henkel 41,500 EUR 3,716,157 3,826,300 0.90Merck 29,300 EUR 2,586,804 3,086,755 0.72SAP 14,700 EUR 1,408,282 1,768,704 0.42Symrise 18,830 EUR 1,243,575 1,766,254 0.41
17,269,689 19,719,319 4.62
Great BritainCroda International 52,200 GBP 2,971,752 3,154,191 0.74Diageo 84,400 GBP 2,441,435 3,187,923 0.75Relx 115,000 EUR 1,825,740 2,582,900 0.60Segro 284,874 GBP 1,976,712 3,016,404 0.71
9,215,639 11,941,418 2.80
IrelandKerry Group 15,300 EUR 1,641,111 1,699,830 0.40Smurfit Kappa Group 90,200 EUR 2,503,544 3,090,252 0.72
4,144,655 4,790,082 1.12
JapanBridgestone 137,700 JPY 4,700,010 4,594,227 1.08Central Japan Railway 34,800 JPY 6,355,603 6,276,044 1.47Denso 94,278 JPY 3,661,094 3,837,966 0.90FANCL 119,300 JPY 2,606,780 2,847,842 0.67KDDI 224,600 JPY 5,043,570 5,989,325 1.40
Statement of investments as at December 31, 2019 (continued)
Triodos Impact Mixed Fund - Neutral
The accompanying notes form an integral part of these financial statements.
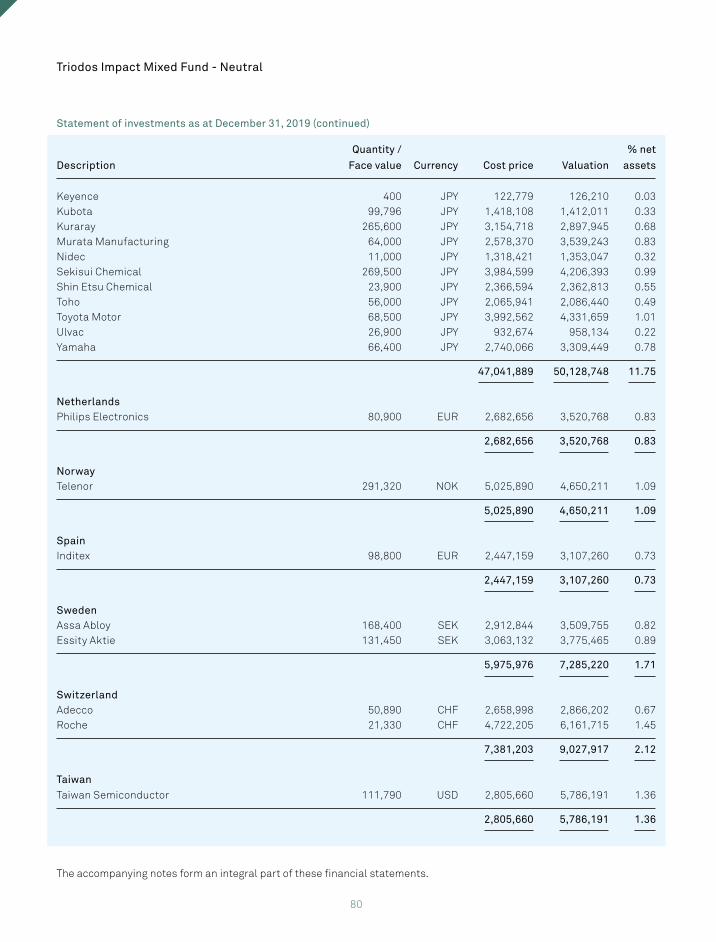
80
Description
Quantity /
Face value Currency Cost price Valuation
% net
assets
Keyence 400 JPY 122,779 126,210 0.03Kubota 99,796 JPY 1,418,108 1,412,011 0.33Kuraray 265,600 JPY 3,154,718 2,897,945 0.68Murata Manufacturing 64,000 JPY 2,578,370 3,539,243 0.83Nidec 11,000 JPY 1,318,421 1,353,047 0.32Sekisui Chemical 269,500 JPY 3,984,599 4,206,393 0.99Shin Etsu Chemical 23,900 JPY 2,366,594 2,362,813 0.55Toho 56,000 JPY 2,065,941 2,086,440 0.49Toyota Motor 68,500 JPY 3,992,562 4,331,659 1.01Ulvac 26,900 JPY 932,674 958,134 0.22Yamaha 66,400 JPY 2,740,066 3,309,449 0.78
47,041,889 50,128,748 11.75
NetherlandsPhilips Electronics 80,900 EUR 2,682,656 3,520,768 0.83
2,682,656 3,520,768 0.83
NorwayTelenor 291,320 NOK 5,025,890 4,650,211 1.09
5,025,890 4,650,211 1.09
SpainInditex 98,800 EUR 2,447,159 3,107,260 0.73
2,447,159 3,107,260 0.73
SwedenAssa Abloy 168,400 SEK 2,912,844 3,509,755 0.82Essity Aktie 131,450 SEK 3,063,132 3,775,465 0.89
5,975,976 7,285,220 1.71
SwitzerlandAdecco 50,890 CHF 2,658,998 2,866,202 0.67Roche 21,330 CHF 4,722,205 6,161,715 1.45
7,381,203 9,027,917 2.12
TaiwanTaiwan Semiconductor 111,790 USD 2,805,660 5,786,191 1.36
2,805,660 5,786,191 1.36
Statement of investments as at December 31, 2019 (continued)
Triodos Impact Mixed Fund - Neutral
The accompanying notes form an integral part of these financial statements.
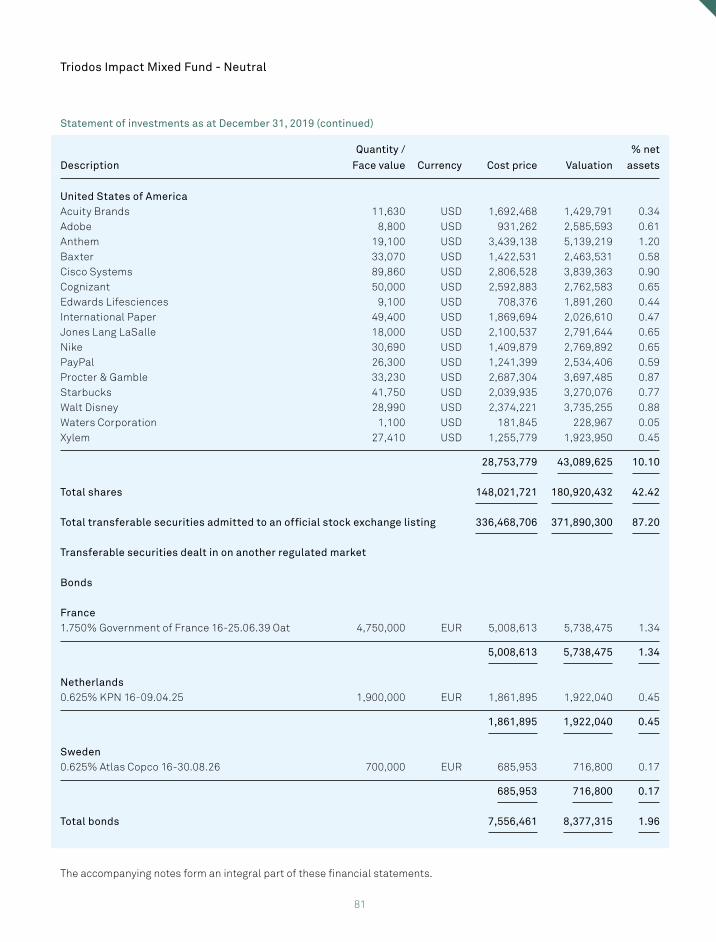
81
Description
Quantity /
Face value Currency Cost price Valuation
% net
assets
United States of AmericaAcuity Brands 11,630 USD 1,692,468 1,429,791 0.34Adobe 8,800 USD 931,262 2,585,593 0.61Anthem 19,100 USD 3,439,138 5,139,219 1.20Baxter 33,070 USD 1,422,531 2,463,531 0.58Cisco Systems 89,860 USD 2,806,528 3,839,363 0.90Cognizant 50,000 USD 2,592,883 2,762,583 0.65Edwards Lifesciences 9,100 USD 708,376 1,891,260 0.44International Paper 49,400 USD 1,869,694 2,026,610 0.47Jones Lang LaSalle 18,000 USD 2,100,537 2,791,644 0.65Nike 30,690 USD 1,409,879 2,769,892 0.65PayPal 26,300 USD 1,241,399 2,534,406 0.59Procter & Gamble 33,230 USD 2,687,304 3,697,485 0.87Starbucks 41,750 USD 2,039,935 3,270,076 0.77Walt Disney 28,990 USD 2,374,221 3,735,255 0.88Waters Corporation 1,100 USD 181,845 228,967 0.05Xylem 27,410 USD 1,255,779 1,923,950 0.45
28,753,779 43,089,625 10.10
Total shares 148,021,721 180,920,432 42.42
Total transferable securities admitted to an official stock exchange listing 336,468,706 371,890,300 87.20
Transferable securities dealt in on another regulated market
Bonds
France1.750% Government of France 16-25.06.39 Oat 4,750,000 EUR 5,008,613 5,738,475 1.34
5,008,613 5,738,475 1.34
Netherlands0.625% KPN 16-09.04.25 1,900,000 EUR 1,861,895 1,922,040 0.45
1,861,895 1,922,040 0.45
Sweden0.625% Atlas Copco 16-30.08.26 700,000 EUR 685,953 716,800 0.17
685,953 716,800 0.17
Total bonds 7,556,461 8,377,315 1.96
Statement of investments as at December 31, 2019 (continued)
Triodos Impact Mixed Fund - Neutral
The accompanying notes form an integral part of these financial statements.
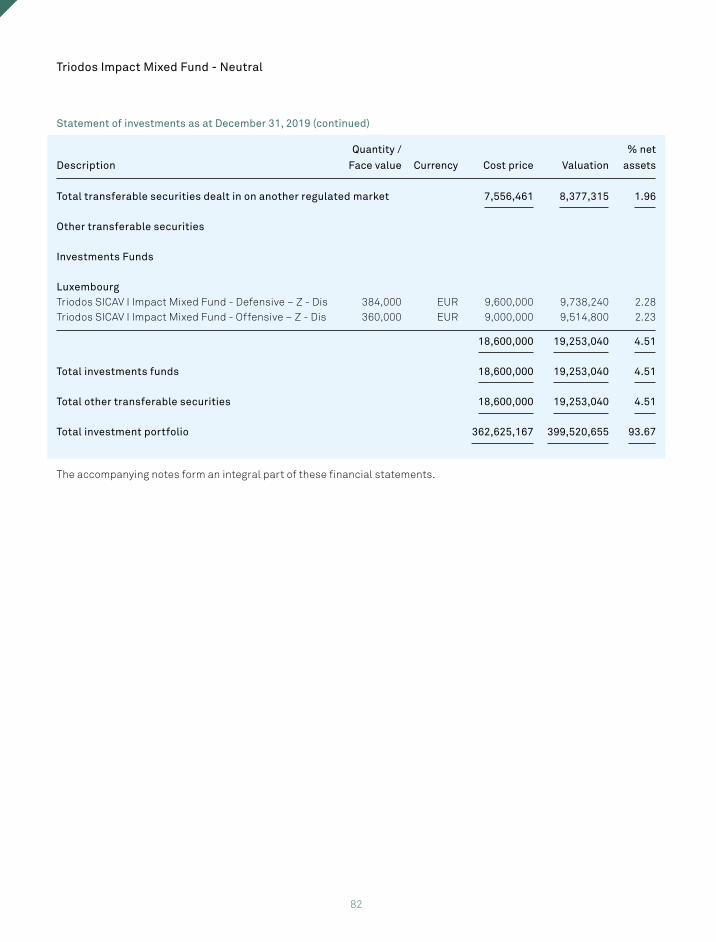
82
Description
Quantity /
Face value Currency Cost price Valuation
% net
assets
Total transferable securities dealt in on another regulated market 7,556,461 8,377,315 1.96
Other transferable securities
Investments Funds
LuxembourgTriodos SICAV I Impact Mixed Fund - Defensive – Z - Dis 384,000 EUR 9,600,000 9,738,240 2.28Triodos SICAV I Impact Mixed Fund - Offensive – Z - Dis 360,000 EUR 9,000,000 9,514,800 2.23
18,600,000 19,253,040 4.51
Total investments funds 18,600,000 19,253,040 4.51
Total other transferable securities 18,600,000 19,253,040 4.51
Total investment portfolio 362,625,167 399,520,655 93.67
The accompanying notes form an integral part of these financial statements.
Statement of investments as at December 31, 2019 (continued)
Triodos Impact Mixed Fund - Neutral
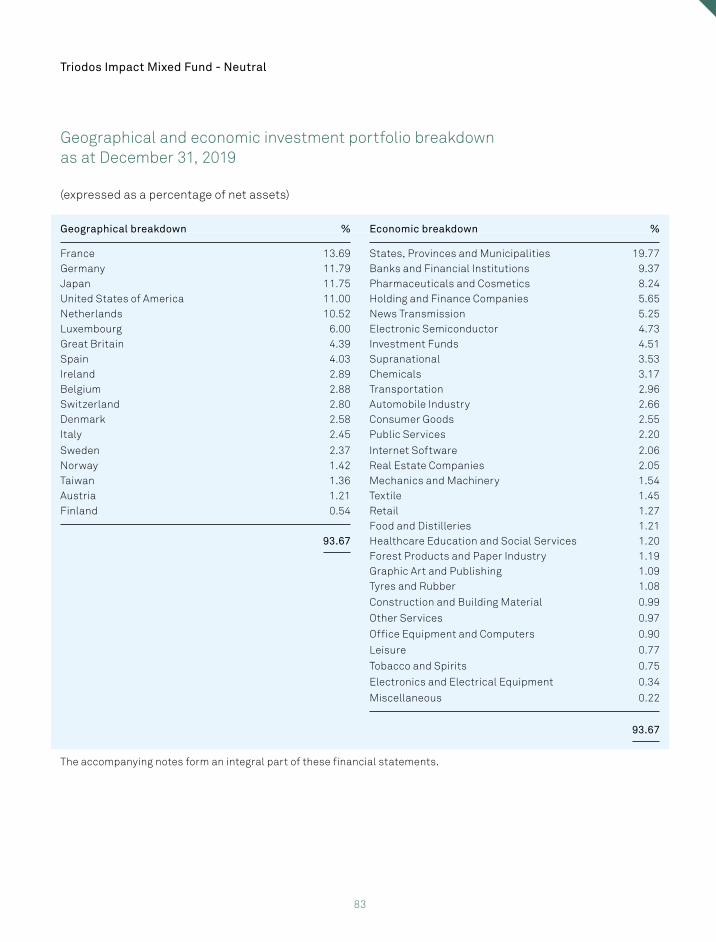
83
Geographical and economic investment portfolio breakdown as at December 31, 2019
(expressed as a percentage of net assets)
Geographical breakdown % Economic breakdown %
France 13.69 States, Provinces and Municipalities 19.77Germany 11.79 Banks and Financial Institutions 9.37Japan 11.75 Pharmaceuticals and Cosmetics 8.24United States of America 11.00 Holding and Finance Companies 5.65Netherlands 10.52 News Transmission 5.25Luxembourg 6.00 Electronic Semiconductor 4.73Great Britain 4.39 Investment Funds 4.51Spain 4.03 Supranational 3.53Ireland 2.89 Chemicals 3.17Belgium 2.88 Transportation 2.96Switzerland 2.80 Automobile Industry 2.66Denmark 2.58 Consumer Goods 2.55Italy 2.45 Public Services 2.20
Sweden 2.37 Internet Software 2.06Norway 1.42 Real Estate Companies 2.05Taiwan 1.36 Mechanics and Machinery 1.54Austria 1.21 Textile 1.45Finland 0.54 Retail 1.27
Food and Distilleries 1.2193.67 Healthcare Education and Social Services 1.20
Forest Products and Paper Industry 1.19Graphic Art and Publishing 1.09Tyres and Rubber 1.08
Construction and Building Material 0.99
Other Services 0.97
Office Equipment and Computers 0.90
Leisure 0.77
Tobacco and Spirits 0.75
Electronics and Electrical Equipment 0.34
Miscellaneous 0.22
93.67
The accompanying notes form an integral part of these financial statements.
Triodos Impact Mixed Fund - Neutral
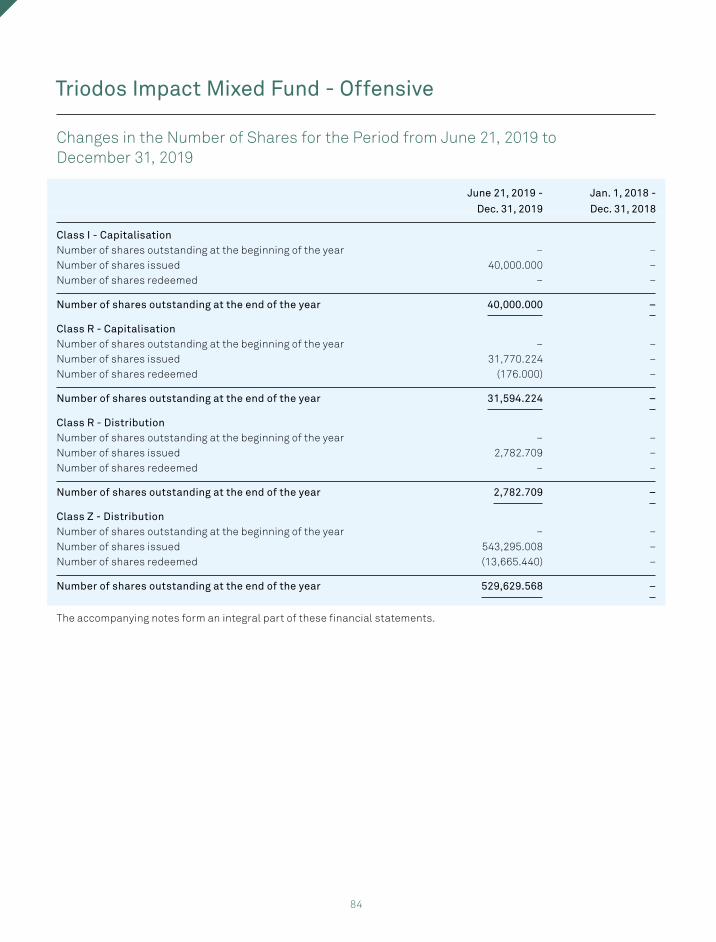
84
Changes in the Number of Shares for the Period from June 21, 2019 to December 31, 2019
June 21, 2019 -
Dec. 31, 2019
Jan. 1, 2018 -
Dec. 31, 2018
Class I - CapitalisationNumber of shares outstanding at the beginning of the year – –Number of shares issued 40,000.000 –Number of shares redeemed – –
Number of shares outstanding at the end of the year 40,000.000 –
Class R - CapitalisationNumber of shares outstanding at the beginning of the year – –Number of shares issued 31,770.224 –Number of shares redeemed (176.000) –
Number of shares outstanding at the end of the year 31,594.224 –
Class R - DistributionNumber of shares outstanding at the beginning of the year – –Number of shares issued 2,782.709 –Number of shares redeemed – –
Number of shares outstanding at the end of the year 2,782.709 –
Class Z - DistributionNumber of shares outstanding at the beginning of the year – –Number of shares issued 543,295.008 –Number of shares redeemed (13,665.440) –
Number of shares outstanding at the end of the year 529,629.568 –
The accompanying notes form an integral part of these financial statements.
Triodos Impact Mixed Fund - Offensive
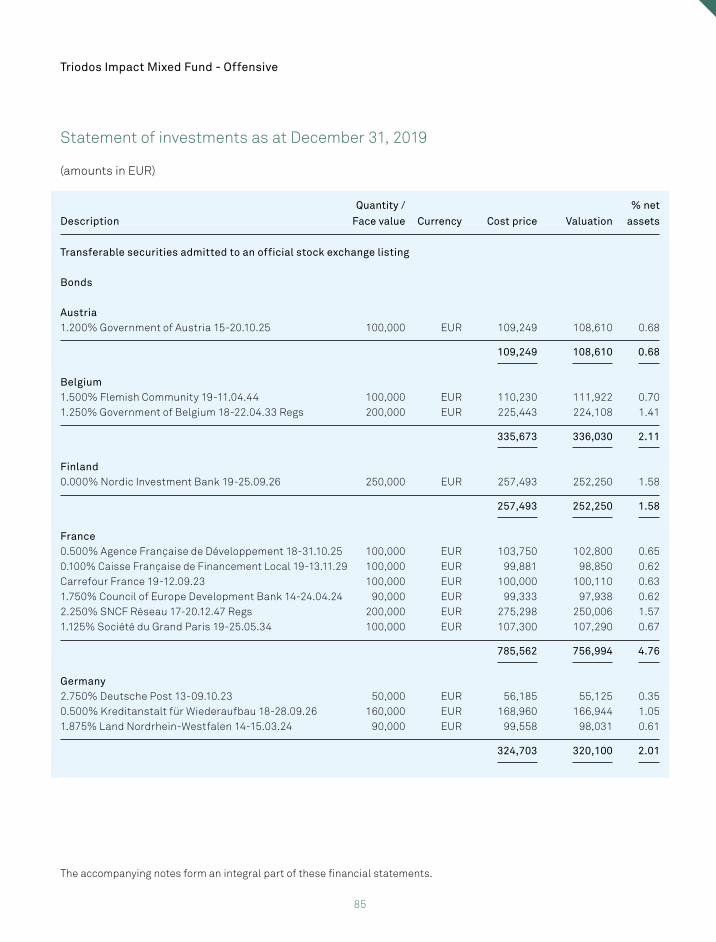
85
Statement of investments as at December 31, 2019
(amounts in EUR)
Description
Quantity /
Face value Currency Cost price Valuation
% net
assets
Transferable securities admitted to an official stock exchange listing
Bonds
Austria1.200% Government of Austria 15-20.10.25 100,000 EUR 109,249 108,610 0.68
109,249 108,610 0.68
Belgium1.500% Flemish Community 19-11.04.44 100,000 EUR 110,230 111,922 0.701.250% Government of Belgium 18-22.04.33 Regs 200,000 EUR 225,443 224,108 1.41
335,673 336,030 2.11
Finland0.000% Nordic Investment Bank 19-25.09.26 250,000 EUR 257,493 252,250 1.58
257,493 252,250 1.58
France0.500% Agence Française de Développement 18-31.10.25 100,000 EUR 103,750 102,800 0.650.100% Caisse Française de Financement Local 19-13.11.29 100,000 EUR 99,881 98,850 0.62Carrefour France 19-12.09.23 100,000 EUR 100,000 100,110 0.631.750% Council of Europe Development Bank 14-24.04.24 90,000 EUR 99,333 97,938 0.622.250% SNCF Réseau 17-20.12.47 Regs 200,000 EUR 275,298 250,006 1.571.125% Société du Grand Paris 19-25.05.34 100,000 EUR 107,300 107,290 0.67
785,562 756,994 4.76
Germany2.750% Deutsche Post 13-09.10.23 50,000 EUR 56,185 55,125 0.350.500% Kreditanstalt für Wiederaufbau 18-28.09.26 160,000 EUR 168,960 166,944 1.051.875% Land Nordrhein-Westfalen 14-15.03.24 90,000 EUR 99,558 98,031 0.61
324,703 320,100 2.01
Triodos Impact Mixed Fund - Offensive
The accompanying notes form an integral part of these financial statements.
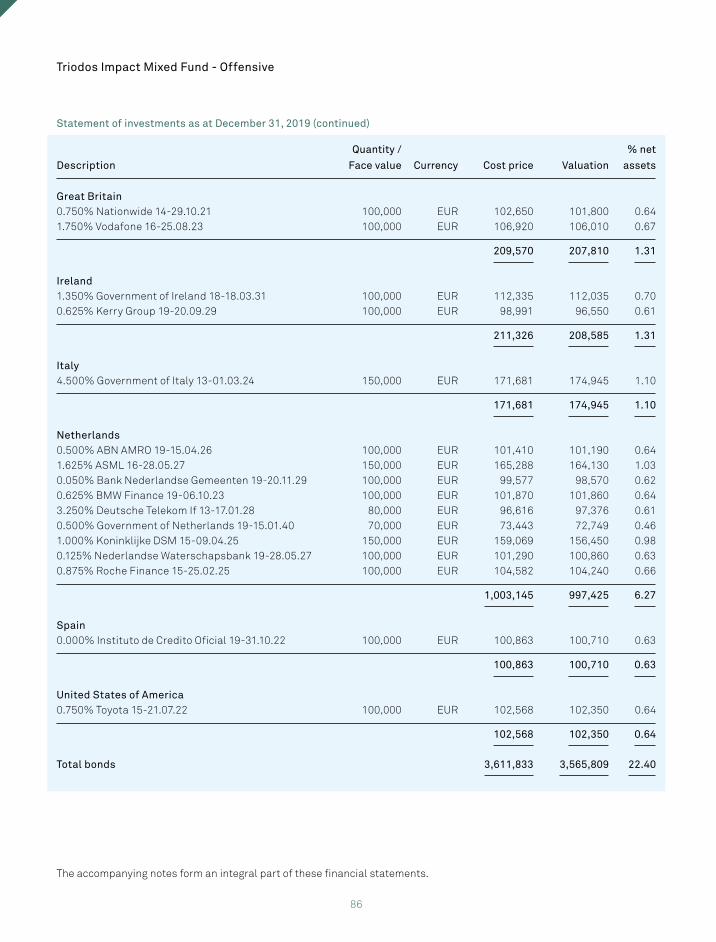
86
Description
Quantity /
Face value Currency Cost price Valuation
% net
assets
Great Britain0.750% Nationwide 14-29.10.21 100,000 EUR 102,650 101,800 0.641.750% Vodafone 16-25.08.23 100,000 EUR 106,920 106,010 0.67
209,570 207,810 1.31
Ireland1.350% Government of Ireland 18-18.03.31 100,000 EUR 112,335 112,035 0.700.625% Kerry Group 19-20.09.29 100,000 EUR 98,991 96,550 0.61
211,326 208,585 1.31
Italy4.500% Government of Italy 13-01.03.24 150,000 EUR 171,681 174,945 1.10
171,681 174,945 1.10
Netherlands0.500% ABN AMRO 19-15.04.26 100,000 EUR 101,410 101,190 0.641.625% ASML 16-28.05.27 150,000 EUR 165,288 164,130 1.030.050% Bank Nederlandse Gemeenten 19-20.11.29 100,000 EUR 99,577 98,570 0.620.625% BMW Finance 19-06.10.23 100,000 EUR 101,870 101,860 0.643.250% Deutsche Telekom If 13-17.01.28 80,000 EUR 96,616 97,376 0.610.500% Government of Netherlands 19-15.01.40 70,000 EUR 73,443 72,749 0.461.000% Koninklijke DSM 15-09.04.25 150,000 EUR 159,069 156,450 0.980.125% Nederlandse Waterschapsbank 19-28.05.27 100,000 EUR 101,290 100,860 0.630.875% Roche Finance 15-25.02.25 100,000 EUR 104,582 104,240 0.66
1,003,145 997,425 6.27
Spain0.000% Instituto de Credito Oficial 19-31.10.22 100,000 EUR 100,863 100,710 0.63
100,863 100,710 0.63
United States of America0.750% Toyota 15-21.07.22 100,000 EUR 102,568 102,350 0.64
102,568 102,350 0.64
Total bonds 3,611,833 3,565,809 22.40
Statement of investments as at December 31, 2019 (continued)
Triodos Impact Mixed Fund - Offensive
The accompanying notes form an integral part of these financial statements.
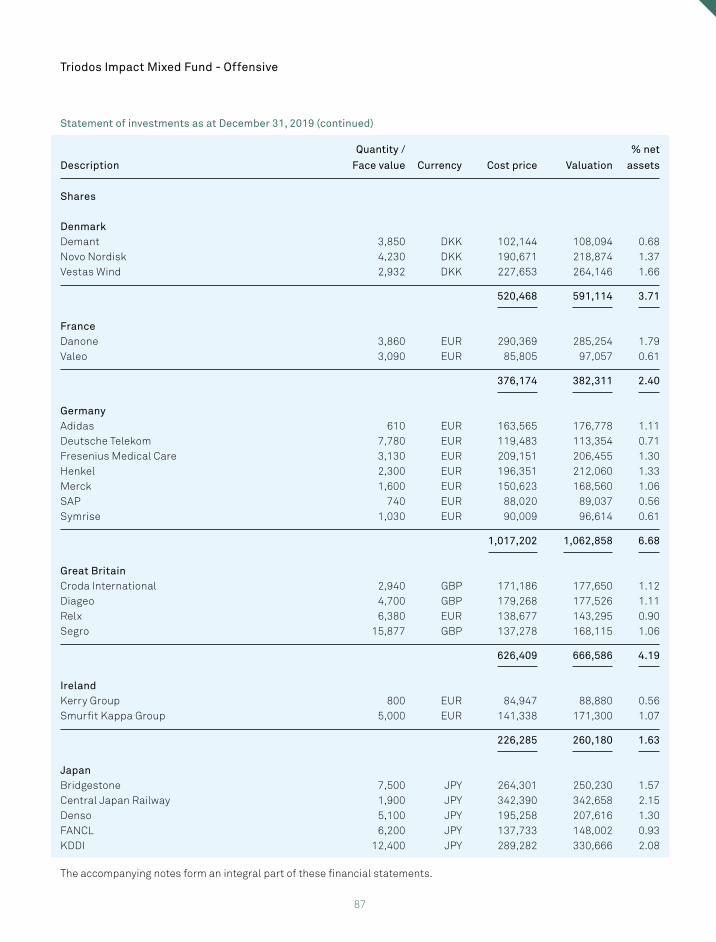
87
Description
Quantity /
Face value Currency Cost price Valuation
% net
assets
Shares
DenmarkDemant 3,850 DKK 102,144 108,094 0.68Novo Nordisk 4,230 DKK 190,671 218,874 1.37Vestas Wind 2,932 DKK 227,653 264,146 1.66
520,468 591,114 3.71
FranceDanone 3,860 EUR 290,369 285,254 1.79Valeo 3,090 EUR 85,805 97,057 0.61
376,174 382,311 2.40
GermanyAdidas 610 EUR 163,565 176,778 1.11Deutsche Telekom 7,780 EUR 119,483 113,354 0.71Fresenius Medical Care 3,130 EUR 209,151 206,455 1.30Henkel 2,300 EUR 196,351 212,060 1.33Merck 1,600 EUR 150,623 168,560 1.06SAP 740 EUR 88,020 89,037 0.56Symrise 1,030 EUR 90,009 96,614 0.61
1,017,202 1,062,858 6.68
Great BritainCroda International 2,940 GBP 171,186 177,650 1.12Diageo 4,700 GBP 179,268 177,526 1.11Relx 6,380 EUR 138,677 143,295 0.90Segro 15,877 GBP 137,278 168,115 1.06
626,409 666,586 4.19
IrelandKerry Group 800 EUR 84,947 88,880 0.56Smurfit Kappa Group 5,000 EUR 141,338 171,300 1.07
226,285 260,180 1.63
JapanBridgestone 7,500 JPY 264,301 250,230 1.57Central Japan Railway 1,900 JPY 342,390 342,658 2.15Denso 5,100 JPY 195,258 207,616 1.30FANCL 6,200 JPY 137,733 148,002 0.93KDDI 12,400 JPY 289,282 330,666 2.08
Statement of investments as at December 31, 2019 (continued)
Triodos Impact Mixed Fund - Offensive
The accompanying notes form an integral part of these financial statements.
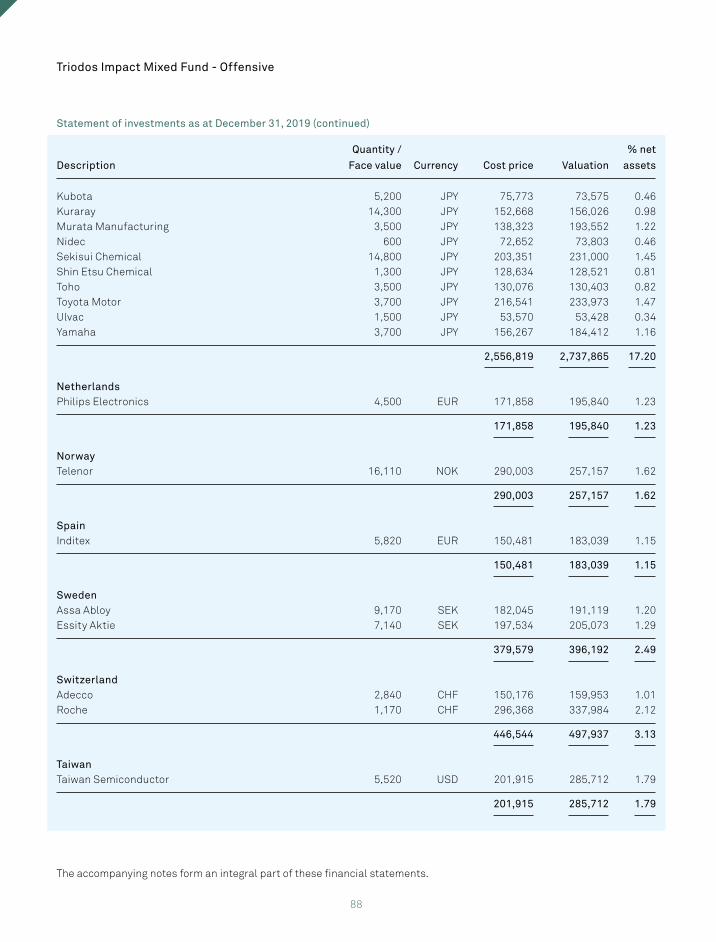
88
Description
Quantity /
Face value Currency Cost price Valuation
% net
assets
Kubota 5,200 JPY 75,773 73,575 0.46Kuraray 14,300 JPY 152,668 156,026 0.98Murata Manufacturing 3,500 JPY 138,323 193,552 1.22Nidec 600 JPY 72,652 73,803 0.46Sekisui Chemical 14,800 JPY 203,351 231,000 1.45Shin Etsu Chemical 1,300 JPY 128,634 128,521 0.81Toho 3,500 JPY 130,076 130,403 0.82Toyota Motor 3,700 JPY 216,541 233,973 1.47Ulvac 1,500 JPY 53,570 53,428 0.34Yamaha 3,700 JPY 156,267 184,412 1.16
2,556,819 2,737,865 17.20
NetherlandsPhilips Electronics 4,500 EUR 171,858 195,840 1.23
171,858 195,840 1.23
NorwayTelenor 16,110 NOK 290,003 257,157 1.62
290,003 257,157 1.62
SpainInditex 5,820 EUR 150,481 183,039 1.15
150,481 183,039 1.15
SwedenAssa Abloy 9,170 SEK 182,045 191,119 1.20Essity Aktie 7,140 SEK 197,534 205,073 1.29
379,579 396,192 2.49
SwitzerlandAdecco 2,840 CHF 150,176 159,953 1.01Roche 1,170 CHF 296,368 337,984 2.12
446,544 497,937 3.13
TaiwanTaiwan Semiconductor 5,520 USD 201,915 285,712 1.79
201,915 285,712 1.79
Statement of investments as at December 31, 2019 (continued)
Triodos Impact Mixed Fund - Offensive
The accompanying notes form an integral part of these financial statements.
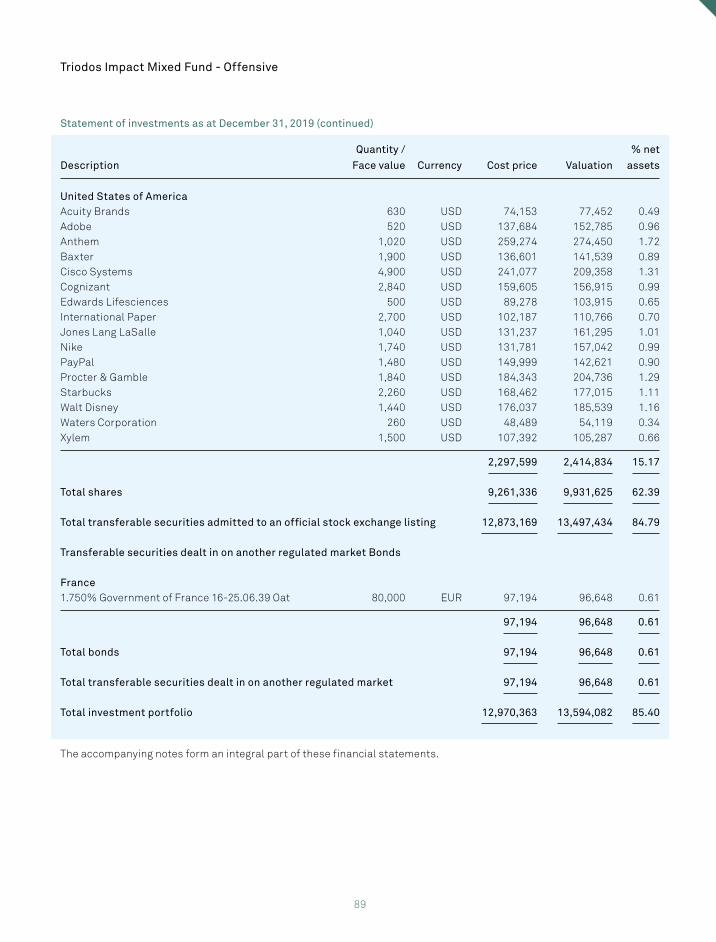
89
Description
Quantity /
Face value Currency Cost price Valuation
% net
assets
United States of AmericaAcuity Brands 630 USD 74,153 77,452 0.49Adobe 520 USD 137,684 152,785 0.96Anthem 1,020 USD 259,274 274,450 1.72Baxter 1,900 USD 136,601 141,539 0.89Cisco Systems 4,900 USD 241,077 209,358 1.31Cognizant 2,840 USD 159,605 156,915 0.99Edwards Lifesciences 500 USD 89,278 103,915 0.65International Paper 2,700 USD 102,187 110,766 0.70Jones Lang LaSalle 1,040 USD 131,237 161,295 1.01Nike 1,740 USD 131,781 157,042 0.99PayPal 1,480 USD 149,999 142,621 0.90Procter & Gamble 1,840 USD 184,343 204,736 1.29Starbucks 2,260 USD 168,462 177,015 1.11Walt Disney 1,440 USD 176,037 185,539 1.16Waters Corporation 260 USD 48,489 54,119 0.34Xylem 1,500 USD 107,392 105,287 0.66
2,297,599 2,414,834 15.17
Total shares 9,261,336 9,931,625 62.39
Total transferable securities admitted to an official stock exchange listing 12,873,169 13,497,434 84.79
Transferable securities dealt in on another regulated market Bonds
France1.750% Government of France 16-25.06.39 Oat 80,000 EUR 97,194 96,648 0.61
97,194 96,648 0.61
Total bonds 97,194 96,648 0.61
Total transferable securities dealt in on another regulated market 97,194 96,648 0.61
Total investment portfolio 12,970,363 13,594,082 85.40
The accompanying notes form an integral part of these financial statements.
Statement of investments as at December 31, 2019 (continued)
Triodos Impact Mixed Fund - Offensive
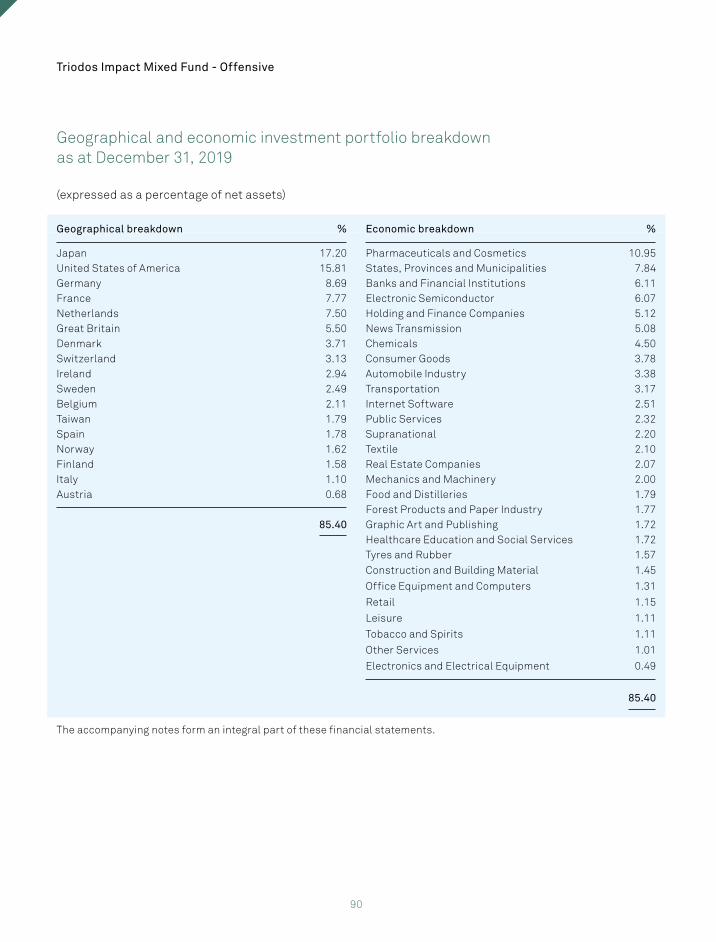
90
Geographical and economic investment portfolio breakdown as at December 31, 2019
(expressed as a percentage of net assets)
Geographical breakdown % Economic breakdown %
Japan 17.20 Pharmaceuticals and Cosmetics 10.95United States of America 15.81 States, Provinces and Municipalities 7.84Germany 8.69 Banks and Financial Institutions 6.11France 7.77 Electronic Semiconductor 6.07Netherlands 7.50 Holding and Finance Companies 5.12Great Britain 5.50 News Transmission 5.08Denmark 3.71 Chemicals 4.50Switzerland 3.13 Consumer Goods 3.78Ireland 2.94 Automobile Industry 3.38Sweden 2.49 Transportation 3.17Belgium 2.11 Internet Software 2.51Taiwan 1.79 Public Services 2.32Spain 1.78 Supranational 2.20Norway 1.62 Textile 2.10Finland 1.58 Real Estate Companies 2.07Italy 1.10 Mechanics and Machinery 2.00Austria 0.68 Food and Distilleries 1.79
Forest Products and Paper Industry 1.7785.40 Graphic Art and Publishing 1.72
Healthcare Education and Social Services 1.72Tyres and Rubber 1.57Construction and Building Material 1.45
Office Equipment and Computers 1.31
Retail 1.15
Leisure 1.11
Tobacco and Spirits 1.11
Other Services 1.01
Electronics and Electrical Equipment 0.49
85.40
The accompanying notes form an integral part of these financial statements.
Triodos Impact Mixed Fund - Offensive
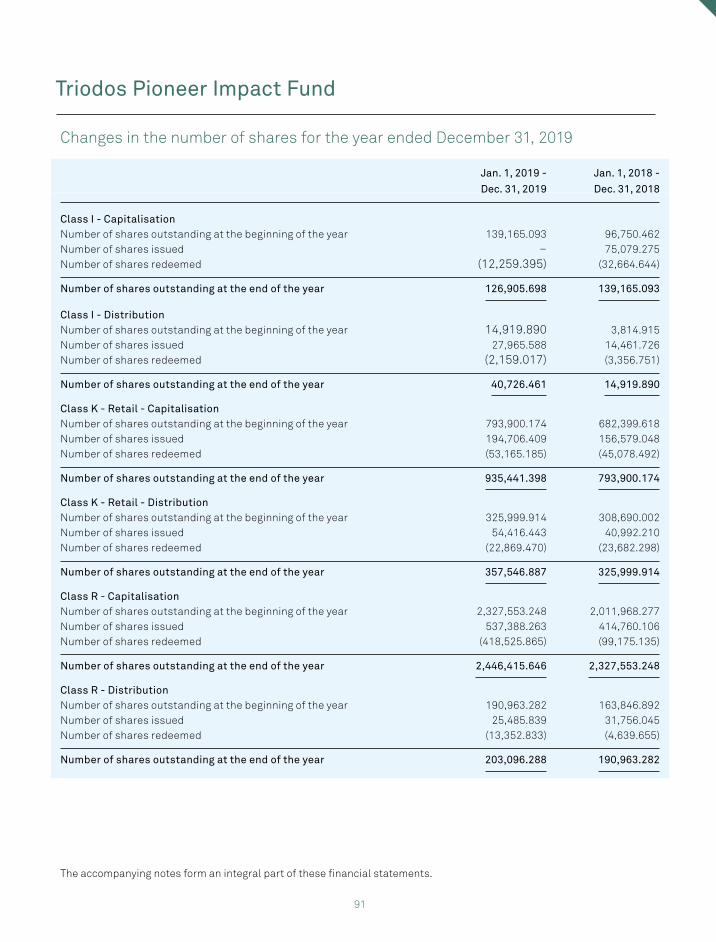
91
Changes in the number of shares for the year ended December 31, 2019
Jan. 1, 2019 -
Dec. 31, 2019
Jan. 1, 2018 -
Dec. 31, 2018
Class I - CapitalisationNumber of shares outstanding at the beginning of the year 139,165.093 96,750.462Number of shares issued – 75,079.275Number of shares redeemed (12,259.395) (32,664.644)
Number of shares outstanding at the end of the year 126,905.698 139,165.093
Class I - DistributionNumber of shares outstanding at the beginning of the year 14,919.890 3,814.915Number of shares issued 27,965.588 14,461.726Number of shares redeemed (2,159.017) (3,356.751)
Number of shares outstanding at the end of the year 40,726.461 14,919.890
Class K - Retail - CapitalisationNumber of shares outstanding at the beginning of the year 793,900.174 682,399.618Number of shares issued 194,706.409 156,579.048Number of shares redeemed (53,165.185) (45,078.492)
Number of shares outstanding at the end of the year 935,441.398 793,900.174
Class K - Retail - DistributionNumber of shares outstanding at the beginning of the year 325,999.914 308,690.002Number of shares issued 54,416.443 40,992.210Number of shares redeemed (22,869.470) (23,682.298)
Number of shares outstanding at the end of the year 357,546.887 325,999.914
Class R - CapitalisationNumber of shares outstanding at the beginning of the year 2,327,553.248 2,011,968.277Number of shares issued 537,388.263 414,760.106Number of shares redeemed (418,525.865) (99,175.135)
Number of shares outstanding at the end of the year 2,446,415.646 2,327,553.248
Class R - DistributionNumber of shares outstanding at the beginning of the year 190,963.282 163,846.892Number of shares issued 25,485.839 31,756.045Number of shares redeemed (13,352.833) (4,639.655)
Number of shares outstanding at the end of the year 203,096.288 190,963.282
Triodos Pioneer Impact Fund
The accompanying notes form an integral part of these financial statements.
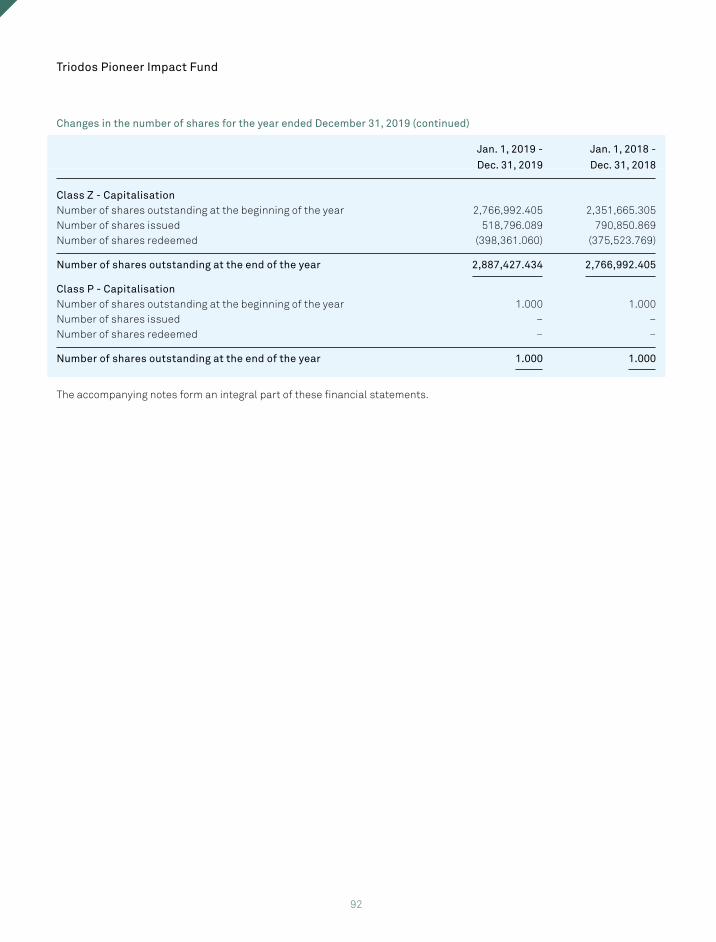
92
Jan. 1, 2019 -
Dec. 31, 2019
Jan. 1, 2018 -
Dec. 31, 2018
Class Z - CapitalisationNumber of shares outstanding at the beginning of the year 2,766,992.405 2,351,665.305Number of shares issued 518,796.089 790,850.869Number of shares redeemed (398,361.060) (375,523.769)
Number of shares outstanding at the end of the year 2,887,427.434 2,766,992.405
Class P - CapitalisationNumber of shares outstanding at the beginning of the year 1.000 1.000Number of shares issued – –Number of shares redeemed – –
Number of shares outstanding at the end of the year 1.000 1.000
The accompanying notes form an integral part of these financial statements.
Changes in the number of shares for the year ended December 31, 2019 (continued)
Triodos Pioneer Impact Fund
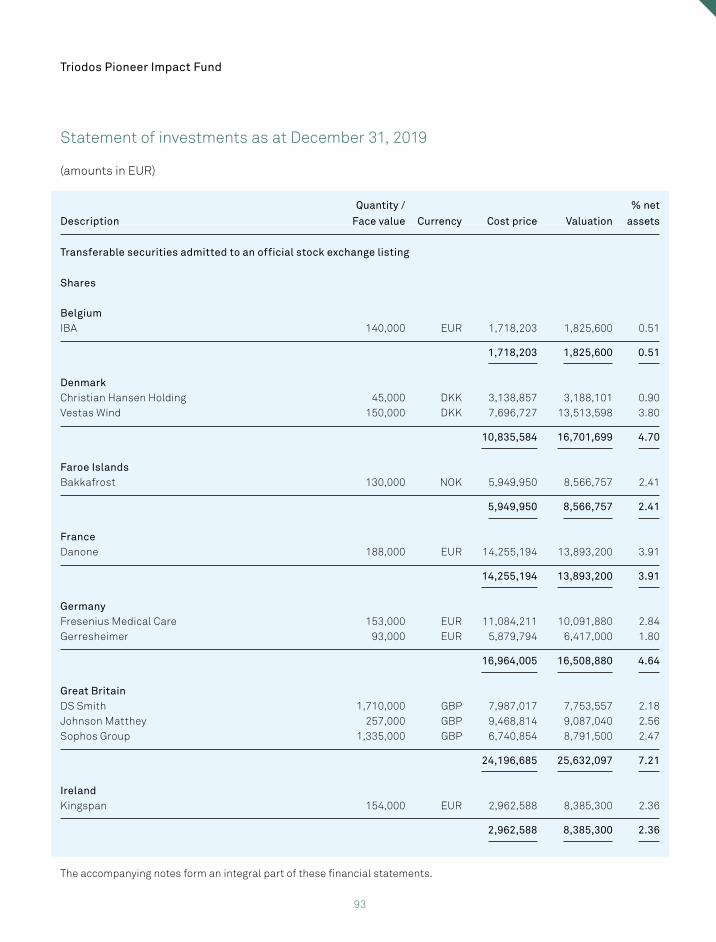
93
Statement of investments as at December 31, 2019
(amounts in EUR)
Description
Quantity /
Face value Currency Cost price Valuation
% net
assets
Transferable securities admitted to an official stock exchange listing
Shares
BelgiumIBA 140,000 EUR 1,718,203 1,825,600 0.51
1,718,203 1,825,600 0.51
DenmarkChristian Hansen Holding 45,000 DKK 3,138,857 3,188,101 0.90Vestas Wind 150,000 DKK 7,696,727 13,513,598 3.80
10,835,584 16,701,699 4.70
Faroe IslandsBakkafrost 130,000 NOK 5,949,950 8,566,757 2.41
5,949,950 8,566,757 2.41
FranceDanone 188,000 EUR 14,255,194 13,893,200 3.91
14,255,194 13,893,200 3.91
GermanyFresenius Medical Care 153,000 EUR 11,084,211 10,091,880 2.84Gerresheimer 93,000 EUR 5,879,794 6,417,000 1.80
16,964,005 16,508,880 4.64
Great BritainDS Smith 1,710,000 GBP 7,987,017 7,753,557 2.18Johnson Matthey 257,000 GBP 9,468,814 9,087,040 2.56Sophos Group 1,335,000 GBP 6,740,854 8,791,500 2.47
24,196,685 25,632,097 7.21
IrelandKingspan 154,000 EUR 2,962,588 8,385,300 2.36
2,962,588 8,385,300 2.36
Triodos Pioneer Impact Fund
The accompanying notes form an integral part of these financial statements.
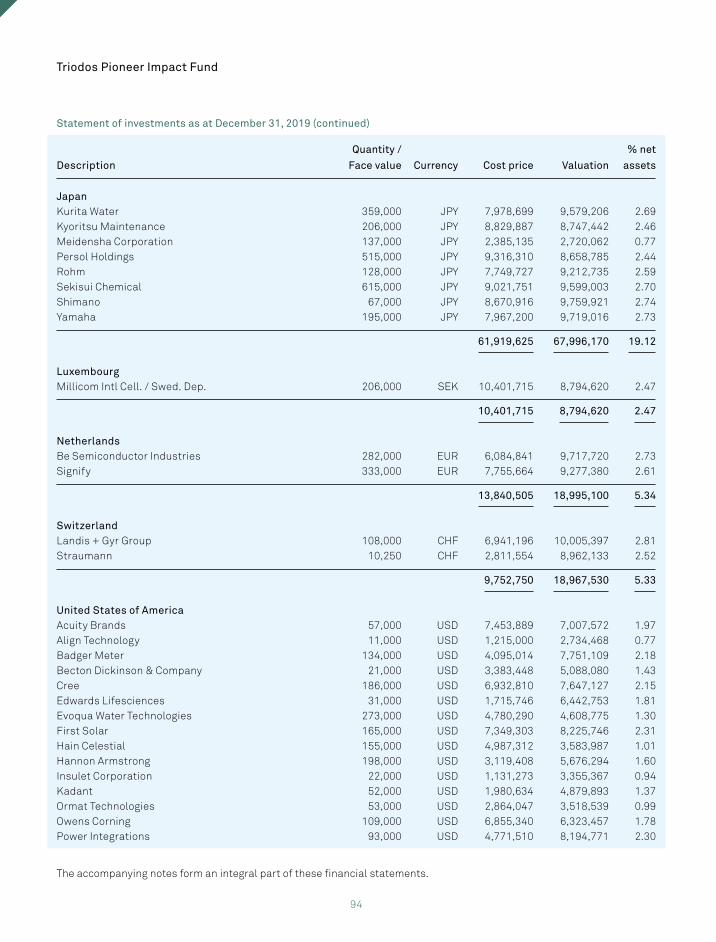
94
Description
Quantity /
Face value Currency Cost price Valuation
% net
assets
JapanKurita Water 359,000 JPY 7,978,699 9,579,206 2.69Kyoritsu Maintenance 206,000 JPY 8,829,887 8,747,442 2.46Meidensha Corporation 137,000 JPY 2,385,135 2,720,062 0.77Persol Holdings 515,000 JPY 9,316,310 8,658,785 2.44Rohm 128,000 JPY 7,749,727 9,212,735 2.59Sekisui Chemical 615,000 JPY 9,021,751 9,599,003 2.70Shimano 67,000 JPY 8,670,916 9,759,921 2.74Yamaha 195,000 JPY 7,967,200 9,719,016 2.73
61,919,625 67,996,170 19.12
LuxembourgMillicom Intl Cell. / Swed. Dep. 206,000 SEK 10,401,715 8,794,620 2.47
10,401,715 8,794,620 2.47
NetherlandsBe Semiconductor Industries 282,000 EUR 6,084,841 9,717,720 2.73Signify 333,000 EUR 7,755,664 9,277,380 2.61
13,840,505 18,995,100 5.34
SwitzerlandLandis + Gyr Group 108,000 CHF 6,941,196 10,005,397 2.81Straumann 10,250 CHF 2,811,554 8,962,133 2.52
9,752,750 18,967,530 5.33
United States of AmericaAcuity Brands 57,000 USD 7,453,889 7,007,572 1.97Align Technology 11,000 USD 1,215,000 2,734,468 0.77Badger Meter 134,000 USD 4,095,014 7,751,109 2.18Becton Dickinson & Company 21,000 USD 3,383,448 5,088,080 1.43Cree 186,000 USD 6,932,810 7,647,127 2.15Edwards Lifesciences 31,000 USD 1,715,746 6,442,753 1.81Evoqua Water Technologies 273,000 USD 4,780,290 4,608,775 1.30First Solar 165,000 USD 7,349,303 8,225,746 2.31Hain Celestial 155,000 USD 4,987,312 3,583,987 1.01Hannon Armstrong 198,000 USD 3,119,408 5,676,294 1.60Insulet Corporation 22,000 USD 1,131,273 3,355,367 0.94Kadant 52,000 USD 1,980,634 4,879,893 1.37Ormat Technologies 53,000 USD 2,864,047 3,518,539 0.99Owens Corning 109,000 USD 6,855,340 6,323,457 1.78Power Integrations 93,000 USD 4,771,510 8,194,771 2.30
Statement of investments as at December 31, 2019 (continued)
Triodos Pioneer Impact Fund
The accompanying notes form an integral part of these financial statements.
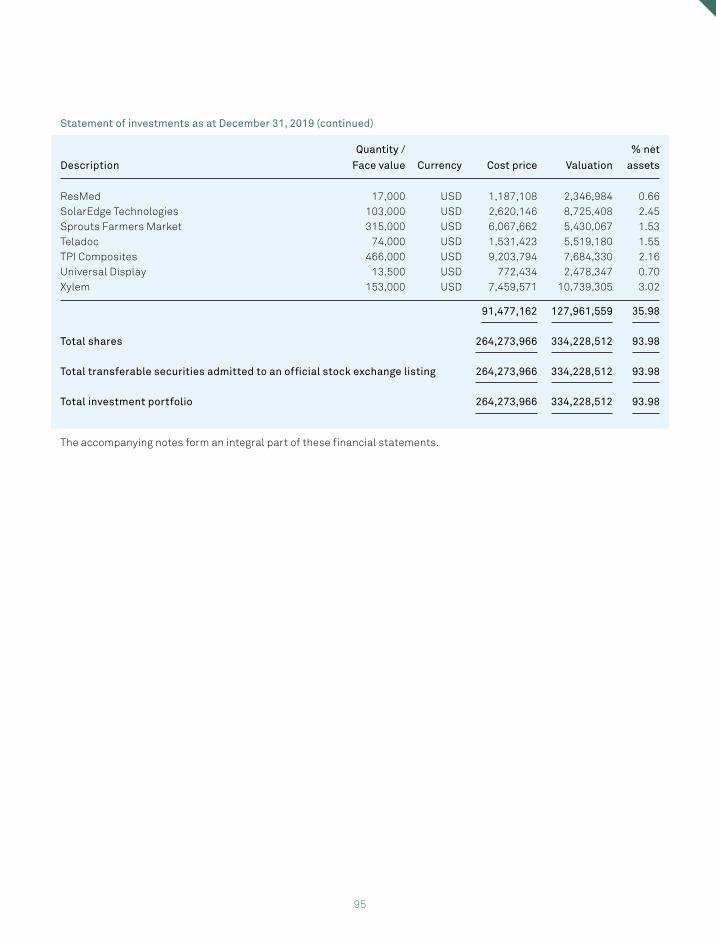
95
Description
Quantity /
Face value Currency Cost price Valuation
% net
assets
ResMed 17,000 USD 1,187,108 2,346,984 0.66SolarEdge Technologies 103,000 USD 2,620,146 8,725,408 2.45Sprouts Farmers Market 315,000 USD 6,067,662 5,430,067 1.53Teladoc 74,000 USD 1,531,423 5,519,180 1.55TPI Composites 466,000 USD 9,203,794 7,684,330 2.16Universal Display 13,500 USD 772,434 2,478,347 0.70Xylem 153,000 USD 7,459,571 10,739,305 3.02
91,477,162 127,961,559 35.98
Total shares 264,273,966 334,228,512 93.98
Total transferable securities admitted to an official stock exchange listing 264,273,966 334,228,512 93.98
Total investment portfolio 264,273,966 334,228,512 93.98
The accompanying notes form an integral part of these financial statements.
Statement of investments as at December 31, 2019 (continued)
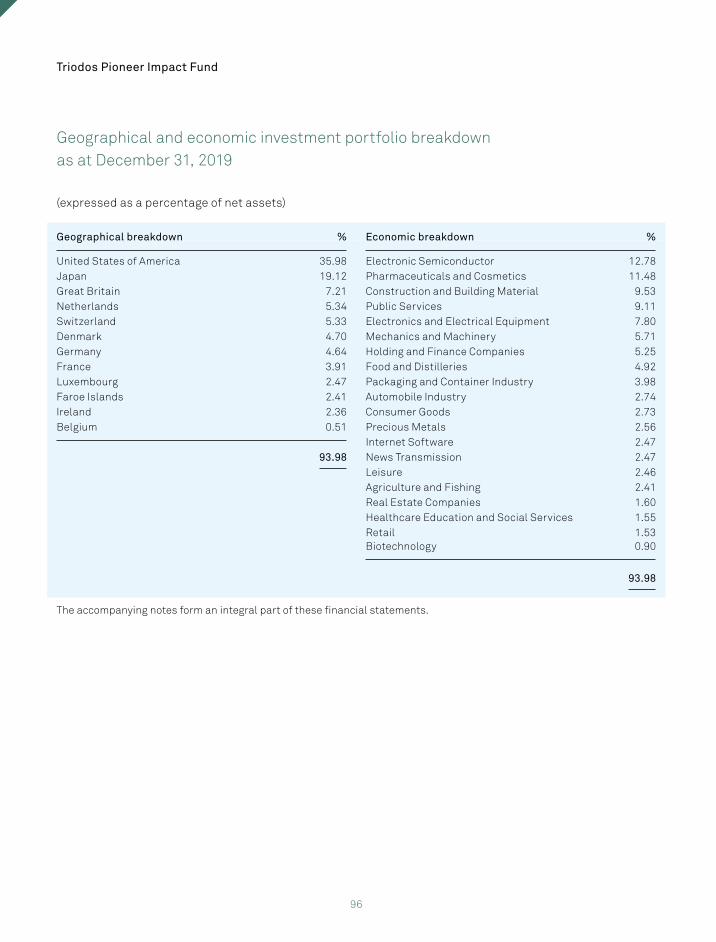
96
Geographical and economic investment portfolio breakdown as at December 31, 2019
(expressed as a percentage of net assets)
Geographical breakdown % Economic breakdown %
United States of America 35.98 Electronic Semiconductor 12.78Japan 19.12 Pharmaceuticals and Cosmetics 11.48Great Britain 7.21 Construction and Building Material 9.53Netherlands 5.34 Public Services 9.11Switzerland 5.33 Electronics and Electrical Equipment 7.80Denmark 4.70 Mechanics and Machinery 5.71Germany 4.64 Holding and Finance Companies 5.25France 3.91 Food and Distilleries 4.92Luxembourg 2.47 Packaging and Container Industry 3.98Faroe Islands 2.41 Automobile Industry 2.74Ireland 2.36 Consumer Goods 2.73Belgium 0.51 Precious Metals 2.56
Internet Software 2.4793.98 News Transmission 2.47
Leisure 2.46Agriculture and Fishing 2.41Real Estate Companies 1.60Healthcare Education and Social Services 1.55Retail 1.53Biotechnology 0.90
93.98
The accompanying notes form an integral part of these financial statements.
Triodos Pioneer Impact Fund
97
Note 1 - General
Triodos SICAV I is an open-ended investment company, incorporated under the laws of the Grand Duchy of Luxembourg as a “Société d’Investissement à Capital Variable” (SICAV) in the form of a “société anonyme”. Triodos SICAV I is governed by the law of the Grand Duchy of Luxembourg of August 10, 1915 on commercial companies, as amended, and by part I of the Law of December 17, 2010, as amended. Triodos SICAV I has appointed Triodos Investment Management as its authorised UCITS management company.
The fund (and each of its sub-funds) does not qualify as a “structured UCITS” within the meaning of article 36(1) of Commission Regulation (EU) No 583/2010 of July 1, 2010 implementing Directive 2009/65/EC.
The fund has been incorporated under the name of Triodos SICAV I for an unlimited period. The registered office of Triodos SICAV I is established at 11-13, boulevard de la Foire, L-1528 Luxembourg.
The articles of incorporation of Triodos SICAV I were last amended at the extraordinary general meeting of shareholders held on March 23, 2018 and published in the Recueil des Sociétés et Associations (RESA) on May 18, 2018. The R.C.S. number of the fund is B119.549.
The shares to be issued shall be issued in several separate sub-funds of Triodos SICAV I. A separate portfolio of assets is maintained for each sub- fund and is invested in accordance with the investment objective for that sub-fund. As a result, Triodos SICAV I is commonly known as an “umbrella fund” enabling investors to choose between one or more investment objectives by investing in one or more sub-funds. Investors may choose which sub-fund(s) may be most appropriate for their specific risk and return expectations as well as their diversification needs.
As at December 31, 2019, Triodos SICAV I has six sub-funds that are opened to investors:
• Triodos Euro Bond Impact Fund (launched on July 16, 2007), formerly known as Triodos Sustainable Bond Fund until May 15, 2019
• Triodos Global Equities Impact Fund (launched on July 16, 2007), formerly known as Triodos Sustainable Equity Fund until May 15, 2019
• Triodos Impact Mixed Fund - Defensive (launched on June 21, 2019)• Triodos Impact Mixed Fund - Neutral (launched on June 25, 2010), formerly known as Triodos Sustainable
Mixed Fund until May 15, 2019• Triodos Impact Mixed Fund - Offensive (launched on June 21, 2019)• Triodos Pioneer Impact Fund (launched on March 12, 2007), formerly known as Triodos Sustainable Pioneer
Fund until May 15, 2019
The sub-funds are denominated in euros.
The sub-funds may offer shares of the following classes:
• Class D – Capitalisation (EUR) • Class I – Capitalisation (EUR)• Class D – Distribution (EUR) • Class I – Distribution (EUR)• Class R – Capitalisation (EUR) • Class I-II – Capitalisation (EUR)• Class R – Distribution (EUR) • Class I-II – Distribution (EUR)• Class P – Capitalisation (EUR) • Class S – Capitalisation (EUR)• Class K – Institutional - Capitalisation (GBP) • Class S – Distribution (EUR)• Class K – Institutional - Distribution (GBP) • Class Z – Capitalisation (EUR)• Class K – Retail - Capitalisation (GBP) • Class Z – Distribution (EUR)• Class K – Retail - Distribution (GBP)
Notes to the financial statements as at December 31, 2019
98
Subscription to Class D shares is only open to appointed discretionary portfolio managers which have established an investment discretionary relationship in writing with their clients in return for a fee. Class D shares are subject to a subscription tax at an annual rate of 0.05% of the net assets, calculated and payable quarterly at the end of the relevant quarter.
Subscription to Class R shares is open to any investor. Class R shares are subject to a subscription tax at an annual rate of 0.05% of the net assets, calculated and payable quarterly at the end of the relevant quarter.
Subscription to Class P shares is open to entities of Triodos Bank group qualifying as institutional investors. Class P shares are subject to a subscription tax at an annual rate of 0.01% of the net assets, calculated and payable quarterly at the end of the relevant quarter.
Subscription to Class I shares is open to institutional investors. Class I shares are subject to a subscription tax at an annual rate of 0.01% of the net assets, calculated and payable quarterly at the end of the relevant quarter.
Subscription to Class I-II shares is open to institutional investors who will invest an initial subscription amount larger than Euro 25 million. Class I-II shares are subject to a subscription tax at an annual rate of 0.01% of the net assets, calculated and payable quarterly at the end of the relevant quarter.
Subscription to Class S shares is only open to investors who are resident in Spain. Class S shares are subject to a subscription tax at an annual rate of 0.05% of the net assets, calculated and payable quarterly at the end of the relevant quarter.
Subscription to Class K – Institutional shares is open to institutional investors who are resident in the United Kingdom. Class K – Institutional shares are subject to a subscription tax at an annual rate of 0.01% of the net assets, calculated and payable quarterly at the end of the relevant quarter.
Subscription to Class K – Retail shares is open to retail investors who are resident in the United Kingdom. Class K – Retail shares are subject to a subscription tax at an annual rate of 0.05% of the net assets, calculated and payable quarterly at the end of the relevant quarter.
Subscription to Class Z shares is open to distributors and financial intermediaries, which according to regulatory requirements or based on individual fee arrangements with their clients, are not allowed to accept and keep commissions on management fee, subject to the approval of the management company. Class Z shares are subject to a subscription tax at an annual rate of 0.05% of the net assets, calculated and payable quarterly at the end of the relevant quarter.
Note 2 - Summary of significant accounting policies
The financial statements are prepared in accordance with Luxembourg regulations relating to investment funds using the following significant accounting policies.
a) Valuation of investments
The value of such assets is determined as follows:
The value of any cash on hand or on deposit, bills and demand notes and accounts receivable, prepaid expenses, cash dividends and interests declared or accrued as aforesaid and not yet received is deemed to be the full amount thereof, unless in any case the same is unlikely to be paid or received in full, in which case
99
the value thereof is arrived at after making such discount as may be considered appropriate in such case to reflect the true value thereof.
The value of transferable securities, money market instruments and any other financial assets listed or dealt in on a regulated market, a stock exchange in another state or on any other regulated market is based on the last available price on the relevant market which is normally the principal market for such assets.
In the event that any assets are not listed or dealt in on any regulated market, any stock exchange in another state or on any other regulated market, or if, with respect to assets listed or dealt in on any such markets, the price as determined above is not representative of the fair market value of the relevant assets, the value of such assets will be based on reasonably foreseeable sales prices determined prudently and in good faith by the Board of Directors.
b) Net realised profit / (loss) on sales of investments
The net realised profit / (loss) on sales of investments is calculated on the basis of average cost of investments sold.
c) Foreign exchange translation
Triodos SICAV I maintains its accounting records in euros and its financial statements are expressed in this currency.
Assets and liabilities which are not denominated in euros are translated into euros at the rate of exchange prevailing in Luxembourg at applicable exchange rates at the end of the year.
Income and expenses in currencies other than euros are translated into euros at the applicable exchange rates prevailing on the transaction date. Resulting realised and unrealised foreign exchange gains or losses are included in the statement of operations and changes in net assets. The exchange rates used as at December 31, 2019:
1 EUR = 1.086973 CHF 1 EUR = 121.987665 JPY1 EUR = 7.472473 DKK 1 EUR = 9.863709 NOK1 EUR = 1.000000 EUR 1 EUR = 10.507742 SEK1 EUR = 0.847330 GBP 1 EUR = 1.122500 USD
d) Income from investments
Interest on fixed income securities is accrued prorata temporis on each net asset calculation date and dividends are accrued on an ex-dividend basis.
e) Allocation of expenses
Each sub-fund shall pay for the general costs and expenses directly attributable to it. These fees are all part of the service fee.General costs and expenses that cannot be attributed to a given sub-fund shall be allocated to the sub-funds, in proportion to their respective net assets. These fees are all part of the service fee.
100
Since the introduction of MIFID II on January 3, 2018, research costs have to be paid either by the fund, or by the investment manager. The choice was made to have the investment manager pay for the research costs. No research costs are allocated to the sub-funds.
f) Formation expenses
The costs and expenses of the formation of the fund have been borne by the fund and amortised over a period of five years. Expenses incurred in connection with the creation of any additional sub-fund shall be borne by the relevant sub-fund and, where applicable, will be written off in proportion to their net assets over a period not exceeding five years.
Note 3 - Determination of the net asset value of shares
The net asset value per share of each sub-fund is expressed in the reference currency of the relevant sub-fund and is calculated for each sub-fund by dividing the assets of such sub-fund less its liabilities by the number of shares in issue in respect of such sub-fund.
Note 4 - Fees
4.1 Management fee
The annual management fee of each sub-fund is used to cover charges and expenses of the sub-fund to be paid to the management company, the investment manager (if any) and the distributors of each sub-fund in relation to share distribution (if applicable). The annual management fee is accrued daily out of the assets attributable to the relevant class of shares or sub-fund as a percentage of the net asset value.
Management fee (per annum)
Sub-fundMaximum
feeFee R-class and P-class
Fee Z-class and KR-class
Fee I-classand KI-class
Fee I-II class
Triodos Euro Bond Impact Fund 2.00% 1.00% 0.60% 0.40% 0.30% Triodos Global Equities Impact Fund 2.00% 1.30% 0.75% 0.75% 0.45% Triodos Impact Mixed Fund - Defensive 1.50% 1.03% 0.58% 0.38% n/aTriodos Impact Mixed Fund - Neutral* 1.50% 1.07% 0.62% 0.42% 0.32% Triodos Impact Mixed Fund - Offensive 1.50% 1.10% 0.65% 0.45% n/aTriodos Pioneer Impact Fund 2.10% 1.70% 0.95% 0.95% 0.65%
* The management fees of Triodos Impact Mixed Fund - Neutral became applicable as of July 1, 2019.
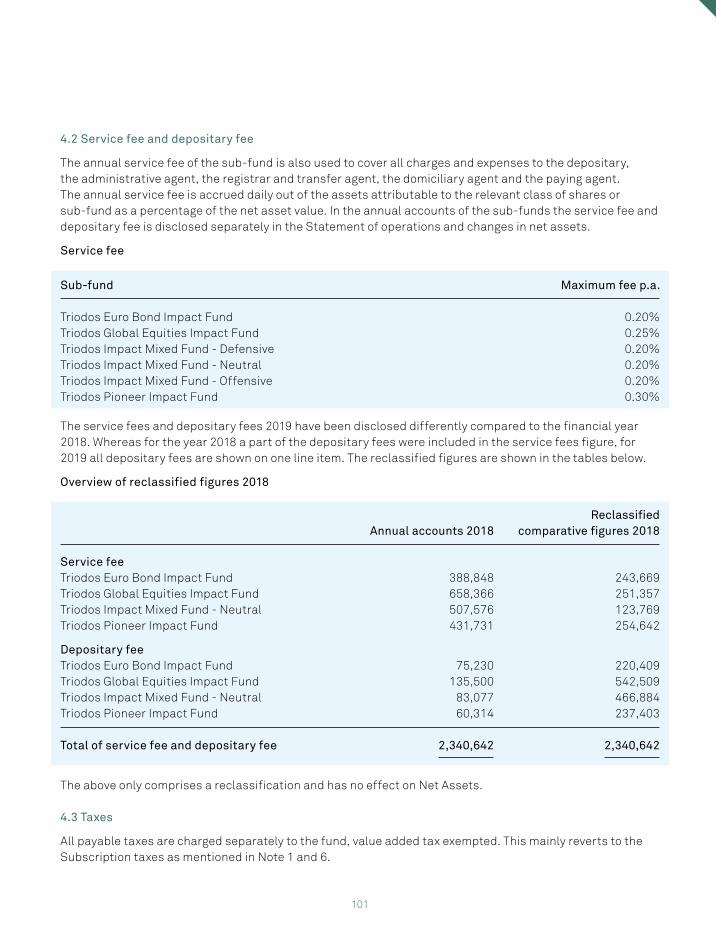
101
4.2 Service fee and depositary fee
The annual service fee of the sub-fund is also used to cover all charges and expenses to the depositary, the administrative agent, the registrar and transfer agent, the domiciliary agent and the paying agent. The annual service fee is accrued daily out of the assets attributable to the relevant class of shares or sub-fund as a percentage of the net asset value. In the annual accounts of the sub-funds the service fee and depositary fee is disclosed separately in the Statement of operations and changes in net assets.
Service fee
Sub-fund Maximum fee p.a.
Triodos Euro Bond Impact Fund 0.20% Triodos Global Equities Impact Fund 0.25% Triodos Impact Mixed Fund - Defensive 0.20% Triodos Impact Mixed Fund - Neutral 0.20% Triodos Impact Mixed Fund - Offensive 0.20% Triodos Pioneer Impact Fund 0.30%
The service fees and depositary fees 2019 have been disclosed differently compared to the financial year 2018. Whereas for the year 2018 a part of the depositary fees were included in the service fees figure, for 2019 all depositary fees are shown on one line item. The reclassified figures are shown in the tables below.
Overview of reclassified figures 2018
Annual accounts 2018Reclassified
comparative figures 2018
Service feeTriodos Euro Bond Impact Fund 388,848 243,669 Triodos Global Equities Impact Fund 658,366 251,357 Triodos Impact Mixed Fund - Neutral 507,576 123,769 Triodos Pioneer Impact Fund 431,731 254,642
Depositary feeTriodos Euro Bond Impact Fund 75,230 220,409 Triodos Global Equities Impact Fund 135,500 542,509 Triodos Impact Mixed Fund - Neutral 83,077 466,884 Triodos Pioneer Impact Fund 60,314 237,403
Total of service fee and depositary fee 2,340,642 2,340,642
The above only comprises a reclassification and has no effect on Net Assets.
4.3 Taxes
All payable taxes are charged separately to the fund, value added tax exempted. This mainly reverts to the Subscription taxes as mentioned in Note 1 and 6.
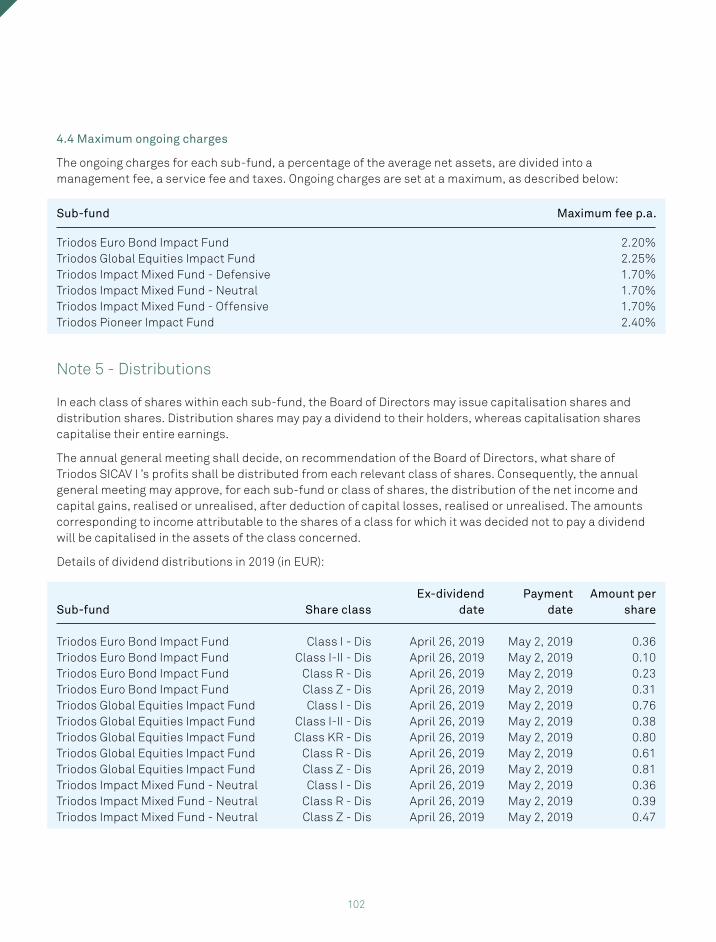
102
4.4 Maximum ongoing charges
The ongoing charges for each sub-fund, a percentage of the average net assets, are divided into a management fee, a service fee and taxes. Ongoing charges are set at a maximum, as described below:
Sub-fund Maximum fee p.a.
Triodos Euro Bond Impact Fund 2.20% Triodos Global Equities Impact Fund 2.25% Triodos Impact Mixed Fund - Defensive 1.70% Triodos Impact Mixed Fund - Neutral 1.70% Triodos Impact Mixed Fund - Offensive 1.70% Triodos Pioneer Impact Fund 2.40%
Note 5 - Distributions
In each class of shares within each sub-fund, the Board of Directors may issue capitalisation shares and distribution shares. Distribution shares may pay a dividend to their holders, whereas capitalisation shares capitalise their entire earnings.
The annual general meeting shall decide, on recommendation of the Board of Directors, what share of Triodos SICAV I ’s profits shall be distributed from each relevant class of shares. Consequently, the annual general meeting may approve, for each sub-fund or class of shares, the distribution of the net income and capital gains, realised or unrealised, after deduction of capital losses, realised or unrealised. The amounts corresponding to income attributable to the shares of a class for which it was decided not to pay a dividend will be capitalised in the assets of the class concerned.
Details of dividend distributions in 2019 (in EUR):
Sub-fund Share classEx-dividend
datePayment
dateAmount per
share
Triodos Euro Bond Impact Fund Class I - Dis April 26, 2019 May 2, 2019 0.36Triodos Euro Bond Impact Fund Class I-II - Dis April 26, 2019 May 2, 2019 0.10Triodos Euro Bond Impact Fund Class R - Dis April 26, 2019 May 2, 2019 0.23Triodos Euro Bond Impact Fund Class Z - Dis April 26, 2019 May 2, 2019 0.31Triodos Global Equities Impact Fund Class I - Dis April 26, 2019 May 2, 2019 0.76Triodos Global Equities Impact Fund Class I-II - Dis April 26, 2019 May 2, 2019 0.38Triodos Global Equities Impact Fund Class KR - Dis April 26, 2019 May 2, 2019 0.80Triodos Global Equities Impact Fund Class R - Dis April 26, 2019 May 2, 2019 0.61Triodos Global Equities Impact Fund Class Z - Dis April 26, 2019 May 2, 2019 0.81Triodos Impact Mixed Fund - Neutral Class I - Dis April 26, 2019 May 2, 2019 0.36Triodos Impact Mixed Fund - Neutral Class R - Dis April 26, 2019 May 2, 2019 0.39Triodos Impact Mixed Fund - Neutral Class Z - Dis April 26, 2019 May 2, 2019 0.47
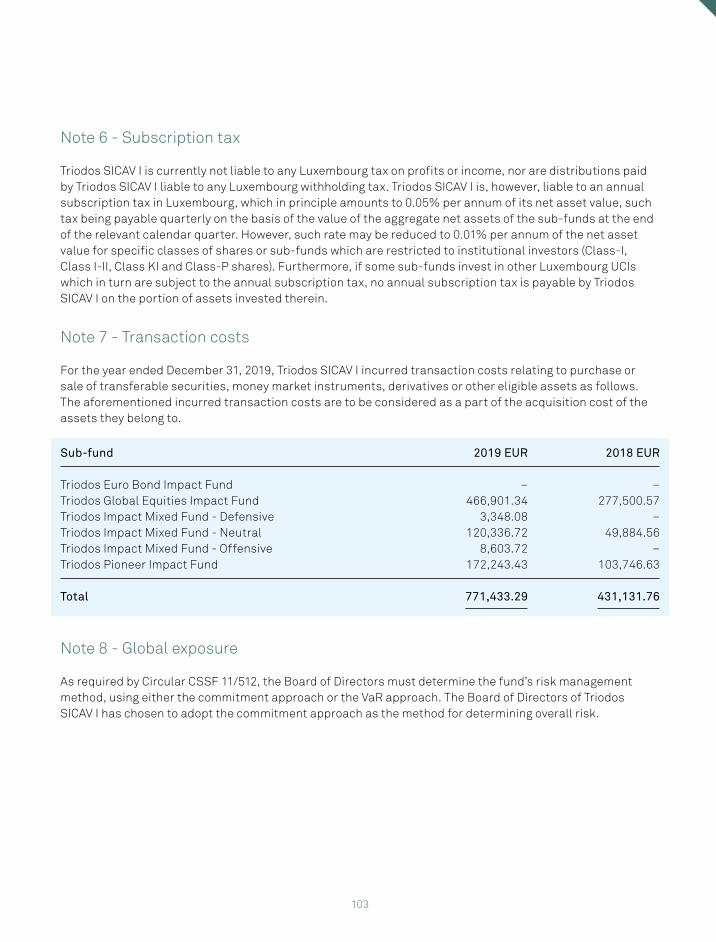
103
Note 6 - Subscription tax
Triodos SICAV I is currently not liable to any Luxembourg tax on profits or income, nor are distributions paid by Triodos SICAV I liable to any Luxembourg withholding tax. Triodos SICAV I is, however, liable to an annual subscription tax in Luxembourg, which in principle amounts to 0.05% per annum of its net asset value, such tax being payable quarterly on the basis of the value of the aggregate net assets of the sub-funds at the end of the relevant calendar quarter. However, such rate may be reduced to 0.01% per annum of the net asset value for specific classes of shares or sub-funds which are restricted to institutional investors (Class-I, Class I-II, Class KI and Class-P shares). Furthermore, if some sub-funds invest in other Luxembourg UCIs which in turn are subject to the annual subscription tax, no annual subscription tax is payable by Triodos SICAV I on the portion of assets invested therein.
Note 7 - Transaction costs
For the year ended December 31, 2019, Triodos SICAV I incurred transaction costs relating to purchase or sale of transferable securities, money market instruments, derivatives or other eligible assets as follows. The aforementioned incurred transaction costs are to be considered as a part of the acquisition cost of the assets they belong to.
Sub-fund 2019 EUR 2018 EUR
Triodos Euro Bond Impact Fund – –Triodos Global Equities Impact Fund 466,901.34 277,500.57Triodos Impact Mixed Fund - Defensive 3,348.08 –Triodos Impact Mixed Fund - Neutral 120,336.72 49,884.56Triodos Impact Mixed Fund - Offensive 8,603.72 –Triodos Pioneer Impact Fund 172,243.43 103,746.63
Total 771,433.29 431,131.76
Note 8 - Global exposure
As required by Circular CSSF 11/512, the Board of Directors must determine the fund’s risk management method, using either the commitment approach or the VaR approach. The Board of Directors of Triodos SICAV I has chosen to adopt the commitment approach as the method for determining overall risk.
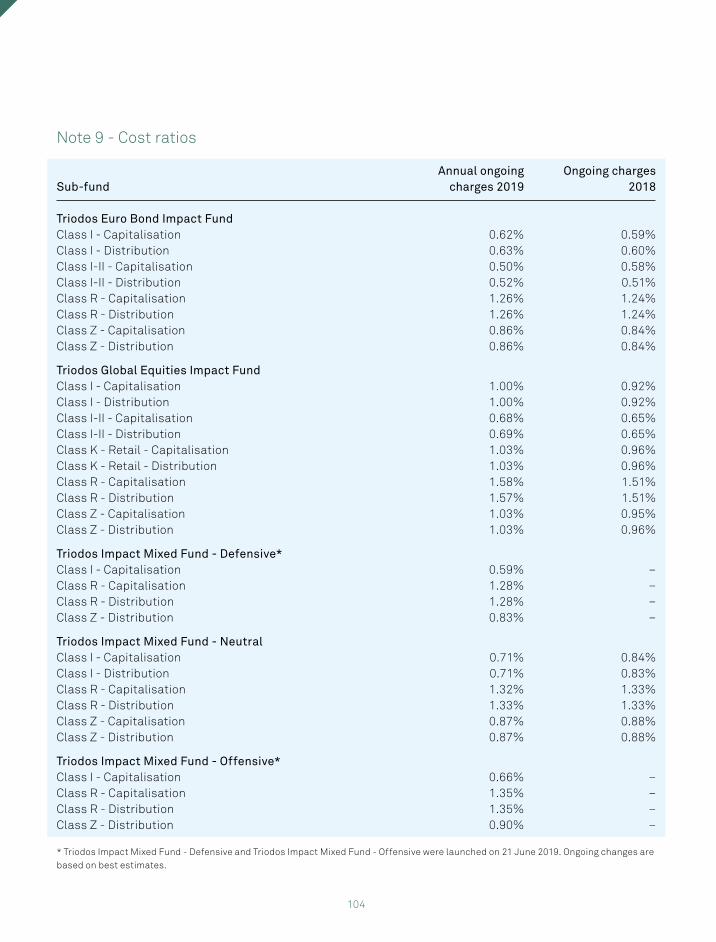
104
Note 9 - Cost ratios
Sub-fundAnnual ongoing
charges 2019Ongoing charges
2018
Triodos Euro Bond Impact FundClass I - Capitalisation 0.62% 0.59%Class I - Distribution 0.63% 0.60%Class I-II - Capitalisation 0.50% 0.58%Class I-II - Distribution 0.52% 0.51%Class R - Capitalisation 1.26% 1.24%Class R - Distribution 1.26% 1.24%Class Z - Capitalisation 0.86% 0.84%Class Z - Distribution 0.86% 0.84%
Triodos Global Equities Impact FundClass I - Capitalisation 1.00% 0.92%Class I - Distribution 1.00% 0.92%Class I-II - Capitalisation 0.68% 0.65%Class I-II - Distribution 0.69% 0.65%Class K - Retail - Capitalisation 1.03% 0.96%Class K - Retail - Distribution 1.03% 0.96%Class R - Capitalisation 1.58% 1.51%Class R - Distribution 1.57% 1.51%Class Z - Capitalisation 1.03% 0.95%Class Z - Distribution 1.03% 0.96%
Triodos Impact Mixed Fund - Defensive*Class I - Capitalisation 0.59% –Class R - Capitalisation 1.28% –Class R - Distribution 1.28% –Class Z - Distribution 0.83% –
Triodos Impact Mixed Fund - NeutralClass I - Capitalisation 0.71% 0.84%Class I - Distribution 0.71% 0.83%Class R - Capitalisation 1.32% 1.33%Class R - Distribution 1.33% 1.33%Class Z - Capitalisation 0.87% 0.88%Class Z - Distribution 0.87% 0.88%
Triodos Impact Mixed Fund - Offensive*Class I - Capitalisation 0.66% –Class R - Capitalisation 1.35% –Class R - Distribution 1.35% –Class Z - Distribution 0.90% –
* Triodos Impact Mixed Fund - Defensive and Triodos Impact Mixed Fund - Offensive were launched on 21 June 2019. Ongoing changes are based on best estimates.
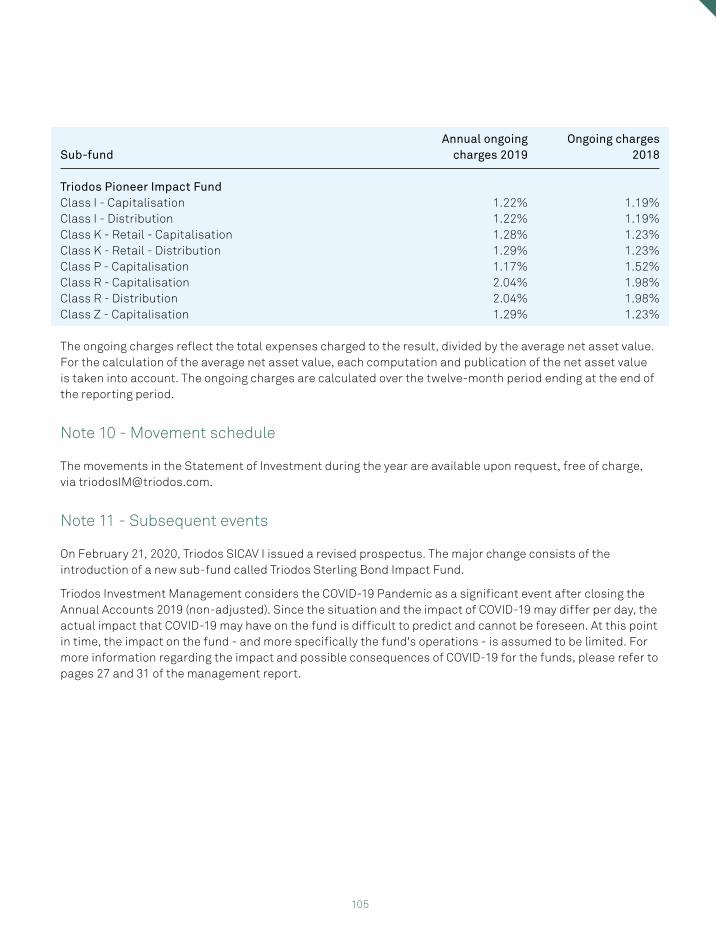
105
Sub-fundAnnual ongoing
charges 2019Ongoing charges
2018
Triodos Pioneer Impact FundClass I - Capitalisation 1.22% 1.19%Class I - Distribution 1.22% 1.19%Class K - Retail - Capitalisation 1.28% 1.23%Class K - Retail - Distribution 1.29% 1.23%Class P - Capitalisation 1.17% 1.52%Class R - Capitalisation 2.04% 1.98%Class R - Distribution 2.04% 1.98%Class Z - Capitalisation 1.29% 1.23%
The ongoing charges reflect the total expenses charged to the result, divided by the average net asset value. For the calculation of the average net asset value, each computation and publication of the net asset value is taken into account. The ongoing charges are calculated over the twelve-month period ending at the end of the reporting period.
Note 10 - Movement schedule
The movements in the Statement of Investment during the year are available upon request, free of charge, via [email protected].
Note 11 - Subsequent events
On February 21, 2020, Triodos SICAV I issued a revised prospectus. The major change consists of the introduction of a new sub-fund called Triodos Sterling Bond Impact Fund.
Triodos Investment Management considers the COVID-19 Pandemic as a significant event after closing the Annual Accounts 2019 (non-adjusted). Since the situation and the impact of COVID-19 may differ per day, the actual impact that COVID-19 may have on the fund is difficult to predict and cannot be foreseen. At this point in time, the impact on the fund - and more specifically the fund's operations - is assumed to be limited. For more information regarding the impact and possible consequences of COVID-19 for the funds, please refer to pages 27 and 31 of the management report.
106
To the Shareholders of
Triodos SICAV I
Our opinion
In our opinion, the accompanying financial statements give a true and fair view of the financial position of Triodos SICAV I (the “Fund”) and of each of its sub-funds as at 31 December 2019, and of the results of their operations and changes in their net assets for the year then ended in accordance with Luxembourg legal and regulatory requirements relating to the preparation and presentation of the financial statements.
What we have audited
The Fund’s financial statements comprise:
• the combined statement of net assets tor the Fund and the statement of net assets tor each of the sub-funds as at 31 December 2019;
• the statement of investments as at 31 December 2019;• the combined statement of operations and changes in net assets for the Fund and the statement of
operations and changes in net assets for each of the sub-funds for the year then ended; and• the notes to the financial statements, which include a summary of significant accounting policies.
Basis for opinion
We conducted our audit in accordance with the Law of 23 July 2016 on the audit profession (Law of 23 July 2016) and with International Standards on Auditing (ISAs) as adopted tor Luxembourg by the “Commission de Surveillance du Secteur Financier” (CSSF). Our responsibilities under the Law of 23 July 2016 and ISAs as adopted tor Luxembourg by the CSSF are further described in the “Responsibilities of the “Réviseur d’entreprises agréé” tor the audit of the financial statements” section of our report.
We believe that the audit evidence we have obtained is sufficient and appropriate to provide a basis for our opinion.
We are independent of the Fund in accordance with the International Ethics Standards Board tor Accountants’ Code of Ethics tor Professional Accountants (IESBA Code) as adopted tor Luxembourg by the CSSF together with the ethical requirements that are relevant to our audit of the financial statements. We have fulfilled our other ethical responsibilities under those ethical requirements.
Other information
The Board of Directors of the Fund is responsible tor the other information. The other information comprises the information stated in the annual report but does not include the financial statements and our audit report thereon.
Our opinion on the financial statements does not cover the other information and we do not express any form of assurance conclusion thereon.
Audit report
PricewaterhouseCoopers, Société coopérative, 2 rue Gerhard Mercator, B.P. 1443, L-1014 LuxembourgT : +352 494848 1, F : +352 494848 2900, www.pwc.lu
Cabinet de révision agréé. Expert-comptable (autorisation gouvernementale n°10028256)R.C.S. Luxembourg B65 477 - TVA LU25482518
107
In connection with our audit of the financial statements, our responsibility is to read the other information identified above and, in doing so, consider whether the other information is materially inconsistent with the financial statements or our knowledge obtained in the audit, or otherwise appears to be materially misstated. If, based on the work we have performed, we conclude that there is a material misstatement of this other information, we are required to report that fact. We have nothing to report in this regard.
Responsibilities of the Board of Directors of the Fund for the financial statements
The Board of Directors of the Fund is responsible for the preparation and fair presentation of the financial statements in accordance with Luxembourg legal and regulatory requirements relating to the preparation and presentation of the financial statements, and for such internal control as the Board of Directors of the Fund determines is necessary to enable the preparation of financial statements that are free from material misstatement, whether due to fraud or error.
In preparing the financial statements, the Board of Directors of the Fund is responsible for assessing the Fund’s and each of its sub-funds’ ability to continue as a going concern, disclosing, as applicable, matters related to going concern and using the going concern basis of accounting unless the Board of Directors of the Fund either intends to liquidate the Fund or close any of its sub-funds or to cease operations, or has no realistic alternative but to do so.
Responsibilities of the “Réviseur d’entreprises agréé” for the audit of the financial statements
The objectives of our audit are to obtain reasonable assurance about whether the financial statements as a whole are free from material misstatement, whether due to fraud or error, and to issue an audit report that includes our opinion. Reasonable assurance is a high level of assurance, but is not a guarantee that an audit conducted in accordance with the Law of 23 July 2016 and with ISAs as adopted for Luxembourg by the CSSF will always detect a material misstatement when it exists. Misstatements can arise from fraud or error and are considered material if, individually or in the aggregate, they could reasonably be expected to influence the economie decisions of users taken on the basis of these financial statements.
As part of an audit in accordance with the Law of 23 July 2016 and with ISAs as adopted for Luxembourg by the CSSF, we exercise professional judgment and maintain professional scepticism throughout the audit. We also:
• identify and assess the risks of material misstatement of the financial statements, whether due to fraud or error, design and perform audit procedures responsive to those risks, and obtain audit evidence that is sufficient and appropriate to provide a basis for our opinion. The risk of not detecting a material misstatement resulting from fraud is higher than for one resulting from error, as fraud may involve collusion, forgery, intentional omissions, misrepresentations, or the override of internal control;
• obtain an understanding of internal control relevant to the audit in order to design audit procedures that are appropriate in the circumstances, but not for the purpose of expressing an opinion on the effectiveness of the Fund’s internal control;
108
• evaluate the appropriateness of accounting policies used and the reasonableness of accounting estimates and related disclosures made by the Board of Directors of the Fund;
• conclude on the appropriateness of the Board of Directors of the Fund’s use of the going concern basis of accounting and, based on the audit evidence obtained, whether a material uncertainty exists related to events or conditions that may cast significant doubt on the Fund’s or any of its sub-funds’ ability to continue as a going concern. If we conclude that a material uncertainty exists, we are required to draw attention in our audit report to the related disclosures in the financial statements or, if such disclosures are inadequate, to modify our opinion. Our conclusions are based on the audit evidence obtained up to the date of our audit report. However, future events or conditions may cause the Fund or any of its sub-funds to cease to continue as a going concern;
• evaluate the overall presentation, structure and content of the financial statements, including the disclosures, and whether the financial statements represent the underlying transactions and events in a manner that achieves fair presentation.
We communicate with those charged with governance regarding, among other matters, the planned scope and timing of the audit and significant audit findings, including any significant deficiencies in internal control that we identify during our audit.
PricewaterhouseCoopers, Société coopérative Luxembourg, 31 March 2020
Represented by
Andreas Drossel
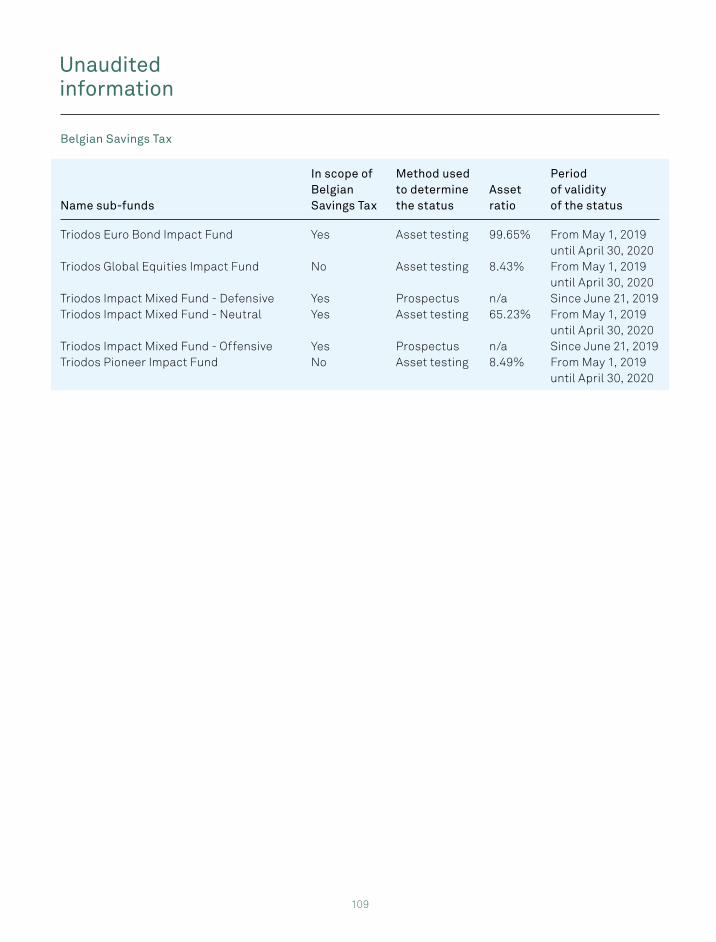
109
Unaudited information
Belgian Savings Tax
Name sub-funds
In scope of Belgian Savings Tax
Method usedto determine the status
Asset ratio
Period of validity of the status
Triodos Euro Bond Impact Fund Yes Asset testing 99.65% From May 1, 2019until April 30, 2020
Triodos Global Equities Impact Fund No Asset testing 8.43% From May 1, 2019until April 30, 2020
Triodos Impact Mixed Fund - Defensive Yes Prospectus n/a Since June 21, 2019Triodos Impact Mixed Fund - Neutral Yes Asset testing 65.23% From May 1, 2019
until April 30, 2020Triodos Impact Mixed Fund - Offensive Yes Prospectus n/a Since June 21, 2019Triodos Pioneer Impact Fund No Asset testing 8.49% From May 1, 2019
until April 30, 2020
110
Registered office
11-13, boulevard de la FoireL-1528 LuxembourgGrand Duchy of Luxembourg
Board of Directors
G.R. PietersChair, Partner of the Directors’ Office Luxembourg
Garry Pieters is an ILA (Institut Luxembourgeois des Administrateurs)-certified director. In addition to his role as Chairman, he oversees the Money Laundering Reporting activities and the handling of complaints. Garry Pieters is a Board Member of several other Luxembourg investment entities, including Sustainability Finance Real Economies fund (SFRE, initiated by the Global Alliance for Banking on Values). He has over 30 years of experience in the field of finance, in particular with ING Group NV. He was fund manager for a number of ING Group’s Luxembourg money market and fixed income funds and was Chief Executive Officer of NN Investment Partners Luxembourg SA and of its Singapore joint venture, as well as Executive Vice President of its Korean joint venture. He is also Chair of the Board of Triodos SICAV II. As at December 31, 2019, Garry Pieters did not hold any shares in the sub-funds of Triodos SICAV I.
M. BachnerIndependent, Founder of Bachner Legal
Monique Bachner is a lawyer and an ILA-certified director. She started her legal career in London, at Freshfields Bruckhaus Deringer, and later moved to Debevoise & Plimpton. She currently has her own law firm, Bachner Legal. Monique Bachner focuses her practice on corporate and funds law, as well as on corporate governance advisory services for Board of Directors. She has served as Member of the Board of several investment funds and non-profit organisations, including the Board of ILA (the Luxembourg Institute of Directors). Monique Bachner is also a Member of the Board of Triodos SICAV II. As at December 31, 2019, Monique Bachner did not hold any shares in the sub-funds of Triodos SICAV I.
M.H.G.E. van Golstein Brouwers (Member of the Board until February 1, 2020)Managing Director of Triodos Regenerative Money Centre
Marilou van Golstein Brouwers is the former Chair of Triodos Investment Management and Triodos Investment Advisory Services BV (until January 1, 2019). As of April 1 2019, she became managing director of Triodos Regenerative Money Centre. In addition, she is a Member of the Board of Stichting Triodos Renewable Energy for Development Fund, and Chair of the Board of Stichting Triodos Foundation. She is also a Member of the Board of Triodos SICAV II (until February 1, 2020). Furthermore, Marilou van Golstein Brouwers is a Member of the Board of the Global Impact Investing Network (GIIN), Chair of the Supervisory Board of B Lab Europe, Chair of the Supervisory Board of Qredits, member of the Advisory Board Responsible Investment (‘ABRI’) of PGGM, member of the Supervisory Board of Stichting BRAC Foundation, Chair of the Supervisory Board of BRAC International Holdings BV and member of the We-Fi’s Leadership Champions, the Women Entrepreneurs Finance Initiative housed in the World Bank. As at December 31, 2019, Marilou van Golstein Brouwers did not hold any shares in the sub-funds of Triodos SICAV I.
C. MolitorIndependent, Director of Innpact
After a career of more than 20 years in the Luxembourg financial sector, Corinne Molitor is a partner of Innpact, a private company dedicated to consulting and management support services for innovative and sustainable impact finance initiatives. Corinne Molitor is furthermore actively involved in impact investing through a number of activities: she co-chairs the ALFI Responsible Investing Committee and is the chairperson of ADA Asbl, an NGO specialised in microfinance and inclusive finance. Corinne Molitor is also a Member of the Board of Triodos SICAV II. As at December 31, 2019, Corinne Molitor held 138 shares in Triodos Pioneer Impact Fund.
Management and administration
111
D.J. van OmmerenManaging Director of Triodos Investment Management
Dick van Ommeren is Managing Director at Triodos Investment Management and Triodos Investment Advisory Services BV. Within the Management Board of Triodos Investment Management he is responsible for the business lines Impact Equities & Bonds, Commercial and Operations. He has a long-standing experience in the financial sector. He previously worked at ABN AMRO MeesPierson, where he was Managing Director Marketing & Products and member of the management group of ABN AMRO Bank. Furthermore, on February 2, 2020, Dick van Ommeren was appointed chairman of the Board of Directors of Dutch Fund and Asset Management Association (DUFAS). As at December 31, 2019, Dick van Ommeren did not hold any shares in the sub-funds of Triodos SICAV I.
Management company
Triodos Investment Management BVRegistered office:Nieuweroordweg 13704 EC ZeistThe NetherlandsPostal address:P.O. Box 553700 AB ZeistThe Netherlands
Triodos Investment Management is the management company of Triodos SICAV I. The Management Board of Triodos Investment Management has the following members:
J.J. MinnaarJacco Minnaar is Chair of the Management Board (as of January 1, 2019) of Triodos Investment Management and Triodos Investment Advisory & Services BV. In addition, he is a Member of the Board of Stichting Hivos-Triodos Fonds. As at December 31, 2019, Jacco Minnaar did not hold any shares in Triodos SICAV I.
K. BosscherKor Bosscher is Director Risk and Finance at Triodos Investment Management and Triodos Investment Advisory & Services BV. As at December 31, 2019, Kor Bosscher held 594.807 shares in Triodos Global Equities Impact Fund.
D.J. van OmmerenDick van Ommeren is Managing Director at Triodos Investment Management and Triodos Investment Advisory & Services BV. He is a Member of the Board of Triodos SICAV I and since February 2, 2020, chairman of the Board of the Dutch Fund and Asset Management Association (DUFAS). As at December 31, 2019, Dick van Ommeren did not hold any shares in the sub-funds of Triodos SICAV I.
Director Impact Equities & Bonds (IE&B)
F.C. BreenUntil December 31, 2019, Erik Breen was Director IE&B.As of February 1, 2020, William de Vries is Director IE&B.
Triodos Euro Bond Impact Fund
W. de VriesFund Manager, Triodos Euro Bond Impact Fund
William de Vries joined Triodos Investment Management in 2017 as fund manager of Triodos Euro Bond Impact Fund, bringing over 25 years of experience in the industry. Prior to Triodos, William spent nearly 10 years at Kempen Capital Management as Head of Core Fixed Income. Prior, he held several portfolio management and director positions at Philips Pension Fund, Merrill Lynch Investment Managers and BlackRock. William studied International Economics at Tilburg University and is registered as a DSI- and CEFA (VBA) analyst. As at December 31, 2019, William de Vries did not hold any shares in Triodos Euro Bond Impact Fund.
112
Triodos Global Equities Impact Fund
P.J. HüskenFund Manager, Triodos Global Equities Impact Fund
Pieter-Jan Hüsken joined Triodos Investment Management on 1 January 2018 as fund manager of Triodos Global Equities Impact Fund. Pieter-Jan brings a long track-record of almost 25 years of active fund management, lastly in his position as Senior Portfolio Manager Equities with Actiam. Pieter-Jan holds a Master’s degree in Finance from Tilburg University. As at December 31, 2019, Pieter-Jan Hüsken did not hold any shares in Triodos Global Equities Impact Fund.
Triodos Impact Mixed Fund Defensive, Neutral and Offensive
R. van de BeltFund Manager Triodos Impact Mixed Fund
Ruth van de Belt is responsible for asset allocation decisions for the Defensive, Neutral, and Offensive strategies. Prior to her position as Fund Manager, Ruth served as Senior Investment Strategist, developing strategic and tactical asset allocations for all of Triodos IM’s impact equity and bond funds. Before joining Triodos IM in 2018, she held several investment strategist and economist positions at Kempen Capital Management, Rabobank, and The Netherlands Competition Authority. She holds a Master’s in Econometrics and in Economics from the University of Amsterdam and a Master’s in VBA Investment Management from VU Amsterdam. She is also a registered CFA (VBA) analyst. As at December 31, 2019, Ruth van de Belt held 30.986 shares in Triodos Impact Mixed Fund - Neutral.
Triodos Pioneer Impact Fund
D. HoozemansFund Manager, Triodos Pioneer Impact Fund
Dirk Hoozemans joined Triodos Investment Management in 2017 as fund manager of Triodos Pioneer Impact Fund. Dirk previously worked at Robeco, where he served in various senior portfolio management positions in Rotterdam, Boston and Hong Kong, including portfolio manager of Robeco
Global Energy Fund and deputy portfolio manager of the Robeco NV fund. Dirk studied Econometrics at Tilburg University, and is a CFA Charterholder. As at December 31, 2019, Dirk Hoozemans held 110 shares in Triodos Pioneer Impact Fund.
Head of Triodos Research
H.W. StegemanTriodos Research is headed by Hans Stegeman. He has over twenty years of experience as an economist and strategist and joined Triodos Investment Management in 2017. As at December 31, 2019, Hans Stegeman did not hold any shares in the sub-funds of Triodos SICAV I.
Distributor
Triodos Investment Management BVRegistered office:Nieuweroordweg 13704 EC ZeistThe Netherlands+31 30 693 65 00Postal address:P.O. Box 553700 AB ZeistThe Netherlands
Depositary, custodian, administrative agent, registrar and transfer agent, paying agent
RBC Investor Services Bank SA14, Porte de FranceL-4360 Esch-sur-AlzetteGrand Duchy of Luxembourg
Auditor
PricewaterhouseCoopers, Société coopérative2, rue Gerhard MercatorL-2182 LuxembourgGrand Duchy of Luxembourg
Legal advisor in Luxembourg
Arendt & Medernach SA41A, avenue John F. KennedyL-2082 LuxembourgGrand Duchy of Luxembourg
113
Colophon
Triodos SICAV I annual report 2019
PublishedApril 2020
TextTriodos Investment Management, Zeist
DesignMichael Nash Associates, London
LayoutVia Bertha, Utrecht
If you have any comments or questions about this report, please contact Triodos Investment Management. This document can be downloaded from: www.triodos-im.com.