Embed Size (px)
Citation preview

Treasurer’s ReportRalph Tingle
ANNUAL GENERAL MEETING 2012

What it covers
Financial results for 2011
How we compared to similar charities
Balance Sheet and Investments
Latest Position for 2012
Reserves
Conclusion

Original Budget for 2011
National
Programmes Local Groups Total
£’000 £’000 £’000
Income 16,854 3,600 20,454
Expenditure (21,983) (2,800) (24,783)
Surplus/(Deficit) (5,129) 800 (4,329)

Overall Position for 2011
National
Programmes Local groups Total
£’000 £’000 £’000
Income 17,982 3,941 21,923
Expenditure (20,867) (2,814) (23,681)
Surplus/(Deficit) (2,885) 1,127 (1,758)
Gain / (loss) on Investments 268 (2) 266
Transfer of Funds 1,773 (1,773) -
Net (Deficit) (844) (648) (1,492)
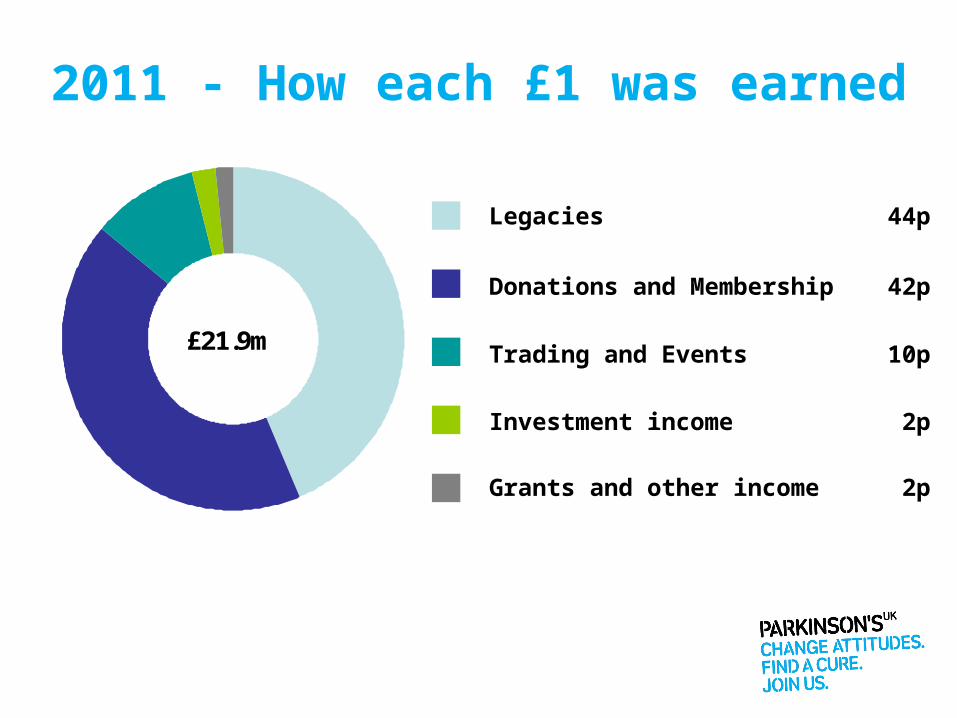
2011 - How each £1 was earned
£21.9m
Legacies 44p
Donations and Membership 42p
Trading and Events 10p
Investment income 2p
Grants and other income 2p

2011 – Where each £1 came from
£21.9m
Local Groups 18p
National Programmes 82p

2011 - How each £1 was spent
£23.7m
Friendship and Support 31p
Information 23p
Research 20p
Cost of generating funds 18p
Campaigning 6p
Governance costs 2p

Expenditure by type (£m)
0
5
10
15
20
2011 2010 2009 2008 2007
Governance Charitable Expenditure Cost of generating funds
£m
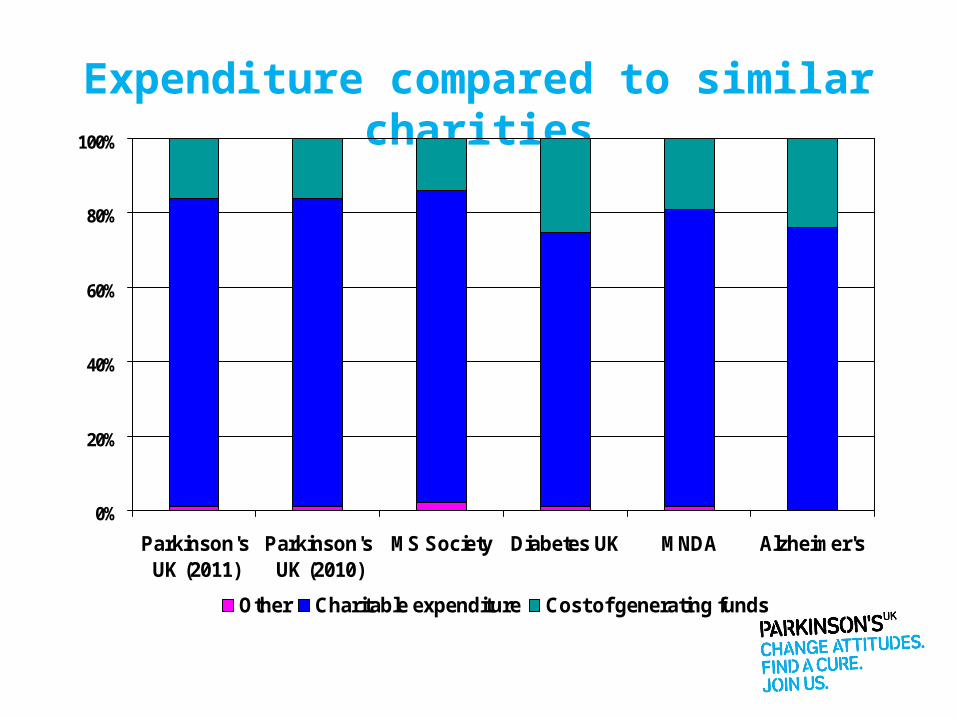
Expenditure compared to similar charities
0%
20%
40%
60%
80%
100%
Parkinson'sUK (2011)
Parkinson'sUK (2010)
MS Society Diabetes UK MNDA Alzheimer's
Other Charitable expenditure Cost of generating funds

Return on fundraising compared to similar charities
0
1
2
3
4
5
6
Parkinson'sUK (2011)
Parkinson'sUK (2010)
MS Society Diabetes UK MNDA Alzheimer's
£1 spent on fundraising generates....
£

Balance Sheet at 31 Dec 2011
£’000
Buildings / other tangible fixed assets 2,407Investments and short term cash deposits 21,045
23,452Cash at hand 6,496Amounts owing to us 1,410 Amounts owing or committed by us (14,250)NET ASSETS = RESERVES 17,108

Investments
0
5
10
15
20
25
30
2008 2009 2010 2011 Jul-12Year End
£m
Other
Shares
Bonds
CashFunds
CashDeposit

Latest Position for 2012
BudgetLatest
Forecast
£’000 £’000
Income 23,576 23,545
Expenditure (27,000) (26,922)
Deficit (3,424) (3,377)
Gain / (loss) on Investments 175 175
Net Deficit (3,249) (3,202)

Latest Forecast of Published Reserves
National
Programmes Local groups Total
£’000 £’000 £’000
Balance 31/12/10 11,245 7,355 18,600
Movement in 2011 (844) (648) (1,492)
Balance 31/12/11 10,401 6,707 17,108
Forecast Movement 2012 (2,702) (500) (3,202)
Forecast 31/12/12 7,699 6,207 13,906
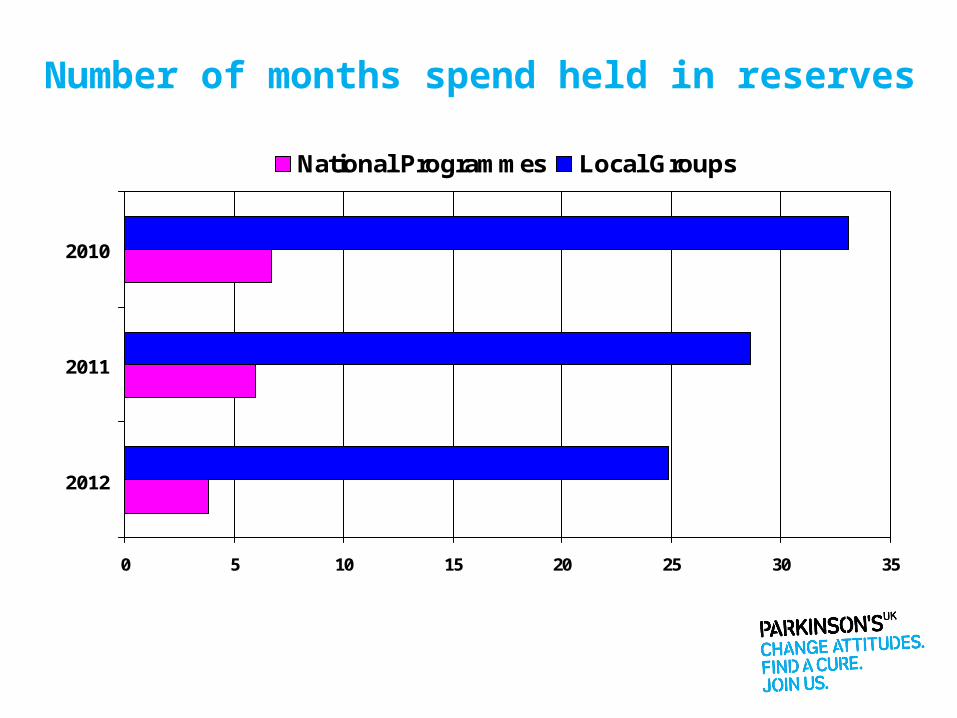
Number of months spend held in reserves
0 5 10 15 20 25 30 35
2012
2011
2010
National Programmes Local Groups
Year
Months
forecast

Conclusion
Income continues to grow – and beat expectations
Increased investment in core activities continues
Performing well compared to similar charities
Reserves reducing but pressures remain to address high levels of local reserves
Approval given to the Financial Statements by Crowe Clark Whitehill LLP
Financial Statements require adoption by Annual General Meeting

Any questions?
ANNUAL GENERAL MEETING 2012