Embed Size (px)
Citation preview

TIFF Investment Program2019 Semi-Annual Report JUNE 30, 2019 (Unaudited)
CONTENTS
TIFF Multi-Asset Fund
Internet Availability of Shareholder Reports 2
Fund Expenses 3
Financial Highlights 4
Schedule of Investments 5
Statement of Assets and Liabilities 33
Statement of Operations 34
Statements of Changes in Net Assets 35
Statement of Cash Flows 36
Notes to Financial Statements 37
Additional Information 54
Approval of Money Manager Agreements 55
Index Descriptions 62
TIFF Short-Term Fund
Internet Availability of Shareholder Reports 63
Fund Expenses 63
Financial Highlights 64
Schedule of Investments 65
Statement of Assets and Liabilities 66
Statement of Operations 67
Statements of Changes in Net Assets 68
Notes to Financial Statements 69
Additional Information 73
Governance
Trustees and Principal Officers 74
ABOUT TIFF
TIFF, founded in 1991, is a not-for-profit organization thatseeks to improve the investment returns of endowednon-profits by making available to them a series of multi-manager investment strategies, plus resources aimed atenhancing fiduciaries’ knowledge of investing.
TIFF MUTUAL FUNDS
TIFF Investment Program (TIP) is comprised of no-loadmutual funds available primarily to foundations,endowments, other 501(c)(3) organizations, and certainother non-profit organizations meeting specified accredi-tation requirements. TIP consists of two mutual funds atpresent: TIFF Multi-Asset Fund (MAF) and TIFF Short-TermFund (STF). TIFF Advisory Services, Inc. (TIFF) serves as theinvestment advisor to the funds. MAF operates primarily ona multi-manager basis, and TIFF has responsibility for thetime-intensive task of selecting money managers and othervendors for the fund as well as for the all-important task ofasset allocation. With respect to STF, TIFF is responsible forthe day-to-day management of all of the fund’s assets.
FINANCIAL STATEMENTS
TIP is pleased to provide this Semi-Annual Report for theperiod ended June 30, 2019.
FOR FURTHER INFORMATION
As always, we welcome the opportunity to discuss any aspectof TIFF’s services as well as answer any questions aboutthese financial statements. For further information aboutTIFF, please call us at 610-684-8200 or visit www.tiff.org.
August 26, 2019
Copyright � 2019 • All rights reserved • This report is intended for institutional investors only and may not be reproduced or distributed without written permission from TIFF.

INTERNET AVAILABILITY OF SHAREHOLDER REPORTS
Beginning on January 2, 2021, as permitted by regulations adopted by the U.S. Securities and Exchange Commission, papercopies of TIFF Multi-Asset Fund’s (the ‘‘Fund’’) annual and semi-annual shareholder reports will no longer be sent by mail,unless you specifically request paper copies of these reports from the Fund. Instead, these reports will be made available onthe Fund’s website, and you will be notified by e-mail each time a report is posted and provided with a website link to accessthe report.
If you already elected to receive shareholder reports electronically, you will not be affected by this change and you need nottake any action. You may elect to receive shareholder reports and other communications from the Fund electronically at anytime by calling TIFF Member Services at 800-984-0084 or by sending an e-mail request to [email protected].
You may elect to receive all future shareholder reports in paper free of charge. You can inform the Fund that you wish tocontinue receiving paper copies of your shareholder reports by calling TIFF Member Services at 800-984-0084 or by sending ane-mail request to [email protected]. Your election to receive reports in paper will apply to all TIP funds that you hold.
SUMMARY SCHEDULE OF INVESTMENTS (UNAUDITED)
Foreign Common Stocks 38.0%US Common Stocks 22.0%Private Investment Funds 13.1%US Treasury Bills 9.5%US Treasury Bonds/Notes 8.1%Exchange-Traded Funds (ETFs) 7.4%Repurchase Agreement 4.3%Preferred Stocks 0.2%Publicly Traded Limited Partnerships 0.1%Rights 0.0%Warrants 0.0%Convertible Bonds 0.0%Purchased Option Contracts 0.0%Disputed Claims Receipt 0.0%Total Investments 102.7%Securities Sold Short (6.6)%Other Assets in Excess of Other Liabilities 3.9%Net Assets 100.0%
Fund holdings and sector weightings are subject to change and should not be considered a recommendation to buy or sell anysecurity. Please refer to the Schedule of Investments for complete holdings information. Current and future holdings aresubject to risk. Diversification does not ensure a profit or protect against loss in declining markets.
TIFF MULTI-ASSET FUND JUNE 30, 2019
MULTI-A
SSET
2

FUND EXPENSES (UNAUDITED)
As a shareholder of a fund, you incur two types of costs: (1) transaction costs, including entry and exit fees; and (2) ongoingcosts, including management fees and other fund expenses. This example is intended to help you understand your ongoingcosts (in dollars) of investing in the fund and to compare these costs with the ongoing costs of investing in other mutual funds.
The example is based on an investment of $1,000 invested at the beginning of the period and held for the entire period fromJanuary 1, 2019 to June 30, 2019.
Actual Expenses
The first line of the table below provides information about actual account values and actual expenses. You may use theinformation in this line, together with the amount you invested, to estimate the expenses that you paid over the period. Simplydivide your account value by $1,000 (for example, an $8,600 account value divided by $1,000 = 8.6), then multiply the result bythe number in the first line under the heading entitled ‘‘Expenses Paid During the Period’’ to estimate the expenses you paidon your account during this period.
Hypothetical Example for Comparison Purposes
The second line of the table below provides information about hypothetical account values and hypothetical expenses basedon the fund’s actual expense ratio and an assumed rate of return of 5% per year before expenses, which is not the fund’sactual return. The hypothetical account values and expenses may not be used to estimate the actual ending account balance orexpenses you paid for the period. You may use this information to compare the ongoing costs of investing in the fund andother funds. To do so, compare this 5% hypothetical example with the 5% hypothetical examples that appear in theshareholder reports of the other funds.
Please note that the expenses shown in the table are meant to highlight your ongoing costs only and do not reflect anytransactional costs, such as entry fees or exit fees. Therefore, the second line of the table is useful in comparing ongoing costsonly, and will not help you determine the relative total costs of owning different funds. In addition, if these transactional costswere included, your costs would have been higher.
Including Expenses forSecurities Sold Short*
Excluding Expenses forSecurities Sold Short*
BeginningAccount Value
1/1/19
EndingAccount Value
6/30/19
Expenses PaidDuring thePeriod**
1/1/19 − 6/30/19
BeginningAccount Value
1/1/19
EndingAccount Value
6/30/19
Expenses PaidDuring thePeriod**
1/1/19 − 6/30/19
1) Actual $1,000.00 $1,121.50 $5.15 $1,000.00 $1,121.50 $4.212) Hypothetical $1,000.00 $1,019.93 $4.91 $1,000.00 $1,020.83 $4.01* Expenses for Securities Sold Short include interest expense and dividends paid on securities sold short and broker fees on securities sold
short.** Expenses are equal to the fund’s annualized expense ratio of 0.98% (calculated over a six-month period, which may differ from the
fund’s actual expense ratio for the full year), multiplied by the average account value over the period, multiplied by 181/365 (to reflectthe one-half year period). Excluding interest and dividend expense, expenses incurred by the fund were 0.80%. The expense ratios donot include the fees and expenses associated with investments made in acquired funds; such fees and expenses are reflected in theacquired funds’ total return.
TIFF MULTI-ASSET FUND JUNE 30, 2019
MULTI-A
SSET
3
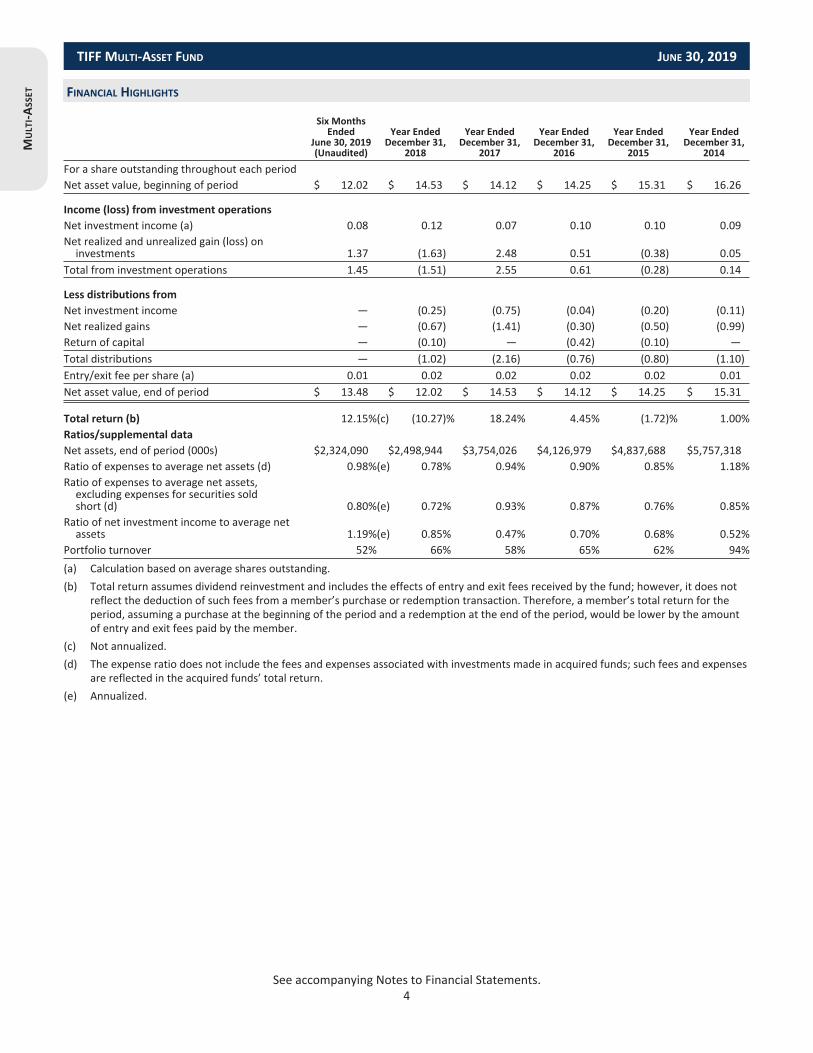
FINANCIAL HIGHLIGHTS
Six MonthsEnded
June 30, 2019(Unaudited)
Year EndedDecember 31,
2018
Year EndedDecember 31,
2017
Year EndedDecember 31,
2016
Year EndedDecember 31,
2015
Year EndedDecember 31,
2014For a share outstanding throughout each periodNet asset value, beginning of period $ 12.02 $ 14.53 $ 14.12 $ 14.25 $ 15.31 $ 16.26
Income (loss) from investment operationsNet investment income (a) 0.08 0.12 0.07 0.10 0.10 0.09Net realized and unrealized gain (loss) oninvestments 1.37 (1.63) 2.48 0.51 (0.38) 0.05
Total from investment operations 1.45 (1.51) 2.55 0.61 (0.28) 0.14
Less distributions fromNet investment income — (0.25) (0.75) (0.04) (0.20) (0.11)Net realized gains — (0.67) (1.41) (0.30) (0.50) (0.99)Return of capital — (0.10) — (0.42) (0.10) —Total distributions — (1.02) (2.16) (0.76) (0.80) (1.10)Entry/exit fee per share (a) 0.01 0.02 0.02 0.02 0.02 0.01Net asset value, end of period $ 13.48 $ 12.02 $ 14.53 $ 14.12 $ 14.25 $ 15.31
Total return (b) 12.15%(c) (10.27)% 18.24% 4.45% (1.72)% 1.00%Ratios/supplemental dataNet assets, end of period (000s) $2,324,090 $2,498,944 $3,754,026 $4,126,979 $4,837,688 $5,757,318Ratio of expenses to average net assets (d) 0.98%(e) 0.78% 0.94% 0.90% 0.85% 1.18%Ratio of expenses to average net assets,excluding expenses for securities soldshort (d) 0.80%(e) 0.72% 0.93% 0.87% 0.76% 0.85%
Ratio of net investment income to average netassets 1.19%(e) 0.85% 0.47% 0.70% 0.68% 0.52%
Portfolio turnover 52% 66% 58% 65% 62% 94%(a) Calculation based on average shares outstanding.(b) Total return assumes dividend reinvestment and includes the effects of entry and exit fees received by the fund; however, it does not
reflect the deduction of such fees from a member’s purchase or redemption transaction. Therefore, a member’s total return for theperiod, assuming a purchase at the beginning of the period and a redemption at the end of the period, would be lower by the amountof entry and exit fees paid by the member.
(c) Not annualized.(d) The expense ratio does not include the fees and expenses associated with investments made in acquired funds; such fees and expenses
are reflected in the acquired funds’ total return.(e) Annualized.
TIFF MULTI-ASSET FUND JUNE 30, 2019
MULTI-A
SSET
See accompanying Notes to Financial Statements.4

Numberof Shares Value
Investments— 102.7% of net assets
Common Stocks— 60.0%
US Common Stocks— 22.0%
Airlines— 1.2%American Airlines Group, Inc. 115,205 $ 3,756,835Delta Air Lines, Inc. 244,047 13,849,667Southwest Airlines Co. 15,243 774,040Spirit Airlines, Inc. (a) 2,152 102,715United Continental Holdings, Inc. (a) 98,016 8,581,301
27,064,558
Auto Components — 0.0%Adient plc 7,190 174,501Dana, Inc. 1,286 25,643Lear Corp. (b) 4,209 586,188
786,332
Automobiles — 0.0%Ford Motor Co. 22,630 231,505General Motors Co. 5,471 210,798Thor Industries, Inc. 1,163 67,977
510,280
Beverages— 0.4%Coca-Cola Co. (The) 2,425 123,481Monster Beverage Corp. (a) 16,537 1,055,557PepsiCo, Inc. 58,499 7,670,974
8,850,012
Biotechnology— 0.3%Alexion Pharmaceuticals, Inc. (a) 2,081 272,569Alnylam Pharmaceuticals, Inc. (a) 3,045 220,945Amgen, Inc. 4,445 819,125Biogen, Inc. (a) (b) 9,227 2,157,919Celgene Corp. (a) (b) 3,447 318,641Exelixis, Inc. (a) 71,376 1,525,305Gilead Sciences, Inc. (b) 19,381 1,309,380Incyte Corp. (a) (b) 2,879 244,600Ionis Pharmaceuticals, Inc. (a) 1,038 66,712Regeneron Pharmaceuticals, Inc. (a) 491 153,683United Therapeutics Corp. (a) (b) 7,399 577,566
7,666,445
Building Products — 0.0%Masco Corp. 17,603 690,742Owens Corning 668 38,877
729,619
Capital Markets — 0.1%Ameriprise Financial, Inc. 5,127 744,235BlackRock, Inc. 366 171,764KKR & Co., Inc., Class A 8,833 223,210Morgan Stanley 8,876 388,857S&P Global, Inc. 1,339 305,011Stifel Financial Corp. 1,566 92,488T. Rowe Price Group, Inc. 503 55,184
1,980,749
Numberof Shares Value
Chemicals — 0.2%Cabot Corp. 1,768 $ 84,351Celanese Corp. (b) 5,768 621,790Corteva, Inc. (a) 1,209 35,750Dow, Inc. (a) 1,209 59,616DuPont de Nemours, Inc. 1,209 90,760Eastman Chemical Co. (b) 2,891 225,007Huntsman Corp. 2,213 45,234Ingevity Corp. (a) 277 29,132LyondellBasell Industries NV, Class A (b) 20,996 1,808,385Mosaic Co. (The) 5,203 130,231Scotts Miracle-Gro Co. (The) 1,214 119,579Sherwin-Williams Co. (The) 895 410,170
3,660,005
Commercial Banks— 0.2%Bank OZK 609 18,325Citizens Financial Group, Inc. 30,313 1,071,868Huntington Bancshares, Inc. 3,932 54,340PNC Financial Services Group, Inc. (The) 4,265 585,499SunTrust Banks, Inc. 2,233 140,344Wells Fargo & Co. (b) 34,311 1,623,597
3,493,973
Commercial Services & Supplies — 0.1%Clean Harbors, Inc. (a) 3,400 241,740Deluxe Corp. 5,623 228,631Herman Miller, Inc. 1,868 83,500HNI Corp. 14,463 511,701MSA Safety, Inc. 1,571 165,568Waste Management, Inc. (b) 3,569 411,755
1,642,895
Communications Equipment— 0.2%Arista Networks, Inc. (a) (b) 524 136,041Ciena Corp. (a) (b) 7,584 311,930Cisco Systems, Inc. 51,315 2,808,470CommScope Holding Co., Inc. (a) 12,960 203,861F5 Networks, Inc. (a) 1,620 235,920Juniper Networks, Inc. (b) 24,026 639,812QUALCOMM, Inc. 15,199 1,156,188
5,492,222
Computers & Peripherals — 0.4%Apple, Inc. (b) 29,091 5,757,691Dell Technologies, Inc., Class C (a) 236 11,989Hewlett Packard Enterprise Co. 46,370 693,231HP, Inc. 51,995 1,080,976NetApp, Inc. 5,945 366,807Seagate Technology plc 11,443 539,194Western Digital Corp. 1,473 70,041Xerox Corp. 1,132 40,084
8,560,013
Construction & Engineering— 0.1%Fluor Corp. 748 25,200NVR, Inc. (a) 166 559,461
TIFF MULTI-ASSET FUND / SCHEDULE OF INVESTMENTS (UNAUDITED)* JUNE 30, 2019
MULTI-A
SSET
5

Numberof Shares Value
PulteGroup, Inc. 20,996 $ 663,894Quanta Services, Inc. 9,966 380,602Toll Brothers, Inc. 2,700 98,874
1,728,031
Consumer Finance— 0.2%Ally Financial, Inc. 20,087 622,496American Express Co. 6,314 779,400Capital One Financial Corp. (b) 12,670 1,149,676Discover Financial Services 8,021 622,349FirstCash, Inc. 2,340 234,047Synchrony Financial 51,738 1,793,757
5,201,725
Containers & Packaging— 0.0%Sealed Air Corp. 6,330 270,797WestRock Co. 1,506 54,924
325,721
Diversified Consumer Services — 0.0%Sotheby's (a) 2,920 169,740Weight Watchers International,Inc. (a) (b) 24,952 476,583
646,323
Diversified Financial Services — 0.4%AXA Equitable Holdings, Inc. 14,568 304,471Bank of America Corp. 109,360 3,171,440Citigroup, Inc. 46,108 3,228,943CME Group, Inc. 123 23,876Jefferies Financial Group, Inc. 11,615 223,356JPMorgan Chase & Co. (b) 17,387 1,943,867Moody's Corp. (b) 1,193 233,005Tortoise Acquisition Corp. - Unit (a) 128,669 1,286,690Washington Mutual, Inc. (a) (c) (d) 33,600 —
10,415,648
Diversified Telecommunication Services — 0.1%AT&T, Inc. 9,776 327,594CenturyLink, Inc. 10,674 125,526Verizon Communications, Inc. 33,949 1,939,506
2,392,626
Electric Utilities — 0.1%American Electric Power Co., Inc. 315 27,723Exelon Corp. (b) 57,075 2,736,175IDACORP, Inc. 2,151 216,025Pinnacle West Capital Corp. 2,429 228,545
3,208,468
Electrical Equipment— 0.0%AMETEK, Inc. 4,620 419,681Eaton Corp. plc (b) 1,451 120,839GrafTech International, Ltd. 7,616 87,584
628,104
Electronic Equipment, Instruments & Components — 0.1%Avnet, Inc. 905 40,969Belden, Inc. 1,196 71,246
Numberof Shares Value
CDW Corp. 5,622 $ 624,042Coherent, Inc. (a) 510 69,549Corning, Inc. 2,159 71,743Keysight Technologies, Inc. (a) (b) 4,794 430,549Tech Data Corp. (a) 3,711 388,171Vishay Intertechnology, Inc. 10,562 174,484
1,870,753
Energy Equipment & Services— 0.0%Halliburton Co. 913 20,762McDermott International, Inc. (a) 33,081 319,562Nabors Industries, Ltd. 16,012 46,435Patterson-UTI Energy, Inc. 12,800 147,328RPC, Inc. 6,318 45,553
579,640
Food & Beverage— 0.2%Curtiss-Wright Corp. 213 27,079Huntington Ingalls Industries, Inc. (b) 4,141 930,648L3 Technologies, Inc. (b) 395 96,842Lockheed Martin Corp. 1,517 551,490Raytheon Co. 6,042 1,050,583Spirit AeroSystems Holdings, Inc.,Class A 12,176 990,761
3,647,403
Food & Staples Retailing— 0.2%Costco Wholesale Corp. 6,070 1,604,058Kroger Co. (The) 40,172 872,134Walmart, Inc. (b) 19,599 2,165,494
4,641,686
Food Products — 0.4%Archer-Daniels-Midland Co. 15,205 620,364General Mills, Inc. 1,921 100,891Hershey Co. (The) 2,124 284,680McCormick & Co., Inc. 32,902 5,100,139Pilgrim's Pride Corp. (a) 5,869 149,014Tyson Foods, Inc., Class A 23,341 1,884,552
8,139,640
Health Care Equipment & Supplies — 1.3%Align Technology, Inc. (a) 1,608 440,110Baxter International, Inc. (b) 17,949 1,470,023Becton Dickinson and Co. 8,674 2,185,935Boston Scientific Corp. (a) 1,038 44,613Danaher Corp. (b) 10,700 1,529,244DENTSPLY SIRONA, Inc. 2,405 140,356DexCom, Inc. (a) 21,074 3,157,728Edwards Lifesciences Corp. (a) 1,623 299,833Globus Medical, Inc., Class A (a) 1,157 48,941Haemonetics Corp. (a) 4,918 591,832IDEXX Laboratories, Inc. (a) 34,811 9,584,513Inogen, Inc. (a) (b) 10,601 707,723Intuitive Surgical, Inc. (a) (b) 68 35,669Masimo Corp. (a) 1,882 280,079NuVasive, Inc. (a) 5,638 330,048
TIFF MULTI-ASSET FUND / SCHEDULE OF INVESTMENTS (UNAUDITED)* JUNE 30, 2019
MULTI-A
SSET
6

Numberof Shares Value
Stryker Corp. 41,016 $ 8,432,069Varian Medical Systems, Inc. (a) 4,506 613,402
29,892,118
Health Care Providers & Services— 0.3%Anthem, Inc. 2,373 669,684Brookdale Senior Living, Inc. (a) 2,612 18,833Cardinal Health, Inc. (b) 14,807 697,410HCA Healthcare, Inc. 2,473 334,275Humana, Inc. (b) 7,009 1,859,488McKesson Corp. (b) 14,005 1,882,132MEDNAX, Inc. (a) 4,438 111,971Tenet Healthcare Corp. (a) 1,903 39,316UnitedHealth Group, Inc. 1,720 419,697
6,032,806
Health Care Technology— 0.1%Allscripts Healthcare Solutions, Inc. (a) 6,100 70,943Cerner Corp. 10,199 747,587Veeva Systems, Inc., Class A (a) (b) 6,041 979,306
1,797,836
Hotels, Restaurants & Leisure— 0.4%Carnival Corp. 1,884 87,700Eldorado Resorts, Inc. (a) 2,112 97,300International Game Technology plc 1,018 13,203Las Vegas Sands Corp. (b) 12,722 751,743Marriott International, Inc., Class A 47,218 6,624,213Marriott Vacations Worldwide Corp. 470 45,308MGM Resorts International 23,032 658,024Norwegian Cruise Line Holdings, Ltd. (a) 11,187 599,959Starbucks Corp. 11,742 984,332Yum! Brands, Inc. 5,401 597,729
10,459,511
Household Durables — 0.0%Mohawk Industries, Inc. (a) 1,287 189,794TopBuild Corp. (a) 594 49,159Whirlpool Corp. 292 41,569
280,522
Household Products — 0.1%Colgate-Palmolive Co. 5,127 367,452Kimberly-Clark Corp. 2,183 290,950Procter & Gamble Co. (The) (b) 13,762 1,509,004Tupperware Brands Corp. 13,538 257,628
2,425,034
Independent Power Producers & Energy Traders — 0.0%AES Corp. (The) 34,646 580,667NRG Energy, Inc. 1,448 50,854
631,521
Industrial Conglomerates— 0.3%3M Co. 26,106 4,525,214General Electric Co. (b) 132,160 1,387,680Honeywell International, Inc. 6,859 1,197,513Textron, Inc. 6,638 352,079
7,462,486
Numberof Shares Value
Insurance— 0.6%Aflac, Inc. (b) 37,028 $ 2,029,505Alleghany Corp. (a) 323 219,999Allstate Corp. (The) (b) 10,047 1,021,680American International Group, Inc. 16,926 901,817Athene Holding, Ltd., Class A (a) 621 26,740Berkshire Hathaway, Inc., Class B (a) (b) 13,871 2,956,881Everest Re Group, Ltd. 613 151,521Fidelity National Financial, Inc. 17,659 711,658Hanover Insurance Group, Inc. (The) 393 50,422Hartford Financial Services Group, Inc.(The) 19,619 1,093,171
Lincoln National Corp. 9,394 605,443Loews Corp. 2,199 120,219Markel Corp. (a) 223 242,981MBIA, Inc. (a) 44,768 416,790MetLife, Inc. 8,742 434,215Principal Financial Group, Inc. 6,301 364,954Prudential Financial, Inc. 4,679 472,579Reinsurance Group of America, Inc. 3,513 548,133Travelers Companies, Inc. (The) (b) 3,642 544,552Unum Group (b) 464 15,567
12,928,827
Internet & Catalog Retail — 1.2%Amazon.com, Inc. (a) (b) 8,285 15,688,725Booking Holdings, Inc. (a) 1,448 2,714,580Expedia Group, Inc. 2,733 363,571Liberty Expedia Holdings, Inc.,Class A (a) 634 30,299
Liberty TripAdvisor Holdings, Inc.,Class A (a) 3,757 46,587
Netflix, Inc. (a) 22,648 8,319,063Qurate Retail, Inc. (a) 18,485 229,029TripAdvisor, Inc. (a) (b) 12,636 584,920Wayfair, Inc., Class A (a) 170 24,820
28,001,594
Internet Software & Services— 1.6%Akamai Technologies, Inc. (a) 10,813 866,554Alphabet, Inc., Class A (a) (b) 4,964 5,375,019Alphabet, Inc., Class C (a) (b) 4,639 5,014,342Altaba, Inc. (a) 4,085 283,376eBay, Inc. (b) 46,726 1,845,677Facebook, Inc., Class A (a) (b) 99,525 19,208,325GrubHub, Inc. (a) 28,752 2,242,369IAC/InterActiveCorp (a) (b) 4,652 1,011,950Match Group, Inc. (b) 255 17,154Nutanix, Inc., Class A (a) 5,246 136,081Twitter, Inc. (a) 8,716 304,188VeriSign, Inc. (a) 5,538 1,158,328Yelp, Inc. (a) (b) 8,102 276,926
37,740,289
TIFF MULTI-ASSET FUND / SCHEDULE OF INVESTMENTS (UNAUDITED)* JUNE 30, 2019
MULTI-A
SSET
7

Numberof Shares Value
IT Services — 1.7%Alliance Data Systems Corp. 1,895 $ 265,546Amdocs, Ltd. 1,039 64,512Automatic Data Processing, Inc. 43,561 7,201,940Broadridge Financial Solutions, Inc. 7,351 938,576Cognizant Technology Solutions Corp.,Class A 17,057 1,081,243
Conduent, Inc. (a) 30,934 296,657CoreLogic, Inc. (a) 4,620 193,255DXC Technology Co. (b) 13,822 762,283EPAM Systems, Inc. (a) 6,710 1,161,501First Data Corp., Class A (a) 4,329 117,186Gartner, Inc. (a) 1,993 320,753Hackett Group, Inc. (The) 13,019 218,589International Business Machines Corp.(IBM) (b) 18,421 2,540,256
Mastercard, Inc., Class A 4,805 1,271,067MAXIMUS, Inc. 3,027 219,579PayPal Holdings, Inc. (a) 49,311 5,644,137Perspecta, Inc. 1,344 31,463Sabre Corp. 9,280 206,016Square, Inc., Class A (a) 634 45,984Twilio, Inc., Class A (a) 45,284 6,174,473Visa, Inc., Class A 56,625 9,827,269Worldpay, Inc., Class A (a) 1,470 180,148
38,762,433
Leisure Equipment & Products — 0.0%Brunswick Corp. 5,725 262,720Vista Outdoor, Inc. (a) 6,355 56,433
319,153
Life Sciences Tools & Services— 0.5%Agilent Technologies, Inc. (b) 18,086 1,350,482AquaVenture Holdings, Ltd. (a) 3,455 68,996Bio-Rad Laboratories, Inc., Class A (a) 1,175 367,293Bruker Corp. 6,066 302,997Charles River Laboratories International,Inc. (a) 1,600 227,040
Illumina, Inc. (a) 703 258,809IQVIA Holdings, Inc. (a) 950 152,855Mettler-Toledo International, Inc. (a) 403 338,520PRA Health Sciences, Inc. (a) 3,761 372,903Thermo Fisher Scientific, Inc. (b) 736 216,149Waters Corp. (a) 35,705 7,685,144
11,341,188
Machinery— 0.1%Caterpillar, Inc. 1,398 190,533Cummins, Inc. (b) 8,549 1,464,786Gardner Denver Holdings, Inc. (a) 1,006 34,808Graco, Inc. 3,266 163,888ITT, Inc. 2,238 146,544Oshkosh Corp. (b) 2,417 201,795PACCAR, Inc. 8,837 633,260Wabtec Corp. 145 10,405
Numberof Shares Value
Welbilt, Inc. (a) 13,632 $ 227,6543,073,673
Marine— 0.0%Scorpio Bulkers, Inc. 12,883 59,262
Media— 0.3%Altice USA, Inc., Class A (a) 9,342 227,478AMC Networks, Inc., Class A (a) 10,265 559,340CBS Corp., Class B 23,092 1,152,291Charter Communications, Inc.,Class A (a) 332 131,200
Comcast Corp., Class A 43,213 1,827,046Discovery, Inc., Series A (a) 3,640 111,748GCI Liberty, Inc., Class A (a) 867 53,286IheartMedia, Inc. (a) 34 512IheartMedia, Inc.- ENT (a) (c) (d) 9,430 —Liberty Broadband Corp., Class A (a) 84 8,638Liberty Broadband Corp., Class C (a) 951 99,113Liberty Latin America, Ltd., Class A (a) 3,408 58,720Liberty Latin America, Ltd., Class C (a) 4,505 77,441Liberty Media Corp-Liberty Braves,Class A (a) 61 1,696
Liberty Media Corp-Liberty Braves,Class C (a) 167 4,671
Liberty Media Corp-Liberty FormulaOne, Class A (a) 691 24,779
Liberty Media Corp-Liberty FormulaOne, Class C (a) 749 28,020
Liberty Media Corp-Liberty SiriusXM,Class A (a) 3,193 120,727
Liberty Media Corp-Liberty SiriusXM,Class C (a) 3,947 149,907
Lions Gate Entertainment Corp., Class B 335 3,889TEGNA, Inc. 48,760 738,714Tribune Publishing Co. 504 4,017Viacom, Inc., Class B 29,282 874,653Walt Disney Co. (The) (b) 13,117 1,831,658
8,089,544
Metals & Mining— 0.1%Alcoa Corp. (a) 7,027 164,502Allegheny Technologies, Inc. (a) 20,711 521,917Freeport-McMoRan, Inc. 21,723 252,204Nucor Corp. 750 41,325Reliance Steel & Aluminum Co. (b) 5,717 540,943Southern Copper Corp. 3,633 141,142Steel Dynamics, Inc. 25,325 764,815Warrior Met Coal, Inc. 1,891 49,393
2,476,241
Multi-Utilities — 0.1%Ameren Corp. 5,817 436,915Black Hills Corp. (b) 4,890 382,251CenterPoint Energy, Inc. 21,747 622,617Consolidated Edison, Inc. 787 69,004DTE Energy Co. 2,242 286,707NorthWestern Corp. 6,383 460,533OGE Energy Corp. 1,314 55,924
TIFF MULTI-ASSET FUND / SCHEDULE OF INVESTMENTS (UNAUDITED)* JUNE 30, 2019
MULTI-A
SSET
8

Numberof Shares Value
Public Service Enterprise Group, Inc. 3,077 $ 180,989UGI Corp. 1,246 66,549
2,561,489
Multiline Retail — 0.0%Kohl's Corp. 4,048 192,482Macy's, Inc. 3,094 66,397Target Corp. 9,747 844,188
1,103,067
Office Electronics — 0.0%Zebra Technologies Corp., Class A (a) 493 103,279
Oil, Gas & Consumable Fuels — 3.7%Anadarko Petroleum Corp. 2,109 148,811Apache Corp. 1,056 30,592Berry Petroleum Corp. (b) 54,795 580,827Cabot Oil & Gas Corp. (b) 208,255 4,781,535Carrizo Oil & Gas, Inc. (a) (b) 135,964 1,362,359Centennial Resource Development, Inc.,Class A (a) 1,823 13,837
Cheniere Energy, Inc. (a) (b) 59,198 4,052,103Chevron Corp. (b) 36,921 4,594,449Cimarex Energy Co. (b) 82,524 4,896,149Cloud Peak Energy, Inc. (a) 313,225 18,606Concho Resources, Inc. (b) 34,873 3,598,196ConocoPhillips (b) 73,422 4,478,742Continental Resources, Inc. (a) (b) 83,771 3,525,921Devon Energy Corp. (b) 120,725 3,443,077Diamondback Energy, Inc. (b) 18,834 2,052,341EOG Resources, Inc. (b) 45,402 4,229,650EQT Corp. (b) 177,031 2,798,860Equitrans Midstream Corp. (a) (b) 104,760 2,064,820Exxon Mobil Corp. (b) 13,114 1,004,926Goodrich Petroleum Corp. (a) 45,711 593,786HollyFrontier Corp. 26,303 1,217,303International Seaways, Inc. (a) 4,703 89,357Jagged Peak Energy, Inc. (a) (b) 583,044 4,821,774Kosmos Energy, Ltd. (b) 77,244 484,320Marathon Oil Corp. 10,587 150,441Marathon Petroleum Corp. (b) 7,104 396,972Oasis Petroleum, Inc. (a) (b) 187,975 1,067,698Occidental Petroleum Corp. (b) 14,455 726,797PDC Energy, Inc. (a) (b) 39,986 1,441,895Peabody Energy Corp. 18,854 454,381Phillips 66 14,245 1,332,477Pioneer Natural Resources Co. 882 135,705Plains GP Holdings LP, Class A (a) 326,250 8,146,463Range Resources Corp. 697,135 4,866,002SM Energy Co. 6,422 80,403Southwestern Energy Co. (a) 43,097 136,187SRC Energy, Inc. (a) 546,612 2,711,196Targa Resources Corp. (b) 42,010 1,649,313Valero Energy Corp. 16,110 1,379,177Whiting Petroleum Corp. (a) 8,196 153,101World Fuel Services Corp. 20,242 727,902
Numberof Shares Value
WPX Energy, Inc. (a) (b) 564,349 $ 6,495,65786,934,108
Paper & Forest Products — 0.0%International Paper Co. 2,738 118,610Louisiana-Pacific Corp. 3,026 79,342
197,952
Personal Products — 0.2%Coty, Inc., Class A 2,189 29,333Estee Lauder Companies, Inc. (The),Class A 22,586 4,135,722
Nu Skin Enterprises, Inc., Class A 2,996 147,7634,312,818
Pharmaceuticals — 0.6%Abbott Laboratories 1,593 133,971AbbVie, Inc. 14,080 1,023,898Bristol-Myers Squibb Co. 27,865 1,263,678Eli Lilly & Co. 6,150 681,359Johnson & Johnson 26,062 3,629,915Merck & Co., Inc. (b) 35,695 2,993,026Mylan NV (a) 1,999 38,061Pfizer, Inc. (b) 74,945 3,246,617Walgreens Boots Alliance, Inc. 857 46,852
13,057,377
Professional Services — 0.1%H&R Block, Inc. 13,275 388,957Insperity, Inc. 2,440 298,022ManpowerGroup, Inc. (b) 4,613 445,616Robert Half International, Inc. 17,037 971,279Verisk Analytics, Inc. 830 121,562
2,225,436
Real Estate— 0.1%CBRE Group, Inc., Class A (a) 37,198 1,908,257
Real Estate Investment Trusts (REITs) — 0.1%American Tower Corp. (b) 2,583 528,094Apartment Investment & ManagementCo., Class A 3,971 199,027
AvalonBay Communities, Inc. 156 31,696Boston Properties, Inc. (b) 822 106,038Brixmor Property Group, Inc. 3,284 58,718Equity Residential 3,281 249,093Host Hotels & Resorts, Inc. 5,153 93,888Outfront Media, Inc. 4,512 116,364Public Storage 1,793 427,039Simon Property Group, Inc. 2,627 419,689SL Green Realty Corp. 2,496 200,604Ventas, Inc. 2,086 142,578VICI Properties, Inc. 2,295 50,582
2,623,410
Road & Rail — 0.1%Avis Budget Group, Inc. (a) 2,051 72,113CSX Corp. (b) 1,646 127,351Hertz Global Holdings, Inc. (a) 683 10,901
TIFF MULTI-ASSET FUND / SCHEDULE OF INVESTMENTS (UNAUDITED)* JUNE 30, 2019
MULTI-A
SSET
9

Numberof Shares Value
Kansas City Southern 1,644 $ 200,272Norfolk Southern Corp. (b) 2,102 418,992Union Pacific Corp. 5,691 962,405
1,792,034
Semiconductors & Semiconductor Equipment— 0.8%Applied Materials, Inc. 77,238 3,468,759Boeing Co. (The) (b) 4,295 1,563,423Broadcom, Inc. 456 131,264Cirrus Logic, Inc. (a) 8,015 350,255Intel Corp. (b) 37,626 1,801,157KLA-Tencor Corp. 1,593 188,293Lam Research Corp. 13,636 2,561,386Micron Technology, Inc. (a) (b) 94,623 3,651,501NVIDIA Corp. 518 85,071ON Semiconductor Corp. (a) 2,466 49,838Skyworks Solutions, Inc. 10,303 796,113Texas Instruments, Inc. 28,112 3,226,133Veeco Instruments, Inc. (a) 5,222 63,813Xilinx, Inc. 5,238 617,665
18,554,671
Software— 1.8%Activision Blizzard, Inc. (b) 14,590 688,648Adobe, Inc. (a) (b) 3,566 1,050,722ANSYS, Inc. (a) 612 125,350Aspen Technology, Inc. (a) 3,321 412,734Autodesk, Inc. (a) 1,683 274,161Cadence Design Systems, Inc. (a) 17,796 1,260,135Citrix Systems, Inc. 6,194 607,879CommVault Systems, Inc. (a) 10,607 526,319Electronic Arts, Inc. (a) 15,623 1,581,985FireEye, Inc. (a) 10,928 161,844Fortinet, Inc. (a) 4,709 361,792Guidewire Software, Inc. (a) 3,223 326,748Intuit, Inc. 31,657 8,272,924Manhattan Associates, Inc. (a) 2,578 178,733Microsoft Corp. (b) 156,501 20,964,874Oracle Corp. (b) 34,123 1,943,987Red Hat, Inc. (a) (b) 885 166,167ServiceNow, Inc. (a) 581 159,525Splunk, Inc. (a) 983 123,612Symantec Corp. 27,296 593,961Synopsys, Inc. (a) 3,527 453,890Zynga, Inc., Class A (a) 123,126 754,762
40,990,752
Specialty Retail — 0.3%Advance Auto Parts, Inc. 704 108,515AutoZone, Inc. (a) 428 470,573Bed Bath & Beyond, Inc. 20,289 235,758Best Buy Co., Inc. 16,468 1,148,314Foot Locker, Inc. 20,131 843,892Gap, Inc. (The) 1,728 31,052Home Depot, Inc. (The) 1,077 223,984Lowe's Cos, Inc. (b) 4,761 480,432
Numberof Shares Value
Michaels Companies, Inc. (The) (a) 23,375 $ 203,362Ross Stores, Inc. (b) 2,208 218,857Sally Beauty Holdings, Inc. (a) 11,300 150,742Signet Jewelers, Ltd. 5,060 90,473TJX Companies, Inc. (The) (b) 19,200 1,015,296Tractor Supply Co. 7,514 817,523Urban Outfitters, Inc. (a) (b) 16,370 372,417
6,411,190
Textiles, Apparel & Luxury Goods— 0.2%Deckers Outdoor Corp. (a) (b) 7,408 1,303,586Hanesbrands, Inc. 11,006 189,523Lululemon Athletica, Inc. (a) (b) 5,405 974,035Nike, Inc., Class B 8,234 691,244Ralph Lauren Corp. 6,273 712,550Skechers U.S.A., Inc., Class A (a) (b) 25,271 795,784
4,666,722
Thrifts & Mortgage Finance— 0.0%Fannie Mae (a) 5,834 15,734
Tobacco— 0.3%Altria Group, Inc. 3,897 184,523Philip Morris International, Inc. 90,091 7,074,846
7,259,369
Trading Companies & Distributors — 0.1%NOW, Inc. (a) 6,692 98,774W.W. Grainger, Inc. 1,949 522,780WESCO International, Inc. (a) 20,455 1,036,046
1,657,600
Wireless Telecommunication Services — 0.0%T-Mobile US, Inc. (a) 3,910 289,888United States Cellular Corp. (a) 445 19,878
309,766Total US Common Stocks(Cost $438,473,513) 512,321,940
Foreign Common Stocks— 38.0%
Argentina— 0.0%Banco BBVA Argentina SA - ADR 23,753 268,885Transportadora de Gas del Sur SA - ADR 12,486 180,548
449,433
Australia — 1.1%AGL Energy, Ltd. 9,626 135,315Alumina, Ltd. 114,525 187,662Ansell, Ltd. 7,184 135,671Atlassian Corp. plc, Class A (a) 69,534 9,097,829Aurizon Holdings, Ltd. 13,018 49,443Australia & New Zealand BankingGroup, Ltd. 14,046 278,534
BHP Group plc 98,886 2,523,806BHP Group, Ltd. 14,362 416,048BlueScope Steel, Ltd. 77,529 658,109Brambles, Ltd. 17,072 154,686Caltex Australia, Ltd. 11,374 197,819CIMIC Group, Ltd. 15,141 476,827
TIFF MULTI-ASSET FUND / SCHEDULE OF INVESTMENTS (UNAUDITED)* JUNE 30, 2019
MULTI-A
SSET
10

Numberof Shares Value
Coca-Cola Amatil, Ltd. 5 $ 36Coles Group, Ltd. (a) 8,384 78,676Dexus - REIT 4,265 38,926Fortescue Metals Group, Ltd. 107,461 684,032Goodman Group - REIT 9,892 104,545Iluka Resources, Ltd. 75,486 572,098Kogan.com, Ltd. 47,625 159,179Lend Lease Group 27,315 249,502Mirvac Group - REIT 51,921 114,298Newcrest Mining, Ltd. 283,532 6,372,540Orica, Ltd. 14,537 207,144Origin Energy, Ltd. 9,307 47,864Qantas Airways, Ltd. 257,368 976,748QBE Insurance Group, Ltd. 11,664 97,069Santos, Ltd. 31,435 156,653Scentre Group - REIT 54,471 147,098South32, Ltd. - ASX Shares 458,471 1,024,636Stockland - REIT 65,162 190,939Telstra Corp., Ltd. 47,749 129,164TPG Telecom, Ltd. 1,833 8,295Woodside Petroleum, Ltd. 11,521 294,918
25,966,109
Austria — 0.0%Erste Group Bank AG (a) 2,839 105,385
Belgium— 0.0%Ageas (b) 5,876 305,599Greenyard NV 2,327 9,149KBC Group NV (b) 1,657 108,621UCB SA 5,826 483,109
906,478
Bermuda— 0.1%Arch Capital Group, Ltd. (a) 6,102 226,262Assured Guaranty, Ltd. 24,230 1,019,599DHT Holdings, Inc. 38,429 227,115Golar LNG, Ltd. 3,792 70,076
1,543,052
Brazil — 0.3%BrasilAgro - Co. Brasileira dePropriedades Agricolas 88,100 380,854
Centrais Eletricas Brasileiras SA 294,900 2,707,125Cia Siderurgica Nacional SA 21,459 93,381Construtora Tenda SA 70,640 439,666Direcional Engenharia SA 63,715 185,838International Meal Co. Alimentacao SA,Class A 93,289 191,925
Localiza Rent a Car SA 9,757 104,127LOG Commercial Properties eParticipacoes SA 1,248 6,477
MRV Engenharia e Participacoes SA 19,658 100,186Nexa Resources SA 859 8,238Odontoprev SA 25,595 121,711Petroleo Brasileiro SA 30,003 234,558Petroleo Brasileiro SA - SPADR 19,653 305,997
Numberof Shares Value
Porto Seguro SA 8,082 $ 108,772Qualicorp Consultoria e Corretora deSeguros SA 149,114 891,977
Ser Educacional SA (e) 69,100 447,176Sul America SA (UNIT) 22,757 222,358Transmissora Alianca de Energia EletricaSA (UNIT) 53,700 379,821
Tupy SA 62,260 338,705WEG SA 19,912 110,762
7,379,654
Canada— 3.1%Aimia, Inc. (a) 5,808 16,942Air Canada (a) 5,801 175,817Altius Minerals Corp. 7,100 68,964Bear Creek Mining Corp. (a) 478,091 606,034Cameco Corp. 538,614 5,779,328Cameco Corp. - TSX Shares 5,192 55,665Canadian Natural Resources, Ltd. - NYSEShares 7,679 207,052
Centerra Gold, Inc. (a) 682,427 4,804,686Cobalt 27 Capital Corp. (a) 155,643 502,745Crescent Point Energy Corp. 476,832 1,576,635Denison Mines Corp. (a) 2,066,459 1,104,594Dundee Corp., Class A (a) 405,126 309,363Encana Corp. - NYSE Shares 4,254 21,821Fairfax Financial Holdings, Ltd. 558 273,880Fairfax India Holdings Corp. (a) (e) 9,794 124,384First Quantum Minerals, Ltd. 5,676 53,919Fission Uranium Corp. (a) 1,698,000 622,382Imperial Oil, Ltd. 4,918 136,174International Tower Hill Mines, Ltd. (a) 507,456 284,226Ivanhoe Mines, Ltd., Class A (a) 499,663 1,587,261Kinross Gold Corp. - TSX Shares (a) 10,374 40,084Lundin Gold, Inc. (a) 396,907 1,988,248MEG Energy Corp. (a) 1,497,901 5,742,021Mountain Province Diamonds, Inc. 24,121 23,761New Gold, Inc. (a) 1,579,358 1,518,237NexGen Energy, Ltd. (a) 1,354,058 2,109,334Northern Dynasty Minerals, Ltd. (a) 1,251,110 754,746Northern Dynasty Minerals, Ltd. - NYSEShares (a) 53,669 32,309
NOVAGOLD Resources, Inc. (a) 291,875 1,724,981NuVista Energy, Ltd. (a) 356,313 710,150Onex Corp. 1,130 68,160Pan American Silver Corp. 141,889 1,834,356Pipestone Energy Corp. (a) 529,564 509,527PrairieSky Royalty, Ltd. 132 1,855Rogers Communications, Inc., Class B 10,313 552,053Seabridge Gold, Inc. (a) 165,166 2,232,399Shopify, Inc., Class A (a) 44,936 13,487,540Sprott, Inc. 1,028,363 2,646,393Suncor Energy, Inc. (b) 203,213 6,339,010Teck Resources, Ltd., Class B 8,094 186,782Turquoise Hill Resources, Ltd. (a) 3,455,511 4,284,834Uranium Participation Corp. (a) 970,249 3,111,791
TIFF MULTI-ASSET FUND / SCHEDULE OF INVESTMENTS (UNAUDITED)* JUNE 30, 2019
MULTI-A
SSET
11

Numberof Shares Value
Wheaton Precious Metals Corp. 149,316 $ 3,610,46171,820,904
Chile — 0.1%AES Gener SA 521,716 143,405Antofagasta plc 66,243 784,227Geopark, Ltd. (a) 6,731 124,793
1,052,425
China— 9.7%58.com, Inc. - ADR (a) 2,244 139,509Alibaba Group Holding, Ltd. - SPADR (a) 107,015 18,133,692Aluminum Corp. of China, Ltd.,Class H (a) 63,415 22,515
Anhui Conch Cement Co., Ltd., Class A 663,299 4,017,819Anhui Conch Cement Co., Ltd., Class H 58,437 366,558Asia Cement China Holdings Corp. 183,738 295,352AVIC Helicopter Co., Ltd., Class A 181,300 1,084,168Baidu, Inc. - SPADR (a) 996 116,891Beijing Capital International Airport Co.,Ltd., Class H 622,000 544,661
Beijing Capital Land, Ltd., Class H 301,049 107,623Beijing North Star Co., Ltd., Class H 168,928 63,624Bilibili, Inc. - SPADR (a) 137,532 2,237,646Changgang Dunxin Enterprise Co.,Ltd. (a) (c) (d) 4,640,000 77,217
Changyou.com, Ltd. - ADR 5,290 50,837China Construction Bank Corp., Class A 7,321,800 7,938,085China Construction Bank Corp., Class H 153,547 131,950China International Travel Service Corp.,Ltd., Class A 112,528 1,455,334
China Jushi Co., Ltd., Class A 570,216 792,170China Lesso Group Holdings, Ltd. 188,566 151,159China Merchants Bank Co., Ltd., Class A 1,126,410 5,913,234China Merchants Bank Co., Ltd., Class H 215,500 1,076,039China Pacific Insurance Group Co., Ltd.,Class A 775,300 4,129,393
China Pacific Insurance Group Co., Ltd.,Class H 1,503,400 5,884,283
China Petroleum & Chemical Corp.,Class A 5,632,258 4,500,053
China Sanjiang Fine Chemicals Co., Ltd. 231,933 49,641China Telecom Corp., Ltd., Class H 1,852,000 932,559China Vanke Co., Ltd., Class H 290,900 1,091,880CNHTC Jinan Truck Co., Ltd., Class A 4,199 9,827Ctrip.com International, Ltd. - ADR (a) 1,482 54,701Daqin Railway Co., Ltd., Class A 3,941,691 4,645,907Dongyue Group, Ltd. 837,000 515,352Fangda Special Steel Technology Co.,Ltd., Class A 602,200 858,905
Focus Media Information TechnologyCo., Ltd., Class A 2,069,276 1,595,705
Fufeng Group, Ltd. (a) 595,000 325,873Grandblue Environment Co., Ltd.,Class A 1,689,920 4,158,404
Gree Electric Appliances, Inc. of Zhuhai,Class A 422,213 3,386,239
Guangshen Railway Co., Ltd., Class H 5,020,000 1,716,590
Numberof Shares Value
Guangzhou Baiyun International AirportCo., Ltd., Class A 1,126,234 $ 2,987,610
Haier Smart Home Co., Ltd., Class A (a) 3,941,238 9,935,781Hisense Home Appliances Group Co.,Ltd., Class A 38,500 70,064
Hongfa Technology Co., Ltd., Class A 449,800 1,593,778Huadong Medicine Co., Ltd., Class A 780,388 2,955,380Huaxin Cement Co., Ltd., Class B 377,784 877,218Huayu Automotive Systems Co., Ltd.,Class A 563,012 1,772,307
Industrial & Commercial Bank of China,Ltd., Class H 5,785,000 4,211,932
Inner Mongolia Yili Industrial Group Co.,Ltd., Class A 1,409,211 6,867,382
JD.com, Inc. - ADR (a) 29,300 887,497Jiangsu Hengli Hydraulic Co., Ltd.,Class A 126,599 579,309
Jiangsu Hengrui Medicine Co., Ltd.,Class A 290,017 2,789,677
Jiangsu Kanion Pharmaceutical Co., Ltd.,Class A 126,600 273,943
Jiangxi Wannianqing Cement Co., Ltd.,Class A 605,660 885,058
Kingsoft Corp., Ltd. (a) 105,000 227,803Kweichow Moutai Co., Ltd., Class A 44,609 6,399,761Lonking Holdings, Ltd. 1,385,344 369,771Meituan Dianping, Class B (a) 329,772 2,893,492Midea Group Co., Ltd., Class A 450,484 3,410,476Minth Group, Ltd. 708,000 1,910,292NetEase, Inc. - ADR 1,356 346,824New China Life Insurance Co., Ltd.,Class H 115,800 564,984
New Oriental Education & TechnologyGroup, Inc. - SPADR (a) 3,300 318,714
Noah Holdings, Ltd. - SPADR (a) 2,552 108,588NVC Lighting Holding, Ltd. (a) 6,103,000 491,924Pinduoduo, Inc. - ADR (a) 104,300 2,151,709Ping An Insurance Group Co. of China,Ltd., Class A 591,860 7,654,853
Ping An Insurance Group Co. of China,Ltd., Class H 1,400,000 16,850,035
Poly Developments and Holdings GroupCo., Ltd., Class A 2,111,609 3,930,713
Sany Heavy Industry Co., Ltd., Class A 2,506,606 4,782,472SDIC Power Holdings Co., Ltd., Class A 3,325,499 3,765,813Shanghai International Airport Co., Ltd.,Class A 169,118 2,067,235
Shengyi Technology Co., Ltd., Class A 704,231 1,545,637Shenzhen Expressway Co., Ltd., Class A 746,084 1,020,506Shenzhen Sunlord Electronics Co., Ltd.,Class A 238,300 611,051
Sichuan Kelun Pharmaceutical Co., Ltd.,Class A 1,155,550 5,009,346
SINA Corp. (a) 13,000 560,690Sinotruk Hong Kong, Ltd. 300,460 520,723Spring Airlines Co., Ltd., Class A 438,876 2,878,019TAL Education Group - ADR (a) 58,652 2,234,641Tasly Pharmaceutical Group Co., Ltd.,Class A 1,254,543 3,026,032
TIFF MULTI-ASSET FUND / SCHEDULE OF INVESTMENTS (UNAUDITED)* JUNE 30, 2019
MULTI-A
SSET
12

Numberof Shares Value
Tencent Holdings, Ltd. 363,410 $ 16,440,856Tencent Music Entertainment Group -ADR (a) 155,600 2,332,444
Tingyi Cayman Islands Holding Corp. 175,056 292,117Tsingtao Brewery Co., Ltd., Series H 14,600 92,582Vipshop Holdings, Ltd. - ADR (a) 17,824 153,821Weibo Corp. - SPADR (a) 56,200 2,447,510Wens Foodstuffs Group Co., Ltd.,Class A 112,740 588,959
Xiamen C & D, Inc., Class A 106,860 138,519Xinyuan Real Estate Co., Ltd. - ADR 36,807 153,853Yangzijiang Shipbuilding Holdings, Ltd. 982,300 1,113,729Yuan Longping High-tech AgricultureCo., Ltd., Class A 338,560 714,290
Yunji, Inc. - ADR (a) 320,400 3,620,520YY, Inc. - ADR (a) 11,400 794,466ZTO Express Cayman, Inc. - ADR 259,794 4,967,261
224,761,362
Colombia— 0.0%Frontera Energy Corp. 17,131 177,125
Cyprus— 0.0%Global Ports Investments plc -GDR (a) (f) 56,359 161,179
Hellenic Bank plc (a) 45,512 45,438TCS Group Holding plc - GDR (f) 31,330 614,013
820,630
Denmark— 0.6%AP Moller - Maersk A/S, Class B 299 371,062Bang & Olufsen A/S (a) 8,172 56,898Carlsberg A/S, Class B 773 102,500Coloplast A/S, Class B 34,165 3,869,463Danske Bank A/S 4,869 76,982Drilling Co. of 1972 A/S (The) (a) 524 40,771GN Store Nord A/S (b) 13,033 608,917H Lundbeck A/S (b) 10,029 396,596Jyske Bank A/S 832 28,832Novo Nordisk A/S, Class B (b) 137,477 7,012,671Orsted A/S (e) 1,998 172,920Pandora A/S 10,719 381,394Rockwool International A/S, Class B 665 169,850Vestas Wind Systems A/S 396 34,255
13,323,111
Finland— 0.5%Fortum Oyj 951 21,018Kone Oyj, Class B 132,509 7,820,757Neste Oyj (b) 19,260 654,717Nokia Oyj 92,250 458,423Orion Oyj, Class B (b) 2,979 109,222Sampo Oyj, Class A 2,501 118,029Stora Enso Oyj 3,147 36,989UPM-Kymmene Oyj (b) 113,676 3,021,195Valmet Oyj 2,472 61,699
12,302,049
Numberof Shares Value
France— 1.3%Airbus SE 802 $ 113,720Alstom SA 1,445 67,044Atos SE (b) 4,097 342,557AXA SA (b) 15,829 415,831BNP Paribas SA (b) 6,896 328,100Bureau Veritas SA 1,598 39,472Capgemini SE 4,372 543,996Carrefour SA 13,981 269,969Cie de Saint-Gobain (b) 5,959 232,928CNP Assurances 8,259 187,529Credit Agricole SA 7,607 91,231Dassault Aviation SA 28 40,324Dassault Systemes SE 1,816 290,135Edenred SA 681 34,743Electricite de France SA (b) 386,654 4,876,550Engie SA (b) 11,828 179,618EssilorLuxottica SA 1,908 249,410Getlink SE 11,347 181,812Hermes International (b) 227 163,721Kering SA (b) 1,040 615,207L'Oreal SA (b) 35,620 10,146,179Legrand SA 2,680 196,381LVMHMoet Hennessy Louis Vuitton SE 124 52,786Peugeot SA (b) 41,862 1,031,725Renault SA 1,121 70,666Rothschild & Co. 2,260 73,356Safran SA (b) 3,769 552,277Sanofi SA (b) 12,282 1,062,502Sartorius Stedim Biotech 789 124,442Schneider Electric SE 1,958 177,605Societe BIC SA 1,346 102,692Societe Generale SA (b) 6,432 162,758SPIE SA 2,092 38,853Technicolor SA (a) 13,542 12,536Teleperformance 1,149 230,236Total SA (b) 24,023 1,344,113Unibail-Rodamco-Westfield - REIT 597 89,441Vinci SA 4,446 455,838Vivendi SA 188,365 5,191,671Worldline SA (a) (e) 3,449 251,035
30,630,989
Germany— 1.6%Adidas AG (b) 2,769 854,858Allianz SE (b) 8,006 1,929,569AURELIUS Equity Opportunities SE & CoKGaA 3,573 169,770
BASF SE 812 58,988Bayer AG 1,246 86,546Carl Zeiss Meditec AG (b) 3,080 303,822CECONOMY AG (a) (b) 14,566 89,341Commerzbank AG 3,462 24,865Covestro AG (b) (e) 9,152 465,222Deutsche Bank AG 2,555 19,694
TIFF MULTI-ASSET FUND / SCHEDULE OF INVESTMENTS (UNAUDITED)* JUNE 30, 2019
MULTI-A
SSET
13

Numberof Shares Value
Deutsche Boerse AG 1,334 $ 188,701Deutsche Lufthansa AG 413,132 7,079,471Deutsche Telekom AG 6,857 118,664Deutsche Wohnen SE 2,457 90,124Deutz AG 10,202 99,418E.ON SE (b) 59,062 641,456Fresenius Medical Care AG & Co. 2,627 206,085Fresenius SE & Co. KGaA 2,894 156,787Hannover Rueck SE 206 33,306Hochtief AG 1,013 123,367KION Group AG 2,223 140,140LEG Immobilien AG 34,768 3,921,254Leoni AG (a) 946 15,651MuenchenerRueckversicherungs-Gesellschaft AGin Muenchen (b) 1,566 393,026
ProSiebenSat.1 Media SE 3,124 49,075Rheinmetall AG 509 62,306RWE AG 3,422 84,358Salzgitter AG 1,062 30,407SAP SE (b) 13,546 1,862,048Siemens AG 3,667 435,877Siemens Healthineers AG (e) 2,593 109,419Software AG 13,315 457,243Talanx AG (a) 2,301 99,687Vonovia SE 329,931 15,756,913Wacker Neuson SE 6,138 154,254Wirecard AG (b) 3,483 586,054zooplus AG (a) 1,192 162,380
37,060,146
Greece— 0.2%Autohellas SA 5,800 39,847Diana Shipping, Inc. (a) 350,109 1,158,861Ellaktor SA (a) 4,128 8,929Motor Oil Hellas Corinth Refineries SA 28,027 717,171OPAP SA 6,035 67,600Piraeus Bank SA (a) 10,551 36,815Tsakos Energy Navigation, Ltd. 402,586 1,324,508
3,353,731
Hong Kong— 0.9%AIA Group, Ltd. 34,201 369,735Ajisen China Holdings, Ltd. 38,478 15,655CECEP COSTIN New Materials Group,Ltd. (a) (c) (d) 1,736,000 —
China Merchants Land, Ltd. 478,688 69,902China Mobile, Ltd. 68,000 618,963China Taiping Insurance Holdings Co.,Ltd. 207,200 555,120
CK Asset Holdings, Ltd. 112,500 878,209CK Hutchison Holdings, Ltd. 9,655 94,992CLP Holdings, Ltd. 15,000 165,268Duiba Group, Ltd. (a) 610,400 363,347Esprit Holdings, Ltd. (a) 370,999 70,750Henderson Land Development Co., Ltd. 78,223 431,626
Numberof Shares Value
HKT Trust / HKT, Ltd. 45,000 $ 71,449Hong Kong & Shanghai Hotels, Ltd. (The) 260,248 339,450Hong Kong Exchanges & Clearing, Ltd. 39,800 1,406,767Hua Han Health Industry Holdings,Ltd. (a) (d) 7,412,000 502,882
Huabao International Holdings, Ltd. 123,021 52,020Hysan Development Co., Ltd. 19,000 98,201Jardine Matheson Holdings, Ltd. 11,407 718,946Jardine Strategic Holdings, Ltd. 18,746 715,277Johnson Electric Holdings, Ltd. 25,576 54,681K Wah International Holdings, Ltd. 268,409 156,168Kerry Properties, Ltd. 82,000 344,545Link - REIT 6,000 73,800Luks Group Vietnam Holdings Co., Ltd. 1,682,000 383,554Midland Holdings, Ltd. 619,092 109,496Midland IC&I, Ltd. (a) 368,613 8,967NewWorld Development Co., Ltd. 340,464 530,540Pacific Basin Shipping, Ltd. 1,202,422 220,341PAX Global Technology, Ltd. 3,644,000 1,484,752Shangri-La Asia, Ltd. 2,236,000 2,821,154Sino Biopharmaceutical, Ltd. 5,306,000 5,441,267SmarTone TelecommunicationsHoldings, Ltd. 291,216 277,538
Swire Pacific, Ltd., Class B 127,500 241,657Swire Properties, Ltd. 84,600 341,940TCL Multimedia Technology Holdings,Ltd. 320,000 154,487
Techtronic Industries Co., Ltd. 16,000 122,700Television Broadcasts, Ltd. 86,102 144,064Vinda International Holdings, Ltd. 5,326 9,045WH Group, Ltd. (e) 659,500 671,401Wharf (Holdings), Ltd. (The) 27,000 71,392Wheelock & Co., Ltd. 40,688 292,165Yue Yuen Industrial Holdings, Ltd. 33,500 91,630
21,585,843
Hungary— 0.0%Magyar Telekom Telecommunicationsplc 102,478 151,941
OTP Bank plc 5,634 224,141376,082
India— 0.4%Alembic Pharmaceuticals, Ltd. 4,761 35,061Bajaj Consumer Care, Ltd. (a) 4,912 23,360Balrampur Chini Mills, Ltd. 171,074 346,844Bank of Baroda (a) 157,431 275,737Birlasoft, Ltd. (a) 192,669 241,019Bliss Gvs Pharma, Ltd. 45,428 101,735Bombay Burmah Trading Corporation,Ltd. 5,484 74,140
BSE, Ltd. 20,355 179,938Century Enka, Ltd. 9,478 30,969CESC, Ltd. 9,126 103,737Dhampur Sugar Mills, Ltd. 33,989 94,344Dish TV India, Ltd. 55,395 21,748Dr Lal PathLabs, Ltd. (e) 5,145 79,902
TIFF MULTI-ASSET FUND / SCHEDULE OF INVESTMENTS (UNAUDITED)* JUNE 30, 2019
MULTI-A
SSET
14

Numberof Shares Value
Eros International Media, Ltd. (a) 114,141 $ 30,044Godfrey Phillips India, Ltd. 2,460 29,514Granules India, Ltd. 13,591 19,079Graphite India, Ltd. 143,221 697,202Greaves Cotton, Ltd. 86,905 182,778Gujarat Alkalies & Chemicals, Ltd. 2,589 19,535Gujarat Fluorochemicals, Ltd. 5,722 75,869HEG, Ltd. 21,170 447,843HeidelbergCement India, Ltd. 67,007 189,535Hexaware Technologies, Ltd. 39,300 214,970ICICI Bank, Ltd. 34,508 218,693India Cements, Ltd. (The) 128,374 185,231IOL Chemicals and Pharma, Ltd. (a) 62,638 192,195Jammu & Kashmir Bank, Ltd. (The) (a) 178,914 105,198Jindal Saw, Ltd. 48,148 57,999JK Cement, Ltd. 13,305 192,839Kalpataru Power Transmission, Ltd. 17,519 133,320L&T Technology Services, Ltd. (e) 12,988 327,957LIC Housing Finance, Ltd. 70,403 570,139Lupin, Ltd. 2,973 32,432Manappuram Finance, Ltd. 292,397 586,255Meghmani Organics, Ltd. 154,661 143,735Multi Commodity Exchange of India,Ltd. 14,406 173,012
NCC, Ltd. 482,561 681,017NIIT Technologies, Ltd. 4,538 88,410Persistent Systems, Ltd. 5,326 47,863PNC Infratech, Ltd. 1,551 4,510Punjab National Bank (a) 194,099 224,390Radico Khaitan, Ltd. 93,278 425,888Ramco Cements, Ltd. (The) 5,669 64,552REC, Ltd. 369,994 885,300Redington India, Ltd. 63,832 100,579RITES, Ltd. 40,972 173,509Sanofi India, Ltd. 1,141 92,765Sonata Software, Ltd. 35,970 181,917State Bank of India (a) 25,407 133,536Triveni Engineering & Industries, Ltd. 70,351 70,170Vodafone Idea, Ltd. (a) 587,305 103,354
9,711,668
Indonesia— 0.1%Indo Tambangraya Megah Tbk PT 79,736 99,288Indosat Tbk PT (a) 102,838 19,153Malindo Feedmill Tbk PT 1,083,245 84,281Media Nusantara Citra Tbk PT 2,573,900 189,617Perusahaan Gas Negara Tbk PT 962,700 143,817Ramayana Lestari Sentosa Tbk PT 1,369,934 136,727Waskita Beton Precast Tbk PT 8,274,000 234,408Wijaya Karya Beton Tbk PT 4,704,300 196,514
1,103,805
Ireland— 0.3%Accenture plc, Class A 3,517 649,836Alkermes plc (a) (b) 8,591 193,641Bank of Ireland Group plc 9,311 48,452
Numberof Shares Value
CRH plc - BATS Europe Shares 3,438 $ 112,329Irish Bank Resolution Corp.,Ltd. (a) (c) (d) 38,180 —
Medtronic plc (b) 11,808 1,149,981Paddy Power Betfair plc 3,401 256,153Paddy Power Betfair plc - LSE Shares 35,871 2,702,436Permanent TSB Group Holdings plc (a) 69,514 96,446Ryanair Holdings plc - SPADR (a) 7,122 456,805
5,666,079
Italy — 0.2%A2A SpA 199,763 346,374Assicurazioni Generali SpA 10,077 189,517Banca IFIS SpA 14,207 191,925Banca Monte dei Paschi di Siena SpA (a) 881 1,080Banco BPM SpA (a) 113,898 231,829BPER Banca 74,578 303,848Credito Valtellinese SpA (a) 5,522,765 354,816Enel SpA 145,344 1,015,553Eni SpA (b) 25,494 422,292Ferrari NV 873 141,767Hera SpA 8,593 32,888Intesa Sanpaolo SpA 149,800 320,575Italgas SpA 14,917 100,150Leonardo SpA 29,741 376,907Tamburi Investment Partners SpA 87,054 555,329UniCredit SpA 3,377 41,572Unione di Banche Italiane SpA 12,914 35,243Unipol Gruppo SpA 18,445 89,644UnipolSai Assicurazioni SpA 9,251 23,726
4,775,035
Japan— 6.7%AGC, Inc. 900 31,188Aisin Seiki Co., Ltd. 1,400 48,121Alfresa Holdings Corp. (b) 7,200 178,159Alps Alpine Co., Ltd. (b) 12,900 217,032Amano Corp. 291,600 8,067,119ANA Holdings, Inc. 2,230 73,899Astellas Pharma, Inc. (b) 53,100 758,169Bandai Namco Holdings, Inc. (b) 88,100 4,283,910BML, Inc. 127,700 3,633,135Bridgestone Corp. 1,370 54,017Brother Industries, Ltd. 11,900 225,410Bunka Shutter Co., Ltd. 251,400 1,909,331Citizen Watch Co., Ltd. 15,300 78,676Coca-Cola Bottlers Japan Holdings, Inc. 2,493 63,272Cosmos Pharmaceutical Corp. 864 146,805CyberAgent, Inc. 5,794 210,582Dai-ichi Life Holdings, Inc. 17,500 264,761Daiwa House Industry Co., Ltd. 4,000 116,817Daiwa Securities Group, Inc. 17,018 74,724DMGMori Co., Ltd. 7,562 121,661Eisai Co., Ltd. (b) 4,400 248,265FANUC Corp. 900 167,071Fuji Electric Co., Ltd. 6,600 228,362
TIFF MULTI-ASSET FUND / SCHEDULE OF INVESTMENTS (UNAUDITED)* JUNE 30, 2019
MULTI-A
SSET
15

Numberof Shares Value
FUJIFILM Holdings Corp. 1,200 $ 60,965Fujitsu, Ltd. (b) 5,600 389,832Fukuda Corp. 2,400 102,158Fukuda Denshi Co., Ltd. 4,800 322,731Fukushima Industries Corp. 36,200 1,192,416Glory, Ltd. 232,000 6,170,054GungHo Online Entertainment, Inc. 7,160 197,771Hachijuni Bank, Ltd. (The) 41,700 170,358Hakuhodo DY Holdings, Inc. 537,800 9,080,073Haseko Corp. (b) 37,600 381,138Hitachi High-Technologies Corp. 3,800 195,562Hitachi, Ltd. (b) 22,206 816,114Hogy Medical Co., Ltd. 243,000 7,197,588Honda Motor Co., Ltd. (b) 900 23,312Hoshizaki Corp. 67,600 5,026,669IHI Corp. 5,300 128,162Inpex Corp. 61,210 557,929Isuzu Motors, Ltd. 2,300 26,319ITOCHU Corp. 1,900 36,371Japan Airlines Co., Ltd. (b) 28,472 910,852Japan Petroleum Exploration Co., Ltd. 2,000 46,744Japan Post Holdings Co., Ltd. 7,800 88,373Japan Retail Fund Investment Corp. -REIT 17 34,369
Japan Steel Works, Ltd. (The) 36,600 614,056JTEKT Corp. 5,400 65,709Kajima Corp. (b) 22,500 309,418Kamigumi Co., Ltd. (b) 69,500 1,647,610Kao Corp. 900 68,661KDDI Corp. 2,100 53,501Kenedix, Inc. 16,800 83,829Kose Corp. (b) 2,500 420,498Kurita Water Industries, Ltd. 171,700 4,278,575Mabuchi Motor Co., Ltd. 1,800 61,746Makita Corp. 2,000 68,144Marubeni Corp. 71,300 473,057Matsumotokiyoshi Holdings Co., Ltd. (b) 900 26,373Mazda Motor Corp. 17,000 178,003Medipal Holdings Corp. 5,400 119,441MINEBEA MITSUMI, Inc. (b) 5,700 96,952Miraca Holdings, Inc. 250,800 5,713,637Mitsubishi Corp. 105,700 2,790,377Mitsubishi Electric Corp. (b) 7,800 103,101Mitsubishi Estate Co., Ltd. 13,696 255,497Mitsubishi Gas Chemical Co., Inc. (b) 8,300 110,957Mitsubishi Heavy Industries, Ltd. 600 26,155Mitsubishi UFJ Financial Group, Inc. 76,323 364,867Mitsui & Co., Ltd. (b) 277,500 4,526,182Mitsui Fudosan Co., Ltd. 313,500 7,612,130Mixi, Inc. 9,600 192,274Morinaga & Co., Ltd. 174,100 8,493,315MS&AD Insurance Group Holdings, Inc. 7,237 230,109Murata Manufacturing Co., Ltd. 2,800 126,276NEC Corp. 8,600 338,894
Numberof Shares Value
Nexon Co., Ltd. (a) 3,516 $ 51,044NHK Spring Co., Ltd. 9,700 74,756Nikon Corp. (b) 14,200 201,305Nintendo Co., Ltd. (b) 400 147,052Nippon Densetsu Kogyo Co., Ltd. 11,400 229,358Nippon Express Co., Ltd. (b) 5,800 309,132Nippon Telegraph & TelephoneCorp. (b) 6,500 302,920
Nohmi Bosai, Ltd. 41,900 896,660Noritz Corp. 100,600 1,206,177NSK, Ltd. 3,700 33,250NTT DoCoMo, Inc. 6,400 149,367Obayashi Corp. (b) 9,100 90,226OKUMA Corp. 157,300 8,100,887OLYMPUS Corp. (b) 26,800 298,750Organo Corp. 38,400 1,279,856Persol Holdings Co., Ltd. 11,300 266,236Pola Orbis Holdings, Inc. (b) 10,300 288,380Rakuten, Inc. 6,525 77,815Recruit Holdings Co., Ltd. 4,100 137,067Renesas Electronics Corp. (a) 18,400 91,671Resona Holdings, Inc. 41,400 173,011Sekisui Jushi Corp. 2,400 46,914Seven Bank, Ltd. 2,717,900 7,124,911SG Holdings Co., Ltd. 2,500 70,941Shimamura Co., Ltd. (b) 500 37,416Shinsei Bank, Ltd. 16,600 258,384Shionogi & Co., Ltd. (b) 4,200 242,515Showa Denko KK 1,200 35,587Sinko Industries, Ltd. 91,600 1,335,148SK Kaken Co., Ltd. 9,000 4,004,115SoftBank Group Corp. (b) 18,800 905,948Sojitz Corp. 154,900 498,426Sony Corp. 18,569 970,210Square Enix Holdings Co., Ltd. 9,690 311,356Sumitomo Corp. (b) 26,100 396,184Sumitomo Dainippon Pharma Co.,Ltd. (b) 20,600 391,427
Sumitomo Heavy Industries, Ltd. (b) 7,000 241,490Sumitomo Mitsui Financial Group,Inc. (b) 12,800 453,248
Sumitomo Mitsui Trust Holdings, Inc. 3,255 118,237Sumitomo Realty & Development Co.,Ltd. 2,300 82,242
Sumitomo Warehouse Co., Ltd. (The) 554,200 7,117,723Sundrug Co., Ltd. 1,100 29,808Suzuken Co., Ltd. 1,400 82,286Sysmex Corp. 3,200 209,037T&D Holdings, Inc. 8,200 89,436Taiheiyo Cement Corp. 4,900 148,586Taisei Corp. (b) 3,300 120,112Taisho Pharmaceutical Holdings Co.,Ltd. 300 23,097
Takeuchi Manufacturing Co., Ltd. 270,200 4,853,516THK Co., Ltd. (b) 11,300 271,680
TIFF MULTI-ASSET FUND / SCHEDULE OF INVESTMENTS (UNAUDITED)* JUNE 30, 2019
MULTI-A
SSET
16

Numberof Shares Value
Toei Co., Ltd. 67,000 $ 9,324,287Tokio Marine Holdings, Inc. 2,200 110,408Tosoh Corp. (b) 12,700 179,210Toyo Seikan Kaisha Group Holdings, Ltd. 3,500 69,613Toyo Tire Corp. 4,290 56,536Toyota Boshoku Corp. 8,000 105,267Toyota Industries Corp. 2,383 131,478Toyota Motor Corp. 7,008 435,582Toyota Tsusho Corp. (b) 3,600 109,387TV Asahi Holdings Corp. 360,000 5,820,725Zenkoku Hosho Co., Ltd. 1,953 75,087
155,098,170
Kazakhstan— 0.1%NAC Kazatomprom JSC - GDR (d) (e) 91,858 1,313,569
Lebanon— 0.0%Solidere ADR (a) 38,451 257,237
Luxembourg— 0.2%ArcelorMittal 260,329 4,661,960d'Amico International Shipping SA (a) 1,081,608 115,487SES SA 9,996 156,525Tenaris SA 24,060 316,559
5,250,531
Macau— 0.0%Wynn Macau, Ltd. 10,000 22,466
Malaysia — 0.1%AirAsia Berhad 227,832 150,536Berjaya Sports Toto Berhad 181,243 121,056BerMaz Motor Sdn Berhad 354,700 228,360Carlsberg Brewery Malaysia Berhad 49,181 305,389CIMB Group Holdings Berhad 121,675 158,457Dufu Technology Corp. Berhad 370,611 140,418Frontken Corp. Berhad 724,779 235,339Genting Malaysia Berhad 273,710 214,656Hong Leong Financial Group Berhad 13,439 60,292IFCA MSC Berhad 1,909,939 173,169IOI Properties Group Berhad 372,094 124,337Magnum Berhad 336,173 216,409OSK Holdings Berhad 422,522 96,133Sime Darby Berhad 262,754 143,761Sime Darby Plantation Berhad 191,867 228,435Sime Darby Property Berhad 165,494 41,245Sunway Berhad 328,484 133,552Supermax Corp. Berhad 191,912 77,572TIME dotCom Berhad 21,500 46,669TRC Synergy Berhad 18 3
2,895,788
Malta— 0.0%Kindred Group plc 41,569 352,606
Mexico— 0.1%America Movil SAB de CV, Series L - ADR 3,932 57,250Banco del Bajio SA (e) 218,287 437,171Cemex SAB de CV - SPADR 97,258 412,374
Numberof Shares Value
Consorcio ARA SAB de CV 882,628 $ 195,897Credito Real SAB de CV SOFOM ER 162,808 197,724Gentera SAB de CV 472,135 408,825Grupo Carso SAB de CV 40,438 150,933Grupo Mexico SAB de CV, Series B 34,856 92,834Megacable Holdings SAB de CV (UNIT) 10,345 44,088Qualitas Controladora SAB de CV 28,597 80,247
2,077,343
Monaco— 0.0%Scorpio Tankers, Inc. 13,907 410,535
Netherlands— 0.5%Adyen NV (a) (e) 457 352,884Akzo Nobel NV 836 78,580ASM International NV 454 29,581ASR Nederland NV (b) 13,470 548,361HAL Trust 482 69,719Heineken Holding NV 403 42,305ING Groep NV (b) 19,710 228,556Koninklijke (Royal) KPN NV 23,285 71,500Koninklijke Ahold Delhaize NV (b) 37,616 846,008Koninklijke Philips NV 5,373 233,383Randstad NV (b) 2,786 153,037Royal Dutch Shell plc, Class A 29,735 970,733Royal Dutch Shell plc, Class A - BATSEurope Shares 26,026 852,215
Royal Dutch Shell plc, Class A - QuoteMTF Shares 164,198 5,346,832
Royal Dutch Shell plc, Class B 23,459 765,199Signify NV (b) (e) 14,112 417,253Wolters Kluwer NV (b) 5,225 380,393
11,386,539
Nigeria — 0.0%Access Bank plc 1,261,143 22,740United Bank for Africa plc 5,943,571 102,222Zenith Bank plc 3,046,880 167,354
292,316
Norway— 0.1%DNB ASA 5,416 100,743Equinor ASA (b) 32,804 649,912Gjensidige Forsikring ASA 1,948 39,228Golden Ocean Group, Ltd. 5,217 30,225Leroy Seafood Group ASA (b) 22,593 149,738Norwegian Finans Holding ASA (a) 10,427 75,824Salmar ASA (b) 16,368 711,827
1,757,497
Pakistan— 0.0%Bank of Punjab (The) 2,864,944 161,704Engro Corp., Ltd. 56,710 95,130Engro Fertilizers, Ltd. 319,289 127,255Fauji Fertilizer Co., Ltd. 246,269 133,377Lotte Chemical Pakistan, Ltd. 1,364,572 130,014National Bank of Pakistan (a) 268,603 56,593
TIFF MULTI-ASSET FUND / SCHEDULE OF INVESTMENTS (UNAUDITED)* JUNE 30, 2019
MULTI-A
SSET
17

Numberof Shares Value
Oil & Gas Development Co., Ltd. 15,975 $ 13,149717,222
Philippines (The) — 0.1%ABS-CBN Holdings Corp. - PDR 354,913 116,679Alliance Global Group, Inc. 339,100 102,199Cebu Air, Inc. 22,867 40,637Cosco Capital, Inc. 1,044,473 140,311DMCI Holdings, Inc. 992,595 199,609Filinvest Land, Inc. 5,972,636 219,255First Gen Corp. 545,384 285,185Globe Telecom, Inc. 5,592 246,746Jollibee Foods Corp. 19,001 104,528Lopez Holdings Corp. 1,117,523 90,091SM Investments Corp. 13,666 258,476Vista Land & Lifescapes, Inc. 493,420 68,657
1,872,373
Poland— 0.0%Asseco Poland SA 18,473 263,745Ciech SA 7,124 79,751
343,496
Portugal — 0.0%EDP - Energias de Portugal SA 8,288 31,528Galp Energia SGPS SA (b) 3,389 52,245
83,773
Puerto Rico— 0.0%Popular, Inc. (b) 16,515 895,774
Qatar — 0.0%United Development Co. QSC 96,429 366,806
Russia — 1.3%Aeroflot PJSC - Foreign RegisteredShares 124,641 200,573
Bank St Petersburg PJSC 190,961 154,356Beluga Group PJSC (a) 4,548 36,096Credit Bank of Moscow PJSC (a) 735,666 69,423Etalon Group plc - GDR (f) 1,094,333 2,440,345Evraz plc 88,961 754,228Federal Grid Co. Unified Energy SystemPJSC (a) (d) 1,229,751,154 3,942,582
Gazprom PAO (d) 1,433,250 5,280,946Gazprom PJSC 35,330 130,177Gazprom PJSC - SPADR 17,108 125,342Lenta, Ltd. - GDR (a) (f) 535,481 1,734,977LSR Group PJSC (a) (d) 36,566 453,344LSR Group PJSC - GDR 30,794 79,142Lukoil PJSC - SPADR 494 41,706Magnitogorsk Iron & Steel Works PJSC 57,494 41,027MD Medical Group Investments plc -GDR 12,184 60,920
MMC Norilsk Nickel PJSC 534 120,757MMC Norilsk Nickel PJSC - ADR 6,610 150,090Moscow Exchange MICEX-RTSPJSC (a) (d) 798,330 1,137,664
Mosenergo PJSC (a) (d) 4,199,792 166,812
Numberof Shares Value
Polymetal International plc 11,976 $ 151,689Polyus PJSC - GDR (f) 48,241 2,230,822Rosneft Oil Co. PJSC - GDR 36,638 240,666ROSSETI PJSC (a) (d) 9,103,750 198,671RusHydro PJSC (a) (d) 300,738,327 2,873,855RusHydro PJSC - ADR 2,192,911 1,997,814Safmar Financial Investment 7,151 55,298Sberbank of Russia PJSC (d) 672,017 2,533,497Sberbank PAO - SPADR - OTC Shares 45,221 695,598Sistema PJSFC 26,742 4,195Sistema PJSFC - SPGDR - LSE Shares (f) 9,009 27,857Sollers PJSC (a) 9,974 50,315TMK PJSC 2,647 2,513TMK PJSC - GDR (a) (f) 46,670 177,694Unipro PJSC (a) (d) 3,196,030 132,872X5 Retail Group NV - GDR 7,036 241,262Yandex NV, Class A (a) 6,060 230,280
28,965,405
Singapore— 0.2%China Yuchai International, Ltd. 12,016 180,120ComfortDelGro Corp., Ltd. 189,300 372,244Genting Singapore, Ltd. 269,500 183,352Golden Agri-Resources, Ltd. 20,926,500 4,486,592Great Eastern Holdings, Ltd. 9,637 182,171Venture Corp., Ltd. 5,000 60,236
5,464,715
South Africa— 0.4%African Phoenix Investments, Ltd. (a) 3,640,881 147,322Anglo American Platinum, Ltd. 2,043 121,558ArcelorMittal South Africa, Ltd. (a) 107,514 18,409Bidvest Group, Ltd. (The) 5,180 69,652DataTec, Ltd. (a) 17,182 42,378Discovery, Ltd. 26,550 281,345Gold Fields, Ltd. 164,669 900,392Harmony Gold Mining Co., Ltd. -SPADR (a) 325,211 738,229
Hosken Consolidated Investments, Ltd. 30,144 228,586Hosken Passenger Logistics and Rail,Ltd. 14,440 4,461
Impala Platinum Holdings, Ltd. (a) 529,526 2,625,673Investec plc 22,364 145,382Kumba Iron Ore, Ltd. 6,726 238,898MiX Telematics, Ltd. - SPADR 9,733 146,287Montauk Holdings, Ltd. 32,593 83,306Multichoice Group, Ltd. (a) 692 6,587Naspers, Ltd. 692 168,110Nedbank Group, Ltd. 1,700 30,602Net 1 UEPS Technologies, Inc. (a) 6,746 26,984Niveus Investments, Ltd. (a) 27,381 3,888Northam Platinum, Ltd. (a) 51,929 217,674Oceana Group, Ltd. 40,020 195,928Old Mutual, Ltd. 52,984 79,079Peregrine Holdings, Ltd. 29,210 38,270Remgro, Ltd. 12,900 172,247
TIFF MULTI-ASSET FUND / SCHEDULE OF INVESTMENTS (UNAUDITED)* JUNE 30, 2019
MULTI-A
SSET
18

Numberof Shares Value
Reunert, Ltd. 13,950 $ 66,883Sibanye Gold, Ltd. (a) 798,381 943,027Super Group, Ltd. (a) 73,286 171,170Telkom SA SOC, Ltd. 79,358 519,537Tsogo Sun Holdings, Ltd. 235,937 255,054Tsogo Sun Hotels, Ltd. (a) 49,930 14,889
8,701,807
South Korea— 0.9%Aju Capital Co., Ltd. 2,993 29,159Autech Corp. 22,848 248,284Binggrae Co., Ltd. 2,957 175,004Cell Biotech Co., Ltd. 9,376 170,521Chongkundang Holdings Corp. 1,753 171,771Daesang Holdings Co., Ltd. 7,144 44,940Daihan Pharmaceutical Co., Ltd. 2,602 78,975Daishin Securities Co., Ltd. 20,260 242,963Danawa Co., Ltd. 9,013 199,387Daou Technology, Inc. 3,829 71,929DHP Korea Co., Ltd. 2,212 17,006DI Dong Il Corp. 1,372 102,987Dong-A ST Co., Ltd. 225 19,779DongKook Pharmaceutical Co., Ltd. 1,876 94,862Dongwon Development Co., Ltd. 43,732 195,024DY POWER Corp. 4,318 53,795Eyesvision Corp. 36,302 166,767GS Home Shopping, Inc. 1,686 251,423Hana Pharm Co., Ltd. 9,929 216,730Hankook Technology Group Co., Ltd. 33,639 499,473Hanwha Corp. 15,950 368,689Hanyang Eng Co., Ltd. 13,991 154,778HS Industries Co., Ltd. 32,164 260,192Hyundai Motor Co., Ltd. 17,307 2,097,751Hyundai Telecommunication Co., Ltd. 14,212 124,474Iljin Power Co., Ltd. 31,240 175,221Innocean Worldwide, Inc. 436 26,918Interpark Holdings Corp. 69,198 144,901INTOPS Co., Ltd. 13,348 194,158IS Dongseo Co., Ltd. 1,728 57,873JB Financial Group Co., Ltd. 33,917 173,673JW Holdings Corp. 4,462 23,571Korea Electric Power Corp. - SPADR (a) 118,704 1,317,614Korea Investment Holdings Co., Ltd. 9,769 684,175Korea Real Estate Investment & TrustCo., Ltd. 97,991 199,836
Korea Zinc Co., Ltd. 158 65,180KT Corp. 121,557 2,986,000KT Corp. - SPADR 271,327 3,356,315Kyobo Securities Co., Ltd. 21,079 201,072LF Corp. 8,456 168,593Maeil Dairies Co., Ltd. 2,528 184,997MegaStudyEdu Co., Ltd. 9,253 279,247Meritz Securities Co., Ltd. 145,131 674,530MonAmi Co., Ltd. 8,330 18,738NICE Information Service Co., Ltd. 14,685 215,572
Numberof Shares Value
OPTRON-TEC, Inc. 29,115 $ 207,691Orion Holdings Corp. 13,291 197,367Osstem Implant Co., Ltd. (a) 5,725 371,916Partron Co., Ltd. 41,026 630,660Sammok S-Form Co., Ltd. 9,641 101,835Samsung SDI Co., Ltd. 75 15,372Samsung Securities Co., Ltd. 17,819 603,854Samyang Holdings Corp. 1,888 120,482Samyang Tongsang Co., Ltd. 913 52,250Shinhan Financial Group Co., Ltd. 3,560 138,450Shinsegae Information &Communication Co., Ltd. 1,487 156,628
Shinyoung Securities Co., Ltd. 506 26,390SK Hynix, Inc. 7,824 471,311UniTest, Inc. 28,787 299,406Value Added Technology Co., Ltd. 7,813 191,728Visang Education, Inc. 426 3,368Youngone Holdings Co., Ltd. 1,294 68,205Yuyu Pharma, Inc. 2,381 23,845
20,885,605
Spain— 0.4%ACS, Actividades de ConstruccionyServicios SA 7,752 309,527
Amadeus IT Group SA (b) 87,336 6,911,430Banco Bilbao Vizcaya Argentaria SA 65,749 367,681Banco Santander SA 30,696 142,671Bankia SA 16,206 38,299Endesa SA 33,047 850,156Fomento de Construcciones y ContratasSA 10,850 144,523
Grifols SA 4,668 137,933Iberdrola SA (b) 48,045 479,243Industria de Diseno Textil SA 9,328 280,261Inmobiliaria Colonial Socimi SA 4,818 53,655Inmobiliaria del Sur SA 2,608 33,205Mediaset Espana Comunicacion SA 5,658 41,195Realia Business SA (a) 160,504 169,741Red Electrica Corp. SA (b) 9,417 196,056Repsol SA (b) 7,143 111,978
10,267,554
Sri Lanka— 0.0%Aitken Spence plc 124,322 28,875Ceylon Guardian Investment Trust plc 57,154 21,146CT Holdings plc 92,900 87,376Dialog Axiata plc 1,950,679 99,478Hemas Holdings plc 1,243,138 436,494Richard Pieris & Co. plc 401,198 22,336
695,705
Sweden— 0.1%Assa Abloy AB, Class B 10,924 247,303Atlas Copco AB, Class B (b) 2,705 77,610Essity AB, Class B 9,804 301,335Fingerprint Cards AB, Class B (a) 70,140 124,266G5 Entertainment AB 3,121 30,256
TIFF MULTI-ASSET FUND / SCHEDULE OF INVESTMENTS (UNAUDITED)* JUNE 30, 2019
MULTI-A
SSET
19

Numberof Shares Value
Getinge AB, Class B 14,584 $ 229,781Investor AB, Class B 6,935 333,179Kinnevik AB, Class B 1,568 40,821Modern Times Group MTG AB,Series B (a) 74 829
Nordic Entertainment Group AB, Class B 74 1,740Sandvik AB 8,519 156,524Securitas AB, Class B 2,150 37,734Svenska Handelsbanken AB, Class A 6,197 61,351Swedish Match AB (b) 7,604 321,377Swedish Orphan Biovitrum AB (a) 34,069 656,905Telefonaktiebolaget LM Ericsson,Series B (b) 55,420 525,952
Volvo AB, Class B 8,002 126,9933,273,956
Switzerland— 0.4%Adecco Group AG (b) 11,506 691,502Alcon, Inc. (a) 1,190 73,599Coca-Cola HBC AG (a) 10,647 402,896GAM Holding AG (a) 430 1,992Garmin, Ltd. 2,742 218,812Glencore plc (a) 211,600 736,310Helvetia Holding AG 740 92,983IWG plc 6,863 29,760Nestle SA (b) 12,190 1,262,015Novartis AG (b) 17,383 1,589,971Roche Holding AG (b) 9,222 2,594,760Sonova Holding AG 4,164 947,840STMicroelectronics NV 4,279 75,923Swiss Life Holding AG 43 21,312Temenos AG (a) 1,010 180,854Zurich Insurance Group AG 1,439 501,078
9,421,607
Taiwan— 0.8%Accton Technology Corp. 64,034 271,108Acter Group Corp., Ltd. 23,275 126,407APCB, Inc. (a) 171,000 165,628Apex Biotechnology Corp. 132,821 133,909Avita Corp. 31,000 41,624BenQ Materials Corp. 179,000 139,812Bioteque Corp. 49,805 194,444Chenbro Micom Co., Ltd. 100,791 210,177Chia Chang Co., Ltd. 129,000 156,600Chicony Power Technology Co., Ltd. 43,410 68,531Chong Hong Construction Co., Ltd. 71,800 206,472Emerging Display Technologies Corp. 298,196 152,172Eson Precision Ind Co., Ltd. 141,876 165,268Excelsior Biopharma, Inc. 27,590 42,379Farcent Enterprise Co., Ltd. 54,226 158,231Farglory Land Development Co., Ltd. 56,261 74,643FIT Hon Teng, Ltd. (e) 31,523 12,753Fulgent Sun International Holding Co.,Ltd. 73,679 168,007
Ginko International Co., Ltd. 41,000 257,782
Numberof Shares Value
Hannstar Board Corp. 503,059 $ 503,822Hanpin Electron Co., Ltd. 88,403 106,521Hon Hai Precision Industry Co., Ltd. -GDR (f) 14,378 70,648
Hotron Precision Electronic IndustrialCo., Ltd. 93,199 160,492
International Games System Co., Ltd. 78,963 762,942Jarllytec Co., Ltd. 93,000 199,125King Yuan Electronics Co., Ltd. 494,825 427,980Kung Long Batteries Industrial Co., Ltd. 41,000 216,068La Kaffa International Co., Ltd. 22,000 102,441Lida Holdings, Ltd. 96,420 159,553momo.com, Inc. 22,584 191,159Namchow Holdings Co., Ltd. 111,386 199,067Pou Chen Corp. 446,000 553,339Qisda Corp. 86,000 55,733Radiant Opto-Electronics Corp. 254,000 851,345Sinbon Electronics Co., Ltd. 94,750 346,639Sinmag Equipment Corp. 22,429 83,803Sino-American Silicon Products, Inc. (a) 211,000 556,533Soft-World International Corp. 39,274 93,069Sun Max Tech, Ltd. 11,408 15,111Syncmold Enterprise Corp. 49,365 133,633Taiwan Paiho, Ltd. 218,000 631,779Taiwan PCB Techvest Co., Ltd. 144,000 171,666Taiwan Semiconductor ManufacturingCo., Ltd. - SPADR 145,666 5,705,737
TCI Co., Ltd. 16,000 220,372TOPBI International Holdings, Ltd. 62,650 172,142Tripod Technology Corp. 190,000 674,407Unimicron Technology Corp. 929,000 1,059,719Userjoy Technology Co., Ltd. 82,250 175,795Wowprime Corp. 12,000 30,395Zeng Hsing Industrial Co., Ltd. 37,059 174,760
17,551,742
Thailand— 0.2%Advanced Info Service PCL 44,912 316,328Ananda Development PCL 1,734,938 217,238Bangkok Bank PCL - Foreign RegisteredShares 52,707 342,013
Bangkok Land PCL 4,788,254 268,551KGI Securities Thailand PCL 1,038,734 160,548Land and Houses PCL 1,122,555 402,645LPN Development PCL 844,415 202,379Major Cineplex Group PCL 293,129 279,580MBK PCL 1,056,635 758,000PTG Energy PCL 1,081,700 687,801Quality Houses PCL 4,964,800 501,863Sansiri PCL 5,008,100 241,689SEAFCO PCL - Foreign Registered Shares 588,141 164,931Somboon Advance Technology PCL 251,800 148,613SPCG PCL 305,495 193,253Thanachart Capital PCL 176,080 318,658
5,204,090
TIFF MULTI-ASSET FUND / SCHEDULE OF INVESTMENTS (UNAUDITED)* JUNE 30, 2019
MULTI-A
SSET
20

Numberof Shares Value
Turkey— 0.2%Anadolu Efes Biracilik Ve MaltSanayii AS 25,688 $ 88,242
BIM Birlesik Magazalar AS 18,916 260,190Emlak Konut Gayrimenkul YatirimOrtakligi AS - REIT 2,854,380 557,117
Enerjisa Enerji AS (e) 95,168 90,578GSD Holding AS (a) 349,109 50,035KOC Holding AS 58,680 177,794Tekfen Holding AS 203,306 912,238Tofas Turk Otomobil Fabrikasi AS 9,681 32,276Turkiye Garanti Bankasi AS (a) 16,633 26,149Turkiye Halk Bankasi AS 697,779 691,759Vestel Beyaz Esya Sanayi ve Ticaret AS 26,137 80,369Vestel Elektronik Sanayi ve TicaretAS (a) 246,687 526,648
3,493,395
Ukraine— 0.2%Astarta Holding NV (a) 90,707 595,157Kernel Holding SA 58,329 754,549MHP SA - GDR - OTC Shares (f) 259,134 2,617,169
3,966,875
United Arab Emirates— 0.0%RAK Properties PJSC (a) 650,761 76,187
United Kingdom— 4.5%3i Group plc 31,916 451,939Admiral Group plc 4,860 136,544Aggreko plc 4,195 42,090Anglo American plc 78,962 2,258,636Ashtead Group plc 9,489 272,156Associated British Foods plc 3,761 117,885AstraZeneca plc 1,086 88,655Aviva plc 14,155 75,078Awilco Drilling plc (a) 14,955 47,687Bank of Georgia Group plc 731 13,917Barclays plc 450,208 858,167BP plc 1,636,966 11,439,807BP plc - SPADR 43,015 1,793,726British American Tobacco plc 13,289 463,839BT Group plc 2,907,622 7,267,905BTG plc (a) 4,553 48,297Burberry Group plc 42,180 1,000,691Capita plc (a) 68,507 91,754Capri Holdings, Ltd. (a) (b) 16,698 579,087CNH Industrial NV 2,787 28,508Countrywide plc (a) 1,361,214 72,749Diageo plc 117,640 5,066,079Dialog Semiconductor plc (a) 5,619 226,677Dixons Carphone plc 102,222 142,097Drax Group plc 81,218 268,409Ensco Rowan plc, Class A 9,814 83,713Experian plc 7,899 239,795Ferroglobe plc 8,619 14,652Ferroglobe plc - ENT (c) (d) 17,904 —
Numberof Shares Value
Fiat Chrysler Automobiles NV (b) 22,711 $ 316,009Foxtons Group plc (a) 152,549 102,649Gabriel Resources, Ltd. (a) 1,962,000 629,254Gem Diamonds, Ltd. (a) 79,402 77,602Georgia Capital plc (a) 731 10,121GlaxoSmithKline plc 9,329 186,744Greene King plc 21,520 169,145Hansteen Holdings plc - REIT 23,548 29,122Hays plc 19,356 38,619Howden Joinery Group plc 70,143 451,659HSBC Holdings plc - LSE Shares 17,343 144,694Hummingbird Resources plc (a) 90,569 19,576Imperial Brands plc 8,985 210,970Inchcape plc 21,640 169,293Indivior plc (a) 313,004 169,740Inmarsat plc 15,732 108,798InterContinental Hotels Group plc 104,531 6,879,616International Consolidated AirlinesGroup SA 700,803 4,251,168
Intertek Group plc 54,919 3,847,484J D Wetherspoon plc 5,853 106,121John Wood Group plc 4,224 24,401Land Securities Group plc - REIT 10,305 109,154Legal & General Group plc 6,199 21,219Liberty Global plc, Class A (a) 13,235 357,213Liberty Global plc, Series C (a) 13,928 369,510LivaNova plc (a) 3,625 260,855Lloyds Banking Group plc 12,284,892 8,846,873London Stock Exchange Group plc 2,161 150,565Luceco plc (e) 85,820 116,894Man Group PLC 210,806 417,097Meggitt plc 13,422 89,441Melrose Industries plc 93,236 214,596Michelmersh Brick Holdings plc 274,186 320,410Micro Focus International plc 4,337 113,586Moneysupermarket.com Group plc 71,344 374,028Next plc 2,123 149,001nVent Electric plc 9,476 234,910Ocado Group plc (a) 42,761 633,805Pagegroup plc 29,452 192,374Paragon Banking Group plc 36,848 205,583Pendragon plc 1,104,719 227,969Provident Financial plc 4,478 23,492Prudential plc 3,831 83,442QinetiQ Group plc 34,081 120,931Quilter plc (e) 17,660 31,593Reckitt Benckiser Group plc 54,737 4,325,719Rentokil Initial plc 4,279 21,622Rio Tinto plc 140,269 8,653,898Rio Tinto, Ltd. 1,842 134,409Rockhopper Exploration plc (a) 210,709 54,945Royal Bank of Scotland Group plc 1,592,284 4,445,463Sage Group plc (The) 767,092 7,826,728Segro plc - REIT 13,225 122,668
TIFF MULTI-ASSET FUND / SCHEDULE OF INVESTMENTS (UNAUDITED)* JUNE 30, 2019
MULTI-A
SSET
21
Numberof Shares Value
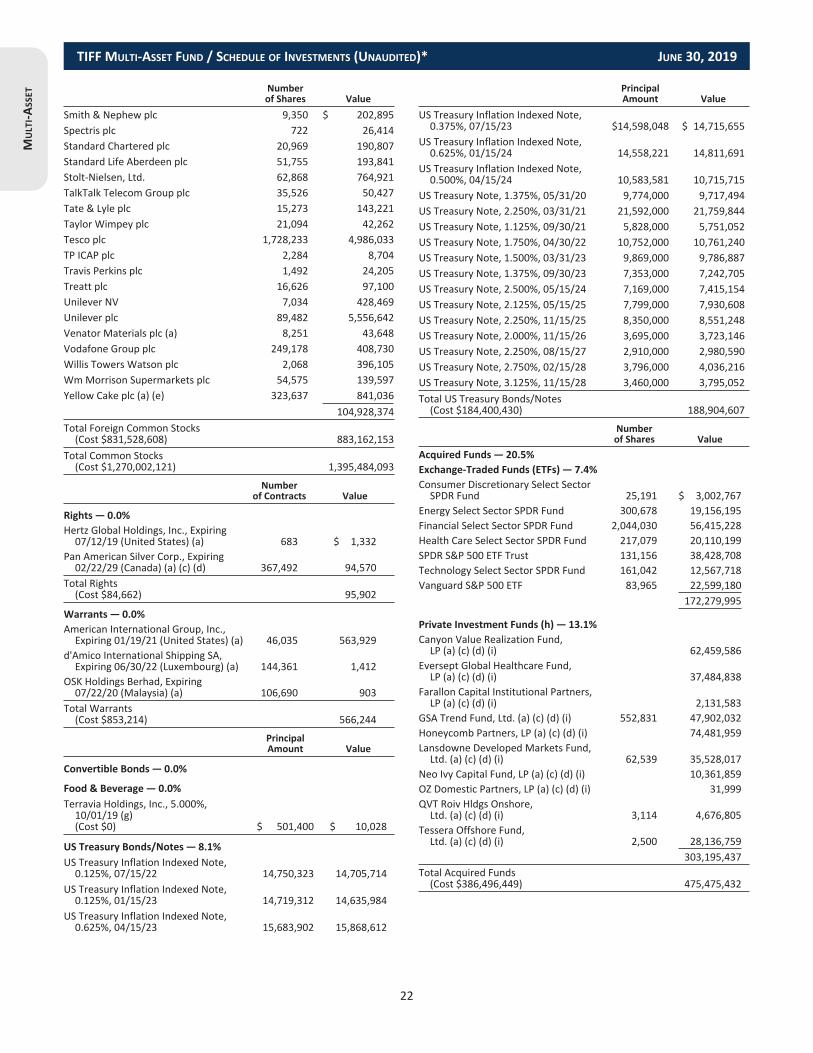
Smith & Nephew plc 9,350 $ 202,895Spectris plc 722 26,414Standard Chartered plc 20,969 190,807Standard Life Aberdeen plc 51,755 193,841Stolt-Nielsen, Ltd. 62,868 764,921TalkTalk Telecom Group plc 35,526 50,427Tate & Lyle plc 15,273 143,221Taylor Wimpey plc 21,094 42,262Tesco plc 1,728,233 4,986,033TP ICAP plc 2,284 8,704Travis Perkins plc 1,492 24,205Treatt plc 16,626 97,100Unilever NV 7,034 428,469Unilever plc 89,482 5,556,642Venator Materials plc (a) 8,251 43,648Vodafone Group plc 249,178 408,730Willis Towers Watson plc 2,068 396,105WmMorrison Supermarkets plc 54,575 139,597Yellow Cake plc (a) (e) 323,637 841,036
104,928,374Total Foreign Common Stocks(Cost $831,528,608) 883,162,153
Total Common Stocks(Cost $1,270,002,121) 1,395,484,093
Numberof Contracts Value
Rights — 0.0%Hertz Global Holdings, Inc., Expiring07/12/19 (United States) (a) 683 $ 1,332
Pan American Silver Corp., Expiring02/22/29 (Canada) (a) (c) (d) 367,492 94,570
Total Rights(Cost $84,662) 95,902
Warrants — 0.0%American International Group, Inc.,Expiring 01/19/21 (United States) (a) 46,035 563,929
d'Amico International Shipping SA,Expiring 06/30/22 (Luxembourg) (a) 144,361 1,412
OSK Holdings Berhad, Expiring07/22/20 (Malaysia) (a) 106,690 903
Total Warrants(Cost $853,214) 566,244
PrincipalAmount Value
Convertible Bonds— 0.0%
Food & Beverage— 0.0%Terravia Holdings, Inc., 5.000%,10/01/19 (g)(Cost $0) $ 501,400 $ 10,028
US Treasury Bonds/Notes— 8.1%US Treasury Inflation Indexed Note,0.125%, 07/15/22 14,750,323 14,705,714
US Treasury Inflation Indexed Note,0.125%, 01/15/23 14,719,312 14,635,984
US Treasury Inflation Indexed Note,0.625%, 04/15/23 15,683,902 15,868,612
PrincipalAmount Value
US Treasury Inflation Indexed Note,0.375%, 07/15/23 $14,598,048 $ 14,715,655
US Treasury Inflation Indexed Note,0.625%, 01/15/24 14,558,221 14,811,691
US Treasury Inflation Indexed Note,0.500%, 04/15/24 10,583,581 10,715,715
US Treasury Note, 1.375%, 05/31/20 9,774,000 9,717,494US Treasury Note, 2.250%, 03/31/21 21,592,000 21,759,844US Treasury Note, 1.125%, 09/30/21 5,828,000 5,751,052US Treasury Note, 1.750%, 04/30/22 10,752,000 10,761,240US Treasury Note, 1.500%, 03/31/23 9,869,000 9,786,887US Treasury Note, 1.375%, 09/30/23 7,353,000 7,242,705US Treasury Note, 2.500%, 05/15/24 7,169,000 7,415,154US Treasury Note, 2.125%, 05/15/25 7,799,000 7,930,608US Treasury Note, 2.250%, 11/15/25 8,350,000 8,551,248US Treasury Note, 2.000%, 11/15/26 3,695,000 3,723,146US Treasury Note, 2.250%, 08/15/27 2,910,000 2,980,590US Treasury Note, 2.750%, 02/15/28 3,796,000 4,036,216US Treasury Note, 3.125%, 11/15/28 3,460,000 3,795,052Total US Treasury Bonds/Notes(Cost $184,400,430) 188,904,607
Numberof Shares Value
Acquired Funds— 20.5%Exchange-Traded Funds (ETFs) — 7.4%Consumer Discretionary Select SectorSPDR Fund 25,191 $ 3,002,767
Energy Select Sector SPDR Fund 300,678 19,156,195Financial Select Sector SPDR Fund 2,044,030 56,415,228Health Care Select Sector SPDR Fund 217,079 20,110,199SPDR S&P 500 ETF Trust 131,156 38,428,708Technology Select Sector SPDR Fund 161,042 12,567,718Vanguard S&P 500 ETF 83,965 22,599,180
172,279,995
Private Investment Funds (h) — 13.1%Canyon Value Realization Fund,LP (a) (c) (d) (i) 62,459,586
Eversept Global Healthcare Fund,LP (a) (c) (d) (i) 37,484,838
Farallon Capital Institutional Partners,LP (a) (c) (d) (i) 2,131,583
GSA Trend Fund, Ltd. (a) (c) (d) (i) 552,831 47,902,032Honeycomb Partners, LP (a) (c) (d) (i) 74,481,959Lansdowne Developed Markets Fund,Ltd. (a) (c) (d) (i) 62,539 35,528,017
Neo Ivy Capital Fund, LP (a) (c) (d) (i) 10,361,859OZ Domestic Partners, LP (a) (c) (d) (i) 31,999QVT Roiv Hldgs Onshore,Ltd. (a) (c) (d) (i) 3,114 4,676,805
Tessera Offshore Fund,Ltd. (a) (c) (d) (i) 2,500 28,136,759
303,195,437Total Acquired Funds(Cost $386,496,449) 475,475,432
TIFF MULTI-ASSET FUND / SCHEDULE OF INVESTMENTS (UNAUDITED)* JUNE 30, 2019
MULTI-A
SSET
22

Numberof Shares Value
Publicly Traded Limited Partnerships— 0.1%Capital Product Partners LP 15,662 $ 164,451Lazard, Ltd. 10,385 357,140Rattler Midstream LP (b) 45,318 878,716Total Publicly Traded LimitedPartnerships(Cost $1,539,283) 1,400,307
Preferred Stocks— 0.2%Bancolombia SA, 2.59% (Colombia) 13,774 174,881Cia Paranaense de Energia, 2.90%(Brazil) 7,800 98,720
CJ Corp. - ENT, 2.00%(South Korea) (a) (d) 808 70,727
Draegerwerk AG & Co. KGaA, 0.38%(Germany) 17,990 1,134,973
Hyundai Motor Co., Ltd., 3.52%(South Korea) 13,108 980,670
Itausa - Investimentos Itau SA, 3.15%(Brazil) 61,677 207,038
Metalurgica Gerdau SA, 2.48% (Brazil) 557,600 1,051,322Porsche Automobil Holding SE, 3.78%(Germany) 3,256 211,551
Samsung Electronics Co., Ltd., 2.77%(South Korea) 41,910 1,387,699
Saraiva SA Livreiros Editores, 0.00%(Brazil) (a) 23,512 8,940
Schaeffler AG, 8.62% (Germany) 3,722 27,696Transneft PJSC, 2.56% (Russia) 13 34,049Total Preferred Stocks(Cost $4,333,949) 5,388,266
Numberof Contracts Value
Purchased Option Contracts — 0.0%
Calls — 0.0%Antero Resources Corp., NotionalAmount $557,250, Strike Price $7.5Expiring 07/19/2019 (United States)Unrealized depreciation $(15,447) 743 $ —
Callon Petroleum Co., NotionalAmount $779,800, Strike Price $7Expiring 07/19/2019 (United States)Unrealized depreciation $(1,954) 1,114 27,850
Cimarex Energy Co., Notional Amount$1,368,000, Strike Price $80Expiring 09/20/2019 (United States)Unrealized depreciation $(28,554) 171 2,565
Pioneer Natural Resources Co.,Notional Amount $2,450,000, StrikePrice $175Expiring 09/20/2019 (United States)Unrealized depreciation $(14,318) 140 51,100
Range Resources Corp., NotionalAmount $1,192,000, Strike Price $8Expiring 09/20/2019 (United States)Unrealized appreciation $1,490 1,490 59,600
Wpx Energy, Inc., Notional Amount$892,800, Strike Price $12 Expiring08/16/2019 (United States)Unrealized depreciation $(6,696) 744 44,640
Total Calls(Cost $251,234) 185,755
Numberof Contracts Value
Puts — 0.0%Cabot Oil & Gas Corp., NotionalAmount $3,450,000, Strike Price $23Expiring 07/19/2019 (United States)Unrealized appreciation $6,960 1,500 $ 105,000
California Resources Corp., NotionalAmount $1,200,000, Strike Price $16Expiring 07/19/2019 (United States)Unrealized depreciation $(114,750) 750 27,750
Cheniere Energy, Inc., NotionalAmount $2,318,750, StrikePrice $62.5 Expiring 07/19/2019(United States) Unrealizeddepreciation $(40,280) 371 10,759
Chesapeake Energy Corp., NotionalAmount $3,120,000, Strike Price $2Expiring 07/19/2019 (United States)Unrealized appreciation $33,100 15,600 234,000
Encana Corp., Notional Amount$746,500, Strike Price $5Expiring 07/19/2019 (United States)Unrealized depreciation $(33,648) 1,493 34,339
Hess Corp., Notional Amount$2,535,800, Strike Price $62Expiring 07/19/2019 (United States)Unrealized appreciation $15,207 409 66,667
Murphy Oil Corp., Notional Amount$930,000, Strike Price $25Expiring 07/19/2019 (United States)Unrealized depreciation $(14,508) 372 39,060
National Fuel Gas Co., NotionalAmount $632,500, Strike Price $55Expiring 07/19/2019 (United States)Unrealized appreciation $3,688 115 26,450
Plains GP Holdings LP, NotionalAmount $5,717,800, Strike Price $22Expiring 07/19/2019 (United States)Unrealized depreciation $(155,940) 2,599 —
QEP Resources, Inc., Notional Amount$879,600, Strike Price $6Expiring 07/19/2019 (United States)Unrealized depreciation $(57,316) 1,466 14,660
Southwestern Energy Co., NotionalAmount $1,540,000, StrikePrice $3.5Expiring 07/19/2019 (United States)Unrealized appreciation $68,175 4,400 154,000
Southwestern Energy Co., NotionalAmount $2,630,400, Strike Price $3Expiring 09/20/2019 (United States)Unrealized appreciation $5,368 8,768 236,736
Total Puts(Cost $1,233,365) 949,421
Total Purchased Option Contracts(Cost $1,484,599) 1,135,176
Numberof Units Value
Disputed Claims Receipt — 0.0%AMR Corp.(Cost $0) (a) (c) (d) (i) 260,322 $—
TIFF MULTI-ASSET FUND / SCHEDULE OF INVESTMENTS (UNAUDITED)* JUNE 30, 2019
MULTI-A
SSET
23

PrincipalAmount Value
Short-Term Investments— 13.8%Repurchase Agreement— 4.3%Fixed Income Clearing Corp. issued on06/28/19 (proceeds at maturity$99,106,832) (collateralized by USTreasury Inflation Indexed Note, due04/15/22 with a par value of$95,035,000 and a total market valueof $99,049,659; and US TreasuryNote, due 03/31/21 with a par valueof $2,015,000 and a total marketvalue of $2,041,509), 0.500%,07/01/19(Cost $99,102,703) $ 99,102,703 $ 99,102,703
US Treasury Bills (j) — 9.5%US Treasury Bill, 2.499%, 07/11/19 (k) 40,000,000 39,972,944US Treasury Bill, 2.427%, 07/18/19 (k) (l) 100,000,000 99,885,982US Treasury Bill, 2.309%, 08/06/19 (k) 50,000,000 49,886,525US Treasury Bill, 2.484%, 08/08/19 (k) (l) 30,000,000 29,923,351Total US Treasury Bills(Cost $219,668,802) 219,668,802
Total Short-Term Investments(Cost $318,771,505) 318,771,505
Total Investments — 102.7%(Cost $2,167,966,212) $2,387,231,560
Liabilities in Excess of OtherAssets — (2.7)% (63,141,798)
Net Assets — 100.0% $2,324,089,762
Numberof Shares Value
Securities Sold Short — (6.6)%
Common Stocks— (6.6)%
US Common Stocks— (4.8)%
Aerospace— (0.0)%TransDigm Group, Inc. (a) (715) $ (345,917)
Airlines— (0.0)%Delta Air Lines, Inc. (5,081) (288,347)Southwest Airlines Co. (3,884) (197,229)
(485,576)
Auto Components — (0.1)%Adient plc (18,667) (453,048)Visteon Corp. (a) (6,282) (368,000)
(821,048)
Automobiles — (0.1)%General Motors Co. (4,015) (154,698)Tesla, Inc. (a) (4,839) (1,081,323)Thor Industries, Inc. (198) (11,573)
(1,247,594)
Biotechnology— (0.1)%Agios Pharmaceuticals, Inc. (a) (4,208) (209,895)Alnylam Pharmaceuticals, Inc. (a) (3,045) (220,945)Bluebird Bio, Inc. (a) (6,181) (786,223)Gilead Sciences, Inc. (541) (36,550)Ligand Pharmaceuticals, Inc. (a) (5,967) (681,133)Sage Therapeutics, Inc. (a) (2,457) (449,852)
Numberof Shares Value
Seattle Genetics, Inc. (a) (1,417) $ (98,071)(2,482,669)
Building Products — (0.0)%Owens Corning (668) (38,878)
Capital Markets — (0.0)%Stifel Financial Corp. (1,566) (92,488)Virtu Financial, Inc., Class A (32,577) (709,527)
(802,015)
Chemicals — (0.1)%Albemarle Corp. (12,324) (867,733)Element Solutions, Inc. (a) (46,042) (476,074)International Flavors & Fragrances, Inc. (3,072) (445,716)Olin Corp. (15,060) (329,965)
(2,119,488)
Commercial Banks— (0.1)%Bank OZK (609) (18,325)Home BancShares, Inc. (6,449) (124,208)Pinnacle Financial Partners, Inc. (6,074) (349,133)Sterling Bancorp (78,228) (1,664,692)SVB Financial Group (a) (365) (81,975)United Bankshares, Inc. (23,440) (869,390)
(3,107,723)
Commercial Services & Supplies — (0.0)%Stericycle, Inc. (a) (7,278) (347,525)
Communications Equipment— (0.1)%Lumentum Holdings, Inc. (a) (3,948) (210,863)ViaSat, Inc. (a) (10,742) (868,168)
(1,079,031)
Computers & Peripherals — (0.0)%Dell Technologies, Inc., Class C (a) (236) (11,989)Seagate Technology plc (6,826) (321,641)
(333,630)
Construction & Engineering— (0.0)%Arconic, Inc. (11,514) (297,291)Granite Construction, Inc. (8,002) (385,536)Lennar Corp., Class A (1,086) (52,628)
(735,455)
Diversified Consumer Services — (0.0)%Sotheby's (a) (857) (49,817)
Electronic Equipment, Instruments & Components — (0.1)%BWX Technologies, Inc. (4,178) (217,674)Cognex Corp. (10,806) (518,472)Coherent, Inc. (a) (1,641) (223,783)Dril-Quip, Inc. (a) (2,870) (137,760)IPG Photonics Corp. (a) (1,347) (207,775)Littelfuse, Inc. (2,218) (392,386)Universal Display Corp. (3,331) (626,428)
(2,324,278)
Energy Equipment & Services— (0.1)%Baker Hughes a GE Co. (23,564) (580,381)
TIFF MULTI-ASSET FUND / SCHEDULE OF INVESTMENTS (UNAUDITED)* JUNE 30, 2019
MULTI-A
SSET
24

Numberof Shares Value
Helmerich & Payne, Inc. (10,272) $ (519,968)Nabors Industries, Ltd. (89,222) (258,744)National Oilwell Varco, Inc. (7,318) (162,679)Oceaneering International, Inc. (a) (3,943) (80,398)RPC, Inc. (6,318) (45,553)
(1,647,723)
Food Products — (0.1)%Conagra Brands, Inc. (61,405) (1,628,460)Hain Celestial Group, Inc. (The) (a) (22,050) (482,895)Kraft Heinz Co. (The) (3,021) (93,772)
(2,205,127)
Health Care Equipment & Supplies — (0.1)%Insulet Corp. (a) (10,081) (1,203,470)NuVasive, Inc. (a) (4,851) (283,977)
(1,487,447)
Health Care Providers & Services— (0.2)%Acadia Healthcare Co., Inc. (a) (29,338) (1,025,363)Brookdale Senior Living, Inc. (a) (2,612) (18,833)DexCom, Inc. (a) (16,123) (2,415,870)
(3,460,066)
Hotels, Restaurants & Leisure— (0.1)%Caesars Entertainment Corp. (a) (17,457) (206,342)International Game Technology plc (1,018) (13,203)Penn National Gaming, Inc. (a) (28,847) (555,593)Scientific Games Corp., Class A (a) (18,045) (357,652)
(1,132,790)
Insurance— (0.0)%Hanover Insurance Group, Inc. (The) (393) (50,422)Hartford Financial Services Group, Inc.(The) (7,804) (434,839)
Travelers Cos, Inc. (The) (406) (60,705)(545,966)
Internet & Catalog Retail — (0.0)%Liberty Expedia Holdings, Inc.,Class A (a) (457) (21,840)
Qurate Retail, Inc. (a) (10,603) (131,371)(153,211)
Internet Software & Services— (0.0)%eBay, Inc. (643) (25,399)
IT Services — (0.0)%First Data Corp., Class A (a) (4,329) (117,186)Switch, Inc., Class A (49,528) (648,322)
(765,508)
Machinery— (0.1)%Wabtec Corp. (28,107) (2,016,958)Welbilt, Inc. (a) (41,052) (685,569)
(2,702,527)
Media— (0.0)%Comcast Corp., Class A (644) (27,228)Meredith Corp. (5,332) (293,580)
(320,808)
Numberof Shares Value
Metals & Mining— (0.1)%Allegheny Technologies, Inc. (a) (42,406) $ (1,068,631)Commercial Metals Co. (5,161) (92,124)Compass Minerals International, Inc. (7,921) (435,259)Freeport-McMoRan, Inc. (24,944) (289,600)Newmont Mining Corp. (2,138) (82,249)Royal Gold, Inc. (4,870) (499,126)United States Steel Corp. (9,030) (138,249)
(2,605,238)Multi-Utilities — (0.0)%Ameren Corp. (5,817) (436,915)Consolidated Edison, Inc. (787) (69,004)DTE Energy Co. (2,242) (286,707)
(792,626)Oil, Gas & Consumable Fuels — (3.1)%Altus Midstream Co., Class A (a) (121,359) (451,456)Antero Midstream Corp. (140,161) (1,606,245)Apache Corp. (69,293) (2,007,418)California Resources Corp. (a) (66,124) (1,301,320)Callon Petroleum Co. (a) (434,952) (2,866,334)Centennial Resource Development,Inc., Class A (a) (217,812) (1,653,193)
Cheniere Energy, Inc. (a) (17,956) (1,229,088)Chesapeake Energy Corp. (a) (455,098) (887,441)Chevron Corp. (461) (57,367)Concho Resources, Inc. (5,733) (591,531)Denbury Resources, Inc. (a) (803,281) (996,068)EnLink Midstream LLC (104,314) (1,052,528)Equitrans Midstream Corp. (a) (17,246) (339,919)Extraction Oil & Gas, Inc. (a) (556,628) (2,410,199)Exxon Mobil Corp. (65,122) (4,990,299)Gulfport Energy Corp. (a) (147,513) (724,289)Hess Corp. (46,372) (2,947,868)HighPoint Resources Corp. (a) (357,284) (650,257)Kinder Morgan, Inc. (230,087) (4,804,217)Magnolia Oil & Gas Corp. (a) (338,740) (3,922,609)Marathon Oil Corp. (47,234) (671,195)Matador Resources Co. (a) (364,958) (7,255,365)Murphy Oil Corp. (142,545) (3,513,734)National Fuel Gas Co. (35,918) (1,894,675)Noble Energy, Inc. (154,699) (3,465,258)Oasis Petroleum, Inc. (a) (33,163) (188,366)ONEOK, Inc. (144,031) (9,910,773)Pioneer Natural Resources Co. (8,154) (1,254,574)QEP Resources, Inc. (a) (102,638) (742,073)Range Resources Corp. (26,717) (186,485)Roan Resources, Inc. (a) (423,988) (737,739)SM Energy Co. (1,490) (18,655)Southwestern Energy Co. (a) (840,464) (2,655,866)Talos Energy, Inc. (a) (11,297) (271,693)Targa Resources Corp. (5,347) (209,923)Whiting Petroleum Corp. (a) (72,780) (1,359,530)Williams Cos., Inc. (The) (60,443) (1,694,822)
(71,520,372)
TIFF MULTI-ASSET FUND / SCHEDULE OF INVESTMENTS (UNAUDITED)* JUNE 30, 2019
MULTI-A
SSET
25

Numberof Shares Value
Pharmaceuticals — (0.0)%Catalent, Inc. (a) (6,089) $ (330,085)
Real Estate Investment Trusts (REITs) — (0.0)%Colony Capital, Inc. (27,555) (137,775)
Road & Rail — (0.0)%Knight-Swift Transportation Holdings,Inc. (16,980) (557,623)
Semiconductors & Semiconductor Equipment— (0.1)%Advanced Micro Devices, Inc. (a) (7,949) (241,411)Cree, Inc. (a) (5,710) (320,788)Microchip Technology, Inc. (5,183) (449,366)Skyworks Solutions, Inc. (332) (25,654)
(1,037,219)
Software— (0.0)%2U, Inc. (a) (2,976) (112,016)FireEye, Inc. (a) (10,928) (161,844)Guidewire Software, Inc. (a) (3,223) (326,748)Splunk, Inc. (a) (983) (123,612)
(724,220)
Specialty Retail — (0.1)%Advance Auto Parts, Inc. (252) (38,843)CarMax, Inc. (a) (3,871) (336,119)Floor & Decor Holdings, Inc., Class A (a) (13,249) (555,133)Mattel, Inc. (a) (25,207) (282,571)
(1,212,666)
Textiles, Apparel & Luxury Goods— (0.0)%Hanesbrands, Inc. (3,551) (61,148)Under Armour, Inc.,Class A (a) (8,243) (208,960)
(270,108)
Thrifts & Mortgage Finance— (0.0)%LendingTree, Inc. (a) (793) (333,084)Total US Common Stocks(Proceeds $107,114,589) (110,288,232)
Foreign Common Stocks— (1.8)%
Australia — (0.1)%AMP, Ltd. (48,986) (73,025)Aristocrat Leisure, Ltd. (2,057) (44,475)Challenger, Ltd. (121,182) (566,269)Domino's Pizza Enterprises, Ltd. (4,031) (106,672)Magellan Financial Group, Ltd. (3,878) (139,183)SEEK, Ltd. (32,796) (488,030)Sydney Airport (6,449) (36,437)Tabcorp Holdings, Ltd. (37,487) (117,290)Vocus Group, Ltd. (a) (7,500) (17,266)WorleyParsons, Ltd. (27,058) (280,887)
(1,869,534)
Austria — (0.0)%ams AG (a) (3,095) (121,370)
Numberof Shares Value
Belgium— (0.0)%Telenet Group Holding NV (565) $ (31,511)Umicore SA (9,549) (307,028)
(338,539)
Bermuda— (0.1)%Assured Guaranty, Ltd. (662) (27,857)Everest Re Group, Ltd. (613) (151,521)Marvell Technology Group, Ltd. (58,042) (1,385,463)
(1,564,841)
Canada— (0.5)%ARC Resources, Ltd. (221,204) (1,082,752)Cenovus Energy, Inc. (482,612) (4,256,553)Crescent Point Energy Corp. (329,071) (1,088,066)Encana Corp. (146,725) (752,698)Husky Energy, Inc. (80,954) (767,164)Imperial Oil, Ltd. (70,585) (1,954,421)Kelt Exploration, Ltd. (a) (248,743) (740,787)Peyto Exploration & DevelopmentCorp. (372,069) (1,113,749)
Seven Generations Energy, Ltd.,Class A (a) (88,579) (434,254)
(12,190,444)
Denmark— (0.1)%AP Moller - Maersk A/S, Class B (906) (1,124,354)Chr Hansen Holding A/S (1,619) (152,234)Dfds A/S (3,203) (135,809)Drilling Co. of 1972 A/S (The) (a) (1,201) (93,446)
(1,505,843)
Finland— (0.0)%Huhtamaki Oyj (6,014) (247,308)Outokumpu Oyj (132,432) (451,867)
(699,175)
France— (0.1)%Altran Technologies SA (38,193) (606,122)Bollore SA (19,954) (88,046)Elior Group SA (e) (7,726) (106,440)Iliad SA (5,838) (657,085)JCDecaux SA (2,429) (73,581)Technicolor SA (a) (25,279) (23,401)Valeo SA (25,498) (829,451)
(2,384,126)
Germany— (0.1)%1&&1 Drillisch AG (2,709) (90,135)Aurubis AG (1,333) (64,923)Delivery Hero SE (a) (e) (7,837) (355,478)Deutsche Bank AG (71,950) (554,603)Fraport AG Frankfurt Airport ServicesWorldwide (1,059) (91,037)
Freenet AG (2,101) (42,033)Telefonica Deutschland Holding AG (19,089) (53,362)thyssenkrupp AG (83,210) (1,216,909)TUI AG (36,527) (358,330)
TIFF MULTI-ASSET FUND / SCHEDULE OF INVESTMENTS (UNAUDITED)* JUNE 30, 2019
MULTI-A
SSET
26

Numberof Shares Value
United Internet AG (12,546) $ (413,145)Zalando SE (a) (e) (5,479) (243,101)
(3,483,056)
Ireland— (0.1)%Aptiv plc (9,645) (779,605)James Hardie Industries plc (103,253) (1,358,250)Perrigo Co. plc (2,994) (142,574)Transocean, Ltd. (a) (188,275) (1,206,843)
(3,487,272)
Italy — (0.1)%Autogrill SpA (1,962) (20,544)Banco BPM SpA (a) (14,605) (29,727)Brembo SpA (15,536) (178,969)Buzzi Unicem SpA (2,542) (51,489)Ferrari NV (1,005) (163,203)Pirelli & C SpA (e) (53,952) (318,919)Prysmian SpA (5,033) (103,873)Saipem SpA (a) (10,656) (53,221)Telecom Italia SpA (a) (261,814) (142,960)Unione di Banche Italiane SpA (62,935) (171,752)
(1,234,657)
Japan— (0.1)%Asahi Intecc Co., Ltd. (2,000) (49,449)Asics Corp. (5,300) (57,578)Chugoku Electric Power Co., Inc. (The) (1,700) (21,455)CyberAgent, Inc. (4,400) (159,917)FamilyMart UNY Holdings Co., Ltd. (2,400) (57,201)Hitachi Chemical Co., Ltd. (1,600) (43,520)Hokuriku Electric Power Co. (a) (8,000) (58,056)Japan Airport Terminal Co., Ltd. (600) (25,723)Kansai Paint Co., Ltd. (7,200) (151,393)Keikyu Corp. (3,500) (60,343)Mercari, Inc. (a) (800) (21,293)MISUMI Group, Inc. (900) (22,678)Nippon Paint Holdings Co., Ltd. (12,700) (493,832)Sumitomo Metal Mining Co., Ltd. (2,800) (83,939)Taiyo Nippon Sanso Corp. (3,500) (74,204)Yaskawa Electric Corp. (6,400) (218,796)
(1,599,377)
Luxembourg— (0.0)%Eurofins Scientific (167) (73,877)Millicom International Cellular SA SDR (735) (41,359)Tenaris SA (7,059) (92,876)
(208,112)
Netherlands— (0.1)%Altice Europe NV, Class A (a) (19,472) (69,999)Boskalis Westminster NV - CVA (5,613) (129,649)Koninklijke Vopak NV (1,388) (64,139)OCI NV (a) (4,025) (110,499)Royal Dutch Shell plc, Class A - SPADR (25,458) (1,656,552)SBM Offshore NV (5,624) (108,867)
(2,139,705)
Numberof Shares Value
Norway— (0.1)%Adevinta ASA, Class A (a) (3,204) $ (35,644)Equinor ASA - SPADR (75,766) (1,498,651)Schibsted ASA, Class A (3,412) (94,252)Yara International ASA (7,185) (348,747)
(1,977,294)
Panama— (0.0)%Copa Holdings SA, Class A (625) (60,981)
Singapore— (0.0)%Keppel Corp., Ltd. (4,500) (22,224)
Spain— (0.1)%Cellnex Telecom SA (a) (e) (36,422) (1,348,285)
Sweden— (0.0)%BillerudKorsnas AB (4,445) (59,158)Hexpol AB (5,639) (45,979)Husqvarna AB (26,405) (246,999)SSAB AB, Class A (6,097) (21,257)Svenska Cellulosa AB, Class B (6,426) (55,849)Tele2 AB, Class B (12,436) (181,624)
(610,866)
Switzerland— (0.0)%Dufry AG (a) (257) (21,770)Sunrise Communications Group AG (a) (e) (1,185) (88,439)
(110,209)
United Arab Emirates—(0.0)%NMCHealth plc (22,966) (700,917)
United Kingdom—(0.2)%Amcor, Ltd. (10,193) (115,856)ASOS plc (a) (5,046) (163,489)EasyJet plc (10,603) (128,493)Ensco Rowan plc, Class A (98,149) (837,211)GVCHoldings plc (56,208) (465,314)Hargreaves Lansdown plc (2,360) (57,582)JohnWoodGroup plc (135,100) (780,451)Melrose Industries plc (34,784) (80,060)Merlin Entertainments plc (e) (114,066) (650,596)Micro Focus International plc (3,390) (89,025)Petrofac, Ltd. (4,441) (24,255)RoyalMail plc (13,426) (36,216)Severn Trent plc (14,126) (367,581)SSE plc (6,966) (99,364)St James's Place plc (7,716) (107,799)Subsea 7 SA (12,019) (145,469)Thomas CookGroup plc (a) (289,504) (48,321)Weir Group plc (The) (7,457) (146,482)
(4,343,564)Total Foreign Common Stocks(Proceeds $43,225,145) (42,000,391)
Total Common Stocks(Proceeds $150,339,734) $(152,288,623)
Total Securities Sold Short—(6.6)%(Proceeds $150,339,734) $(152,288,623)
TIFF MULTI-ASSET FUND / SCHEDULE OF INVESTMENTS (UNAUDITED)* JUNE 30, 2019
MULTI-A
SSET
27

Financial Futures Contracts
Number ofContracts Expiration Date Type
Initial NotionalValue/(Proceeds)
Notional Value atJune 30, 2019
UnrealizedAppreciation/(Depreciation)
Long Financial Futures ContractsEquity-Related
260 09/20/2019 Russell 2000 e-Mini Index $ 19,919,965 $ 20,372,300 $ 452,33578 09/20/2019 S&P 500 e-Mini Index 11,277,086 11,482,380 205,294
$ 657,629
Short Financial Futures ContractsEquity-Related
(52) 09/20/2019 MSCI EAFE $ (4,995,426) $ (5,000,580) $ (5,154)(1,533) 09/20/2019 MSCI Emerging Markets (77,633,267) (80,743,110) (3,109,843)
$(3,114,997)$(2,457,368)
Forward Currency Contracts
Contract Settlement Date CounterpartyContract Amount Unrealized
Appreciation/(Depreciation)Receive Deliver
07/29/2019 Goldman Sachs International USD 17,190,661 CNH 117,257,500 $124,66110/09/2019 Goldman Sachs International USD 6,000,000 CNH 41,777,100 (76,494)10/22/2019 Goldman Sachs International USD 4,000,000 CNH 28,144,000 (92,790)01/22/2020 Goldman Sachs International USD 8,309,146 CNH 56,540,000 98,24201/31/2020 Barclays Bank plc USD 4,000,000 CNH 27,075,200 68,67302/11/2020 Barclays Bank plc USD 4,000,000 CNH 26,882,400 97,41103/04/2020 Barclays Bank plc USD 6,000,000 CNH 40,205,700 165,45403/23/2020 Goldman Sachs International USD 7,000,000 CNH 47,001,500 181,50704/29/2020 Barclays Bank plc USD 6,286,582 CNH 42,516,000 123,45906/17/2020 Barclays Bank plc USD 7,471,250 CNH 52,248,000 (94,564)07/03/2020 Goldman Sachs International USD 3,000,000 CNH 20,731,500 (999)
$594,560
Swap Contracts
ExpirationDate Counterparty Pay Receive Currency
PaymentFrequency
Paid/ReceivedNotionalAmount
UnrealizedAppreciation/Depreciation
Net Value ofReferenceEntity
Long Total Return Equity Swap Contracts02/22/2022 Morgan Stanley
Capital Services LLC1 Month FEDLplus 0.125%
Energy Transfer LPUSD Monthly $ 6,777,319 $ (18,364) $ 6,758,955
02/22/2022 Morgan StanleyCapital Services LLC
1 Month FEDLplus 0.125%
Enterprise ProductsPartners LP USD Monthly 7,154,312 38,753 7,193,065
02/22/2022 Morgan StanleyCapital Services LLC
1 Month FEDLplus 0.125%
EQMMidstreamPartners LP USD Monthly 3,209,600 81,673 3,291,273
02/22/2022 Morgan StanleyCapital Services LLC
1 Month FEDLplus 0.40%
GoodrichPetroleum Corp. USD Monthly 316,430 35,442 351,872
02/22/2022 Morgan StanleyCapital Services LLC
1 Month FEDLplus 0.125%
Plains All AmericanPipeline LP USD Monthly 1,125,427 32,860 1,158,287
$ 170,364
Short Total Return Equity Swap Contracts02/22/2022 Morgan Stanley
Capital Services LLC1 Month FEDLless 0.35%
Antero Midstream Corp.USD Monthly $ (824,204) $ 20,898 $ (803,306)
02/22/2022 Morgan StanleyCapital Services LLC
1 Month FEDLless 0.63%
DCP Midstream LPUSD Monthly (3,216,114) (51,836) (3,267,950)
02/22/2022 Morgan StanleyCapital Services LLC
1 Month FEDLless 0.35%
Enable MidstreamPartners LP USD Monthly (1,136,963) (54,075) (1,191,038)
02/22/2022 Morgan StanleyCapital Services LLC
1 Month FEDLless 0.35%
Magellan MidstreamUSD Monthly (11,322,711) (239,811) (11,562,522)
TIFF MULTI-ASSET FUND / SCHEDULE OF INVESTMENTS (UNAUDITED)* JUNE 30, 2019
MULTI-A
SSET
28

ExpirationDate Counterparty Pay Receive Currency
PaymentFrequency
Paid/ReceivedNotionalAmount
UnrealizedAppreciation/Depreciation
Net Value ofReferenceEntity
02/22/2022 Morgan StanleyCapital Services LLC
1 Month FEDLless 0.35%
MPLX LPUSD Monthly (1,131,702) (24,387) (1,156,089)
02/22/2022 Morgan StanleyCapital Services LLC
1 Month FEDLless 0.35%
Noble MidstreamPartners LP USD Monthly (360,250) (25,522) (385,772)
02/22/2022 Morgan StanleyCapital Services LLC
1 Month FEDLless 0.35%
Shell MidstreamUSD Monthly (954,533) (42,757) (997,290)
02/22/2022 Morgan StanleyCapital Services LLC
1 Month FEDLless 0.107%
Viper EnergyPartners LP USD Monthly (898,411) (80,952) (979,363)
02/22/2022 Morgan StanleyCapital Services LLC
1 Month FEDLless 0.35%
Western MidstreamPartners LP USD Monthly (303,137) (17,752) (320,889)
$(516,194)$(345,830)
Long Total Return Basket Swap Contracts09/30/2022 Morgan Stanley
Capital Services LLC1 Month LIBOR
plus 0.35%Alphas Managed AccountsPlatform LXII Limited − KCPLong Segregated Portfolio (c) USD Monthly $169,823,947 $ (64,920) $169,759,027
09/30/2022 Morgan StanleyCapital Services LLC
1 Month LIBORplus 0.35%
Alphas Managed AccountsPlatform LXII Limited − KCP
Short Segregated Portfolio (c) USD Monthly 20,320,411 (7,847) 20,312,56409/30/2022 Morgan Stanley
Capital Services LLC1 Month LIBOR
plus 0.45%Alphas Managed Accounts
Platform LXVI Limited −WeltonNexus Segregated Portfolio (c) USD Monthly 46,258,025 (100,058) 46,157,967
$(172,825)
Number ofContracts Value
Written Options— (0.0)%
Calls — (0.0)%Callon Petroleum Co., Notional Amount ($296,800), Strike Price $8Expiring 07/19/2019 (United States) Unrealized appreciation $1,484 (371) $ (1,484)
Wpx Energy, Inc., Notional Amount ($1,041,600), Strike Price $14Expiring 08/16/2019 (United States) Unrealized appreciation $0 (744) (14,880)Total Calls(Premiums received $17,848) $ (16,364)
Puts — (0.0)%Chesapeake Energy Corp., Notional Amount ($562,500), Strike Price $1.5Expiring 07/19/2019 (United States) Unrealized appreciation $7,500 (3,750) $ (7,500)
Murphy Oil Corp., Notional Amount ($918,000), Strike Price $22.5Expiring 07/19/2019 (United States) Unrealized appreciation $10,200 (408) (10,200)
Pioneer Natural Resources Co., Notional Amount ($1,599,000), Strike Price $130Expiring 09/20/2019 (United States) Unrealized depreciation $(3,198) (123) (34,563)
Plains GP Holdings LP, Notional Amount ($2,970,000), Strike Price $20Expiring 07/19/2019 (United States) Unrealized appreciation $8,910 (1,485) (14,850)
Range Resources Corp., Notional Amount ($750,000), Strike Price $5Expiring 09/20/2019 (United States) Unrealized appreciation $1,500 (1,500) (22,500)
Southwestern Energy Co., Notional Amount ($1,012,500), Strike Price $3Expiring 07/19/2019 (United States) Unrealized depreciation $(33,750) (3,375) (50,625)
Southwestern Energy Co., Notional Amount ($1,857,500), Strike Price $2.5Expiring 09/20/2019 (United States) Unrealized depreciation $(7,430) (7,430) (89,160)Total Puts(Premiums received $213,130) $(229,398)
Total Written Options(Premiums received $230,978) $(245,762)
TIFF MULTI-ASSET FUND / SCHEDULE OF INVESTMENTS (UNAUDITED)* JUNE 30, 2019
MULTI-A
SSET
29

The following table represents the individual positions in the KCP Long Segregated Portfolio total return basket swap as ofJune 30, 2019:
Reference Entity Units
Net UnrealizedAppreciation/
(Depreciation) (m)Percent of NetAssets (n)
Long Total Return Swap ContractsCBOE S&P Small CAP 600 Index 38,843 $ (73,887) (0.04)%MSCI USA Momentum Index 7,091 1,467,102 0.86%MSKYMSLB Custom Index (o) 124,776 747,148 0.44%S&P 400 Citigroup Growth 28,272 1,528,257 0.90%S&P 400 Citigroup Value 12,764 1,097,539 0.65%S&P 500 Index 48,341 39,817,726 23.45%S&P 600 Citigroup Value 20,940 1,289,418 0.76%S&P Midcap 400 Index 16,905 529,586 0.31%S&P Smallcap 600 Growth Index 31,206 216,316 0.13%Cash and other (p) 123,139,822 72.54%
$169,759,027
The following table represents a portion of the underlying total return swap contracts in the Welton Nexus SegregatedPortfolio total return basket swap as of June 30, 2019:
Reference Entity Units
Net UnrealizedAppreciation/
(Depreciation) (m)Percent of NetAssets (n)
Long Total Return Swap ContractsArkema SA 8,693 $ 54,953 0.12%Ashmore Group plc 124,568 37,414 0.08%Atlas Copco AB 25,074 45,976 0.10%BE Semiconductor industries NV 22,465 62,389 0.14%Chr Hansen Holding A/S 2,120 (28,247) (0.06)%CIE Automotive SA 16,581 30,656 0.07%Cineworld Group plc 163,636 (37,552) (0.08)%Colruyt Group 3,688 (32,698) (0.07)%Dialog Semiconductor plc 18,811 78,404 0.17%Drax Group plc 184,499 (47,687) (0.10)%GrafTech International, Ltd. 60,014 26,461 0.06%Jupiter Fund Management plc 121,513 42,691 0.09%Pandora A/S 18,258 25,549 0.06%Partners Group Holding AG 1,031 54,945 0.12%Red Electrica Corp. SA 38,539 (36,354) (0.08)%Rightmove plc 119,050 (63,638) (0.14)%Sandvik AB 33,670 32,930 0.07%Siltronic AG 8,665 68,159 0.15%SKF AB 43,845 65,577 0.14%Swedish Match AB 18,905 (60,026) (0.13)%Taubman Centers, Inc. - REIT 13,866 (33,972) (0.07)%TLG Immobilien AG 15,068 (30,804) (0.07)%Vonovia SE 16,935 (53,405) (0.12)%
Short Total Return Swap ContractsAccor SA (18,809) $(45,810) (0.10)%Aecom (18,111) (35,018) (0.08)%Aker Solutions ASA (118,467) (30,122) (0.07)%Aurubis AG (16,653) (84,862) (0.19)%BASF SE (11,111) (35,097) (0.08)%
TIFF MULTI-ASSET FUND / SCHEDULE OF INVESTMENTS (UNAUDITED)* JUNE 30, 2019
MULTI-A
SSET
30

Reference Entity Units
Net UnrealizedAppreciation/
(Depreciation) (m)Percent of NetAssets (n)
Bobst Group SA (5,031) (30,357) (0.07)%Cairn Energy plc (118,561) (38,143) (0.08)%Cancom SE (7,879) (29,441) (0.06)%Continental AG (5,525) (37,272) (0.08)%Davita, Inc. (8,659) (34,669) (0.08)%Deutsche Bank AG (77,284) (39,874) (0.09)%DS Smith plc (103,205) (36,814) (0.08)%EasyJet plc (66,974) (50,849) (0.11)%Edenred SA (15,170) (29,972) (0.06)%FLSmidth & Co., A/S (17,916) (75,810) (0.17)%Grifols SA, Class A (27,458) (52,785) (0.11)%Mgm Growth Properties LLC, Class A - REIT (26,279) 26,672 0.06%Owens Corning (6,405) (26,412) (0.06)%Rolls Royce Holdings plc (50,909) 43,095 0.09%SL Green Realty Corp. (4,293) 32,152 0.07%Standard Life Aberdeen plc (190,800) (46,489) (0.10)%Svenska Cellulosa AB (52,948) (31,574) (0.07)%Swatch Group, Ltd. (2,802) (42,717) (0.09)%Sydbank A/S (26,624) 25,997 0.06%Western Digital Corp. (16,965) (80,044) (0.17)%Worldline SA (10,704) (33,563) (0.07)%WorleyParsons, Ltd. (34,770) (25,871) (0.06)%Cash and other (q) 46,801,895 101.40%
$46,157,967
ADR American Depositary ReceiptASX Australian Securities ExchangeBATS Better Alternative Trading SystemCNH Yuan Renminbi OffshoreCVA Certification Van AandelenEAFE Europe, Australasia, and Far EastENT Entitlement SharesETF Exchange-Traded FundFEDL US Federal Funds Effective RateGDR Global Depositary ReceiptLIBOR London Interbank Offered RateLSE London Stock ExchangeMSCI Morgan Stanley Capital International
MTF Multilateral Trading FacilityNYSE New York Stock ExchangeOTC Over-the-CounterPDR Philippine Depositary ReceiptREIT Real Estate Investment TrustSDR Swedish Depositary ReceiptsSPADR Sponsored ADRSPGDR Sponsored GDRTSX Toronto Stock ExchangeUNIT A security with an attachment to buy shares, bonds, or
other types of securities at a specific price before apredetermined date.
USD US Dollar
* Approximately 15% of the fund's total investments are maintained to cover “senior securities transactions” which may include, but arenot limited to forwards, TBAs, options, futures, swaps, and securities sold short. These securities are marked-to-market daily andreviewed against the value of the fund's “senior securities” holdings to maintain proper coverage for the transactions.
(a) Non income-producing security.(b) Security or a portion thereof is pledged as collateral for securities sold short.(c) Security in which significant unobservable inputs (Level 3) were used in determining fair value.(d) Security is valued in good faith under procedures established by the board of trustees. The aggregate amount of securities fair valued
amounts to $321,974,645, which represents 13.9% of the fund's net assets.(e) Security exempt from registration under Rule 144A of the Securities Act of 1933. These securities may be resold in transactions exempt
from registration, normally to qualified institutional buyers. These securities are generally determined to be liquid in accordance withprocedures approved by the board of trustees. At June 30, 2019, the aggregate value of these securities was $9,374,405, whichrepresents 0.4% of net assets.
TIFF MULTI-ASSET FUND / SCHEDULE OF INVESTMENTS (UNAUDITED)* JUNE 30, 2019
MULTI-A
SSET
31

(f) Security exempt from registration under Regulation S of the Securities Act of 1933. These securities may be resold in transactionsexempt from registration, normally to investors outside the United States.
(g) Security in default.(h) Portfolio holdings information of the Private Investment Funds is not available as of June 30, 2019. These positions are therefore
grouped into their own industry classification. For any private investment funds structured as a limited partnership, no share value isincluded as these investments are not unitized.
(i) Restricted Securities. The following restricted securities were held by the fund as of June 30, 2019, and were valued in accordance withthe Valuation of Investments as described in Note 2. Such securities generally may be sold only in a privately negotiated transactionwith a limited number of purchasers. The fund will bear any costs incurred in connection with the disposition of such securities. Thefund monitors the acquisition of restricted securities and, to the extent that a restricted security is illiquid, will limit the purchase ofsuch a restricted security, together with other illiquid securities held by the fund, to no more than 15% of the fund’s net assets. All ofthe below securities are illiquid, with the exception of GSA Trend Fund, Ltd. and Canyon Value Realization Fund, LP. TIP’s valuationcommittee has deemed 10% of Canyon Value Realization Fund, LP to be illiquid in accordance with procedures approved by the TIPboard of trustees. The below list does not include securities eligible for resale without registration pursuant to Rule 144A under theSecurities Act of 1933 that may also be deemed restricted.
Private Investment Funds Investment StrategyDate of
Acquisition Cost ValueCanyon Value Realization Fund, LP Multi-Strategy 12/31/97 − 04/03/06 $19,257,955 $ 62,459,586Eversept Global Healthcare Fund, LP Long-Short Global Healthcare 02/01/19 35,000,000 37,484,838Farallon Capital Institutional Partners, LP Multi-Strategy 01/01/13 1,566,845 2,131,583GSA Trend Fund, Ltd. Trend Following 09/01/16 − 12/01/16 55,000,000 47,902,032Honeycomb Partners, LP Long-Short Global 07/01/16 − 07/01/17 51,000,000 74,481,959Lansdowne Developed Markets Fund, Ltd. Long-Short Global 04/01/13 27,095,185 35,528,017Neo Ivy Capital Fund, LP Relative Value 05/01/19 10,500,000 10,361,859OZ Domestic Partners, LP Multi-Strategy 09/30/03 38,945 31,999QVT Roiv Hldgs Onshore, Ltd. Multi-Strategy 01/05/16 3,114,245 4,676,805Tessera Offshore Fund, Ltd. Long-Short US Small-Cap 01/01/17 25,000,000 28,136,759
303,195,437AMR Corp. 12/09/13 — —Total (13.1% of Net Assets) $303,195,437
(j) Treasury bills and discount notes do not pay interest, but rather are purchased at a discount and mature at the stated principal amount.(k) Security or a portion thereof is pledged as collateral for swap contracts.(l) Security or a portion thereof is held as initial margin for financial futures contracts.(m) The net unrealized appreciation/depreciation amount represents appreciation/depreciation of the individual total return swaps
underlying the MAF investment.(n) The percent of net assets represents the net unrealized appreciation/depreciation of the individual underlying total return swaps as
a percent of the net value of reference entity of the swap.(o) MSKYMSLB references a custom index created by Morgan Stanley Capital Services LLC. The index is comprised of 50 small to mid-cap US
equities across multiple sectors.(p) This balance is predominantly comprised of cash and other immaterial income and expense accruals.(q) This balance is predominantly comprised of cash, the remaining investment positions, and immaterial income and expense accruals.
TIFF MULTI-ASSET FUND / SCHEDULE OF INVESTMENTS (UNAUDITED)* JUNE 30, 2019
MULTI-A
SSET
See accompanying Notes to Financial Statements.32

STATEMENT OF ASSETS AND LIABILITIES (UNAUDITED)
June 30, 2019
AssetsInvestments in securities, at value (cost: $2,068,863,509) $2,288,128,857Repurchase agreements (cost: $99,102,703) 99,102,703Total investments (cost: $2,167,966,212) 2,387,231,560
Unrealized appreciation on forward currency contracts 859,407Unrealized appreciation on swap contracts 209,626Deposits with broker for securities sold short 40,790,878Deposits with broker for swap contracts 17,826,235Deposits with brokers 3,520,763Cash denominated in foreign currencies (cost: $15,331,382) 15,412,267Due from broker for futures variation margin 453,825Receivables:Investment securities sold 52,169,987Dividends and tax reclaims 3,257,374Interest 520,969
Total Assets 2,522,252,891
LiabilitiesSecurities sold short, at value (proceeds: $150,339,734) 152,288,623Unrealized depreciation on swap contracts 728,281Unrealized depreciation on forward currency contracts 264,847Foreign currencies sold short, at value (proceeds $237) 237Written options, at value (premium received $230,978) 245,762Cash Overdraft 106,817Due to broker for futures variation margin 5,154Payables:Capital stock redeemed 25,820,853Investment securities purchased 12,505,421Fund administration and custody fees 2,737,521Money manager fees 2,057,970Investment advisory and administrative fees 503,721Dividends and interest on securities sold short 331,597Chief Compliance Officer’s costs and Trustee’s fees 12,879Accrued expenses and other liabilities 553,446
Total Liabilities 198,163,129
Net Assets $2,324,089,762
Shares Outstanding (unlimited authorized shares, par value $0.001) 172,400,876
Net Asset Value Per Share $ 13.48
Net Assets Consist of:Capital stock $2,460,944,409Total distributable earnings (loss) (136,854,647)
Net Assets $2,324,089,762
TIFF MULTI-ASSET FUND
MULTI-A
SSET
See accompanying Notes to Financial Statements.33

STATEMENT OF OPERATIONS (UNAUDITED)
Six Months EndedJune 30, 2019
Investment IncomeDividends (net of foreign withholding taxes of $1,248,068) $ 19,799,257Interest 6,722,411Other Income 79,450Total Investment Income 26,601,118
ExpensesMoney manager fees 4,180,609Investment advisory fees 2,852,028Fund administration and custody fees 1,433,147Professional fees 259,827Administrative fees 245,532Chief Compliance Officer’s costs and Trustee’s fees 122,319Miscellaneous fees and other 673,663Total Operating Expenses 9,767,125Dividends and interest on securities sold short 1,970,430Broker fees on securities sold short 272,086Total Expenses 12,009,641Net Investment Income 14,591,477
Net Realized Gain (Loss) on:Investments (net of foreign withholding taxes on capital gains of $1,006) 29,458,885Securities sold short 7,505,982Swap contracts 19,334,446Financial futures contracts 24,708,375Forward currency contracts 1,786,291Foreign currency-related transactions (109,038)Written options 218,467
Net Realized Gain from Investments, Derivatives, and Foreign Currencies 82,903,408
Net Change in Unrealized Appreciation (Depreciation) from:Investments 201,861,477Securities sold short (12,469,566)Swap contracts 1,781Financial futures contracts 628,009Forward currency contracts (1,226,027)Foreign currency-related transactions 49,402Written options (14,784)
Net Change in Unrealized Appreciation on Investments, Derivatives, and Foreign Currencies 188,830,292
Net Realized and Unrealized Gain on Investments, Derivatives, and Foreign Currencies 271,733,700
Net Increase in Net Assets Resulting from Operations $286,325,177
TIFF MULTI-ASSET FUND
MULTI-A
SSET
See accompanying Notes to Financial Statements.34

STATEMENTS OF CHANGES IN NET ASSETS
Six Months EndedJune 30, 2019(Unaudited)
Year EndedDecember 31, 2018
Increase (Decrease) in Net Assets From Operations
Net investment income $ 14,591,477 $ 28,344,814
Net realized gain from investments, derivatives, and foreign currencies 82,903,408 77,263,957
Net change in unrealized appreciation (depreciation) on investments, derivatives,and foreign currencies 188,830,292 (434,753,592)
Net Increase (Decrease) in Net Assets Resulting from Operations 286,325,177 (329,144,821)
Distributions
Distributions to shareholders — (186,960,357)
Return of capital — (21,207,626)
Decrease in Net Assets Resulting from Distributions — (208,167,983)
Capital Share Transactions
Proceeds from shares sold 8,053,301 42,765,294
Proceeds from distributions reinvested — 181,489,626
Entry/exit fees 2,262,122 4,544,895
Cost of shares redeemed (471,494,827) (946,569,392)
Net Decrease From Capital Share Transactions (461,179,404) (717,769,577)
Total Decrease in Net Assets (174,854,227) (1,255,082,381)
Net Assets
Beginning of period 2,498,943,989 3,754,026,370
End of period $2,324,089,762 $ 2,498,943,989
Capital Share Transactions (in shares)
Shares sold 629,996 2,950,128
Shares reinvested — 14,962,506
Shares redeemed (36,143,782) (68,351,309)
Net Decrease (35,513,786) (50,438,675)
TIFF MULTI-ASSET FUND
MULTI-A
SSET
See accompanying Notes to Financial Statements.35

STATEMENT OF CASH FLOWS (UNAUDITED)
Six Months EndedJune 30, 2019
Cash flows provided by (used in) operating activitiesNet increase (decrease) in net assets from operations $ 286,325,177Adjustments to reconcile net increase (decrease) in net assets resulting from operations to net cashprovided by (used in) operating activities:Investments purchased (1,320,415,704)Investments sold 1,456,835,210Purchases to cover securities sold short (218,364,148)Securities sold short 304,778,987(Purchase)/Sale of short term investments, net 191,782,489Amortization (accretion) of discount and premium, net (4,163,760)Net change in unrealized (appreciation) depreciation on swap contracts (1,781)(Increase)/decrease in deposits with broker for securities sold short (40,790,878)(Increase)/decrease in deposits with broker for swap contracts (17,826,235)(Increase)/decrease in deposits with brokers (908,397)(Increase)/decrease in due to/from broker for futures variation margin 261,195(Increase)/decrease in unrealized appreciation on forward currency contracts 1,226,027(Increase)/decrease in interest receivable 36,254(Increase)/decrease in receivable for dividends and tax reclaims (997,601)(Increase)/decrease in prepaid expenses 69,225Increase/(decrease) in payable for foreign currencies sold short (42,669)Increase/(decrease) in payable for money manager fees (735,985)Increase/(decrease) in payable for dividends and interest for securities sold short 239,583Increase/(decrease) in payable for fund administration and custody fees 646,397Increase/(decrease) in payable for Chief Compliance Officer’s costs and Trustee’s fees (16,951)Increase/(decrease) in other accrued expenses and other liabilities (2,235,164)Increase/(decrease) in payable for investment advisory and administrative fees (69,841)Increase/(decrease) in premiums received on written options, net 230,978Net realized (gain) loss from investments (29,458,885)Net realized (gain) loss from securities sold short (7,505,982)Net realized (gain) loss from foreign currency-related transactions 109,038Net change in unrealized (appreciation) depreciation on investments (201,861,477)Net change in unrealized (appreciation) depreciation on securities sold short 12,469,566Net change in unrealized (appreciation) depreciation on foreign currency-related transactions (49,402)Net change in unrealized (appreciation) depreciation on written options 14,784
Net cash provided by (used in) operating activities 409,580,050
Cash flows provided by (used in) financing activitiesProceeds from shares sold 8,155,713Payment for shares redeemed (443,452,321)Increase/(decrease) in cash overdraft 106,817Net cash provided by (used in) financing activities (435,189,791)Effect of exchange rate changes on cash (59,636)
Net increase (decrease) in cash (25,669,377)Cash at beginning of period 41,081,644Cash at end of period $ 15,412,267Interest Paid: $ 2,926
TIFF MULTI-ASSET FUND
MULTI-A
SSET
See accompanying Notes to Financial Statements.36

1. Organization
TIFF Investment Program (‘‘TIP’’) is a no-load, open-end management investment company that seeks to improve the netinvestment returns of its members through two investment vehicles, each with its own investment objective and policies. TIPwas originally incorporated under Maryland law on December 23, 1993, and was reorganized, effective December 16, 2014, asa Delaware statutory trust. As of June 30, 2019, TIP consisted of two mutual funds, TIFF Multi-Asset Fund (‘‘MAF’’ or the‘‘fund’’) and TIFF Short-Term Fund, each of which is diversified, as defined in the Investment Company Act of 1940, asamended (the ‘‘1940 Act’’). The financial statements and notes presented here relate only to MAF.
Investment Objective
The fund’s investment objective is to attain a growing stream of current income and appreciation of principal that at leastoffset inflation.
2. Summary of Significant Accounting Policies
The fund operates as a diversified investment company and, accordingly, follows the investment company accounting andreporting guidance of the Financial Accounting Standards Board (‘‘FASB’’) Accounting Standards Codification Topic 946Financial Services — Investment Companies.
The preparation of financial statements in conformity with US generally accepted accounting principles (‘‘GAAP’’) requiresmanagement to make estimates and assumptions that affect the reported amounts of assets and liabilities, the reportedamounts of increases and decreases in net assets from operations during the reported period, and disclosure of contingentassets and liabilities at the date of the financial statements. Actual results could differ from these estimates.
Valuation of Investments
Fair value is defined as the price that the fund could reasonably expect to receive upon selling an asset or pay to transfer aliability in a timely transaction to an independent buyer in the principal or most advantageous market for the asset or liability,respectively. A three-tier fair value hierarchy is utilized to maximize the use of observable market data and minimize the use ofunobservable inputs and to establish classification of fair value measurements for disclosure purposes. Inputs refer broadly tothe assumptions that market participants would use in pricing the asset or liability, including assumptions about risk, forexample, the risk inherent in a particular valuation technique used to measure fair value and/or the risk inherent in the inputsto the valuation technique. Inputs may be observable or unobservable. Observable inputs are inputs that reflect theassumptions market participants would use in pricing the asset or liability developed based on market data obtained fromsources independent of the reporting entity. Unobservable inputs are inputs that reflect the reporting entity’s ownassumptions about the assumptions market participants would use in pricing the asset or liability developed based on the bestinformation available in the circumstances. The three-tier fair value hierarchy of inputs is summarized in the three broad levelslisted below.
Level 1— quoted prices in active markets for identical assets and liabilities
Level 2— other significant observable inputs (including quoted prices for similar assets and liabilities, interest rates,prepayment speeds, credit risk, etc.)
Level 3— significant unobservable inputs (including the fund’s own assumptions in determining the fair value of assetsand liabilities)
The fund has established a pricing hierarchy to determine the order of pricing sources utilized in valuing its portfolio holdings.The pricing hierarchy has been approved by the TIP board of trustees (the ‘‘board’’).
Generally, the following valuation policies are applied to securities for which market quotations are readily available. Securitieslisted on a securities exchange or traded on the National Association of Securities Dealers National Market System (‘‘NASDAQ’’)for which market quotations are readily available are valued at their last quoted sales price on the principal exchange on whichthey are traded or at the NASDAQ official closing price, respectively, on the valuation date or, if there is no such reported saleon the valuation date, at the most recently quoted bid price, or asked price in the case of securities sold short. The fundemploys an international fair value pricing model using other observable market-based inputs to adjust prices to reflect eventsaffecting the values of certain portfolio securities that occur between the close of trading on the principal market for suchsecurities (foreign exchanges and OTC markets) and the time at which the net asset value of the fund is determined. If the TIPValuation Committee believes that a particular event would materially affect net asset value, further adjustment is considered.Securities which use the international pricing model are typically categorized as Level 2 for the fair value hierarchy andsecurities that do not use the international pricing model are typically categorized as Level 1.
TIFF MULTI-ASSET FUND / NOTES TO FINANCIAL STATEMENTS (UNAUDITED) JUNE 30, 2019
MULTI-A
SSET
37

Debt securities are valued at prices that reflect broker/dealer-supplied valuations or are obtained from independent pricingservices, which consider such factors as security prices, yields, maturities, and ratings, and are deemed representative ofmarket values at the close of the market. Debt securities valuations are typically categorized as Level 2 for the fair valuehierarchy.
Over-the-counter (‘‘OTC’’) stocks not quoted on NASDAQ and foreign stocks that are traded OTC are normally valued at pricessupplied by independent pricing services if those prices are deemed representative of market values at the close of the firstsession of the New York Stock Exchange and are typically categorized as Level 2 in the valuation hierarchy.
Short-term debt securities having a remaining maturity of 60 days or less are valued at amortized cost, which approximates fairvalue, and short-term debt securities having a remaining maturity of greater than 60 days are valued at their market value.Short-term debt securities, which include repurchase agreements and US Treasury Bills, are typically categorized as Level 2 inthe fair value hierarchy.
Exchange-traded option contracts are valued at the last quoted sales price or, if there were no sales that day for a particularposition, at the closing bid price (closing ask price in the case of open written option contracts). Future contracts are valued atthe last posted settlement price or, if there were no sales that day for a particular position, at the closing bid price (closing askprice in the case of open short futures contracts). OTC open options contracts are normally valued at prices supplied byindependent pricing services if those prices are deemed representative of market values at the close of the actively quotemarkets. Exchange-traded contracts are typically categorized as Level 1 in the fair value hierarchy and OTC options and futurescontracts are typically categorized as Level 2 in the fair value hierarchy.
Forward foreign currency contracts are valued at their respective fair market values and are typically categorized as Level 2 inthe fair value hierarchy.
Investments in other open-end funds or trusts are valued at their closing net asset value per share on valuation date, whichrepresents their redeemable value and are typically categorized as Level 1 in the fair value hierarchy.
MAF invests in both total return equity and total return basket swaps with Morgan Stanley Capital Services LLC as thecounterparty. The total return equity swaps are valued at the last traded price of the reference entity net of interest and aretypically categorized as Level 2 in the fair value hierarchy. The total return basket swaps are valued at the net value of thereference entity provided by the administrator and are typically categorized as Level 3 in the fair value hierarchy.
MAF invests in private investment funds that pursue certain alternative investment strategies. Private investment fundinterests held by MAF are generally securities for which market quotations are not readily available. Rather, such interestsgenerally can be sold back to the private investment fund only at specified intervals or on specified dates. The board hasapproved valuation procedures pursuant to which MAF values its interests in private investment funds at ‘‘fair value.’’ MAFdetermines the fair value of that private investment fund based on the most recent estimated value provided by themanagement of the private investment fund, as well as any other relevant information reasonably available at the time MAFvalues its portfolio including, for example, total returns of indices or exchange-traded funds that track markets to which theprivate investment fund may be exposed. The fair values of the private investment funds are based on available informationand do not necessarily represent the amounts that might ultimately be realized, which depend on future circumstances andcannot be reasonably determined until the investment is actually liquidated. Fair value is intended to represent a good faithapproximation of the amount that MAF could reasonably expect to receive from the private investment fund if MAF’s interestin the private investment fund was sold at the time of valuation, based on information reasonably available at the timevaluation is made and that MAF believes is reliable. Private investment fund valuations are categorized as Level 3 in thevaluation hierarchy.
Investment Transactions and Investment Income
Securities transactions are recorded on the trade date (the date on which the buy or sell order is executed) for financialreporting purposes. Interest income and expenses are recorded on an accrual basis. The fund accretes discounts or amortizespremiums using the yield-to-maturity method on a daily basis, except for mortgage-backed securities that record paydowns.The fund recognizes paydown gains and losses for such securities and reflects them in investment income. Inflation (deflation)adjustments on inflation-protected securities are included in interest income. Dividend income is recorded on the ex-dividenddate, except certain dividends from foreign securities that are recorded as soon after the ex-dividend date as the fund, usingreasonable diligence, becomes aware of such dividends. Non-cash dividends, if any, are recorded at the fair market value of thesecurities received. The fund uses the specific identification method for determining realized gain or loss on sales of securitiesand foreign currency transactions.
TIFF MULTI-ASSET FUND / NOTES TO FINANCIAL STATEMENTS (UNAUDITED) JUNE 30, 2019
MULTI-A
SSET
38

Income Taxes
There is no provision for federal income or excise tax since the fund has elected to be taxed as a regulated investmentcompany (‘‘RIC’’) and intends to comply with the requirements of Subchapter M of the Internal Revenue Code of 1986, asamended (the ‘‘Code’’), applicable to RICs and to distribute substantially all of its taxable income. The fund may be subject toforeign taxes on income, gains on investments, or currency repatriation. The fund accrues such taxes, as applicable, as areduction of the related income and realized and unrealized gain as and when such income is earned and gains are recognized.
The fund evaluates tax positions taken or expected to be taken in the course of preparing the fund’s tax returns to determinewhether the tax positions are ‘‘more-likely-than-not’’ of being sustained by the applicable tax authorities. Tax positions notdeemed to meet the more-likely-than-not threshold are recorded as tax benefits or expenses in the current year. Managementhas analyzed the fund’s tax positions taken or to be taken on federal income tax returns for all open tax years (tax years endedDecember 31, 2015 − December 31, 2018), and has concluded that no provision for federal income tax is required in the fund’sfinancial statements.
Expenses
Expenses directly attributable to MAF are charged to the fund’s operations; expenses that are applicable to all TIP funds areallocated based on the relative average daily net assets of each TIP fund.
Dividends to Members
It is the fund’s policy to declare dividends from net investment income quarterly and distributions from capital gains at leastannually.
Dividends from net short-term capital gains and net long-term capital gains of the fund, if any, are normally declared and paidin December, but the fund may make distributions on a more frequent basis in accordance with the distribution requirementsof the Code. To the extent that a net realized capital gain could be reduced by a capital loss carryover, such gain will not bedistributed. Dividends and distributions are recorded on the ex-dividend date.
Foreign Currency Translation
The books and records of the fund are maintained in US dollars. Foreign currency amounts are translated into US dollars on thefollowing basis:
(i) the foreign currency value of investments and other assets and liabilities denominated in foreign currency are translatedinto US dollars using exchange rates obtained from an independent third party as of the fund’s pricing time on thevaluation date;
(ii) purchases and sales of investments, income, and expenses are translated at the rate of exchange prevailing on therespective dates of such transactions.
The resulting net realized and unrealized foreign currency gain or loss is included in the Statement of Operations.
The fund does not generally isolate that portion of the results of operations arising as a result of changes in the foreigncurrency exchange rates from the fluctuations arising from changes in the market prices of securities. Accordingly, such foreigncurrency gain (loss) is included in net realized and unrealized gain (loss) on investments. However, the fund does isolate theeffect of fluctuations in foreign exchange rates when determining the gain or loss upon the sale or maturity of foreign-currencydenominated debt obligations pursuant to US federal income tax regulations; such an amount is categorized as foreigncurrency gain or loss for income tax reporting purposes.
Net realized gains and losses from foreign currency-related transactions represent net gains and losses from sales andmaturities of forward currency contracts, disposition of foreign currencies, currency gains and losses realized between thetrade and settlement dates on securities transactions, and the difference between the amount of net investment incomeaccrued and the US dollar amount actually received.
Net Asset Value
The net asset value per share is calculated on a daily basis by dividing the assets of the fund, less its liabilities, by the number ofoutstanding shares of the fund.
TIFF MULTI-ASSET FUND / NOTES TO FINANCIAL STATEMENTS (UNAUDITED) JUNE 30, 2019
MULTI-A
SSET
39

3. Investment Valuation and Fair Value Measurements
The following is a summary of the inputs used as of June 30, 2019 in valuing the fund’s assets and liabilities carried at fair value:
TIFF Multi-Asset Fund
Valuation Inputs Level 1 Level 2 Level 3 TotalAssetsCommon Stocks*+ $ 665,018,632 $ 730,388,244 $ 77,217 $1,395,484,093Rights 1,332 — 94,570 95,902Warrants 566,244 — — 566,244Convertible Bonds — 10,028 — 10,028US Treasury Bonds/Notes — 188,904,607 — 188,904,607Exchange-Traded Funds 172,279,995 — — 172,279,995Private Investment Funds — — 303,195,437 303,195,437Publicly Traded Limited Partnerships 1,400,307 — — 1,400,307Preferred Stocks* — 5,388,266 — 5,388,266Disputed Claims Receipt+ — — — —Short-Term Investments — 318,771,505 — 318,771,505Purchased Options 1,135,176 — — 1,135,176
Total Investments in Securities 840,401,686 1,243,462,650 303,367,224 2,387,231,560Financial Futures Contracts − Equity Risk 657,629 — — 657,629Forward Currency Contracts − ForeignCurrency Risk — 859,407 — 859,407
Total Return Equity Swap Contract − Equity Risk — 209,626 — 209,626Total Other Financial Instruments 657,629 1,069,033 — 1,726,662Total Assets $ 841,059,315 $1,244,531,683 $303,367,224 $2,388,958,222
LiabilitiesCommon Stocks Sold Short* $(130,225,935) $ (22,062,688) $ — $ (152,288,623)Financial Futures Contracts − Equity Risk (3,114,997) — — (3,114,997)Forward Currency Contracts − ForeignCurrency Risk — (264,847) — (264,847)
Total Return Equity Swap Contract − EquityRisk — (555,456) — (555,456)
Total Return Basket Swap Contracts − EquityRisk — — (172,825) (172,825)
Written Options − Equity Risk (245,762) — — (245,762)Total Other Financial Instruments (3,360,759) (820,303) (172,825) (4,353,887)Total Liabilities $(133,586,694) $ (22,882,991) $ (172,825) $ (156,642,510)* Securities categorized as Level 2 primarily include listed foreign equities whose value has been adjusted with factors to reflect changes
to foreign markets after market close.+ There are securities in this category that have a market value of zero and are categorized as Level 3.
During the period ended June 30, 2019, there were no transfers to or from Level 3 investments.
TIFF MULTI-ASSET FUND / NOTES TO FINANCIAL STATEMENTS (UNAUDITED) JUNE 30, 2019
MULTI-A
SSET
40

The following is a reconciliation of investments in securities for which significant unobservable inputs (Level 3) were used indetermining value:
Investments in Securities
Balance as ofDecember 31,
2018Realized
Gain (Loss)
Change inUnrealizedAppreciation(Depreciation) Purchases Sales
Balanceas of June 30,
2019
Net Changein UnrealizedAppreciation(Depreciation)
fromInvestmentsstill held as of06/30/19for the
period ended06/30/19
Common Stocks* $ 143,541 $ — $ (66,324) $ — $ — $ 77,217 $ (66,324)Rights — — 16,786 77,784 — 94,570 16,786Disputed Claims Receipt 351,435 — (351,435) — — — (351,435)Private Investment Funds 362,048,738 4,326,785 4,469,272 45,500,000 (113,149,358) 303,195,437 6,377,435Total Return Basket Swaps (520,436) (27,073,324) 347,611 284,485,751 (257,412,427) (172,825) 347,611Total $362,023,278 $(22,746,539) $4,415,910 $330,063,535 $(370,561,785) $303,194,399 $6,324,073
* There are Common Stocks categorized as Level 3 that have a market value of zero.
Securities designated as Level 3 in the fair value hierarchy are valued using methodologies and procedures established by theboard, and the TIP Valuation Committee, which was established to serve as an agent of the board. Management is responsiblefor the execution of these valuation procedures. Transfers to/from, or additions to, Level 3 require a determination of thevaluation methodology, including the use of unobservable inputs, by the TIP Valuation Committee.
The TIP Valuation Committee meets no less than quarterly to review the methodologies and significant unobservable inputscurrently in use, and to adjust the pricing models as necessary. Any adjustments to the pricing models are documented in theminutes of the TIP Valuation Committee meetings, which are provided to the board on a quarterly basis.
The following is a summary of the procedures and significant unobservable inputs used in Level 3 investments:
Common Stocks, Rights and Disputed Claims Receipt. Securities for which market quotations are not readily available or forwhich available prices are deemed unreliable are valued at their fair value as determined in good faith under proceduresestablished by the board. Such procedures use fundamental valuation methods, which may include, but are not limited to, ananalysis of the effect of any restrictions on the resale of the security, industry analysis and trends, significant changes in theissuer’s financial position, and any other event which could have a significant impact on the value of the security. On aquarterly basis, the TIP Valuation Committee reviews the valuations in light of current information available about the issuer,security, or market trends to adjust the pricing models, if deemed necessary.
Private Investment Funds. Private investment funds are valued at fair value using net asset values received on monthlystatements, adjusted for the most recent estimated value or performance provided by the management of the privateinvestment fund. In most cases, values are adjusted further by the total returns of indices or exchange-traded funds that trackmarkets to which the private investment fund is fully or partially exposed, as determined by the TIP Valuation Committee uponreview of information provided by the private investment fund. On a quarterly basis, the TIP Valuation Committee comparesthe valuations as determined by the pricing models at each month-end during the quarter to statements provided bymanagement of the private investment funds in order to recalibrate the market exposures, the indices, or exchange-tradedfunds used in the pricing models as necessary.
Total Return Basket Swaps. These swap contracts held expose MAF to the returns, either positive or negative, of specialpurpose vehicles (‘‘SPVs’’) that hold actively managed portfolios of marketable investments. The SPVs were created by MorganStanley Capital Services LLC, the swap counterparty, and are valued daily by the administrators of the SPVs based on the valueof the assets held by the SPVs. Although independently received on a daily basis, the fund does not have the transparency toview the underlying inputs which support the value. Significant changes in the value would have direct and proportionalchanges in the fair value of the security. There is a third-party pricing exception to the quantitative disclosure requirementwhen prices are not determined by the reporting entity. The fund is exercising this exception and has made a reasonableattempt to obtain quantitative information from the third-party pricing vendors regarding the unobservable inputs used.
TIFF MULTI-ASSET FUND / NOTES TO FINANCIAL STATEMENTS (UNAUDITED) JUNE 30, 2019
MULTI-A
SSET
41

The valuation techniques and significant unobservable inputs used in recurring Level 3 fair value measurements of assets wereas follows:
As of June 30, 2019 Fair Value Valuation MethodologySignificant
Unobservable Inputs RangeWeightedAverage*
Common Stocks $ 77,217 Last market price Discount(%) 75% − 100% 75%Rights 94,570 Last market price
of parent companyExchange Ratio 4.97% 4.97%
Probability ofcontingent event
40.22% 40.22%
Private InvestmentFunds
303,195,437 Adjusted netasset value
Manager estimatedreturns
(2.03)% − 5.00% 1.67%
Market returns** (14.42)% − 0.39% (0.20)%Disputed Claims Receipt — Corporate
Action ModelFuture Claim
Awards0.00% 0.00%
* Weighted by market value of investments as a percentage of the total market value of level three investments within each valuationmethodology.
** Weighted by estimated exposure to chosen indices, exchange-traded funds, other marketable securities or other proxy.
The following are descriptions of the sensitivity of the Level 3 recurring fair value measurements to changes in the significantunobservable inputs presented in the table above:
Common Stocks, Rights, and Disputed Claims Receipt. The chart above reflects the methodology and significant unobservableinputs of securities held at period ended June 30, 2019. The discount for lack of marketability and estimate of future claimsused to determine fair value may include other factors such as liquidity or credit risk. An increase (decrease) in the discount orestimate of future claims would result in a lower or higher fair value measurement.
Private Investment Funds. The range of manager estimates and market returns reflected in the above chart identify the rangeof estimates and returns used in valuing the private investment funds at period ended June 30, 2019. A significant increase(decrease) in the estimates received from the manager of the private investment funds would result in a significantly higher(lower) fair value measurement. A significant increase (decrease) in the market return weighted by estimated exposures tochosen indices would result in a significantly higher or lower fair value measurement.
The table below details the fund’s ability to redeem from private investment funds that are classified as Level 3 assets. Theprivate investment funds in this category generally impose a ‘‘lockup’’ or ‘‘gating’’ provision, which may restrict the timing,amount, or frequency of redemptions. All or a portion of the interests in these privately offered funds generally are deemed tobe illiquid.
Fair Value Redemption FrequencyRedemption Notice
Period
Multi-Strategy (a) 69,299,973 daily (90%) 2 daysLong-Short Global Healthcare (b) 37,484,838 quarterly 45 daysTrend Following (c) 47,902,032 daily 2 daysLong-Short Global (d) 110,009,976 monthly (32%),
quarterly (68%) 60 − 90 daysRelative Value (e) 10,361,859 quarterly 30 daysLong-Short US Small-Cap (f) 28,136,759 quarterly 45 daysTotal $303,195,437(a) This strategy primarily comprises capital allocated to various strategies based on risk and return profiles. This strategy includes
$6,840,387 of redemption residuals.(b) This strategy primarily comprises long and short positions in global healthcare securities.(c) This strategy primarily comprises long and short investments in commodity, equity index, currency, and fixed income futures, based on
trailing price movements.(d) This strategy primarily comprises long and short positions in global common stocks.(e) This strategy primarily comprises long and short positions in US large-cap common stocks selected using artificial intelligence.(f) This strategy primarily comprises long and short positions in US small-cap common stocks.
TIFF MULTI-ASSET FUND / NOTES TO FINANCIAL STATEMENTS (UNAUDITED) JUNE 30, 2019
MULTI-A
SSET
42

4. Derivative and Other Financial Instruments
During the period ended June 30, 2019, the fund invested in derivatives, such as but not limited to futures, currency forwards,purchased and written options, and total return equity and basket swaps for hedging, liquidity, index exposure, and activemanagement strategies. Derivatives are used for ‘‘hedging’’ when TIFF Advisory Services, Inc. (‘‘TAS’’) or a money managerseeks to protect the fund’s investments from a decline in value. Derivative strategies are also used when TAS or a moneymanager seeks to increase liquidity, implement a cash management strategy, invest in a particular stock, bond or segment ofthe market in a more efficient or less expensive way, modify the effective duration of the fund’s portfolio investments and/orfor purposes of total return. Depending on the purpose for which the derivative instruments are being used, the successful useof derivative instruments may depend on, among other factors, TAS’s or the money manager’s general understanding of howderivative instruments act in relation to referenced securities or markets but also on market conditions, which are out ofcontrol of TAS or the money manager.
Cover for Strategies Using Derivative Instruments
Transactions using derivative instruments, including futures contracts, written options and swaps, expose the fund to anobligation to another party and may give rise to a form of leverage. It is the fund’s policy to segregate assets to cover derivativetransactions that might be deemed to create leverage under Section 18 of the 1940 Act. In that regard, the fund will not enterinto any such transactions unless it has covered such transactions by owning and segregating either (1) an offsetting(‘‘covered’’) position in securities, currencies, or other derivative instruments or (2) cash and/or liquid securities with a valuesufficient at all times to cover its potential obligations to the extent not covered as provided in (1) above. When the fund isrequired to segregate cash or liquid securities, it will instruct its custodian as to which cash holdings or liquid assets are to bemarked on the books of the fund or its custodian as segregated for purposes of Section 18 of the 1940 Act. The fund willmonitor the amount of these segregated assets on a daily basis and will not enter into additional transactions that wouldrequire the segregation of cash or liquid securities unless the fund holds a sufficient amount of cash or liquid securities that canbe segregated.
Financial Futures Contracts
The fund may use futures contracts, generally in one of three ways: (1) to gain exposures, both long and short, to the totalreturns of broad equity indices, globally; (2) to gain exposures, both long and short, to the returns of non-dollar currenciesrelative to the US dollar; and (3) to manage the duration of the fund’s fixed income holdings to targeted levels.
Futures contracts involve varying degrees of risk. Such risks include the imperfect correlation between the price of a derivativeand that of the underlying security and the possibility of an illiquid secondary market for these securities. Futures contracts arevalued at the settlement price established each day by the board of trade or exchange on which they are traded.
A financial futures contract is an agreement to purchase (long) or sell (short) an agreed amount of securities or otherinstrument at a set price for delivery at a future date. At the time a futures contract is purchased or sold, the fund mustallocate cash or securities as a deposit payment (‘‘initial margin’’). An outstanding futures contract is valued daily, and thepayment in cash of ‘‘variation margin’’ will be required, a process known as ‘‘marking to the market.’’ Each day, the fund willbe required to provide (or will be entitled to receive) variation margin in an amount equal to any decline (in the case of a longfutures position) or increase (in the case of a short futures position) in the contract’s value since the preceding day. The dailyvariation margin is recorded as a receivable or payable on the Statement of Assets and Liabilities. When the contracts areclosed, a realized gain or loss is recorded as net realized gain (loss) from financial futures contracts in the Statement ofOperations, equal to the difference between the opening and closing values of the contracts.
US futures contracts have been designed by exchanges that have been designated as ‘‘contract markets’’ by the CommodityFutures Trading Commission and such contracts must be executed through a futures commission merchant or brokerage firmthat is a member of the relevant contract market. Futures contracts may trade on a number of exchange markets, and throughtheir clearing corporations, the exchanges guarantee performance of the contracts as between the clearing members of theexchange, thereby reducing the risk of counterparty default. Securities designated as collateral for market value on futurescontracts are noted in the Schedule of Investments.
Swap Contracts
The fund may use swaps and generally uses them in the following ways: (1) to gain exposures, both long and short, to the totalreturns of broad equity indices; (2) to gain exposure, both long and short, to the total returns of individual equities and bonds;and (3) to gain long-term exposures to the total returns of selected investment strategies. While swaps falling into the first andthird categories are often held for multiple quarters, if not years, swaps in the second category can at times be held for shortertime periods or adjusted frequently based on the managers’ evolving views of the expected risk/reward of the trade.
TIFF MULTI-ASSET FUND / NOTES TO FINANCIAL STATEMENTS (UNAUDITED) JUNE 30, 2019
MULTI-A
SSET
43

The fund maintained long and short total return equity swap contracts to indirectly gain exposure to both long and short totalreturns of individual equities.
The fund also maintained three total return basket swap contracts in order to indirectly gain exposure to the investmentstrategies of selected investment advisors. With Morgan Stanley Capital Services LLC as the counterparty, MAF entered into atotal return basket swap with respect to each investment strategy to which it sought exposure. Under each swap, MAF receivesthe return (or pays, if the return is negative) of a special purpose vehicle that invests in accordance with the applicable strategyand pays one-month Libor + an additional interest rate. The three strategies held at period end are described below.
KCP Long Segregated Portfolio:The typical portfolio construction is a US focused long portfolio. The long portfolio is passive equity exposure (primarily S&P500, S&P 600 Citigroup value, S&P 400 Citigroup Growth, and MSCI USA Momentum Index).
KCP Short Segregated Portfolio:The typical portfolio construction is a US focused short portfolio with specific positions selected by the manager.
Welton Nexus Segregated Portfolio:The typical portfolio construction is a market neutral statistical arbitrage strategy in which computers attempt to identify andtake advantage of small mispricings between stocks across North America and Europe.
Generally, swap agreements are contracts between a fund and another party (the swap counterparty) involving the exchangeof payments on specified terms over periods ranging from a few days to multiple years. A swap agreement may be negotiatedbilaterally and traded OTC between the two parties (for an uncleared swap) or, in some instances, must be transacted througha Futures Commission Merchant and cleared through a clearinghouse that serves as a central counterparty (for a clearedswap). In a basic swap transaction, the fund agrees with the swap counterparty to exchange the returns (or differentials inrates of return) and/or cash flows earned or realized on a particular ‘‘notional amount’’ or value of predetermined underlyingreference instruments. The notional amount is the set dollar or other value selected by the parties to use as the basis on whichto calculate the obligations that the parties to a swap agreement have agreed to exchange. The parties typically do not actuallyexchange the notional amount. Instead they agree to exchange the returns that would be earned or realized if the notionalamount were invested in given investments or at given interest rates. Examples of returns that may be exchanged in a swapagreement are those of a particular security, a particular fixed or variable interest rate, a particular non-US currency, or a‘‘basket’’ of securities representing a particular index or portfolio of securities and other instruments. Swaps can also be basedon credit and other events.
A fund will generally enter into swap agreements on a net basis, which means that the two payment streams that are to bemade by the fund and its counterparty with respect to a particular swap agreement are netted out, with the fund receiving orpaying, as the case may be, only the net difference in the two payments. The fund’s obligations (or rights) under a swapagreement that is entered into on a net basis will generally be the net amount to be paid or received under the agreementbased on the relative values of the obligations of each party upon termination of the agreement or at set valuation dates. Thefund will accrue its obligations under a swap agreement daily (offset by any amounts the counterparty owes the fund). If theswap agreement does not provide for that type of netting, the full amount of the fund’s obligations will be accrued on a dailybasis.
Cleared swaps are subject to mandatory central clearing. Central clearing is designed to reduce counterparty credit risk andincrease liquidity compared to bilateral swaps because central clearing interposes the central clearinghouse as thecounterparty to each participant’s swap, but it does not eliminate those risks completely and may involve additional costs andrisks not involved with uncleared swaps.
Upon entering into a swap agreement, the fund may be required to pledge to the swap counterparty an amount of cash and/orother assets equal to the total net amount (if any) that would be payable by the fund to the counterparty if the swap wereterminated on the date in question, including any early termination payments. In certain circumstances, the fund may berequired to pledge an additional amount, known as an independent amount, which is typically equal to a specified percentageof the notional amount of the trade. In some instances, the independent amount can be a significant percentage of thenotional amount. Likewise, the counterparty may be required to pledge cash or other assets to cover its obligations to thefund, net of the independent amount, if any. However, the amount pledged may not always be equal to or more than theamount due to the other party. Therefore, if a counterparty defaults in its obligations to the fund, the amount pledged by thecounterparty and available to the fund may not be sufficient to cover all the amounts due to the fund and the fund may sustaina loss. Other risks may apply if an independent amount has been posted.
TIFF MULTI-ASSET FUND / NOTES TO FINANCIAL STATEMENTS (UNAUDITED) JUNE 30, 2019
MULTI-A
SSET
44

The fund records a net receivable or payable for the amount expected to be received or paid in the period. Fluctuations in thevalue of swap contracts are recorded for financial statement purposes as unrealized appreciation (depreciation) oninvestments. The swap is valued at fair market value as determined by valuation models developed and approved inaccordance with the fund’s valuation procedures. In addition, the fund could be exposed to risk if the counterparties areunable to meet the terms of the contract or if the value of foreign currencies change unfavorably to the US dollar.
Options
The fund generally uses options to hedge a portion (but not all) of the downside risk in its long or short equity positions andalso opportunistically to generate total returns. The fund may also engage in writing options, for example, to express a longview on a security. When writing a put option, the risk to the fund is equal to the notional value of the position.
Generally, an option is a contract that gives the purchaser of the option, in return for the premium paid, the right to buy aspecified security, currency or other instrument (an ‘‘underlying instrument’’) from the writer of the option (in the case of a calloption), or to sell a specified security, currency, or other instrument to the writer of the option (in the case of a put option) at adesignated price during the term of the option or at the expiration date of the option. Put and call options that the fundpurchases may be traded on a national securities exchange or in the OTC market. All option positions entered into on anational securities exchange are cleared and guaranteed by the Options Clearing Corporation, thereby reducing the risk ofcounterparty default. There can be no assurance that a liquid secondary market will exist for any option purchased.
As the buyer of a call option, the fund has a right to buy the underlying instrument (e.g., a security) at the exercise price at anytime during the option period (for American style options) or at the expiration date (for European style options). The fund mayenter into closing sale transactions with respect to call options, exercise them, or permit them to expire unexercised. As thebuyer of a put option, the fund has the right to sell the underlying instrument at the exercise price at any time during theoption period (for American style options) or at the expiration date (for European style options). Like a call option, the fundmay enter into closing sale transactions with respect to put options, exercise them or permit them to expire unexercised.When buying options, the fund’s potential loss is limited to the cost (premium plus transaction costs) of the option.
As the writer of a put option, the fund retains the risk of loss should the underlying instrument decline in value. If the value ofthe underlying instrument declines below the exercise price of the put option and the put option is exercised, the fund, as thewriter of the put option, will be required to buy the instrument at the exercise price. The fund will incur a loss to the extentthat the current market value of the underlying instrument is less than the exercise price of the put option net of the premiumreceived by the fund for the sale of the put option. If a put option written by the fund expires unexercised, the fund will realizea gain in the amount of the premium received. As the writer of a put option, the fund may be required to pledge cash and/orother liquid assets at least equal to the value of the fund’s obligation under the written put.
The fund may write ‘‘covered’’ call options, meaning that the fund owns the underlying instrument that is subject to the call, orhas cash and/or liquid securities with a value at all times sufficient to cover its potential obligations under the option. Whenthe fund writes a covered call option covered by the underlying instrument that is subject to the call, the underlyinginstruments that are held by the fund and are subject to the call option will be earmarked as segregated on the books of thefund or the fund’s custodian. A fund will be unable to sell the underlying instruments that are subject to the written call optionuntil it either effects a closing transaction with respect to the written call, or otherwise satisfies the conditions for release ofthe underlying instruments from segregation, for example, by segregating sufficient cash and/or liquid assets necessary toenable the fund to purchase the underlying instrument in the event the call option is exercised by the buyer.
When the fund writes an option, an amount equal to the premium received by the fund is included in the fund’s Statement ofAssets and Liabilities as a liability and subsequently marked to market to reflect the current value of the option written. Thesecontracts may also involve market risk in excess of the amounts stated in the Statement of Assets and Liabilities. In addition,the fund could be exposed to risk if the counter-parties are unable to meet the terms of the contract or if the value of foreigncurrencies change unfavorably to the US dollar. The current market value of a written option is the last sale price on themarket on which it is principally traded. If the written option expires unexercised, the fund realizes a gain in the amount of thepremium received. If the fund enters into a closing transaction, it recognizes a gain or loss, depending on whether the cost ofthe purchase is less than or greater than the premium received.
Forward Currency Contracts
At times, the fund enters into forward currency contracts to manage the foreign currency exchange risk to which it is subject inthe normal course of pursuing international investment objectives. The primary objective of such transactions is to protect(hedge) against a decrease in the US dollar equivalent value of its foreign securities or the payments thereon that may resultfrom an adverse change in foreign currency exchange rates in advance of pending transaction settlements.
TIFF MULTI-ASSET FUND / NOTES TO FINANCIAL STATEMENTS (UNAUDITED) JUNE 30, 2019
MULTI-A
SSET
45

A forward currency contract is an agreement between two parties to buy or sell a specific currency for another at a set price ona future date, which is individually negotiated and privately traded by currency traders and their customers in the interbankmarket. The market value of a forward currency contract fluctuates with changes in forward currency exchange rates. Forwardcurrency contracts are marked-to-market daily, and the change in value is recorded by the fund as an unrealized gain or loss.The fund may either exchange the currencies specified at the maturity of a forward contract or, prior to maturity, enter into aclosing transaction involving the purchase or sale of an offsetting forward contract. Closing transactions with respect toforward contracts are usually performed with the counterparty to the original forward contract. The gain or loss arising fromthe difference between the US dollar cost of the original contract and the value of the foreign currency in US dollars uponclosing a contract is included in net realized gain (loss) from forward currency contracts on the Statement of Operations. Thesecontracts may involve market risk in excess of the unrealized gain or loss reflected in the fund’s Statement of Assets andLiabilities. In addition, the fund could be exposed to risk if the counterparties are unable to meet the terms of the contracts orif the value of the currency changes unfavorably to the US dollar.
Forward currency contracts held by the fund are fully collateralized by other securities, as disclosed in the accompanyingSchedule of Investments. The collateral is evaluated daily to ensure its market value equals or exceeds the current marketvalue of the corresponding forward currency contracts.
Short Selling
At times, the fund sells securities it does not own in anticipation of a decline in the market price of such securities or in order tohedge portfolio positions. The fund generally will borrow the security sold in order to make delivery to the buyer. Uponentering into a short position, the fund records the proceeds as a deposit with broker for securities sold short in its Statementof Assets and Liabilities and establishes an offsetting liability for the securities or foreign currencies sold under the short saleagreement. The fund is required to pledge cash or securities to the broker as collateral for the securities sold short. Collateralrequirements are calculated daily based on the current market value of the short positions. Cash collateral deposited at thefund’s custodian for the benefit of the broker is recorded as Deposits with broker for securities sold short on the Statements ofAssets and Liabilities. Securities segregated as collateral are denoted on the Schedule of Investments. The liability is marked-to-market while it remains open to reflect the current settlement obligation. Until the security or currency is replaced, the fund isrequired to pay the lender any dividend or interest earned. Such payments are recorded as expenses to the fund. When aclosing purchase is entered into by the fund, a gain or loss equal to the difference between the proceeds originally receivedand the purchase cost is recorded in the Statement of Operations.
In ‘‘short selling,’’ the fund sells borrowed securities or currencies which must at some date be repurchased and returned tothe lender. If the market value of securities or currencies sold short increases, the fund may realize losses upon repurchase inamounts which may exceed the liability on the Statement of Assets and Liabilities. Further, in unusual circumstances, the fundmay be unable to repurchase securities to close its short position except at prices significantly above those previously quotedin the market.
Derivative Disclosure
The fund is a party to agreements which include netting provisions or other similar arrangements. While the terms andconditions of these agreements may vary, all transactions under each such agreements constitute a single contractualrelationship, and each party’s obligation to make any payments, deliveries, or other transfers in respect of any transactionunder such agreement may be applied against the other party’s obligations under such agreement and netted. A default by aparty in performance with respect to one transaction under such an agreement would give the other party the right toterminate all transactions under such agreement and calculate one net amount owed from the defaulting party to the other.The fund is required to disclose positions held at period-end that were entered into pursuant to agreements that allow thefund to net the counterparty’s obligations against those of the fund in the event of a default by the counterparty.
TIFF MULTI-ASSET FUND / NOTES TO FINANCIAL STATEMENTS (UNAUDITED) JUNE 30, 2019
MULTI-A
SSET
46

At June 30, 2019, the fund’s derivative assets and liabilities (by contract type) are as follows:
Assets Liabilities
Derivative Financial Instruments:Purchased Options $1,135,176 $ —Written Options — (245,762)Total Return Equity Swap Contracts 209,626 (555,456)Total Return Basket Swap Contracts — (172,825)Forward Contracts 859,407 (264,847)Futures Contracts 657,629 (3,114,997)
Total derivative assets and liabilities 2,861,838 (4,353,887)Derivatives not subject to a netting provision or similar arrangement 1,792,805 (3,360,759)Total assets and liabilities subject to a netting provision or similar arrangement $1,069,033 $ (993,128)
The following table presents the fund’s derivative assets net of amounts available for offset under a netting provision or similararrangement and net of the related collateral (excluding any independent amounts) received by the fund as of June 30, 2019:
Counterparty
DerivativeAssets Subjectto a NettingProvisionor Similar
Arrangement
DerivativesAvailablefor Offset
CollateralReceived* Net Amount
Forward Currency ContractsBarclays Bank plc $ 454,997 $ (94,564) $— $360,433Goldman Sachs International 404,410 (170,283) — 234,127
SwapsMorgan Stanley Capital Services LLC 209,626 (209,626) — —
Total $1,069,033 $(474,473) $— $594,560* At June 30, 2019, the counterparties had deposited in segregated accounts cash with a total value of $ 530,000 in connection with open
forward currency contracts.
The following table presents the fund’s derivative liabilities net of amounts available for offset under a netting provision orsimilar arrangement and net of the related collateral (excluding any independent amounts) pledged by the fund as of June 30,2019:
Counterparty
DerivativeLiabilities Subject
to a NettingProvisionor Similar
Arrangement
DerivativesAvailablefor Offset
CollateralPledged Net Amount
Forward Currency ContractsBarclays Bank plc $ (94,564) $ 94,564 $ — $—Goldman Sachs International (170,283) 170,283 — —
SwapsMorgan Stanley Capital Services LLC (728,281) 209,626 518,655 —
Total $(993,128) $474,473 $518,655 $—
The following tables provide quantitative disclosure about fair value amounts of and gains and losses on the fund’s derivativeinstruments grouped by contract type and primary risk exposure category as of June 30, 2019. These derivatives are notaccounted for as hedging instruments.
TIFF MULTI-ASSET FUND / NOTES TO FINANCIAL STATEMENTS (UNAUDITED) JUNE 30, 2019
MULTI-A
SSET
47

The following table lists the fair values of the fund’s derivative holdings as of June 30, 2019, grouped by contract type and riskexposure category:
Derivative TypeStatement of Assets and Liability
and LocationForeign
Currency Risk
QuarterlyAverage%** Equity Risk
QuarterlyAverage%** Total
Purchased Options Investments in securities, at value $ — —% $ 1,135,176 0.10% $ 1,135,176Total Return Equity SwapContracts
Unrealized appreciation onswap contracts — —% 209,626 0.01% 209,626
Forward CurrencyContracts
Unrealized appreciationon forward currency contracts 859,407 0.05% — —% 859,407
Financial FuturesContracts
Due from broker forfutures variation margin* — —% 657,629 0.04% 657,629
Total Value − Assets $ 859,407 $ 2,002,431 $ 2,861,838
Written Options Written option, at value $ — —% $ (245,762) 0.01% $ (245,762)Total Return Equity SwapContracts
Unrealized depreciation onswap contracts — —% (555,456) 0.01% (555,456)
Total Return Basket SwapContracts
Unrealized depreciation onswap contracts — —% (172,825) 0.02% (172,825)
Forward CurrencyContracts
Unrealized depreciation onforward currency contracts (264,847) 0.02% — —% (264,847)
Financial FuturesContracts
Due to broker for futuresvariation margin* — —% (3,114,997) 0.10% (3,114,997)
Total Value − Liabilities $(264,847) $(4,089,040) $(4,353,887)
* The Quarterly Average % is a representation of the volume of derivative activity. Quarterly Average % was calculated as follows: At eachquarter end from and including December 31, 2018 to and including June 30, 2019, the absolute value of the applicable fair valueamount was divided by net assets to derive a percentage of net assets for each quarter end. The Quarterly Average % amountrepresents the average of these three percentages.
** Includes appreciation (depreciation) on the date the contracts are opened through June 30, 2019. Only current day’s variation margin isreported within the Statement of Assets and Liabilities.
The following table lists the amounts of gains or losses included in net increase in net assets resulting from operations for theperiod ended June 30, 2019, grouped by contract type and risk exposure category.
Derivative Type Statement of Operations LocationForeign
Currency Risk Equity Risk Total
Realized Gain (Loss)
Purchased OptionsNet realized gain (loss)
on Investments $ — $ 364,009 $ 364,009
Written OptionsNet realized gain (loss)on Written options — 218,467 218,467
Swap ContractsNet realized gain (loss)on Swaps contracts — 19,334,446 19,334,446
Forward Currency Contracts
Net realized gain (loss)on Forward
currency contracts 1,786,291 — 1,786,291
Financial Futures Contracts
Net realized gain (loss)on Financial
futures contracts — 24,708,375 24,708,375Total Realized Gain (Loss) $1,786,291 $44,625,297 $46,411,588
TIFF MULTI-ASSET FUND / NOTES TO FINANCIAL STATEMENTS (UNAUDITED) JUNE 30, 2019
MULTI-A
SSET
48

The following table lists the change in unrealized appreciation (depreciation) included in net increase in net assets resultingfrom operations for the period ended June 30, 2019, grouped by contract type and risk exposure category.
Derivative TypeStatement of Operations
LocationForeign
Currency Risk Equity Risk Total
Change in Appreciation (Depreciation)
Purchased Options
Net Change in UnrealizedAppreciation (Depreciation)
on Investments $ — $(4,378,241) $(4,378,241)
Written Options
Net Change in UnrealizedAppreciation (Depreciation)
on Written options — (14,784) (14,784)
Swap Contracts
Net Change in UnrealizedAppreciation (Depreciation)
on Swap contracts — 1,781 1,781
Forward Currency Contracts
Net Change in UnrealizedAppreciation (Depreciation)
on Forward currency contracts (1,226,027) — (1,226,027)
Financial Futures Contracts
Net Change in UnrealizedAppreciation (Depreciation)on Financial futures contracts — 628,009 628,009
Total Change in Appreciation(Depreciation) $(1,226,027) $(3,763,235) $(4,989,262)
5. Investment Advisory Agreement, Money Manager Agreements, and Other Transactions with Affiliates
TIP’s board has approved an investment advisory agreement for the fund with TAS. The fund pays TAS a monthly fee calculatedby applying the annual rates set forth below to the fund’s average daily net assets for the month:
AssetsOn the first $1 billion 0.25%On the next $1 billion 0.23%On the next $1 billion 0.20%On the remainder (> $3 billion) 0.18%
Fees paid for such services paid to TAS by the fund are reflected as investment advisory fees on the Statement of Operations.As of June 30, 2019, $463,821 remained payable and are included in investment advisory and administrative fees on theStatement of Assets and Liabilities.
TAS provides certain administrative services to the fund under a services agreement. For these services, the fund pays amonthly fee calculated by applying an annual rate of 0.02% to the fund’s average daily net assets for the month. Fees for suchservices paid to TAS by the fund are reflected as administrative fees on the Statement of Operations. As of June 30, 2019,$39,900 remained payable and are included in investment advisory and administrative fees on the Statement of Assets andLiabilities.
TIP has designated an employee of TAS as its Chief Compliance Officer. For these services provided to TIP, which include themonitoring of TIP’s compliance program pursuant to Rule 38a-1 under the 1940 Act, TIP reimburses TAS. MAF pays a pro rataportion of such costs based on its share of TIP’s net assets. The costs for such services paid to TAS by the fund were $98,172 forperiod ended June 30, 2019 and are included in Chief Compliance Officer’s costs and Trustee’s fees on the Statement ofOperations. As of June 30, 2019, $822 remained payable and are included in Chief Compliance Officer’s costs and Trustee’sfees on the Statement of Assets and Liabilities.
TIP’s board, all of whom are considered ‘‘disinterested trustees’’ as defined in the 1940 Act, serve as volunteers and receive nofees or salary for their service as board members. The independent chair of the board received compensation of $24,147 fromMAF for the period ended June 30, 2019 for service as independent chair. Fees paid for such services are included in ChiefCompliance Officer’s costs and Trustee’s fees on the Statement of Operations. As of June 30, 2019, $12,057 remained payableand are included in Chief Compliance Officer’s costs and Trustee’s fees on the Statement of Assets and Liabilities.
TIFF MULTI-ASSET FUND / NOTES TO FINANCIAL STATEMENTS (UNAUDITED) JUNE 30, 2019
MULTI-A
SSET
49

TIP’s board has approved money manager agreements with each of the money managers. Certain money managers will receivefees based in whole or in part on performance of the money manager’s portfolio. Other money managers will receivemanagement fees equal to a specified percentage per annum of the assets under management by such money manager with asingle rate or on a descending scale. Money managers who provided services to the fund and their fee terms during the periodended June 30, 2019 were as follows:
Assets-Based Schedules [a] All paid MonthlyMoney Manager/Strategy Minimum Maximum Breakpoints
Amundi Pioneer Institutional Asset Management, Inc. − Beta 0.02% 0.03% YESFundsmith, LLP 0.90% — NOGreen Court Capital Management Limited 0.60% 0.90% YESLansdowne Partners (UK) LLC 0.80% — NO
Fulcrum Fee Schedule [b] paid Monthly
Money Manager/Strategy Floor CapFulcrum
Fee Benchmark
Excess Returnto achieveFulcrum fee
AJO, LP − Domestic Large Cap 0.10% 0.50% 0.30% S&P 500 Index 2.00%
Blended Asset-Based and Performance-Based Fee Schedules [c]Asset-Based Portion − All Paid Monthly Performance-Based Portion − All Paid Annually
Money Manager/Strategy Minimum Maximum Breakpoints Benchmark/HurdlePerformance
Fee
PerformanceMeasurement
PeriodHigh
Water Mark Cap
AJO, LP − EmergingMarkets
— — — MSCI Emerging MarketsSmall Cap Index (net)
16.6% (d) (e) Rolling60 months
NO 1.33% (d)ANA
AQR CapitalManagement −Europe, Australasia,Far East (‘‘EAFE’’)
0.30% — NO MSCI EAFE Index (net) 17% Calendaryear
NO NO
AQR CapitalManagement − US
0.20% — NO Russell 1000 Total ReturnIndex (net)
17% Calendaryear
NO NO
Deep BasinCapital LP(f)
1.325% 1.50% NO 16.25% Calendaryear
YES NO
Hosking Partners LLP 0.28% — NO Blend: 50% MSCI AllCountry World Index (netdividends reinvested) and50% MSCI All CountryWorld Index (grossdividends reinvested)
18% (e) Rolling60 months
NO NO
Kopernik GlobalInvestors, LLC
0.10% — NO MSCI All Country WorldIndex (net)
20% Calendaryear
NO NO
Mission ValuePartners, LLC
0.50% 0.75% YES 36 month blended hurdleof avg monthly change inConsumer Price Index x 12+ spread of 4% for monthsprior to April 1, 2019 and aflat 4.5% − 5.5% thereafter
10% (e) Rolling36 months
NO 1.00%
Strategy Capital, LLC Blendedrate
between0.1875%and
0.10% (g)
0.75% YES S&P 500 Index (net) 10%-20% (h) Calendaryear
NO NO
TB Alternative AssetsLtd
0.75% — NO Blend: 50% MSCI ChinaIndex and 50% CSI 300Index
15% Calendaryear
NO NO
(a) Fee schedules are based on assets under management, irrespective of performance. The fee rate is applied to average net assets.(b) Fee schedules embody the concept of a ‘‘fulcrum’’ fee (i.e., a fee midway between the minimum and the maximum). Actual fees paid to
such money managers are proportionately related to performance above or below the fulcrum point. The formula is designed toaugment the fee if the portfolio’s excess return (i.e., its actual return less the total return of the portfolio’s benchmark) exceeds aspecified level and to reduce the fee if the portfolio’s excess return falls below this level. The fee rate is applied to average net assets.
TIFF MULTI-ASSET FUND / NOTES TO FINANCIAL STATEMENTS (UNAUDITED) JUNE 30, 2019
MULTI-A
SSET
50

(c) The performance-based portion of the fee schedule is generally based on a specified percentage of the amount by which the returngenerated by the money manager’s portfolio exceeds the return of the portfolio’s benchmark or a specified percentage of the netappreciation of the manager’s portfolio over a hurdle, in certain cases subject to a high water mark, a performance fee cap, or therecovery of prior years’ losses, if any. Total returns are generally computed over rolling time periods of varying lengths and are in mostcases determined gross of fund expenses and fees, except custodian transaction charges and, in certain cases, the asset-based feeand/or performance-based fee applicable to the money manager’s account.
(d) During the first five years after a contribution to the account (the ʹʹtransitional period’’), the performance fee is similarly structured,with the measurement periods starting at a specified inception date and running through each annual calculation date but withperformance fee rates and fee caps for each measurement period that decline from 20.2% to 17.21%, with respect to the performancefee rates, and 1.615% of average net assets to 1.38% of average net assets, with respect to the fee caps.
(e) Performance-based fees earned on excess return (portfolio over benchmark) expressed as a percentage times average net assets.(f) Asset based fee rate is reduced over time as follows: 1.50% per annum on all assets from January 31, 2019 through August 31, 2019,
1.325% per annum on all assets from September 1, 2019 through August 31, 2020, 1.2% per annum on all assets thereafter unless ifafter September 1, 2021 the assets managed by in the Deep Basin long/short strategy exceed $750 million for two consecutive calendarquarters in which case the rate would be reduced to 1.125% per annum on all assets.
(g) Asset based fee minimum rate is a blended rate between 0.1875% and 0.10% based on manager assets.(h) Performance fee rate based on average assets managed by Strategy Capital, LLC, excluding TIFF advised assets and assets of Strategy
Capital, LLC and its affiliates.
Fees for such services paid to the individual money managers are reflected as money manager fees on the Statement ofOperations. As of June 30, 2019, $2,057,970 remained payable and reflected as money manager fees on the Statement ofAssets and Liabilities.
With respect to MAF’s investments in other registered investment companies, private investment funds, exchange-tradedfunds, and other acquired funds, MAF bears its ratable share of each such entity’s expenses, including its share of themanagement and performance fees, if any, charged by such entity through that entity’s NAV. MAF’s share of management andperformance fees charged by such entities is in addition to fees paid by MAF to TAS and the money managers.
6. Fund Administration and Custody Agreement
Pursuant to a series of agreements, State Street Bank and Trust Company (‘‘State Street’’) earns a fee for providing core fundadministration, fund accounting, domestic custody, and transfer agent services. Fees paid for non-core services rendered byState Street include, but are not limited to, foreign custody and transactional fees, which are based upon assets of the fundand/or on transactions entered into by the fund during the period, and out-of-pocket expenses. Fees for such services paid toState Street by the fund are reflected as fund administration and custody fees on the Statement of Operations. As of June 30,2019, $2,737,521 remained payable and reflected as fund administration and custody fees on the Statement of Assets andLiabilities.
7. Investment Transactions
Cost of investment securities purchased and proceeds from sales of investment securities, other than short-term investments,during the period ended June 30, 2019 were as follows:
Purchases Sales
Non-US Government Securities $945,451,957 $1,196,152,578US Government Securities 88,803,510 121,844,524
8. Federal Tax Information
For federal income tax purposes, the cost of investments owned at June 30, 2019 has been estimated since the final taxcharacteristic cannot be determined until subsequent to fiscal year end. The cost of securities, the aggregate gross unrealizedappreciation/(depreciation), and the net unrealized appreciation/(depreciation) on securities, other than proceeds fromsecurities sold short, at June 30, 2019, are as follows:
Gross UnrealizedAppreciation
Gross UnrealizedDepreciation
Net UnrealizedAppreciation/(Depreciation)
Tax Cost ofInvestments
Investments in securities $319,741,834 $(271,994,608) $47,747,226 $2,338,349,158Securities sold short 7,210,990 (9,159,879) (1,948,889) (150,339,734)
TIFF MULTI-ASSET FUND / NOTES TO FINANCIAL STATEMENTS (UNAUDITED) JUNE 30, 2019
MULTI-A
SSET
51

Gross UnrealizedAppreciation
Gross UnrealizedDepreciation
Net UnrealizedAppreciation/(Depreciation)
Tax Cost ofDerivatives
Purchased option contracts — — — 1,135,176Financial futures contracts — — — (2,457,368)Forward currency contracts — — — 594,560Swap contracts — — — (518,655)Written option contracts — — — (245,762)
The difference between the tax cost of securities and the cost of securities for GAAP purposes is primarily due to the taxtreatment of wash sale losses, mark to market on derivatives, mark to market on passive foreign investment companies, totalreturn swaps, partnerships, and tax adjustments related to holding offsetting positions such as straddles.
Dividends and distributions from net investment income and net realized capital gains are determined in accordance withfederal income tax regulations, which may differ from GAAP. These ‘‘book/tax’’ differences are considered either temporary orpermanent in nature. To the extent these differences are permanent in nature, such amounts are reclassified within the capitalaccounts based on their federal tax-basis treatment; temporary differences do not require reclassification.
The amount and character of tax basis distributions and composition of net assets are finalized at fiscal year end; accordingly,tax basis balances have not been determined as of June 30, 2019.
9. Repurchase and Reverse Repurchase Agreements
The fund will engage in repurchase and reverse repurchase transactions under the terms of master repurchase agreementswith parties approved by TAS or the relevant money manager.
In a repurchase agreement, the fund buys securities from a counterparty (e.g., typically a member bank of the Federal Reservesystem or a securities firm that is a primary or reporting dealer in US Government securities) with the agreement that thecounterparty will repurchase them at the same price plus interest at a later date. In certain instances, the fund may enter intorepurchase agreements with one counterparty, but face another counterparty at settlement. Repurchase agreements may becharacterized as loans secured by the underlying securities. Such transactions afford an opportunity for the fund to earn areturn on available cash at minimal market risk, although the fund may be subject to various delays and risks of loss if thecounterparty becomes subject to a proceeding under the US Bankruptcy Code or is otherwise unable to meet its obligation torepurchase the securities. In transactions that are considered to be collateralized fully, the securities underlying a repurchaseagreement will be marked to market every business day so that the value of such securities is at least equal to the repurchaseprice thereof, including accrued interest.
In a reverse repurchase agreement, the fund sells US Government securities and simultaneously agrees to repurchase them atan agreed-upon price and date. The difference between the amount the fund receives for the securities and the additionalamount it pays on repurchase is deemed to be a payment of interest. Reverse repurchase agreements create leverage, aspeculative factor, but will not be considered borrowings for the purposes of limitations on borrowings. When a fund entersinto a reverse repurchase agreement, it must segregate on its or its custodian’s books cash and/or liquid securities in anamount equal to the amount of the fund’s obligation (cost) to repurchase the securities, including accrued interest.
The following table presents the fund’s repurchase agreements net of amounts available for offset and net of the relatedcollateral received as of June 30, 2019:
Counterparty
Assets Subjectto a NettingProvisionor Similar
ArrangementLiabilities Available
for Offset Collateral Received Net Amount
Fixed Income Clearing Corp. $99,102,703 $ — $(99,102,703) $ —Total $99,102,703 $ — $(99,102,703) $ —
Please see Note 4, Derivatives and Other Financial Instruments, for further discussion of netting provisions and similararrangements.
10. Capital Share Transactions
While there are no sales commissions (loads) or 12b-1 fees, MAF assesses entry and exit fees of 0.50% of capital invested orredeemed. These fees, which are paid to the fund directly, not to TAS or other vendors supplying services to the fund, aredesigned, in part, to protect non-transacting members from bearing the transaction costs, including market impact, that may
TIFF MULTI-ASSET FUND / NOTES TO FINANCIAL STATEMENTS (UNAUDITED) JUNE 30, 2019
MULTI-A
SSET
52
arise from a transacting member’s purchases, exchanges, and redemptions of MAF shares. They are also designed toencourage investment only by members with a long-term investment horizon. Further, they are designed to discourage markettiming or other inappropriate short-term trading by members. The entry and exit fees are assessed irrespective of the length oftime a member’s shares are held. These fees are deducted from the amount invested or redeemed; they cannot be paidseparately. Entry and exit fees may be waived at TAS’s discretion when the purchase or redemption will not result in significanttransaction costs for the fund (e.g., for transactions involving in-kind purchases and redemptions). Such fees are retained bythe fund and included in proceeds from shares sold or deducted from distributions for redemptions.
Members of the fund have the ability to elect a systematic withdrawal plan option and can redeem up to 6% of the value oftheir account each fiscal year without paying the 0.50% exit fee normally assessed on redemptions, subject to certainconditions. Members that elect to take this systematic withdrawal option enhancement will be required to reinvest theirquarterly dividends and distributions.
11. Concentration of Risks
MAF may engage in transactions with counterparties, including but not limited to repurchase and reverse repurchaseagreements, forward contracts, futures and options, and total return, credit default, interest rate, and currency swaps. Thefund may be subject to various delays and risks of loss if the counterparty becomes insolvent or is otherwise unable to meet itsobligations.
The fund engages multiple external money managers, each of which manages a portion of the fund’s assets. A multi-managerfund entails the risk, among others, that the advisor may not be able to (1) identify and retain money managers who achievesuperior investment returns relative to similar investments; (2) combine money managers in the fund such that theirinvestment styles are complementary; or (3) allocate cash among the money managers to enhance returns and reducevolatility or risk of loss relative to a fund with a single manager.
The fund invests in private investment funds that entail liquidity risk to the extent they are difficult to sell or convert to cashquickly at favorable prices.
The fund invests in fixed income securities issued by banks and other financial companies, the market values of which maychange in response to interest rate fluctuations. Although the fund generally maintains a diversified portfolio, the ability of theissuers of the fund’s portfolio securities to meet their obligations may be affected by changing business and economicconditions in a specific industry, state, or region.
The fund invests in US Government securities. Because of the rising US Government debt burden, it is possible that the USGovernment may not be able to meet its financial obligations or that securities issued or backed by the US Government mayexperience credit downgrades. Such a credit event may adversely affect the financial markets.
The fund invests in securities of foreign issuers in various countries. These investments may involve certain considerations andrisks not typically associated with investments in the US, a result of, among other factors, the possibility of future political andeconomic developments and the level of governmental supervision and regulation of securities markets in the respectivecountries.
The fund invests in small capitalization stocks. These investments may entail different risks than larger capitalizations stocks,including potentially lesser degrees of liquidity.
The fund may engage in short sales in which it sells a security it does not own. To complete such a transaction, the fund mustborrow or otherwise obtain the security to make delivery to the buyer. The fund then is obligated to replace the borrowedsecurity by purchasing the security at the market price at the time of replacement. The price at such time may be more or lessthan the price at which the security was sold by the fund. The fund’s investment performance will suffer if a security that it hassold short appreciates in value.
12. Indemnifications
In the normal course of business, the fund enters into contracts that provide general indemnifications. The fund’s maximumexposure under these arrangements is dependent on future claims that may be made against the fund and, therefore, cannotbe established; however, based on experience, the risk of loss from such claims is considered remote.
13. Subsequent Events
Management has evaluated the possibility of subsequent events and has determined that there are no material events thatwould require disclosure.
TIFF MULTI-ASSET FUND / NOTES TO FINANCIAL STATEMENTS (UNAUDITED) JUNE 30, 2019
MULTI-A
SSET
53

ADDITIONAL INFORMATION (UNAUDITED)
Proxy Voting Policy and Voting Record
A description of the policies and procedures that TIP uses to determine how to vote proxies relating to portfolio securities isavailable at https://www.tiff.org/mutualfunds/prospectusdisclosures/proxy.aspx and without charge, upon request, by calling800-984-0084. This information is also available on the website of the US Securities and Exchange Commission (‘‘SEC’’) athttp://www.sec.gov. Information regarding how the funds voted proxies relating to portfolio securities during the most recent12-month year ended June 30 is also available on the websites noted above and without charge, upon request, by calling800-984-0084.
Quarterly Reporting
TIP files its complete schedules of portfolio holdings with the SEC for the first and third quarters of each fiscal year onForm N-PORT. TIP’s Form N-PORT report is available on the website of the SEC at http://www.sec.gov.
TIFF MULTI-ASSET FUND JUNE 30, 2019
MULTI-A
SSET
54

APPROVAL OF MONEY MANAGER AGREEMENTS (UNAUDITED)
Approval of Amended Money Manager Agreement
During an in-person meeting held on March 20, 2019 (the ‘‘March Meeting’’), the board of trustees of TIFF Investment Program(‘‘TIP’’), all of whom are not ‘‘interested persons’’ of TIP (the ‘‘board’’ or ‘‘trustees’’), as that term is defined in the InvestmentCompany Act of 1940, as amended (the ‘‘1940 Act’’), evaluated and approved the amendment to the money manageragreement to amend and restate the fee schedule with Mission Value Partners, LLC (‘‘Mission Value’’), a money managermanaging assets on behalf of TIFF Multi-Asset Fund (‘‘Multi-Asset Fund’’ or ‘‘MAF’’).
Consideration of the Amendment to the Money Manager Agreement to Amend and Restate the Fee Schedule withMission Value
During the March Meeting, the board evaluated and approved the amendment to the money manager agreement withMission Value for Multi-Asset Fund (the ‘‘Amendment’’) in order to amend and restate the fee schedule. In considering theAmendment at the March Meeting, the board took into account information it had received in connection with its annualreview of TIP’s investment advisory and money manager agreements and fees on June 12-13, 2018 (the ‘‘Annual Review’’),including information with respect to the money manager agreement with Mission Value. The board noted that, at that time, ithad approved the continuance of the money manager agreement between TIP, on behalf of Multi-Asset Fund, and MissionValue for another one-year term commencing July 1, 2018.
In connection with the Annual Review, the board had requested and considered a wide range of information fromTIFF Advisory Services, Inc. (‘‘TAS’’), the advisor to Multi-Asset Fund, and Mission Value of the type it regularly considers whendetermining whether to continue Multi-Asset Fund’s money manager agreements as in effect from year to year. In approvingthe Amendment at the March Meeting, the board considered the same factors and information that it considered in approvingthe continuance of the money manager agreement with Mission Value at the Annual Review, as well as such other informationas the board considered appropriate. During the Annual Review, the board considered information regarding Mission Value’spersonnel and services, investment mandate, investment strategies and philosophies, portfolio management, performance,and fees and expenses. Information about Mission Value’s brokerage practices was also provided, including allocationmethodologies, best execution policies, commission rates, and soft dollar program, as applicable. In addition, the boardconsidered information with respect to the compliance, risk management, and administration of Mission Value, including, butnot limited to, its code of ethics and business continuity procedures, as well as information concerning any material violationsof such compliance programs, the background of the individual serving as the chief compliance officer, and disclosure aboutregulatory examinations or other inquiries and litigation proceedings affecting Mission Value.
The board noted that the purpose of the Amendment was to amend and restate the fee schedule included in the currentmoney manager agreement with Mission Value for Multi-Asset Fund, and that otherwise the terms of Mission Value’s currentmoney manager agreement remained unchanged since its review and approval as part of the Annual Review. The board alsonoted that TAS recommended approval of the Amendment, which revised both the asset-based fee component and theperformance fee component of the fee schedule with the goal and expectation of lowering fees in most circumstances. Theboard noted that under the Amendment the monthly asset-based fee rate would decrease as compared to the rate currentlypaid to Mission Value by MAF, and that the calculation of the performance fee would be simplified, which should reduce theoverall fees paid to Mission Value, although there are some situations, particularly if inflation (as captured by the ConsumerPrice Index) increases above current levels and Mission Value’s absolute performance is high, in which the fee that MAF paysto Mission Value would be higher under the revised fee schedule included in the Amendment. In this regard the boardconsidered the materials provided by TAS discussing the changes included in the Amendment and their potential impact,including their impact to fees over the life of the agreement and, in particular, noting those potential situations where the feespaid to Mission Value would be higher than under the current money manager agreement. The board also noted that the TASmaterials included confirmation from Mission Value that the change to the fee schedule would not result in any changes to thenature, quality, or extent of investment advisory services to be provided to Multi-Asset Fund by Mission Value.
At the March Meeting, the board also noted that in connection with the Annual Review, the board (1) considered amemorandum from its independent counsel setting forth the board’s fiduciary duties and responsibilities under the 1940 Actand applicable state law and the factors the board should consider in its evaluation of a money manager agreement; and(2) reviewed Mission Value’s responses to a questionnaire prepared by the trustees’ independent counsel requesting infor-mation necessary for the trustees’ evaluation of the money manager agreement with Mission Value.
TIFF MULTI-ASSET FUND JUNE 30, 2019
MULTI-A
SSET
55

The board noted the information received at regular meetings throughout the year related to the services rendered by MissionValue concerning the management of Multi-Asset Fund’s portfolio. The board’s evaluation of the services provided by MissionValue took into account the board’s knowledge and familiarity gained as board members regarding the scope and quality ofMission Value’s investment management capabilities. The board concluded that, overall, it was satisfied with the nature,quality, and extent of the services currently being provided, and expected to be provided, by Mission Value. Consistent withthe approach taken by the board at the Annual Review, (1) the board did not specifically consider the profitability or expectedprofitability of Mission Value resulting from its relationship with Multi-Asset Fund because Mission Value is not affiliated withTAS or TIP, except by virtue of serving as a money manager to Multi-Asset Fund, and the fees to be paid to Mission Value werenegotiated on an arm’s-length basis in a competitive marketplace, and (2) the board noted that the Amendment with MissionValue included breakpoints that would enable Multi-Asset Fund to benefit from economies of scale, and also included a perfor-mance fee which aligned Mission Value’s interests with those of Multi-Asset Fund.
The board based its evaluation on the material factors presented to it at theMarchMeeting and at the Annual Review anddiscussed above, including: (1) the terms of the Amendment; (2) the reasonableness of the money manager’s fees in light of thenature and quality of the services expected to be provided and any additional benefits to be received byMission Value inconnection with providing services to Multi-Asset Fund in the future; (3) the nature, quality, and extent of the services expected tobe performed byMission Value; (4) the overall organization, skills, and experience of Mission Value in managing the existingportfolio for Multi-Asset Fund; and (5) the contribution of Mission Value towards the overall performance of Multi-Asset Fund.
In arriving at its decision to approve the Amendment, the board did not single out any one factor or group of factors as beingmore important than the other factors, but considered all of these factors together with a view toward future long-termconsiderations. After carefully considering the information summarized above and all factors deemed to be relevant, the boardunanimously voted to approve the Amendment. Prior to a vote being taken, the board met separately in executive session todiscuss the appropriateness of the Amendment and other considerations.
In their deliberations with respect to these matters, the trustees were advised by their independent legal counsel. The trusteesweighed the foregoing matters in light of the advice given to them by their independent legal counsel as to the law applicable to theconsideration of investment advisory contracts. The trustees concluded that the Amendment was reasonable, fair, and in the bestinterests of Multi-Asset Fund and its members, and that the fees provided in the agreement were fair and reasonable. In theboard’s view, approving the Amendment was desirable and in the best interests of Multi-Asset Fund and its members.
* * *Approval of the Advisory Agreements and Money Manager Agreements
During an in-person meeting held on June 10 -11, 2019 (the ‘‘June Meeting’’), the board of trustees of TIFF Investment Program(‘‘TIP’’), all of whom are not ‘‘interested persons’’ of TIP (the ‘‘Board’’ or ‘‘trustees’’), as that term is defined in the InvestmentCompany Act of 1940, as amended (the ‘‘1940 Act’’), conducted its annual review (the ‘‘Annual Review’’) of the investmentadvisory agreements between each of the TIP funds and TIFF Advisory Services, Inc. (‘‘TAS’’) (‘‘Investment Advisory Agree-ments’’), the investment advisor to TIFF Multi-Asset Fund (‘‘Multi-Asset Fund’’ or ‘‘MAF’’) and TIFF Short-Term Fund(‘‘Short-Term Fund’’), as well as the money manager agreements between Multi-Asset Fund and its money managers (assub-advisors) (‘‘Money Manager Agreements’’)1. The Investment Advisory Agreements and the Money Manager Agreementsare collectively referred to herein as ‘‘Advisory Agreements,’’ and Multi-Asset Fund and Short-Term Fund may be referred toindividually as a ‘‘Fund’’ or collectively as the ‘‘Funds.’’
Consideration of the Advisory Agreements at the Annual Review
The Board requested and received information from TAS and the money managers in advance of the June Meeting, which thetrustees reviewed separately in executive sessions with their independent legal counsel at the June Meeting. The materialsprovided included information regarding personnel and services, investment process and strategies, portfolio management,fees and expenses, performance, and, with respect to TAS, its profitability and process to select, monitor and oversee themoney managers. Information about brokerage practices was also supplied, including allocation methodologies, bestexecution, commission rates, and soft dollar arrangements. Information with respect to compliance, administration, and riskmanagement was supplied, such as information on TAS’s and the money managers’ compliance programs, including codes ofethics and business continuity procedures, as well as information concerning any material violations of such programs, chiefcompliance officer backgrounds, disclosure about regulatory examinations or other inquiries, and litigation proceedingsaffecting TAS or the money managers.1 The money managers that the Board considered for renewal are: AJO, LP; Amundi Pioneer Institutional Asset Management, Inc.; AQR
Capital Management, LLC, Fundsmith, LLP; Green Court Capital Management Limited; Hosking Partners LLP; Kopernik Global Investors,LLC; Lansdowne Partners (UK) LLP; Mission Value Partners, LLC; and TB Alternative Assets Ltd. (Trustbridge).
TIFF MULTI-ASSET FUND JUNE 30, 2019
MULTI-A
SSET
56
In addition, the Board considered the following: (1) a memorandum from the Board’s independent legal counsel setting forththe Board’s fiduciary duties and responsibilities under the 1940 Act and applicable state law and the factors the Board shouldconsider in its evaluation of the Advisory Agreements; (2) responses submitted by TAS and each money manager to question-naires prepared by the Board’s independent legal counsel requesting information necessary for the trustees’ evaluation of theAdvisory Agreements; (3) a report prepared by Broadridge Financial Solutions, Inc. (‘‘Broadridge’’), an independent provider ofinvestment company data, comparing the performance of each Fund to the performance of its applicable peer groups, andcomparing each Fund’s advisory fees and total expenses to those of its respective peer groups; (4) additional information fromTAS regarding the fees charged by TAS to each Fund and to certain other private funds managed by TAS; (5) money managerprofiles detailing MAF assets under management, effective fee rates and fees paid to each money manager in 2018, and anadvisor profile detailing similar information for TAS; (6) a report of the ten brokers receiving the highest aggregate brokeragecommissions by manager for the year ended December 31, 2018; (7) certain financial information about TAS, including itsaudited financial statements for the year ended December 31, 2018; and (8) the direct and indirect benefits that accrue to TASand its affiliates, and to the money managers, from their relationships with the Funds, which include fees paid to TAS by theFunds for TAS to perform certain administrative and other services for the Funds.
While attention was given to all information furnished, the following discusses the primary factors relevant to the Board’sdecisions. In each case, the Board concluded that the Funds’ performance was acceptable and that the Funds’ advisory feesand total expenses were reasonable in light of the quality and nature of services provided.
Nature, Extent, and Quality of Services
The Board considered a number of factors in evaluating TAS and the money managers in connection with the Annual Review.The Board noted that it receives information at regular meetings throughout the year related to the services rendered by TASand the money managers, as well as the Funds’ performance, expenses, and compliance information. It also noted that itreceives information between regular meetings as the need arises. The Board’s evaluation of the services provided by TAS andthe money managers took into account the trustees’ knowledge and familiarity gained as Board members, including the scopeand quality of TAS’s investment management capabilities in selecting money managers, allocating Fund assets across moneymanagers and asset classes, managing certain asset types in-house (e.g., Treasuries, futures contracts, swaps, and other instru-ments), and its compliance responsibilities.
The Board also considered each money manager’s skills and experience in managing the underlying portfolios given theamount of assets and particular universe of asset types available to the manager, its trading acumen, its performancetendencies in various market cycles, and its process for risk monitoring and management. The Board considered reports fromTAS regarding the operations of certain money managers, the performance and investment strategies of certain moneymanagers in light of current market conditions, as well as the role that each money manager plays in Multi-Asset Fund’sportfolio. The Board concluded that, overall, it was satisfied with the nature, extent, and quality of the services provided underthe Advisory Agreements by TAS and each of the money managers.
Profitability
In addition, the Board considered the profitability of TAS as the investment advisor and the likelihood that TAS would remainfinancially viable moving forward. The Board did not specifically consider the profitability of each money manager resultingfrom its relationship with Multi-Asset Fund because none of the money managers is affiliated with TAS or Multi-Asset Fundexcept by virtue of serving as a money manager, and the fees paid to each money manager by TIP were negotiated on anarm’s-length basis in a competitive marketplace.
TIFF Multi-Asset Fund Performance, Fees, and Expenses
Multi-Asset Fund operates on a ‘‘multi-manager’’ basis, which means that its assets are divided into multiple segments andthose segments are managed by different investment management firms as money managers to such Fund. In addition, TASmanages a portion of Multi-Asset Fund’s assets directly and is also responsible for determining the appropriate manner inwhich to allocate assets among money managers. There is no pre-specified target allocation of assets to any particular moneymanager. Each money manager manages one or more segments of Multi-Asset Fund pursuant to a money manager agreementbetween the money manager and TIP, on behalf of Multi-Asset Fund. Multi-Asset Fund also invests a portion of its assets inother investment funds (which are sometimes referred to as ‘‘underlying funds’’ or ‘‘acquired funds’’), such as exchange-traded funds, open-end mutual funds, and private investment funds, such as hedge funds. As an investor in an acquired fund,Multi-Asset Fund will bear its ratable share of expenses, including advisory and administration fees and other fees, of theacquired fund. Such fees and expenses are referred to as ‘‘underlying fund expenses’’ and represent the approximate fees andexpenses indirectly incurred by Multi-Asset Fund as a result of its investments in acquired funds.
TIFF MULTI-ASSET FUND JUNE 30, 2019
MULTI-A
SSET
57

Money Managers Under Consideration and Performance Benchmarks Reviewed:
AJO, LPS&P 500 Index (US Large Cap mandate)MSCI Emerging Markets Small Cap Index (Emerging Markets Small Cap mandate)
Amundi Pioneer Institutional Asset Management, Inc.Bloomberg Barclays US Government Inflation-Linked Bond Index (US Treasury obligations, including TIPS, mandate)Bloomberg Barclays Nominal US Treasury Index (Laddered US Treasury securities mandate)
AQR Capital ManagementRussell 1000 (Domestic mandate)MSCI EAFE Index (EAFE mandate)
Fundsmith, LLPMSCI World Index
Green Court Capital Management LimitedCSI 300 Index
Hosking Partners LLP50% MSCI All Country World Index (net dividends reinvested) and 50% MSCI All Country World Index (gross dividendsreinvested)
Kopernik Global Investors, LLCMSCI All Country World Index
Lansdowne Partners (UK) LLPMSCI World Index
Mission Value Partners, LLCUS CPI Urban Consumers Index plus a specified spread70% MSCI Japan Index/30% MSCI World Index
TB Alternative Assets Ltd.50% MSCI China Index/50% CSI 300 Index
The Board reviewed various comparative data provided to it in connection with its consideration of the renewal of the AdvisoryAgreements, including, among other information, a comparison of the Fund’s total return with three self-selected benchmarksand with that of other mutual funds deemed to be in its peer group and peer universe by Broadridge.
In particular, the Board reviewed Multi-Asset Fund’s performance against its benchmarks (the three self-selected benchmarkswere the MAF Constructed Index, based on the normal allocation to each asset class, the 65/35 Mix2, and the Consumer PriceIndex (‘‘CPI’’) + 5% per annum), and a Broadridge peer universe. The Broadridge peer universe consisted of Multi-Asset Fundand all retail and institutional flexible portfolio funds as classified by Broadridge (the ‘‘Broadridge MAF peer universe’’). TheBoard considered TAS’s implementation of Multi-Asset Fund’s investment strategy across multiple asset classes and moneymanagers. Multi-Asset Fund’s returns lagged the MAF Constructed Index for the one-, three-, and five-year periods endedMarch 31, 2019, and exceeded the MAF Constructed Index for the ten-year period ended March 31, 2019. Multi-Asset Fund’sreturns lagged the 65/35 Mix for the one-, three-, five-, ten-year periods ended March 31, 2019. Multi-Asset Fund’s returnsexceeded the CPI + 5% benchmark for the ten-year period and lagged the CPI + 5% benchmark for the one-, three-, andfive-year periods ended March 31, 2019. Multi-Asset Fund’s returns exceeded the average of the Broadridge MAF peeruniverse for the three-, five- and ten-year periods ended March 31, 2019, but lagged this average for the one-year periodended March 31, 2019.
2 The 65/35 Mix is comprised of 65% MSCI All Country World Index and 35% Barclays US Aggregate Bond Index.
TIFF MULTI-ASSET FUND JUNE 30, 2019
MULTI-A
SSET
58

The Board also reviewed the fees and expenses of Multi-Asset Fund against an expense peer group provided by Broadridge.This expense peer group (the ‘‘MAF expense peer group’’) consisted of Multi-Asset Fund and ten other institutional flexibleportfolio funds as classified by Broadridge. The actual advisory fees of Multi-Asset Fund were below the median advisory feesof the MAF expense peer group for the latest fiscal year. The trustees noted that MAF makes substantial use of performance-based fee arrangements with the money managers, which can lead to higher advisory fees when money managers performwell. The total expenses of Multi-Asset Fund, including the underlying fund expenses, exceeded the median of the MAFexpense peer group for the latest fiscal year, but were below the median excluding underlying fund expenses. The Board notedthat, because the acquired funds in which Multi-Asset Fund invests typically use performance-based fee arrangements, theunderlying fund expenses will tend to be higher when the acquired funds perform well. Further, most of the other funds in theMAF expense peer group do not invest in acquired funds and, therefore, do not incur underlying fund expenses. The Boardtook into consideration management’s discussion of the acquired funds’ contributions to MAF’s overall performance and therole such funds play in MAF’s portfolio, as well as management’s view that these factors offset the higher fees and expensesresulting from such investments.
The Board reviewed and discussed TAS’s fee schedule and the fee schedules of the money managers, noting that each of themoney managers had an asset-based fee arrangement, a performance-based fee arrangement, or a fee arrangement whichincluded a combination of both an asset-based fee and a performance-based fee. The Board assessed the extent to whichMulti-Asset Fund enjoyed economies of scale resulting from the fee structures provided by each of the money managers,noting that certain money managers’ asset-based fee schedules did not include breakpoints, but their fee schedules wereconsistent with the fee schedules such managers had in place with, or offered to, other clients having substantially similarinvestment mandates. Further, with respect to those money managers that received performance-based fees, the Board feltthat such fee schedules appropriately aligned the money managers’ interests with those of Multi-Asset Fund’s members. Aspart of its analysis, the Board also considered the fees charged by TAS to MAF and certain other private funds managed by TAS.
Additionally, the Board considered the direct and indirect benefits that accrue to certain money managers as a result of theiruse of brokerage commissions paid by MAF, with respect to portfolio transactions undertaken by such money managers, toobtain research products and services. In this regard, the Board also considered that the amended money manager agreementwith Lansdowne Partners (UK) LLP (‘‘Lansdowne’’) permits MAF to directly compensate Lansdowne for third-party researchcosts.
TIFF Short-Term Fund Performance, Fees, and Expenses
The Board reviewed various comparative data provided to it in connection with its consideration of the renewal of theInvestment Advisory Agreement with TAS, including, among other information, a comparison of the Fund’s total return with aself-selected benchmark and with that of other mutual funds deemed to be in its peer group and peer universe by Broadridge.
In particular, the Board reviewed Short-Term Fund’s performance against its self-selected benchmark (BofA Merrill Lynch US6-Month Treasury Bill Index (the ‘‘Index’’)), and a Broadridge peer universe. The Broadridge peer universe consisted ofShort-Term Fund and all retail and institutional ultra-short obligation funds as classified by Broadridge (the ‘‘Broadridge STFpeer universe’’). The Board considered TAS’s internal management of Short-Term Fund since 2004. It noted that Short-TermFund typically invests substantially all of its assets in US Treasury bills and normally maintains a duration of withinthree months of the duration of the Index. In contrast, the Broadridge STF peer universe used for comparison purposes, whichclosely matches Short-Term Fund in certain respects, includes funds that do not limit their investments to US Treasury bills andmay maintain portfolio dollar-weighted average maturities up to 365 days. Short-Term Fund produced modestly positive totalreturns for the one-, three-, five- and ten-year periods ended March 31, 2019 due to the extremely low yields on US Treasurybills resulting from Federal Reserve Board policy and Short-Term Fund’s operational costs, including the cost of portfolio rebal-ancing. Short-Term Fund underperformed the Index for the one-, three-, five- and ten-year periods ended March 31, 2019. TheBoard noted that the Index does not reflect any fees or expenses and has an average maturity of six months compared toShort-Term Fund’s average maturity of about three months. Similarly, Short-Term Fund’s returns lagged the average of theBroadridge STF peer universe for the one-, three-, five-, and ten-year periods ended March 31, 2019, for the reasons statedabove. The Board considered these results in light of Short-Term Fund’s investment strategy and the purposes for whichShort-Term Fund members use the Fund.
The Board also reviewed the fees and expenses of Short-Term Fund against an expense peer group provided by Broadridge.This expense peer group (the ‘‘STF expense peer group’’) consisted of Short-Term Fund and twelve other institutional ultra-short obligation funds as classified by Broadridge. The Board noted that the actual advisory fee and total expenses ofShort-Term Fund were well below the median of the STF expense peer group. The Board also noted that TAS’s fee scheduleincluded breakpoints that could enable Short-Term Fund to benefit from economies of scale should the Fund’s assets grow.
TIFF MULTI-ASSET FUND JUNE 30, 2019
MULTI-A
SSET
59

Results of Review of Advisory Agreements
After considering responses from TAS and each money manager to the questionnaire prepared on behalf of the Board andfurther discussion, the Board voted at the June Meeting to approve the continuance of the Investment Advisory Agreementsfor another year with respect to both Multi-Asset Fund and Short-Term Fund and to continue the Money Manager Agreementsfor another year with respect to Multi-Asset Fund. The Board based its evaluation on the material factors presented to it at theJune Meeting and discussed below, including: (1) the terms of the agreements; (2) the reasonableness of the advisory andmoney manager fees in light of the nature and quality of the advisory services provided and any additional benefits received byTAS or the money managers, as applicable, in connection with providing services to the Funds; (3) the nature, quality, andextent of the services performed by TAS and each of the money managers, as well as the cost to TAS of providing such services;(4) in the case of the Multi-Asset Fund, the contribution of each money manager toward the overall performance of the Fund;(5) the fees charged by TAS and each of the money managers; and (6) the overall organization and experience of TAS and eachof the money managers.
Prior to a vote being taken to approve the continuance of the Investment Advisory Agreements and theMoneyManager Agree-ments, the trustees met separately in executive session to discuss the appropriateness of the agreements and other considerations.In their deliberations with respect to these matters, the trustees were advised by their independent legal counsel. The trusteesweighed the foregoing matters in light of the advice given to them by their independent legal counsel as to the law applicable to thereview of investment advisory contracts. The trustees concluded that the Advisory Agreements were reasonable, fair, and in thebest interests of the Funds, and that the fees set forth in the agreements were fair and reasonable. In reaching its conclusion toapprove the continuance of the Investment Advisory Agreements and theMoneyManager Agreements for another year, the Boarddid not single out any one factor or group of factors as being more important than the other factors, but considered all of thesefactors together with a view toward past and future long-term considerations.
* * *
Approval of Money Manager Agreements
During an in-person meeting held on June 10-11, 2019 (the ‘‘June Meeting’’), the board of trustees of TIFF Investment Program(‘‘TIP’’), all of whom are not ‘‘interested persons’’ of TIP (the ‘‘board’’ or ‘‘trustees’’), as that term is defined in the InvestmentCompany Act of 1940, as amended (the ‘‘1940 Act’’), evaluated and approved a money manager agreement between TIP andNewGen Asset Management (‘‘NewGen’’) a new money manager proposed to manage assets on behalf of TIFF Multi-AssetFund (‘‘Multi-Asset Fund’’ or ‘‘MAF’’).
Approval of the Money Manager Agreement between TIP and NewGen
During the June Meeting, the board evaluated and approved the money manager agreement for Multi-Asset Fund with a newmoney manager, NewGen (the ‘‘NewGen Agreement’’). In this regard, the board requested and considereda wide range ofinformation from NewGen and TIFF Advisory Services, Inc. (‘‘TAS’’), the investment advisor to Multi-Asset Fund, in advance ofthe June Meeting, and at the June Meeting the trustees reviewed this information with TAS staff and separately in executivesession with the trustees’ independent legal counsel. Among other matters, the board considered information regardingNewGen’s personnel and services, investment strategies and philosophies and portfolio management, including the experienceof NewGen’s investment personnel. The board also considered NewGen’s potential portfolio holdings, fees and expenses, andinformation detailing the performance of NewGen’s investment strategy since its inception. The board noted that theproposed management fee for the investment strategy to be implemented by NewGen on behalf of Multi-Asset Fund includeda discounted management fee and a performance fee which aligned NewGen’s interests with those of Multi-Asset Fund. Infor-mation about NewGen’s proposed brokerage practices and best execution policies was also provided. In addition, the boardconsidered information with respect to the compliance and administration of NewGen, including, but not limited to, its code ofethics and business continuity procedures, as well as information concerning any material violations of such complianceprograms, the background of the individual serving as the chief compliance officer, and disclosure about regulatory examina-tions or other inquiries and litigation proceedings affecting NewGen.
The board also considered a memorandum from its independent counsel setting forth the board’s fiduciary duties andresponsibilities under the 1940 Act and applicable state law and the factors the board should consider in its evaluation of theNewGen Agreement. The board also reviewed NewGen’s responses to a questionnaire prepared by the trustees’ independentcounsel requesting information necessary for the trustees’ evaluation of the NewGen Agreement. In addition, during the JuneMeeting, TAS staff (1) reviewed the process undertaken and due diligence performed in assessing NewGen as a possible moneymanager for Multi-Asset Fund, and (2) responded to additional questions from the board regarding, among other things,
TIFF MULTI-ASSET FUND JUNE 30, 2019
MULTI-A
SSET
60

NewGen’s operating structure and compliance program, including information about NewGen’s operational and compliancestaffing and the level of resources dedicated to NewGen’s compliance functions.
The board also considered a number of additional factors in evaluating the NewGen Agreement: the advisory services NewGenwas expected to provide to MAF; the investment risks presented by the investment strategy that NewGen intended to employ;the potential benefits of including NewGen as a money manager to MAF; operational matters and additional costs related tothe implementation of NewGen’s investment strategies and related risks; and other information deemed relevant.
The board concluded that, overall, it was satisfied with the nature, extent, and quality of the services expected to be providedunder the NewGen Agreement. The board based its evaluation on the material factors presented to it at the June Meeting anddiscussed above, including: (1) the terms of the NewGen Agreement; (2) the reasonableness of the money manager’s fees inlight of the nature and quality of the services to be provided and any additional benefits to be received by NewGen inconnection with providing services to Multi-Asset Fund; (3) the nature, quality, and extent of the services expected to beperformed by NewGen; and (4) the nature and expected effects of adding NewGen as a money manager of Multi-Asset Fund.The board did not specifically consider the profitability of NewGen expected to result from its relationship with Multi-AssetFund because NewGen is not affiliated with TAS or TIP, except by virtue of serving as a money manager, and the fees to be paidto NewGen were negotiated on an arm’s-length basis in a competitive marketplace.
In arriving at its decision to approve the NewGen Agreement, the board did not single out any one factor or group of factors asbeing more important than the other factors, but considered all of these factors together. After carefully considering the infor-mation summarized above and all factors deemed to be relevant, the board unanimously voted to approve the NewGenAgreement. Prior to the vote being taken, the board met separately in executive session to discuss the appropriateness of theNewGen Agreement and other considerations.
In their deliberations with respect to these matters, the trustees were advised by their independent legal counsel. The trusteesweighed the foregoing matters in light of the advice given to them by their independent legal counsel as to the law applicableto the consideration of investment advisory contracts. The trustees concluded that the NewGen Agreement was reasonable,fair, and in the best interests of Multi-Asset Fund and its members, and that the fees provided in the NewGen Agreement werefair and reasonable. In the board’s view, approving the NewGen Agreement was desirable and in the best interests of Multi-Asset Fund and its members.
TIFF MULTI-ASSET FUND JUNE 30, 2019
MULTI-A
SSET
61

INDEX DESCRIPTIONS
Consumer Price Index is based on the Consumer Price Index-All Urban Consumers (CPI- U), a widely recognized measure of USinflation that represents changes in the prices paid by consumers for a representative basket of goods and services.
CSI 300 Index tracks 300 stocks traded in the Shanghai and Shenzhen stock exchanges.
MSCI All Country World Index tracks large-capitalization stocks worldwide.
The MSCI All Country World ex USA Index captures large and mid-cap representation across 22 of 23 Developed Marketscountries (excluding the US) and 26 Emerging Markets countries. With 2,205 constituents, the index covers approximately 85%of the global equity opportunity set outside the US.
MSCI China Index tracks large and mid-cap segments of the China equity universe across China H shares, B shares, red chips,P chips, and foreign listings and is comprised of 491 constituents.
MSCI EAFE Index tracks developed markets in Europe, Australia, and the Far East.
MSCI Emerging Markets Small Cap Index tracks small-capitalization companies whose market capitalization. Representsapproximately the bottom 14% of the market capitalization of companies in the global emerging markets.
MSCI Emerging Markets Index tracks the performance of the performance of large- and mid-cap securities in 26 EmergingMarkets.
The MSCI USA Momentum Index is based on MSCI USA Index, its parent index, which captures large and mid-cap stocks of theUS market. It reflects the performance of an equity momentum strategy by emphasizing stocks with high price momentum,while maintaining reasonably high trading liquidity, investment capacity and moderate index turnover.
The MSCI USA Index is designed to measure the performance of the large and mid cap segments of the US market. With 639constituents, the index covers approximately 85% of the free float-adjusted market capitalization in the US.
Russell 1000 Index tracks the largest 1,000 US companies.
S&P 500 Index (S&P 500 Total Return Index) includes 500 companies in leading industries of the US economy, capturing 75%coverage of US equities. The S&P 500 Index is maintained by the S&P Index Committee, based on published guidelinesgoverning additions to and removal from the index. Criteria for index additions include US companies, market capitalization inexcess of $4 billion, public float, financial viability, adequate liquidity and reasonable price, sector representation, andcompany type. Criteria for index removals include violating or no longer meeting one or more criteria for index inclusion.
S&P MidCap 400/Citigroup Growth Index tracks the performance of mid capitalization growth section of the US equity market.
TIFF MULTI-ASSET FUND JUNE 30, 2019
MULTI-A
SSET
62

INTERNET AVAILABILITY OF SHAREHOLDER REPORTS
Beginning on January 2, 2021, as permitted by regulations adopted by the U.S. Securities and Exchange Commission, papercopies of TIFF Short-Term Fund’s (the ‘‘Fund’’) annual and semi-annual shareholder reports will no longer be sent by mail,unless you specifically request paper copies of these reports from the Fund. Instead, these reports will be made available onthe Fund’s website, and you will be notified by e-mail each time a report is posted and provided with a website link to accessthe report.
If you already elected to receive shareholder reports electronically, you will not be affected by this change and you need nottake any action. You may elect to receive shareholder reports and other communications from the Fund electronically at anytime by calling TIFF Member Services at 800-984-0084 or by sending an e-mail request to [email protected].
You may elect to receive all future shareholder reports in paper free of charge. You can inform the Fund that you wish tocontinue receiving paper copies of your shareholder reports by calling TIFF Member Services at 800-984-0084 or by sending ane-mail request to [email protected]. Your election to receive reports in paper will apply to all TIP funds that you hold.
FUND EXPENSES (UNAUDITED)
As a shareholder of a fund, you incur two types of costs: (1) transaction costs and (2) ongoing costs, including managementfees and other fund expenses. This example is intended to help you understand your ongoing costs (in dollars) of investing inthe fund and to compare these costs with the ongoing costs of investing in other mutual funds.
The example is based on an investment of $1,000 invested at the beginning of the period and held for the entire period fromJanuary 1, 2019 to June 30, 2019.
Actual ExpensesThe first line of the table below provides information about actual account values and actual expenses. You may use theinformation in this line, together with the amount you invested, to estimate the expenses that you paid over the period. Simplydivide your account value by $1,000 (for example, an $8,600 account value divided by $1,000 = 8.6), then multiply the result bythe number in the first line under the heading entitled ‘‘Expenses Paid During the Period’’ to estimate the expenses you paidon your account during this period.
Hypothetical Example for Comparison PurposesThe second line of the table below provides information about hypothetical account values and hypothetical expenses basedon the fund’s actual expense ratio and an assumed rate of return of 5% per year before expenses, which is not the fund’sactual return. The hypothetical account values and expenses may not be used to estimate the actual ending account balance orexpenses you paid for the period. You may use this information to compare the ongoing costs of investing in the fund andother funds. To do so, compare this 5% hypothetical example with the 5% hypothetical examples that appear in theshareholder reports of the other funds.
Please note that the expenses shown in the table are meant to highlight your ongoing costs only and do not reflect anytransactional costs. Therefore, the second line of the table is useful in comparing ongoing costs only, and will not help youdetermine the relative total costs of owning different funds.
BeginningAccount Value
1/1/19
EndingAccount Value
06/30/19
Expenses PaidDuring the Period*1/1/19 − 6/30/19
1) Actual $1,000.00 $1,013.10 $1.252) Hypothetical $1,000.00 $1,023.55 $1.25* Expenses are equal to the fund’s annualized expense ratio of 0.25% (calculated over a six-month period, which may differ from the
fund’s actual expense ratio for the full year), multiplied by the average account value over the period, multiplied by 181/365 (to reflectthe one-half year period).
SUMMARY SCHEDULE OF INVESTMENTS (UNAUDITED)
US Treasury Bills 71.7%US Treasury Bonds/Notes 27.5%Repurchase Agreement 3.7%Total Investments 102.9%Liabilities in Excess of Other Assets (2.9)%Net Assets 100.0%
TIFF SHORT-TERM FUND JUNE 30, 2019
SHORT-T
ERM
63

FINANCIAL HIGHLIGHTS
Six MonthsEnded
June 30, 2019(Unaudited)
Year EndedDecember 31,
2018
Year EndedDecember 31,
2017
Year EndedDecember 31,
2016
Year EndedDecember 31,
2015
Year EndedDecember 31,
2014
For a share outstandingthroughout each period
Net asset value, beginning ofperiod $ 9.86 $ 9.86 $ 9.86 $ 9.86 $ 9.87 $ 9.89
Income (loss) frominvestment operations
Net investment income (loss) 0.12 0.17 0.06 0.01 (0.01) (0.03)Net realized and unrealizedgain on investments 0.01 0.00 (a) 0.00 (a) 0.00 (a) 0.00 (a) 0.01
Total from investmentoperations 0.13 0.17 0.06 0.01 (0.01) (0.02)
Less distributions fromNet investment income (0.12) (0.17) (0.06) (0.01) — —Total distributions (0.12) (0.17) (0.06) (0.01) — —Net asset value, end ofperiod $ 9.87 $ 9.86 $ 9.86 $ 9.86 $ 9.86 $ 9.87
Total return (b) 1.31% (c) 1.74% 0.64% 0.13% (0.10)% (0.20)%Ratios/supplemental dataNet assets, end of period(000s) $65,162 $80,341 $84,612 $83,729 $97,168 $104,383
Ratio of expenses to averagenet assets 0.25% (d) 0.23% 0.23% 0.24% 0.22% 0.35%
Ratio of net investmentincome (loss) to averagenet assets 2.35% (d) 1.69% 0.63% 0.15% (0.09)% (0.28)%
Portfolio turnover (e) –% –% –% –% –% –%
(a) Rounds to less than $0.01.(b) Total return assumes dividend reinvestment.(c) Not annualized.(d) Annualized.(e) Because the fund holds primarily securities with maturities at the time of acquisition of one year or less, and such securities are
excluded by definition from the calculation of portfolio turnover, the fund’s portfolio turnover rate was 0% of the average value of itsportfolio.
TIFF SHORT-TERM FUND JUNE 30, 2019
SHORT-T
ERM
See accompanying Notes to Financial Statements.64

SCHEDULE OF INVESTMENTS (UNAUDITED)*
PrincipalAmount Value
Investments— 102.9% of net assets
Short-Term Investments— 102.9%
Repurchase Agreement— 3.7%Fixed Income Clearing Corp. issued on06/28/19 (proceeds at maturity$2,420,643) (collateralized by USTreasury Notes, due 03/31/21 witha total par value of $2,440,000 anda total market value of $2,472,101)0.500%, 07/01/19(Cost $2,420,542) $ 2,420,542 $2,420,542
US Treasury Bills (a) — 71.7%U.S. Treasury Bill, 2.547%, due on07/05/19 10,000,000 9,997,244
U.S. Treasury Bill, 2.422%, due on07/09/19 4,000,000 3,997,885
U.S. Treasury Bill, 2.294%, due on08/06/19 1,000,000 997,745
U.S. Treasury Bill, 2.146%, due on08/27/19 (b) 2,000,000 1,993,437
PrincipalAmount Value
U.S. Treasury Bill, 2.643%, due on09/12/19 $13,000,000 $12,945,630
U.S. Treasury Bill, 2.552%, due on02/27/20 17,000,000 16,778,364
Total US Treasury Bills(Cost $46,640,341) 46,710,305
US Treasury Bonds/Notes— 27.5%U.S. Treasury Note, 1.000%, 10/15/19 6,000,000 5,980,781U.S. Treasury Note, 1.000%, 11/15/19 6,000,000 5,974,688U.S. Treasury Note, 1.000%, 11/30/19 6,000,000 5,972,109
Total US Treasury Bonds/Notes(Cost $17,891,208) 17,927,578
Total Short-Term Investments(Cost $66,952,091) 67,058,425
Total Investments — 102.9%(Cost $66,952,091) $67,058,425
Liabilities in Excess of Other Assets — (2.9)% (1,896,029)
Net Assets — 100.0% $65,162,396
* Approximately 3% of the fund’s total investments are maintained to cover ‘‘senior securities transactions’’ which may include, but arenot limited to TBAs. These securities are marked-to-market daily and reviewed against the value of the fund’s ‘‘senior securities’’holdings to maintain proper coverage for the transactions.
(a) Treasury bills do not pay interest, but rather are purchased at a discount and mature at the stated principal amount.(b) Security is valued in good faith under procedures established by the board of trustees. The aggregate amount of securities fair valued
amounts to $1,993,437, which represents 3.1% of the fund’s net assets.
TIFF SHORT-TERM FUND JUNE 30, 2019
SHORT-T
ERM
See accompanying Notes to Financial Statements.65

STATEMENT OF ASSETS AND LIABILITIES (UNAUDITED)
June 30, 2019
Assets
Investments in securities, at value (cost: $64,531,549) $64,637,883
Repurchase agreements (cost: $2,420,542) 2,420,542
Total investments (cost: $66,952,091) 67,058,425
Receivables:
Investment securities sold 999,946
Interest 87,733
Prepaid expenses 7,365
Total Assets 68,153,469
Liabilities
Payables:
Investment securities purchased 1,993,437
Capital stock redeemed 894,500
Fund administration and custody fees 55,868
Accrued professional fees 32,340
Distributions 10,611
Investment advisory and administrative fees 2,336
Chief Compliance Officer’s costs and Trustee’s fees 285
Accrued expenses and other liabilities 1,696
Total Liabilities 2,991,073
Net Assets $65,162,396
Shares Outstanding (unlimited authorized shares, par value $0.001) 6,601,027
Net Asset Value Per Share $ 9.87
Net Assets Consist of:
Capital stock $65,070,150
Total distributable earnings (loss) 92,246
Net Assets $65,162,396
TIFF SHORT-TERM FUND
SHORT-T
ERM
See accompanying Notes to Financial Statements.66

STATEMENT OF OPERATIONS (UNAUDITED)
Six Months EndedJune 30, 2019
Investment Income
Interest $ 974,406
Total Investment Income 974,406
Expenses
Fund administration and custody fees 30,911
Professional fees 24,617
Shareholder Registration fees 13,875
Investment advisory fees 11,265
Chief Compliance Officer’s costs and Trustee’s fees 3,764
Administrative fees 3,755
Miscellaneous fees and other 4,790
Total Expenses 92,977
Net Investment Income 881,429
Net Realized Gain from Investments 31,121
Net Change in Unrealized Appreciation on Investments 96,005
Net Realized and Unrealized Gain on Investments 127,126
Net Increase in Net Assets Resulting from Operations $1,008,555
TIFF SHORT-TERM FUND
SHORT-T
ERM
See accompanying Notes to Financial Statements.67

STATEMENTS OF CHANGES IN NET ASSETS
Six Months EndedJune 30, 2019(Unaudited)
Year EndedDecember 31, 2018
Increase (Decrease) in Net Assets From Operations
Net investment income $ 881,429 $ 1,395,913
Net realized gain (loss) from investments 31,121 (40,538)
Net change in unrealized appreciation on investments 96,005 26,022
Net Increase in Net Assets Resulting from Operations 1,008,555 1,381,397
Distributions
Distributions to shareholders (883,525) (1,386,422)
Decrease in Net Assets Resulting from Distributions (883,525) (1,386,422)
Capital Share Transactions
Proceeds from shares sold 31,639,148 100,495,407
Proceeds from distributions reinvested 791,921 1,257,658
Cost of shares redeemed (47,734,819) (106,018,603)
Net Decrease From Capital Share Transactions (15,303,750) (4,265,538)
Total Decrease in Net Assets (15,178,720) (4,270,563)
Net Assets
Beginning of period 80,341,116 84,611,679
End of period $ 65,162,396 $ 80,341,116
Capital Share Transactions (in shares)
Shares sold 3,204,984 10,191,037
Shares reinvested 80,305 127,660
Shares redeemed (4,834,762) (10,751,401)
Net Decrease (1,549,473) (432,704)
TIFF SHORT-TERM FUND
SHORT-T
ERM
See accompanying Notes to Financial Statements.68

1. Organization
TIFF Investment Program (‘‘TIP’’) is a no-load, open-end management investment company that seeks to improve the netinvestment returns of its members through two investment vehicles, each with its own investment objective and policies. TIPwas originally incorporated under Maryland law on December 23, 1993, and was reorganized, effective December 16, 2014, asa Delaware statutory trust. As of June 30, 2019, TIP consisted of two mutual funds, TIFF Multi-Asset Fund and TIFF Short-TermFund (‘‘STF’’ or the ‘‘fund’’), each of which is diversified, as defined in the Investment Company Act of 1940, as amended (the‘‘1940 Act’’). The schedule of investments and notes presented here relate only to STF.
Investment Objective
STF’s investment objective is to attain as high a rate of current income as is consistent with ensuring that the fund’s risk ofprincipal loss does not exceed that of a portfolio invested in six-month US Treasury bills.
2. Summary of Significant Accounting Policies
The fund operates as a diversified investment company and, accordingly, follows the investment company accounting andreporting guidance of the Financial Accounting Standards Board (‘‘FASB’’) Accounting Standards Codification Topic 946Financial Services — Investment Companies.
The preparation of financial statements in conformity with US generally accepted accounting principles (‘‘GAAP’’) requiresmanagement to make estimates and assumptions that affect the reported amounts of assets and liabilities, the reportedamounts of increases and decreases in net assets from operations during the reported period, and disclosure of contingentassets and liabilities at the date of the financial statements. Actual results could differ from these estimates.
Valuation of Investments
Fair value is defined as the price that the fund could reasonable expect to receive upon selling an asset or pay to transfer aliability in a timely transaction to an independent buyer in the principal or most advantageous market for the asset or liability,respectively. A three-tier fair value hierarchy is utilized to maximize the use of observable market data and minimize the use ofunobservable inputs and to establish classification of fair value measurements for disclosure purposes. Inputs refer broadly tothe assumptions that market participants would use in pricing the asset or liability, including assumptions about risk, forexample, the risk inherent in a particular valuation technique used to measure fair value and/or the risk inherent in the inputsto the valuation technique. Inputs may be observable or unobservable. Observable inputs are inputs that reflect theassumptions market participants would use in pricing the asset or liability developed based on market data obtained fromsources independent of the reporting entity. Unobservable inputs are inputs that reflect the reporting entity’s ownassumptions about the assumptions market participants would use in pricing the asset or liability developed based on the bestinformation available in the circumstances. The three-tier fair value hierarchy of inputs is summarized in the three broad levelslisted below.
Level 1— quoted prices in active markets for identical assets and liabilities
Level 2— other significant observable inputs (including quoted prices for similar assets and liabilities, interest rates,prepayment speeds, credit risk, etc.)
Level 3— significant unobservable inputs (including the fund’s own assumptions in determining the fair value of assetsand liabilities)
Short-term debt securities having a remaining maturity of less than 60 days are valued at amortized cost using straight-lineamortization, which approximates fair value, and short-term debt securities having a remaining maturity of greater than60 days are valued at their market value. Short-term debt securities are typically categorized as Level 2 in the fair valuehierarchy.
During the period ended June 30, 2019, all of the fund’s investments were valued using Level 2 inputs; therefore, there wereno transfers to or from Level 3 investments.
Investment Transactions and Investment Income
Securities transactions are recorded on the trade date (the date on which the buy or sell order is executed) for financialreporting purposes. Interest income and expenses are recorded on an accrual basis. The fund accretes discounts or amortizespremiums using the yield-to-maturity method on a daily basis.
TIFF SHORT-TERM FUND / NOTES TO FINANCIAL STATEMENTS (UNAUDITED) JUNE 30, 2019
SHORT-T
ERM
69

Income Taxes
There is no provision for federal income or excise tax since the fund has elected to be taxed as a regulated investmentcompany (‘‘RIC’’) and intends to comply with the requirements of Subchapter M of the Internal Revenue Code of 1986, asamended (the ‘‘Code’’), applicable to RICs and to distribute substantially all of its taxable income.
The fund evaluates tax positions taken or expected to be taken in the course of preparing the fund tax returns to determinewhether the tax positions are ‘‘more-likely-than-not’’ of being sustained by the applicable tax authorities. Tax positions notdeemed to meet the more-likely-than-not threshold are recorded as tax benefits or expenses in the current year. Managementhas analyzed the fund’s tax positions taken on federal income tax returns for all open tax years (tax years ended December 31,2015 − December 31, 2018), and has concluded that no provision for federal income tax is required in the fund’s financialstatements.
Expenses
Expenses directly attributable to STF are charged to that fund’s operations; expenses that are applicable to all TIP funds areallocated among them based on the relative average daily net assets of each TIP fund.
Dividends to Members
It is the policy of the fund to declare dividends, if any, from net investment income monthly and capital gains distributions atleast annually.
Dividends from net short-term capital gains and net long-term capital gains of the fund, if any, are normally declared and paidin December, but the fund may make distributions on a more frequent basis in accordance with the distribution requirementsof the Code. To the extent that a net realized capital gain could be reduced by a capital loss carryover, such gain will not bedistributed. Dividends and distributions are recorded on the ex-dividend date.
Net Asset Value
The net asset value per share is calculated on a daily basis by dividing the fund’s assets, less its liabilities, by the number ofoutstanding shares of the fund.
3. Investment Advisory and Other Agreements, and Other Transactions with Affiliates
TIP’s board of trustees (the ‘‘board’’) has approved an investment advisory agreement with TIFF Advisory Services, Inc. (‘‘TAS’’),an affiliate of TIP. The fund pays TAS a monthly fee calculated by applying the annual rates set forth below to the fund’saverage daily net assets for the month:
Assets
On the first $1 billion 0.03%On the next $1 billion 0.02%On the remainder (> $2 billion) 0.01%
Fees for such services paid to TAS by the fund are reflected as investment advisory fees on the Statement of Operations. As ofJune 30, 2019, $1,752 remained payable and are included in investment advisory and administrative fees on the Statement ofAssets and Liabilities.
TAS provides certain administrative services to TIP under a services agreement. For these services, the fund pays a monthly feecalculated by applying an annual rate of 0.01% to the fund’s average daily net assets for the month. Fees for such services paidto TAS by the fund are reflected as administrative fees on the Statement of Operations. As of June 30, 2019, $584 remainedpayable and is included in investment advisory and administrative fees on the Statement of Assets and Liabilities.
TIP has designated an employee of TAS as its Chief Compliance Officer. For these services provided to TIP, which include themonitoring of TIP’s compliance program pursuant to Rule 38a-1 under the 1940 Act, TIP reimburses TAS. STF pays a pro rataportion of such costs based on its share of TIP’s net assets. The costs for such services paid to TAS by the fund were $3,044 forthe period ended June 30, 2019 and are included in Chief Compliance Officer’s costs and Trustee’s fees on the Statement ofOperations. As of June 30, 2019, $25 was prepaid and is included as an offset in Chief Compliance Officer’s costs and Trustee’sfees on the Statement of Assets and Liabilities.
TIFF SHORT-TERM FUND / NOTES TO FINANCIAL STATEMENTS (UNAUDITED) JUNE 30, 2019
SHORT-T
ERM
70

TIP’s board, all of whom are considered ‘‘disinterested trustees’’ as defined in the 1940 Act, serve as volunteers and receive nofees or salary for their service as board members. The independent chair of the board received compensation of $720 from STFfor the period ended June 30, 2019 for service as independent chair. Fees paid for such services are included in ChiefCompliance Officer’s costs and Trustee’s fees on the Statement of Operations. As of June 30, 2019, $310 remained payable andare included in Chief Compliance Officer’s costs and Trustee’s fees on the Statement of Assets and Liabilities.
4. Fund Administration and Custody Agreement
Pursuant to a series of agreements, State Street Bank and Trust Company (‘‘State Street’’) earns a fee for providing core fundadministration, fund accounting, custody, and transfer agent services. Fees paid for non-core services rendered by State Streetinclude, but are not limited to, transactions entered into by the fund during the period, and out-of-pocket expenses. Fees forsuch services paid to State Street by the fund are reflected as fund administration and custody fees on the Statement ofOperations. As of June 30, 2019, $55,868 remained payable and reflected as fund administrative and custody fees onStatement of Assets and Liabilities.
5. Federal Tax Information
For federal income tax purposes, the cost of investments owned at June 30, 2019 has been estimated since the final tax
characteristic cannot be determined until fiscal year end. The cost of investments, the aggregate gross unrealized appreciation/(depreciation) and the net unrealized appreciation/(depreciation) on investment securities, at June 30, 2019 are as follows:
Gross UnrealizedAppreciation
Gross UnrealizedDepreciation
Net UnrealizedAppreciation Cost
$106,334 $— $106,334 $66,952,091
Dividends and distributions from net investment income and net realized capital gains are determined in accordance withfederal income tax regulations, which may differ from GAAP. These ‘‘book/tax’’ differences are considered either temporary orpermanent in nature. To the extent these differences are permanent in nature, such amounts are reclassified within the capitalaccounts based on their federal tax-basis treatment; temporary differences do not require reclassification.
The amount and character of tax basis distributions and composition of net assets are finalized at fiscal year end; accordingly,tax basis balances have not been determined as of June 30, 2019.
6. Repurchase Agreements
The fund will engage in repurchase transactions under the terms of master repurchase agreements with parties approved byTAS.
In a repurchase agreement, the fund buys securities from a counterparty (e.g., typically a member bank of the Federal Reservesystem or a securities firm that is a primary or reporting dealer in US Government securities) with the agreement that thecounterparty will repurchase them at the same price plus interest at a later date. In certain instances, the fund may enter intorepurchase agreements with one counterparty, but face another counterparty at settlement. Repurchase agreements may becharacterized as loans secured by the underlying securities. Such transactions afford an opportunity for the fund to earn areturn on available cash at minimal market risk, although the fund may be subject to various delays and risks of loss if thecounterparty becomes subject to a proceeding under the US Bankruptcy Code or is otherwise unable to meet its obligation torepurchase the securities. Securities pledged as collateral for repurchase agreements are held by the custodial bank untilmaturity of the repurchase agreements. Provisions of the repurchase agreements and the procedures adopted by the fundrequire that the market value of the collateral, including accrued interest thereon, be at least equal to the value of thesecurities sold or purchased in order to protect against loss in the event of default by the counterparty.
Counterparty
Assets Subjectto a NettingProvisionor Similar
ArrangementLiabilities Available
for OffsetCollateralReceived Net Amount
Fixed Income Clearing Corp. $2,420,542 $ — $(2,420,542) $ —Total $2,420,542 $ — $(2,420,542) $ —
7. Concentration of Risks
The fund may engage in transactions with counterparties, including but not limited to repurchase agreements. The fundmay be subject to various delays and risks of loss if the counterparty becomes insolvent or is otherwise unable to meet itsobligations.
TIFF SHORT-TERM FUND / NOTES TO FINANCIAL STATEMENTS (UNAUDITED) JUNE 30, 2019
SHORT-T
ERM
71

The fund invests in US Government securities. Because of the rising US Government debt burden, it is possible that the USGovernment may not be able to meet its financial obligations or that securities issued or backed by the US Government mayexperience credit downgrades. Such a credit event may adversely affect the financial markets.
From time to time, a fund may have members that hold significant portions of the fund’s outstanding shares. Investmentactivities of such members could have a material impact on the fund. As of June 30, 2019, TAS, the advisor to the fund, owned47% of STF.
8. Indemnifications
In the normal course of business, the fund enters into contracts that provide general indemnifications. The fund’s maximumexposure under these arrangements is dependent on future claims that may be made against the fund and, therefore, cannotbe established; however, based on experience, the risk of loss from such claims is considered remote.
9. Subsequent Events
Management has evaluated the possibility of subsequent events and has determined that there are no material events thatwould require disclosure.
TIFF SHORT-TERM FUND / NOTES TO FINANCIAL STATEMENTS (UNAUDITED) JUNE 30, 2019
SHORT-T
ERM
72

ADDITIONAL INFORMATION (UNAUDITED)
Proxy Voting Policy and Voting Record
A description of the policies and procedures that TIP uses to determine how to vote proxies relating to portfolio securities isavailable at https://www.tiff.org/mutualfunds/prospectusdisclosures/proxy.aspx and without charge, upon request, by calling800-984-0084. This information is also available on the website of the US Securities and Exchange Commission (‘‘SEC’’) athttp://www.sec.gov. Information regarding how the funds voted proxies relating to portfolio securities during the most recent12-month year ended June 30 is also available on the websites noted above and without charge, upon request, by calling800-984-0084.
Quarterly Reporting
TIP files its complete schedules of portfolio holdings with the SEC for the first and third quarters of each fiscal year onForm N-PORT. TIP’s Form N-PORT reports are available on the website of the SEC at http://www.sec.gov.
TIFF SHORT-TERM FUND JUNE 30, 2019
SHORT-T
ERM
73
The board of TIP comprises experienced institutional investors, including current or former senior officers of leadingendowments and foundations. Among the responsibilities of the board are approving the selection of the investment advisorand money managers for TIP; monitoring fund operations, performance, and costs; reviewing contracts; nominating andselecting new trustees; and electing TIP officers.
Each trustee serves the fund until his termination, or until the trustee’s retirement, resignation, or death, or otherwise asspecified in TIP’s Agreement and Declaration of Trust. The table on these two pages shows information for each trustee andexecutive officer of the fund. The mailing address of the trustees and officers is 170 N. Radnor Chester Road, Suite 300, Radnor,PA, 19087.
The Statement of Additional Information has additional information regarding the board. A copy is available upon requestwithout charge by calling 800-984-0084. This information is also available on the website of the SEC at http://www.sec.gov.
Independent Trustees
William F. McCalpinBorn 1957Trustee since February 2008Board Chair since 20082 funds overseen
Principal Occupation(s) During the Past Five Years:Managing Partner, Impact Investments, Athena Capital Advisors, LLC, anindependent, registered advisor (2016 − present); Managing Director, HolosConsulting LLC, a consultant to foundations and non-profit organizations(2009 − present); Chair of the Board of Trustees of The Janus Henderson Funds(2008 − present); Trustee of The Janus Henderson Funds (2002 − present)(oversees 60 portfolios). Formerly, Chief Executive Officer, Imprint CapitalAdvisors, LLC, an investment advisor exclusively focused on impact investing(2013 − 2015).Other Directorships: F.B. Heron Foundation; Mutual Fund Directors Forum.
Craig R. CarnaroliBorn 1963Trustee since January 20122 funds overseen
Principal Occupation(s) During the Past Five Years:Executive Vice President, University of Pennsylvania. Other Directorships:University City District; University City Science Center; Philadelphia IndustrialDevelopment Corp.; Visit Philadelphia; The Connelly Foundation, a privategrantmaking foundation.
Mark L. BaumgartnerBorn 1969Trustee since September 20162 funds overseen
Principal Occupation(s) During the Past Five Years:Chief Investment Officer, Institute for Advanced Study, a private, independentacademic institution (2014 − present).Other Directorships: Trustee, YMCA Retirement Fund.
TRUSTEES AND PRINCIPAL OFFICERS (UNAUDITED)
GOVE
RNAN
CE
74

Principal Officers
Richard J. FlanneryBorn 1957President and CEOsince September 2003
Principal Occupation(s) During the Past Five Years:CEO, TIFF Advisory Services, Inc.; President and CEO, TIFF Investment Program.Directorships: TIFF Advisory Services, Inc., Investment Committee Member ofthe Financial Industry Regulatory Authority (FINRA), Compensation Committeemember, Mercy Investment Services, Inc., Nelson Foundation, and Advisor tothe Board, Catholic Investment Services, Inc.
Jay L. WilloughbyBorn 1958Chief Investment Officersince October 2015
Principal Occupation(s) During the Past Five Years:Chief Investment Officer, TIFF Advisory Services, Inc. (2015 − present);CIO, Alaska Permanent Fund Corp., a sovereign wealth fund of the State of Alaska(2011 − 2015). Directorships:Sustainability Accounting Standards Board (SASB) Foundation.
Katherine M. BillingsBorn 1980CFO and Treasurersince July 2017
Principal Occupation(s) During the Past Five Years:Vice President and Treasurer, TIFF Advisory Services, Inc.(2017 − present); Director, among other positions, PricewaterhouseCoopers, LLP(2002 − 2017).
Zane T. HamidBorn 1981Vice Presidentsince December 2017
Principal Occupation(s) During the Past Five Years:Vice President and Head of Fund Operations (2017-present);Deputy Head of Fund Operations (2013 − 2017), TIFF Advisory Services, Inc.
Kelly A. LundstromBorn 1964Vice Presidentsince September 2006
Principal Occupation(s) During the Past Five Years:Vice President and Chief Strategy and People Officer (2018 − present);Vice President and Head of Operations (2006 − 2017), TIFF Advisory Services, Inc.
Christian A. SzautnerBorn 1972CCO since July 2008;Vice President, Secretary, andChief Legal Officersince July 2017
Principal Occupation(s) During the Past Five Years:Vice President and Chief Compliance Officer, TIFF Advisory Services, Inc.;General Counsel — Regulatory and Assistant Secretary (2017 − present),TIFF Advisory Services, Inc.
Robert J. ZionBorn 1961Vice President and COOsince March 2017,Assistant Treasurer since July 2017
Principal Occupation(s) During the Past Five Years:Vice President and Chief Operating Officer, TIFF Advisory Services, Inc.(March 2017 − present); Chief Operating Officer, among other positions,Hirtle Callaghan & Co. (1991 − 2017).
TRUSTEES AND PRINCIPAL OFFICERS (UNAUDITED)
GOVERN
ANCE
75

MONEY MANAGERS AND ACQUIRED FUND(‘‘AF’’) MANAGERS
TIFF Multi-Asset FundAHL Partners LLP (AF)*AJO, LPAmundi Pioneer Institutional Asset Management, Inc.AQR Capital Management, LLCCanyon Capital Advisors LLC (AF)Deep Basin Capital LPEversept Partners, LP (AF)Farallon Capital Management, LLC (AF)Fundsmith, LLPGreen Court Capital Management LimitedGSA Capital Ltd. (AF)Honeycomb Asset Management LP (AF)Hosking Partners LLPKopernik Global Investors, LLCLansdowne Partners (UK) LLPLansdowne Partners Limited (AF)Mission Value Partners, LLCNeo Ivy Capital Management, LLC (AF)Och-Ziff Capital Management Group (AF)QVT Financial LP (AF)RK Capital Management, LLC (‘‘Tessera’’) (AF)Strategy Capital, LLCTB Alternative Assets Ltd. (‘‘Trustbridge’’)TIFF Advisory Services, Inc.
TIFF Short-Term FundTIFF Advisory Services, Inc.
ADVISORTIFF Advisory Services, Inc.
170 N. Radnor Chester RoadSuite 300Radnor, PA 19087phone 610-684-8200fax 610-684-8210
CUSTODIANACCOUNTING AGENTTRANSFER AGENTDIVIDEND DISBURSING AGENTFUND ADMINISTRATORState Street Bank and Trust CompanyOne Iron StreetBoston, MA 02210
FUND DISTRIBUTORForeside Fund Services, LLC3 Canal PlazaSuite 100Portland, ME 04101
FUND COUNSELStradley Ronon Stevens & Young, LLP2600 One Commerce SquarePhiladelphia, PA 19103
INDEPENDENT REGISTERED PUBLICACCOUNTING FIRMPricewaterhouseCoopers LLP2001 Market StreetSuite 1800Philadelphia, PA 19103
* Manager is no longer managing assets for the fund at June 30, 2019.
Investors should consider the investment objectives, risks and charges and expenses of a fund carefully before investing.The prospectus contains this and other information about the funds. A prospectus may be obtained by contacting TIFFat 800-984-0084 or by visiting https://www.tiff.org/mutualfunds/prospectusdisclosures/proxy.aspx. Please read theprospectus carefully before investing. The SEC does not approve or disapprove of the securities mentioned in this report.Mutual fund investing involves risk. Principal loss is possible.
TIFF INVESTMENT PROGRAM