Embed Size (px)
Citation preview

The role of virtual water trade in physical water scarcity: Case Central Asia
08 Fall
A master’s thesis submitted for inspection for the degree of Master of Science in Technology Espoo, August 29th 2011
Miina Porkka
Supervisor: Professor Olli Varis Instructor: D.Sc. (Tech.) Matti Kummu
AALTO UNIVERSITY School of Engineering Department of Civil and Environmental Engineering

2

3
AALTO UNIVERSITY SCHOOLS OF TECHNOLOGY PO Box 11000, FI-00076 AALTO http://www.aalto.fi
ABSTRACT OF THE MASTER’S THESIS
Author: Miina Porkka
Title: The role of virtual water trade in physical water scarcity: Case Central Asia
School: School of engineering
Department: Civil and environmental engineering
Professorship: Water resources engineering Code: Yhd-12
Supervisor: Prof. Olli Varis
Instructor: D.Sc. (Tech.) Matti Kummu
Abstract:
Today’s globalised world is characterized by increased trade of water intensive products. The local
and regional water scarcities should, therefore, also be examined in a global context. In this study
the relation of physical water scarcity and virtual water trade in Central Asia was analysed. Two
indices were used to identify water scarcity at the scale of sub-basin areas (SBAs): water stress
index (i.e. consumption-to-availability ratio) and water shortage index (i.e. water availability per
capita). Impact of virtual water trade on water scarcity was studied by calculating water scarcity
indices for a baseline scenario that included virtual water flows, and comparing them to a scenario
where virtual water trade was assumed not to exist. I found that water stress was the dominant type
of water scarcity in Central Asia. Over 80 % of the total study area population lived in areas that
suffered from water stress. About a half of the total population lived in areas that were also short of
water resources. Most SBAs are net virtual water exporters, thus the impact of removing virtual
water flows was mostly positive. The elimination of virtual water trade considerably decreased
water scarcity for about a half of the total population. Inverting virtual water flows could thus be one
solution for alleviating water scarcity in Central Asia, along with the more traditional measures of
e.g. reducing water use intensity and increasing water use efficiency.
Date: 29.8.2011 Language: English Number of pages: 31 + 5
Keywords: physical water scarcity, water stress, water shortage, virtual water trade,
Central Asia

4
AALTO-YLIOPISTO TEKNIIKAN KORKEAKOULUT PL 11000, 00076 AALTO http://www.aalto.fi
DIPLOMITYÖN TIIVISTELMÄ
Tekijä: Miina Porkka
Työn nimi: Virtuaalivesivirtojen rooli veden fyysisessä niukkuudessa: Case Central Asia
Korkeakoulu: Insinööritieteiden korkeakoulu
Laitos: Yhdyskunta ja ympäristötekniikka
Professuuri: Vesitalous Koodi: Yhd-12
Valvoja: Prof. Olli Varis
Ohjaaja: D.Sc. (Tech.) Matti Kummu
Tiivistelmä:
Tämän päivän globalisoituneessa maailmassa liikkuu kansainvälisen kaupan myötä suuria määriä
paljon vettä kuluttavia maataloustuotteita. Paikallista ja alueellista veden niukkuutta pitäisikin siksi
tarkastella globaalissa kontekstissa. Tässä tutkimuksessa analysoitiin veden fyysisen niukkuuden
ja virtuaalivesivirtojen suhdetta Keski-Aasiassa. Veden niukkuutta tarkasteltiin osavaluma-
alueiden (SBA:t) tasolla käyttäen kahta mittaria: vesistressi-indeksiä (veden käytön ja
vesiresurssien suhde) sekä veden puutteen indeksiä (vesiresurssit väestöä kohden).
Virtuaalivesivirtojen vaikutusta vesiniukkuuteen tutkittiin laskemalla indeksit perusskenaariolle,
jossa virtuaalivesi oli otettu huomioon ja vertaamalla arvoja tilanteeseen, jossa virtuaalivesivirtojen
oletettiin puuttuvan. Vesistressi oli Keski-Aasiassa dominoivampi vesiniukkuuden tyyppi. Yli 80%
tutkimusalueen väestöstä asui vesistressistä kärsivillä alueilla. Noin puolet koko väestöstä asui
alueilla joilla oli lisäksi puutetta vedestä. Suurimmalla osalla SBA-alueista virtuaaliveden vienti oli
suurempaa kuin tuonti, joten virtuaalivesivirtojen poistamisen vaikutus oli pääosin positiivinen.
Virtuaalivesivirtojen poistaminen vähensi vesiniukkuutta merkittävästi alueilla, jotka yhteensä
asuttivat yli puolta koko tutkimusalueen väestöstä. Perinteisempien keinojen, kuten veden käytön
tehostamisen, lisäksi virtuaalivesivirtojen kääntäminen nettoviennistä nettotuontiin voisikin olla
yksi keino vähentää vesiniukkuutta Keski-Aasiassa.
Päivämäärä: 29.8.2011 Kieli: englanti Sivumäärä: 31 + 5
Avainsanat: veden niukkuus, vesistressi, virtuaalivesivirrat, Keski-Aasia

5
Acknowledgements
This study was carried out at the Water & Development Research Group of Aalto
University. The research was funded by Maa-‐ ja vesitekniikan tuki ry and Academy of
Finland project 133748.
I would like to thank all the people who have given me guidance during this process. I am
extremely grateful to my instructor Matti Kummu for all the help he has offered me along
the way, and to my supervisor Professor Olli Varis for his support and valuable comments.
Special thanks goes to Stefan Siebert from University of Bonn and Martina Flörke from
University of Kassel for providing me with data and their expertise when commenting the
work.
Warm thank you to all the members of Water & Development Research Group for their
encouragement and inspiration. I cannot imagine a better working environment. I would
particularly like to thank Elina Heikinheimo who has been in the same boat with me
throughout this process: thank you for your support and for setting me a deadline – it
looks like we will make it to that plane after all.
Finally, I would like to thank all my friends and family for their support and understanding,
and especially for offering me much needed distraction from writing this master’s thesis.
Miina Porkka
Espoo, August 29th 2011

6
ACKNOWLEDGEMENTS 5
1 INTRODUCTION 7
2 STUDY AREA 9
3 MATERIALS AND METHODS 11
3.1 SPATIAL SCALE OF ANALYSIS 11 3.2 MATERIALS 11 3.2.1 POPULATION DENSITY 12 3.2.2 WATER RESOURCES AVAILABILITY 13 3.2.3 WATER CONSUMPTION 14 3.2.4 VIRTUAL WATER CALCULATIONS 15 3.3 METHODS 16 3.3.1 WATER SCARCITY 16 3.3.2 IMPACT OF VIRTUAL WATER TRADE ON WATER SCARCITY 17
4 RESULTS 19
4.1 WATER SCARCITY 19 4.2 IMPACT OF VIRTUAL WATER TRADE ON WATER SCARCITY 22
5 DISCUSSION 23
5.1 VIRTUAL WATER TRADE: SOLUTION TO WATER SCARCITY? 23 5.2 FUTURE RESEARCH NEEDS 25
6 CONCLUSIONS 27
REFERENCES 28
ANNEX I – MATERIALS USED IN THE ANALYSIS 32
ANNEX II – CROP AND LIVESTOCK COMMODITIES 33
ANNEX III – VIRTUAL WATER TRADE: UZBEK COTTON 34
ANNEX IV – RESULTS IN SBA SCALE 36

7
1 Introduction
Both population and fresh water resources are distributed very unevenly over the globe
(e.g. Kummu & Varis, 2011) and water is considered a scarce resource in many regions
(e.g. Ohlsson & Turton, 1999; Vörösmarty, 2000; Oki & Kanae, 2006; Alcamo et al, 2007).
Water can be scarce either physically (Falkenmark et al, 1989) or socially, induced by
political power, policies and/or socio-‐economic relations (e.g. Ohlsson & Turton, 1999). In
this study I concentrate on physical water scarcity without, however, diminishing the
importance of social water scarcity.
Physical water scarcity can be roughly divided into two main categories: population-‐
driven water shortage and demand-‐driven water stress (Falkenmark et al, 2007).
Population-‐driven water shortage occurs in areas where a large population has to depend
on a limited resource while demand-‐driven water stress is related to the excessive use of
otherwise sufficient water resources (Falkenmark et al, 2007).
It has been estimated that around one third of the world’s population is living in areas that
suffer from physical water scarcity, either from water shortage (Arnell, 2004; Alcamo et al,
2007; Islam et al, 2007; Kummu et al, 2010) and/or from water stress (Vörösmarty, 2000;
Oki & Kanae, 2006; Alcamo et al, 2007). In today’s globalised world, however, the
importance of local water management has somewhat changed due to the rapidly
increased trade of agricultural and other water intensive products. Therefore, many areas
are not anymore depending solely on their local water resources but more and more on
the combination of those with the global trade of virtual water. Global virtual water trade
is approximately 1625 km3/yr (Chapagain & Hoekstra, 2008), being about a half of the
total blue water (surface and ground water) consumption (Oki & Kanae, 2006). Water
scarcity is thus globalised and should be analysed in this context.
The relevance of virtual water flows depends largely on the location of exporting and
importing areas. In some areas virtual water flows help to alleviate water scarcity, as
water-‐intensive products are imported instead of producing them locally. There have been
various global studies addressing water scarcity (e.g. Vörösmarty, 2000; Oki et al, 2001;
Arnell, 2004; Alcamo et al, 2007; Kummu et al, 2010) and virtual water trade (e.g. Oki &
Kanae, 2004; Chapagain & Hoekstra, 2008; Hanasaki et al, 2010) but only few that assess
the implications of virtual water trade for water scarcity. Hoekstra and Hung (2005)
quantified virtual water flows between countries and analysed national virtual water
balances in relation to water needs and water availability. Kumar and Singh (2005)

8
examined whether a relationship exists between the extent of virtual water trade and
water availability in a country. Islam et al. (2007) did a grid-‐based assessment of water
scarcity with virtual water trade included.
In addition to global studies, various case studies have addressed the connection of virtual
water and water scarcity (e.g. Wichelns, 2001; Yang & Zehnder, 2001; Yang et al, 2007;
Faramarzi et al, 2010). Studies suggest that some areas are so dependent on imported
water that they simply could not sustain the population without it. Jordan, for example
imports annually around 5-‐7 km3 of water in virtual form – in sheer contrast with the
country’s domestic annual withdrawal of 1 km3/yr (Chapagain & Hoekstra, 2008).
However, limited domestic water resources are rarely the driving force behind virtual
water trade (e.g. Wichelns, 2004). In some areas large exports of water extensive products
can even be an important part of the reason behind water scarcity.
Central Asia is one of the regions that are virtual water exporters (Chapagain & Hoekstra,
2008; Hanasaki et al, 2010) despite their limited fresh water resources (e.g. Vörösmarty,
2000; Oki & Kanae, 2006). Although water is regionally relatively abundant there, its
excessive use – particularly for irrigated agriculture – has led to severe local water deficits
(Aldaya et al, 2010). This has partly been addressed by e.g. Aldaya et al. (2010) who
calculate the water footprint of Central Asian cotton, wheat and rice. They did not,
however, assess their implications for water scarcity. Although the Central Asian situation
has been addressed in global studies, as addressed above, to my best knowledge the
impact of virtual water trade on water scarcity has not been studied in detail.
In this study my objective is thus to analyse the relation of water scarcity and virtual
water trade in Central Asia. The aim of this work is first, to assess the extent and severity
of water scarcity in the region. Both water scarcity categories, i.e. water stress and water
shortage, are analysed to understand the nature of the water scarcity in the region.
Secondly, the aim is to assess the impact of virtual water trade on water scarcity in Central
Asia. I estimate the virtual water flows of 71 crop and livestock commodities and calculate
the combined water savings and losses. The analysis is carried out in the geographical
scale of sub-‐basin areas (SBAs), a combination of large river basins, national borders and
climate zones, to represent the unit in which water is normally managed (this can be
compared to Food Production Units used in Kummu et al. (2010)).
9
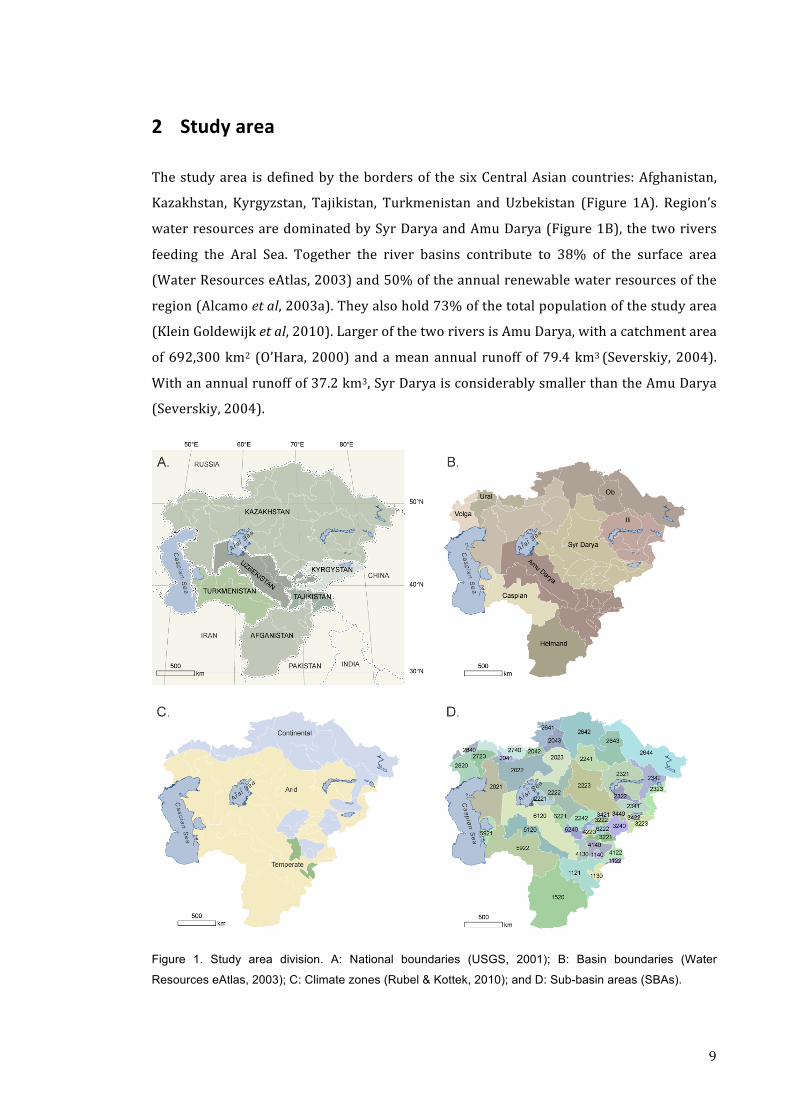
2 Study area
The study area is defined by the borders of the six Central Asian countries: Afghanistan,
Kazakhstan, Kyrgyzstan, Tajikistan, Turkmenistan and Uzbekistan (Figure 1A). Region’s
water resources are dominated by Syr Darya and Amu Darya (Figure 1B), the two rivers
feeding the Aral Sea. Together the river basins contribute to 38% of the surface area
(Water Resources eAtlas, 2003) and 50% of the annual renewable water resources of the
region (Alcamo et al, 2003a). They also hold 73% of the total population of the study area
(Klein Goldewijk et al, 2010). Larger of the two rivers is Amu Darya, with a catchment area
of 692,300 km2 (O’Hara, 2000) and a mean annual runoff of 79.4 km3 (Severskiy, 2004).
With an annual runoff of 37.2 km3, Syr Darya is considerably smaller than the Amu Darya
(Severskiy, 2004).
Figure 1. Study area division. A: National boundaries (USGS, 2001); B: Basin boundaries (Water
Resources eAtlas, 2003); C: Climate zones (Rubel & Kottek, 2010); and D: Sub-basin areas (SBAs).

10
In the Amu Darya and Syr Darya basins, more than 65 % of water available for use is
generated in the areas of Tajikistan and Kyrgyzstan, yet the biggest consumers are
Uzbekistan and Turkmenistan (O’Hara, 2000). In these two countries, the national
economies are largely based on irrigated agriculture, particularly cotton production
(Aldaya et al, 2010). The countries are almost entirely dependent on water resources
coming from transboundary rivers originating in upstream states (Severskiy, 2004).
Other major river basins inside the study area are the Ili basin in Kazakhstan and the
Helmand basin in Afghanistan (Figure 1B). The area also includes portions of Ob, Ural and
Volga river basins. A more detailed description of the large Central Asian river basins and
their social, economic and environmental vulnerability can be found in Varis & Kummu (in
press).
The study area is dominated by the arid climate, with some temperate patches in the east
and continental climate belt in the north (Figure 1 C). Thus, large part of the region is
naturally rather dry what comes to the available water resources. Annual precipitation
ranges from about 100 mm in the dry lowlands to 500 mm in the high mountain areas of
Tajikistan and Kyrgyzstan (Törnqvist & Jarsjö, 2011).

11
3 Materials and methods
3.1 Spatial scale of analysis
The study area was divided into SBAs (sub-‐basin areas), based on large river basins
(Figure 1B), climate zones (Figure 1C) and administrative regions (Figure 1A) (see Table 1
for data sources). This resulted altogether 47 SBAs (Figure 1D). Eight large basins were
distinguished, namely Amu Darya, Syr Darya, Ili, Helmand, Ob, Ural, Volga and Caspian Sea.
To simplify the division, some smaller areas outside these basins were merged into the
closest large river basin. Basin areas from Ob, Volga and Ural that lie outside the six study
countries were not included in the analyses. Later on, ‘Other basin’ in tables and figures
refers to the SBAs that do not belong to any of the large river basins. While all the analyses
were carried out at SBA scale, some results are also presented aggregated to basin and
country levels. For comparison some results obtained from country and basin scale
analyses are also presented in the ‘Discussion’ section.
3.2 Preparation of materials
In this section the preparation of the materials used for the analyses (see Table 1) is
presented. The materials can be divided in four categories: population density, water
resources availability, water consumption, and virtual water trade.
Table 1. Datasets used in the study.

12
3.2.1 Population density
Population density data were derived from the 5′ x 5′ resolution HYDE dataset (Klein
Goldewijk et al, 2010) and aggregated to SBA scale (See figure 2A). The most densely
populated SBAs are located in the upper Syr Darya and Amu Darya basins, which is where
many of the biggest cities of Central Asia are situated. Vast areas of the region, especially
Kazakhstan, are very sparsely populated.
Figure 2. Maps of the materials. A: Population density; B: Water availability; C: Water consumption; D: Net
virtual water imports.

13
3.2.2 Water resources availability
The available water resources were based on mean annual runoff with a spatial resolution
of 30′ x 30′ from WaterGAP 2 model results (Alcamo et al, 2003a; Döll et al, 2003). In
addition to this, cell level discharge data based on the global WATCH dataset with a similar
spatial resolution (WATCH, 2011) was used. Average monthly discharges for 1990–2009
were used to calculate mean annual discharge for 2000.
Four indicators of water resources availability on SBA level were computed:
A. The equal sharing approach: runoff of the whole basin is distributed evenly for
each grid cell inside the basin.
B. Local runoff approach: sum of cell specific runoff is computed for each SBA.
C. Upstream-‐to-‐downstream approach: method takes into account both the local
runoff of the SBA and the water that originates from upstream. Here, it is assumed
that all the resources that are not consumed in the upper SBA are available in the
lower SBA. Flow routing between SBAs was done manually based on the actual
river network.
D. Discharge proportion approach: the ratio of sum of SBA discharges to sum of basin
discharges is used to divide the basin runoff between SBAs.
The equal sharing (A) is the simplest approach. It does, however, ignore the naturally
irregular distribution of water resources inside a river basin and therefore is not very
realistic. The local runoff (B) takes into account the irregularity inside a river basin but
tends to give unrealistically low values for downstream areas where most of the available
water resources originate from upstream. The upstream-‐to-‐downstream (C) gives perhaps
the most realistic estimation of actual available water resources of a small area such as an
SBA or a grid cell. Due to the accumulation of water in the downstream areas, the method
is, however, not very suitable for aggregating the results from SBA scale to basin or
country scale. Thus, I selected to use the discharge proportion approach (D) in the
calculations. The approach is rather realistic, assuming a simple treaty how the water is
managed in each transboundary river basin. In addition, the available water resources are
not counted many times over the basin. The method does, however, often give lower
values to some of the wet upstream parts of the basin compared to other approaches.
Although the SBA scale calculations are presented from the ‘Discharge proportion’
approach (see Figure 2B), the calculations were also carried out by using the other three
approaches described above. As discussed in more detail in the ‘Discussion’ section, it
should be noted also here, that in certain SBAs the choice of method for calculating water
availability has a significant impact on water scarcity calculations.

14
Groundwater resources are relatively easily
accessible in many parts of the study area.
Their quality is, however, reported to be
significantly lower than that of surface water,
especially in many downstream areas
(Törnqvist & Jarsjö, 2011). Moreover,
accurate data for groundwater resources is
not easily available, thus only surface waters
were included in this study. It should also be
noted that water quality issues, such as
salinity and contamination, which have a
rather big impact on water usability in
Central Asia (Severskiy, 2004), have not been
considered in this study.
3.2.3 Water consumption
Sectoral water consumption data were
derived from the global 30′ x 30′ resolution
WATCH dataset (WATCH, 2011) with five
sectors, namely irrigation, domestic,
manufacturing, electricity and livestock.
Average annual water consumption data for
1990-‐2009 were used to calculate sectoral
water consumption for the year 2000. Values
were then aggregated to SBA scale. Water
consumption for each sector is presented in
Table 2 and the totals mapped in Figure 2C.
According to the calculations, agriculture is
the dominant water user, accounting for 93%
of total water consumption in the study area.
Next largest are domestic and manufacturing
sectors, which make up 4% and 2% of total
water consumption respectively. Livestock
and electricity water consumption constitute
the remaining one per cent of the Central
Asian total.
Tabl
e2. M
ater
ials
use
d in
the
anal
yses
. SB
A s
cale
num
bers
are
pre
sent
ed in
Ann
ex 1
.

15
3.2.4 Virtual water calculations
Global crop water model GCWM (Siebert & Döll, 2010) was used to calculate the virtual
water content of crops and crop products. Output of the model has a spatial resolution of
5′ x 5′, distinguishing consumptive blue (evaporation of irrigation water) and green water
use (evapotranspiration of infiltrated rainwater) for 26 different crop classes, of which 23
were included in this study (see Annex II). Crop specific production (kg/yr) and blue
water consumption (m3/yr) data were aggregated to SBA scale and used to calculate the
crop specific virtual water content (m3/kg) in each SBA.
For livestock water consumption, results of Mekonnen & Hoekstra (2010) were used. In
this global study they estimated the green, blue and grey virtual water content of farm
animals and the derived animal products for the period 1996–2005. Three different
production systems were distinguished, and based on a spatially explicit crop water use
model and estimates of the amount and composition of feed in each system, virtual water
content of livestock products were calculated at country level. I used the estimates of
virtual water content of five primary livestock products, namely raw milk and live bovine,
swine, sheep and fowls, in further calculations.
Country scale import and export data of 71 crop commodities and 11 livestock
commodities (see Annex 2) for years 1998–2002 were obtained from the Comtrade
database of the United Nations (UN Comtrade, 2010). Only the most important
commodities were included in the study. It was assumed that the production of possible
by-‐products of these commodities (e.g. oil-‐cake from extraction of sunflower seeds for
sunflower oil) does not increase the production of the primary product (e.g. sunflower)
and thus does not affect the virtual water content of commodities (e.g. sunflower oil).
Average weight of annual imports and exports of each commodity were converted to the
equivalent amount of the primary product according to specific extraction rates (amount
of processed product obtained from processing the primary product). Extraction rates
were estimated based on commodity trees by FAO (2003). In the case of cotton products,
estimations by Chapagain et al. (2006b) were used.
National exports of crop products were divided between SBAs in proportion to the
production of each crop class. In the case of exporting livestock products, the proportion
of livestock water consumption was used to represent the spatial distribution of livestock
production inside a country. National imports of crop and livestock products were
distributed between SBAs in proportion to their total population. Finally, to obtain the SBA
scale virtual water flows (see Figure 2D), trade flows of each SBA were multiplied with
their respective crop and livestock product specific virtual water content unique to that

16
particular SBA. In the case of imports, virtual water content characteristic to the importing
SBA was used rather than water actually consumed in the place of production. This
enables to quantify the water savings induced by virtual water imports in Central Asia.
Due to the lack of information on internal trade, virtual water flows inside a nation were
not taken into account.
Both GCWM (Siebert & Döll, 2010) and Mekonnen & Hoekstra (2010) distinguish between
blue and green crop water consumption. However, green water scarcity is quite difficult to
define and further research is required to identify the thresholds at which an area faces
green water scarcity (Rockström et al, 2009). Therefore I chose to only analyse blue water
scarcity and the blue fraction of virtual water trade in this study, while not forgetting the
importance of green water in crop production and food security. Green water also has an
important role in water savings through virtual water trade. In many arid and semi-‐arid
areas, such as Central Asia, imports of green water replace the local blue water resources
that would be needed to produce agricultural products domestically. However, despite
excluding green water from the analysis, these savings of blue water have been taken into
account by using the importing area’s virtual water content in the calculations, as
described above.
An example of estimating the virtual water flows related to trade of cotton products in
Uzbekistan is presented in Annex 3.
3.3 Methods
3.3.1 Water scarcity
Two indices for physical water scarcity were used in this study: the water crowding index
(WCI), i.e. Falkenmark’s index (Falkenmark, 1997), and the water stress index (WSI). WCI
was used to measure population-‐driven water shortage and is defined here as the annual
available water resources per capita. Demand-‐driven water stress is usually measured
with the ratio of water withdrawals to available water resources (e.g. Falkenmark, 1997;
Vörösmarty, 2000). In this study I decided to use the ratio of annual water consumption to
available water resources for calculating WSI. I believe, that using water consumption
rather than withdrawals is more appropriate for the Central Asian conditions because of
the reported importance of downstream reuse of return flows of irrigation water
withdrawn in upstream areas (Törnqvist & Jarsjö, 2011; Aus der Beek et al, 2011). Water
scarcity refers here to both water shortage and water stress.

17
I follow the thresholds and definitions of different levels of water scarcity defined by
Falkenmark et al (2007):
-‐ WCI:
o Moderate water shortage: per capita water availability is 1000–1700
m3/yr.
o Chronic water shortage: per capita water availability is < 1000 m3/yr.
-‐ WSI:
o Moderate water stress: consumption of 20–40 % of available water
resources.
o High water stress: consumption of over 40 % of available water resources.
It should be noted that I used the water stress thresholds defined for withdrawals-‐to-‐
availability ratio because such thresholds for consumption-‐to-‐availability ratio have not
been defined. Moreover, it was assumed that the thresholds used in this study are fixed
and do not change over time or based on the location, even though there are processes (e.g.
technological change, structural change etc.) that may have an impact on currently used
thresholds.
Both indices were calculated for each SBA based on the materials described above.
Although water scarcity assessments normally use only one indicator to describe the level
of water scarcity (e.g. Oki et al, 2001; Alcamo et al, 2003b; Arnell, 2004; Islam et al, 2007;
Kummu et al, 2010), I believe that the use of both WCI and WSI in parallel gives a better
understanding of the nature of water scarcity and the reasons behind it. Furthermore,
both indices have their limitations, as discussed in Rijsberman (2005), and using the two
together is likely to give a more valid estimate of the extent of water scarcity in Central
Asia. The results are presented in a water scarcity matrix developed by Falkenmark
(1997) (Figure 3). The matrix is a plot of WCI (horizontal scale) and WSI (vertical scale). It
distinguishes moderate and chronic water shortage, moderate and high water stress, and
the combinations of different levels of the two water scarcity indices. Water scarcity
categories are presented in Figure 3, along with the principal drivers that lead to changes
in the indices.
3.3.2 Impact of virtual water trade on water scarcity
Water scarcity indices were first calculated for the baseline scenario, where virtual water
trade was included. When calculating the WCI index for each SBA, virtual water flows were
included in the calculations by treating them as natural flows entering or exiting the area.
In the baseline scenario net virtual water exports were subtracted from the exporting

18
SBAs available water resources. Likewise, net virtual water imports were added to the
importing area’s natural water resources. In the second scenario, where virtual water
flows were eliminated, only the locally available water resources were used to calculate
WCI. This increases the WCI value in net exporting areas and decreases it in net importing
areas compared to the baseline (Figure 3).
Figure 3. Water scarcity categories and their thresholds. Arrows indicate the effect of the principal drivers
of change.
WSI for the baseline scenario was calculated by dividing consumptive water use with
locally available water resources. In the second scenario, virtual water trade was
eliminated by adding net virtual water imports to the importers’ water consumption,
which increases the WSI value (Figure 3). This represents the additional water needed to
produce the formerly imported commodities domestically. Similarly, net virtual water
exports were subtracted from the exporters water consumption, which represents the
water savings when the formerly exported commodities are not produced. These water
savings decrease the WSI value compared to the baseline scenario (Figure 3).

19
4 Results
4.1 Water scarcity
Demand-‐driven water stress was the dominant type of water scarcity in Central Asia. Most
SBAs had sufficient water resources in relation to their population, and all the areas that
experienced some form of water scarcity suffered from either water stress alone (high
WSI value) or both water stress and water shortage (high WSI and low WCI value) (Figure
4a). The few areas where population-‐driven water shortage occurred along with water
stress, however, hold almost a half (37.4 million) of the total population of the study area.
Thus, water shortage is also significant in Central Asia, despite the seemingly plentiful per
capita water resources (Table 2).
According to the calculations 84% (63.6 million) of the study area population lived under
some level of water scarcity. About a half of them lived in areas that suffered from severe
water scarcity in the sense that both high water stress and chronic water shortage
occurred (Figure 4a, Table 3). 65% of the population experienced high water stress, with
majority of them living in areas with less than 1700 m3 of water per capita per year.
Water scarcity occurred mainly in Amu Darya, Syr Darya, Ili, Helmand and Caspian Sea
basins, where it affected over 75% of each basin’s population (Figure 4a, Table 3). Scarcity
was particularly serious in Amu Darya and Syr Darya basins, where 40% and 75% of
population respectively was classified as being under severe water scarcity (Table 3). In
Syr Darya basin, all of this population lived under extreme water shortage with a WCI
value of less than 500 m3/capita/yr. In Ili and Syr Darya basins, scarcity occurred only in
the upstream end, whereas in other water scarce basins the downstream end was also
affected (Figure 5a). When water scarcity was examined on country scale, Afghanistan,
Kyrgyzstan and Uzbekistan stood out particularly, with over half of the population (61%,
67% and 52% respectively) living under severe water scarcity (Table 3).

20
Figure 4. Water scarcity results in matrix plot. A: Baseline scenario; and B: Scenario without virtual water
trade. Bubble sizes indicate the population of the SBAs and colours the river basin they belong to. Total
population in each of the matrix’s nine areas is presented in the lower right corner of A and B, with the
percentage of total Central Asian population in brackets. Arrows in B mark the change due to eliminating
virtual water trade. Both axes have a logarithmic scale.

21
Table 3. Results of population under different w
ater scarcity categories aggregated to basin and country levels, baseline scenario on the left and scenario without virtual w
ater
trade on the right. Note: categories that do not appear in the table equal to 0. S
ee Annex 4 for S
BA
scale results.

22
4.2 Impact of virtual water trade on water scarcity
Most SBAs were net virtual water exporters (Figure 2D) and therefore the elimination of
virtual water flows had generally a positive impact on water scarcity. In the net importing
SBAs, virtual water flows were relatively small and thus their elimination did not increase
the areas’ water scarcity considerably. The combined virtual water flows of the eight
largest net exporters (see Figure 4B), however, accounted for 99% of the whole Central
Asia’s net exports. These were all SBAs that suffered from some level of water scarcity.
Three of the eight large net exporters (2242, 4130 and 5120) were SBAs where the
elimination of virtual water flows had an impact on water scarcity classification (Figure 4,
Figure 5). In SBA 5120 water scarcity did not occur at all when virtual water flows were
eliminated, while the other two moved to a less critical water scarcity category. There
were significant changes also in other large net exporting SBAs. Three Uzbek SBAs in the
Amu Darya and Syr Darya basins (6120, 6222 and 6240), one Tajik SBA in the Syr Darya
basin (4220) and one Turkmen SBA in the Caspian Sea basin (5922) exported virtually
over 14% of their available water resources. Elimination of virtual water flows alleviated
water scarcity considerably in these eight areas that together hold 47% (35.6 million) of
the total population of Central Asia (Figure 4B).
Figure 5. Water scarcity mapped for each SBA. A: Baseline scenario; and B: Scenario without virtual water
trade.

23
5 Discussion
The results showed that over 80% of the total Central Asian population lived under some
level of water scarcity. All of these people suffered from demand-‐driven water stress and
about a half of them also from population-‐driven water shortage. This indicates that the
main cause of water scarcity in the study area is over-‐exploitation of available water
resources, which is mostly due to irrigated agriculture, as presented in Table 2. The GCWM
model output (Siebert & Döll, 2010) shows that the production of cotton, wheat and rice
accounts for 86% of the total agricultural blue water consumption in Central Asia. The
proportion of cotton alone is 62%, making it the dominant cause of high agricultural water
withdrawals. There is also a notable spatial overlap between cotton producing areas and
areas that suffer from water stress, which suggests that they are indeed connected.
5.1 Virtual water trade: solution to water scarcity?
When assessing the number of people living under water scarcity, the elimination of
virtual water flows did not have a very significant impact. Likewise, when assessing the
number of SBAs affected by virtual water trade, notable changes in water scarcity indices
could only be seen in eight of the 47 SBAs. However, in these SBAs the elimination of
virtual water trade considerably decreased water scarcity. As these areas hold almost a
half of the total population of Central Asia, the impact of virtual water trade on water
scarcity can be considered significant both in SBA scale as well as regional scale.
Various measures to decrease water scarcity exist (e.g. Oki & Kanae, 2006; Falkenmark et
al, 2007; Kummu et al, 2010). For demand-‐driven water stress, the most straightforward
ways are related to reducing water use (Figure 3). In Central Asia, a shift from the water-‐
hungry cotton to for instance grains could well decrease water demand in the most
stressed areas (Aus der Beek et al, 2011). Grain production has indeed become more
important in the region since the former Soviet Union states became independent in 1991,
and cotton producing areas have decreased some over the past ten years (Aldaya et al,
2010; Aus der Beek et al, 2011). However, cotton – the main cash crop of the region –
remains economically very important, particularly in the largest producing countries,
Uzbekistan, Turkmenistan and Tajikistan (Aldaya et al, 2010). Thus, further transition
away from cotton is likely to be very slow if it will occur at all. Another way to reduce
water consumption to some extent would be to cut losses in water supply and irrigation
systems. Improving the decayed Soviet-‐era infrastructure that is still widely in use in
Central Asia could increase water use efficiency substantially (Severskiy, 2004). Törnqvist

24
and Jarsjö (2011) found that an implementation of improved irrigation techniques in the
Amu Darya and Syr Darya basins would lead to water savings that increase the discharge
to the Aral Sea considerably.
While measures to combat demand-‐driven water stress can be fairly easy to take, simple
solutions to alleviate population-‐driven water shortage are much more difficult to find. In
the future, climate change could bring along wetter climate, which would increase water
availability. However, while some projections do suggest increased runoff for certain parts
of the study area (Vörösmarty, 2000; Arnell, 2004) population is also projected to grow
(Varis & Kummu, in press). This is likely to decrease per capita water availability despite
the possible wetter climate conditions (Arnell, 2004).
It has also been suggested that virtual water trade could decrease the pressure on
domestic water resources in water scarce areas (e.g. Allan, 1998; Hoekstra, 2011). The
idea applies to both population-‐driven and demand-‐driven scarcity: virtually imported
water can be seen as an alternative water source along with domestic water resources,
increasing the area’s per capita water availability. On the other hand, if for example cereal
crops – and the embedded virtual water – are imported instead of producing them
domestically, less domestic water resources have to be used, decreasing the level of
exploitation. Chapagain et al. (2006a) demonstrated that Morocco, for example, is saving
27 km3/yr of its scarce domestic water resources through international trade of
agricultural products. According to a global study by Islam et al. (2007), some 200-‐300
million people less fall into the chronic water shortage category if virtual water flows are
taken into account. I found that most water scarce areas in Central Asia are currently net
virtual water exporters. Inverting their virtual water flows from export to import would
relieve pressure on the areas’ water resources to a certain degree.
While the idea of water saving through international trade of agricultural products is
appealing, in practice water scarcity is rarely the dominant factor behind virtual water
trade. Other important factors, such as availability of land and labour often pay a decisive
role in global trade patterns (e.g. Wichelns, 2004; Chapagain et al, 2006a; Ansink, 2010),
which partly explains why many water scarce areas of the world are net virtual water
exporters (Kumar & Singh, 2005; Chapagain & Hoekstra, 2008). These factors, as well as
economical and political issues, have not been included in this study. It is safe to say that
from a water resources point of view, decreasing the exports and increasing the imports of
agricultural products would improve the situation in water scarce areas of Central Asia.
Whether or not it would be beneficial in broader context, however, depends on other

25
factors, such as resource endowments and
production technologies in the countries encaging
in trade. The question would, therefore, require
further research.
5.2 Future research needs
As discussed briefly in ‘Materials and methods’ -‐
section, the approach for calculating SBA scale
water availability has a significant impact on the
results of the analyses. I compared four different
approaches to calculate WSI and WCI values for
each SBA. Table 4 presents total Central Asian
population under different water scarcity categories
using the four approaches.
Population under some level of water scarcity was
almost the same using discharge proportion, local
runoff and equal sharing approaches, although
there were considerable differences in some of the
water scarcity categories (Table 4). Upstream-‐to-‐
downstream approach gave significantly smaller
values in most categories. With this approach the
total population under some level of water scarcity
was 67%, compared to around 85% using the other
three approaches.
Another factor influencing the results is the spatial
scale of the analyses. Table 5 presents the SBA,
basin and country scale results of population under
different water scarcity categories. Although the
proportion of people under some level of water
scarcity was very similar regardless of the scale,
considerable differences could be seen in the most
extreme categories (Table 5).
The variation in the outcomes of different
approaches shows that it is important to
acknowledge the influence of methodological
Table 4. Population under different w
ater scarcity categories using alternative water availability approaches. N
ote: categories that do not appear in the table equal to 0.

26
choices on the results. This is overlooked in many of the
water scarcity studies, and would require more global scale
analysis. It should also be noted that universally accepted
definition for water scarcity does not exist, thus more
research is needed to clarify the concept and its classification.
Moreover, groundwater resources and water quality
concerns have an impact on the region’s water scarcity.
Especially in many downstream areas contamination and
salinity reduce the volume of usable water resources
(Severskiy, 2004; Törnqvist & Jarsjö, 2011). These issues
should, therefore, be considered in future water scarcity
analyses.
For a more accurate virtual water trade analysis and a better
understanding of its impacts on water scarcity, an estimation
of inter-‐country trade should be included in similar studies
in the future. Inclusion of green water would also be an
interesting addition to the current analyses. Furthermore,
both physical water scarcity and global trade of agricultural
products have developed greatly over the past decades, as
demonstrated by Kummu et al. (2010). A regional historical
analysis of water scarcity and virtual water flows could thus
reveal interesting trends and give a better understanding of
the connection between water scarcity and virtual water
trade in Central Asia.
Tabl
e 5.
Pop
ulat
ion
unde
r di
ffere
nt w
ater
ava
ilabi
lity
cate
gorie
s ca
lcul
ated
at S
BA
, bas
in a
nd c
ount
ry s
cale
. Not
e: c
ateg
orie
s th
at d
o no
t
appe
ar in
the
tabl
e eq
ual t
o 0.

27
6 Conclusions
In this study I assessed the extent and nature of physical water scarcity in Central Asia at
the scale of sub-‐basin areas (SBAs) by using two different indicators for water scarcity,
namely water crowing index (water availability per capita) and water stress index
(consumption-‐to-‐availability ratio). Further, I estimated the net virtual water flows for
each SBA to analyse the impact of virtual water trade on water scarcity in the study area.
I found that demand-‐driven water stress was the dominant type of water scarcity in
Central Asia. Large majority (84%) of the total population (75.4 million) lived in areas that
suffered from demand-‐driven water stress and around a half in areas that also suffered
from population-‐driven water shortage. Alarmingly, 40% of the population lived under
severe water scarcity (over 40% of available water resources are consumed and per capita
water availability is less than 1000 m3/yr). Scarcity was the most widespread in Amu
Darya and Syr Darya river basins.
The impact of virtual water trade on water scarcity was considerable in eight of the 47
SBAs. The affected SBAs were net virtual water exporters and suffered from water scarcity.
Thus, in these areas the elimination of virtual water trade alleviated the serious situation
significantly. Almost a half of the total population of Central Asia live in these eight
affected SBAs, thus the impact of virtual water trade on water scarcity can be considered
significant also at regional scale.
Central Asia is generally perceived as a water scarce region, even though its water
resources are relatively abundant. My results reinforce the view that the actual problem in
the region is not the availability of water resources but its uneven distribution and
excessive use. Currently most areas that use their available water resources excessively
are also large virtual water exporters. These are also the areas where great majority of the
region's population is concentrated, and the pressure on scarce water resources is only
expected to grow in the future due to increasing population. Consequently, there is a real
need for measures to alleviate water scarcity in Central Asia. Such measures have
traditionally included, for example, reducing water use intensity and increasing water use
efficiency. In the current globalised world, however, a great deal of water intensive
products are not consumed at the place of production but traded elsewhere, thus the
wider context of water management cannot be ignored.

28
References
Alcamo, J., Döll, P., Henrichs, T., Kaspar, F., Lehner, B., Rösch, T. & Siebert, S. (2003a) Development and testing of the WaterGAP 2 -‐ global model of water use and availability. Hydrological Sciences Journal, 48, 317.
Alcamo, J., Döll, P., Henrichs, T., Kaspar, F., Lehner, B., Rösch, T. & Siebert, S. (2003b) Global estimates of water withdrawals and availability under current and future “business-‐as-‐usual” conditions. Hydrological Sciences Journal, 48, 339.
Alcamo, J., Flörke, M. & Märker, M. (2007) Future long-‐term changes in global water resources driven by socio-‐economic and climatic changes. Hydrological Sciences Journal, 52, 247-‐275.
Aldaya, M.M., Muñoz, G. & Hoekstra, A.Y. (2010)Water footprint of cotton, wheat and rice production in Central Asia. Value of Water Research Report Series No. 41 Delft: UNESCO-‐IHE institute for Water Education.
Allan, J.A. (1998) Virtual water: a strategic resource global solutions to regional deficits. Ground Water, 36, 545-‐546.
Ansink, E. (2010) Refuting two claims about virtual water trade. Ecological Economics, 69, 2027-‐2032.
Arnell, N.W. (2004) Climate change and global water resources: SRES emissions and socio-‐economic scenarios. Global Environmental Change, 14, 31-‐52.
Aus der Beek, T., Voß, F. & Flörke, M. (2011) Modelling the impact of Global Change on the hydrological system of the Aral Sea basin. Physics and Chemistry of the Earth, Parts A/B/C.
Chapagain, A.K. & Hoekstra, A.Y. (2008) The global component of freshwater demand and supply: an assessment of virtual water flows between nations as a result of trade in agricultural and industrial products. Water International, 33, 19-‐32.
Chapagain, A.K., Hoekstra, A.Y. & Savenije, H. (2006a) Water saving through international trade of agricultural products. Hydrol. Earth Syst. Sci., 10, 455-‐468.
Chapagain, A.K., Hoekstra, A.Y., Savenije, H. & Gautam, R. (2006b) The water footprint of cotton consumption: An assessment of the impact of worldwide consumption of cotton products on the water resources in the cotton producing countries. Ecological Economics, 60, 186-‐203.
Döll, P., Kaspar, F. & Lehner, B. (2003) A global hydrological model for deriving water availability indicators: model tuning and validation. Journal of Hydrology, 270, 105-‐134.

29
Falkenmark, M., Berntell, A., Jägerskog, A., Lundqvist, J., Matz, M. & Tropp, H. (2007)On the Verge of a New Water Scarcity: A Call for Good Governance and Human Ingenuity. SIWI Policy Brief SIWI.
Falkenmark, M. (1997) Meeting water requirements of an expanding world population. Philosophical Transactions of the Royal Society of London. Series B: Biological Sciences, 352, 929 -‐936.
Falkenmark, M., Lundqvist, J. & Widstrand, C. (1989) Macro-‐scale water scarcity requires micro-‐scale approaches. Natural Resources Forum, 13, 258-‐267.
FAO (2003) Technical Conversion Factors for Agricultural Commodities, Food and Agriculture Organization, Rome, Italy.
Faramarzi, M., Yang, H., Mousavi, J., Schulin, R., Binder, C.R. & Abbaspour, K.C. (2010) Analysis of intra-‐country virtual water trade strategy to alleviate water scarcity in Iran. Hydrology and Earth System Sciences, 14, 1417-‐1433.
Hanasaki, N., Inuzuka, T., Kanae, S. & Oki, T. (2010) An estimation of global virtual water flow and sources of water withdrawal for major crops and livestock products using a global hydrological model. Journal of Hydrology, 384, 232-‐244.
Hoekstra, A.Y. (2011) The global dimension of water governance: why the river basin approach is no longer sufficient and why cooperative action at global level is needed. Water, 3, 21-‐46.
Hoekstra, A.Y. & Hung, P.Q. (2005) Globalisation of water resources: international virtual water flows in relation to crop trade. Global Environmental Change Part A, 15, 45-‐56.
Islam, M.S., Oki, T., Kanae, S., Hanasaki, N., Agata, Y. & Yoshimura, K. (2007) A grid-‐based assessment of global water scarcity including virtual water trading. Water Resources Management, 21, 19-‐33.
Klein Goldewijk, K., Beusen, A. & Janssen, P. (2010) Long-‐term dynamic modeling of global population and built-‐up area in a spatially explicit way: HYDE 3.1. The Holocene, 20, 565 -‐573.
Kumar, M.D. & Singh, O.P. (2005) Virtual water in global food and water policy making: Is there a need for rethinking? Water Resources Management, 19, 759-‐789.
Kummu, M. & Varis, O. (2011) The world by latitudes: A global analysis of human population, development level and environment across the north-‐south axis over the past half century. Applied Geography, 31, 495-‐507.
Kummu, M., Ward, P.J., de Moel, H. & Varis, O. (2010) Is physical water scarcity a new phenomenon? Global assessment of water shortage over the last two millennia. Environmental Research Letters, 5, 034006.

30
Mekonnen, M.M. & Hoekstra, A.Y. (2010)The green, blue and grey water footprint of farm animals and animal products, Value of Water Research Report Series No. 48 Delft: UNESCO-‐IHE institute for Water Education.
O’Hara, S. (2000) Central Asia’s water resources: contemporary and future management issues. International Journal of Water Resources Development, 16, 423-‐441.
Ohlsson, L. & Turton, A. (1999)The Turning of a Screw: Social Resource Scarcity as a Bottle-‐neck in adaption to water scarcity. SOAS Occasional Paper No. 19 London: School of Oriental and African Studies, University of London.
Oki, T. & Kanae, S. (2004) Virtual water trade and world water resources. Water Science and Technology, 49, 203-‐209.
Oki, T. & Kanae, S. (2006) Global hydrological cycles and world water resources. Science, 313, 1068-‐1072.
Oki, T., Agata, Y., Kanae, S., Saruhashi, T., Yangg, D. & Musiake, K. (2001) Global assessment of current water resources using total runoff integrating pathways. Hydrological Sciences Journal, 46, 983.
Rijsberman, F. (2005) Water scarcity: Fact or fiction? Agricultural Water Management, 80, 5-‐22.
Rockström, J., Falkenmark, M., Karlberg, L., Hoff, H., Rost, S. & Gerten, D. (2009) Future water availability for global food production: The potential of green water for increasing resilience to global change. Water Resources Research, 45, 16 PP.
Rubel, F. & Kottek, M. (2010) Observed and projected climate shifts 1901-‐2100 depicted by world maps of the Koppen-‐Geiger climate classification. Meteorologische Zeitschrift, 19, 135-‐141.
Severskiy, I.V. (2004) Water-‐related problems of Central Asia: Some results of the (GIWA) international water assessment program. AMBIO: A Journal of the Human Environment, 33, 52-‐62.
Siebert, S. & Döll, P. (2010) Quantifying blue and green virtual water contents in global crop production as well as potential production losses without irrigation. Journal of Hydrology, 384, 198-‐217.
Törnqvist, R. & Jarsjö, J. (2011) Water savings through improved irrigation techniques: basin-‐scale quantification in semi-‐arid environments. Water Resources Management.
UN Comtrade (2010) UN Comtrade, United Nations Commodity Trade Statistics Database, UN Statistics Division, New York. Available at: http://comtrade.un.org/.

31
USGS (2001) Administrative boundaries. Part of Global GIS Database by U.S. Geological Survey (USGS). Available at: http://webgis.wr.usgs.gov/globalgis/.
Varis, O. & Kummu, M. (in press) The vulnerability analysis of Central Asian river basins with a comparison to the major river basins in Asia-‐Pacific. International Journal of Water Resources Development, in press,.
Vörösmarty, C.J. (2000) Global water resources: Vulnerability from climate change and population growth. Science, 289, 284-‐288.
WATCH (2011) EU WATCH -‐ Water and Global Change. Available at: http://www.eu-‐watch.org/.
Water Resources eAtlas (2003) Watersheds of the World-‐CD. IUCN-‐The World Conservation Union, the International Water Management Institute (IWMI), the Ramsar Convention Bureau, and the World Resources Institute (WRI).
Wichelns, D. (2001) The role of “virtual water” in efforts to achieve food security and other national goals, with an example from Egypt. Agricultural Water Management, 49, 131-‐151.
Wichelns, D. (2004) The policy relevance of virtual water can be enhanced by considering comparative advantages. Agricultural Water Management, 66, 49-‐63.
Yang, H. & Zehnder, A. (2001) China’s regional water scarcity and implications for grain supply and trade. Environment and Planning A, 33, 79 – 95.
Yang, H., Wang, L. & Zehnder, A. (2007) Water scarcity and food trade in the Southern and Eastern Mediterranean countries. Food Policy, 32, 585-‐605.

32
Annex I – Materials used in the analysis
Tabl
e A
1. M
ater
ials
use
d in
the
anal
ysis
, pre
sent
ed in
SB
A s
cale
.

33
Annex II – Crop and livestock commodities
Table A2. C
rop and livestock comm
odities and their extraction rates.

34
Annex III – Virtual water trade: Uzbek cotton
Virtual water content of seed cotton (m3/kg harvested) was calculated for each SBA based
on annual production of cotton (kg/yr) and crop specific consumptive blue water use
(m3/yr), as presented in Table A3.
Table A3. Virtual water content of cotton calculated for Uzbek SBAs.
Exports and imports (kg) of 14 cotton products were converted to equivalent amount of
the primary product, i.e. seed cotton, according to specific extraction rates (amount of
processed product obtained from processing the primary product) (see Table A4).
Because seed cotton produces both cotton seed and cotton lint the conversion to primary
product was done separately for cotton seed products and cotton lint products. Only the
product group that resulted in larger amount of the primary product (marked with green
in Table A4) was taken into account to avoid double counting of the amount of primary
product needed to produce the processed products.
Table A4. Exports and imports of cotton commodities converted to equivalent amount of seed cotton. The
converted exports and imports are marked with green. Marked with yellow are the trade flows of fabrics,
for which an additional process water requirement was estimated.
The converted national exports were divided between SBAs in proportion to the
production of cotton and national imports in proportion to the total population of SBAs
(Table A5).

35
Table A5. The converted exports and imports of cotton divided between SBAs.
The processing of cotton fabrics requires a considerable amount of water for bleaching,
dying, printing and finishing. Thus, a process water requirement of 0.36 m3/kg of fabric
was assumed, based on the estimations by Chapagain et al. (2006b). The exports and
imports of fabrics (marked with yellow in Table A4) were divided between SBAs
separately (Table A6) so that the process water requirement could be added in the virtual
water flows of each SBA.
Table A6. Exports and imports of cotton fabrics divided between SBAs.
In the final step of virtual water trade calculations the trade flows of each SBA were
multiplied with the virtual water content of cotton unique to that particular SBA (Table
A7). The process water requirement of fabrics was also added to the virtual water flow of
each SBA (Table A7).
Table A7. Net virtual water imports of each SBA calculated based on SBA specific virtual water content of
cotton, trade flows converted to seed cotton and process water requirement of fabrics.

36
Annex IV – Results in SBA scale
Tabl
e A
8. P
opul
atio
n un
der d
iffer
ent w
ater
sca
rcity
cat
egor
ies,
pre
sent
ed in
SB
A s
cale
. Not
e: c
ateg
orie
s th
at d
o no
t app
ear i
n th
e ta
ble
equa
l to
0.