Embed Size (px)
Citation preview

t h e w o r l d’s l e a d i n g p r ov i d e r o f e b u s i n e s s a p p l i c a t i o n s o f t wa r e
Siebel_AR_for_PDF 7/18/00 4:19 PM Page 1

Siebel Systems is the world’s leading supplier of eBusiness application software.
Siebel_AR_for_PDF 7/18/00 4:19 PM Page 2

Siebel eBusiness enables organizations to serve their customers—anytime, anyplace, any language, any currency—through any communications channel.
Siebel_AR_for_PDF 7/18/00 4:32 PM Page 2
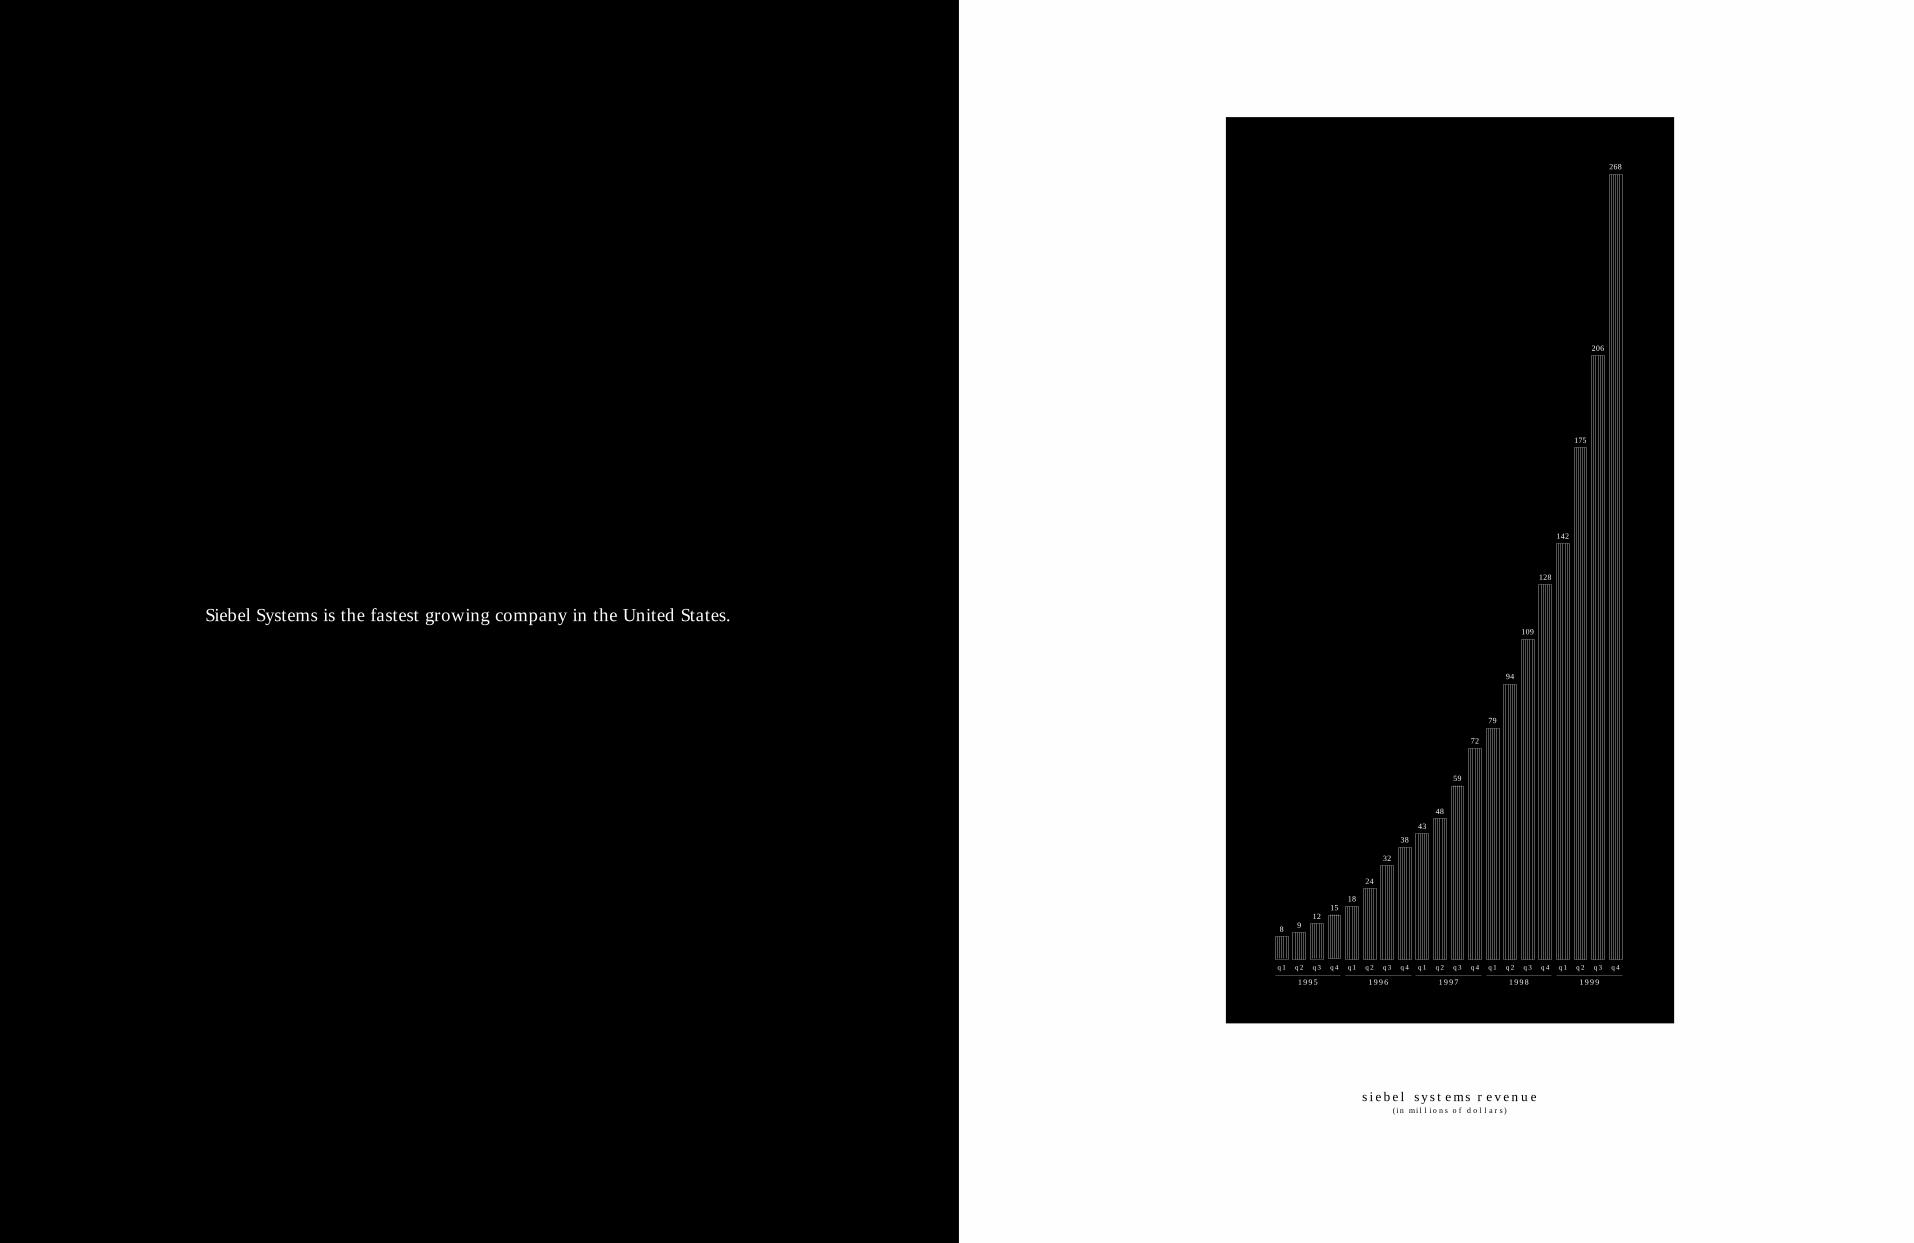
siebel systems revenue(in millions of dollars)
1995 1996 1997 1998 1999
q4
268
q3
206
q2
175
q1
142
q4
128
q3
109
q2
94
q1
79
q4
72
q3
59
q2
48
q1
43
q4
38
q3
32
q2
24
q1
18
q4
15
q3
12
q2
9
q1
8
Siebel Systems is the fastest growing company in the United States.
Siebel_AR_for_PDF 7/18/00 4:19 PM Page 4

We are committed to do whatever it takes to ensure that our customers are 100% successful.
thomas m. siebel
Siebel_AR_for_PDF 7/18/00 4:19 PM Page 6

s i e b e l s y s t e m s , i n c . 1 9 9 9 a n n u a l r e p o r t
8 9
t h o m a s m . s i e b e l
c h a i r m a n a n d c h i e f e x e c u t i v e o f f i c e r
Our sixth full year of operation, 1999, marked another
year of exceptional achievement at Siebel Systems.
We finished the year with revenue of $791 million, an
increase of more than 90 percent from 1998. Fourth quar-
ter 1999 revenue of $268 million put us at a billion-dollar
run rate. Operating margins for the year were 23 percent,
a significant improvement over the 21 percent of 1998.
Cash and short-term investments as of December 31
were $663 million, up from $233 million as of December
31, 1998. The increase in cash represents both the
successful placement of $300 million of convertible deben-
tures as well as $120 million generated from ongoing oper-
ations.
We received tremendous recognition in the media,
including:
• Being named by Fortune Magazine as the fastest grow-
ing public company in America over the past three years.
• Winning the Deloitte & Touche Technology Fast 500
competition, identifying us as the fastest growing public
company in America over the past five years.
• Being named by Intelligent Enterprise magazine as
the world’s most influential company in information
technology.
Our focus on the customer continues to be a core
differentiating factor for Siebel Systems. We added
major customers throughout 1999, ending the year with
well over 1,000 customers. We believe that our customer
satisfaction levels, independently measured, continue to
be the highest in the enterprise software industry.
Our Alliance Program is another key element of our
success, and we significantly strengthened that program
during 1999. We believe that our extremely broad global
alliance with ibm , announced in October, will prove to be
one of the most strategic events in Siebel’s history. This
relationship has the potential to dramatically expand
Siebel’s presence and reach, as our field organizations
work together to sell to, support, and satisfy customers
worldwide.
Our strategic investment in USinternetworking, made
at the end of 1998, increased in value from the $5 million
originally invested to a market value of over $100 million,
as of December 31, 1999. During 1999 we made two
additional strategic investments, and we continue to
evaluate others where we see that a formal relationship
with Siebel Systems will enhance shareholder value.
We have spun out Sales.com, the Web site dedicated
to the needs of the individual sales professional, as a stand
alone, investor-owned company. This will give Sales.com
the independence necessary to succeed in the Internet
world, while allowing Siebel Systems to participate finan-
cially in its success.
We extended our reputation for thought leadership
in eBusiness with the publication of Cyber Rules, and
through the acquisition of OnTarget, Inc., the leading
provider of sales methodology, consulting, and training to
high tech businesses worldwide.
We shipped the current release of the Siebel product
line in June, 1999. This release significantly enhanced
functionality in each of the major existing applications
and introduced our eBusiness suite of applications to
extend the reach of our products to customers, prospects,
and channel partners across the Internet.
s h a r e h o l d e r s , c u s t o m e r s , a n d e m p l o y e e s
m a r c h 3 1 , 2 0 0 0
We more than doubled our regular employee head-
count from approximately 1,500 at year end 1998 to more
than 3,200 at the end of 1999, without compromising the
quality of our employees and with turnover rates below
the industry average.
Finally, one of my key personal objectives for 1999
was to strengthen the management team at Siebel to
be capable of managing a multibillion dollar global
business. With the addition of Paul Wahl as President and
Chief Operating Officer, and with the additions of other
key executives throughout the organization, I feel we now
have the strongest management team in the software
industry.
As we look at the competitive landscape, our position
has never been stronger. We have established ourselves as
the clear market leader in our space. I believe we have
better products, more strategic partners, more satisfied
customers, more productive and dedicated employees,
and stronger management than any current or potential
competitor in the eBusiness market.
As we enter the new millennium, Siebel Systems
has become the world’s leading provider of eBusiness
application software. We have become the second largest
enterprise application software company in the world,
as measured by license revenue. We are recognized as the
fastest growing company in the United States, perhaps the
fastest growing company in the world.
We have a robust and expanding product footprint,
allowing our customers to harness the full power of
the Internet—as well as traditional distribution and
communication channels—to transform themselves into
prospering eBusiness enterprises. We are achieving the
highest levels of customer satisfaction in the software
industry, and we remain committed to do whatever it
takes to assure that each of our customers is successful
with our eBusiness products.
Siebel Systems is a recognized leader in the new
economy and continues to operate with traditional
economic values. We remain steadfast in our commitment
to operate a professionally managed, highly disciplined
company. A company that is prosperous and growing, as
well as cash positive and profitable. A company commit-
ted to achieving the highest levels of customer satisfaction.
A responsible member of the community. A great place to
work. A leader in eBusiness information technology.
We are now focusing our efforts on consolidating
and extending our eBusiness leadership position into the
coming decade.
Siebel_AR_for_PDF 7/18/00 4:19 PM Page 8

Siebel Systems, Inc. was founded in 1993 to address the growing need of organi-
zations of all sizes to acquire, retain, and better serve their customers. Today,
Siebel Systems is the world’s leading provider of eBusiness application software
with more than 3,200 employees who operate in more than 28 countries and 97
offices around the world. In 1999, Siebel Systems was broadly acknowledged
throughout the industry for its business and technology successes. Fortune
Magazine ranked Siebel Systems first among the “100 Fastest Growing
Companies.” Business Week named Thomas M. Siebel one of the “Top 25
Executives of the Year.” InformationWeek included Siebel eBusiness Applications
in the “Ten Most Important Products of 1999.” Intelligent Enterprise Magazine
named Siebel Systems the most influential company shaping the “intelligent
enterprise.” Siebel Systems topped the list of the fastest growing technology
companies in the United States in the “1999 Deloitte & Touche Technology Fast
500,” breaking records with a five-year revenue growth rate of 782,978 percent.
Siebel Systems
Siebel_AR_for_PDF 7/18/00 4:55 PM Page 10

siebel .com applications
Siebel eSales
Siebel eService
Siebel eMarketing
Siebel eMail Response
Siebel eBriefings
Siebel eContent Services
Siebel eChannel
siebel call center applications
Siebel Call Center
Siebel Telesales
Siebel Service
siebel field sales and field service applications
Siebel Sales
Siebel eConfigurator
Siebel Pricer
Siebel Incentive Compensation
Siebel Professional Services
Siebel Field Service
Siebel Handheld
Siebel Voice
Siebel Wireless
siebel channel applications
Siebel eChannel
siebel marketing applications
Siebel Marketing
siebel industry applications
Siebel eApparel and Footwear
Siebel eAutomotive
Siebel eCommunications
Siebel eConsumer Goods
Siebel eEnergy
Siebel eFinance
Siebel eHealthcare
Siebel eInsurance
Siebel ePharma
Siebel ePublic Sector
Siebel eTechnology
siebel ebusiness global services
Siebel Professional Services
Siebel Expert Services
Technical Account Management
Siebel Multichannel Services• Multichannel Consulting • Field Sales Solutions• Partner Solutions• Marketing Solutions
Siebel University• Siebel Customer Education• Siebel End User Education• Siebel Partner Education• Siebel University Learning Portal
Siebel Operational Services• Siebel HelpDesk• SiebelNet
Siebel Technical Support
Products and Services
s i e b e l s y s t e m s , i n c .
Siebel Systems provides the industry’s most comprehensive family of eBusiness
applications and services, enabling organizations to sell to, market to, and service
customers across multiple channels, including the Web, call centers, field, resellers,
retail, and dealer networks. With best-of-class eBusiness application software,
coupled with a broad array of around-the-clock global services, Siebel Systems
delivers a single source of customer information that organizations can
use to tailor offerings to meet the unique needs of each customer. By using
Siebel eBusiness Applications, organizations can develop new customer relation-
ships, serve existing customers profitably, and integrate their systems with those of
their partners, suppliers, and customers, regardless of their locations.
1 2
Siebel_AR_for_PDF 7/18/00 4:19 PM Page 12

consulting
American Management Systems
Andersen Consulting
Cambridge Technology
Partners, Inc.
Cap Gemini, s.a.Compaq Services
Deloitte Consulting, llcDruid Group plc
Ernst & Young, llpibm Global Services
iclKeane, Inc.
lgs Group, Inc.
PricewaterhouseCoopers, llpSiemens Business Services GmbH
& Co. ohg
software and content
Aspect Communications
Attachmate Corporation
BroadVision, Inc.
Dun & Bradstreet, Inc.
i2 Technologies, Inc.
ibm Corporation
lexis-nexis Group
Lucent Technologies, Inc.
Manugistics Group, Inc.
vast Solutions
platform
Applicast, Inc.
Compaq Computer Corporation
Fujitsu Siemens Computers bvibm Corporation
Microsoft Corporation
sitel Corporation
Sun Microsystems, Inc.
Unisys Corporation
USinternetworking, Inc.
resellers
Applicast, Inc.
Corio, Inc.
Great Plains Software, Inc.
ibm Corporation
Itochu Techno-Science Corporation
J.D. Edwards & Company
Structured Intelligence, llc
Global Strategic Alliances
s i e b e l s y s t e m s , i n c .
Siebel Systems continues to expand its eBusiness ecosystem of complementary,value-added products and services by partnering with industry-leading businessand technology providers who share Siebel Systems’ commitment to customer success. These long-term strategic partners contribute best-of-class business andsystem integration, hardware, software, networking, content, support, and training to ensure the successful deployment of Siebel eBusiness Applications to midmarket and enterprise-class customers throughout the world. Siebel Systemsand its partners offer proven applications and trained, certified professionals todeliver the most comprehensive, extensible suite of customer-centric eBusinesssolutions. Siebel Strategic Alliance Partners include the largest and most influentialeBusiness technology leaders.
Siebel Systems continues to expand its eBusiness ecosystem of complementary,value-added products and services by partnering with industry-leading businessand technology providers who share Siebel Systems’ commitment to customer success. These long-term strategic partners contribute best-of-class business andsystem integration, hardware, software, networking, content, support, and training to ensure the successful deployment of Siebel eBusiness Applications to midmarket and enterprise-class customers throughout the world. Siebel Systemsand its partners offer proven applications and trained, certified professionals todeliver the most comprehensive, extensible suite of customer-centric eBusinesssolutions. Siebel Strategic Alliance Partners include the largest and most influentialeBusiness technology leaders.
1 4
Siebel_AR_for_PDF 7/18/00 4:42 PM Page 14

1 9 9 9 a n n u a l r e p o r t
Siebel & IBM
1 7
Siebel Systems and ibm have formed a global strategic alliance that combines
Siebel’s leading eBusiness applications with ibm’s leading eBusiness infrastructure
and expertise. The alliance encompasses collaborative selling worldwide,
software integration, and extensive joint development and integration testing.
With thousands of ibm global sales and service professionals trained on
Siebel eBusiness Applications, the alliance is generating compelling financial
returns and competitive advantages for joint customers globally.
Siebel_AR_for_PDF 7/18/00 4:19 PM Page 16

banking
Banc of America Securities llcBanco Atlántico
Bank of America Corporation
Bank One Services Corporation
Barclays Bank plc
Chancellor lgt Asset
Management, Inc.
The Chase Manhattan
Corporation
Citicorp International
Technology, Inc.
Dresdner Bank agFirst usa Bank, n.a.First Union Corporation
Firstplus Bank
FleetBoston Financial Corporation
Frank Russell Company
Grupo Bolívar
Harris Trust and Savings Bank
National City Corporation
Nykredit a/sRoyal Bank of Canada
Toronto Dominion
Asset Management
U.S. Bancorp Information
Services, Inc.
brokerage
Charles Schwab & Co., Inc.
Merrill Lynch, Pierce,
Fenner & Smith, Inc.
OppenheimerFunds, Inc.
Quick & Reilly, Inc.
Salomon Smith Barney, Inc.
Scudder Kemper Investments, Inc.
Van Kampen American
Capital, Inc.
.com
Stamps.com Corporation
Excite@Home Corporation
Flashcom, Inc.
hsn General Partner llcjobs.com Ltd.
LoanCity.com, Inc.
Monster.com, Inc.
Qwest Cyber.Solutions llcWomen.com Networks, Inc.
Yahoo! Inc.
communications
at&t Corporation
Bell Canada
BellSouth Corporation
Bouygues Telecom s.a.British Broadcasting Corporation
British Telecommunications plc
Cable & Wireless
Communications
Deutsche Telekom agFrance Télécom Mobiles Services
gte Wireless, Inc.
Infostrada
Lucent Technologies, Inc.
mci WorldCom, Inc.
Nokia Corporation
Paging Network, Inc.
Qwest Communications
International, Inc.
Telecom Italia Mobile
Telenor Mobil a.s.Telstra Corporation Ltd.
us west, Inc.
computers
3Com Corporation
Acer America Corporation
American Power Conversion
Corporation
Compaq Computer Corporation
emc Corporation
Fujitsu Business Communication
Systems
Hewlett-Packard Company
Hitachi Computer Products
IBM Corporation
Packard Bell nec, Inc.
Siemens agSilicon Graphics, Inc.
Sun Microsystems, Inc.
Toshiba Corporation
Unisys Corporation
consumer goods
3m Corporation
The Dial Corporation
Hershey Foods Corporation
Kellogg Company
Murphy Brewery Ireland Ltd.
Nestle usa, Inc.
Pepsico, Inc.
The Perrier Group
Quaker Oats Company
electronics
Altera Corporation
lsi Logic Corporation
Mitsubishi Electric Corporation
entertainment
Princess Cruises
Universal City Studios, Inc.
Warner Brothers
finance
Groupama s.a.The Nasdaq Stock Market
Sotheby’s, Inc.
insurance
aiu/aigAmerican General Corporation
American Re-Insurance Co.
Blue Cross Blue Shield
of Colorado
Cigna Corporation
Country Companies Services, Inc.
Farmers Insurance Group
of America
ge Financial Insurance
The Great-West Life
Assurance Company
The Hartford Financial
Services Group, Inc.
John Hancock Financial
Services, Inc.
Manulife Financial Corporation
Metropolitan Life Insurance
Company (MetLife)
Mutual of Omaha Companies
Nationwide Insurance Companies
New England Financial
The Northwestern Mutual
Life Company
Old Mutual plc
Prudential plc
The Prudential Insurance
Company of America
The Variable Annuity Life
Insurance Company
Winterthur Group
manufacturing
The Boeing Company
DaimlerChrysler Corporation
Ford Motor Company
General Motors Corporation
Honeywell International, Inc.
Lockheed Martin Corporation
Marvin Windows and Doors
Otis Elevator Co.
Pitney Bowes, Inc.
Renault s.a.
Rockwell International
Corporation
Saturn Corporation
Southwire Company
Volvo Group
pharmaceuticals
Abbott Laboratories
basf Corporation
Bayer agBristol-Myers Squibb Company
Glaxo-Wellcome, Inc.
Knoll Pharmaceutical Company
Merck & Company, Inc.
Janssen Pharmaceutica, Inc.
Johnson & Johnson Ltd.
Parke-Davis
SmithKline Beecham
retail
Compusa, Inc.
The j.c. Penney Company, Inc.
Kmart Corporation
Nike, Inc.
Nordstrom, Inc.
software
America Online, Inc.
bmc Software, Inc.
Dun & Bradstreet, Inc.
Cadence Design Systems, Inc.
Genesys Communications
Laboratories, Inc.
Informix Corporation
j.d. Edwards & Company
Mentor Graphics Corporation
Microsoft Corporation
Novell, Inc.
Software ag - Spain
Software ag, Inc. -
North America
transportation
apl Ltd.
dhl International Ltd.
utilities
Advanced Planning Systems, Inc.
American Electric Power
Company, Inc.
Enron Corporation
FirstEnergy Corporation
Williams Energy Services
Yorkshire Electricity Group plc
s i e b e l s y s t e m s , i n c .
1 8
Customers
Siebel eBusiness Applications are the standard for market-leading companies
around the world, including: Ford Motor Company; The Charles Schwab
Corporation; Farmers Insurance Group of Companies; Nationwide Insurance
Companies; Dresdner Bank ag; American Express Company; PepsiCo, Inc.;
Lucent Technologies, Inc.; Yahoo! Inc.; mci WorldCom, Inc.; and British Telecom
Wholesale Services & Solutions. Spanning diverse industries and geographies,
Siebel customers represent organizations of all sizes that are known globally for
delivering the highest levels of customer satisfaction in their respective industries.
Siebel_AR_for_PDF 7/18/00 4:37 PM Page 18
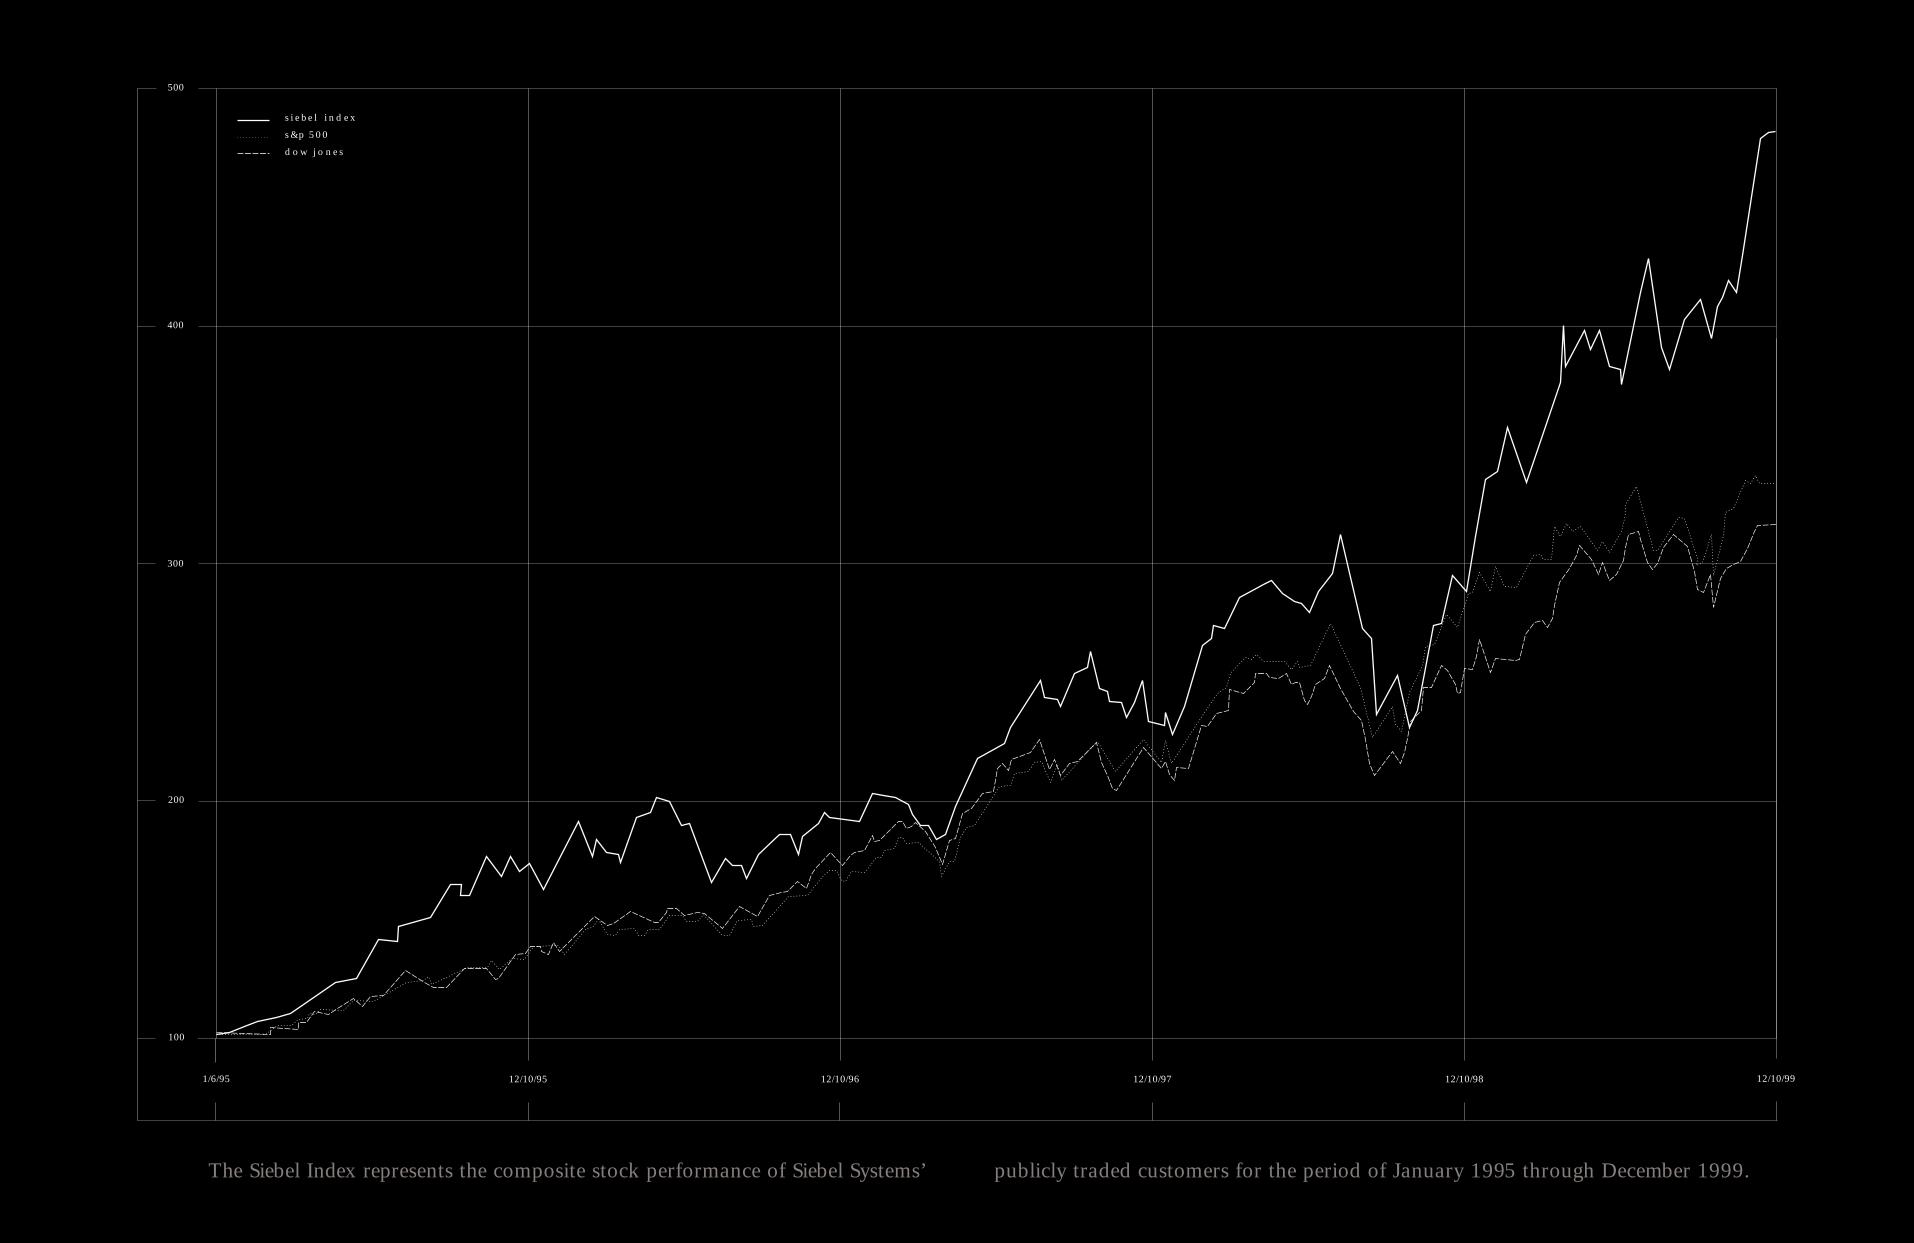
100
200
400
300
500
1/6/95 12/10/95
siebel index
s&p 500
dow jones
12/10/96 12/10/97 12/10/98 12/10/99
publicly traded customers for the period of January 1995 through December 1999.The Siebel Index represents the composite stock performance of Siebel Systems’
Siebel_AR_for_PDF 7/18/00 4:19 PM Page 20

revenuegrowth
+15%
customersatisfaction
+21%
employeeproductivity
gains
+20%
b a s e d o n r e s p o n s e s t o t h e a u g u s t 1 9 9 9 c u s t o m e r
s a t i s f a c t i o n s u r v e y d i r e c t e d t o c u s t o m e r s w i t h
f u l l y d e p l o y e d s i e b e l e b u s i n e s s a p p l i c a t i o n s .
s i e b e l s y s t e m s , i n c .
2 2
Exceptional Revenue andProductivity Gains
Surveyed by a leading market research firm, Siebel Systems’ customers were askedto quantify the actual impact of using Siebel eBusiness Applications. On average,Siebel eBusiness customers report exceptional revenue and productivity gains.Revenue growth of 15%. Customer satisfaction increases of 21%. Employee productivity gains of 20%. And, a return on Siebel application investments withinan average of 10 months.
Siebel_AR_for_PDF 7/18/00 4:19 PM Page 22

2 5
British Telecom Wholesale Services & Solutions, a leader in the rapidly growing
wholesale communications market, selected Siebel eBusiness Applications
to better serve its customers and streamline its workflow and order processing
systems. By using Siebel eBusiness Applications, British Telecom Wholesale
Services & Solutions has united its sales, service, and marketing infrastructure in
a single, comprehensive, multichannel eBusiness system that integrates the Web,
telephone, and email. British Telecom Wholesale Services & Solutions is relying
on Siebel eBusiness Applications to support the estimated 2.1 million transactions
the company projects it will handle in 2001.
1 9 9 9 a n n u a l r e p o r t
w h o l e s a l e s e rv i c e s & s o l u t i o n s
British Telecom
Siebel_AR_for_PDF 7/18/00 4:19 PM Page 24

s t u a r t h o r w o o d , d i r e c t o r , b t w h o l e s a l e s e r v i c e s & s o l u t i o n s
Siebel_AR_for_PDF 7/18/00 4:19 PM Page 26

Siebel_AR_for_PDF 7/18/00 4:19 PM Page 28

3 0
s i e b e l s y s t e m s , i n c .
Dresdner Bank has long focused on customer care and service and in developing
innovative technology solutions that place the customer at the heart of its sales
and service activities. The bank standardized on Siebel eBusiness Applications
to consolidate its customer information. With Siebel eBusiness Applications,
Dresdner Bank capitalizes on information captured during each customer interac-
tion, enabling its financial service agents to recommend the best combination of
products and services, resulting in significantly higher levels of customer satisfac-
tion and loyalty.
Dresdner Bank
Siebel_AR_for_PDF 7/18/00 4:19 PM Page 30

w o l f g a n g d a m b m a n n , s e n i o r g e n e r a l m a n a g e r , h e a d o f c o r p o r a t e s a n d i n s t i t u t i o n s , d r e s d n e r b a n k
Siebel_AR_for_PDF 7/18/00 4:19 PM Page 32

1 9 9 9 a n n u a l r e p o r t
Yahoo! has built one of the most recognized brands on the Internet today
by creating a strong sense of community and long-term loyalty among its
customers. Siebel eBusiness Applications will enable Yahoo! to track new
co-marketing opportunities from the moment they enter the company, regardless
of their origin: the Web, a phone call, or any other source. By deploying
Siebel eBusiness Applications, Yahoo! will increase cross-team collaboration and
simplify the process of designing the advertising and promotional programs that
best meet each customer’s unique requirements.
Yahoo!
3 5t i m k o o g l e , c h a i r m a n a n d c e o , y a h o o !
Siebel_AR_for_PDF 7/18/00 4:19 PM Page 34

Siebel_AR_for_PDF 7/18/00 4:19 PM Page 36

1 9 9 9 a n n u a l r e p o r t
Saturn is recognized throughout the automotive industry for providing its
customers with highly satisfying sales and service experiences. Saturn is building
on this reputation by deploying the industry’s first customer-driven retail
system, to be used by an estimated 15,000 Saturn retail team members who work
in more than 400 retail facilities nationwide. Siebel eBusiness Applications
provide a common information system to help Saturn’s retailers increase coordi-
nation, communication, and collaboration across their sales, marketing, and
customer service departments. With Siebel eBusiness Applications, Saturn
enhances retailer customer relationships, improves service and support, and
enables them to conduct business through any channel they choose, including face-
to-face, via the Web, and over the telephone.
Saturn
3 9
Siebel_AR_for_PDF 7/18/00 4:19 PM Page 38

Siebel_AR_for_PDF 7/18/00 4:19 PM Page 40

Siebel_AR_for_PDF 7/18/00 4:19 PM Page 42

1 9 9 9 a n n u a l r e p o r t
ibm standardized on and is deploying Siebel eBusiness Applications across its
entire customer-facing infrastructure, uniting sales, service, marketing, and call
center professionals, including third-party business partners and their Web sites.
Serving more than 55,000 internal ibm users, 30,000 business partners, and
millions of customers directly over the Web, Siebel eBusiness Applications support
ibm’s strong commitment to providing the industry’s highest levels of customer
satisfaction across all of its lines of business and channels.
IBM
4 5
Siebel_AR_for_PDF 7/18/00 4:19 PM Page 44

s t e p h e n m . w a r d , v i c e p r e s i d e n t , b u s i n e s s t r a n s f o r m a t i o n a n d c i o , i b m c o r p o r a t i o n
Siebel_AR_for_PDF 7/18/00 4:55 PM Page 46

Siebel_AR_for_PDF 7/18/00 4:19 PM Page 48

f i n a n c i a l d a t a
s e l e c t e d f i n a n c i a l d a t a 5 3
m a n a g e m e n t ’ s d i s c u s s i o n a n d a n a l y s i s 5 4
c o n s o l i d a t e d b a l a n c e s h e e t s 6 0
c o n s o l i d a t e d s t a t e m e n t s o f o p e r a t i o n s 6 1
c o n s o l i d a t e d s t a t e m e n t s o f s t o c k h o l d e r s ’ e q u i t y 6 2
c o n s o l i d a t e d s t a t e m e n t s o f c a s h f l o w s 6 4
n o t e s t o c o n s o l i d a t e d f i n a n c i a l s t a t e m e n t s 6 5
i n d e p e n d e n t a u d i t o r s ’ r e p o r t 7 7
s e l e c t e d q u a r t e r l y f i n a n c i a l d a t a 7 8
c o r p o r a t e i n f o r m a t i o n 7 9
1 9 9 9 a n n u a l r e p o r t
5 1
board of directors
Thomas M. Siebel
Chairman and Chief Executive Officer
Siebel Systems, Inc.
James C. Gaither, Esq.
Partner
Cooley Godward llp
Eric E. Schmidt, Ph.D.
Chairman and Chief Executive Officer
Novell, Inc.
Charles R. Schwab
Chairman and Co-chief Executive Officer
The Charles Schwab Corporation
George T. Shaheen
Chief Executive Officer
Webvan Group, Inc.
A. Michael Spence, Ph.D.
Former Dean, Graduate School of Business
Stanford University
standing, from left: Charles R. Schwab, Eric E. Schmidt, Ph.D., George T. Shaheen
sitting, from left: A. Michael Spence, Ph.D., James C. Gaither, Esq.
s i e b e l s y s t e m s , i n c .
5 0
Siebel_AR_for_PDF 7/18/00 5:07 PM Page 50

-----BEGIN PRIVACY-ENHANCED MESSAGE----- Proc-Type: 2001,MIC-CLEAR Originator-Name: [email protected] Originator-Key-Asymmetric: MFgwCgYEVQgBAQICAf8DSgAwRwJAW2sNKK9AVtBzYZmr6aGjlWyK3XmZv3dTINen TWSM7vrzLADbmYQaionwg5sDW3P6oaM5D3tdezXMm7z1T+B+twIDAQAB MIC-Info: RSA-MD5,RSA, C4bfNKtlaTBqDeYhfVzMYcp8T8Xgmg/uqnihcGpVSEKK5r620G3HuSAVcb0a+Ewd 4OOSpVQ2h2HiUCEY1yppJg== 0001006835-00-000024.txt : 20030317 0001006835-00-000024.hdr.sgml : 20000411 ACCESSION NUMBER: 0001006835-00-000024 CONFORMED SUBMISSION TYPE: 10-K PUBLIC DOCUMENT COUNT: 12 CONFORMED PERIOD OF REPORT: 19991231 FILED AS OF DATE: 20000329 FILER: COMPANY DATA: COMPANY CONFORMED NAME: SIEBEL SYSTEMS INC CENTRAL INDEX KEY: 0001006835 STANDARD INDUSTRIAL CLASSIFICATION: SERVICES-PREPACKAGED SOFTWARE [7372] IRS NUMBER: 943187233 STATE OF INCORPORATION: DE FISCAL YEAR END: 1231 FILING VALUES: FORM TYPE: 10-K SEC ACT: 1934 Act SEC FILE NUMBER: 000-20725 FILM NUMBER: 581747 BUSINESS ADDRESS: STREET 1: 1885 SOUTH GRANT STREET CITY: SAN MATEO STATE: CA ZIP: 94402 BUSINESS PHONE: 6502955000 MAIL ADDRESS: STREET 1: 1885 SOUTH GRANT STREET CITY: SAN MATEO STATE: CA ZIP: 94402 10-K 1 FOR FISCAL YEAR END DECEMBER 31, 1999
UNITED STATES SECURITIES AND EXCHANGE COMMISSION
Washington, D.C. 20549
FORM 10-K
[X] ANNUAL REPORT PURSUANT TO SECTION 13 OR 15(d) OF THE SECURITIES EXCHANGE ACT OF 1934
For the fiscal year ended December 31, 1999
OR
[ ] TRANSITION REPORT PURSUANT TO SECTION 13 OR 15(d) OF THE SECURITIES EXCHANGE ACT OF 1934
For the transition period from ________to _________
Commission File Number: 0-20725
SIEBEL SYSTEMS, INC.
(Exact name of registrant as specified in its charter)
Delaware 94-3187233 (State or Other Jurisdiction of Incorporation or Organization) (IRS Employer Identification Number)

1855 South Grant Street San Mateo, CA 94402
(Address of principal executive offices, including zip code)
(650) 295-5000 (Registrant's telephone number, including area code)
Indicate by check mark whether the registrant (1) has filed all reports required to be filed by Section 13 or 15 (d) of the Securities Exchange Act of 1934 during the preceding 12 months (or for such shorter period that the registrant was required to file reports), and (2) has been subject to such filing requirements for the past 90 days. YES [X] NO [ ]
Indicate by check mark if disclosure of delinquent filers pursuant to Item 405 of Regulation S-K is not contained herein, and will not be contained, to the best of the registrant's knowledge, in definitive proxy or information statements incorporated by reference in Part III of the Form 10-K. [ ]
The aggregate market value of the voting stock held by non-affiliates of the registrant, based on the closing sale price of the Common Stock on February 10, 2000 as reported on the Nasdaq National Market was approximately $13,578,741,895. Shares of Common Stock held by each current executive officer and director and by each person who is known by the registrant to own 5% or more of the outstanding Common Stock have been excluded from this computation in that such persons may be deemed to be affiliates of the Company. Share ownership information of certain persons known by the Company to own greater than 5% of the outstanding common stock for purposes of the preceding calculation is based solely on information on Schedule 13G filed with the Commission and is as of December 31, 1999. This determination of affiliate status is not a conclusive determination for other purposes.
The number of shares outstanding of the registrant's Common Stock, par value $.001 per share, as of February 10, 2000, was 195,969,654.
SIEBEL SYSTEMS, INC. FOR THE FISCAL YEAR ENDED DECEMBER 31, 1999
TABLE OF CONTENTS
PART I
Item 1. Business
Item 2. Properties
Item 3. Legal Proceedings
Item 4. Submission of Matters to a Vote of Security Holders
PART II

Item 5. Market for Registrant's Common Stock and Related Stockholder Matters
Item 6. Selected Financial Data
Item 7. Management's Discussion and Analysis of Financial Condition and Results of Operations
Item 7A. Quantitative and Qualitative Disclosure About Market Risks
Item 8. Financial Statements and Supplementary Data
Item 9. Changes in and Disagreements with Accountants on Accounting and Financial Disclosure
PART III
Item 10. Directors and Executive Officers of the Registrant
Item 11. Executive Compensation
Item 12. Security Ownership of Certain Beneficial Owners and Management
Item 13. Certain Relationships and Related Transactions
PART IV
Item 14. Exhibits, Financial Statement Schedules and Reports on Form 8-K
SIGNATURE
Documents Incorporated By Reference
Portions of the registrant's Proxy Statement for its 2000 Annual Stockholders Meeting are incorporated by reference in Part III hereof.
PART I
The statements contained in this annual report on Form 10-K that are not historical are forward-looking statements within the meaning of Section 27A of the Securities Act of 1933, as amended and Section 21E of the Securities Exchange Act of 1934, as amended, including statements regarding our expectations, beliefs, intentions or strategies regarding the future. Forward-looking statements include statements regarding the extent and timing of future revenues and expenses and customer demand, statements regarding the deployment of our products, and statements regarding reliance on third parties. All forward-looking statements included in this document are based on information available to us as of the date hereof, and we assume no obligation to update any forward-looking statement. It is important to note that our actual results could differ materially from those in forward-looking statements as a result of many factors, including those discussed under the heading "Risk Factors" and elsewhere in this report.
Item 1. Business

Overview
Siebel Systems is the world's leading provider of eBusiness applications. Siebel eBusiness Applications enable organizations to sell to, market to, and service their customers across multiple channels, including the Web, call centers, field, resellers, retail, and dealer networks. By employing comprehensive eBusiness applications to better manage their customer relationships, our customers continue to be leaders in their markets.
Siebel eBusiness Applications are available in industry-specific versions designed for the pharmaceutical, healthcare, consumer goods, telecommunications, insurance, energy, apparel and footwear, automotive, technology, public sector, and finance markets. With best-of-class functionality of eBusiness software, Siebel eBusiness Applications enable organizations to create a single source of customer information that sales, service, and marketing professionals can use to tailor product and service offerings to meet each of their customer's unique needs. By using Siebel eBusiness Applications, organizations can develop new customer relationships, profitably serve existing customers, and integrate their systems with those of their partners, suppliers, and customers, regardless of location.
Our customers are known for delivering the highest levels of quality in their products and services and for their commitment to maintaining the highest levels of customer satisfaction. Spanning diverse industries and locations, Siebel eBusiness Applications customers represent organizations of all sizes.
Through global strategic alliances with industry-leading organizations, we continue to enhance Siebel eBusiness Applications, ensuring that we continue to fully support our customers' rapidly evolving technology requirements and industry best practices today and in the future.
Products
Siebel eBusiness 99.6, released in September 1999, is the industry's most comprehensive suite of Web-based eBusiness application software. Siebel eBusiness provides organizations with one view of the customer across multiple distribution channels including the Web, call center, field sales and service, resellers, partners, and dealer channels. Our Web-based architecture and diverse product offerings are designed to provide support for sales, marketing and customer service organizations and seamlessly unites the organization's partners, resellers and customers in one global information system.
Siebel Sales
Siebel Sales is designed to allow teams of sales and marketing professionals to manage sales information throughout the entire sales cycle. This core application includes the Opportunity Management, Account Management, Contact Management, Activity Tracking, Message Broadcasting, Siebel Search, Quotas and Incentives modules.
Siebel Sales options, as of December 31, 1999, include Siebel Quotes, Siebel Revenue Forecasting, Siebel Product Forecasting, Siebel Proposal, Siebel Presentations, Siebel Campaigns, Siebel Sales Assistant, Siebel Target Account Selling, Siebel Customer Service Integration, Siebel Configurator, Siebel Product Configuration Integration Object and Siebel Sales Handheld.
Siebel Service
Siebel Service enables teams of customer service, sales and marketing professionals to help ensure complete customer satisfaction by using closed-loop, service request management capabilities. The base application includes the Service Request Management, Account Management, Asset Tracking, Contact Management, Activity Tracking, Message Broadcasting, Solution Management and Siebel Search modules.

Siebel Service options, as of December 31, 1999, include Siebel Service Assistant, Siebel Quality Management and Siebel eMail Response.
Siebel Field Service
Siebel Field Service extends upon Siebel's customer service solution and provides field engineers with service functionality for entitlement/contracts management, integration with other customer facing departments, dispatch and scheduling, parts management and repair center operations. Siebel Field Service provides a complete solution for the mobile technician as well as the connected service agent.
Siebel Field Service options, as of December 31, 1999, include Siebel Service Inventory, Siebel Shipping/Receiving, Siebel Logistics Manager, Siebel Repair, Siebel Service Assistant, Siebel Quality Management and Siebel eMail Response.
Siebel Call Center
Siebel Call Center provides blended Sales and Service functionality that enables call center agents to provide both sales and customer service assistance to customers. It accesses the power of Siebel Sales and Service Enterprise to integrate all available customer information. This allows each service request to result in additional sales opportunities and provides integrated sales and service histories for each opportunity. This base application includes the Opportunity Management, Service Request Management, Account Management, Asset Tracking, Contact Management, Activity Tracking, Message Broadcasting, Solution Management and Siebel Search modules.
Siebel Call Center options, as of December 31, 1999, include all of the options available for both Siebel Sales and Siebel Service.
Siebel Marketing
The Siebel Marketing is designed to allow marketing professionals, sales and service managers and business analysts to monitor overall company performance and the effectiveness of company programs and activities. Siebel Marketing is designed to extract information from Siebel Sales Enterprise, Siebel Service Enterprise and Siebel Call Center into a customer data mart, designed for fast data analysis. Siebel Marketing is designed to include a broad range of pre-built analyses about customers, sales pipeline, customer service, competitors, campaigns and products, allowing managers and analysts to drill down into key operational details. Siebel Marketing also includes powerful database marketing capabilities that allow marketing professionals to immediately develop multi-level campaigns that are tailored to target specific market segments.
General Product
General product options are typically available on any of the Siebel eBusiness base applications and as of December 31, 1999, include Siebel Thin Client, Siebel Encyclopedia, Siebel Office, Siebel Calendar, Siebel Reports, Siebel Expense Reporting, Siebel Executive Information System, Siebel Incentive Compensation, Siebel Order Entry, Siebel Contracts, Siebel Campaigns, Siebel SmartScript, Siebel CTI, Siebel CTI Connect, Siebel Remote, Siebel Anywhere, Siebel Workflow Manager, Siebel Assignment Manager, Siebel Data Quality, Siebel Professional Services, Siebel Resource Assignment, Siebel Time Management and Reporting, Siebel Agreements, Siebel Distance Learning and Siebel Advanced Search.
Siebel .COM Applications
Siebel .COM Applications allows organizations to interact directly with prospects, customers and partners over the Internet. Using Siebel ..COM Applications, organizations can rapidly deploy scalable, secure and Web-based applications for acquiring, growing and retaining customers. Siebel .COM Applications include Siebel eSales, Siebel eMarketing, Siebel eService, Siebel eChannel, Siebel eBriefings, and Siebel eMail Response.

Siebel eSales. Siebel eSales is a Web-based application which supports unassisted business-to-business and business-to-consumer selling over the Web. Siebel eSales includes a visual product catalog, Web-based quote generation, self-service solution configuration and on-line ordering. Siebel eSales options, as of December 31, 1999, include Siebel eShopping Basket, Siebel eCatalog, Siebel eConfigurator and Siebel eOrders.
Siebel eMarketing. Siebel eMarketing enables enterprises to create, execute and assess Web-based marketing campaigns. With Siebel eMarketing, enterprises segment their customers and prospects; target them with a personalized, automatically generated Web- or email-based promotions; and create graphical reports to assess the effectiveness and return- on-investment of the campaign.
Siebel eService and Siebel eMail Response. Through Web- and email-based service automation, Siebel eService and Siebel eMail Response allow organizations to manage the entire service process and to provide world-class customer service and support via the Internet.
Siebel eChannel. Siebel eChannel allows organizations to turn their partners, distributors, resellers, and dealers into a virtual sales and service network. By using Siebel eChannel, organizations can be linked to their business partners over the Internet, allowing business partners to better communicate with the parent organization, sell more, and increase customer satisfaction.
Siebel eBriefings. Siebel eBriefings allows organizations to provide customized Web-based personalized briefings to sales professionals, partners and resellers over the Web. Briefings include key customer information including opportunities, accounts and contacts and on-line content such as news and company profiles.
Siebel Industry Applications
Our products are available in industry-specific versions, all with similar functionality, but each specifically designed for a particular industry. Examples of our industry applications include:
● Siebel eFinance
● Siebel eInsurance
● Siebel eCommunications
● Siebel ePharma
● Siebel eConsumer Goods
● Siebel eEnergy
Product Development Expense
During 1999, 1998 and 1997, the Company had product development expenses of approximately $72.9 million, $44.0 million, and $26.7 million, respectively.
Professional Services
We provide implementation consulting and other technical services to license customers through our worldwide professional services organization. We provide these services in connection with similar services provided by certain global alliance partners to provide the customer with the full array of services necessary to install, integrate, customize and deploy

Siebel eBusiness Applications.
Customer Support and Training
We offer a comprehensive, multi-tiered, integrated family of global support programs designed to ensure successful implementation and customer satisfaction. These programs include maintenance, technical support, professional services and customer communications, as well as extensive educational offerings. Our educational offerings include technical training, end user training, and advanced sales training.
Marketing and Sales
In the United States, we market and sell our products and services through our direct sales and services organization, and through channel partners including Great Plains, J.D.Edwards and others. Our sales and service professionals are located in 44 offices throughout the United States. In addition, we employ sales and service professionals in 37 offices outside of the United States, selling our products primarily through direct sales and services organization in the countries where we have an office. We also market and sell our products through distributors, primarily in Japan, Latin America, South Africa and Asia.
Our ability to achieve significant revenue growth in the future will depend in large part on how successfully we recruit, train and retain sufficient direct sales, technical and customer support personnel, and how well we continue to establish and maintain relationships with our strategic partners. We believe that the complexity of our products and the large scale deployments anticipated by our customers will require a number of highly trained customer support personnel.
The following key elements comprise our marketing and sales strategy:
Target Large Multinational Customers in a Broad Range of Industries
Our customer base consists of a significant number of large multinational companies. Siebel eBusiness Applications' Web-based architecture supports the complex needs of even the largest global organizations. We intend to leverage our experience and continue to target sales and marketing activities through our direct sales force and channel partners to expand worldwide market acceptance of Siebel eBusiness Applications.
Maintain and Extend Advanced Technology Position
We provide what we believe to be the industry's most comprehensive family of multichannel eBusiness applications, enabling organizations to sell to, market to, and service customers across multiple channels, including the Web, call centers, field, resellers, retail, and dealer networks. Siebel eBusiness Applications enable organizations to manage, synchronize, and coordinate their customer touchpoints. Utilizing advanced information technology, Siebel eBusiness Applications are built on a component-based architecture that provides a broad range of functionality for eBusiness applications deployments.
We intend to continue investing substantial resources in technological research and developments, such as:
Proven, Component-based Architecture: The Siebel eBusiness architecture includes Siebel Remote, one of the industry's most scalable data synchronization technologies for mobile clients and server-to-server replication; Siebel Workflow Manager, which allows organizations to visually model business processes and apply workflow automation rules across all channels of distribution; Siebel Tools, a visual development toolset that allows organizations to customize their user interface, business rules, and data; and Siebel EAI, which provides pre-built integration with leading middleware products and industry-specific back office products.
Support for Multiple Computing Platforms: To enable immediate access to key customer information, Siebel eBusiness Applications can operate on multiple computing platforms used by organizations, including mobile clients, connected clients, thin clients, and handheld clients.

Web-based Architecture: The Siebel eBusiness Applications product architecture is entirely Web-based and designed for fast performance. Siebel eBusiness Applications are capable of operating within a standard Web browser as thin clients, with no Siebel Systems software installed on the client computing device. This technology contributes to a dramatic reduction of the costs of deploying Siebel eBusiness Applications by nearly eliminating client software distribution costs.
Full Life Cycle Management: Siebel eBusiness Applications technology also makes it easier for organizations to manage the full application deployment life cycle. Automatic Siebel application upgrades and remote software distribution contribute to a dramatic reduction of the costs associated with deploying software and help to ensure the success of the deployment.
The Siebel eBusiness Applications product architecture enables organizations to configure their Siebel eBusiness Applications once and then deploy that same configuration to all their users. Once an organization makes customizations to the underlying objects, the customizations can operate automatically across nearly all types of client computing devices. This technology is designed to provide significant cost savings in deployment and implementation costs, and assures consistency across customer-facing channels.
Global Market Support: We designed and built Siebel eBusiness Applications to support global deployments, including most major European and Asian languages. Siebel eBusiness Applications support both single and double byte characters, multiple currencies, automatic currency conversions including the ENU standards for supporting the euro and real-time interfaces to accept new exchange rates from leading online services.
Siebel eBusiness Applications provide support for multiple organizations, allowing companies to define different organizational structures to manage data visibility, security, and business processes across both centralized and decentralized deployment topologies.
Global Strategic Alliances
Having long recognized the power and value of strategic partnerships, one of our key strengths is our ability to develop and maintain long-term global strategic partnerships with the largest and most influential corporations in the technology marketplace, including IBM, Microsoft and Sun.
We have partnered with best-of-class business and system integrators, hardware, software, support, and training partners to help ensure the successful deployment of Siebel eBusiness Applications. These strategic global partnerships with industry leaders help ensure that we deliver solutions that meet our global customers' sales, marketing, and customer service requirements. We believe these partnerships enable us to deliver the comprehensive suite of eBusiness solutions to our customers.
Siebel Systems' partners include the following industry leaders:
System Integrator Software Platform
Andersen Consulting Ariba Compaq
Cap Gemini BroadVision IBM
Deloitte & Touche IBM Lucent
Ernst & Young Lucent Sun Microsystems
IBM Microsoft Unisys
ICL Sun Microsystems USi
PricewaterhouseCoopers

Siemens Business Services
Successful Customer Implementations
Our success depends on our customers' successful implementations of Siebel eBusiness Applications. As a result, we actively support the customer's deployment efforts by providing Internet and telephone technical support, and comprehensive instructor-led training, and assigning an account management team to each customer that consists of a sales representative, a technical account manager, and an executive sponsor.
Expand Global Sales Capabilities
We currently have operations in Australia, Austria, Belgium, Brazil, Canada, Colombia, Denmark, Finland, France, Germany, Hong Kong, Ireland, Italy, Japan, Mexico, the Netherlands, Norway, Portugal, Scotland, Singapore, Spain, Sweden, Switzerland, the United Kingdom, and the United States, and have introduced localized versions of Siebel eBusiness Applications for major European and Asian markets. We intend to further expand our global sales and marketing capabilities by increasing the size of our direct sales and marketing organizations in major markets, and by continuing to develop our channel partner relationships. As market conditions warrant, we intend to increase our direct sales and marketing activities worldwide.
During each of 1999, 1998, and 1997, no individual customer accounted for more than 10% of revenues. Export sales for 1999, 1998, and 1997 were $157.3 million, $88.2 million and $41.8 million, respectively. This represented 31%, 30%, and 27% of total license revenues in 1999, 1998 and 1997, respectively.
Acquisitions
In December 1999, we acquired OnTarget, Inc. ("OnTarget"), a professional services firm that develops and implements advanced sales and marketing training and consulting programs for sales organizations competing in complex, multilevel sales campaigns. OnTarget's goal is to provide its clients with a pragmatic, repeatable, and implementable process that will create lasting changes within sales organizations, and which will enable our customers to effectively respond to today's market challenges. Under the terms of the agreement, each outstanding share of OnTarget common stock was exchanged for 0.3077516 newly issued shares of our common stock. This resulted in the issuance of approximately 3,700,000 additional shares of our common stock. In addition, all outstanding stock options of OnTarget were converted into the right to acquire our common stock at the same exchange ratio with a corresponding adjustment to the exercise price. The transaction was accounted for as a pooling of interests.
Competition
The market for our products is intensely competitive, subject to rapid change and significantly affected by new product introductions and other market activities of industry participants. Our products are targeted at the emerging market for sales, marketing and customer information systems. We face competition from customers' internal development efforts, custom system integration products, as well as other application software providers that offer a variety of products and services designed to address this market. We believe that the market for global eBusiness information systems has historically not been well served by the application software industry. We believe that most customer deployments have been the result of large internal development projects, custom solutions from systems integrators or the application of personal and departmental productivity tools to the global enterprise. Please see "Risk Factors - To be successful, we must effectively compete in the eBusiness systems market."
Internal Development
Many of our customers and potential customers have in the past attempted to develop sales, marketing and customer service information systems in-house, either alone or with the help of systems integrators. Internal information technology

departments have staffed projects to build their own systems utilizing a variety of tools. In some cases, such internal development projects have been successful in satisfying the needs of an organization. The competitive factors in this area require that we produce a product that conforms to the customer's information technology standards, scales to meet the needs of large enterprises, operates globally and costs less than the result of an internal development effort. We cannot assure you that we will be able to compete effectively against such internal development efforts.
Custom System Integration Projects
A second source of competition results from system integrators engaged to build a custom development application. The introduction of a system integrator typically increases the likelihood of success for the customer. The competitive factors in this area require that we demonstrate to the customer the cost savings and advantages of a configurable, upgradeable and commercially supported product developed by a dedicated professional software organization.
We frequently rely on system consulting and system integration firms for implementation and other customer support services, as well as recommendations of our products during the evaluation stage of the purchase process. Although we seek to maintain close relationships with these service providers, many of these third parties have similar and often more established relationships with our competitors. We cannot assure you that these third parties, many of which have significantly greater resources than us, will not market software products in competition with us in the future or will not otherwise reduce or discontinue their relationships with or support of us and our products.
Other Competitors
A large number of personal, departmental and other products exist in the Siebel eBusiness applications market. Companies (products) such as Allegis (Allegis Sales Partner), Annuncio (Annuncio Live), Ariba (Ariba ORMS Application, Ariba Internet Business Exchange Service, Ariba Market Suite), Baan Co. (BaanFrontOffice, Baan E-Enterprise), Blue Martini (Blue Martini Customer Interaction), Brightware (Web Assistance, Email Assistance), BroadVision (One-to-One Enterprise, One-to-One), Broadbase Info. (CRMPerform), Calico Commerce (Calico eSales Configurator, Calico eSales Engine), Callidus Software, Inc. (TrueComp), CAS GmbH (Mapware, Groupware, Referenzen), Chordiant Software (Enterprise Business Center, Chordiant CCS), Clarify (ClearCallCenter, Clear Quality, Clear Telebusiness), Dendrite International (Dendrite Series 6, AIMS, Strategic Selling Guide), Epicor (Epicor eFrontOffice, Epicor eCommerce Suite, Epicor eIntelligence), E.piphany (E.4 System), FirePond (FirePond Application Suite), Firstwave Technologies (Firstwave eRM, eMarketing, eSales, eSupport), GoldMine Software (GoldMine), I2 Technologies (RYTHM), Kana Communications (Kana Connect, Kana Notify, Kana Realtime, Kana Response, Kana Classify, Kana Assist, Kana Forms), MarketFirst (MarketFirst 2.0), MarketSoft (eLeads), Niku (iNiku), Octane Software (Octane 2000), ONYX Software (Customer Center), Oracle (Oracle iMarketing, Oracle iStore, OracleiPayment, Oracle Telephony Manager, Oracle Customer Care. Oracle OpenTel), Pegasystems, Inc. (Pegasystems), Pivotal Software, Inc. (eRelationship 2000), Prime Resposne ([email protected]), Quintus Corp. (eContact), Relavis Corp. (Remedy@work), RTS, SalesLogix (CommerceLogix, SupportLogix, ACT!),
SAP AG (mySAP.comTM), Saratoga Systems, ServiceSoft (Web Advisor®, eCenterTM, Knowledge Builder®,
LiveContactTM, E-mailContactTM), Silknet Software Inc. (Silknet)(To be acquired by Kana Communications, Inc.), Trilogy (MultiChannel Commerce 2.0), Update Marketing (Marketing Manager®), Vantive Corp. (Vantive)(Acquired by PeopleSoft), Vignette (StoryServer, Syndication Server, Multi-Channel Server, Tools, Professional Services) are among the many firms in this market segment. Some of these competitors have longer operating histories, significantly greater financial, technical, marketing and other resources, significantly greater name recognition and a larger installed base of customers than us. In addition, many competitors have well-established relationships with current and potential customers of ours. As a result, these competitors may be able to respond more quickly to new or emerging technologies and changes in customer requirements or to devote greater resources to the development, promotion and sale of their products than we can. We believe that we compete favorably in this marketplace based on the following competitive advantages: a breadth and depth of functionality, a modern and enduring Web-based product architecture, an ability to manage all customer interactions support across multiple channels, configurable business objects, support for the global enterprise, scalability allowing support for large user communities and strategic alignments with industry leaders. In general, we have priced our products at or above those of our competitors, which pricing we believe is justified by the scope of functionality delivered

and the performance characteristics afforded by our products.
It is also possible that new competitors or alliances among competitors may emerge and rapidly acquire significant market share. We also expect that competition will increase as a result of consolidation in the software industry. Increased competition may result in price reductions, reduced gross margins and loss of market share, any of which could materially and adversely affect our business, operating results and financial condition. We cannot assure you that we will be able to compete successfully against current and future competitors or that competitive pressures faced by us will not materially and adversely affect our business, operating results and financial condition.
Employees
As of December 31, 1999, we had a total of 3,203 employees, of which 1,200 were engaged in sales and marketing, 473 were in product development, 1,279 were in customer support and 251 were in finance, administration and operations. Our future performance depends in significant part upon the continued service of our key technical, sales and senior management personnel, particularly Thomas M. Siebel, our Chairman and Chief Executive Officer, none of whom is bound by an employment agreement. The loss of the services of one or more of our key employees could have a material adverse effect on our business, operating results and financial condition. Our future success also depends on our continuing ability to attract, train and retain highly qualified technical, sales and managerial personnel. Competition for such personnel is intense, and there can be no assurance that we can retain our key technical, sales and managerial personnel in the future. None of our employees are represented by a labor union. We have not experienced any work stoppages and we consider our relations with our employees to be good.
Item 2. Properties
Our principal administration, sales, marketing, support and research and development facilities are located in San Mateo, California, pursuant to a lease which expires in August 2008, and Emeryville, California, pursuant to a lease which expires in March, 2001. We have entered into three leases to relocate our principal facilities to another location in San Mateo in the summer of 2000. These three leases expire on July 31, 2012. We will continue to occupy the existing spaces at the current principal facilities in San Mateo and Emeryville. We currently also occupy a number of domestic and international sales and support offices.
Item 3. Legal Proceedings
In October 1999, SAP America, Inc. filed a complaint against the Company in the Court of Common Pleas of Delaware County, Pennsylvania. The Complaint alleges tortious interference with contractual relations, predatory hiring, misappropriation of trade secrets, and unfair competition in connection with the Company's employment of 27 individuals formerly employed by SAP America or its affiliated companies. In October 1999, the Company filed a complaint against SAP America, Inc. and SAP Labs, Inc. in the Superior Court of California for the County of Santa Clara, alleging unfair competition, violations of Business and Professions Code section 17200, and seeking declaratory relief. In March 2000, the Company and SAP agreed to settle the litigation and dismissed both actions with prejudice.
We are engaged in other legal actions arising in the ordinary course of business. We believe we have adequate legal defenses and that the ultimate outcome of these actions will not have a material effect on our financial position or results of operations.
Item 4. Submission of Matters to a Vote of Security Holders
At a special stockholders' meeting on October 20, 1999, our stockholders approved (i) an amendment to our certificate of incorporation to increase our authorized number of shares of common stock from 300,000,000 to 800,000,000 shares and (ii) an amendment to our 1996 Equity Incentive Plan to increase the number of shares of common stock authorized for issuance under such plan by 15,000,000 shares, from 40,000,000 shares to 55,000,000 shares. The vote regarding the amendment of

our certificate of incorporation, as amended, to increase the authorized number of shares of common stock from 300,000,000 shares to 800,000,000 shares was 76,786,323 votes for, 4,939,828 votes against and 89,127 votes abstaining; on that, the proposal was approved. The vote regarding the amendment of our Equity Incentive Plan to increase the number of shares of common stock authorized for issuance under the plan by 15,000,000 shares, from 40,000,000 shares to 55,000,000, was 40,740,919 votes for, 24,744,860 votes against and 183,839 votes abstaining; on that, the proposal was approved.
On November 12, 1999, we effected a two-for-one stock split by way of a stock dividend of one share of common stock for each share of common stock held by each stockholder. All share data contained in this report is adjusted to reflect the stock split.
PART II
Item 5. Market for Registrant's Common Stock and Related Stockholder Matters
(a) Our common stock is traded on the Nasdaq National Market under the symbol "SEBL." The following high and low sales prices were reported by Nasdaq in each quarter during the last two years. All amounts give retroactive effect to the Company's stock split which was effective November 12, 1999.
High Low --------- ---------Quarter Ended March 31, 1998.................... $15.88 $9.19Quarter Ended June 30, 1998..................... 16.22 10.69Quarter Ended September 30, 1998................ 18.50 9.00Quarter Ended December 31, 1998................. 17.06 7.56Quarter Ended March 31, 1999.................... 27.25 15.88Quarter Ended June 30, 1999..................... 33.69 16.44Quarter Ended September 30, 1999................ 38.88 24.19Quarter Ended December 31, 1999................. 92.00 31.84
As of December 31, 1999, we had approximately 711 holders of record of our common stock. We have never paid any cash dividends on our capital stock and do not expect to pay any such dividends in the foreseeable future.
(b) The effective date of our first registration statement, filed on Form S-1 under the Securities Act of 1933 (No. 333-12061) relating to our initial public offering of our Common Stock, was June 27, 1996. There has been no change to the disclosure contained in our report on Form 10-Q for the quarter ended March 31, 1998, regarding the use of proceeds generated by our initial public offering.
Item 6. Selected Financial Data
The acquisitions of OnTarget, Inc. ("OnTarget") in 1999 and Scopus Technology, Inc. ("Scopus") in 1998 have been accounted for as poolings of interests. Accordingly, the financial statements of Siebel have been restated to include the financial position and results of operations of OnTarget and Scopus for all periods presented.
Year Ended December 31, --------------------------------------------------- 1999 1998 1997 1996 1995

----------- --------- --------- --------- --------- (in thousands, except per share data and employees) Operating Data Net revenues............... $790,920 $409,886 $222,071 $111,980 $45,010 Operating income........... $182,954 $68,019 $8,518 $18,162 $3,797 Net income................. $122,092 $44,265 $643 $13,750 $3,122 Pro forma net income(1).... $121,727 $43,460 $55 $13,313 $2,764 Pro forma diluted net income per share(1)....... $0.54 $0.21 $0.00 $0.08 $0.02 Pro forma basic net income per share(1)....... $0.65 $0.24 $0.00 $0.09 $0.02 Total assets............... $1,226,962 $447,596 $271,535 $209,602 $60,003 Total equity............... $674,591 $291,120 $210,950 $173,157 $43,542 Employees.................. 3,203 1,483 955 506 246
(1) Includes pro forma provision for income taxes to reflect income tax expense that would have been reported if OnTarget Inc. (an S corporation for income tax reporting purposes) had been a C corporation.
Item 7. Management's Discussion and Analysis of Financial Condition and Results of Operations
Overview
Siebel Systems, Inc. ("Siebel" or the "Company") is the world's leading provider of eBusiness applications. Siebel eBusiness Applications enable organizations to sell to, market to, and service their customers across multiple channels, including the Web, call centers, field, resellers, retail, and dealer networks. By employing comprehensive eBusiness applications to better manage their customer relationships, the Company's customers continue to be leaders in their markets.
Siebel eBusiness Applications are available in industry-specific versions designed for the pharmaceutical, healthcare, consumer goods, telecommunications, insurance, energy, apparel and footwear, automotive, technology, public sector, and finance markets. With best-of-class functionality of eBusiness software, Siebel eBusiness Applications enable organizations to create a single source of customer information that sales, service, and marketing professionals can use to tailor product and service offerings to meet each of their customer's unique needs. By using Siebel eBusiness Applications, organizations can develop new customer relationships, profitably serve existing customers, and integrate their systems with those of their partners, suppliers, and customers, regardless of location.
In December 1999, the Company acquired OnTarget, Inc. ("OnTarget"). OnTarget develops and implements advanced sales and marketing training and consulting programs for sales organizations competing in complex, multilevel sales campaigns. OnTarget's goal is to provide its clients with a pragmatic, repeatable and implementable process that will create lasting change within sales organizations, and which will enable Siebel's clients to effectively respond to today's market challenges. Primary customers include corporate clients and business owners who wish to provide for the development and training of their sales and marketing personnel.
Under the terms of the agreement, each outstanding share of OnTarget common stock was exchanged for 0.3077516 newly issued shares of common stock of the Company. This resulted in the issuance of approximately 3.7 million additional shares of the Company's common stock. In addition, all outstanding stock options of OnTarget were converted into the right to acquire the Company's common stock at the same exchange ratio with a corresponding adjustment to the exercise price.
The acquisition of OnTarget has been accounted for as a pooling of interests. Accordingly, the financial statements of the Company have been restated to include the financial position and results of operations of OnTarget for all periods presented.

This Report contains forward looking statements that involve known and unknown risks, uncertainties and other factors which may cause the actual results, performance or achievements of the Company, or industry results, to be materially different from any future results, performance or achievements expressed or implied by such forward-looking statements. Some of these factors are discussed in "Risk Factors" below.
Results of Operations
The following table sets forth statement of operations data for the three years ended December 31, 1999 expressed as a percentage of total revenues:
Year Ended December 31, -------------------------------- 1999 1998 1997 ---------- ---------- ----------Revenues: Software..................................... 63.1% 71.0% 70.7% Professional services, maintenance and other. 36.9% 29.0% 29.3% ---------- ---------- ---------- Total revenues............................. 100.0% 100.0% 100.0% ---------- ---------- ----------Cost of revenues: Software..................................... 1.0% 1.4% 1.9% Professional services, maintenance and other. 21.9% 15.9% 14.3% ---------- ---------- ---------- Total cost of revenues..................... 22.9% 17.3% 16.2% ---------- ---------- ---------- Gross margin............................... 77.1% 82.7% 83.8% ---------- ---------- ----------Operating expenses: Product development.......................... 9.2% 10.7% 12.0% Sales and marketing.......................... 36.8% 43.7% 46.6% General and administrative................... 8.0% 8.4% 9.6% Merger-related expenses...................... -- 3.3% 11.7% ---------- ---------- ---------- Total operating expenses................... 54.0% 66.1% 79.9% ---------- ---------- ---------- Operating income........................... 23.1% 16.6% 3.9%Other income, net.............................. 1.8% 1.5% 2.4% ---------- ---------- ---------- Income before income taxes................. 24.9% 18.1% 6.3%Income taxes................................... 9.5% 7.3% 5.9% ---------- ---------- ---------- Net income................................. 15.4% 10.8% 0.4% ========== ========== ==========
Revenues
Software. License revenues increased to $499,398,000 for the year ended December 31, 1999 from $290,890,000 and $156,971,000 for the years ended December 31, 1998 and 1997, respectively. License revenues as a percentage of total revenues were 63% in the fiscal 1999 period as compared to 71% both in the fiscal 1998 and 1997 periods, respectively. License revenues increased in absolute dollars during these periods from the respective prior year periods due to an increase

in the number of licenses of Siebel applications sold to new and existing customers and also due to licenses of new modules, released with the latest version of Siebel applications, to existing users of Siebel base applications. This increase in the number of licenses was primarily due to continued demand by new and existing customers for products in the Siebel applications family both in the United States and internationally. The Company expects that license revenues will continue to increase in absolute dollars, but will remain the same or decrease as a percentage of total revenues as the Company's maintenance and other services revenues continue to grow as a result of increases in the installed base of customers purchasing such services.
Professional Services, Maintenance and Other. Professional services, maintenance and other revenues increased to $291,522,000 for the year ended December 31, 1999 from $118,996,000 and $65,100,000 for the years ended December 31, 1998 and 1997, respectively, and as a percentage of total revenues were 37% in the fiscal 1999 period as compared to 29% both in the fiscal 1998 and 1997 periods, respectively. These increases in absolute dollars were due to growth in the Company's sales and marketing training businesses, consulting business and in the installed base of customers on maintenance. First-year maintenance is typically sold with the related software license. Revenue related to such maintenance is deferred based on vendor-specific objective evidence of fair value and amortized over the term of the maintenance contract, typically twelve months. The Company expects that professional services, maintenance and other revenues will remain the same or increase as a percentage of total revenues due to increased maintenance revenues derived from the Company's growing installed base and due to the Company's expansion of its consulting and training organization to meet anticipated customer demands in connection with product implementation and sales training.
A relatively small number of customers account for a significant percentage of the Company's license revenues. For 1999, 1998 and 1997, sales to the Company's ten largest customers accounted for 10%, 19% and 24% of total revenues, respectively. The Company expects that licenses of its products to a limited number of customers will continue to account for a large percentage of revenue for the foreseeable future.
The Company markets its products in the United States through its direct sales force and internationally through its sales force and distributors, primarily in Japan, Latin America, South Africa and Asia. International revenues accounted for 31%, 30% and 27% of license revenues in 1999, 1998 and 1997, respectively. The Company is increasing its international sales force and is seeking to establish distribution relationships with appropriate strategic partners and expects international revenues will continue to account for a substantial portion of total revenues in the future.
Cost of Revenues
Software. Cost of software license revenues includes third-party software royalties, product packaging, documentation and production. Cost of license revenues through December 31, 1999 has averaged less than 2% of software license revenues. All costs incurred in the research and development of software products and enhancements to existing products have been expensed as incurred, and, as a result, cost of license revenues includes no amortization of capitalized software development costs. These costs are expected to remain the same or increase as a percentage of total revenues.
Professional Services, Maintenance and Other. Cost of professional services, maintenance and other revenues consist primarily of personnel, facilities and systems costs incurred in providing consulting, customer support, and training. Cost of professional services, maintenance and other revenues increased to $173,278,000 for the year ended December 31, 1999 from $65,387,000 and $31,646,000 for the years ended December 31, 1998 and 1997, respectively, and as a percentage of professional services, maintenance and other revenues were 59% for the year ended December 31, 1999 as compared to 55% in fiscal 1998 and 49% in fiscal 1997. The increases in the absolute dollar amount reflect the effect of fixed costs resulting from the Company's expansion of its maintenance and support organization and growth in the Company's consulting and training businesses. The Company expects that professional services, maintenance and other costs will continue to increase in absolute dollar amount as the Company expands both its customer support organization to support a growing installed base and its consulting organization to meet anticipated customer demands in connection with product implementation and the training organization to support the growing needs of its customers. These costs are expected to remain the same or increase as a percentage of total revenues.

Operating Expenses
Product Development. Product development expenses include expenses associated with the development of new products, enhancements of existing products and quality assurance activities, and consist primarily of employee salaries, benefits, consulting costs and the cost of software development tools. Product development expenses increased to $72,853,000 for the year ended December 31, 1999 from $43,950,000 and $26,650,000 for the years ended December 31, 1998 and 1997, respectively, and decreased as a percentage of total revenues to 9% in the fiscal 1999 period from 11% and 12% in the fiscal 1998 and 1997 periods, respectively. The increases in the dollar amount of product development expenses were primarily attributable to costs of additional personnel in the Company's product development operations. The Company anticipates that it will continue to devote substantial resources to product development. The Company expects product development expenses to increase in absolute dollar amount but remain at a similar percentage of total revenues as in 1999. The Company considers technological feasibility of its software products to have been reached upon completion of a working model that has met certain performance criteria. The period between achievement of technological feasibility and general release of a software product is typically very short, and development costs incurred during that period have not been material. Accordingly, the Company has not capitalized any software development costs to date.
Sales and Marketing. Sales and marketing expenses consist primarily of salaries, commissions and bonuses earned by sales and marketing personnel, field office expenses, travel and entertainment and promotional expenses. Sales and marketing expenses increased to $290,687,000 for the year ended December 31, 1999 from $178,957,000 and $103,551,000 for the years ended December 31, 1998 and 1997, respectively, and as a percentage of total revenues, sales and marketing expenses decreased to 37% in 1999, from 44% and 47% in the fiscal 1998 and 1997 periods, respectively. The increases in the dollar amount of sales and marketing expenses reflect primarily the hiring of additional sales and marketing personnel, costs associated with expanded promotional activities, and indirect merger-related costs, such as corporate sales training and marketing programs. The Company expects that sales and marketing expenses will continue to increase in absolute dollar amount as the Company continues to expand its sales and marketing efforts, establishes additional sales offices in the United States and internationally and increases promotional activities. These expenses are expected to remain at a similar percentage of total revenues as in 1999.
General and Administrative. General and administrative expenses consist primarily of salaries and occupancy costs for administrative, executive and finance personnel. General and administrative expenses increased to $63,508,000 for the year ended December 31, 1999 from $34,473,000 and $21,275,000 for the years ended December 31, 1998 and 1997, respectively, and as a percentage of total revenues were 8% in the fiscal 1999 period as compared to 8% and 10% in the fiscal 1998 and 1997 periods, respectively. The increases in the absolute dollar amount of general and administrative expenses were primarily due to increased staffing and associated expenses necessary to manage and support the Company's increased scale of operations. The Company believes that its general and administrative expenses will continue to increase in absolute dollar amount as a result of the continued expansion of the Company's administrative staff and facilities to support growing operations. The Company anticipates that its general and administrative expenses as a percentage of total revenues should remain at a similar percentage as in 1999.
Merger-Related Expenses. The Company did not incur any significant merger-related costs in connection with the merger with OnTarget.
In connection with the merger with Scopus, the Company incurred direct merger-related expenses of approximately $13,500,000, comprised primarily of investment bankers, attorneys, accountants and other professional fees of $9,100,000, duplicate facilities and equipment of $3,100,000 and other miscellaneous expenses of $1,300,000.
The Company incurred costs of approximately $3,300,000 in 1997 in connection with Scopus' planned merger with Clear With Computers, Inc. The merger plan was terminated early in the fourth quarter of 1997.
On October 1, 1997, the Company completed its purchase of InterActive, a developer of intranet-based business intelligence software technology that has been incorporated into the Siebel eBriefings product. The acquisition was accounted for by the purchase method of accounting. The Company recorded a charge to income of $14,017,000, or $0.09

per diluted share, pursuant to an allocation of the purchase price by an independent appraiser, as a write-off of acquired research and development. Purchased in-process research and development is related to the completion of InterActive's data integration, filtering and formatting technology and its integration into the Company's products. At the time of acquisition, a prototype of InterActive's product existed and was in limited trials, however, the prototype was not stable or sufficiently developed to be scalable on an enterprise-wide basis. InterActive's technology was completed, at a cost of approximately $400,000, and incorporated as a separate module into the Siebel 98 product suite, which was released in June 1998. The Company estimated that technology was approximately 75% complete as of the acquisition date. At that date, the only identifiable asset acquired was the technology under development. Accordingly, essentially all of the excess purchase price over net assets acquired, except for amounts assigned to net current assets, fixed assets and workforce-in-place, was assigned to in-process research and development.
The valuation of acquired research and development was prepared using the income approach and contemplated that sales of products incorporating InterActive's technology would be $11,500,000 in 1998, increasing to $35,000,000 in 2000, and declining significantly thereafter. Revenue increases were based upon the historical growth rate of software sales for the customer relationship managment market and the Company. Operating costs as a percentage of revenue ranged from 56% in 1998 to 47% in 2000 based upon the Company's normal operating margin. Operating cash flows were reduced by an expected effective tax rate of 38% consistent with the Company's effective tax rate. Net cash flows were discounted to their present value at the acquisition date using an after-tax risk-adjusted discount rate of 30%. The Company believes this discount rate is consistent with that required by venture capitalists for investments in unproven but partially developed software products. Through the end of 1999, total revenues from Siebel eBriefings were approximately $11,000,000; however, the Company is unable to quantify the effect of Siebel eBriefings as a competitive differentiator. The Company does not track selling, general and administrative costs by product but believes the incremental costs associated with selling and distributing Siebel eBriefings were substantially lower than those used in the valuation due to synergies associated with selling the product as a separate component of the Siebel 98 product suite and subsequent versions. If the Company is unable to continuously upgrade the Siebel eBriefings product or existing and future customers do not elect to purchase this module, the Company's ability to recover the value assigned to the acquired research and development will be impaired and revenue and profitability will be adversely affected.
On November 1, 1997, the Company completed its purchase of Nomadic, a provider of innovative business solutions to pharmaceutical sales forces. The acquisition was accounted for by the purchase method of accounting. Technology acquired from Nomadic has been incorporated into the Siebel ePharma product. The Company recorded a charge to income of $8,723,000 or $0.05 per diluted share, pursuant to an allocation of the purchase price by an independent appraiser, as a write-off of acquired research and development. The appraisal of the acquired research and development was based upon the present value of forecasted operating cash flows from the technology acquired, giving effect to the stage of completion at the acquisition date. These forecasted cash flows were then discounted at a rate commensurate with the risk involved in completing the acquired technology. The forecasted cash flows assumed inclusion of the product developed from acquired technology into the existing Siebel product suite. The purchased in-process research and development expense related to completion of Nomadic's second generation pharmaceutical sales force automation product. This product was completed and enterprise-wide deployment to end-user customers commenced in March 1998. Much of the functionality was incorporated into the Company's ePharma product, which was released in June 1998. At the time of the acquisition, Nomadic had a first-generation product at a limited number of customers, with a very small user base. There were a considerable number of uncertainties as to increasing the product's scalability for deployment on an enterprise-wide basis, improving the stability of the application and identifying and fixing bugs. The Company allocated limited excess purchase price over net assets acquired to net current assets, fixed assets and workforce-in-place. The majority of the excess purchase price was allocated to in-process research and development and other intangible assets (goodwill) based upon the expected cash flows from Nomadic's existing product and the product under development, giving consideration to the stage of completion of the technology under development at the acquisition date. This technology was completed, at a cost of approximately $1,300,000, for enterprise-wide release in March 1998.
The valuation of acquired research and development was prepared using the income approach and contemplated that sales of products incorporating Nomadic's technology would be $11,500,000 in 1998, increasing to $35,000,000 in 2000, and declining significantly thereafter. Revenue increases were based upon the historical growth rate of software sales for the

customer relationship managment market and the Company. Operating costs as a percentage of revenue were estimated at 70%, based upon the Company's normal operating margin. Operating cash flows were reduced by an expected effective tax rate of 39% consistent with the Company's effective tax rate. Net cash flows were discounted to their present value at the acquisition date using an after-tax risk-adjusted discount rate of 25%. The Company believes this discount rate is consistent with that required by venture capitalists for investments in unproven but partially developed software products. Through the end of 1999, total revenues from products incorporating the Nomadic technology under development at the acquisition date were approximately $35,000,000. Although the Company does not track selling, general and administrative costs by product, because these products are sold as vertical eBusiness solutions for the pharmaceutical industry, the Company believes the operating margin is similar to the Company's consolidated operating margin. If the Company is unable to continuously upgrade the Siebel ePharma product or superior products are released by competitors, the Company's ability to recover the value assigned to the acquired research and development will be impaired and revenue and profitability will be adversely affected.
Operating Income and Operating Margin
Operating income increased to $182,954,000 for the year ended December 31, 1999 from $68,019,000 for the year ended December 31, 1998 and $8,518,000 for the year ended December 31, 1997 and operating margin was 23% in the fiscal 1999 period, as compared with 17% and 4% in the fiscal 1998 and 1997 periods, respectively. Excluding merger-related expenses, operating income increased to $182,954,000 for the year ended December 31, 1999 from $83,303,000 and $34,556,000 for the years ended December 31, 1998 and 1997, respectively, and operating margin was 23% in the fiscal 1999 period as compared to 20% and 16% in the fiscal 1998 and 1997 periods, respectively. These increases in operating income and margin, excluding merger-related expenses, were due to increases in license revenues without a proportional increase in cost, particularly costs associated with the hiring of new personnel. We believe it is likely that operating margins in future periods will be less than the 23% achieved in 1999.
Other Income, Net
Other income, net, is primarily comprised of interest income earned on the Company's cash and cash equivalents and short-term investments and reflects earnings on increasing cash and cash equivalents and short-term investment balances.
Pro forma Provision for Income Taxes
Income taxes are comprised primarily of federal and state taxes. The pro forma provision for income taxes reflects income tax expense that would have been reported if OnTarget (an S Corporation for income tax reporting purposes) had been a C Corporation for each of the periods presented. The pro forma provision for income taxes was $75,195,000, $30,817,000, and $13,848,000 in 1999, 1998, and 1997, respectively. The pro forma provision for income taxes as a percentage of pretax income was 38%, 41%, and 100%, respectively. The pro forma tax rate in 1997 was higher than the rates in 1998 and 1999 primarily due to non-deductible items related to acquisitions. The Company expects its effective tax rate in 2000 to be approximately 38%, excluding the effect of non-deductible costs such as merger-related expenses.
As a result of deductions relating to stock options, the Company paid no federal income taxes during 1999.
Pro forma Net Income
The Company had pro forma net income of $121,727,000 for the year ended December 31, 1999 and pro forma net income of $43,460,000 and $55,000 for the years ended December 31, 1998 and 1997, respectively. Pro forma net income per diluted share was $0.54 in fiscal 1999, compared with $0.21 in the fiscal 1998, and $0.00 in fiscal 1997, respectively.
Liquidity and Capital Resources
The Company's cash, cash equivalents, short-term investments and marketable equity securities increased to

$805,314,000 as of December 31, 1999 from $232,629,000 as of December 31, 1998, representing approximately 66% and 52% of total assets, respectively. This increase was primarily attributable to issuance of convertible subordinated debentures, net income, sale of certain property and equipment, increases in accounts payable, accrued expenses, income taxes payable and deferred revenue, issuance of common stock under the Company's stock option plans, and the initial public offering and subsequent increase in market value of an equity investment, partially offset by increases in accounts receivable, purchases of property and equipment and charitable contribution of a portion of the Company's marketable equity securities. The Company's days sales outstanding (DSO) in accounts receivable was 98 as of December 31, 1999, as compared with 88 as of December 31, 1998.
The Company completed a private placement of $300,000,000 of convertible subordinated debentures in September 1999. The seven-year term notes bear interest at a rate of 5.50% and are convertible into approximately 6,432,000 shares of the Company's common stock at any time prior to maturity, at a conversion price of approximately $46.64 per share, subject to adjustment under certain conditions. The Company may redeem the notes, in whole or in part, at any time on or after September 15, 2002. The redemption price will range from $309,420,000 to $302,370,000 if the notes are redeemed between September 15, 2002 through September 14, 2006. Any redemption made on or after September 15, 2006 will be redeemed at $300,000,000. In addition, accrued interest to the redemption date will be paid by the Company in each redemption.
As of February 10, 2000, the fair market value of the Company's marketable equity securities was $90,340,000.
The Company recently entered into a lease agreement for a new headquarters facility in San Mateo, California. The Company expects significant capital expenditures in connection with tenant improvements and furniture and fixtures for this facility. These expenditures are expected to be incurred through the end of 2000. In addition, the Company expects to continue to incur capital expenditures associated with tenant improvements, furniture and fixtures for newly-leased offices.
The Company has used full-serviced office suites on a month-to-month rental basis to establish its presence in new locations. As these locations expand, the Company expects to transition more of the office suites to leased space. This transition will involve build-out of tenant improvements, acquisition of furniture and fixtures, and other capital costs, which were not incurred in connection with the use of fully serviced office suites. The Company has already built out a number of leased facilities, both domestically and internationally, and expects this trend to continue.
Capital expenditures of the nature described above are expected to increase during 2000 and 2001.
The Company believes that the anticipated cash flows from operations, cash, cash equivalents and short-term investments will be adequate to meet its cash needs for working capital and capital expenditures for at least the next twelve months.
Risk Factors
Our net revenue and operating results may fluctuate.
We may experience a shortfall in revenue or earnings or otherwise fail to meet public market expectations, which could materially adversely affect our business and the market price of our common stock. Our net revenue and operating results may fluctuate significantly because of a number of factors, many of which are outside of our control. These factors include:
● Level of product and price competition;
● Length of our sales cycle and customer purchasing patterns;
● The size and timing of individual license transactions;
● Delay or deferral of customer implementations of our products;

● Success in expanding our customer support organization, direct sales force and indirect distribution channels;
● Timing of new product introductions and product enhancements;
● Appropriate mix of products and services sold;
● Levels of international sales;
● Activities of and acquisitions by competitors;
● Timing of new hires and the allocation of our resources;
● Changes in the economy and foreign currency exchange rates; and
● Our ability to develop and market new products and control costs.
One or more of the foregoing factors may cause our operating expenses to be disproportionately high during any given period or may cause our net revenue and operating results to fluctuate significantly. Based upon the preceding factors, we may experience a shortfall in revenue or earnings or otherwise fail to meet public market expectations, which could materially adversely affect our business, financial condition and the market price of our common stock.
Our quarterly operating results may fluctuate.
Our net revenue and operating results may vary drastically from quarter to quarter. The main factors that may affect these fluctuations are:
● The discretionary nature of our customer's purchase and budget cycles;
● The size and complexity of our license transactions;
● The potential delays in recognizing revenue from license transactions;
● The timing of new product releases;
● Seasonal variations in operating results; and
● Variations in the fiscal or quarterly cycles of our customers.
Each customer's decision to implement our products and services is discretionary, involves a significant commitment of resources and is subject to their budget cycles. In addition, the timing of license revenue is difficult to predict because of the length of our sales cycle, which has ranged to date from one to twenty four months. We base our operating expenses on anticipated revenue trends. Because a high percentage of these expenses are relatively fixed, a delay in recognizing revenue from license transactions could cause significant variations in operating results from quarter to quarter and could result in operating losses. If these expenses precede, or are not subsequently followed by, increased revenues, our operating results could be materially and adversely affected. Although we have not experienced significant seasonal variations in operating results, such variations could develop in the future.
As a result of these and other factors, revenues for any quarter are subject to significant variation and we believe that period-to-period comparisons of our results of operations are not necessarily useful. You should not rely on these

comparisons as indications of future performance. It is likely that our future quarterly operating results from time to time will not meet the expectations of market analysts or investors, which would likely have an adverse effect on the price of our common stock.
We need to successfully integrate acquisitions and manage growth.
Our business strategy includes pursuing opportunities to grow our business, both internally and through selective acquisitions, investments, joint ventures and strategic alliances. Our ability to implement this strategy depends, in part, on our success in making such acquisitions, investments, joint ventures and strategic alliances on satisfactory terms and successfully integrating them into our operations. Implementation of our growth strategy may impose significant strains on our management, operating systems and financial resources. Failure to manage this growth, or unexpected difficulties encountered during expansion, could have an adverse effect on our business, operating results and financial condition.
We rely on strategic relationships with systems integrators.
Failure to maintain existing strategic relationships with systems integrators, or to establish new relationships in the future, could have a material adverse effect on our business. We have established strategic relationships with a number of organizations that we believe are important to our sales, marketing and support activities, and the implementation of our products. We believe that our relationships with these organizations provide marketing and sales opportunities for our direct sales force and expand the distribution of our products. These relationships allow us to keep pace with the technological and marketing developments of major software vendors and provide us with technical assistance for our product development efforts.
In particular, we have established a non-exclusive strategic relationship with Andersen Consulting, one of our largest stockholders. We have also entered into significant relationships with other third-party systems integrators such as IBM Global Services, PricewaterhouseCoopers and Deloitte Consulting. A significant portion of our revenues have historically been derived from customers for whom Andersen Consulting, or another systems integrator with which we have a significant relationship, have been engaged to provide system integration services. Any deterioration of our relationship with these significant third-party systems integrators could have a material adverse effect on our business, financial condition and results of operations. We also have relationships with IBM Corporation, Compaq Computer Corporation, Microsoft Corporation and Sun Microsystems, among others. Failure to maintain existing relationships, or to establish new relationships in the future, could have a material adverse effect on our business, results of operations and financial condition.
Our current and potential customers may also rely on third-party systems integrators to develop, deploy or manage Siebel eBusiness Applications. If we do not adequately train a sufficient number of system integrators, or if these integrators do not have, or do not devote, the resources necessary to implement our products, our business, operating results and financial condition could be materially and adversely affected.
The Internet presents unique risks.
We may not be able to compete effectively in the Internet-related products and services market. Siebel eBusiness Applications communicate through public and private networks over the Internet. The success of our products may depend, in part, on our ability to continue developing products that are compatible with the Internet. We cannot predict with any assurance whether the Internet will be a viable commercial marketplace or whether the demand for Internet-related products and services will increase or decrease in the future. The increased commercial use of the Internet could require substantial modification and customization of our products and the introduction of new products.
Critical issues concerning the commercial use of the Internet, including security, demand, reliability, cost, ease of use, accessibility, quality of service and potential tax or other government regulation, remain unresolved and may affect the use of the Internet as a medium to support the functionality of our products and distribution of our software. If these critical issues are not favorably resolved, our business, operating results and financial condition could be materially and adversely
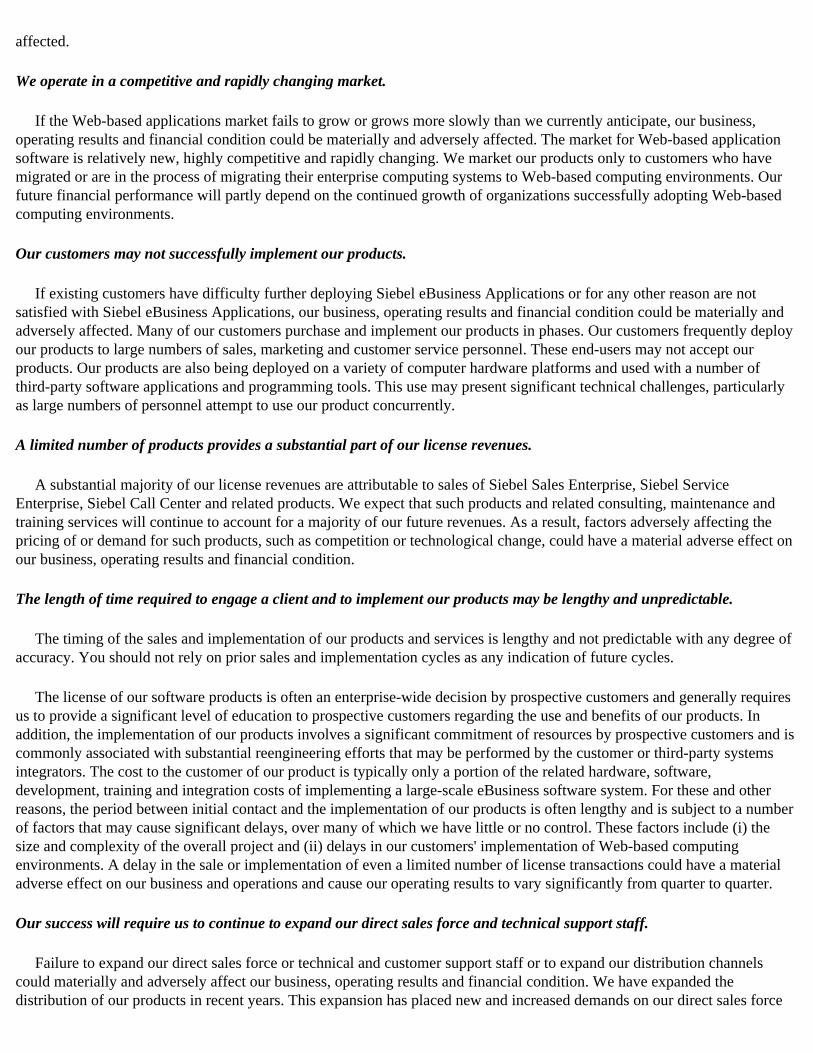
affected.
We operate in a competitive and rapidly changing market.
If the Web-based applications market fails to grow or grows more slowly than we currently anticipate, our business, operating results and financial condition could be materially and adversely affected. The market for Web-based application software is relatively new, highly competitive and rapidly changing. We market our products only to customers who have migrated or are in the process of migrating their enterprise computing systems to Web-based computing environments. Our future financial performance will partly depend on the continued growth of organizations successfully adopting Web-based computing environments.
Our customers may not successfully implement our products.
If existing customers have difficulty further deploying Siebel eBusiness Applications or for any other reason are not satisfied with Siebel eBusiness Applications, our business, operating results and financial condition could be materially and adversely affected. Many of our customers purchase and implement our products in phases. Our customers frequently deploy our products to large numbers of sales, marketing and customer service personnel. These end-users may not accept our products. Our products are also being deployed on a variety of computer hardware platforms and used with a number of third-party software applications and programming tools. This use may present significant technical challenges, particularly as large numbers of personnel attempt to use our product concurrently.
A limited number of products provides a substantial part of our license revenues.
A substantial majority of our license revenues are attributable to sales of Siebel Sales Enterprise, Siebel Service Enterprise, Siebel Call Center and related products. We expect that such products and related consulting, maintenance and training services will continue to account for a majority of our future revenues. As a result, factors adversely affecting the pricing of or demand for such products, such as competition or technological change, could have a material adverse effect on our business, operating results and financial condition.
The length of time required to engage a client and to implement our products may be lengthy and unpredictable.
The timing of the sales and implementation of our products and services is lengthy and not predictable with any degree of accuracy. You should not rely on prior sales and implementation cycles as any indication of future cycles.
The license of our software products is often an enterprise-wide decision by prospective customers and generally requires us to provide a significant level of education to prospective customers regarding the use and benefits of our products. In addition, the implementation of our products involves a significant commitment of resources by prospective customers and is commonly associated with substantial reengineering efforts that may be performed by the customer or third-party systems integrators. The cost to the customer of our product is typically only a portion of the related hardware, software, development, training and integration costs of implementing a large-scale eBusiness software system. For these and other reasons, the period between initial contact and the implementation of our products is often lengthy and is subject to a number of factors that may cause significant delays, over many of which we have little or no control. These factors include (i) the size and complexity of the overall project and (ii) delays in our customers' implementation of Web-based computing environments. A delay in the sale or implementation of even a limited number of license transactions could have a material adverse effect on our business and operations and cause our operating results to vary significantly from quarter to quarter.
Our success will require us to continue to expand our direct sales force and technical support staff.
Failure to expand our direct sales force or technical and customer support staff or to expand our distribution channels could materially and adversely affect our business, operating results and financial condition. We have expanded the distribution of our products in recent years. This expansion has placed new and increased demands on our direct sales force
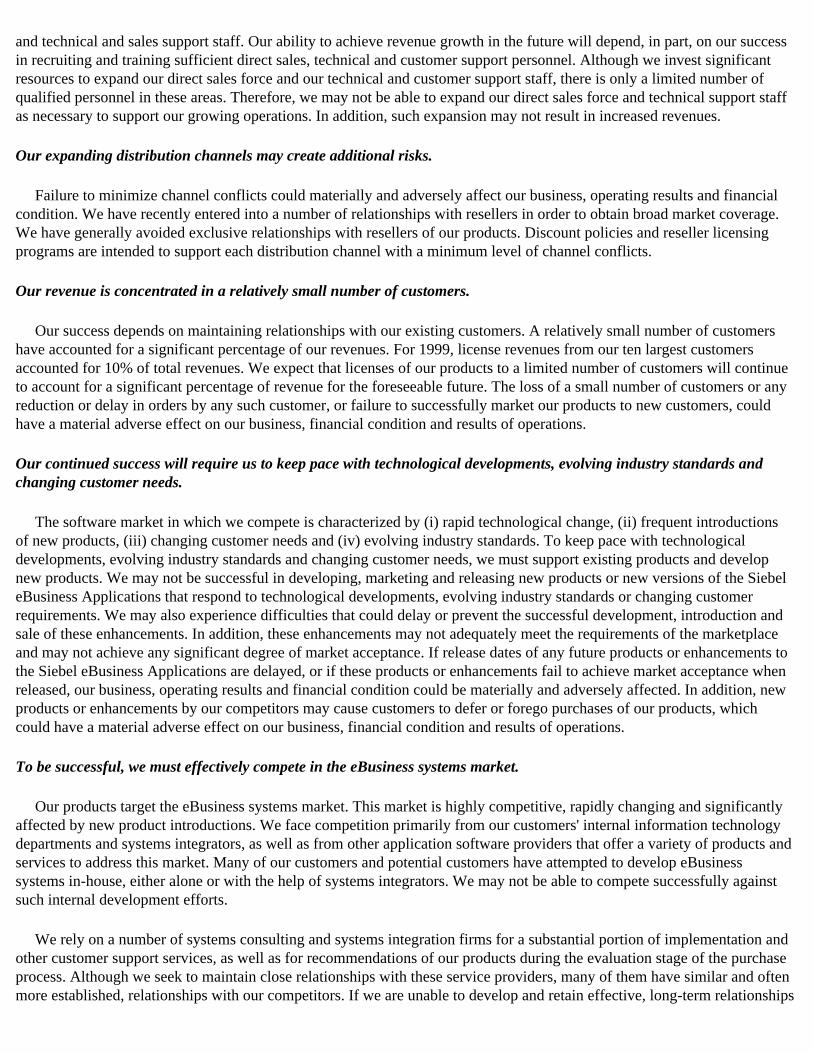
and technical and sales support staff. Our ability to achieve revenue growth in the future will depend, in part, on our success in recruiting and training sufficient direct sales, technical and customer support personnel. Although we invest significant resources to expand our direct sales force and our technical and customer support staff, there is only a limited number of qualified personnel in these areas. Therefore, we may not be able to expand our direct sales force and technical support staff as necessary to support our growing operations. In addition, such expansion may not result in increased revenues.
Our expanding distribution channels may create additional risks.
Failure to minimize channel conflicts could materially and adversely affect our business, operating results and financial condition. We have recently entered into a number of relationships with resellers in order to obtain broad market coverage. We have generally avoided exclusive relationships with resellers of our products. Discount policies and reseller licensing programs are intended to support each distribution channel with a minimum level of channel conflicts.
Our revenue is concentrated in a relatively small number of customers.
Our success depends on maintaining relationships with our existing customers. A relatively small number of customers have accounted for a significant percentage of our revenues. For 1999, license revenues from our ten largest customers accounted for 10% of total revenues. We expect that licenses of our products to a limited number of customers will continue to account for a significant percentage of revenue for the foreseeable future. The loss of a small number of customers or any reduction or delay in orders by any such customer, or failure to successfully market our products to new customers, could have a material adverse effect on our business, financial condition and results of operations.
Our continued success will require us to keep pace with technological developments, evolving industry standards and changing customer needs.
The software market in which we compete is characterized by (i) rapid technological change, (ii) frequent introductions of new products, (iii) changing customer needs and (iv) evolving industry standards. To keep pace with technological developments, evolving industry standards and changing customer needs, we must support existing products and develop new products. We may not be successful in developing, marketing and releasing new products or new versions of the Siebel eBusiness Applications that respond to technological developments, evolving industry standards or changing customer requirements. We may also experience difficulties that could delay or prevent the successful development, introduction and sale of these enhancements. In addition, these enhancements may not adequately meet the requirements of the marketplace and may not achieve any significant degree of market acceptance. If release dates of any future products or enhancements to the Siebel eBusiness Applications are delayed, or if these products or enhancements fail to achieve market acceptance when released, our business, operating results and financial condition could be materially and adversely affected. In addition, new products or enhancements by our competitors may cause customers to defer or forego purchases of our products, which could have a material adverse effect on our business, financial condition and results of operations.
To be successful, we must effectively compete in the eBusiness systems market.
Our products target the eBusiness systems market. This market is highly competitive, rapidly changing and significantly affected by new product introductions. We face competition primarily from our customers' internal information technology departments and systems integrators, as well as from other application software providers that offer a variety of products and services to address this market. Many of our customers and potential customers have attempted to develop eBusiness systems in-house, either alone or with the help of systems integrators. We may not be able to compete successfully against such internal development efforts.
We rely on a number of systems consulting and systems integration firms for a substantial portion of implementation and other customer support services, as well as for recommendations of our products during the evaluation stage of the purchase process. Although we seek to maintain close relationships with these service providers, many of them have similar and often more established, relationships with our competitors. If we are unable to develop and retain effective, long-term relationships
with these third parties, our competitive position could be materially and adversely affected. Further, many of these third parties have significantly greater resources than we do and may market software products that compete with us.
A large number of personal, departmental and other products exist in the Siebel eBusiness applications market. Companies (products) such as Allegis (Allegis Sales Partner), Annuncio (Annuncio Live), Ariba (Ariba ORMS Application, Ariba Internet Business Exchange Service, Ariba Market Suite), Baan Co. (BaanFrontOffice, Baan E-Enterprise), Blue Martini (Blue Martini Customer Interaction), Brightware (Web Assistance, Email Assistance), BroadVision (One-to-One Enterprise, One-to-One), Broadbase Info. (CRMPerform), Calico Commerce (Calico eSales Configurator, Calico eSales Engine), Callidus Software, Inc. (TrueComp), CAS GmbH (Mapware, Groupware, Referenzen), Chordiant Software (Enterprise Business Center, Chordiant CCS), Clarify (ClearCallCenter, Clear Quality, Clear Telebusiness), Dendrite International (Dendrite Series 6, AIMS, Strategic Selling Guide), Epicor (Epicor eFrontOffice, Epicor eCommerce Suite, Epicor eIntelligence), E.piphany (E.4 System), FirePond (FirePond Application Suite), Firstwave Technologies (Firstwave eRM, eMarketing, eSales, eSupport), GoldMine Software (GoldMine), I2 Technologies (RYTHM), Kana Communications (Kana Connect, Kana Notify, Kana Realtime, Kana Response, Kana Classify, Kana Assist, Kana Forms), MarketFirst (MarketFirst 2.0), MarketSoft (eLeads), Niku (iNiku), Octane Software (Octane 2000), ONYX Software (Customer Center), Oracle (Oracle iMarketing, Oracle iStore, OracleiPayment, Oracle Telephony Manager, Oracle Customer Care. Oracle OpenTel), Pegasystems, Inc. (Pegasystems), Pivotal Software, Inc. (eRelationship 2000), Prime Resposne ([email protected]), Quintus Corp. (eContact), Relavis Corp. (Remedy@work), RTS, SalesLogix (CommerceLogix, SupportLogix, ACT!),
SAP AG (mySAP.comTM), Saratoga Systems, ServiceSoft (Web Advisor®, eCenterTM, Knowledge Builder®,
LiveContactTM, E-mailContactTM), Silknet Software Inc. (Silknet)(To be acquired by Kana Communications, Inc.), Trilogy (MultiChannel Commerce 2.0), Update Marketing (Marketing Manager®), Vantive Corp. (Vantive)(Acquired by PeopleSoft), Vignette (StoryServer, Syndication Server, Multi-Channel Server, Tools, Professional Services) are among the many firms in this market segment. Some of these competitors have longer operating histories, significantly greater financial, technical, marketing and other resources, significantly greater name recognition and a larger installed base of customers than we do. In addition, many competitors have well-established relationships with our current and potential customers. As a result, these competitors may be able to respond more quickly to new or emerging technologies and changes in customer requirements, or to devote greater resources to the development, promotion and sale of their products than we can.
There are many factors that may increase competition in the eBusiness systems market, including (i) entry of new competitors, (ii) alliances among existing competitors, (iii) consolidation in the software industry and (iv) technological changes or changes in the use of the Internet. Increased competition may result in price reductions, reduced gross margins or loss of market share, any of which could materially and adversely affect our business, operating results and financial condition. If we cannot compete successfully against current and future competitors or overcome competitive pressures, our business, operating results and financial condition may be adversely affected.
If we do not maintain our relationships with third-party vendors, interruptions in the supply of our products may result.
We may not be able to replace the functionality provided by the third-party software currently offered with our products if that software becomes obsolete or incompatible with future versions of our products or is not adequately maintained or updated. Portions of our products incorporate software that was developed and is maintained by third-party software developers. Although we believe there are other sources for these products, any significant interruption in the supply of these products could adversely impact our sales unless and until we can secure another source. We depend in part on these third parties' abilities to enhance their current products, to develop new products on a timely and cost-effective basis and to respond to emerging industry standards and other technological changes. The absence of or any significant delay in the replacement of functionality provided by third-party software in our products could materially and adversely affect our sales.
Software errors or defects in our products could reduce revenues.
Software products frequently contain errors or failures, especially when first introduced or when new versions are released. Although we conduct extensive product testing during product development, we have, in the past, been forced to
delay the commercial release of products until the correction of software problems. We could lose revenues as a result of software errors or defects. Our products are intended for use in sales applications that may be critical to a customer's business. As a result, we expect that our customers and potential customers will have a greater sensitivity to product defects than the market for software products generally. Testing errors may also be found in new products or releases after commencement of commercial shipments, resulting in loss of revenue or delay in market acceptance, damage to our reputation, or increased service and warranty costs, any of which could have a material adverse effect upon our business, operating results and financial condition.
If we do not successfully manage our growth, our business may be negatively impacted.
If we fail to manage our growth effectively, our business, financial condition and results of operations could be materially and adversely affected. Our business has grown rapidly in recent years. This growth has placed a significant strain on our management systems and resources. To manage future growth, we must continue to (i) improve our financial and management controls, reporting systems and procedures on a timely basis and (ii) expand, train and manage our employee work force.
The loss of key personnel could negatively affect our performance.
Our performance depends on the continued service of our key technical, sales and senior management personnel, particularly Thomas M. Siebel, our Chairman and Chief Executive Officer. None of our key employees has entered into an employment agreement with us. The loss of the services of one or more of our executive officers could have a material adverse effect on our business, operating results and financial condition.
Substantial leverage and debt service obligations may adversely affect our cash flow.
We have substantial amounts of outstanding indebtedness, primarily consisting of our 5-1/2% convertible subordinated notes due September 15, 2006. As a result of this indebtedness, our principal and interest payment obligations are substantial. We may be unable to generate cash sufficient to pay the principal of, interest on and other amounts due in respect of our indebtedness when due. We also expect to add additional equipment loans and lease lines to finance capital expenditures and may obtain additional long-term debt, working capital lines of credit and lease lines. There can be no assurance that any financing arrangements will be available.
Our substantial leverage could have significant negative consequences, including:
● Increasing our vulnerability to general adverse economic and industry conditions;
● Limiting our ability to obtain additional financing;
● Requiring the dedication of a substantial portion of our expected cash flow from operations to service our indebtedness, thereby reducing the amount of our expected cash flow available for other purposes, including capital expenditures;
● Limiting our flexibility in planning for, or reacting to, changes in our business and the industry in which we compete; and
● Placing us at a competitive disadvantage compared to less leveraged competitors and competitors that have better access to capital resources.
The protection of our proprietary information is limited.
We rely primarily on a combination of patent, copyright, trade secret and trademark laws, confidentiality procedures and

contractual provisions to protect our proprietary rights. We also believe that the technological and creative skills of our personnel, new product developments, frequent product enhancements, name recognition and reliable product maintenance are essential to establishing and maintaining a technology leadership position. We seek to protect our software, documentation and other written materials under patent, trade secret and copyright laws, which afford only limited protection. Any patents issued to us may be invalidated, circumvented or challenged. Any of our pending or future patent applications, whether or not being currently challenged, may not be issued with the scope of the claims we seek, if at all. Furthermore, others may develop technologies that are similar or superior to our technology or design around our patents. Despite our efforts to protect our proprietary rights, unauthorized parties may attempt to copy aspects of our products or to obtain and use information that we regard as proprietary. Policing unauthorized use of our products is difficult. In addition, the laws of some foreign countries do not protect our proprietary rights as fully as do the laws of the United States. Our means of protecting our proprietary rights in the United States or abroad may not be adequate. We have entered into agreements with substantially all of our customers that require us to place Siebel eBusiness Applications source code into escrow. Such agreements generally provide that such parties will have a limited, non-exclusive right to use such code if (i) there is a bankruptcy proceeding by or against us, (ii) we cease to do business, or (iii) we fail to meet our support obligations.
Although we do not believe that we are infringing any proprietary rights of others, third parties may claim that we have infringed their intellectual property rights. Furthermore, former employers of our former, current or future employees may assert claims that such employees have improperly disclosed to us the confidential or proprietary information of such former employers. Any such claims, with or without merit, could (i) be time consuming to defend, (ii) result in costly litigation, (iii) divert management's attention and resources, (iv) cause product shipment delays and (v) require us to pay money damages or enter into royalty or licensing agreements. A successful claim of product infringement against us and our failure or inability to license or create a workaround for such infringed or similar technology may materially and adversely affect our business, operating results and financial condition.
We license certain software from third parties. These third-party software licenses may not continue to be available to us on acceptable terms. The loss of, or inability to maintain, any of these software licenses could result in shipment delays or reductions. This could materially and adversely affect our business, operating results and financial condition.
International operations involve unique risks.
Our revenues are primarily derived from large multi-national companies. To service the needs of these companies, we must provide worldwide product support services. We have expanded and intend to continue expanding, our international operations and enter additional international markets. This will require significant management attention and financial resources that could adversely affect our operating margins and earnings. We may not be able to maintain or increase international market demand for Siebel eBusiness Applications. If we do not, our international sales will be limited and our business, operating results and financial condition could be materially and adversely affected.
Our international operations are subject to a variety of risks, including (i) foreign currency fluctuations, (ii) economic or political instability, (iii) shipping delays and (iv) various trade restrictions. Any of these risks could have a significant impact on our ability to deliver products on a competitive and timely basis. Significant increases in the level of customs duties, export quotas or other trade restrictions could also have an adverse effect on our business, financial condition and results of operations. In situations where direct sales are denominated in foreign currency, any fluctuation in foreign currency or the exchange rate may adversely affect our business, financial condition and results of operations. We manage our foreign currency exchange rate risk by entering into contracts to sell foreign currency at the time a foreign currency receivable is generated. When the foreign currency receivable is collected, the contract is liquidated, thereby converting the foreign currency to US dollars and mitigating the exchange rate risk. In certain instances, we have not hedged foreign currency receivables when the forward contracts in the relevant currency were not readily available or were not cost effective.
Certain stockholders may be able to exercise control over matters requiring stockholder approval.
Our current officers, directors and entities affiliated with us together beneficially owned a significant portion of the outstanding shares of common stock as of December 31, 1999. While these stockholders do not hold a majority of our

outstanding common stock, they will be able to exercise significant influence over matters requiring stockholder approval, including the election of directors and the approval of mergers, consolidations and sales of our assets. This may prevent or discourage tender offers for our common stock.
Our stock price may continue to be volatile.
Our stock price has fluctuated substantially since our initial public offering in June 1996. The trading price of our common stock is subject to significant fluctuations in response to variations in quarterly operating results, the gain or loss of significant orders, changes in earning estimates by analysts, announcements of technological innovations or new products by us or our competitors, general conditions in the software and computer industries and other events or factors. In addition, the stock market in general has experienced extreme price and volume fluctuations that have affected the market price for many companies in industries similar or related to ours and that have been unrelated to the operating performance of these companies. These market fluctuations have adversely affected and may continue to adversely affect the market price of our common stock.
Certain provisions in our charter documents may prevent certain corporate actions.
Our Board of Directors is authorized to issue up to 2,000,000 shares of preferred stock and to determine the price, rights, preferences, privileges and restrictions, including voting rights, of those shares without any further approval by our stockholders. The preferred stock could be issued with voting, liquidation, dividend and other rights superior to those of the common stock. The rights of the holders of common stock will be subject to and may be adversely affected by, the rights of the holders of any preferred stock that may be issued in the future. The issuance of preferred stock, while providing desirable flexibility in connection with possible acquisitions and other corporate purposes, could make it more difficult for a third party to acquire a majority of our outstanding voting stock. We have a classified Board of Directors. This and certain other provisions of our certificate of incorporation and certain provisions of our Bylaws and of Delaware law, could delay or make more difficult a merger, tender offer or proxy contest.
Audit Committee
The Company has established an Audit Committee of the Board of Directors, the charter of which is to oversee the activities of management and the Company's external auditors as they relate to the financial reporting process. In 1999, the Audit Committee was comprised of James C. Gaither, Charles R. Schwab and George T. Shaheen. In particular, the Audit Committee's role includes ensuring that management properly develops and adheres to a sound system of internal controls, and that the Company's auditors, through their own review, assess the effectiveness of those controls and management's adherence to them.
In fulfilling their responsibilities, the Audit Committee conducted regular, quarterly meetings with the Company's outside auditors. In each of these meetings, the Audit Committee met with the Company's outside auditors, independent of management, to assure the Audit Committee an independent and confidential view of the Company's management and internal controls as they relate to the quality and reliability of the Company's financial statements.
The Company is committed to supporting this process and the Audit Committee in fulfilling their role of ensuring the integrity of the Company's internal controls and financial reporting.
Item 7a. Quantitative and Qualitative Disclosures About Market Risk
The tables below provide information about the Company's derivative financial instruments and financial instruments that are subject to market risk. These include foreign currency forward contracts used to hedge foreign currency receivables and intercompany balances, which are subject to exchange rate risk, cash equivalents and available-for-sale short-term investments, which are subject to interest rate risk.

The Company manages its foreign currency exchange rate risk by entering into contracts to sell foreign currency at the time a foreign currency receivable is generated. When the foreign currency receivable is collected, the contract is liquidated, thereby converting the foreign currency to US dollars and mitigating the exchange rate risk.
The Company manages its interest rate risk by maintaining an investment portfolio with debt instruments of high credit quality and relatively short average maturities. The Company also manages interest rate risk by maintaining sufficient cash and cash equivalent balances such that it is typically able to hold its investments to maturity.
The Company is exposed to equity price risks on marketable equity securities. This investment is in a publicly-trade company in the high-technology industry sector. The Company typically does not attempt to reduce or eliminate its market exposure on these securities. A 10% adverse change in the equity price would result in an approximate $14,200,000 decrease in the fair value of the Company's marketable equity securities as of December 31, 1999.
The fair value of the Company's convertible subordinated debenture fluctuates based upon changes in the price of the Company's common stock, changes in interest rates and changes in the creditworthiness of the Company. The fair market value of the convertible subordinated debenture as of December 31, 1999 was $580,140,000.
The following summarizes the Company's foreign currency forward contracts, all of which mature in 2000, by currency, as of December 31, 1999. Contract amounts are representative of the expected payments to be made under these instruments (in thousands):
Fair Value Contract Contract at Amount (Local Amount December 31, Currency) (US$) 1999 (US$) --------------- ----------- ------------ German marks (contracts to pay DM/receive US$)..................... DM 5,930 $3,081 $36 British pounds (contracts to pay Pounds/receive US$)................. (Pounds)4,211 $6,779 ($42) Japanese yen (contracts to pay Yen/receive US$)....................(Yen)2,008,000 $19,663 $8 Euro (contracts to pay EUR/receive US$).................... (EUR)7,664 $7,499 $133 British pounds (contracts to pay Pounds/receive EUR)................. (Pounds)970 (EUR)1,402 ($164)
The following summarizes the Company's short-term investments and the weighted average yields, as of December 31, 1999 (in thousands):
Expected maturity date ----------------------------------------------------- There- 2000 2001 2002 2003 2004 after -------- -------- -------- -------- -------- --------US treasury securities. $9,752 $10,974 $4,945 $1,953 $6,262 --Wtd. Avg. Yld.......... 5.24% 6.27% 6.42% 6.36% 7.16%
Municipal securities... $52,116 $37,942 $36,395 $5,305 -- --
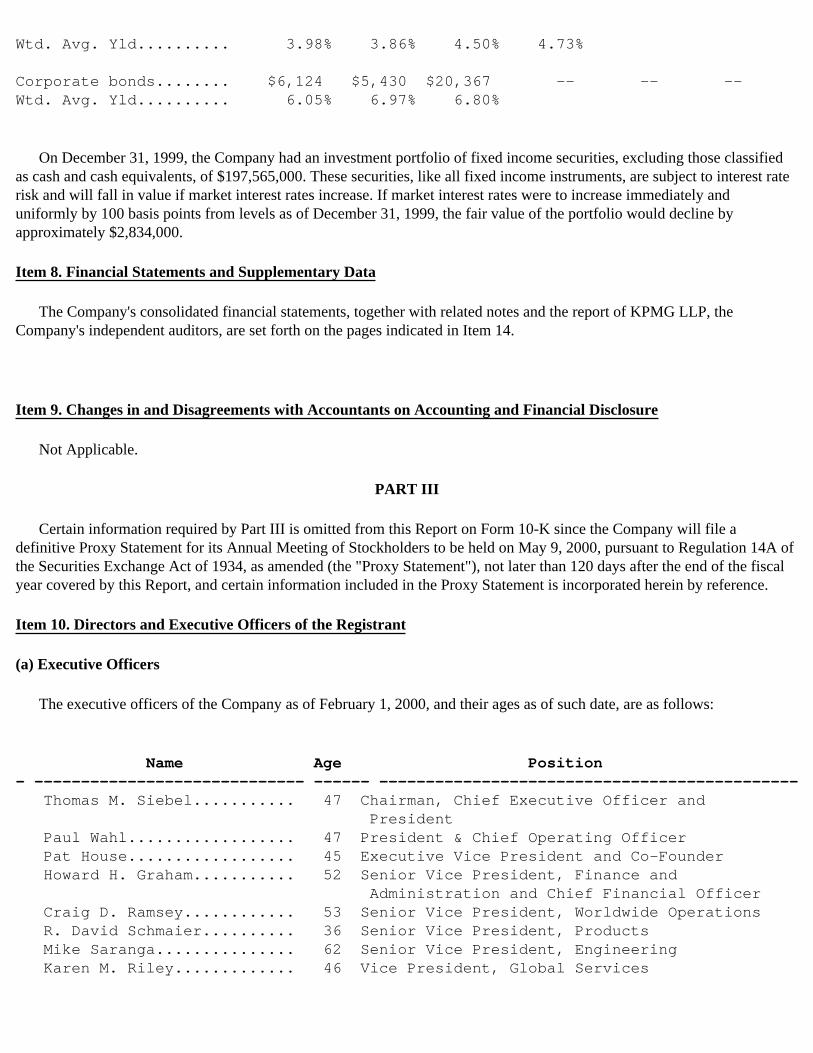
Wtd. Avg. Yld.......... 3.98% 3.86% 4.50% 4.73%
Corporate bonds........ $6,124 $5,430 $20,367 -- -- --Wtd. Avg. Yld.......... 6.05% 6.97% 6.80%
On December 31, 1999, the Company had an investment portfolio of fixed income securities, excluding those classified as cash and cash equivalents, of $197,565,000. These securities, like all fixed income instruments, are subject to interest rate risk and will fall in value if market interest rates increase. If market interest rates were to increase immediately and uniformly by 100 basis points from levels as of December 31, 1999, the fair value of the portfolio would decline by approximately $2,834,000.
Item 8. Financial Statements and Supplementary Data
The Company's consolidated financial statements, together with related notes and the report of KPMG LLP, the Company's independent auditors, are set forth on the pages indicated in Item 14.
Item 9. Changes in and Disagreements with Accountants on Accounting and Financial Disclosure
Not Applicable.
PART III
Certain information required by Part III is omitted from this Report on Form 10-K since the Company will file a definitive Proxy Statement for its Annual Meeting of Stockholders to be held on May 9, 2000, pursuant to Regulation 14A of the Securities Exchange Act of 1934, as amended (the "Proxy Statement"), not later than 120 days after the end of the fiscal year covered by this Report, and certain information included in the Proxy Statement is incorporated herein by reference.
Item 10. Directors and Executive Officers of the Registrant
(a) Executive Officers
The executive officers of the Company as of February 1, 2000, and their ages as of such date, are as follows:
Name Age Position- ----------------------------- ------ --------------------------------------------- Thomas M. Siebel........... 47 Chairman, Chief Executive Officer and President Paul Wahl.................. 47 President & Chief Operating Officer Pat House.................. 45 Executive Vice President and Co-Founder Howard H. Graham........... 52 Senior Vice President, Finance and Administration and Chief Financial Officer Craig D. Ramsey............ 53 Senior Vice President, Worldwide Operations R. David Schmaier.......... 36 Senior Vice President, Products Mike Saranga............... 62 Senior Vice President, Engineering Karen M. Riley............. 46 Vice President, Global Services
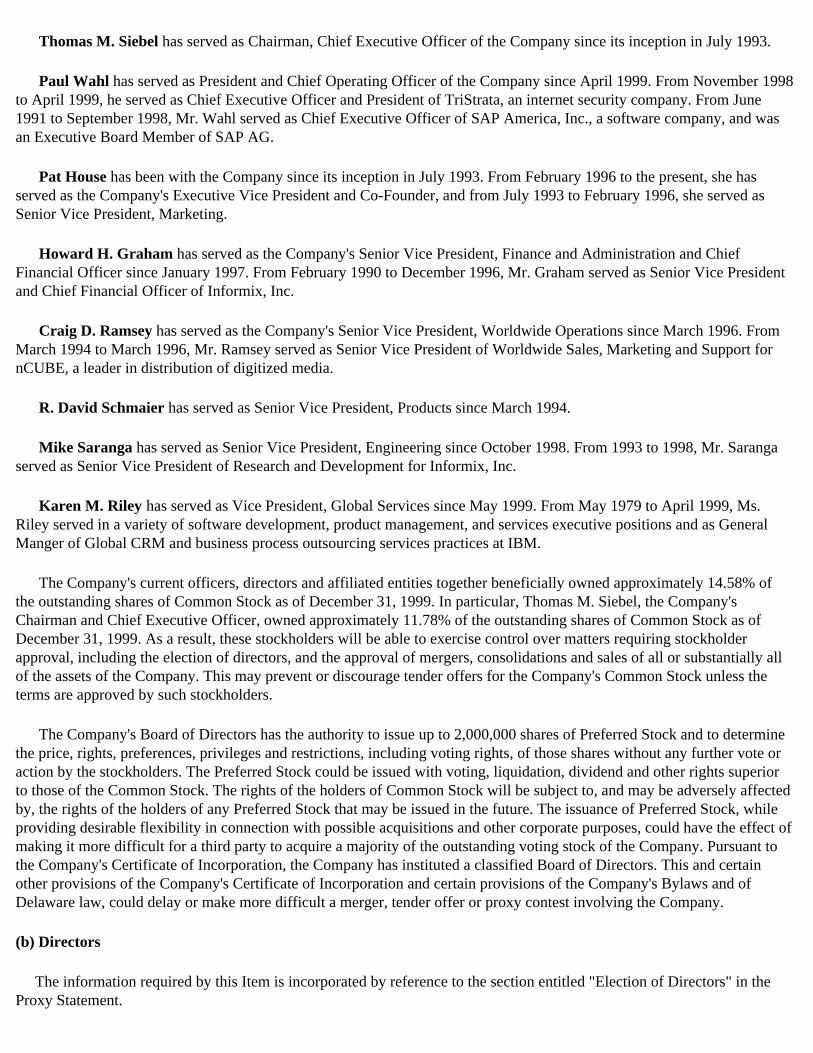
Thomas M. Siebel has served as Chairman, Chief Executive Officer of the Company since its inception in July 1993.
Paul Wahl has served as President and Chief Operating Officer of the Company since April 1999. From November 1998 to April 1999, he served as Chief Executive Officer and President of TriStrata, an internet security company. From June 1991 to September 1998, Mr. Wahl served as Chief Executive Officer of SAP America, Inc., a software company, and was an Executive Board Member of SAP AG.
Pat House has been with the Company since its inception in July 1993. From February 1996 to the present, she has served as the Company's Executive Vice President and Co-Founder, and from July 1993 to February 1996, she served as Senior Vice President, Marketing.
Howard H. Graham has served as the Company's Senior Vice President, Finance and Administration and Chief Financial Officer since January 1997. From February 1990 to December 1996, Mr. Graham served as Senior Vice President and Chief Financial Officer of Informix, Inc.
Craig D. Ramsey has served as the Company's Senior Vice President, Worldwide Operations since March 1996. From March 1994 to March 1996, Mr. Ramsey served as Senior Vice President of Worldwide Sales, Marketing and Support for nCUBE, a leader in distribution of digitized media.
R. David Schmaier has served as Senior Vice President, Products since March 1994.
Mike Saranga has served as Senior Vice President, Engineering since October 1998. From 1993 to 1998, Mr. Saranga served as Senior Vice President of Research and Development for Informix, Inc.
Karen M. Riley has served as Vice President, Global Services since May 1999. From May 1979 to April 1999, Ms. Riley served in a variety of software development, product management, and services executive positions and as General Manger of Global CRM and business process outsourcing services practices at IBM.
The Company's current officers, directors and affiliated entities together beneficially owned approximately 14.58% of the outstanding shares of Common Stock as of December 31, 1999. In particular, Thomas M. Siebel, the Company's Chairman and Chief Executive Officer, owned approximately 11.78% of the outstanding shares of Common Stock as of December 31, 1999. As a result, these stockholders will be able to exercise control over matters requiring stockholder approval, including the election of directors, and the approval of mergers, consolidations and sales of all or substantially all of the assets of the Company. This may prevent or discourage tender offers for the Company's Common Stock unless the terms are approved by such stockholders.
The Company's Board of Directors has the authority to issue up to 2,000,000 shares of Preferred Stock and to determine the price, rights, preferences, privileges and restrictions, including voting rights, of those shares without any further vote or action by the stockholders. The Preferred Stock could be issued with voting, liquidation, dividend and other rights superior to those of the Common Stock. The rights of the holders of Common Stock will be subject to, and may be adversely affected by, the rights of the holders of any Preferred Stock that may be issued in the future. The issuance of Preferred Stock, while providing desirable flexibility in connection with possible acquisitions and other corporate purposes, could have the effect of making it more difficult for a third party to acquire a majority of the outstanding voting stock of the Company. Pursuant to the Company's Certificate of Incorporation, the Company has instituted a classified Board of Directors. This and certain other provisions of the Company's Certificate of Incorporation and certain provisions of the Company's Bylaws and of Delaware law, could delay or make more difficult a merger, tender offer or proxy contest involving the Company.
(b) Directors
The information required by this Item is incorporated by reference to the section entitled "Election of Directors" in the Proxy Statement.

Item 11. Executive Compensation
The information required by this Item is incorporated by reference to the section entitled "Executive Compensation" in the Proxy Statement.
Item 12. Security Ownership of Certain Beneficial Owners and Management
The information required by this Item is incorporated by reference to the section entitled "Security Ownership of Certain Beneficial Owners and Management" in the Proxy Statement.
Item 13. Certain Relationships and Related Transactions
The information required by this Item is incorporated by reference to the section entitled "Certain Transactions" in the Proxy Statement.
PART IV
Item 14. Exhibits, Financial Statements and Reports on Form 8-K
(a) The following documents are filed as part of this Report:
1. Financial Statements
Independent Auditors' Report
Consolidated Financial Statements:
Balance Sheets
Statements of Operations and Comprehensive Income
Statements of Stockholders' Equity
Statements of Cash Flows
Notes to Consolidated Financial Statements
2. Financial Statement Schedule
Schedule II--Valuation and Qualifying Accounts
3. Exhibits
ExhibitNumber Description of Document- -------- --------------------------------------------------------------- 2.1 Agreement and Plan of Merger and Reorganization, dated March 1, 1998, among the Registrant, Syracuse Acquisition Sub, Inc. and

Scopus Technology, Inc.(4) 2.2 Agreement and Plan of Merger and Reorganization dated November 17, 1999, among the Registrant, SE Acquisition Corp. and OnTarget, Inc. (8) 3.1 Amended and Restated Certificate of Incorporation of the Registrant.(3) 3.2 Certificate of Amendment of the Amended and Restated Certificiate of Incorporation of the Registrant (9) 3.3 Bylaws of the Registrant.(1) 4.1 Reference is made to Exhibits 3.1 and 3.2. 4.2 Specimen Stock Certificate.(1) 4.3 Restated Investor Rights Agreement, dated December 1, 1995, between the Registrant and certain investors, as amended April 30, 1996 and June 14, 1996.(1)10.1 Registrant's 1996 Equity Incentive Plan, as amended.(3)10.2 Registrant's Employee Stock Purchase Plan, as amended.(3)10.3 Form of Indemnity Agreement entered into between the Registrant and its officers and directors.(1)10.4 Registrant's Deferred Compensation Plan, dated January 10, 1997.(5)10.5 Master Alliance Agreement, dated March 17, 1995, between the Registrant and Andersen Consulting LLP.(1)(2)10.6 Assignment Agreement, dated September 20, 1995, by and between the Registrant and Thomas M. Siebel.(1)10.7 Lease Agreement, dated June 4, 1996, by and between the Registrant and Crossroad Associates and Clocktower Associates.(1)10.8 Lease Agreement, dated March 11, 1999, by and between the Registrant and Sobrato Interests III.(9)10.9 Lease Agreement, dated March 11, 1999, by and between the Registrant and Sobrato Interests III.(9)10.10 Lease Agreement, dated June 11, 1999, by and between the Registrant and Sobrato Interests III.(9)10.11 Lease Agreement, dated August 24, 1994, by and between the Registrant and Watergate Tower Associates.(9)10.12 Lease Agreement, dated August 16, 1999, by and between the Registrant and Spieker Properties, L.P..(9)10.13 Lease Amendment 10, dated April 8, 1999, by and between the Registrant and Spieker Properties, L.P..(9)10.14 Lease Amendment 11, dated August 13, 1999, by and between the Registrant and Spieker Properties, L.P..(9)10.15 Lease Amendment 12, dated October 28, 1999, by and between the Registrant and Spieker Properties, L.P..(9)23.1 Consent of KPMG LLP, Independent Auditors.(9)27.1 Financial Data Schedule.(9)
---------
(1) Incorporated by reference to the Registrant's Registration Statement on Form S-1 (No. 333-03751), as amended. (2) Confidential treatment has been granted with respect to portions of this exhibit. (3) Incorporated by reference to the Registrant's Registration Statement on Form S-8 (No. 333-07983), as amended.

(4) Incorporated by reference to exhibit 99.1 of the Registrant's Current Report on Form 8-K filed by the Registrant on March 16, 1998. (5) Incorporated by reference to the Registrant's Annual Report on Form 10-K for the fiscal year ended December 31, 1996. (6) Incorporated by reference to exhibit 99.3 of the Registrant's Current Report on Form 8-K filed by the Registrant on March 16, 1998. (7) Incorporated by reference to exhibit 99.5 of the Registrant's Current Report on Form 8-K filed by the Registrant on March 16, 1998. (8) Incorporated by reference the Registrant's Current Report on Form 8-K filed by the Registrant on January 7, 2000. (9) Filed herewith.
(b) Reports on Form 8-K
On January 7, 2000, the Registrant filed a report on Form 8-K relating to the Registrant's restated audited consolidated financial statements, giving effect to the merger with OnTarget, Inc. for the three years ended December 31, 1998, and the related consolidated financial statement schedule, selected financial data and management's discussion and analysis of financial condition and results of operations.
INDEPENDENT AUDITORS' REPORT
The Board of Directors and Stockholders Siebel Systems, Inc.:
We have audited the accompanying consolidated balance sheets of Siebel Systems, Inc. and subsidiaries as of December 31, 1999 and 1998, and the related consolidated statements of operations and comprehensive income, stockholders' equity, and cash flows for each of the years in the three- year period ended December 31, 1999. These consolidated financial statements are the responsibility of the Company's management. Our responsibility is to express an opinion on these consolidated financial statements based on our audits.
We conducted our audits in accordance with generally accepted auditing standards. Those standards require that we plan and perform the audit to obtain reasonable assurance about whether the financial statements are free of material misstatement. An audit includes examining, on a test basis, evidence supporting the amounts and disclosures in the financial statements. An audit also includes assessing the accounting principles used and significant estimates made by management, as well as evaluating the overall financial statement presentation. We believe that our audits provide a reasonable basis for our opinion.
In our opinion, the consolidated financial statements referred to above present fairly, in all material respects, the financial position of Siebel Systems, Inc. and subsidiaries as of December 31, 1999 and 1998, and the results of their operations and their cash flows for each of the years in the three-year period ended December 31, 1999, in conformity with generally accepted accounting principles.
/s/ KPMG LLP
Mountain View, California January 24, 2000

SIEBEL SYSTEMS, INC.
Consolidated Balance Sheets
(in thousands, except per share data)
December 31, ---------------------- 1999 1998 ----------- ---------- Assets Current assets: Cash and cash equivalents............................ $465,810 $80,741 Short-term investments............................... 197,565 151,888 Marketable equity securities.......................... 141,939 -- Accounts receivable, net............................. 293,010 126,081 Deferred income taxes................................ -- 13,270 Prepaids and other................................... 30,711 14,402 ----------- ---------- Total current assets............................... 1,129,035 386,382 Property and equipment, net.......................... 56,875 46,384 Other assets......................................... 41,052 14,830 ----------- ---------- Total assets....................................... $1,226,962 $447,596 =========== ========== Liabilities and Stockholders' EquityCurrent liabilities: Accounts payable..................................... $11,845 $4,558 Accrued expenses..................................... 125,085 88,185 Income taxes payable................................. -- 10,917 Deferred revenue..................................... 86,170 52,033 Deferred income taxes................................ 27,832 -- ----------- ---------- Total current liabilities.......................... 250,932 155,693
Convertible subordinated debentures..................... 300,000 --Deferred income taxes.................................. 1,439 783 ----------- ---------- Total liabilities.................................. 552,371 156,476 ----------- ----------
Commitments and contingencies
Stockholders' equity: Common stock; $0.001 par value; 800,000 shares authorized; 194,597 and 182,036 shares issued and outstanding, respectively........................... 195 182 Additional paid-in capital........................... 415,408 235,400
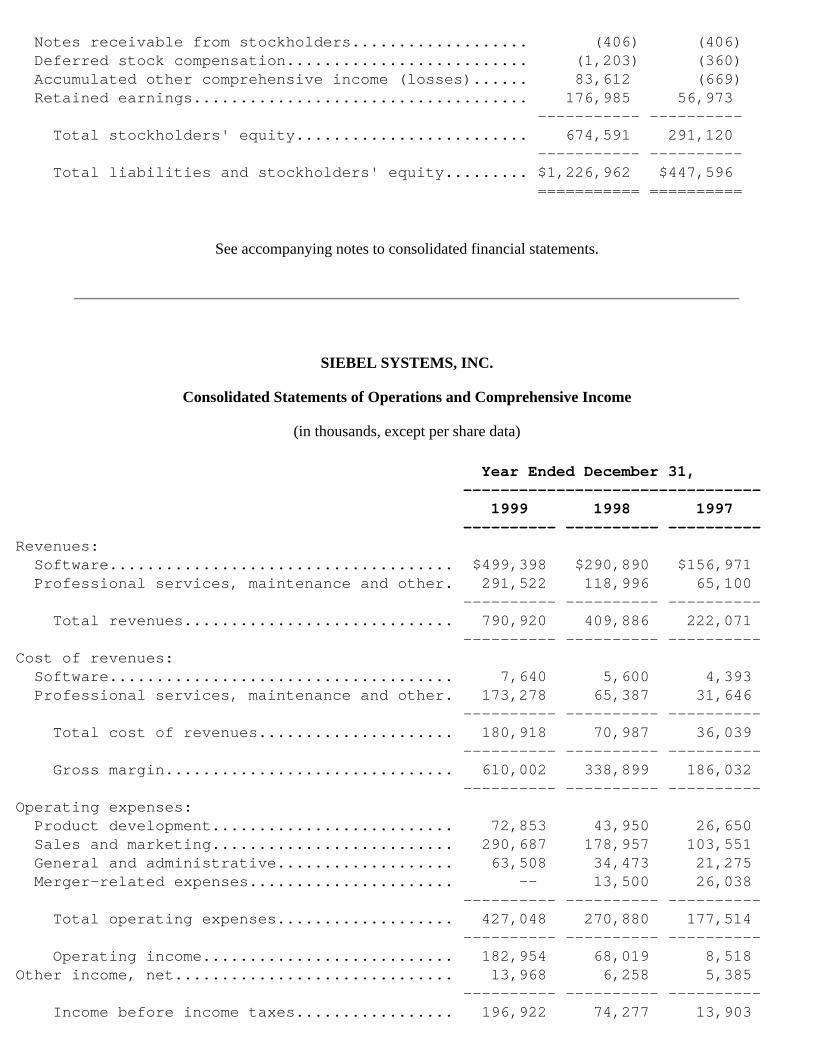
Notes receivable from stockholders................... (406) (406) Deferred stock compensation.......................... (1,203) (360) Accumulated other comprehensive income (losses)...... 83,612 (669) Retained earnings.................................... 176,985 56,973 ----------- ---------- Total stockholders' equity......................... 674,591 291,120 ----------- ---------- Total liabilities and stockholders' equity......... $1,226,962 $447,596 =========== ==========
See accompanying notes to consolidated financial statements.
SIEBEL SYSTEMS, INC.
Consolidated Statements of Operations and Comprehensive Income
(in thousands, except per share data)
Year Ended December 31, -------------------------------- 1999 1998 1997 ---------- ---------- ----------Revenues: Software..................................... $499,398 $290,890 $156,971 Professional services, maintenance and other. 291,522 118,996 65,100 ---------- ---------- ---------- Total revenues............................. 790,920 409,886 222,071 ---------- ---------- ----------Cost of revenues: Software..................................... 7,640 5,600 4,393 Professional services, maintenance and other. 173,278 65,387 31,646 ---------- ---------- ---------- Total cost of revenues..................... 180,918 70,987 36,039 ---------- ---------- ---------- Gross margin............................... 610,002 338,899 186,032 ---------- ---------- ----------Operating expenses: Product development.......................... 72,853 43,950 26,650 Sales and marketing.......................... 290,687 178,957 103,551 General and administrative................... 63,508 34,473 21,275 Merger-related expenses...................... -- 13,500 26,038 ---------- ---------- ---------- Total operating expenses................... 427,048 270,880 177,514 ---------- ---------- ---------- Operating income........................... 182,954 68,019 8,518Other income, net.............................. 13,968 6,258 5,385 ---------- ---------- ---------- Income before income taxes................. 196,922 74,277 13,903

Income taxes................................... 74,830 30,012 13,260 ---------- ---------- ---------- Net income................................. $122,092 $44,265 $643 ========== ========== ==========
Pro forma net income and per share data: Income before taxes as reported............. $196,922 $74,277 $13,903 Pro forma income taxes...................... 75,195 30,817 13,848 ---------- ---------- ---------- Pro forma net income........................ $121,727 $43,460 $55 ========== ========== ==========
Pro forma diluted net income per share......... $0.54 $0.21 $0.00 ========== ========== ==========
Pro forma basic net income per share........... $0.65 $0.24 $0.00 ========== ========== ==========
Shares used in diluted pro forma net income per share computation......................... 226,279 202,204 191,338 ========== ========== ==========Shares used in basic pro forma net income per share computation......................... 188,088 177,446 169,904 ========== ========== ==========
Comprehensive income: Net income................................... $122,092 $44,265 $643
Other comprehensive income (loss), net of tax: Foreign currency translation adjustments..... 615 (505) (365) Unrealized gains on securities............... 83,666 201 -- ---------- ---------- ----------Other comprehensive income (loss).............. 84,281 (304) (365) ---------- ---------- ---------- Total comprehensive income................. $206,373 $43,961 $278 ========== ========== ==========
See accompanying notes to consolidated financial statements.
SIEBEL SYSTEMS, INC.
Consolidated Statements of Stockholders' Equity
(in thousands)
Notes Accumu- Receiv- lated able Deferred Other Total

Common stock Additional from Stock Compre- Stock- ---------------- Paid-in Stock- Compen- hensive Retained holders' Shares Amount Capital holders sation Losses Earnings Equity -------- ------- --------- -------- -------- -------- --------- ---------Balances, December 31, 1996.................... 166,247 $166 $157,058 ($508) ($1,173) -- $17,613 $173,156Issuance of common stock under Employee Stock Option Plans...... 4,134 5 4,785 -- -- -- -- 4,790Issuance of common stock under Employee Stock Purchase Plans.... 1,252 1 4,299 -- -- -- -- 4,300Issuance of common stock related to InterActive acquisition. 1,204 1 14,580 -- -- -- -- 14,581Issuance of common stock related to Nomadic acquisition..... 1,200 1 10,392 -- -- -- -- 10,393Repayment of note receivable.............. -- -- -- 102 -- -- -- 102Compensation related to stock options........ -- -- (256) -- 256 -- -- --Cancellation of stock options issued below fair value.............. -- -- (1) -- 1 -- -- --Tax benefit from stock options........... -- -- 4,046 -- -- -- -- 4,046Amortization of deferred compensation related to stock options................. -- -- -- -- 277 -- -- 277Currency translation adjustment (net of taxes of $214).......... -- -- -- -- -- (365) -- (365)Subchapter S distributions by On Target............... -- -- -- -- -- -- (973) (973)Net income............... -- -- -- -- -- -- 643 643 -------- ------- --------- -------- -------- -------- --------- ---------Balances, December 31, 1997.................... 174,037 174 194,903 (406) (639) (365) 17,283 210,950Issuance of common stock under Employee Stock Option Plans............ 6,767 7 17,855 -- -- -- -- 17,862Issuance of common stock under Employee Stock Purchase Plans.......... 1,232 1 8,534 -- -- -- -- 8,535Adjustment to conform acquired company's year-end................ -- -- -- -- -- -- (1,464) (1,464)Cancellation of stock options issued below fair value.............. -- -- (39) -- 39 -- -- --Tax benefit from stock options........... -- -- 13,516 -- -- -- -- 13,516Amortization of deferred compensation related to stock options........ -- -- -- -- 240 -- -- 240Unrealized gain on short-term investments (net of taxes of $118).. -- -- -- -- -- 201 -- 201Currency translation adjustment (net of taxes of $297).......... -- -- -- -- -- (505) -- (505)Transfer of common stock to employees....... -- -- 631 -- -- -- -- 631Subchapter S distributions by
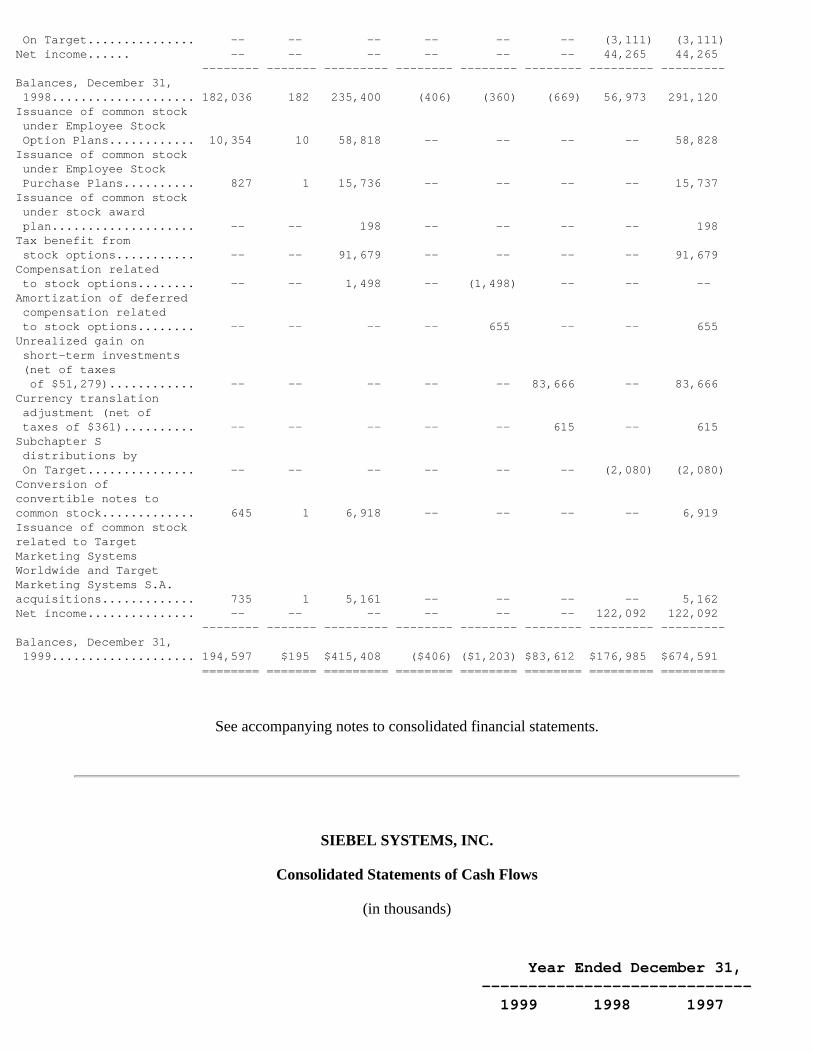
On Target............... -- -- -- -- -- -- (3,111) (3,111)Net income...... -- -- -- -- -- -- 44,265 44,265 -------- ------- --------- -------- -------- -------- --------- ---------Balances, December 31, 1998.................... 182,036 182 235,400 (406) (360) (669) 56,973 291,120Issuance of common stock under Employee Stock Option Plans............ 10,354 10 58,818 -- -- -- -- 58,828Issuance of common stock under Employee Stock Purchase Plans.......... 827 1 15,736 -- -- -- -- 15,737Issuance of common stock under stock award plan.................... -- -- 198 -- -- -- -- 198Tax benefit from stock options........... -- -- 91,679 -- -- -- -- 91,679Compensation related to stock options........ -- -- 1,498 -- (1,498) -- -- --Amortization of deferred compensation related to stock options........ -- -- -- -- 655 -- -- 655Unrealized gain on short-term investments (net of taxes of $51,279)............ -- -- -- -- -- 83,666 -- 83,666Currency translation adjustment (net of taxes of $361).......... -- -- -- -- -- 615 -- 615Subchapter S distributions by On Target............... -- -- -- -- -- -- (2,080) (2,080)Conversion ofconvertible notes tocommon stock............. 645 1 6,918 -- -- -- -- 6,919Issuance of common stockrelated to TargetMarketing SystemsWorldwide and TargetMarketing Systems S.A.acquisitions............. 735 1 5,161 -- -- -- -- 5,162Net income............... -- -- -- -- -- -- 122,092 122,092 -------- ------- --------- -------- -------- -------- --------- ---------Balances, December 31, 1999.................... 194,597 $195 $415,408 ($406) ($1,203) $83,612 $176,985 $674,591 ======== ======= ========= ======== ======== ======== ========= =========
See accompanying notes to consolidated financial statements.
SIEBEL SYSTEMS, INC.
Consolidated Statements of Cash Flows
(in thousands)
Year Ended December 31, ----------------------------- 1999 1998 1997

--------- --------- --------- Cash flows from operating activities: Net income .................................... $122,092 $44,265 $643 Adjustments to reconcile net income to net cash provided by operating activities: Compensation related to stock options........ 655 240 277 Depreciation and amortization................ 22,339 13,638 8,275 Deferred income taxes........................ (10,450) (9,543) (1,614) Tax benefit from exercise of stock options... 91,679 13,516 4,046 Loss on disposal of property and equipment... 714 4,557 307 Provision for doubtful accounts and returns, net................................ 7,478 6,613 2,348 Write-off of acquired research and development................................. -- -- 22,740 Changes in operating assets and liabilities: Accounts receivable........................ (170,766) (68,739) (41,344) Prepaids and other......................... (15,721) (6,744) (1,946) Accounts payable and accrued expenses...... 48,237 49,802 14,130 Income taxes payable....................... (10,803) 9,228 (1,896) Deferred revenue........................... 34,118 30,286 15,744 --------- --------- --------- Net cash provided by operating activities.............................. 119,572 87,119 21,710 --------- --------- ---------Cash flows from investing activities: Purchases of property and equipment............ (42,835) (39,581) (18,013) Purchases, sales and maturities of short-term investments, net.............................. (45,677) (56,751) (17,866) Proceeds from disposal of property and equipment..................................... 13,225 -- -- Cash acquired in acquisitions.................. 993 (31) 129 Other assets................................... (21,974) (2,641) (1,764) --------- --------- --------- Net cash used in investing activities.... (96,268) (99,004) (37,514) --------- --------- ---------Cash flows from financing activities: Proceeds from issuance of common stock, net of repurchases................................ 74,575 27,254 8,725 Proceeds from issuance of convertible debt, net..................................... 291,316 -- -- Borrowings on line of credit................... 5,874 1,542 130 Repayments of line of credit................... (7,659) -- -- Subchapter S distributions..................... (2,080) (2,366) (974) Repayment of stockholder notes................. -- -- (43) --------- --------- --------- Net cash provided by financing activities.............................. 362,026 26,430 7,838 --------- --------- ---------Effect of exchange rate changes in cash.......... (261) -- -- --------- --------- ---------Change in cash and cash equivalents.............. 385,069 14,545 (7,966)Adjustment to conform acquired company's year end -- (4,140) --Cash and cash equivalents, beginning of year..... 80,741 70,336 78,302

--------- --------- ---------Cash and cash equivalents, end of year........... $465,810 $80,741 $70,336 ========= ========= =========
Cash paid for interest........................... $3 $ -- $22 ========= ========= =========
Cash paid for income taxes....................... $14,537 $14,194 $14,579 ========= ========= =========
Supplemental disclosures of noncash financing and investing activities: Purchase price payable 20*20 Group, Ltd........ $ -- $6,000 $ -- ========= ========= =========
Common stock issued for acquisitions........... $4,934 $ -- $24,974 ========= ========= =========
Subchapter S distributions payable............. $ -- $745 $22 ========= ========= =========
Convertible notes issued for acquisitions...... $6,918 $ -- $ -- ========= ========= =========
See accompanying notes to consolidated financial statements.
SIEBEL SYSTEMS, INC.
NOTES TO CONSOLIDATED FINANCIAL STATEMENTS
(1) Summary of Significant Accounting Policies
The Company
Siebel Systems, Inc. ("Siebel" or the "Company") is the market leader in eBusiness application software for organizations focused on increasing sales, marketing and customer service effectiveness in field sales, customer service, telesales, telemarketing, call centers, and third-party resellers. The Company designs, develops, markets, and supports Siebel eBusiness Applications, a leading Web-based application software product family designed to meet the sales, marketing and customer service information system requirements of even the largest multi-national organizations.
In December 1999, the Company acquired OnTarget, Inc. ("OnTarget") in a business combination accounted for as a pooling of interests. Accordingly, all financial information has been restated to reflect the combined operations of the two companies. See Note 9.
Principles of Consolidation
The accompanying consolidated financial statements include the accounts of the Company and its wholly owned subsidiaries. All intercompany accounts and transactions have been eliminated.

Revenue Recognition
Prior to January 1, 1998, the Company recognized revenue in accordance with Statement of Position ("SOP") No. 91-1, "Software Revenue Recognition". Software license revenue was recognized when all of the following criteria had been met: there was an executed license agreement; software had been shipped to the customer; no significant vendor obligations remained; the license fee was fixed and payable within twelve months and collection was deemed probable.
On January 1, 1998, the Company adopted the provisions of Statement of Position No. 97-2 "Software Revenue Recognition". Revenue is recognized under SOP 97-2 when persuasive evidence of an arrangement exists and delivery has occurred, provided the fee is fixed and determinable, collectibility is probable and the arrangement does not require significant customization of the software. Under SOP 97-2, revenue on multiple element arrangements is allocated to the various elements based on fair values specific to the Company.
Professional services, maintenance and other revenues relate primarily to consulting services, maintenance and training. Maintenance revenues are recognized ratably over the term of the maintenance contract, typically 12 months. Consulting and training revenues are recognized as the services are performed and are usually on a time and materials basis. Such services primarily consist of implementation services related to the installation of the Company's products and do not include significant customization to or development of the underlying software code.
The Company's customer base includes a number of its suppliers (e.g., AT&T Corporation, BankBoston Robertson Stephens, Bank of America Corporation, Cabletron Systems, Inc., The Charles Schwab Corporation, Cigna Corporation, Cisco Systems, Inc., Compaq Computer Corporation, Dell Computer Corporation, Lucent Technologies, Inc., MCI WorldCom, Inc., Microsoft Corporation, NationsBanc Montgomery Securities, Inc., PeopleSoft, Inc., Siemens Corporation and Sun Microsystems, Inc.). On occasion, the Company has purchased goods or services for company operations from these vendors at or about the same time Siebel has licensed its software to these organizations. These transactions are separately negotiated and recorded at terms the Company considers to be arm's-length.
Cost of Revenues
Cost of software consists primarily of media, product packaging, documentation and other production costs, and third-party royalties. Cost of professional services, maintenance and other consists primarily of salaries, benefits and allocated overhead costs related to consulting, training and customer support personnel, including cost of services provided by third party consultants engaged by the Company.
Use of Estimates
The preparation of consolidated financial statements in conformity with generally accepted accounting principles requires management to make estimates and assumptions that affect the reported amounts of assets and liabilities and disclosure of contingent assets and liabilities at the date of the consolidated financial statements and the reported amounts of revenues and expenses during the reporting period. Actual results could differ from those estimates.
Cash, Cash Equivalents, Short-Term Investments and Marketable Equity Securities
The Company considers all highly liquid investments with a remaining maturity of 90 days or less to be cash equivalents. Short-term investments generally consist of highly liquid securities with original maturities in excess of 90 days. Marketable equity securities include an investment in a single publicly traded company. The Company has classified its short-term investments and marketable equity securities as "available for sale." Such investments are carried at fair value with unrealized gains and losses, net of related tax effects, reported within accumulated other comprehensive income (losses).

Realized gains and losses on available for sale securities are computed using the specific identification method.
Property and Equipment
Property and equipment are stated at cost less accumulated depreciation and amortization. Depreciation is calculated using the straight-line method over the estimated useful lives of the respective assets, generally three to five years. Leasehold improvements are amortized over the lesser of the lease term or the estimated useful lives of the improvements, generally seven years.
Expenditures for maintenance and repairs are charged to expense as incurred. Costs and accumulated depreciation of assets sold or retired are removed from the respective property accounts, and gain or loss is reflected in the statement of operations.
Software Development Costs
Software development costs associated with new products and enhancements to existing software products are expensed as incurred until technological feasibility in the form of a working model has been established. To date, the time period between the establishment of technological feasibility and completion of software development has been short, and no significant development costs have been incurred during that period. Accordingly, the Company has not capitalized any software development costs to date.
Intangible Assets
Included in other assets are various intangible assets, primarily goodwill related to acquisitions. These amounts are generally being amortized over three to five years using the straight-line method. Gross intangible assets were $14,135,000 and $9,627,000 and related accumulated amortization was $3,656,000 and $2,503,000 at December 31, 1999 and 1998, respectively.
Other Assets
Included in other assets is the Company's investment in Sales.com. In December 1999, the Company sold a controlling interest in Sales.com's voting equity to various outside investors. As a result, Sales.com is no longer being consolidated in the Company's financial statements, but is accounted for by the equity method. At December 31, 1999, the carrying value of the Company's investment in Sales.com was approximately $5,000,000.
The Company had non-cash reductions in accounts receivable, prepaids and other, property equipment, other assets, accounts payable, accrued expenses and deferred revenue of $116,000, $602,000, $35,000, $505,000, $4,398,000, $5,275,000 and $149,000, respectively, attributable to the deconsolidation of Sales.com.
Advertising
Advertising costs are expensed as incurred. Advertising expense is included in sales and marketing expense and amounted to $22,766,000, $12,126,000 and $7,245,000 in 1999, 1998 and 1997, respectively.
Income Taxes
The Company uses the asset and liability method of accounting for income taxes. Deferred tax assets and liabilities are recognized for the estimated future tax consequences attributable to differences between the consolidated financial statement carrying amounts of existing assets and liabilities and their respective tax bases. Deferred tax assets are recognized for deductible temporary differences, net operating loss carryforwards and credit carryforwards if it is more likely than not that the tax benefits will be realized. To the extent a deferred tax asset cannot be recognized under the preceding criteria,

allowances must be established. Deferred tax assets and liabilities are measured using enacted tax rates in effect for the year in which those temporary differences are expected to be recovered or settled.
The pro forma provision for income taxes reflects income tax expense that would have been reported if OnTarget, Inc. (an S corporation for income-tax reporting purposes) had been a C corporation for each of the periods presented.
Pro Forma Net Income Per Share
Basic pro forma net income per share is computed using the weighted average number of shares of common stock outstanding. Diluted pro forma earnings per share is computed using the weighted average number of shares of common stock and, when dilutive, potential common shares from options to purchase common stock and warrants outstanding using the treasury stock method. Dilutive pro forma net income per share also gives effect, when dilutive, to the conversion of the convertible notes and subordinated debentures using the if-converted method.
Employee Stock Option and Purchase Plans
The Company accounts for its stock-based compensation plans using the intrinsic value method. As such, compensation expense is recorded on the date of grant if the current market price of the underlying stock exceeds the exercise price. The Company records and measures deferred compensation cost for options granted to non-employees at their fair value.
Foreign Currency Translation
The Company considers the functional currency of its foreign subsidiaries to be the local currency, and accordingly, they are translated into U.S. dollars using exchange rates in effect at period end for assets and liabilities and average exchange rates during each reporting period for the results of operations. Adjustments resulting from translation of foreign subsidiary financial statements are reported within accumulated other comprehensive income (loss).
The Company generally utilizes foreign currency forward contracts to hedge its exchange risk on foreign currency receivable and intercompany balances. While these forward contracts are subject to fluctuations in value, which are recorded in current results of operations, such fluctuations are generally offset by the changes in value of the underlying exposures being hedged. The Company does not hold or issue financial instruments for speculative or trading purposes.
Concentrations of Credit Risk
Financial instruments that potentially subject the Company to a concentration of credit risk principally consist of trade accounts receivable. The Company performs ongoing credit evaluations of its customers and generally does not require collateral on accounts receivable, as the majority of the Company's customers are large, well established companies. The Company maintains reserves for potential credit losses, but historically has not experienced any significant losses related to any particular industry or geographic area since the Company's business is not concentrated on any one particular customer or customer base. No single customer accounts for more than 10% of revenues, and the Company's largest customer base, high technology, which accounted for approximately 24% of revenues during the year ended December 31, 1999, is sufficiently broad that the Company does not consider itself significantly exposed to concentrations of credit risk.
Fair Value of Financial Instruments
The carrying amount of the Company's cash and cash equivalents, short-term investments, accounts receivable, and accounts payable approximate their respective fair values. Changes in the fair value of the Company's derivative financial instruments (foreign currency forward contracts) are generally offset by changes in the value of the underlying exposures being hedged. The unrealized loss of the Company's derivative financial instruments at December 31, 1999 was approximately $29,000.

The fair value of the Company's convertible subordinated debentures was $580,140,000 at December 31, 1999, based on quoted market price.
Impairment of Long-Lived Assets
The Company evaluates long-lived assets, including goodwill, for impairment whenever events or changes in circumstances indicate that the carrying value of an asset may not be recoverable based on expected undiscounted cash flows attributable to that asset. The amount of any impairment is measured as the difference between the carrying value and the fair value of the impaired asset. The Company does not have any long-lived assets it considers to be impaired.
Recent Accounting Pronouncements
In June 1998, the Financial Accounting Standards Board issued SFAS No. 133 "Accounting for Derivative Instruments and Hedging Activities". SFAS No. 133 establishes accounting and reporting standards for derivative instruments, including certain derivative instruments embedded in other contracts, (collectively referred to as derivatives) and for hedging activities. It requires that an entity recognize all derivatives as either assets or liabilities in the statement of financial position and measure those instruments at fair value. If certain conditions are met, a derivative may be specifically designated and accounted for as (a) a hedge of the exposure to changes in the fair value of a recognized asset or liability or an unrecognized firm commitment, (b) a hedge of the exposure to variable cash flows of a forecasted transaction, or (c) a hedge of the foreign currency exposure of a net investment in a foreign operation, an unrecognized firm commitment, an available-for-sale security, or a foreign-currency- denominated forecasted transaction. For a derivative not designated as a hedging instrument, changes in the fair value of the derivative are recognized in earnings in the period of change. This statement will be effective for all annual and interim periods beginning after June 15, 2000. Management does not believe the adoption of SFAS No. 133 will have a material effect on the Company's consolidated financial position or results of operations.
In December 1998, the Accounting Standards Executive Committee (AcSEC) of the AICPA issued SOP 98-9, "Software Revenue Recognition with Respect to Certain Arrangements", which requires recognition of revenue using the "residual method" in a multiple element arrangement when fair value does not exist for one or more of the undelivered elements in the arrangement. Under the "residual method", the total fair value of the undelivered elements is deferred and subsequently recognized in accordance with SOP 97-2. Management does not believe the adoption of SOP 98-9 will have a material effect on the Company's consolidated financial position or results of operations. SOP 98-9 will be effective for all annual and interim periods beginning on or after January 1, 2000.
(2) Financial Statement Details
Cash, Cash Equivalents, Short-Term Investments and Marketable Equity Securities
Cash equivalents consist of securities with remaining maturities of 90 days or less at the date of purchase. Short-term investments as of December 31, 1999 consisted of $58,481,000 of securities which mature in less than one year, $139,084,000 of securities which mature in one to five years and no securities which mature in over five years. Cash, cash equivalents and short- term investments and marketable securities consisted of the following as of December 31, 1999 (in thousands):
Unrealized ------------------- Cost Loss Gain Market --------- --------- --------- --------- Cash and cash equivalents: Cash............................ $35,039 $-- $-- $35,039

Certificates of deposit......... 1,685 -- -- 1,685 Money market funds.............. 401,162 -- -- 401,162 US treasury & agency securities. 6,628 -- -- 6,628 Corporate notes................. 21,292 (1) 5 21,296 --------- --------- --------- --------- $465,806 ($1) $5 $465,810 ========= ========= ========= ========= Short-term investments: US treasury securities.......... $34,436 ($551) $1 $33,886 Corporate notes.................. 32,182 (261) -- 31,921 Municipal securities............ 133,071 (1,315) 2 131,758 --------- --------- --------- --------- $199,689 ($2,127) $3 $197,565 ========= ========= ========= =========
Marketable equity securities....... $4,550 $-- $137,389 $141,939 --------- --------- --------- --------- $4,550 $-- $137,389 $141,939 ========= ========= ========= =========
Short-term investments as of December 31, 1998 consisted of $46,187,000 of municipal securities which mature in less then one year, and $94,980,000 of municipal securities which mature in one to five years and $10,721,000 of securities which mature in over five years. As of December 31, 1998, cost approximated market for short-term investments; realized and unrealized gains and losses were not significant.
Accounts Receivable, Net
Accounts receivable, net, consisted of the following (in thousands):
December 31, ------------------- 1999 1998 --------- --------- Trade accounts receivable......... $305,710 $136,411 Less: allowances for doubtful accounts and returns............ 12,700 10,330 --------- --------- $293,010 $126,081 ========= =========
Property and Equipment, Net
Property and equipment, net, consisted of the following (in thousands):
December 31, ------------------- 1999 1998

--------- --------- Computer equipment................ $33,150 $38,965 Furniture and fixtures............ 18,526 10,513 Computer software................. 12,310 8,735 Corporate aircraft................ 6,963 -- Leasehold improvements............ 19,531 9,058 --------- --------- 90,480 67,271 Less: accumulated depreciation.... 33,605 20,887 --------- --------- $56,875 $46,384 ========= =========
Accrued Expenses
Accrued expenses consisted of the following (in thousands):
December 31, ------------------- 1999 1998 --------- --------- Bonuses........................... $24,253 $23,091 Commissions....................... 20,552 17,810 Sales tax......................... 5,984 9,345 Vacation.......................... 8,306 3,967 Acquisition-related............... 2,486 7,450 Other............................. 63,504 26,522 --------- --------- $125,085 $88,185 ========= =========
Accumulated Other Comprehensive Income (Loss)
Accumulated other comprehensive income (loss) consisted of the following (in thousands):
December 31, ------------------- 1999 1998 --------- --------- Foreign currency translation adjustments.. ($255) ($870) Unrealized gains on securities............ 83,867 201 --------- --------- $83,612 ($669) ========= =========
Other Income, Net
Other income, net, consisted of the following (in thousands):

December 31, ----------------------------- 1999 1998 1997 --------- --------- --------- Realized gains on disposition of marketable equity securities...... $12,343 $ -- $ -- Charitable contributions........... (6,000) -- -- Interest income.................... 16,941 7,605 6,055 Interest expense................... (6,059) (68) (29) Other, net......................... (3,257) (1,279) (641) --------- --------- --------- $13,968 $6,258 $5,385 ========= ========= =========
(3) Convertible Subordinated Debentures
The Company completed a private placement of $300,000,000 of convertible subordinated debentures in September 1999. The seven-year term notes bear interest at a rate of 5.50% and are convertible into approximately 6,432,000 shares of the Company's common stock at any time prior to maturity, at a conversion price of approximately $46.64 per share, subject to adjustment under certain conditions. The notes may be redeemed, in whole or in part, by the Company at any time on or after September 15, 2002. The redemption price will range from $309,420,000 to $302,370,000 if the notes are redeemed between September 15, 2002 through September 14, 2006. Any redemption made on or after September 15, 2006 will be redeemed at $300,000,000. Accrued interest to the redemption date will be paid by the Company in each redemption.
(4) Commitments and Contingencies
Letters of Credit
In August 1996, the Company entered into a $1,325,000 secured letter of credit with a bank. This letter of credit, which expires July 2006, collaterizes the Company's obligations to a third party for lease payments.
In March 1999, the Company entered into an $8,400,000 secured letter of credit with a bank. This letter of credit, which expires November 2000, collateralizes the Company's obligations to a third party for tenant improvement costs.
In October 1999, the Company entered into two $8,400,000 secured letters of credit with a bank. These letters of credit, which expire October 2000 and January 2001, collateralize the Company's obligations to a third party for tenant improvement costs. The Company also entered into a $3,000,000 secured letter of credit with a bank. This letter of credit, which expires August 2000, collateralizes the Company's obligation to a third party for lease payments.
The letters of credit are secured by cash, cash equivalents and short- term investments.
Lease Obligations
As of December 31, 1999, the Company leased facilities under noncancelable operating leases expiring between 2000 and 2009. Future minimum lease payments are as follows (in thousands):

Year Ending December 31, ------------------------ 2000...................................... $33,501 2001...................................... 43,029 2002...................................... 41,306 2003...................................... 41,542 2004 and thereafter....................... 281,443 --------- $440,821 =========
Rent expense for the years ended December 31, 1999, 1998 and 1997, was $15,644,000, $11,904,000 and $6,469,000, respectively.
Employee Benefit Plan
The Company has a 401(k) plan that allows eligible employees to contribute up to 20% of their compensation, limited to $10,000 in 1999. Employee contributions and earnings thereon vest immediately. Although the Company may make discretionary contributions to the 401(k) plan, none have been made to date. A subsidiary made discretionary contributions of $244,000 and $154,000 to its 401(k) and profit-sharing plans in 1998 and 1997, respectively.
Legal Actions
In October 1999, SAP America, Inc. filed a complaint against the Company in the Court of Common Pleas of Delaware County, Pennsylvania. The complaint alleges tortious interference with contractual relations, predatory hiring, misappropriation of trade secrets, and unfair competition in connection with its employment of individuals formerly employed by SAP America or its affiliated companies. The Company believes the claims are without merit, and intends to defend them vigorously. The Company believes that the ultimate outcome of the action will not have a material effect on the Company's financial position or results of operations, although there can be no assurance as to the outcome of such litigation.
The Company is engaged in other legal actions arising in the ordinary course of business. The Company believes it has adequate legal defenses and believes that the ultimate outcome of these actions will not have a material effect on the Company's consolidated financial position or results of operations, although there can be no assurance as to the outcome of such litigation.
(5) Stockholders' Equity
Stock Split
On August 24, 1999 and October 20, 1999, respectively, the Company's Board of Directors and stockholders approved a two-for-one stock split (to be effected in the form of a stock dividend) which was paid on November 12, 1999. The accompanying consolidated financial statements have been restated to give effect to the stock split.
Pro Forma Net Income per Share
The following is a reconciliation of the number of shares used in the pro forma basic and proforma diluted earnings per share computations for the periods presented (in thousands):
Year Ended December 31,

----------------------------- 1999 1998 1997 --------- --------- --------- Shares used in basic pro forma net income per share computation......... 188,088 177,446 169,904 Effect of dilutive potential common shares............................... 37,724 24,758 21,434 Shares used in diluted pro forma net income............................... 467 -- -- --------- --------- --------- Shares used in diluted pro forma net income per share computation......... 226,279 202,204 191,338 ========= ========= =========
The Company excludes potentially dilutive securities from its diluted net income (loss) per share computation when either the exercise price of the securities exceeds the average fair value of the Company's common stock or the Company reported net losses, because their effect would be anti-dilutive. For the year ended December 31, 1999, the Company excluded 2,108,370 employee stock options with a weighted average exercise price of $60.09 per share from the earnings per share computation as their exercise prices exceeded the average fair value of the Company's common stock during the year and, accordingly, their inclusion would have been anti-dilutive. The Company also excluded 6,432,000 shares relating to the convertible subordinated debentures (see note 3) from the earnings per share computation as the effect would be antidilutive. During 1998, the Company excluded a total of 6,619,882 employee stock options with a weighted average exercise price of $14.36 per share from the earnings per share computation as their inclusion would have been anti-dilutive.
Employee Stock Option and Purchase Plans
The 1996 Equity Incentive Plan, which amended and restated the Company's 1994 Stock Option Plan and 1996 Supplemental Stock Option Plan and the 1998 Non-Officer Equity Incentive Plan (collectively, the "Plan"), provides for the issuance of up to an aggregate of 100,000,000 shares of common stock to employees, directors and consultants. The Plan provides for the issuance of incentive and nonstatutory stock options, restricted stock purchase awards, stock bonuses and stock appreciation rights.
Under the Plan, the exercise price for incentive stock options is at least 100% of the fair market value on the date of the grant. Options generally expire in 10 years; however, incentive stock options may expire in 5 years if the optionee owns stock representing more than 10% of the voting power of all classes of stock. Vesting periods are determined by the Board of Directors and generally provide for shares to vest ratably over 5 years.
The Plan also allows for the exercise of certain unvested options. Shares of common stock issued to employees upon exercise of unvested options are subject to repurchase by the Company at the original exercise price. The Company's ability to repurchase these shares expires at a rate equivalent to the current vesting schedule of each option. As of December 31, 1999, 7,177,200 shares of common stock had been issued to employees upon the exercise of unvested options, which are subject to repurchase, at a weighted average repurchase price of $0.12 per share. No compensation expense has resulted from repurchases of restricted shares since the amount of cash paid by the Company did not differ from the proceeds received from the employee from the sale of the restricted shares. The Company has not issued any other restricted stock purchase awards, stock bonuses or stock appreciation rights.
During the period from October 1995 through April 1996, the Company granted options to purchase an aggregate of 32,610,000 shares of common stock at exercise prices ranging from $0.07 to $0.82 per share. Based in part on an independent appraisal obtained by the Company's Board of Directors, and other factors, the Company recorded $748,000 of deferred compensation expense in 1995 and an additional $893,000 of deferred compensation expense in 1996 relating to these options. These amounts are being amortized over the vesting period of the individual options, generally five years.
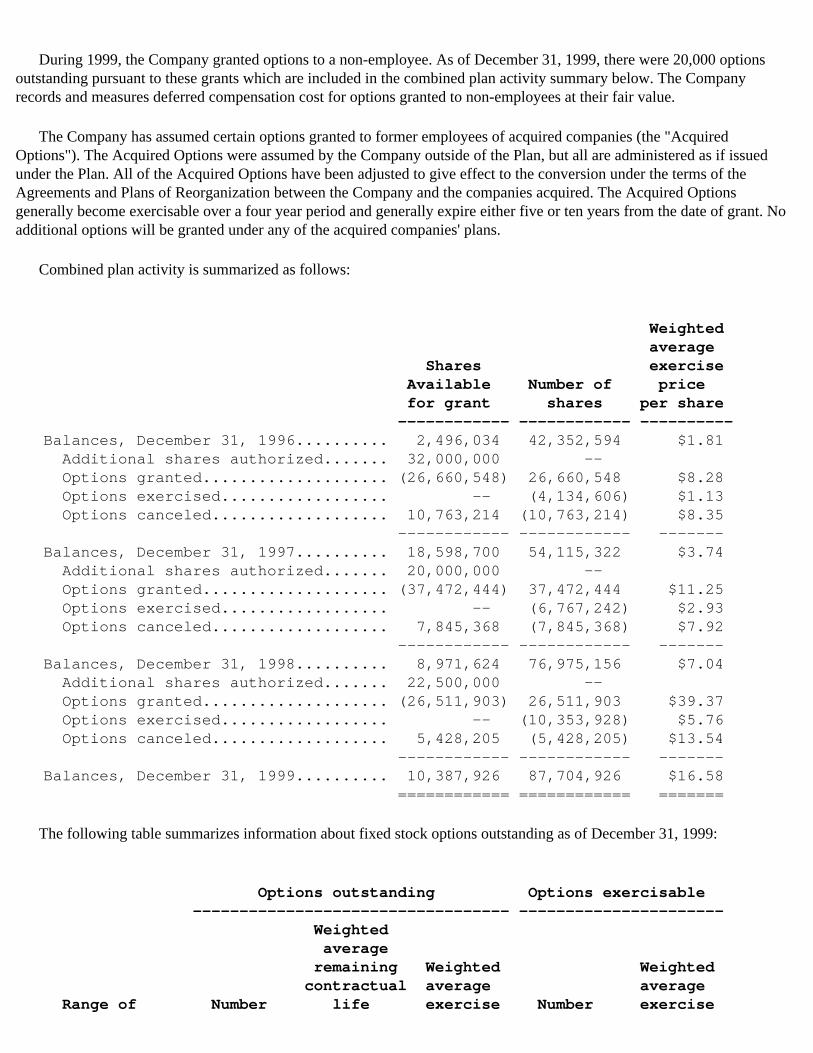
During 1999, the Company granted options to a non-employee. As of December 31, 1999, there were 20,000 options outstanding pursuant to these grants which are included in the combined plan activity summary below. The Company records and measures deferred compensation cost for options granted to non-employees at their fair value.
The Company has assumed certain options granted to former employees of acquired companies (the "Acquired Options"). The Acquired Options were assumed by the Company outside of the Plan, but all are administered as if issued under the Plan. All of the Acquired Options have been adjusted to give effect to the conversion under the terms of the Agreements and Plans of Reorganization between the Company and the companies acquired. The Acquired Options generally become exercisable over a four year period and generally expire either five or ten years from the date of grant. No additional options will be granted under any of the acquired companies' plans.
Combined plan activity is summarized as follows:
Weighted average Shares exercise Available Number of price for grant shares per share ------------ ------------ ---------- Balances, December 31, 1996.......... 2,496,034 42,352,594 $1.81 Additional shares authorized....... 32,000,000 -- Options granted.................... (26,660,548) 26,660,548 $8.28 Options exercised.................. -- (4,134,606) $1.13 Options canceled................... 10,763,214 (10,763,214) $8.35 ------------ ------------ ------- Balances, December 31, 1997.......... 18,598,700 54,115,322 $3.74 Additional shares authorized....... 20,000,000 -- Options granted.................... (37,472,444) 37,472,444 $11.25 Options exercised.................. -- (6,767,242) $2.93 Options canceled................... 7,845,368 (7,845,368) $7.92 ------------ ------------ ------- Balances, December 31, 1998.......... 8,971,624 76,975,156 $7.04 Additional shares authorized....... 22,500,000 -- Options granted.................... (26,511,903) 26,511,903 $39.37 Options exercised.................. -- (10,353,928) $5.76 Options canceled................... 5,428,205 (5,428,205) $13.54 ------------ ------------ ------- Balances, December 31, 1999.......... 10,387,926 87,704,926 $16.58 ============ ============ =======
The following table summarizes information about fixed stock options outstanding as of December 31, 1999:
Options outstanding Options exercisable ---------------------------------- ---------------------- Weighted average remaining Weighted Weighted contractual average average Range of Number life exercise Number exercise

exercise prices of shares (in years) price of shares price- ------------------ ----------- ----------- ---------- ----------- ---------- $0.01 194,100 5.0 $0.01 194,100 $0.01 $0.03 100,728 5.3 $0.03 100,728 $0.03 $0.06 250,050 5.8 $0.06 250,050 $0.06 $0.22 1,448,350 6.1 $0.22 1,448,350 $0.22 $0.33 - 0.37 4,173,802 6.2 $0.36 2,000,455 $0.36 $0.69 - 0.92 8,471,854 6.3 $0.71 4,307,367 $0.70 $1.44 - 2.13 2,693,643 6.3 $1.52 1,188,390 $1.51 $2.91 - 4.22 1,828,822 5.8 $4.08 695,420 $4.06 $5.49 - 8.11 10,996,446 6.9 $6.07 3,994,269 $6.08 $8.28 - 12.39 26,639,978 8.4 $10.34 6,779,622 $10.35 $12.44 - 18.51 9,602,056 8.7 $14.92 1,220,346 $13.79 $18.88 - 26.81 8,285,777 9.2 $21.43 268,192 $19.65 $29.22 - 42.30 5,079,400 9.6 $31.73 1,424 $29.56 $50.04 - 62.81 1,839,070 9.9 $62.70 262 $62.81 $81.06 6,100,850 10.0 $81.06 0 $81.06- ------------------ ----------- ----------- ---------- ----------- ---------- $0.01 - 81.06 87,704,926 8.00 $16.58 22,448,975 $5.58 =========== ===========
In May 1996, the Company adopted the 1996 Employee Stock Purchase Plan (the "Purchase Plan") and reserved 2,800,000 shares for issuance thereunder. The Purchase Plan became effective upon the completion of the Company's initial public offering. In January 1997, the Board of Directors of the Company adopted an amendment to the Purchase Plan to increase the number of shares authorized for issuance under the Purchase Plan to 6,800,000 shares. The Purchase Plan permits eligible employees to purchase common stock, through payroll deductions of up to 15% of the employee's compensation, at a price equal to 85% of the fair market value of the common stock at either the beginning or the end of each offering period, whichever is lower. As of December 31, 1999, 3,901,000 shares had been purchased under the Purchase Plan.
Common Stock
The Company has elected to continue to use the intrinsic value-based method to account for all of its employee stock-based compensation plans. The Company records deferred compensation costs related to employee stock options when the exercise price of each option equals or is less than the fair value of the underlying common stock as of the grant date for each stock option. The Company also recorded compensation expense for the estimated fair value of common stock transferred from the majority shareholders of OnTarget to two key employees in January 1998 and for options granted to one consultant in 1999.
Pursuant to SFAS No. 123, the Company is required to disclose the pro forma effects on net income (loss) and net income (loss) per share data as if the Company had elected to use the fair value approach to account for all its employee stock-based compensation plans. Had compensation cost for the Company's plans been determined consistent with the fair value approach enumerated in SFAS No. 123, the Company's net income (loss) and net income (loss) per share for the years ended December 31, 1999, 1998 and 1997 would have been as indicated below (in thousands, except per share data):
1999 1998 1997 --------- --------- --------- Pro forma net income (loss): As reported............................ $121,727 $43,460 $55

Pro forma giving effect to SFAS No 123. $94,998 $23,203 ($12,697)
Diluted pro forma net income (loss) per share: As reported............................ $0.54 $0.21 $0.00 Pro forma giving effect to SFAS No 123. $0.42 $0.11 ($0.07)
Basic pro forma net income (loss) per share: As reported............................ $0.65 $0.24 $0.00 Pro forma giving effect to SFAS No 123. $0.51 $0.13 ($0.07)
The fair value of options was estimated on the date of grant using the Black-Scholes option-pricing model with the following weighted- average assumptions used for option grants:
1999 1998 1997 --------- --------- --------- Risk-free interest rate................... 5.44% 4.85% 6.1% Expected life (in years).................. 3.4 3.4 3.5 Expected volatility....................... 69.0% 70.5% 83.9%
The fair value of employees' stock purchase rights under the Purchase Plan was estimated using the Black-Scholes model with the following weighted average assumptions used for purchases:
1999 1998 1997 --------- --------- --------- Risk-free interest rate................... 4.66% 5.3% 5.3% Expected life (in years).................. 0.5 0.6 0.7 Expected volatility....................... 69.0% 70.5% 83.9%
Under SFAS No. 123, the weighted average estimated fair value of employee stock options granted at exercise prices equal to market price at grant date during 1999, 1998 and 1997 was $20.86, $5.94 and $4.30 per share, respectively.
The Company determined the assumptions to be used in computing the fair value of stock options or stock purchase rights as follows. The risk-free rate is the U.S. treasury bill rate for the relevant expected life. The expected useful lives were estimated giving consideration to vesting and purchase periods, contractual lives, expected employee turnover and underlying stock volatility.
(6) Income Taxes
Income before taxes includes income from foreign operations of approximately $5,413,000, $3,600,000 and $680,000 for the years ended December 31, 1999, 1998 and 1997, respectively.
Historical Information
The components of income tax expense (benefit) for the years ended December 31, 1999, 1998 and 1997 are as follows (in thousands):

1999 1998 1997 --------- --------- --------- Current: Federal................................. ($8,796) $18,488 $7,694 State................................... -- 4,559 2,684 Foreign................................. 1,586 1,289 400 --------- --------- --------- Total current......................... (7,210) 24,336 10,778 Deferred: Federal................................. (5,359) (6,432) (1,345) State................................... (4,280) (1,409) (219) --------- --------- --------- Total deferred........................ (9,639) (7,841) (1,564)
Charge in lieu of taxes attributable to employer's stock option plans........ 91,679 13,517 4,046 --------- --------- --------- Total income taxes.................... $74,830 $30,012 $13,260 ========= ========= =========
The differences between the income tax expense computed at the federal statutory rate of 35% and the Company's actual income tax expense for the years ended December 31, 1999, 1998 and 1997 are as follows:
1999 1998 1997 --------- --------- --------- Expected income tax expense.............. 35.0% 35.0% 35.0% State income taxes, net of federal tax benefit............................ 4.7% 4.4% 13.4% In-process research and development...... -- -- 57.2% Non-deductible merger costs.............. -- 4.5% -- Research and experimentation credit...... (0.7%) (1.1%) (3.9%) Tax exempt interest...................... (1.0%) (2.4) (7.0%) Foreign sales corporation benefit........ -- (0.8%) -- S corporation benefit.................... -- (1.1%) (4.2%) Other, net............................... -- 1.9% 4.9% --------- --------- --------- Total income taxes..................... 38.0% 40.4% 95.4% ========= ========= =========
The tax effects of temporary differences that give rise to significant portions of deferred tax assets and liabilities as of December 31, 1999 and 1998 are as follows in thousands:
1999 1998 --------- --------- Deferred tax assets: Deferred state taxes.............................. $ -- $549

Accruals and reserves, not currently taken for tax purposes................................. 4,679 8,048 Allowance for doubtful accounts and returns....... 4,901 4,438 Charitable contribution carryforward.............. 2,451 -- Research and development credit carryforward...... 2,800 -- Net operating loss carryforward................... 1,326 235 Gain on investment................................ 5,183 -- Other............................................. 2,225 -- --------- --------- Deferred assets.................................. 23,565 13,270
Deferred tax liabilities: Unrealized gain on marketable securities.......... (51,397) -- Depreciation...................................... (1,439) (783) --------- --------- Deferred liabilities............................. (52,836) (783) --------- --------- Net deferred assets (liabilities)................ ($29,271) $12,487 ========= =========
As of December 31, 1999, the Company had state net operating loss carryforwards of approximately $23,000,000 available to offset future state taxable income. In addition, the Company had federal and state research and devlopment credit carryforwards of $1,600,000 and $1,200,000, respectively available to offset future tax liabilities. The Company's state net operating loss carryforwards expire in 2004 if not utilized. The Company's federal research and development credit carryforward expires in 2019, if not utilized. The state research and development credit can be carried forward indefinitely.
Management believes it is more likely than not that future operations will generate sufficient taxable income to realize any deferred tax assets.
Pro Forma Income Taxes
The pro forma provision for income taxes reflects the income tax expense that would have been reported if OnTarget Inc. (an S corporation for income tax reporting purposes) had been a C corporation for each of the years in the three-year period ended December 31, 1999. The components of pro forma income tax expense are as follows (in thousands):
1999 1998 1997 --------- --------- --------- Current: Federal................................. ($8,548) $19,192 $8,211 State................................... -- 4,660 2,755 Foreign................................. 1,586 1,289 400 --------- --------- --------- Total current......................... (6,962) 25,141 11,366 Deferred: Federal................................. (5,288) (6,432) (1,345) State................................... (4,234) (1,409) (219) --------- --------- --------- Total deferred........................ (9,522) (7,841) (1,564)

Charge in lieu of taxes attributable to employer's stock option plans........ 91,679 13,517 4,046 --------- --------- --------- Total income taxes.................... $75,195 $30,817 $13,848 ========= ========= =========
The differences between the pro forma income tax expense computed at the federal statutory rate of 35% and the Company's actual pro forma income tax expense for the years ended December 31, 1997, 1998 and 1999 are as follows:
1999 1998 1997 --------- --------- --------- Expected income tax expense.............. 35.0% 35.0% 35.0% State income taxes, net of federal tax benefit............................ 4.7% 4.4% 13.4% In-process research and development...... -- -- 57.2% Non-deductible merger costs.............. -- 4.5% -- Research and experimentation credit...... (0.7%) (1.1%) (3.9%) Tax exempt interest...................... (1.0%) (2.4%) (7.0%) Foreign sales corporation benefit........ -- (0.8%) -- Other, net............................... -- 1.9% 4.9% --------- --------- --------- Total income taxes..................... 38.0% 41.5% 99.6% ========= ========= =========
Deferred tax assets and liabilities on a pro forma basis do not differ materially from the historical information presented above.
(7) Related Party Transactions
Certain members of the Company's Board of Directors serve as officers for customers of the Company. In 1999, aggregate license revenues associated with shipments to these customers were $1,382,000 and accounts receivable from these customers was $2,460,000. In 1998, aggregate revenues associated with shipments to these customers were $1,763,000 and accounts receivable from these customers was $1,335,000.
(8) Segment and Geographic Information
The Company and its subsidiaries are principally engaged in the design, development, marketing and support of Siebel eBusiness Applications, its family of proprietary software applications. Substantially all revenues result from the licensing of the Company's software products and related consulting and customer support (maintenance) services. The Company's chief operating decision maker reviews financial information presented on a consolidated basis, accompanied by disaggregated information about revenues by geographic region for purposes of making operating decisions and assessing financial performance. Accordingly, the Company considers itself to be in a single industry segment, specifically the license, implementation and support of its software applications.
The Company evaluates the performance of its geographic regions based on revenues and gross margin only. The Company does not assess the performance of its geographic regions on other measures of income or expense, such as depreciation and amortization, operating income or net income. In addition, as the Company's assets are primarily located in its corporate office in the United States and not allocated to any specific region, the Company does not produce reports for, or measure the performance of, its geographic regions based on any asset-based metrics. Therefore, geographic information

is presented only for revenues and gross margin.
While a majority of the Company's revenues are derived from the United States, the Company's export sales have been growing. Export sales for the years ended December 31, 1999, 1998 and 1997 were $157,300,000, $88,200,000 and $41,800,000, respectively. This represented 31%, 30% and 27% of total license revenues, respectively. The Company's export sales are principally in Europe and Asia/Pacific.
The following geographic information is presented for the years ended December 31, 1999, 1998 and 1997 (in thousands):
North Asia Year America Europe Pacific Other Totals ------- --------- --------- --------- --------- --------- Revenues: 1999 $597,034 $158,948 $11,331 $23,607 $790,920 1998 293,872 75,364 24,424 16,226 409,886 1997 171,491 35,052 10,115 5,413 222,071
Gross margin: 1999 $428,768 $148,109 $28,077 $5,048 $610,002 1998 241,529 62,699 20,824 13,847 338,899 1997 141,976 30,535 9,161 4,360 186,032
No single customer has accounted for 10% or more of total revenues in 1999, 1998 or 1997.
(9) Acquisitions
OnTarget, Inc.
In January and February 1999, OnTarget acquired Target Marketing Systems Worldwide Limited, Target Marketing Systems S.A., and The Sales Consultancy Inc. in exchange for convertible notes and OnTarget stock. OnTarget recorded goodwill of $9,745,000 in connection with these acquisitions. The goodwill is being amortized over a five-year period using the straight-line method. Pro forma information giving effect to these mergers has not been presented since it would not differ materially from the historical results of the Company.
On December 1, 1999, the Company acquired OnTarget, Inc. OnTarget develops and implements advanced sales and marketing training and consulting programs for sales organizations competing in complex, multilevel sales campaigns. Primary customers include corporate clients and business owners who wish to provide for the development and training of their sales and marketing personnel.
Under the terms of the agreement, each outstanding share of OnTarget common stock was exchanged for 0.3077516 newly issued shares of common stock of the Company. This resulted in the issuance of approximately 3,700,000 additional shares of the Company's common stock. In addition, all outstanding stock options of OnTarget were converted into the right to acquire the Company's common stock at the same exchange ratio with a corresponding adjustment to the exercise price.
The acquisition of OnTarget has been accounted for as a pooling of interests. Accordingly, the financial position, results of operations and cashflows of OnTarget have been combined with those of the Company for the same dates and periods as if the entities had been combined from the earliest date presented. There were no adjustments to conform accounting methods. The Company did not incur any significant merger-related costs in connection with the acquisition of OnTarget.

As a result of OnTarget's conversion from a Subchapter S Corporation to a Subchapter C subsidiary of the Company on December 1, 1999, all of OnTarget's retained earnings at that date were reclassified to additional paid-in-capital. In addition, the Company recorded an income tax benefit in the amount of OnTarget's net deferred tax assets at that date.
Scopus Technology, Inc.
On May 18, 1998, the Company completed the acquisition of Scopus of Emeryville, California, a leading provider of customer service, field service, and call center software solutions. Under the terms of the agreement, each outstanding share of Scopus common stock was exchanged for newly issued shares of common stock of the Company. This resulted in the issuance of approximately 30,200,000 additional shares of the Company's common stock. In addition, all outstanding stock options of Scopus were converted into the right to acquire the Company's common stock at the same exchange ratio, with a corresponding adjustment to the exercise price. In connection with the merger, the Company incurred direct merger-related expenses of approximately $13,500,000, including fees for investment bankers, attorneys, accountants and other professional fees of $9,100,000, integration charges related to duplicate facilities and equipment of $3,100,000 and other miscellaneous expenses of $1,300,000.
The transaction has been accounted for as a pooling of interests. Accordingly, the financial statements of Siebel have been restated to include the financial position and results of operations of Scopus for all periods presented. Prior to the merger with Siebel, Scopus ended its fiscal year on March 31. The restated financial statements as of December 31, 1997 and for prior periods include Siebel's results of operations for the calendar periods noted and Scopus' results of operations for the fiscal periods ending three months later. Beginning January 1, 1998, the restated financial statements combine the operating results of Siebel and Scopus for the calendar periods noted. As a result of conforming the reporting periods of Siebel and Scopus, the operating results of Scopus for the three month period ended March 31, 1998 are included in the restated financial statements for both 1997 and 1998. Scopus revenues and net income for the three-month period ended March 31, 1998 were $27,100,000 and $1,500,000, respectively. Net income for this period of approximately $1,500,000 is reflected as a reduction of opening retained earnings in the restated 1998 consolidated financial statements.
The results of operations for the separate companies and the combined amounts presented in the consolidated financial statements follow (in thousands).
Nine Months Year Year Ended Ended Ended September 30, December 31, December 31, 1999 1998 1997 ------------- ------------ ------------ (unaudited) Total revenues: Siebel.......................... $493,783 $364,467 $118,775 Scopus.......................... -- 27,072 88,853 On Target....................... 29,152 18,347 14,443 ------------- ------------ ------------ $522,935 $409,886 $222,071 ============= ============ ============
Net income (loss): Siebel.......................... $77,195 $41,411 ($2,427) Scopus.......................... -- 1,464 1,240 On Target....................... (80) 1,390 1,830

------------- ------------ ------------ $77,115 $44,265 $643 ============= ============ ============
In combining the financial statements of Siebel and Scopus, certain reclassifications, conforming changes and adjustments relating to revenue recognition were made to the historical financial statements of Scopus. These conforming changes and adjustments resulted in a reduction of previously reported net income of approximately $2,930,000 in fiscal 1997 and $580,000 in fiscal 1996. These adjustments will not reverse in future periods.
20*20 Group, Ltd.
On December 17, 1998, the Company acquired all of the outstanding securities of the privately-held 20*20 Group, Ltd. ("20*20"), a provider of end-user training for the enterprise relationship management software market. The transaction was valued at approximately $6,000,000 and was accounted for by the purchase method of accounting. Accordingly, the operating results of 20*20 have been included in the accompanying consolidated financial statements of the Company from the date of acquisition. The purchase price was allocated to tangible net assets, including current assets, current liabilities and property, plant and equipment. The excess of the purchase price over the fair value of the tangible net assets acquired, $5,500,000, was allocated to goodwill. This amount is being amortized over three years.
The results of operations of 20*20 prior to the acquisition date are not considered material to the consolidated results of operations of the Company and, accordingly, pro forma financial statement information has not been presented.
InterActive WorkPlace, Inc
On October 1, 1997, the Company issued shares of common stock in exchange for all outstanding securities of privately-held InterActive WorkPlace, Inc. ("InterActive"), a developer of intranet- based business intelligence software technology. The transaction was valued at approximately $15,000,000 and was accounted for by the purchase method of accounting. Accordingly, the operating results of InterActive have been included in the accompanying consolidated financial statements of the Company from the date of acquisition. Under the terms of the agreement, InterActive's security holders received or will receive up to approximately 1,708,000 shares of the Company's common stock in exchange for all outstanding shares in InterActive. Additionally, InterActive optionees received options to purchase an aggregate of approximately 128,000 shares of the Company's common stock in exchange for their options to purchase InterActive common stock. The excess of the purchase price over the fair value of the net assets acquired was allocated to purchased in-process research and development and intangible assets of $14,017,000 and $104,000, respectively. The purchased in-process research and development was charged to operations in the fourth quarter of 1997. The amounts allocated to intangible assets are being amortized over three years.
Purchased in-process research and development is related to the completion of InterActive's data integration, filtering and formatting technology and its integration into the Company's products. At the time of acquisition, a prototype of InterActive's product existed and was in limited trials, however, the prototype was not stable or sufficiently developed to be scalable on an enterprise-wide basis. InterActive's technology was completed, at a cost of approximately $400,000, and incorporated as a separate component of the Siebel 98 product suite which was released in June 1998. The Company estimated that the technology was approximately 75% complete as of the acquisition date. At that date, the only identifiable asset acquired was the technology under development. Accordingly, essentially all of the excess purchase price over net assets acquired, except for amounts assigned to net current assets, fixed assets and workforce-in-place, was assigned to in-process research and development.
The results of operations of InterActive prior to the acquisition date are not considered material to the consolidated results of operations of the Company and, accordingly, pro forma financial information has not been presented.

Nomadic Systems, Inc
On November 1, 1997, the Company issued shares of common stock in exchange for all outstanding securities of privately-held Nomadic Systems, Inc. ("Nomadic"), a provider of innovative business solutions to pharmaceutical sales forces. The transaction was valued at approximately $11,000,000 and was accounted for by the purchase method of accounting. Accordingly, the operating results of Nomadic have been included in the accompanying consolidated financial statements of the Company from the date of acquisition. Under the terms of the agreement, Nomadic's securityholders received approximately 1,200,000 shares of the Company's common stock in exchange for all outstanding shares of Nomadic. The purchase price was allocated to net current assets, fixed assets, purchased in-process research and development and intangible assets of $557,000, $186,000, $8,723,000 and $1,553,000, respectively. The purchased in-process research and development was charged to operations in the fourth quarter of 1997. The amounts allocated to intangible assets are being amortized over three years.
The appraisal of the acquired research and development was based upon the present value of forecasted operating cash flows from the technology acquired, giving effect to the stage of completion at the acquisition date. These forecasted cash flows were then discounted at a rate which gave consideration to the risk involved in completing the acquired technology. The forecasted cash flows assumed inclusion of the product developed from acquired technology into the existing Siebel product suite.
The purchased in-process research and development expense related to completion of Nomadic's second generation pharmaceutical sales force automation product. At the time of the acquisition, Nomadic had a first-generation product at a limited number of customers, with a very small user base. There were a considerable number of uncertainties as to increasing the product's scalability for deployment on an enterprise-wide basis, improving the stability of the application and identifying and fixing bugs. The Company allocated limited excess purchase price over net assets acquired to net current assets, fixed assets and workforce-in-place. The majority of the excess purchase price was allocated to in-process research and development and other intangible assets (goodwill) based upon the expected cash flows from Nomadic's existing product and the product under development, giving consideration to the stage of completion of the technology under development at the acquisition date. This technology was completed, at a cost of approximately $1,300,000, for enterprise-wide release in March 1998.
The results of operations of Nomadic prior to the acquisition date are not considered material to the consolidated results of operations of the Company and, accordingly, pro forma financial statement information has not been presented.
Clear With Computers, Inc.
The Company incurred merger costs of approximately $3,300,000 in the third quarter of 1997 in connection with Scopus' planned merger with Clear With Computers, Inc. The merger plan was terminated early in the fourth quarter of 1997.
(10) Subsequent Events
On January 6, 2000, the Company acquired all of the outstanding securitites of Paragren Technologies, Inc. ("Paragren") , a leading provider of high-performance marketing automation software based in Reston, Virginia. Paragren was a previously wholly owned subsidiary of APAC Customer Services, Inc. The transaction was valued at approximately $18,000,000 and was accounted for by the purchase method of accounting. The purchase price was allocated to tangible net assets, including current assets, current liabilities and property, plant and equipment. The excess of the purchase price over the fair value of the tangible net assets acquired, $17,500,000, was allocated to intangible assets and will be amortized over five years.
(11) Selected Quarterly Financial Data (unaudited)
The following table presents selected quarterly information for 1999 and 1998 (in thousands, except share data):

First Second Third Fourth quarter quarter quarter quarter --------- --------- --------- --------- 1999: Net revenues......................... $141,708 $174,882 $206,345 $267,985 Gross margin......................... 114,573 135,937 155,091 204,401 Net income........................... 22,000 25,853 29,262 44,977 Pro forma net income................. 21,756 25,816 29,572 44,583 Pro forma net income per diluted share...................... 0.10 0.12 0.13 0.19 Pro forma net income per basic share........................ 0.12 0.14 0.16 0.23
1998: Net revenues......................... $78,597 $93,868 $109,322 $128,099 Gross margin......................... 65,978 75,422 90,449 107,050 Net income (loss).................... 10,057 (511) 14,859 19,860 Pro forma net income (loss).......... 9,881 (729) 14,539 19,769 Pro forma net income (loss) per diluted share...................... 0.05 (0.00) 0.07 0.10 Pro forma net income (loss) per basic share........................ 0.06 (0.00) 0.08 0.11
Schedule II
Valuation and Qualifying Accounts
Balance Charged Balance at to at Beginning Costs and End of of Year Expenses Deductions Year --------- --------- ---------- --------- (in thousands) Allowance For Doubtful Accounts: Year ended December 31, 1999..... $10,330 $7,478 $5,108 $12,700 Year ended December 31, 1998..... $4,288 $6,230 $188 $10,330 Year ended December 31, 1997..... $1,940 $4,920 $2,572 $4,288

SIEBEL SYSTEMS, INC.
SIGNATURE
Pursuant to the requirements of Section 13 or 15(d) of the Securities Exchange Act of 1934, the registrant has duly caused this report to be signed on its behalf by the undersigned, thereunto duly authorized.
SIEBEL SYSTEMS, INC. (Registrant)
Dated: March 28, 2000
By: /s/ Howard H. Graham Howard H. Graham Senior Vice President Finance and
Administration and Chief Financial Officer
(Principal Financial Officer)
POWER OF ATTORNEY
KNOW ALL PERSONS BY THESE PRESENTS, that each of the persons whose signature appears below hereby constitutes and appoints Thomas M. Siebel and Howard H. Graham, each of them acting individually, as his or her attorney-in-fact, each with the full power of substitution, for him or her in any and all capacities, to sign any and all amendments to this Annual Report on Form 10-K, and to file the same, with all exhibits thereto and other documents in connection therewith, with the Securities and Exchange Commission, granting unto said attorneys-in-fact, and each of them, full power and authority to do and perform each and every act and thing requisite and necessary to be done in and about the premises as fully to all intents and purposes as he or she might or could do in person, hereby ratifying and confirming our signatures as they may be signed by ours said attorney-in-fact and any and all amendments to this Annual Report on Form 10-K.
Pursuant to the requirements of the Securities Exchange Act of 1934, this Annual Report on Form 10-K has been signed by the following persons in the capacities and on the dates indicated.
Signature Title Date- --------------------------- ---------------------------------- ---------------/s/ Thomas M. Siebel Chairman, Chief Executive March 28, 2000__________________________ Officer and DirectorThomas M. Siebel (Principal Executive Officer)

/s/ Howard H. Graham Senior Vice President Finance March 28, 2000__________________________ and Administration and ChiefHoward H. Graham Financial Officer (Principal Financial and Accounting Officer)
/s/ James C. Gaither Director March 28, 2000__________________________James C. Gaither
/s/ Eric E. Schmidt, Ph.D. Director March 28, 2000__________________________Eric E. Schmidt, Ph.D.
/s/ Charles R. Schwab Director March 28, 2000__________________________Charles R. Schwab
/s/ George T. Shaheen Director March 28, 2000__________________________George T. Shaheen
/s/ A. Michael Spence, Ph.D. Director March 28, 2000__________________________A. Michael Spence, Ph.D.
EX-3.2 2 CERTIFICATE
CERTIFICATE OF AMENDMENT OF THE
AMENDED AND RESTATED CERTIFICATE OF INCORPORATION
OF SIEBEL SYSTEMS, INC.
SIEBEL SYSTEMS, INC., a corporation organized and existing under and by virtue of the General Corporation Law of the state of Delaware, does hereby certify:
FIRST: The name of the corporation is Siebel Systems, Inc. The corporation was originally Incorporated under the name

european headquarters
Siebel Systems uk Limited20-22 The Avenue, Egham
Surrey, tw20 9au, United KingdomTel +44 (0) 1784 494900
Fax +44 (0) 1784 494901
japanese headquarters
Siebel Systems Japan k.k.Ebisu Prime Square 7f
1-1-39 Hiroo, Shibuya-KuTokyo, 150-0012, Japan
Tel +81-3-5469-3811
Fax +81-3-5469-3812
world headquarters
Siebel Systems, Inc.2207 Bridgepointe Parkway
San Mateo, California 94404
Tel 650 295-5000
Fax 650 295-5111
www.siebel.com
Siebel_AR_for_PDF 7/18/00 4:19 PM Page 53