Embed Size (px)
Citation preview

1 | P a g e
THE USE OF A COMMERCIAL LOOP-MEDIATED ISOTHERMAL AMPLIFICATION ASSAY (TB-LAMP) FOR THE DETECTION OF TUBERCULOSIS
EXPERT GROUP MEETING REPORT GENEVA: MAY 2013
This report contains the collective views of an international group of experts, and does not necessarily represent the decisions or the stated policy of the World Health Organization. Mention of a technology does not imply endorsement of any specific commercial product.

2 | P a g e
© World Health Organization 2013 All rights reserved. Publications of the World Health Organization are available on the WHO web site (www.who.int) or can be purchased from WHO Press, World Health Organization, 20 Avenue Appia, 1211 Geneva 27, Switzerland (tel.: +41 22 791 3264; fax: +41 22 791 4857; e-mail: [email protected]). Requests for permission to reproduce or translate WHO publications – whether for sale or for noncommercial distribution – should be addressed to WHO Press through the WHO web site (http://www.who.int/about/licensing/copyright_form/en/index.html). The designations employed and the presentation of the material in this publication do not imply the expression of any opinion whatsoever on the part of the World Health Organization concerning the legal status of any country, territory, city or area or of its authorities, or concerning the delimitation of its frontiers or boundaries. Dotted lines on maps represent approximate border lines for which there may not yet be full agreement. The mention of specific companies or of certain manufacturers’ products does not imply that they are endorsed or recommended by the World Health Organization in preference to others of a similar nature that are not mentioned. Errors and omissions excepted, the names of proprietary products are distinguished by initial capital letters. All reasonable precautions have been taken by the World Health Organization to verify the information contained in this publication. However, the published material is being distributed without warranty of any kind, either expressed or implied. The responsibility for the interpretation and use of the material lies with the reader. In no event shall the World Health Organization be liable for damages arising from its use. WHO/HTM/TB/2013.05

3 | P a g e
Executive summary
Background
Nucleic acid amplification offers major advantages of speed and sensitivity for pathogen detection, but until recently, no commercial versions of these systems were designed to be simple enough or inexpensive enough to implement in resource-limited countries. Recent research and development efforts have, however, led to the development of new molecular approaches which may change this paradigm.
TB-LAMP is a new manual TB detection method based on the novel loop-mediated isothermal amplification (LAMP) platform from Eiken Chemical Co. in Japan. TB-LAMP has several features that makes it attractive as a diagnostics platform for resource-poor settings: it is fast (15-40 min), isothermal (requiring only a heat block), robust to inhibitors and reaction conditions that usually adversely affect polymerase chain reaction (PCR) methods, and it generates a result that can be detected with the naked eye. Since 2005, FIND and Eiken have been collaborating to develop an assay for TB that could be implemented in place of microscopy to improve the accuracy of TB detection at microscopy centres and similar laboratories.
The agreed performance targets for the development efforts were such that the new test must not only be equal or superior to sputum smear microscopy in ease-of-use, speed, and specificity, but that it must also be significantly more sensitive. During development, a number of important design changes were made to try to meet this goal, including the development of a simple manual extraction technology. Assay development is now completed, and a TB LAMP kit is registered with the Japanese regulatory authorities and CE marked.
The TB LAMP assay is designed to require, as much as possible, a similar number of steps and biosafety requirements as sputum smear microscopy. Users pipette-transfer a small volume of sputum to a heating tube already containing lysis mix and heat this at 90°C for 5 minutes. The heating tube is then joined to a tube containing an absorbent material which removes amplification inhibitors. The extract can then be expressed directly from this tube into the reaction tube, which contains dried-down reagents under the cap. After inversion to reconstitute the reaction mix, tubes are placed into the warming block for 40 minutes and the stable result, which is turbid and fluorescent, is examined with the naked eye. There are no moving parts to the system, and no requirement for additional pieces of equipment or reagents.
Formal evaluation in a hospital setting in Japan was carried out to support Japanese registration. Subsequently, a series of clinical studies were carried out by FIND in reference centres and in settings of intended use to determine the performance and applicability of the assay relative to microscopy and with conventional culture as reference standard in high-burden TB countries.
Summary of results
Validation study (industry sponsored): This study involved 170 patients at two hospital settings in Japan. 320 TB-LAMP tests were performed of which 205 were positive. The sensitivity of TB-LAMP was 98.2% among smear-positive/culture-positive samples and 55.6% among smear-negative/culture-positives. Specificity for TB diagnosis was 93.9%.
Evaluation studies in TB reference laboratories: Multi-centre evaluation studies involving 1061 patients tested in reference laboratories in Vietnam, South Africa, Peru and Brazil showed that TB-LAMP detected almost 97% of smear-positive/culture-positive patients and 53% of smear-negative/culture-positive patients. Indeterminate rates were very low (<0.2%); however DNA contamination events were observed in some testing runs. The specificity of the TB-LAMP test across these studies was 94.7%, below the original performance target of 97%.
Users in TB reference laboratories found the operational aspects of TB LAMP generally advantageous. However, the failure of specificity meeting the original performance targets, and the lack of evidence that DNA contamination was responsible, led to a root cause analysis of false-positive results. Exposure of reaction tubes to humidity was identified as one of the possible causes of false-positives. Consequently, changes in packaging were made to improve the resealing of aluminum pouches containing the reaction tubes.
Evaluation studies in settings of intended use: Subsequent studies were carried out in 11 rural or simple urban microscopy centres in India, Uganda and Peru that were representative of settings of intended use and similar to those where sputum smear microscopy is the available routine diagnostic option. These settings had limited

4 | P a g e
bench space, frequent power outages, uncontrolled and often high ambient temperatures, and had no staff with prior molecular training.
Staff were trained intensively with standardised materials and underwent proficiency testing before study initiation. 1741 patients met the enrolment criteria and had a clear final diagnosis using local microscopy, with liquid plus solid media culture conducted as reference standard in a supervisory reference laboratory. All TB-LAMP positive but culture-negative results were considered to be false-positive.
In these settings of intended use, TB-LAMP performance was slightly superior to earlier studies in reference laboratories, detecting 97% of smear-positive patients and 62% of smear-negative TB. Indeterminate rates (1.5%) were slightly higher than in the studies in reference settings. The specificity of TB-LAMP (96.3%) was lower than that of microscopy (97.3%). The occurrence of false-positive results was not uniformly distributed across sites - specificity of TB-LAMP in Uganda and Peru was around 97%, but was 94% in India.
The root cause analysis showed that in settings of high heat and humidity, such as experienced in India during the studies, failure to follow manufacturer’s instructions, especially with regard to delays in either reconstituting the dried reagents or in starting the amplification reaction after reconstitution, could cause non-specific amplification in the absence of target M. tuberculosis DNA. This risk was exacerbated by the addition of inadequate volume of extracted DNA in the reaction tube. As a result of these findings, small alterations were made in the assay. The recommended reaction volume was increased from 25-35 µl to 30-35 µl, and training was altered to stress the importance of following procedural recommendations to avoid false-positive results.
Repeat evaluation studies in settings of intended use (Indian sites only): To assess the effectiveness of these modifications, a repeat enrollment was carried out in the same settings in India with additional training focusing on the temperature-sensitive steps identified during the root-cause analysis. 417 patients meeting study criteria were enrolled. No further evaluation of the revised protocol was undertaken. Overall, TB-LAMP specificity increased to 97.6% (95%CI 95.5-98.7). However, there were variations in the number of specimens tested and the specificity at the three different test sites varied. Almost 50% of the samples were tested at one site with a TB-LAMP specificity of 96.2% (95%CI 92.4-98.1).
End-user feedback: Operational appraisals were gathered from end users (laboratory technicians) and experts (laboratory directors, physicians and microbiologists) through questionnaire surveys. Experienced users generally found TB-LAMP to be simpler than microscopy, and preferable in settings with a microscopy workload exceeding 20 samples per day. Overall feedback from experienced users was positive and almost all agreed that TB-LAMP could be implemented at routine laboratories, and that it was less complex and faster than smear microscopy. However, the same users also stressed the possible risks for cross contamination, false-positive results, the user-dependence of TB-LAMP results, and the need for comprehensive training and quality assurance, which together with cost were seen as the most important obstacles to widespread implementation.
Expert Group Findings
The Expert Group recognized that TB-LAMP is a new assay which offers a manual molecular approach to TB detection that seems to be feasible in peripheral laboratories following extensive training. Several operational issues which would need to accompany any such technology were regarded as relevant: the need for electricity supply, adequate storage and waste disposal, stock monitoring, and temperature control in storage settings where temperatures are above manufacturer’s recommendation (currently 30°C for TB-LAMP). TB-LAMP has the advantages of being relatively high-throughput, not requiring sophisticated instrumentation, and being self-contained, without the need for complex biosafety facilities or ancillary equipment. The Expert Group did, however, note that these benefits must be weighed against the need for extensive training and quality assurance required to achieve reproducible results and the anticipated test cost relative to sputum smear microscopy.
Considering the balance of benefits and harms associated with implementing the TB-LAMP assay, the Expert Group noted that, in settings with a TB prevalence of 5%, the average positive predictive value of the test was 51.2% across the studies (range 33.3% - 56.6%). In such settings the number of true-positive results would be almost the same as the number of false-positive results. The Expert Group also noted that changes to the assay made following the detection of false positive-results in the India study was only re-evaluated in the one site in India where the false positive-results were initially observed.

5 | P a g e
The Expert Group was concerned that the modified assay was not re-evaluated at other evaluation settings of intended use, including high HIV prevalence settings. Furthermore, the Expert Group raised concerns that conventional Ziehl-Neelsen microscopy was used as the comparison test with the TB-LAMP assay and recommended that comparison should be made with LED fluorescence microscopy, given that LED microscopy is now regarded as the reference standard.
1 The Expert Group also noted that batching of samples (up to 14
samples) would minimize the cost per test given that the manufacturer recommends for a positive and negative control test to be included in each batch of the TB LAMP assay. However, concerns were raised that batching tests to minimize test costs could result in diagnostic delays for patients.
Expert Group Recommendations
The Expert Group agreed that LAMP technology has potential as a rapid TB diagnostic tool but that the body of evidence presented on the TB-LAMP assay was insufficient to make a recommendation either in favour of, or against the use of TB-LAMP as a replacement test for sputum smear microscopy. The Expert Group made the following recommendations to improve the evidence base for TB-LAMP:
The specificity of the TB-LAMP assay remains a major concern especially when the TB prevalence falls below 10%. In these settings (often found in high-burden TB countries), the positive predictive value for the assay is insufficient. Further research is therefore needed to improved assay specificity, especially for high-burden TB settings;
Further studies in different geographical regions are needed, especially in high HIV prevalence settings where the sensitivity of sputum smear microscopy is reduced;
Head-to-head comparison studies with TB-LAMP and LED microscopy are recommended given the increased sensitivity of LED compared with conventional light microscopy1;
Further research is recommended to simplify the technology and increase the user robustness of the assay, especially in settings where staff are unfamiliar with manual molecular techniques;
The anticipated cost of the TB-LAMP assay relative to microscopy was perceived as a major barrier to implementation and scale-up;
Evaluation of the TB-LAMP assay by more investigators is encouraged to enable further independent assessment.
1World Health Organization. Policy Statement on LED Fluorescence Microscopy. World Health Organization:
Geneva, 2011. Available at: http://www.stoptb.org/wg/gli/documents.asp
6 | P a g e
Contents 1. BACKGROUND.................................................................................................................................................................................................... 9
2. EVIDENCE SYNTHESIS .................................................................................................................................................................................... 13 2.1 Meeting objectives ......................................................................................................................................................................................... 14
2.2 GRADE evaluation ........................................................................................................................................................................................ 14 2.3 Meeting procedural issues .............................................................................................................................................................................. 18
3. FINDINGS ........................................................................................................................................................................................................... 18 3.1 Clinical validation study (industry sponsored) ................................................................................................................................................ 18
3.1.1 Study design ........................................................................................................................................................................................... 18 3.1.2 Study flow and study population ............................................................................................................................................................. 19
3.1.3 Results .................................................................................................................................................................................................... 19 3.1.4 Study conclusions ................................................................................................................................................................................... 20
3.2 Evaluation studies in TB reference laboratories (FIND-coordinated) .............................................................................................................. 21 3.2.1 Study design ........................................................................................................................................................................................... 21 3.2.2 Study flow and study population ............................................................................................................................................................. 21
3.2.3 Data management and analysis ............................................................................................................................................................... 23 3.2.4 Results .................................................................................................................................................................................................... 23
3.2.5 Indeterminate rate ................................................................................................................................................................................... 24 3.2.6 Study conclusions ................................................................................................................................................................................... 24
3.3 Evaluation studies in intended settings of use (FIND-coordinated) ................................................................................................................. 24 3.3.1 Study design ........................................................................................................................................................................................... 24
3.3.2 Study sites .............................................................................................................................................................................................. 27 3.3.3 Data management and analysis ............................................................................................................................................................... 29
3.3.4 Results .................................................................................................................................................................................................... 29 3.3.5 Study conclusions ................................................................................................................................................................................... 29
3.4 Second evaluation study in India (FIND-coordinated) .................................................................................................................................... 30 3.4.1 Study design ........................................................................................................................................................................................... 30
3.4.2 Study enrollment ..................................................................................................................................................................................... 30 3.4.3 Results .................................................................................................................................................................................................... 30
3.4.4 Conclusions ............................................................................................................................................................................................ 30 3.5 Costs and cost-effectiveness ........................................................................................................................................................................... 31

7 | P a g e
3.5.1 Objective ................................................................................................................................................................................................ 31
3.5.2 Methods .................................................................................................................................................................................................. 31 3.5.3 Results .................................................................................................................................................................................................... 33
3.5.4 Conclusion .............................................................................................................................................................................................. 35 4. GRADE evidence profile and summary of test accuracy ....................................................................................................................................... 35
4.1 Grade evidence profiles .................................................................................................................................................................................. 35 4.2 Quality of Evidence ....................................................................................................................................................................................... 37
4.3 Expert Group Observations ............................................................................................................................................................................ 37 4.4 Expert Group Recommendations .................................................................................................................................................................... 37
4.4 Grade evidence profiles .................................................................................................................................................................................. 39 5. Annexes ................................................................................................................................................................................................................... 44
Annex 1. List of Participants ................................................................................................................................................................................ 44 Annex 2. Meeting Agenda .................................................................................................................................................................................... 46
Annex 3: Declarations of Interest ......................................................................................................................................................................... 48 Annex 4. Evaluation studies with LAMP test ........................................................................................................................................................ 49
List of Tables
Table 1: QUADAS Assessment Tool ........................................................................................................................................................................... 15 Table 2: Significance of the four levels of evidence ...................................................................................................................................................... 17
Table 3: Sensitivity of TB-LAMP compared with culture and sputum smear result ...................................................................................................... 19 Table 4: Sensitivity and specificity of TB-LAMP and other commercial NAAT compared with culture ....................................................................... 20
Table 5: GRADE evidence profile: TB LAMP as a replacement test for conventional microscopy, stratified by smear status ...................................... 41 List of Figures
Figure 1: LAMP principle ............................................................................................................................................................................................ 10
Figure 2: Visual readout of LAMP results applying ultraviolet light ............................................................................................................................. 11
8 | P a g e
Figure 3: Schematic description of the workflow for TB-LAMP .................................................................................................................................. 13
Figure 4: Patient and sample flow at enrolment during evaluation studies at reference labs .......................................................................................... 22 Figure 5: Patient and sample flow during evaluation studies in intended settings of use ................................................................................................ 26

9 | P a g e
THE USE OF A COMMERCIAL LOOP-MEDIATED ISOTHERMAL AMPLIFICATION ASSAY (TB-LAMP) FOR THE DETECTION OF TUBERCULOSIS
1. BACKGROUND
Over the past five years, the Foundation for Innovative New Diagnostics (FIND) has partnered with Eiken Chemical Company (Eiken), Tokyo, Japan, to develop molecular assays for the detection of several infectious diseases (including TB, malaria, sleeping sickness and leishmaniasis) using their loop-mediated isothermal amplification platform (LAMP). This molecular method was chosen because of specific features, which favor its use in simplified testing systems that might be appropriate in resource-limited settings.
The fundamental amplification reaction requires four types of primers which are complementary to six regions of the target gene. As double stranded DNA is in a condition of dynamic equilibrium at a temperature around 65°C, one of the LAMP primers can anneal to the complementary sequence of double stranded target DNA, initiating DNA synthesis with the DNA polymerase with strand displacement activity displacing and releasing a single stranded DNA. Due to the complementarity of the 5’ end of the FIP and BIP primers in nearby regions of the target amplicon, loop structures are formed. This allows various sized structures consisting of alternately inverted repeats of the target sequence on the same strand to be formed in rapid succession (Figure 1).

10 | P a g e
Figure 1: LAMP principle (Available at: http://loopamp.eiken.co.jp/e/lamp/principle.html) The addition of loop primers, which contain sequences complementary to the single stranded loop region on the 5' end of the hairpin structure, speeds the reaction by providing a greater number of starting points for DNA synthesis. Using loop primers, amplification by 109 - 1010 times can be achieved within 15-30 minutes. The FIND-Eiken TB LAMP assay includes loop primers for a total of 6 primers binding to 8 locations. This requirement for homogeneous sequence at multiple binding-sites preserves the specificity of the assay even in the absence of a probe.
LAMP is relatively insensitive to the accumulation of DNA and DNA by-products (pyrophosphate salts), so the reaction proceeds until large amounts of amplicon are generated. This feature makes visible detection of successful amplification possible by using dsDNA-binding dyes such as SYBR green, by detecting turbidity caused by precipitating magnesium pyrophosphate, or by using a non-inhibitory fluorescing reagent that is quenched in the presence of divalent cations. In the

11 | P a g e
picture below, calcein, unquenched by pyrophosphate consumption of divalent cations, fluoresces under ultraviolet light. The turbid, fluorescent product is easily seen with the naked eye.
Figure 2: Visual readout of LAMP results applying ultraviolet light
The greatest challenge for using molecular assays in resource-limited settings is the complexity of sample preparation and DNA extraction. The lack of need for an initial denaturation step to form single-stranded DNA, the isothermal amplification conditions, the high amplification speed and efficiency, the requirement for only one inexpensive enzyme, the robustness to suboptimal reaction conditions or presence of inhibitors, and the generation of a visually detectable readout are all specific advantages that might allow the development of simple and inexpensive molecular tests that could be used at sputum smear microscopy facility level. Such features make LAMP an attractive platform for the development of nucleic acid amplification tests suitable for use in developing countries.
Since the signing of a joint development agreement between Eiken and FIND in 2005, the LAMP technique has been substantially modified with the aim to meet customer requirements in terms of ease of use and biosafety. This first LAMP research prototype for the detection of TB was evaluated in Peru, Bangladesh and Tanzania between January and May 2006. The overall appraisal of the assay in terms of performance and practicability was good, but the need for further simplification was identified to allow replacement of sputum smear microscopy by LAMP at peripheral laboratories.
The development of a novel specimen processing method allowed significant simplification of the assay. By adding a material to absorb inhibitory agents (PURE method) from the lysis mix, the usual DNA extraction, trapping, and wash steps could be eliminated entirely. The current TB assay, shown pictorially below, has only 16 steps and uses only 6 pieces of plastic. A small heating unit is the only instrumentation required and can be used for heating of specimens during specimen processing, for amplification and for the visual readout. Furthermore, the amplification target has been changed from gyrB only to IS6110 and gyrB, in order to enhance analytical sensitivity and to be able to test raw sputum without sputum pre-concentration steps and special biosafety measures. The redesigned assay completed clinical trials, received regulatory approval in Japan and Europe and is being manufactured under CE IVD and Japanese GMP process-control conditions.
The final version of TB-LAMP consists of the following steps:
1. Sample preparation (10 – 20 min):
Using a wide-bore disposable pipette provided by Eiken, collect 60µl of sputum from a sputum cup and transfer the collected sputum to a heating tube containing extraction solution.
- - - - + + + +

12 | P a g e
Mix by inverting 3–4 times and place the heating tube in heating block at 90°C for 5 min to lyse and inactivate mycobacteria.
Remove the heating tube from the heating block and let it cool down for 2 minutes.
Attach the heating tube to an adsorbent tube and mix by shaking until all the powder has completely mixed with the solution.
Place an injection cap on the adsorbent tube and screw tightly to pierce the seal.
Insert the nozzle into a reaction tube and transfer drops of solution (30 µl) to the reaction tube.
2. Amplification (40 min):
Confirm the temperature on the digital display on the incubator to be 67°C.
Load the reaction tubes into the heating block and start the reaction.
The amplification is stopped automatically after 40 min.
3. Visual detection of fluorescence light from the reaction tube using UV light (0.5 – 1 min):
Transfer the reaction tubes into the fluorescence detector and record the results.
Discard reaction tubes (without opening the tubes) by incineration.

13 | P a g e
Figure 3: Schematic description of the workflow for TB-LAMP
2. EVIDENCE SYNTHESIS
In order to facilitate rapid policy guidance on the use of new diagnostic tools, new methods, and/or novel approaches using existing tools, WHO has developed a systematic, structured, evidence-based process. The first step involves a systematic review of available data, using standard methods appropriate for diagnostic accuracy studies. The second step involves the convening of an Expert Group to evaluate the strength of the evidence base and recommend operational and logistical considerations for mainstreaming such tools/approaches into national TB control programmes, and/or identify gaps to be addressed in future research. The third step involves WHO policy guidance on the use of these tools/approaches, presented to the WHO Strategic and Technical Advisory Group for TB (STAG-TB) for endorsement, and subsequent dissemination to Member States for implementation.
This document presents the findings and recommendations from the Expert Group meeting on TB-LAMP convened by WHO in Geneva, Switzerland on 20th April 2012. The Expert Group (Annex 1) consisted of researchers, clinicians, epidemiologists, end-users (programme and laboratory representatives), a community representative and an evidence synthesis expert. The Expert Group meeting followed a structured agenda (Annex 2) and was co-chaired by WHO and a clinical epidemiologist with expertise and extensive experience in evidence synthesis and guideline development.

14 | P a g e
2.1 Meeting objectives
To review available data from field evaluation and demonstration studies on the performance characteristics of the TB-LAMP assay as a replacement test for sputum smear microscopy for the diagnosis of TB;
To outline potential subject matters to be addressed by WHO in any subsequent policy recommendations on the use of TB-LAMP in TB control.
2.2 GRADE evaluation
To comply with current standards for evidence assessment in formulation of policy recommendations, the GRADE system (www.gradeworkinggroup.org), adopted by WHO for all policy and guidelines development,2 was used. The GRADE approach, assessing both the quality of evidence and strength of recommendations, aims to provide a comprehensive and transparent approach for developing policy guidance.
The Expert Group reviewed the evidence from all known published and unpublished evaluations of the TB-LAMP assay (Annex 4), including the results of four Japanese studies which were translated into English. In addition, preliminary results were assessed from a study commissioned by FIND on the cost-effectiveness of TB-LAMP applied under various public health scenarios (see Section 3.5).
Four groups of studies evaluating the performance of TB-LAMP were assessed:
A clinical validation study in hospital settings in Japan involving 170 patients (TB and not TB) and subsequently published (Mitarai S et al. Int J Tuberc Lung Dis. 2011 Feb 15(9): 1211-1217);
FIND-coordinated multi-centre evaluation studies in reference laboratories to assess the performance characteristics of the TB-LAMP assay for TB detection in comparison with conventional reference standards (microscopy, culture) involving 1061 persons suspected of TB in four countries (Brazil, Peru, South Africa, Vietnam);
FIND-coordinated evaluation studies in the intended settings of use conducted at eleven sites in three countries (India, Uganda and Peru), involving 1741 persons with suspected TB. These studies were performed to assess the clinical and operational performance of TB-LAMP in settings of intended use;
FIND-coordinated repeat evaluation study in intended settings of use (Indian sites only), using the final version of the TB-LAMP assay in 417 persons with suspected TB.
The FIND/EIKEN contractually agreed acceptable performance criterion was TB-LAMP assay specificity ≥97 %. Modifications were made to the assay following the FIND-coordinated multi-centre evaluation studies in reference laboratories as the agreed criteria for assay specificity was not met (see Section 3.2.6). Further modifications were made to the assay following the FIND-coordinated evaluation studies in the intended settings of use (see Section 3.3.5). A repeat study was conducted with an increased reaction volume at the Indian sites in the evaluation studies in the intended settings of use (see Section 3.4).
2 World Health Organization. Handbook for Guideline Development, 2012. World Health Organization: Geneva.

15 | P a g e
Evaluation of the available evidence followed the GRADE system for grading quality of evidence and strength of recommendations for diagnostic tests, based on the formulation of an a priori agreed question (the PICO question) by the Expert Group. PICO refers to four elements that should be in a question governing a systematic search of the evidence, and was defined for TB-LAMP as follows:
Population targeted by the action/intervention: Persons suspected of having pulmonary TB;
Intervention being considered: TB-LAMP assay for diagnosis of pulmonary TB;
Comparator: Conventional Ziehl-Neelsen (ZN) sputum smear microscopy;
Outcome: Diagnostic accuracy of TB-LAMP (sensitivity, specificity) compared to ZN sputum smear microscopy (sensitivity, specificity), using culture as reference standard. The quality of evidence was evaluated according to six criteria:
Overall study design: Cross-sectional (preferred): Random or consecutive selection of patients/specimens at risk; Case-control: Selection of patients/specimens according to reference standard.
Risk of bias (as reflected by the QUADAS tool) or limitations in study design and execution: Compliance of studies with a subset of 14 independent quality assessment criteria (Table 1).
Directness: Presence of direct evidence of impact on patient-important outcomes and generalisability.
Inconsistency: Unexplained inconsistency in sensitivity or specificity estimates.
Imprecision: Wide confidence intervals for pooled sensitivity or specificity estimates.
Publication bias: Publications of research based on their nature and outcome, e.g. studies showing poor performance not being published, language bias, etc.
Table 1: QUADAS Assessment Tool

16 | P a g e
GRADE categorises the quality of evidence as high, moderate, low or very low (Table 2). These quality ratings apply to the body of evidence assessed for the PICO question and not to individual studies.

17 | P a g e
Table 2: Significance of the four levels of evidence
(Source: World Health Organization. Handbook for Guideline Development, 2012. World Health Organization: Geneva). Quality Definition Implications
High The guideline development group is very confident that the true effect lies close to that of the estimate of effect
Further research is very unlikely to change confidence in the estimate of effect
Moderate The guideline development group is moderately confident in the effect estimate: the true effect is likely to be close to the estimate of effect, but there is a possibility that it is substantially different
Further research is likely to have an important impact on confidence in the estimate of effect and may change the estimate
Low Confidence in the effect estimate is limited: the true effect may be substantially different from the estimate of the true effect
Further research is very likely to have an important impact on confidence in the estimate of effect and is likely to change the estimate
Very low The group has very little confidence in the effect estimate: the true effect is likely to be substantially different from the estimate of effect
Any estimate of effect is very uncertain
As called for by GRADE, the Expert Group also considered the strength of the recommendation (strong or conditional), based on a balance of effects (advantages weighed against disadvantages), patient values and preferences, and costs. The GRADE process also assesses the impact on an intervention on patient-important outcomes and the generalisability of results to the target population, the diagnostic test used, the comparator to the test and whether tests were directly or indirectly compared.

18 | P a g e
Given the absence of relevant data from the studies reviewed, assumed patient values and preferences were assessed by test accuracy as a proxy measure, based on the relative importance/impact of false-positive and false-negative results:
True positives: Benefit to patients from earliest diagnosis and treatment;
True negatives: Patients spared unnecessary treatment; benefit of reassurance and alternative diagnosis;
False positives: Likely patient anxiety and morbidity from additional testing, unnecessary treatment; may halt further diagnostic evaluation;
False negatives: Increased risk of patient morbidity and mortality, and continued risk of community transmission of TB.
Details of the GRADE assessment for the TB-LAMP assay are provided in section 4.
2.3 Meeting procedural issues
The systematic review report was made available to the Expert Group for scrutiny before the meeting. As agreed, interchange by Expert Group meeting participants was restricted to those who attended the Expert Group meeting in person, both for the discussion and follow-up dialogue. The Expert Group members were familiar with the GRADE process and had completed an online course on GRADE prior to the meeting.
Expert Group members were asked to submit completed Declaration of Interest (DOI) forms. These were reviewed by the WHO Legal Department prior to the Expert Group meeting. A summary is attached in Annex 3. DOI statements were summarised by the co-chair (WHO-STB) of the Expert Group meeting at the start of the meeting.
Selected individuals with intellectual and/or research involvement in the TB-LAMP assay were invited as observers to provide technical input and answer technical questions. These individuals did not participate in the GRADE evaluation process and were excluded from the Expert Group discussions when recommendations were developed.
3. FINDINGS
3.1 Clinical validation study (industry sponsored)
3.1.1 Study design
This study was conducted at the Double-Barred Cross Hospital and Tokyo Hospital in Japan. The study aimed to determine the accuracy of TB-LAMP among persons with symptoms of pulmonary TB (PTB) in comparison to commercial nucleic acid amplification tests (NAAT), conventional culture and direct fluorescent microscopy and was subsequently published. (Mitarai S et al. Int J Tuberc Lung Dis. 2011 Feb 15(9): 1211-1217).

19 | P a g e
3.1.2 Study flow and study population
A total of 170 patients (TB and non-TB) were enrolled in the study. Each patient enrolled in the study submitted two consecutive morning specimens, ie. 340 sputum specimens were collected from June to December 2009. Confirmed diagnosis of TB was made based on bacteriological, histopathological and/or clinical findings. Subjects aged <18 years, and those who had been receiving anti-tuberculosis treatment for >48h, including fluoroquinolones and aminoglycosides 60 days prior to enrolment, were excluded.
Sputum specimens were treated using the standard N acetyl-L-cysteine (NALC) NaOH digestion method, followed by neutralization with phosphate buffer (PB; pH 6.8) and centrifugation at 3000g for 15 min at 4°C. The sediment was re-suspended in 2ml of PB, a smear prepared and stained for auramine-O fluorescent smear microscopy, and inoculated into BACTEC Mycobacterial Growth Indicator Tube (MGIT) 960 (Nippon Becton Dickinson Co Ltd, Tokyo, Japan) and 2% Ogawa medium (Kyokuto Pharmaceuticals, Tokyo, Japan) at 37°C for up to 6 and 8 weeks, respectively. All positive cultures were subjected to identification with immune-chromatographic methods (Capilia TB; TAUNS, Shizuoka, Japan).
The same re-suspended specimen was subjected to the TB-LAMP test (indirect testing) and Cobas Amplicor MTB (Roche Diagnostics Systems Inc, Tokyo, Japan) or TRC Rapid MTB (Tosoh Co, Tokyo, Japan) for the detection of Mycobacterium tuberculosis complex. If the NAA tests were not performed immediately, the treated specimen was stored at −20°C until use. Another sputum specimen was subjected to direct fluorescent smear microscopy and the TB-LAMP test using approximately 40μl of the unprocessed sample (direct testing).
3.1.3 Results
The sensitivity of TB-LAMP on direct sputum samples compared with sputum smear microscopy and culture is given in Table 3. A result was considered positive if either direct or indirect smear examination of the specimen was positive. Sensitivity was calculated using the culture result as the reference standard. Nontuberculous mycobacteria (NTM) isolated by culture were classified in the culture- negative group. Cases of mixed infection with M. tuberculosis (MTB) and NTM were considered to be culture-positive.
320 direct TB-LAMP tests were performed of which 205 were positive. The sensitivity of direct TB-LAMP was 98.2% (95CI 94.9% - 99.4%) compared to smear-positive/culture-positive samples. The sensitivity of direct TB-LAMP was 55.6% (95CI 43.4% - 68.0%) among smear-negative/culture-positives (Table 4). Specificity for TB diagnosis was 93.9% (95CI 80.4% - 98.3%).
Table 3: Sensitivity of TB-LAMP compared with culture and sputum smear result
Smear-positive Smear-negative
MTB culture positive
MTB culture
negative
MTB culture positive
MTB culture
negative
Total Sensitivity smear-
positive/ culture-
Sensitivity smear-
negative/ culture-
20 | P a g e
positive (95%CI)
positive (95%CI)
Positive 166 6 30 3 205 98.2% (94.9-99.4)
55.6% (43.4-68.0)
Negative 3 13 24 75 115
Total 169 19 54 78 320
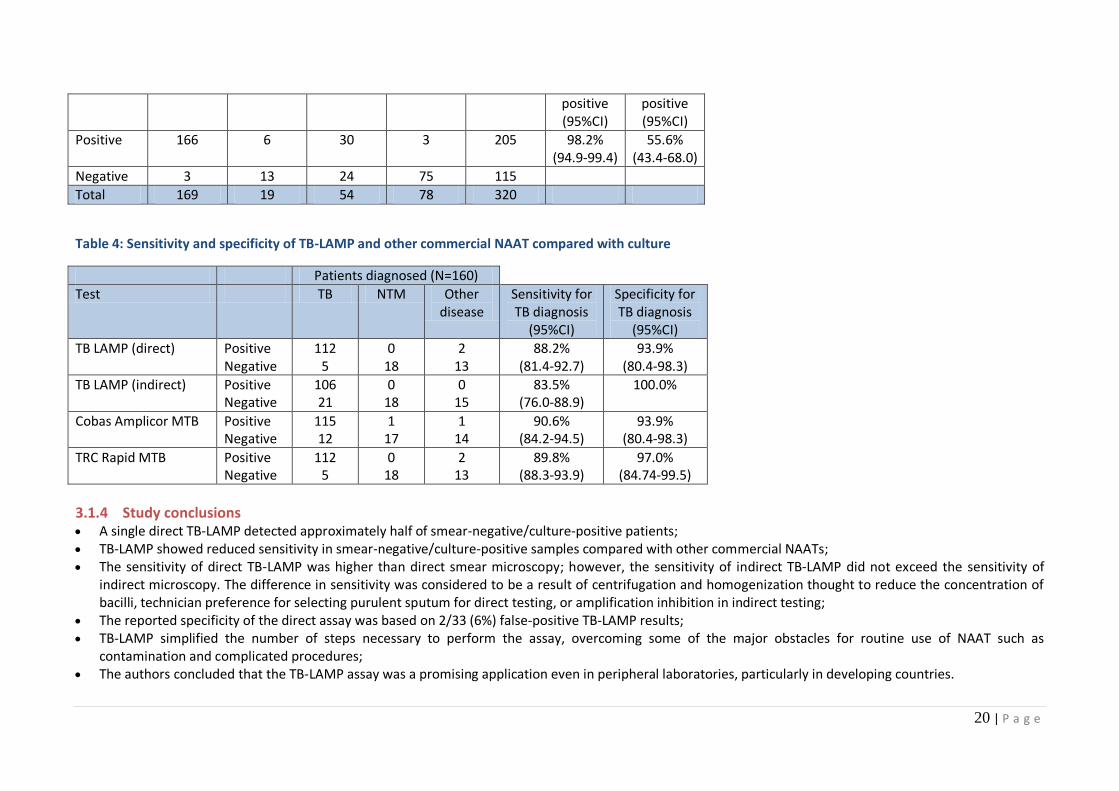
Table 4: Sensitivity and specificity of TB-LAMP and other commercial NAAT compared with culture
Patients diagnosed (N=160)
Test TB NTM Other disease
Sensitivity for TB diagnosis
(95%CI)
Specificity for TB diagnosis
(95%CI)
TB LAMP (direct) Positive Negative
112 5
0 18
2 13
88.2% (81.4-92.7)
93.9% (80.4-98.3)
TB LAMP (indirect) Positive Negative
106 21
0 18
0 15
83.5% (76.0-88.9)
100.0%
Cobas Amplicor MTB Positive Negative
115 12
1 17
1 14
90.6% (84.2-94.5)
93.9% (80.4-98.3)
TRC Rapid MTB Positive Negative
112 5
0 18
2 13
89.8% (88.3-93.9)
97.0% (84.74-99.5)
3.1.4 Study conclusions A single direct TB-LAMP detected approximately half of smear-negative/culture-positive patients; TB-LAMP showed reduced sensitivity in smear-negative/culture-positive samples compared with other commercial NAATs; The sensitivity of direct TB-LAMP was higher than direct smear microscopy; however, the sensitivity of indirect TB-LAMP did not exceed the sensitivity of
indirect microscopy. The difference in sensitivity was considered to be a result of centrifugation and homogenization thought to reduce the concentration of bacilli, technician preference for selecting purulent sputum for direct testing, or amplification inhibition in indirect testing;
The reported specificity of the direct assay was based on 2/33 (6%) false-positive TB-LAMP results; TB-LAMP simplified the number of steps necessary to perform the assay, overcoming some of the major obstacles for routine use of NAAT such as
contamination and complicated procedures; The authors concluded that the TB-LAMP assay was a promising application even in peripheral laboratories, particularly in developing countries.

21 | P a g e
3.2 Evaluation studies in TB reference laboratories (FIND-coordinated)
3.2.1 Study design
A multi-centre, blinded, cross-sectional study aimed to determine the accuracy of TB-LAMP in patients with symptoms of pulmonary TB (PTB) in comparison to conventional methodologies. Study settings were chosen to cover a maximum of geographically distinct populations with differences in HIV and TB prevalence. Each site needed to have the infrastructure to provide high quality reference test results as well as the clinical capacity to enroll and follow-up 300 patients over 6 months.
3.2.2 Study flow and study population
Adult subjects with symptoms suggestive of pulmonary TB who were able to provide two sputum samples of at least 1.5ml were enrolled consecutively (Figure 4). These specimens were used for direct smear microscopy and TB-LAMP and leftover specimens were then processed with NALC-NaOH for solid and liquid culture (BACTEC MGIT [mycobacteria growth indicator tube] 960 culture; BD Microbiology Systems). The first positive culture from each patient underwent confirmation of M. tuberculosis species by MPT64 antigen detection (Capilia TB, Tauns Laboratories). Specimens and test order were randomized. A laboratory and clinical follow-up was carried out after 8 weeks for smear-negative and culture-negative but TB LAMP-positive patients not started on TB treatment, and random controls (smear-negative, culture-negative and TB LAMP-negative patients not started on TB treatment) to establish a final diagnosis.

22 | P a g e
Figure 4: Patient and sample flow at enrolment during evaluation studies at reference labs
Participating laboratories were quality-assured TB reference laboratories in urban centres. In Lima, Peru, patients with suspected tuberculosis were enrolled at 4 DOTS centers with a high rate of tuberculosis case notification, a rate of co-infection with the human immunodeficiency virus (HIV) of less than 3%, and a low rate of multidrug-resistance. In Cape Town, South Africa, patients were enrolled at primary care TB clinics located within informal settlements with a high incidence of tuberculosis, an estimated rate of HIV co-infection of 50% and a rate of multidrug-resistance of 4%. In Ho Chi Minh City, Vietnam, patients were enrolled at a
23 | P a g e
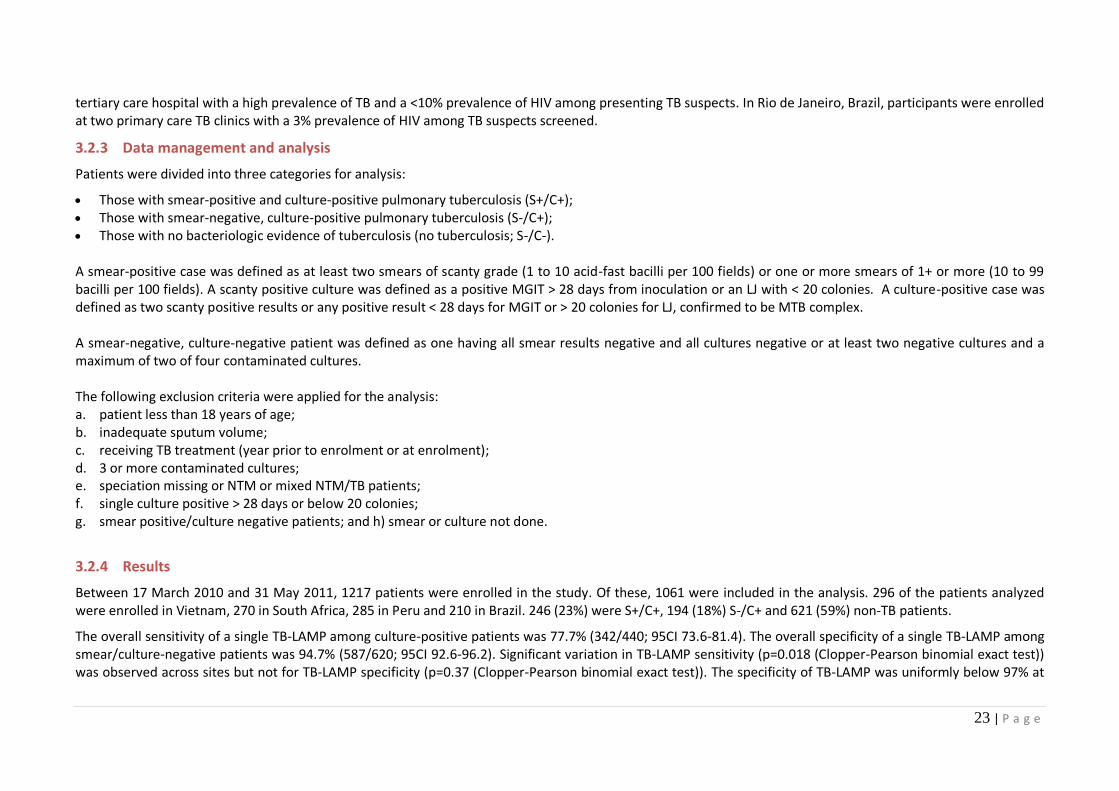
tertiary care hospital with a high prevalence of TB and a <10% prevalence of HIV among presenting TB suspects. In Rio de Janeiro, Brazil, participants were enrolled at two primary care TB clinics with a 3% prevalence of HIV among TB suspects screened.
3.2.3 Data management and analysis
Patients were divided into three categories for analysis:
Those with smear-positive and culture-positive pulmonary tuberculosis (S+/C+); Those with smear-negative, culture-positive pulmonary tuberculosis (S-/C+); Those with no bacteriologic evidence of tuberculosis (no tuberculosis; S-/C-). A smear-positive case was defined as at least two smears of scanty grade (1 to 10 acid-fast bacilli per 100 fields) or one or more smears of 1+ or more (10 to 99 bacilli per 100 fields). A scanty positive culture was defined as a positive MGIT > 28 days from inoculation or an LJ with < 20 colonies. A culture-positive case was defined as two scanty positive results or any positive result < 28 days for MGIT or > 20 colonies for LJ, confirmed to be MTB complex. A smear-negative, culture-negative patient was defined as one having all smear results negative and all cultures negative or at least two negative cultures and a maximum of two of four contaminated cultures. The following exclusion criteria were applied for the analysis: a. patient less than 18 years of age; b. inadequate sputum volume; c. receiving TB treatment (year prior to enrolment or at enrolment); d. 3 or more contaminated cultures; e. speciation missing or NTM or mixed NTM/TB patients; f. single culture positive > 28 days or below 20 colonies; g. smear positive/culture negative patients; and h) smear or culture not done.
3.2.4 Results
Between 17 March 2010 and 31 May 2011, 1217 patients were enrolled in the study. Of these, 1061 were included in the analysis. 296 of the patients analyzed were enrolled in Vietnam, 270 in South Africa, 285 in Peru and 210 in Brazil. 246 (23%) were S+/C+, 194 (18%) S-/C+ and 621 (59%) non-TB patients.
The overall sensitivity of a single TB-LAMP among culture-positive patients was 77.7% (342/440; 95CI 73.6-81.4). The overall specificity of a single TB-LAMP among smear/culture-negative patients was 94.7% (587/620; 95CI 92.6-96.2). Significant variation in TB-LAMP sensitivity (p=0.018 (Clopper-Pearson binomial exact test)) was observed across sites but not for TB-LAMP specificity (p=0.37 (Clopper-Pearson binomial exact test)). The specificity of TB-LAMP was uniformly below 97% at

24 | P a g e
all evaluation sites. Among known HIV-positive patients with pulmonary tuberculosis, the sensitivity of TB-LAMP was 70.6%, as compared with 78.3% in HIV-negative patients or patients with unknown HIV result (p = 0.20 (Cochran-Mantel-Haenzel stratified by site).
In comparison, the sensitivity of 2 smears per patient was 55.9% (246/440; 95CI 51.2% - 60.5%) and the specificity was 99.9% (675/676; 95CI 99.2%-100.0%). TB-LAMP sensitivity was significantly higher than the sensitivity of smear microscopy (both for a single smear and for 2 smears per patient as done routinely), with p-values <0.0001. TB-LAMP specificity was significantly lower than the specificity of smear microscopy (both for a single smear and for 2 smears per patient as done routinely), with p-values <0.0001.
3.2.5 Indeterminate rate
A result was entered as “indeterminate” when the technician was not able to judge whether the TB- LAMP test was positive or negative. The overall indeterminate rate was very low. No apparent technical problem was reported to be associated with the indeterminate results.
Five runs or 1.3% (28/2098 tests) were affected by false-positive negative controls. In four instances, the bags containing reaction tubes had been accidently left open and were the source of contamination. In one case, the negative and positive control had been swapped.
3.2.6 Study conclusions
A single TB-LAMP detected approximately half of smear-negative/culture-positive patients; Overall specificity of a single TB-LAMP assay across all studies was 94.7%, which was below the FIND/EIKEN contractual target of ≥97%. None of the sites
achieved the desired specificity level; Humidity effect and incomplete reconstitution of dried reagents were considered to be the most likely causes of decreased specificity; Changes in packaging and training were introduced to overcome these issues; FIND and Eiken agreed to evaluate the accuracy and operational performance of TB LAMP in intended settings of use.
3.3 Evaluation studies in intended settings of use (FIND-coordinated)
3.3.1 Study design
Evaluation studies in intended settings of use were conducted at 11 sites in three countries (India, Uganda, Peru) and aimed to assess the clinical and operational performance of TB-LAMP in settings of intended use in low- and moderate-income countries with typical infrastructural challenges (operating and storage temperature; space; power supply; staff). The study protocol was reviewed and approved by local institutional review boards and conducted in partnership with the national TB programme (NTP). The project aimed at: a) assessing TB-LAMP performance in less controlled settings after introduction of packaging changes and an intensified, standardized training package; b) assessing the operational feasibility and cost-efficiency of using TB-LAMP as a replacement test for sputum smear

25 | P a g e
microscopy at lower levels of the health system for enhanced detection of TB; and c) studying operational performance characteristics and hurdles to implementation.
Key changes compared to the evaluation studies in reference laboratories were as follows:
TB-LAMP training was not conducted by FIND study coordinators, but by dedicated trainers from Borstel TB Supranational Reference Laboratory and Eiken;
Particular focus of the training was on the avoidance of false-positives (bleach cleaning, glove change, separation of working areas, and handling/manipulation of plastic devices);
A change in packaging was made to avoid the effects of humidity on reaction tubes (by improving the resealing capacity of the reaction tube bag); The sites in this study were microscopy centres and did not conduct other NAATs or culture in the same facility; A proficiency testing protocol was used to assess readiness of users prior to studies; Training was followed by a period of supervised testing.
In these studies, the study design was kept simple as possible and data collection minimized (Figure 5). A direct smear and a direct TB-LAMP test were performed in the microscopy centre on the first sputum sample. A second sample underwent routine smear microscopy only. The results of both tests were blinded by using separate operators for the TB-LAMP assay and smear microscopy. Remaining samples were subsequently transported to the reference laboratory on a daily basis. At the reference laboratory, LJ culture and MGIT culture (BACTEC MGIT [mycobacteria growth indicator tube] 960 culture; BD Microbiology Systems) were performed from sputum sample 1 following NALC-NaOH decontamination. Sputum sample 2 was frozen. The first positive culture underwent confirmation of MTB complex by MPT64 antigen detection (Capilia TB, Tauns Laboratories).

26 | P a g e
Figure 5: Patient and sample flow during evaluation studies in intended settings of use

27 | P a g e
3.3.2 Study sites
Eleven study sites (Table 5) were selected from among urban and rural microscopy centres embedded in health centres or district hospitals with the characteristic challenges regarding temperature, human resources and infrastructure (space; power supply). Given the need for a reference standard, access to quality-assured conventional culture was required.
For enrolment sites in India, the reference laboratory at the Mahatma Gandhi Medical College in a rural area in Maharashtra was used. All 3 microscopy centers selected in India were classified by the NTP as rural. Two sites in Uganda were classified as urban and 2 as rural. The reference laboratory for Uganda was located at the NTRL in Kampala. The 4 participating microscopy centres in Peru were located within 20 km of the reference laboratory at UPCH, Lima, and were classified as peri-urban. All participating microscopy centres were located in health centres (n=4), sub-district hospitals (n=3) or district hospitals (n=4).
Laboratory staff selected as TB-LAMP operators were microscopists and did not have any prior experience with molecular testing. TB-LAMP was set up and performed using two working areas (benches) in either a single room or in two adjacent rooms. Generally, the rooms were small and working space limited, as the bench space was also needed for other basic laboratory work (microscopy, hematology, etc). None of the centres had a biosafety cabinet. The same biosafety precautions were taken as for smear microscopy.
Table 5: Description of study sites, available infrastructure and laboratory capacity
Site Location Distance from supervisory lab
Level of the health system
Average # New TB
suspects/ month
Average # smears/day (new cases)
Electricity Biosafety cabinet
Infrastructure # Lab staff Access to treatment
Operating temperature Ave daily max °C
(range of daily max)
Sevagram, India (supervised by Sevagram Medical College, Maharashtra)
Sevagram Rural 0 Km Referral hospital Dedicated TB lab (smear microscopy)
120 6-7 Recurrent power outage, generator (manual switch) & 1h UPS
No Low: 2 rooms 1 lab technician, 1 lab assistant
TB Min: 27.6°C Max: 41.1°°C Average: 36.2°C
Wardha Rural 10 Km District Dedicated TB lab (smear microscopy)
70 4-5 Long recurrent power outage (4-6h), 1h UPS
No Low: 2 rooms 2 lab technicians
TB; MDR
Hinganghat Rural 60 Km Sub-district Microscopy centre*
50 3-4 Recurrent power outage, generator (manual switch) & 1h UPS
No Low: 2 rooms 2 lab technicians, 1 lab assistant
TB
Kampala, Uganda (supervised by CPCD and mycobacteriology Laboratory, Dept. Med. Microbiology Makerere University)
Kiswa Urban 3 Km Sub-district Microscopy centre*
60 3-4 Recurrent power outage (slowed down enrolment), 30’ UPS
Yes Medium: 2 rooms (BSC, A/C)
4 lab technicians (2 for TB)
TB Min: 23.2°C Max: 39.8°C Average: 27.3°C
Kisenyi Urban 2 Km Sub-district Microscopy centre* (high workload HIV)
70 4-5 Recurrent power outage, 5’ UPS, generator
No Low: 2 rooms (1 container-type)
2 lab technicians
TB
Gombe Rural 70 Km District hospital Microscopy centre*
80 4-5 Recurrent power outage, 5’ UPS
No Medium: 2 lab rooms
2 lab technicians
TB

28 | P a g e
Mukono Rural 25 Km District Microscopy centre*
65 3-4 Recurrent power outage, generator & solar panel
No Medium: 2 rooms
2 lab technicians
TB
Lima, Peru (supervised: by Instituto de Medicina Tropical AvH/Universidad Peruana Cayetano Heredia)
Jaime Zubieta
Peri-urban
20 Km Sub-district Microscopy centre*
40 2-3 Brief power outage, 1h UPS
No Low: 1 room w 2 areas
3 lab technicians (2:am, 1:pm)
TB; MDR Min: 18.3°C Max: 32.4°C Average: 25.1°C
JC Mariategui
Peri-urban
22 Km Sub-district Microscopy centre*
40 2-3 Brief power outage, 1h UPS
No Medium: 1 room w 2 areas
3 lab technicians (2:am, 1:pm)
TB; MDR
Huascar XV Peri-urban
20 Km Sub-district Microscopy centre*
50 3-4 Brief power outage, 1h UPS
No Low: 1 room 3 lab technicians (2:am, 1:pm)
TB; MDR
10 de Octubre
Peri-urban
24 Km Sub-district Microscopy centre*
60 3-4 Brief power outage, 1h UPS
No Low: 1 room 2 lab technicians (1:am, 1:pm)
TB; MDR
* Multipurpose lab: Microbiology (TB smear microscopy), hematology, biochemistry, parasitology
All lab technicians: prior skills on TB diagnostics smear microscopy only All sites, storage of reagents: long term central & short-term local (2 weeks)

29 | P a g e
3.3.3 Data management and analysis
The definitions and exclusion criteria were identical to those applied during the evaluation studies in reference settings. In brief, patients were divided into three categories for analysis:
Those with smear- and culture-positive pulmonary tuberculosis; Those with smear-negative, culture-positive pulmonary tuberculosis; Those with no bacteriologic evidence of tuberculosis (no tuberculosis). A smear-positive case was defined as at least two smears of scanty grade (1 to 10 acid-fast bacilli per 100 fields) or one or more smears of 1+ or more (10 to 99 bacilli per 100 fields). A culture-positive case was defined as two very low positive results (MGIT > 28 days from inoculation or an LJ with < 20 colonies) or any positive result < 28 days for MGIT or > 20 colonies for LJ, confirmed to be MTB complex during speciation on the same sputum as the culture positive. A smear-negative, culture-negative patient was defined as one having negative smear and valid culture-negative results.
3.3.4 Results
From March 8th, 2011 through July 11th, 2011, a total of 1998 adult subjects presenting at the participating clinics with symptoms suggestive of pulmonary tuberculosis were enrolled. Of these, 1741 (87.1%) patients met the eligibility criteria for inclusion in the study.
The overall sensitivity of a single, direct TB-LAMP in culture-positive cases was 84.4% (331/392 95CI 80.5%-87.7%). TB-LAMP specificity was 96.3% (1299/1349 95CI 95.1% - 97.2%). The sensitivity of routine smear microscopy (2 smears per patient) compared with culture was 63.8% (250/392 95CI 58.9% - 68.4%) with a specificity of 97.3% (1385/1423 95CI 96.4% - 98.0%).
TB-LAMP sensitivity was significantly higher than that of smear microscopy (for either a single smear or 2 smears per patient as done routinely), with p-values <0.0001 using a stratified McNemar’s test. The specificity of microscopy was significantly higher than the specificity for TB-LAMP (p-values <0.0001 (stratified McNemar’s test).
In smear-positive/culture-positive patients, TB-LAMP sensitivity was 97.2% (95CI 94.3% - 98.6%) and in smear-negative/culture-positive cases the sensitivity was 62.0% (95CI 53.8%-69.5%). There was significant variation in TB-LAMP sensitivity and specificity across sites. Both sensitivity and specificity were highest in Peru. Uganda had the lowest sensitivity and India the lowest specificity.
3.3.5 Study conclusions
There was significant variation in TB-LAMP sensitivity and specificity across sites:
The lowest sensitivity observed at one of the sites may be explained by a high prevalence of HIV (60.0%);
TB-LAMP accuracy was prone to user error and required extensive training and proficiency testing; Poor specificity of TB-LAMP in India required further investigation.
Based on these findings, FIND in collaboration with Eiken decided to conduct further studies in order to investigate the effects of temperature, humidity, time and other potential interferences such as the presence of human DNA on TB-LAMP specificity. Root-cause analysis determined that false-positive reactions may occur through non-specific amplification when inadequate reaction volume was used, the reaction tubes were exposed to high humidity and temperature, or the reaction tubes were left at high temperature following reconstitution.
As a consequence, the manufacturer increased the reaction volume from 25-35 µl to 30-35 µl in order to
30 | P a g e
minimize the risk of false positivity. Extensive training on time-sensitive steps of the assay was done.
A repeat study was subsequently conducted with the increased reaction volume in a high temperature environment in India (see Section 3.4).
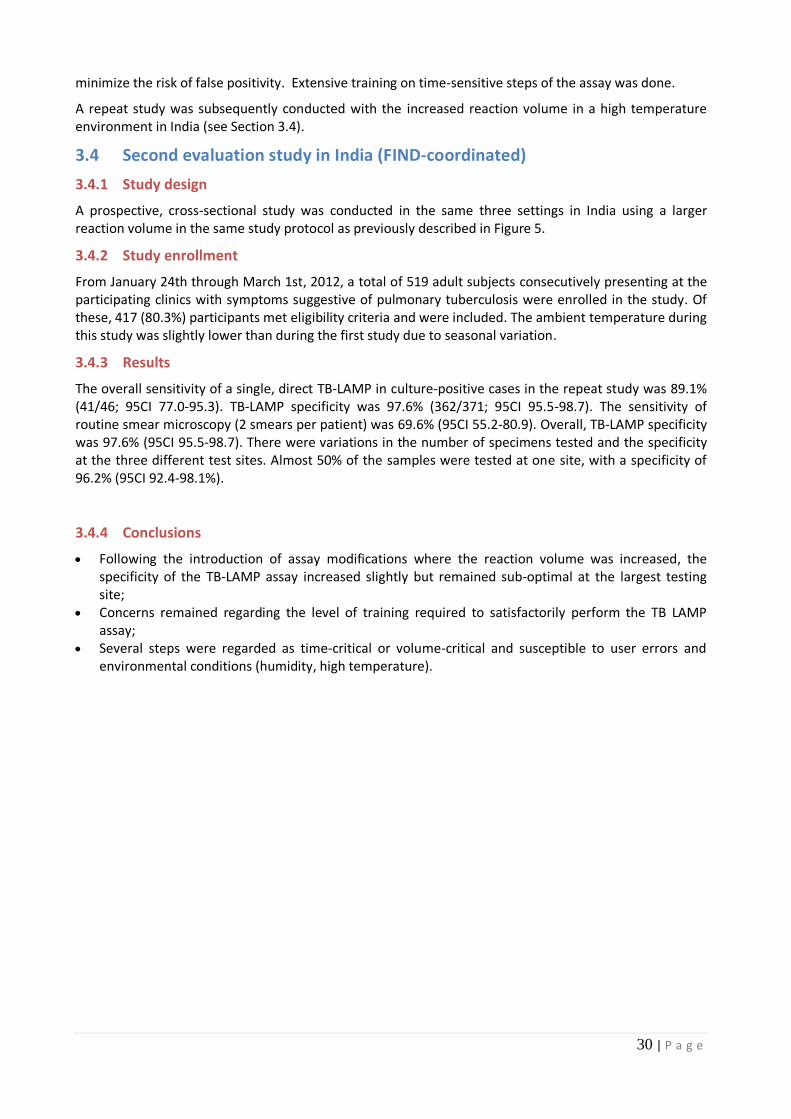
3.4 Second evaluation study in India (FIND-coordinated)
3.4.1 Study design
A prospective, cross-sectional study was conducted in the same three settings in India using a larger reaction volume in the same study protocol as previously described in Figure 5.
3.4.2 Study enrollment
From January 24th through March 1st, 2012, a total of 519 adult subjects consecutively presenting at the participating clinics with symptoms suggestive of pulmonary tuberculosis were enrolled in the study. Of these, 417 (80.3%) participants met eligibility criteria and were included. The ambient temperature during this study was slightly lower than during the first study due to seasonal variation.
3.4.3 Results
The overall sensitivity of a single, direct TB-LAMP in culture-positive cases in the repeat study was 89.1% (41/46; 95CI 77.0-95.3). TB-LAMP specificity was 97.6% (362/371; 95CI 95.5-98.7). The sensitivity of routine smear microscopy (2 smears per patient) was 69.6% (95CI 55.2-80.9). Overall, TB-LAMP specificity was 97.6% (95CI 95.5-98.7). There were variations in the number of specimens tested and the specificity at the three different test sites. Almost 50% of the samples were tested at one site, with a specificity of 96.2% (95CI 92.4-98.1%).
3.4.4 Conclusions
Following the introduction of assay modifications where the reaction volume was increased, the specificity of the TB-LAMP assay increased slightly but remained sub-optimal at the largest testing site;
Concerns remained regarding the level of training required to satisfactorily perform the TB LAMP assay;
Several steps were regarded as time-critical or volume-critical and susceptible to user errors and environmental conditions (humidity, high temperature).

31 | P a g e
3.5 Costs and cost-effectiveness
Data from a cost-effectiveness modelling exercise commissioned by FIND was presented to the Expert Group during the meeting and results are summarised below.
3.5.1 Objective
To estimate the cost-effectiveness of the TB-LAMP assay using decision-analytic simulation modelling with a hypothetical cohort of 10,000 TB suspects presenting with prolonged cough with or without systemic or other symptoms suggestive of pulmonary TB, and comparing TB-LAMP to smear examination (current practice) with and without taking into account additional diagnosis of smear-negative TB. The analysis was limited to health service costs using data from FIND’s field studies in India.
3.5.2 Methods
Cost inputs
Diagnostic costs were measured on-site in routine settings in India where the TB-LAMP demonstration study was conducted, through direct observations of all diagnostic procedures following an ingredient costing approach (ie. including assay costs, labour, overheads, premises etc.) and using a standardized format3. Primary cost estimates for the TB-LAMP assay assumed 10 samples per run. Capital costs were annualized using a 3% discount rate. Costs for TB culture was based on Löwenstein-Jensen medium and speciation by the niacin test.
Costs for clinical diagnosis (chest X-ray and antibiotic trial, according to use in TB suspects) were based on measurements in routine clinics in India as part of FIND’s demonstration study of the Xpert MTB/RIF assay in 2010. 4 Similarly, costs for drug susceptibility testing using the indirect proportion method on Löwenstein-Jensen medium were measured at the regional reference laboratory in Vellore during the demonstration study of the Xpert MTB/RIF assay in 20104.
Costs for treatment included costs for drugs, clinic visits, follow-up tests and treatment supervision, and were estimated using drugs costs from the Global Drug Facility and the MSH International Price Tracker, and unit costs for outpatient visits and hospitalization sourced from WHO-CHOICE (http://www.who.int/choice/en/). Costs for outpatient/community treatment were based on previous studies with adjustment based on purchase power parity, and checked with public-private mix studies.3 For second-line treatment the drug regimen and duration of the treatment phases were taken from the Indian national PMDT guidelines; frequency of observation and hospitalization time were taken from studies from Peru.3
Test characteristics for the TB LAMP assay were taken as the average sensitivity and specificity for all sites (ie. in three countries) in the FIND demonstration study, and were assumed to be similar for HIV-positive and HIV-negative patients.
All costs were expressed in 2011 US dollar. NB: reagents were costed in JPY (at an exchange rate of 80 JPY per USD). Diagnostic scenarios Two diagnostic scenarios were compared against a base case: Base case: Two sputum specimens examined by smear microscopy. If positive, TB treatment started. If negative, followed by clinical diagnosis of smear-negative TB (including chest X-ray and a course of broad spectrum antibiotics; if positive, TB treatment started, if negative no further diagnosis.
3 Vassall A, van Kampen S, Sohn H, Michael JS, John KR, e.a. (2011) Rapid Diagnosis of Tuberculosis with the Xpert MTB/RIF Assay in High Burden Countries: A Cost-Effectiveness Analysis. PLoS Med 8: e1001120. doi:10.1371/journal.pmed.1001120 4 Boehme CC, Nicol MP, Nabeta P, Michael JS, Gotuzzo E, e.a. (2011) Feasibility, diagnostic accuracy, and effectiveness of decentralised use of the Xpert MTB/RIF test for diagnosis of tuberculosis and multidrug resistance: a multicentre implementation study. Lancet 377: 1495–1505. doi:10.1016/S0140-6736(11)60438-8
32 | P a g e
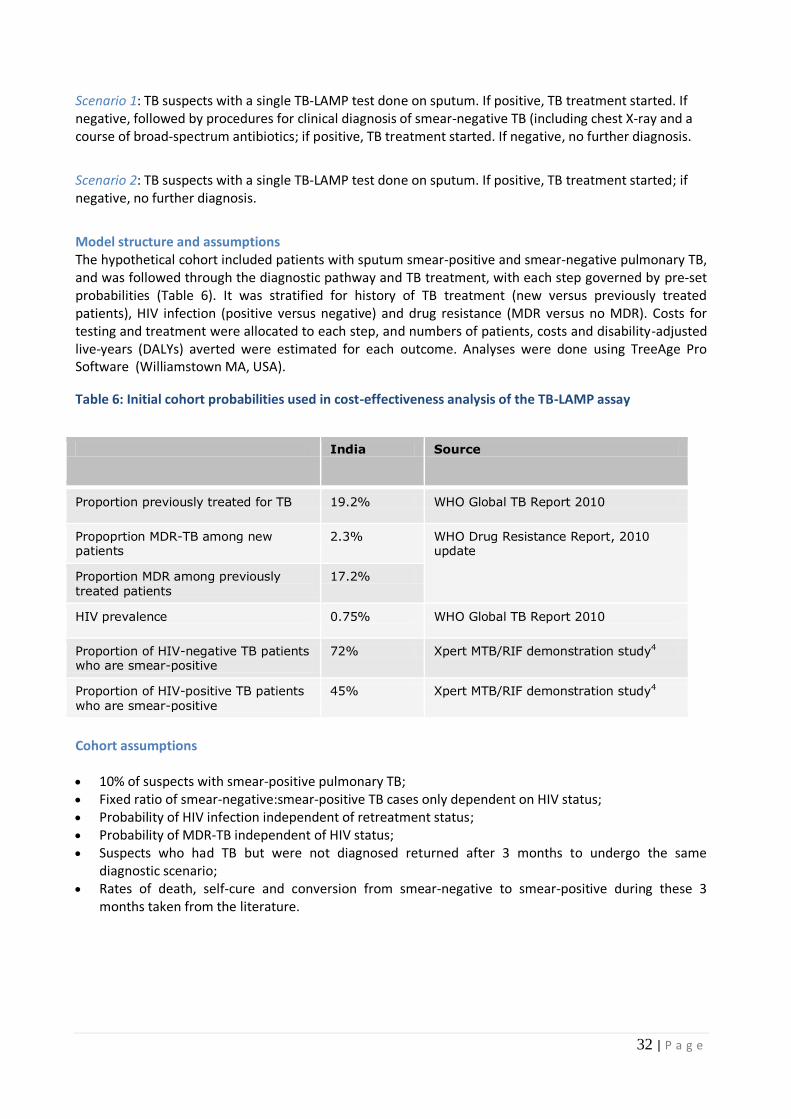
Scenario 1: TB suspects with a single TB-LAMP test done on sputum. If positive, TB treatment started. If negative, followed by procedures for clinical diagnosis of smear-negative TB (including chest X-ray and a course of broad-spectrum antibiotics; if positive, TB treatment started. If negative, no further diagnosis.
Scenario 2: TB suspects with a single TB-LAMP test done on sputum. If positive, TB treatment started; if negative, no further diagnosis.
Model structure and assumptions The hypothetical cohort included patients with sputum smear-positive and smear-negative pulmonary TB, and was followed through the diagnostic pathway and TB treatment, with each step governed by pre-set probabilities (Table 6). It was stratified for history of TB treatment (new versus previously treated patients), HIV infection (positive versus negative) and drug resistance (MDR versus no MDR). Costs for testing and treatment were allocated to each step, and numbers of patients, costs and disability-adjusted live-years (DALYs) averted were estimated for each outcome. Analyses were done using TreeAge Pro Software (Williamstown MA, USA).
Table 6: Initial cohort probabilities used in cost-effectiveness analysis of the TB-LAMP assay
India Source
Proportion previously treated for TB 19.2% WHO Global TB Report 2010
Propoprtion MDR-TB among new patients
2.3% WHO Drug Resistance Report, 2010 update
Proportion MDR among previously treated patients
17.2%
HIV prevalence 0.75% WHO Global TB Report 2010
Proportion of HIV-negative TB patients who are smear-positive
72% Xpert MTB/RIF demonstration study4
Proportion of HIV-positive TB patients who are smear-positive
45% Xpert MTB/RIF demonstration study4
Cohort assumptions 10% of suspects with smear-positive pulmonary TB; Fixed ratio of smear-negative:smear-positive TB cases only dependent on HIV status; Probability of HIV infection independent of retreatment status; Probability of MDR-TB independent of HIV status; Suspects who had TB but were not diagnosed returned after 3 months to undergo the same
diagnostic scenario; Rates of death, self-cure and conversion from smear-negative to smear-positive during these 3
months taken from the literature.

33 | P a g e
Scenario assumptions
Clinical diagnosis of smear-negative TB (clinical evaluation, chest X-ray and antibiotic trial if applicable) treated as a single diagnostic procedure with fixed test characteristics. These characteristics (sensitivity, specificity) were not available form the TB-LAMP studies and therefore taken as observed in India in FIND’s recent demonstration studies of Xpert MTB/RIF;
Patients with drug-susceptible TB treated with the standard first-line category-I regimen 2HREZ/4HR (new cases) of category-II regimen 2HRZES/1HRZE/5HRE (retreatment cases);
Patients with MDR-TB treated with the standard second-line treatment regimen currently used in the Indian Programmatic Management of Drug-resistant TB (PMDT) programme;
Patients could only have cure, failure and death as treatment outcomes; treatment outcome probabilities for each combination of patient category (new, previously treated, MDR) and treatment regimen (first-line category I or II, second-line) were taken from the literature;
All cultures and DST done on solid media. Patients awaiting conventional DST results started on first-line treatment, and switched to second-line treatment after 12 weeks if the DST showed MDR-TB;
Model limited to only one additional diagnostic event (ie. if a diagnosis was missed twice, the patient was assumed to remain untreated)
Not taken into account: repeated treatment episodes (ie. a patients who failed on treatment was assumed to remain untreated thereafter), relapses after treatment, effects of diagnostic delay on treatment outcomes, transmission effects.
Effectiveness inputs
DALYs were calculated using the standard DALY formula with 3% discount rate and based on age at presentation as observed in the TB-LAMP demonstration study (Indian sites). Disability weights were taken from the Global Burden of Disease, 2004 update (http://www.who.int/healthinfo/ global_burden_disease/2004_report_update/en); survival estimates after treated TB with and without HIV infection were taken from the literature. The DALY calculations assumed that if TB was left untreated, disability was due to TB, and that all HIV-infected patients received lifelong highly active antiretroviral treatment (HAART).
3.5.3 Results
Costs
The total cost of the TB-LAMP assay was estimated at $13.47 per patient at a volume of 10 runs per day. This was similar to the cost of mycobacterial culture on solid media ($13.56), but considerable higher than the cost of examining two Ziehl-Neelsen stained sputum smears ($2.51). The cost of the TB-LAMP assay varied between $12.68 for high volume microscopy centres (14 runs per day) to $14.27 for medium-high volume centres (6 runs per day) at the highest pricing level, and from $10.57 to $11.91 at the lowest pricing level, respectively (Table 7).

34 | P a g e
Table 7: Cost estimates for the TB-LAMP assay
Case detection and effectiveness
The model estimates for case detection are summarized in Table 8. Scenario 1 (ie. TB-LAMP assay followed by clinical diagnosis) detected 97% of all TB patients in the cohort, while the Scenario 2 (ie. TB-LAMP assay NOT followed by clinical diagnosis) detected 96%. This was substantially higher than the 82% of all TB patients detected by the base case. Assuming DST was done on all retreatment TB cases, the proportion of MDR-TB cases detected by scenarios 1 and 2 was 62% and 61%, respectively, compared to 52% for the base case. Scenario 1 averted the largest number of DALYs (21,958) although this was only slightly less for Scenario 2 (21,743).
Table 8: Summary of effectiveness and cost-effectiveness results from the model
TB patients in cohort 1389
MDR-TB patients in cohort 72
% TB patients who are HIV-infected 0.75%
Scenario Base case Scenario 1 Scenario 2
Smear examination followed by clinical diagnosis
LAMP followed by clinical diagnosis LAMP only
TB patients detected 1138 1348 1332
Detection rate all TB 82% 97% 96%
MDR patients detected 38 44 44
Detection rate MDR-TB 52% 62% 61%
Per TB case detected:
Diagnostic cost $62 $134 $108
Treatment cost $411 $439 $366
Total cost $473 $573 $474
Samples per day: 6 14 6 14 6 14
Overhead 0.38 0.44 0.38 0.44 0.38 0.44
Building Space 0.00 0.00 0.00 0.00 0.00 0.00
Equipment 0.12 0.11 0.12 0.11 0.12 0.11
Staff 0.22 0.26 0.22 0.26 0.22 0.26
Reagents and Chemicals 10.52 9.37 9.31 8.28 8.20 7.29
Consumables 0.55 0.31 0.55 0.31 0.55 0.31
Shipment cost, loca l handl ing chages
and dis tributors margin* 2.26 2.02 2.15 1.92 2.04 1.81
Total 14.06 12.50 12.85 11.41 11.74 10.42
*Excluding import duty and VAT.
Repeat rate (1.5%) added 14.27 12.68 13.04 11.58 11.91 10.57
Point estimate for 10 samples per run $13.47
Variable per test LAMP costs stratified by the daily workload at medium and high volume microscopy centers,
averaged for the two sites (Wardha and Sewagram)
LAMP LAMP LAMP
(price >100,001 tests)(price >1,000,001 &
<3,000,000 tests) (price >3,000,000 tests)

35 | P a g e
DALYs averted 19,165 21,958 21,743
Total cost per DALY $28 $35 $29
Total cost $538,384 $771,834 $631,089
Incremental cost-effectiveness ratio (ICER) - $83.58 $35.96
Cost-effectiveness
The cost per detected TB patient was similar for Scenario 2 and the base case ($474 and $473, respectively) but considerably higher for Scenario 1 ($573, Table 8). Scenario 1 had the highest diagnostic costs ($134 per patient) while Scenario 2 had the lowest treatment cost ($366). The latter was due to the smaller number of false-positive diagnoses of smear-negative / TB-LAMP- negative TB in this scenario.
The cost per DALY averted were similar for Scenario 2 and the base case ($29 and $28, respectively), but higher for Scenario 1 ($35, Table 8). The total cost for diagnosing and treating TB patients in this cohort of 10,000 TB suspects was $771,834 for Scenario 1, $631,089 for Scenario 2 and $538,384 for the base case.
The incremental cost-effectiveness ratio (ICER) for Scenario 1 compared to the base case was $83.58 per DALY averted, and for Scenario 2 was $35.96 per DALY averted. Both estimates were far below India’s per–capita gross domestic product (GDP) for 2011 ($1150).
Sensitivity analyses showed that the cost-effectiveness of the TB-LAMP scenarios was hardly affected by omitting DST and second-line treatment for previously treated patients or by increasing the HIV prevalence in the cohort, and moderately affected by changing the price of the TB-LAMP assay and the capacity level at which it is used. The cost-effectiveness of the TB-LAMP scenarios was strongly affected by varying the TB prevalence in the patient cohort, and by reducing specificity of clinical diagnosis. Reducing the prevalence of smear-positive TB in the cohort from 10 to 5% almost doubled the ICER for scenario 1 to $148. Reducing the specificity of the clinical diagnostic procedure from 94% (as assumed in the model) to 75% increased the ICER for scenario 1 to $225. Scenario 1 was no longer cost-effective (i.e. the ICER exceeded the per-capita GDP) when this specificity dropped below 64%.
3.5.4 Conclusion
TB-LAMP is cost-effective according to WHO-CHOICE criteria when compared to microscopic smear examination. However, the cost per DALY averted depends on whether clinicians will add clinical procedures (chest X-ray, antibiotic trial) if a TB-LAMP result is negative. The cost-effectiveness estimates were strongly sensitive to assumptions regarding the accuracy of these clinical procedures and on the TB prevalence among patients seeking a diagnosis.
4. GRADE EVIDENCE PROFILE AND SUMMARY OF TEST ACCURACY
4.1 Grade evidence profiles
The GRADE process was used to evaluate the quality of the evidence presented to the Expert Group to determine the suitability of TB-LAMP as a replacement test for microscopy. Sensitivity and specificity of the TB-LAMP was determined using conventional culture as the reference test in the four groups of cross-sectional studies evaluated:
Clinical validation study (industry sponsored) (Mitarai S et al. Int J Tuberc Lung Dis. 2011 Feb 15(9): 1211-1217);
Multi-centre evaluation study in reference laboratories (coordinated by FIND);

36 | P a g e
Multi-centre evaluation studies in intended settings of use (coordinated by FIND);
Repeat evaluation study in intended settings of use (Indian sites only) (coordinated by FIND).
Although randomised control trials are the preferred source of evidence for measures of effectiveness, the GRADE process also allows for the use of information from observational studies. In the TB-LAMP evidence assessment the observational studies started with a baseline quality of 4 points and the quality of data was downgraded depending on the seriousness of the limitations across the domains of overall study design, study limitations, indirectness of evidence, inconsistency in results across studies, imprecision in summary estimates, and likelihood of publication bias.
Study limitations were assessed using the QUADAS tool (Table 1) for assessing diagnostic accuracy studies. The domain of study limitations was downgraded by one point due to two reasons: i) The recommended reaction volume was increased after the FIND-coordinated multi-centre evaluation studies in intended settings of use, and re-tested thereafter only in India; ii) Non-tuberculosis mycobacteria were excluded from all studies and hence the specificity of the assay for excluding NTM could not be determined.
Indirectness
Greater confidence is attributed to results when there is direct evidence. Direct evidence involves research that directly compares the intervention of interest in the target population. Microscopy has well-described reduced sensitivity for the diagnosis of TB in persons living with HIV. Insufficient testing of TB- LAMP was undertaken in high HIV burden settings, especially in the clinical evaluation studies in the settings of intended use, where Uganda was the only high HIV prevalence site included. Although the lowest assay sensitivity was observed in Uganda it is unclear if the reduced sensitivity was related to HIV prevalence or other factors. The quality of the evidence was therefore downgraded one point for indirectness.
Inconsistency in results across studies
Inconsistency refers to the variations in sensitivity or specificity estimates across studies. Variation was observed in specificity values across studies: 93.9% (95CI 80.4% - 98.3%) in Mitarai et al; 94.7% (95CI 93%-96%) in FIND-coordinated multi-centre evaluation studies in reference laboratories; and 96.3% (95CI 95% - 97%) and 97.6% (95CI 95% - 99%) in FIND-coordinated multi-centre evaluation studies in intended settings of use. Variation in both specificity and sensitivity (p-values 0.047 and 0.001, respectively) was observed in evaluation studies performed in settings of intended use. Variation was also observed in sensitivity values across smear-negative/culture-positive cases: 55.6% (95CI 43% - 68%) in Mitarai et al; 53.1% (95CI 46% - 60%) in FIND-coordinated multi-centre evaluation studies in reference laboratories; and 62.0% (95CI 54% - 69%) and 71.4% (95CI 45%-88%) in FIND-coordinated multi-centre evaluation studies in intended settings of use. The quality of the evidence was subsequently downgraded one point for inconsistency.
Imprecision
Imprecision relates to the width of confidence intervals for pooled sensitivity or specificity estimates. Imprecision in summary estimates was not a concern. Across all studies the pooled sensitivity and specificity values had narrow confidence intervals. Data quality was therefore not downgraded for the domain of imprecision.
Likelihood of publication bias
Publication bias was considered highly unlikely as the TB-LAMP is a new assay, produced by a single manufacturer and only available to a small number of investigators. Evidence was therefore not downgraded.

37 | P a g e
4.2 Quality of Evidence
FINAL GRADING OF QUALITY OF EVIDENCE : VERY LOW
The GRADE evidence summary is presented in Tables 9-10.
4.3 Expert Group Observations
The Expert Group recognized that the TB-LAMP is a new assay which offers a manual molecular approach to TB detection that seems to be feasible in peripheral laboratories following extensive training. Trained users were generally satisfied with the ease of performing the assay and found TB-LAMP to be simpler to perform than microscopy. Nevertheless, the risk of cross contamination remained a concern for approximately half of the users.
TB-LAMP has the advantages of being relatively high-throughput, not requiring sophisticated instrumentation, and being self-contained, without the need for complex biosafety facilities or ancillary equipment. The Expert Group, however, noted that these benefits must be weighed against the need for extensive training required to achieve reproducible results and the increased test cost relative to that of microscopy. In addition, the impact of operational issues such as the need for electricity supply, adequate storage and waste disposal, stock monitoring and temperature control in storage settings where temperatures are above the manufacturer’s recommendation (currently 30°C for TB-LAMP) on the health system need to be considered.
Considering the balance of harms and benefits associated with implementing the TB-LAMP assay, the Expert Group noted that in settings with a TB prevalence of 5% the positive predictive value of the test ranged from 33.3% - 56.6% across the study groups (Table 11). In such settings the number of true positive results is almost the same as the number of false positive results. In settings with a TB prevalence of 10% the positive predictive value of the test increased but ranged from 51.3%-73.3% across all studies (Table 11), which was considered to be too low for any assay to be used a stand-alone diagnostic test.
The Expert Group noted that batching of samples (up to 14 samples) would minimize the cost per test given that the manufacturer recommends for a positive and negative control test to be included in each batch of the TB-LAMP assay. Concerns were raised that batching tests to minimize test costs could result is diagnostic delays for patients. The Expert Group also noted that changes to the assay made following the detection of false-positive results in the India study was only re-evaluated in India where the highest number of false-positive results were initially observed. The Expert Group was concerned that the modified assay was not re-evaluated at the other evaluation settings of intended use. Concerns were also raised that conventional Ziehl-Neelsen microscopy was used as the comparison test with the TB LAMP assay and recommended that comparison should be made with LED fluorescence microscopy as the reference standard, given that LED microscopy is roughly 10% more sensitive than conventional light microscopy1. The Expert Group concluded that given the anticipated costs of TB-LAMP relative to microscopy, the current evidence base for TB-LAMP would not justify recommending major policy changes to the primary TB diagnostic services in resource- constrained settings.
4.4 Expert Group Recommendations
The Expert Group agreed that TB-LAMP technology has potential as a rapid TB diagnostic tool but that the body of evidence presented to the Expert Group was insufficient to make a recommendation either in favour of, or against the use of TB-LAMP as a replacement test for AFB microscopy. The Expert Group made the following suggestions to improve the evidence base for TB-LAMP:
The specificity of the TB-LAMP assay remains a major concern especially when the TB prevalence falls below 10%. In these settings (often found in high-burden TB countries), the positive predictive value

38 | P a g e
for the assay is insufficient. Further research is therefore needed to improved assay specificity, especially for high-burden TB settings;
Further studies in different geographical regions are needed, especially in high HIV prevalence setting where the sensitivity of sputum smear microscopy is reduced;
Head-to-head comparison studies with TB-LAMP and LED microscopy are recommended given the increased sensitivity of LED compared with conventional light microscopy1;
Further research is recommended to simplify the technology and increase the user robustness of the assay, especially in settings where staff are unfamiliar with manual molecular techniques;
The anticipated cost of the TB-LAMP assay relative to microscopy was perceived as a major barrier to implementation and scale-up;
Evaluation of the TB-LAMP assay by more investigators is encouraged to enable further independent assessment.
The Expert Group recommended that future research should include the following:
Assessing TB-LAMP performance over longer periods of time to be able to exclude performance drops as a result of user fatigue or accumulating DNA in the laboratory;
Assessing cost-effectiveness within national TB programmes in terms of external quality assurance, training, and retraining.
1WHO Policy Statement on LED fluorescence microscopy. Available at http://www.stoptb.org/wg/gli/documents.asp

39 | P a g e
4.4 Grade evidence profiles
Table 9: GRADE evidence profile: TB LAMP as a replacement test for conventional microscopy
FIND- coordinated multi-centre evaluation studies, Mitarai et al.
No of participants (studies)
Study design Limitations Indirectness Inconsistency Imprecision Publication bias
Quality of evidence (GRADE)
1
Importance
A. Outcome: Diagnostic accuracy for detection of pulmonary TB
True Positives (910)
3,538 (3) A1
Cross-sectional
Serious limitations (-1 point)
A2
Serious indirectness (-1 point)
A3
Serious inconsistency (-1 point)
A4
No serious imprecision
A5
Not likely A6
Very low
Critical (7-9)
True Negatives (2,336)
3,538 (3) A1
Cross-sectional
Serious limitations (-1 point)A2
Serious
indirectness (-1 point) A3
Serious inconsistency (-1 point) A4
No serious imprecision
A5
Not likely A6
Very low
Critical (7-9)
False Positives (101)
3,538 (3) A1 Cross-sectional
Serious limitations (-1 point)A2
Serious indirectness (-1 point) A3
Serious inconsistency (-1 point) A4
No serious imprecision
A5
Not likely A6 Very low
Critical (7-9)
False Negatives (191)
3,538 (3) A1 Cross-sectional
Serious limitations (-1 point)
A2
Serious indirectness (-1 point)
A3
Serious inconsistency (-1 point)
A4
No serious imprecision
A5
Not likely A6 Very low
Critical (7-9)
Footnotes: 1 Quality of evidence for cross sectional studies was set as “high quality evidence” and then downgraded for serious (1 point subtracted) or very serious (2 points subtracted) limitations. Limitations were based on five criteria: study limitations, indirectness of evidence, inconsistency in results across studies, imprecision in summary estimates, and likelihood of publication bias. Raw totals (TP, FN, FP, TN) were calculated based on average sensitivity and specificity across study sites with no weighting or modeling considered feasible due to small number of studies. A1 Sensitivity and specificity were determined using conventional culture as the index test in three cross-sectional studies: Multi-centre clinical evaluation studies in intended settings of use (coordinated by FIND), multi-centre clinical evaluation studies in reference laboratories (coordinated by FIND) and a single-centre clinical validation study (Mitarai S et al. Int J Tuberc Lung Dis. 2011 Feb 15(9): 1211-1217).
A2 Study limitations were assessed using the QUADAS tool. The recommended reaction volume was increased after the FIND-coordinated multi-centre evaluation studies in intended settings of use, and tested thereafter only in one site (India). Positivity rate among TB suspects in one setting was too high, suggesting selection of patients at a referral center and limiting representativeness. Non-tuberculosis mycobacteria were excluded from studies. All studies included only subjects aged >18 years of age.

40 | P a g e
A3 Concerns about indirectness of population, comparator and outcomes were raised. Insufficient testing was performed in high HIV burden settings (only Uganda) which limits the generalizability of the findings. Conventional Ziehl-Neelsen microscopy was used as the comparison test instead of LED microscopy that is known to have increased sensitivity compared to conventional light microscopy. Additionally, no patient important outcomes were measured directly. A4 Variation was observed in specificity values across studies: 93.9% (80.4-98.3%) in Mitarai et al; 94.7% (93-96%) in FIND-coordinated multi-centre evaluation studies in reference laboratories; and 96.3% (95-97%) and 97.6% (95-99%) in FIND-coordinated multi-centre evaluation studies in intended settings of use. Variation in both specificity and sensitivity (p-values 0.047 and 0.001, respectively) was observed in evaluation studies performed in settings of intended use. Variation was observed in sensitivity values across smear-negative / culture-positive cases: 30.2% (19-45%) and 55.6% (43-68%) in Mitarai et al; 53.1% (46-60%) in FIND-coordinated multi-centre evaluation studies in reference laboratories; and 62.0% (54-69%) and 71.4% (45-88%) in FIND-coordinated multi-centre evaluation studies in intended settings of use. A5 Sensitivity and specificity values derived from the studies had narrow confidence intervals. A6
Publication bias was considered highly unlikely as the TB LAMP is a new assay, produced by a single manufacturer and only available to a small number of investigators.

41 | P a g e
Table 5: GRADE evidence profile: TB LAMP as a replacement test for conventional microscopy, stratified by smear status
FIND- coordinated multi-centre evaluation studies, Mitarai et al. No of participants
(studies) Study design Limitations Indirectness Inconsistency Imprecision Publication
bias Quality of evidence
(GRADE)1
Importance
A. Outcome: Sensitivity in detecting of smear-positive pulmonary TB
True Positives (679)
3,538 (3) A1
Cross-sectional
Serious limitations (-1 point)
A2
Serious indirectness (-1 point) A3
Serious inconsistency (-1 point) A4
No serious
imprecision A5
Not likely A6
Very low
Critical (7-9)
False Negatives (18)
3,538 (3) A1
Cross-sectional
Serious limitations (-1 point)A2
Serious
indirectness (-1 point) A3
Serious inconsistency (-1 point) A4
No serious
imprecision A5
Not likely A6
Very low
Critical (7-9)
B. Outcome: Sensitivity in detecting of smear-negative pulmonary TB
True Positives (231)
3,538 (3) A1 Cross-sectional
Serious limitations (-1 point)A2
Very serious
indirectness (-2 points) A3
Serious inconsistency (-1 point) A4
No serious
imprecision A5
Not likely A6 Very low
Critical (7-9)
False Negatives (173)
3,538 (3) A1 Cross-sectional
Serious limitations (-1 point)A2
Very serious
indirectness (-2 points) A3
Serious inconsistency (-1 point) A4
No serious
imprecision A5
Not likely A6 Very low
Critical (7-9)
Footnotes: 1 Quality of evidence for cross sectional studies was set as “high quality evidence” and then downgraded for serious (1 point subtracted) or very serious (2 points subtracted) limitations. Limitations were based on five criteria: study limitations, indirectness of evidence, inconsistency in results across studies, imprecision in summary estimates, and likelihood of publication bias. Raw totals (TP, FN, FP, TN) were calculated based on average sensitivity and specificity across study sites with no weighting or modeling considered feasible due to small number of studies. A1 Sensitivity and specificity of the TB LAMP assay (Eiken design lock kit) for detection of TB were determined using conventional culture as index test in 2 studies coordinated by FIND and 1 study from Mitarai et al. A2 Study limitations were assessed using the QUADAS tool. The recommended reaction volume was increased after the FIND-coordinated multi-centre evaluation studies in intended settings of use, and tested thereafter only in one site (India). Positivity rate among TB suspects in one setting was too high, suggesting selection of patients at a referral center and limiting representativeness. Non-tuberculosis mycobacteria were excluded from studies. All studies included only subjects aged >18 years of age. A3
Insufficient testing was performed in high HIV burden settings (only Uganda), of very serious concern for smear-negative pulmonary TB. A4
Variation was observed in specificity values across studies: 93.9% (80.4-98.3%) in Mitarai et al; 94.7% (93-96%) in FIND-coordinated multi-centre evaluation studies in reference laboratories; and 96.3% (95-97%) and 97.6% (95-99%) in FIND-coordinated multi-centre evaluation studies in intended settings of use. Variation in both specificity and sensitivity (p-values 0.047 and 0.001,

42 | P a g e
respectively) was observed in evaluation studies performed in settings of intended use. Variation was observed in sensitivity values across smear-negative / culture-positive cases: 30.2% (19-45%) and 55.6% (43-68%) in Mitarai et al; 53.1% (46-60%) in FIND-coordinated multi-centre evaluation studies in reference laboratories; and 62.0% (54-69%) and 71.4% (45-88%) in FIND-coordinated multi-centre evaluation studies in intended settings of use. A5 Sensitivity values derived from the studies had narrow confidence intervals. A6 Publication bias was considered highly unlikely as the TB LAMP is a new assay, produced by a single manufacturer and only available to a small number of investigators.

43 | P a g e
Table 11: GRADE summary of findings – various scenarios
Outcomes Average sensitivity (95% CI)
Average specificity (95% CI)
Prevalence TP FN TN FP PPV NVP
Study
Multi-centre clinical evaluation studies (intended settings of used)1
84.4% (80.5-97.7)
96.3% (95.1-97.2)
5% 42 8 917 33 56.6% 99.2%
10% 85 15 869 31 73.3% 98.3%
20% 170 30 773 27 86.1% 96.2%
Multi-centre clinical evaluation studies (reference laboratories)2
77.7% (73.6-81.4)
94.7% (92.6-96.2)
5% 39 11 899 51 43.5% 98.8%
10% 78 22 852 48 61.9% 97.5%
20% 155 45 757 43 78.5% 94.4%
Single-centre published study3
88.2% (81.4-92.7)
93.9% (80.4-98.3)
5% 44 6 862 88 33.3% 99.3%
10% 88 12 816 84 51.3% 98.5%
20% 176 24 726 74 70.3% 96.8%
Footnotes: 1 Eleven study sites in three countries 2 Four study sites 3 Mitarai S, Okumura M, Toyota E, Yoshiyama T, Aono A, Sejimo A, et al. Evaluation of a single loop-mediated isothermal amplification test kit for the diagnosis of tuberculosis. Int J Tuberc Lung Dis. 2011 Feb 15(9):1211-1217.
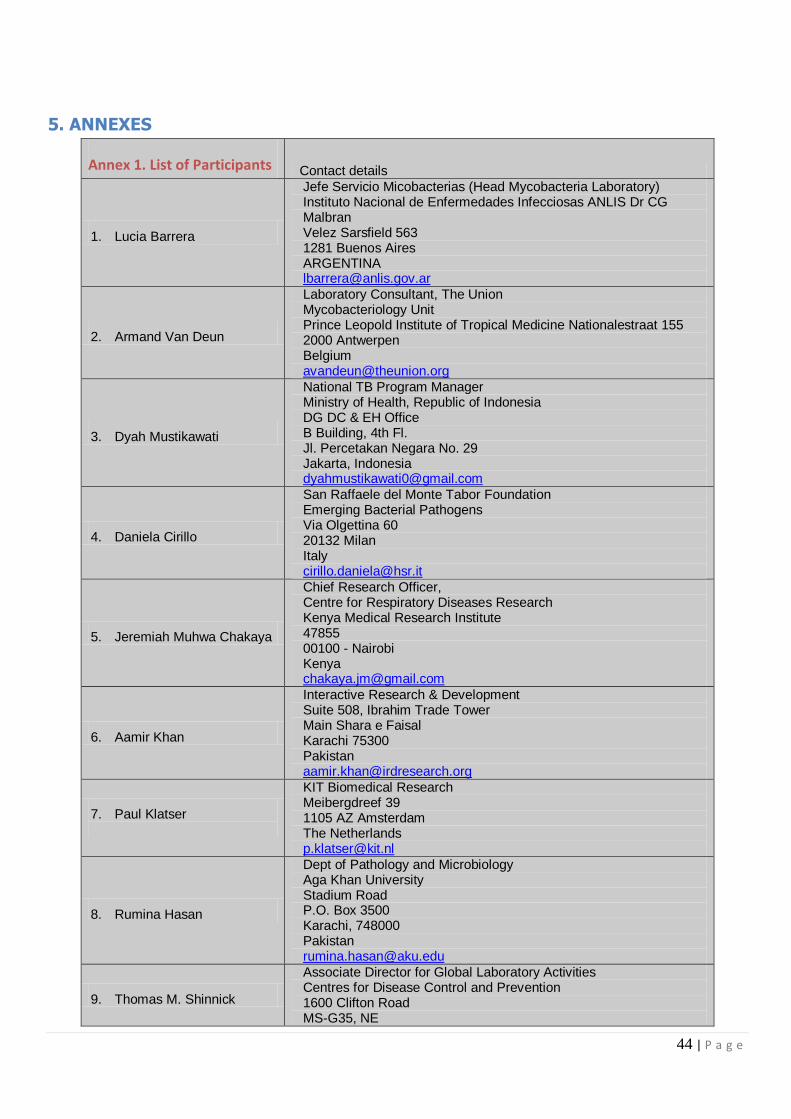
44 | P a g e
5. ANNEXES
Annex 1. List of Participants Contact details
1. Lucia Barrera
Jefe Servicio Micobacterias (Head Mycobacteria Laboratory) Instituto Nacional de Enfermedades Infecciosas ANLIS Dr CG Malbran Velez Sarsfield 563 1281 Buenos Aires ARGENTINA [email protected]
2. Armand Van Deun
Laboratory Consultant, The Union Mycobacteriology Unit Prince Leopold Institute of Tropical Medicine Nationalestraat 155 2000 Antwerpen Belgium [email protected]
3. Dyah Mustikawati
National TB Program Manager Ministry of Health, Republic of Indonesia DG DC & EH Office B Building, 4th Fl. Jl. Percetakan Negara No. 29 Jakarta, Indonesia [email protected]
4. Daniela Cirillo
San Raffaele del Monte Tabor Foundation Emerging Bacterial Pathogens Via Olgettina 60 20132 Milan Italy [email protected]
5. Jeremiah Muhwa Chakaya
Chief Research Officer, Centre for Respiratory Diseases Research Kenya Medical Research Institute 47855 00100 - Nairobi Kenya [email protected]
6. Aamir Khan
Interactive Research & Development Suite 508, Ibrahim Trade Tower Main Shara e Faisal Karachi 75300 Pakistan [email protected]
7. Paul Klatser
KIT Biomedical Research Meibergdreef 39 1105 AZ Amsterdam The Netherlands [email protected]
8. Rumina Hasan
Dept of Pathology and Microbiology Aga Khan University Stadium Road P.O. Box 3500 Karachi, 748000 Pakistan [email protected]
9. Thomas M. Shinnick
Associate Director for Global Laboratory Activities Centres for Disease Control and Prevention 1600 Clifton Road MS-G35, NE
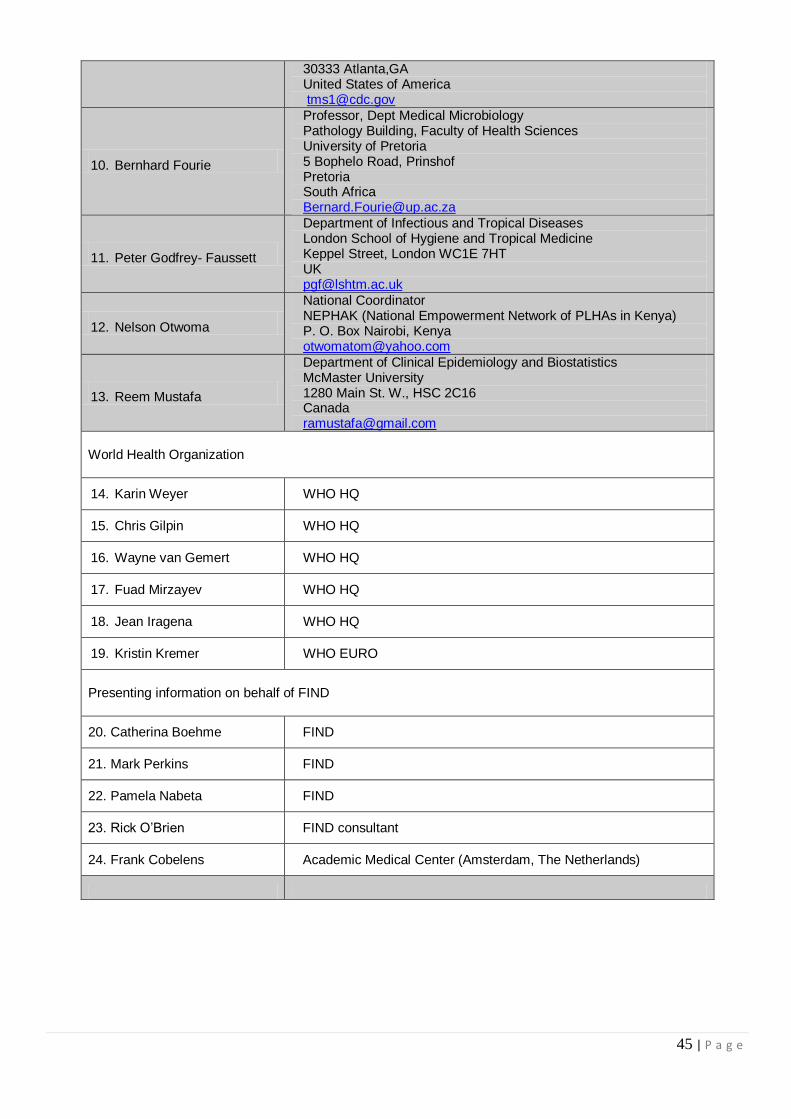
45 | P a g e
30333 Atlanta,GA United States of America [email protected]
10. Bernhard Fourie
Professor, Dept Medical Microbiology Pathology Building, Faculty of Health Sciences University of Pretoria 5 Bophelo Road, Prinshof Pretoria South Africa [email protected]
11. Peter Godfrey- Faussett
Department of Infectious and Tropical Diseases London School of Hygiene and Tropical Medicine Keppel Street, London WC1E 7HT UK [email protected]
12. Nelson Otwoma
National Coordinator NEPHAK (National Empowerment Network of PLHAs in Kenya) P. O. Box Nairobi, Kenya [email protected]
13. Reem Mustafa
Department of Clinical Epidemiology and Biostatistics McMaster University 1280 Main St. W., HSC 2C16 Canada [email protected]
World Health Organization
14. Karin Weyer WHO HQ
15. Chris Gilpin WHO HQ
16. Wayne van Gemert WHO HQ
17. Fuad Mirzayev WHO HQ
18. Jean Iragena WHO HQ
19. Kristin Kremer WHO EURO
Presenting information on behalf of FIND
20. Catherina Boehme FIND
21. Mark Perkins FIND
22. Pamela Nabeta FIND
23. Rick O’Brien FIND consultant
24. Frank Cobelens Academic Medical Center (Amsterdam, The Netherlands)

46 | P a g e
Annex 2. Meeting Agenda
WHO Policy guidance on the use of Loop-mediated Isothermal Amplification (LAMP) assay
for detection of tuberculosis
- EXPERT GROUP MEETING - Date and time: 20 April 2012, 09:00 – 13:00 Venue: WHO-HQ, M building, room M105, Geneva, Switzerland BACKGROUND Although commonly used around the world for detection of TB, sputum smear microscopy has limited sensitivity and specificity, resulting in both suboptimal case detection and false positive diagnoses. A highly sensitive and specific diagnostic that would require minimal infrastructure, cost and training similar or less than smear microscopy would therefore be of great benefit to TB control.
Loop-mediated Isothermal Amplification (LAMP) is a nucleic acid amplification technology (NAAT) developed by Eiken Chemical Co., Ltd. In a joint development agreement with the Foundation for
Innovative New Diagnostics (FIND), Eiken has modified the technique and transformed it into a more convenient kit format for use at the microscopy centre level to provide a yes/no answer for TB case
detection.
WORLD HEALTH ORGANIZATION: EVIDENCE-BASED PROCESS FOR POLICY GUIDANCE In order to facilitate the development of rapid policy guidance, WHO has adopted a systematic, structured, evidence-based process: The first step involves a systematic review and meta-analysis of available data, using standard methods appropriate for diagnostic accuracy studies. The second step involves the convening of an Expert Group to evaluate the strength of the evidence base and recommend operational and logistical considerations for mainstreaming such tools/approaches into national TB control programmes, and/or identify gaps to be addressed in future research. The third and final step involves WHO policy guidance on the use of these tools/approaches, presented to the WHO Strategic and Technical Advisory Group for TB (STAG-TB) for endorsement and subsequent dissemination to Member States for implementation. MEETING OBJECTIVES
To review available data from field evaluation and demonstration studies on the performance characteristics of the LAMP assay for the diagnosis of TB;
To outline potential subject matters to be addressed by WHO in subsequent policy recommendations. EXPECTED OUTCOMES
Evidence-based recommendations on the use of the LAMP assay for the diagnosis of TB;
Consensus on additional potential subject matters to be investigated for development of future policy recommendations.

47 | P a g e
PROVISIONAL AGENDA
Friday, 20 April 2012 Chairs: Jeremiah Chakaya & Chris Gilpin Rapporteur: Wayne van Gemert
09:00 – 09:10 Welcome
Karin Weyer
09:10 – 09:20
Meeting scope and objectives; Declaration of Interests by Expert Group members
Wayne van Gemert
09:20 – 09:50 Grading quality of evidence and strength of recommendations: Brief overview of GRADE
Reem Mustafa
09:50 – 10:00 Questions
10:00 – 11:00
Data from field evaluation and demonstration studies on the performance characteristics of the LAMP assay; questions
Mark Perkins / Catharina Boehme /
Frank Cobelens
11:00 – 11:15 Coffee break
11:15 – 12:30 Closed session: Expert Group assessment Expert group
members
12:30 – 12:45 Final recommendations: use of LAMP assay for the detection of TB
Karin Weyer
12:45 – 13:00 Closing Karin Weyer

48 | P a g e
Annex 3: Declarations of Interest
None declared Lucia Barrera Daniela Cirillo Jeremiah Chakaya Nelson Otwoma Rumina Hasan Armand Van Deun Aamir Khan Bernard Fourie Dyah Mustikawati Reem Mustafa Peter Godfrey-Faussett Thomas Shinnick Declared, insignificant Paul Klatser - Department received research funding for development of a LAMP assay for leishmaniasis; institute paid for flight because of attendance at other meeting in Annecy Declared, significant (observer status) Catharina Boehme - FIND employment Mark Perkins - FIND employment Pamela Nabeta - FIND employment Rick O’Brien - FIND consultancy Frank Cobelens - FIND consultancy: participation in validation study and cost-effectiveness analysis

49 | P a g e
Annex 4. Evaluation studies with LAMP test
Evaluation studies with LAMP tests – An overview
Citation Source
Population
In house/ Eiken prototype/ Eiken
design locked
Primer target; Method for DNA extraction
Direct/Pellet, Frozen/Fresh
Sensitivity in S+C+ (95 CI)
Sensitivity in S-C+ (95 CI)
Sensitivity in C+ (95 CI)
Specificity in C- (95 CI)
Analytical performance (if reported)
FIND 2nd
Evaluation studies, 2012
India Eiken design
locked gyrB & IS gene; Proprietary
PURE method Direct, Fresh 96.9 (84-99)
31/32 71.4 (45-88)
10/14 89.1 (77-95)
41/46 97.6 (95-99)
362/371
FIND Evaluation studies (intended settings of use), 2011
India Uganda
Peru
Eiken design locked
gyrB & IS gene; Proprietary PURE method Direct, Fresh
97.2 (94-99) 243/250
62.0 (54-69) 88/142
84.4 (80-88) 331/392
96.3 (95-97) 1299/1349
FIND Evaluation studies (reference laboratories), 2010
Vietnam South Africa
Peru Brazil
Eiken design locked
gyrB & IS gene; Proprietary PURE method Direct, Fresh
97.2 (94-99) 239/246
53.1 (46-60) 103/194
77.7 (74-81) 342/440
94.7 (93-96) 587/620
Mitarai IJTLD, 2011 (11) Japan Eiken design
locked gyrB & IS gene; Proprietary
PURE method
Direct, Fresh & frozen
98.2 (95-99) 166/169
55.6 (43-68) 30/54
87.9 (83-91) 196/223
90.7 (83-95) 88/97
Pellet, Fresh & frozen
98.9 (96-100) 178/180
30.2 (19-45) 13/43
85.7 (80-90) 191/223
92.8 (86-96) 90/97
George PLoS One, 2011 (12)
India In house (Zhu) 16S rRNA rimM gene Pellet, Frozen 96.7 (83-99)
29/30 22.2 (6-55)
2/9 79.5 (64-89)
31/39 100.0 (88-100)
29/29
Geojith J Microbiol Methods, 2011 (13)
India
In house (Zhu) 16S rRNA rimM gene; lysing
method (Richter, 2004) Culture isolates
5
44.7 (30-60) 17/38
94.4 (74-99) 17/18
In house gyrB gene; Proprietary kit
(Roche Amplicor) Culture isolates
6
99.1 (95-100) 113/114
66.7 (21-94) 2/3
Aryan Microbiol Res, 2010 (14)
Iran In house IS6110; boiling method (Afghani & Stutman, 1996)
Direct, Fresh Specificity: 100% LOD: 1 copy genomic DNA
Poudel KUMJ, 2009 (15) Nepal In house 16S rRNA gene; freeze & boil
method Pellet, Fresh
97.0 (92-99) 97/100
94.1 (88-97) 96/102
Zhu J Microbiol Methods, 2009 (16)
China In house 16S rRNA rimM gene; Xue
2004 Culture isolates
Specificity: 100% LOD: 1pg/tube of genomic DNA
Lee J Microbiol Methods, 2009 (17)
China In house
(RT-LAMP-ELISA-hybridization)
16S rRNA; Epicentre Biotechnologies kit (RNA &
DNA purification)
Pellet, Fresh; Culture isolates
94.1 (81-98)
32/34 94.0 (88-97)
109/1126 Specificity: 100% LOD 10 ⁹ ng RNA
Pandey J Med Microbiol, 2008 (18)
Nepal In house 16S rRNA gene; Freezing & boiling (Woods & Cole, 1989)
Pellet, Fresh 100.0 (96-100)
90/90 100.0 (61-100)
6/6 100.0 (96-100)
96/96 94.2 (90-98)
98/104 Specificity: 100% LOD: 10 copies DNA
Boehme JCM, 2007 (10) Peru
Bangladesh Tanzania
Eiken prototype gyrB & IS gene; Proprietary
method (prototype) Direct, Fresh
97.7 (95-100) 173/177
48.8 (34-64) 21/43
88.2 (83-92) 194/220
99.0 (98-100) 500/505
Iwamoto JCM, 2003 (8) Japan In house gyrB gene; Proprietary kit
(Roche Amplicor) Pellet, Fresh;
Culture isolates
Specificity: 100% LOD: 5-50 copies purified DNA
5 Reference standard GenoType MTBC positive or negative; 60 min format 6 Reference standard GenoType MTBC positive or negative

50 | P a g e
Evaluation studies with LAMP tests – Japanese studies
Citation Source
Population
In house/ Eiken prototype/ Eiken
design locked
Primer target; Method for
DNA extraction
Direct/Pellet, Frozen/Fresh
Sensitivity in S+C+ (95 CI)
Sensitivity in S-C+ (95 CI)
Sensitivity in C+ (95 CI)
Specificity in C- (95 CI)
Atsukawa et al. Evaluation of a novel MTB complex detection kit using the LAMP method. 23
rd Annual Meeting
of the Japanese Society for Clinical Microbiology (Jan, 2012) Japan
Eiken design locked
gyrB & IS gene; Proprietary PURE method
Direct, Fresh 100.0(72 - 100)
10/10 0(0 - 66)
0/2 83.3(55- 95)
10/12 98.5(95 - 100)
129/131
Baba et al. Evaluation of detection reagents for MTB complex and MAC using nucleic acid amplification testing method. 23
rd Annual Meeting of the Japanese Society for
Clinical Microbiology (Jan, 2012)
Japan Eiken design
locked gyrB & IS gene; Proprietary
PURE method Direct, Fresh
100.0(68-100) 8/8
66.7(21-94) 2/3
90.9 (62-98) 10/11
98.2(95-99) 161/164
Moriya et al. Comparison of the PURE-LAMP and COBAS TaqMan techniques for MTB complex detection using 136 clinical samples. 23
rd Annual Meeting of the Japanese
Society for Clinical Microbiology (Jan, 2012)
Japan Eiken design
locked gyrB & IS gene; Proprietary
PURE method Direct, Fresh
100.0(74-100) 11/11
73.3(48-89) 11/15
84.6(66-94) 22/26
97.3(92-99) 107/110
Hosoya et al. Study of detection reagents for MTB complex using LAMP. 43rd Congress of the Japan Society for Clinical Laboratory Automation (Oct. 2011)
Japan Eiken design
locked gyrB & IS gene; Proprietary
PURE method Direct, Fresh -
100.0(21-100) 1/1
100.0 (21-100) 1/1
95.1(89 - 98) 78/82