Embed Size (px)
Citation preview
Filipe André da Palma Marques
Licenciatura em Engenharia de Micro e Nanotecnologias
Sensing methods for real-time Loop-mediated Isothermal Amplification in
Digital Microfluidic systems
Dissertação para obtenção do Grau de Mestre em Engenharia de Micro e Nanotecnologias
Orientador: Professor Doutor Rui Alberto Garção Barreira do Nascimento Igreja, Departamento de Ciências dos
Materiais, Faculdade de Ciências e Tecnologia – Universidade Nova de Lisboa
Co-orientador: Professor Doutor Pedro Viana Baptista, Departamento de Ciências da Vida, Faculdade de
Ciências e Tecnologia – Universidade Nova de Lisboa
Júri:
Presidente: Prof. Doutor Luís Miguel Nunes Pereira
Arguente: Prof. Doutor José Ricardo Ramos Franco Tavares Vogal: Prof. Doutor(a) Rui Alberto Garção Barreira do Nascimento Igreja
Setembro 2018

SENSING METHODS FOR REAL-TIME LOOP-MEDIATED ISOTHERMAL AMPLIFICATION IN DIGITAL MICROFLUIDIC SYSTEMS
SENSING METHODS FOR REAL-TIME LOOP-MEDIATED ISOTHERMAL AMPLIFICATION IN DIGITAL MICROFLUIDIC SYSTEMS
© Filipe André da Palma Marques
Faculdade de Ciências e Tecnologia
Universidade Nova de Lisboa
A Faculdade de Ciências e Tecnologia e a Universidade Nova de Lisboa têm o direito, perpétuo e sem limites geográficos, de arquivar e publicar esta dissertação através de exemplares impressos reproduzidos em papel ou de forma digital, ou por qualquer outro meio conhecido ou que venha a ser inventado, e de a divulgar através de repositórios científicos e de admitir a sua cópia e distribuição com objetivos educacionais ou de investigação, não comerciais, desde que seja dado crédito ao autor e editor.

SENSING METHODS FOR REAL-TIME LOOP-MEDIATED ISOTHERMAL AMPLIFICATION IN DIGITAL MICROFLUIDIC SYSTEMS
SENSING METHODS FOR REAL-TIME LOOP-MEDIATED ISOTHERMAL AMPLIFICATION IN DIGITAL MICROFLUIDIC SYSTEMS
i
Acknowledgements
My parents, and aunt (!), once told me that university would bring some of the best years of my
life, but has a rebellious son, I thought that they were just persuading me into studying more. Five
years later, I have to recognize that they were right. University made me grow so much, meet
friends that I’ll cherish for the rest of my life and study something that I’m really passionate about.
However, even if I am a little bit nostalgic, I’m still very eager for what comes next, since the end
of something merely indicates a step into something new. Nevertheless, the first page of this
thesis is dedicated to everyone that made all of this possible.
Firstly, I would like to thank Professor Rodrigo Martins and Professora Elvira Fortunato, for not
only creating the best course in the whole wide world, Engineering in Micro and Nanotechnology,
but also for supplying the conditions for this thesis to exist. Also, for elevating Portuguese
Nanotecnology to the highest levels and making all of this possible.
Next, to my family, for giving me your heart and soul when raising me, for all the patience you had
with my stubbornness, for being there in good and in the bad moments, for your will to help me in
any moment. and mostly, for making me who I am today. Without you, I wouldn’t have gotten
here!
To my girlfriend, for giving me a smile even when things weren’t going as I expected, for putting
up with my bad mood even when you didn’t have to, for your support during this manuscript writing
and for being the kindest, most caring person in the world.
To my friends, who have my eternal gratitude by supporting me in every moment, for inspiring me
and for reviewing this manuscript. I know don’t say this a lot, but you are the best friends I could
have ever asked for and for that, thank you!
To each and everyone in the three institutions that received me during these months: CEMOP,
CENIMAT and Department of Life Sciences (DCV).
Also, to everyone in laboratory 315, but especially to Bruno Veigas, for teaching how to think and
act (or try to) as a researcher, for putting up with the rookie (in a totally unknown world to me!)
and for all your advices and teachings. You once told me: “Science can’t be made middle of the
darkness, you have to light your way while you walk.”. I will try to work by these words.
Moreover, Beatriz Coelho, I don’t even know from where to begin. You taught me everything I
had to know to realize this thesis. From all the techniques produced in a physics/materials
laboratory or clean room, to all the techniques produced in a biochemistry laboratory. You’ve
endured my failures with patience, my ignorance with knowledge and never quit even were results
weren’t the most favorable. Thank you for all your advices, for working after-hours for my benefit
and for always being there if help was needed. I couldn’t have asked for a better teacher, thank
you for everything.

SENSING METHODS FOR REAL-TIME LOOP-MEDIATED ISOTHERMAL AMPLIFICATION IN DIGITAL MICROFLUIDIC SYSTEMS
ii
Furthermore, I would like to thank my supervisors, Professor Rui Igreja and Professor Pedro
Baptista, for your invaluable guidance, during my work and enduring all those endless reunions.
Last but not least, to Professor Hugo Águas, for his patience during reunions and for his words of
advice on PDMS sealing and photolithography.

SENSING METHODS FOR REAL-TIME LOOP-MEDIATED ISOTHERMAL AMPLIFICATION IN DIGITAL MICROFLUIDIC SYSTEMS
iii
SENSING METHODS FOR REAL-TIME LOOP-MEDIATED ISOTHERMAL AMPLIFICATION IN DIGITAL MICROFLUIDIC SYSTEMS
iv
Abstract
Digital Microfluidics (DMF) is a technology capable of maneuvering picoliter to microliter droplets
in an independent and individual manner, with a wide variety of uses for bioassays and
biosensing. These systems are advantageous for their small volumes, higher portability and
multiplex assay capabilities, proving to be very capable of lab-on-chip and point-of-care
applications.
One of these applications are DNA amplification assays, of which, Loop Mediated Isothermal
Amplification (LAMP), that has received increased interest from the scientific community. This
method is a sensitive and simple diagnostic tool for fast detection and identification of molecular
biomarkers enabling real-time monitoring. Nevertheless, sensing methods coupled with DMF
devices are still uncapable of measuring the progress of said reaction in real-time.
This work explores two real-time LAMP measurement approaches to be coupled with a DMF
system. The first approach uses an H-shaped device, where human c-Myc proto-oncogene and
human 18S housekeeping gene are amplified and measured in real-time through fluorescence
methods. The second approach uses interdigitated electrodes, where human c-Myc proto-
oncogene is amplified and measured in real-time through Electrochemical Impedance
Spectroscopy (EIS).
Following development and characterization of both techniques, fluorescence measuring devices
show 49% fluorescence signal difference between positive and negative controls end-points. EIS
measuring devices indicate significant differences between commercial solutions with pH 4, 7 and
10, by Ciclic Voltammetry. This suggests that such devices could be used for real-time, label free,
LAMP monitoring, since significant pH changes occur during a LAMP reaction
Keywords: Digital Microfluidics, Loop-Mediated Isothermal Amplification, c-Myc, 18S,
Fluorescence, Eletrochemical Impedance Spectroscopy, lab-on-chip, point-of-care.

SENSING METHODS FOR REAL-TIME LOOP-MEDIATED ISOTHERMAL AMPLIFICATION IN DIGITAL MICROFLUIDIC SYSTEMS
v
SENSING METHODS FOR REAL-TIME LOOP-MEDIATED ISOTHERMAL AMPLIFICATION IN DIGITAL MICROFLUIDIC SYSTEMS
vi
Resumo
Microfluídica Digital (MFD) é uma tecnologia capaz de manobrar gotas com volumes entre os
picolitros e os microlitros de uma maneira independente e individual, com uma elevada variedade
de usos para bioensaios e biossensores. Estes sistemas são vantajosos pelos seus baixos
volumes, elevada portabilidade e capacidade de realizar múltiplos ensaios simultaneamente,
provando ser capaz de ser aplicado em lab-on-chip e point-of-care.
Uma destas aplicações são ensaios de amplificação de DNA, dos quais, Loop-mediated
Isothermal Amplification (LAMP), um instrumento de diagnóstico sensível e simples para deteção
rápida e identificação de biomarcadores moleculares medidos em tempo real. Contudo, métodos
sensoriais acoplados a dispositivos de MFD ainda não são capazes de medir o progresso desta
reação em tempo real.
Este trabalho estuda dois tipos de medições de LAMP em tempo real a serem acoplados num
sistema de MFD. O primeiro dispositivo usa um dispositivo em forma de H, onde o proto-
oncogene c-Myc humano e o gene housekeeping 18S humano são amplificados e medidos em
tempo real através de medidas de fluorescência. O segundo dispositivo usa elétrodos
interdigitais, onde o proto-oncogene c-Myc humano é amplificado e medido em tempo real
através de Espectroscopia de Impedância Eletroquímica (EIE).
Após desenvolvimento e caracterização das duas técnicas, dispositivos usados para medir
fluorescência apresentam um controlo positivo com um sinal de fluorescência 49% superior ao
controlo negativo. Dispositivos que medem EIE indicam diferenças significativas entre soluções
comerciais com pH 4, 7 e 10, por Voltometria Cíclica. Isto sugere que estes dispositivos podem
ser usados para real-time, label-free, LAMP devido a diferenças de pH ocorrerem ao longo destas
reações.
Keywords: Microfluídica Digital, Loop-Mediated Isothermal Amplification, c-Myc, 18S,
Fluorescência, Espectroscopia de Impedância Eletroquímica, lab-on-chip, point-of-care.

SENSING METHODS FOR REAL-TIME LOOP-MEDIATED ISOTHERMAL AMPLIFICATION IN DIGITAL MICROFLUIDIC SYSTEMS
vii
SENSING METHODS FOR REAL-TIME LOOP-MEDIATED ISOTHERMAL AMPLIFICATION IN DIGITAL MICROFLUIDIC SYSTEMS
viii
Content
List of figures ................................................................................................................... x
List of tables ................................................................................................................... xii
List of Abbreviations .................................................................................................... xiv
List of symbols ............................................................................................................. xvi
Motivation and Objectives ......................................................................................... xviii
1 Introduction .............................................................................................................. 1
1.1 Digital Microfluidics ..................................................................................................... 1
1.2 Loop Mediated Isothermal Amplification ................................................................. 1
1.3 DNA detection methods ............................................................................................. 3
1.3.1 Fluorescence ....................................................................................................... 3
1.3.2 Electrochemical impedance spectroscopy ........................................................... 4
2 Materials and Methods ................................................................................................. 6
2.1 DNA Extraction ................................................................................................................. 6
2.2 Primer choice for LAMP reaction with 18S gene ........................................................ 6
2.3 DNA Fluorescence optimization .................................................................................... 7
2.4 Device design and fabrication ........................................................................................ 7
2.5 Device characterization ................................................................................................... 8
3 Results and Discussion ............................................................................................. 10
3.1 DNA Extraction ............................................................................................................... 10
3.2 Primer choice for LAMP reaction with 18S gene ...................................................... 11
3.3 Fluorescence measurements on device .................................................................... 14
3.3.1 Device layout ........................................................................................................... 14
3.3.2 Human c-Myc gene fluorescence readout optimization.................................... 15
3.3.2.1 EvaGreen® optimization ................................................................................ 16
3.4 Impedance measurements on device ......................................................................... 20
3.4.1 Device layout ........................................................................................................... 20
3.4.2 Device characterization ......................................................................................... 21
3.4.3 End-Point impedance measurements ................................................................. 22
3.4.3.1 No dielectric device ......................................................................................... 23
3.4.3.2 Parylene C devices ......................................................................................... 24
3.4.3.3 300 nm Ta2O5 device ...................................................................................... 27
4 Conclusion and Future Perspectives....................................................................... 32
References ..................................................................................................................... 34
Annex 1 – PCR and LAMP characteristics comparison ................................................. 38
SENSING METHODS FOR REAL-TIME LOOP-MEDIATED ISOTHERMAL AMPLIFICATION IN DIGITAL MICROFLUIDIC SYSTEMS
ix
Annex 2 - Plasmid DNA extraction by alkaline lysis protocol ........................................ 39
Annex 3 - Human c-Myc and Human 18S target genes and respective primers ....... 41
Annex 4 – LAMP reagents and respective concentrations ............................................ 43
Annex 5 – Annealing temperature optimization for PCR reaction with template 3 (50
°C to 60 °C) ........................................................................................................................... 44
Annex 6 – 75% reduction of primers F3, B3, BIP and FIP ............................................. 45
Annex 7 - CTDF determination for EvaGreen® optimization reactions ....................... 47
Annex 8 – Impedance and phase scanning with frequency for parylene C and Ta2O5
dielectric devices .................................................................................................................. 48
Annex 9 – Real-time LAMP measurement by EIS methods in 100 nm parylene C
dielectric device .................................................................................................................... 51

SENSING METHODS FOR REAL-TIME LOOP-MEDIATED ISOTHERMAL AMPLIFICATION IN DIGITAL MICROFLUIDIC SYSTEMS
x
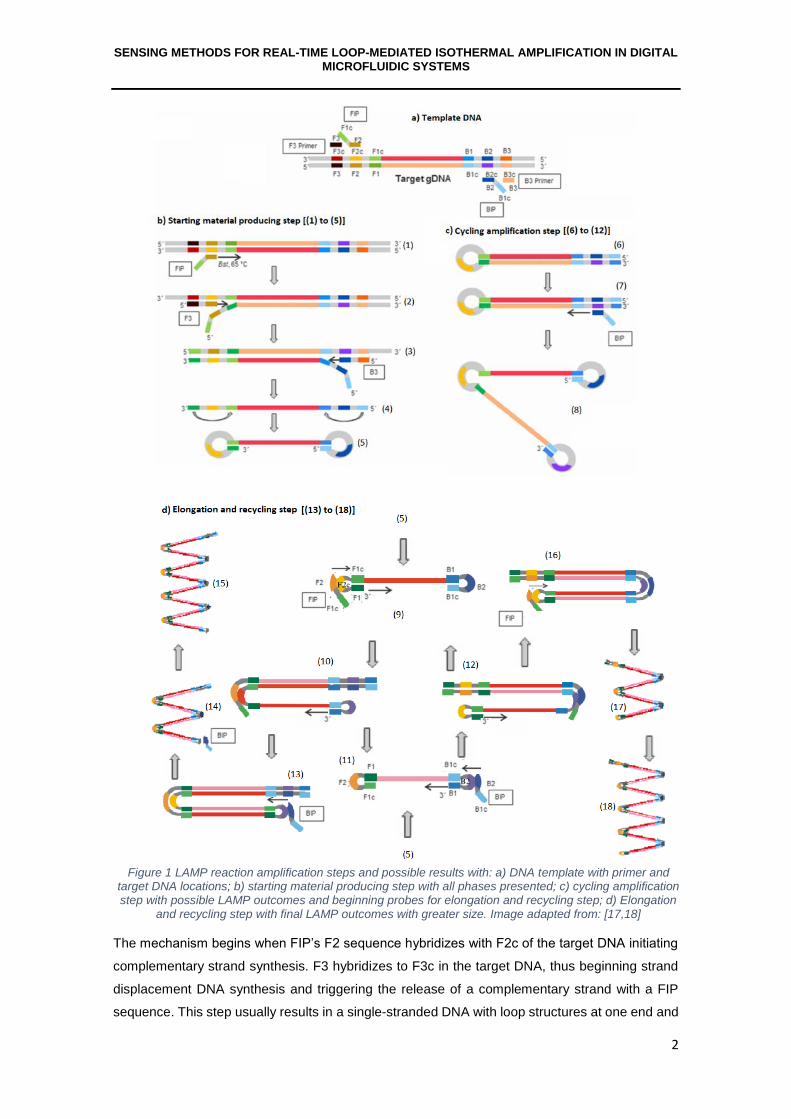
List of figures Figure 1 LAMP reaction amplification steps and possible results with: a) DNA template with primer and target DNA locations; b) starting material producing step with all phases presented; c) cycling amplification step with possible LAMP outcomes and beginning probes for elongation and recycling step; d) Elongation and recycling step with final LAMP outcomes with greater size. Image adapted from: [17,18] ......................................................................................................... 2
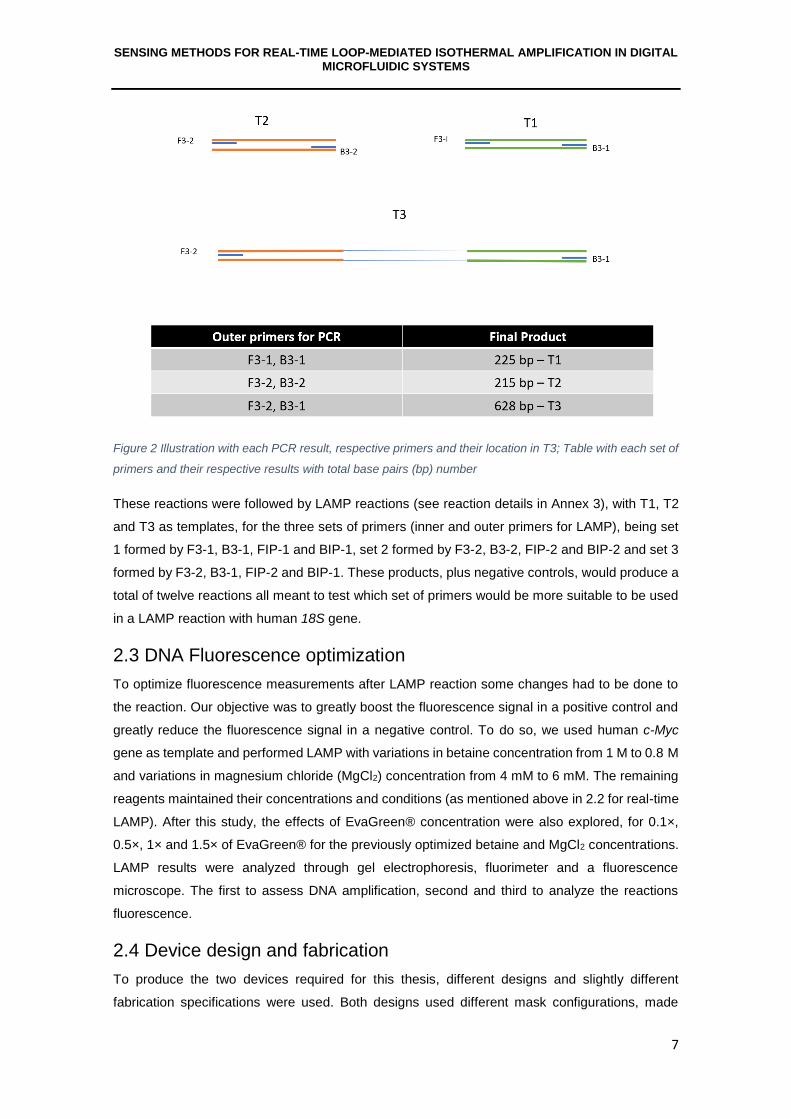
Figure 2 Illustration with each PCR result, respective primers and their location in T3; Table with each set of primers and their respective results with total base pairs (bp) number ...................... 7
Figure 3 Gel electrophoresis result for a PCR reaction with 10-fold dilutions of Human c-Myc and 18S genes. .................................................................................................................................. 10
Figure 4a) represents gel electrophoresis analysis for a triple PCR reaction with S1 primers; 4b) triple PCR reaction with S2 primers and single reaction with S3 primers. .................................. 11
Figure 5 Gel electrophoresis result for PCR reaction with S3 primers, changing annealing temperature from 61 °C to 65 °C. ................................................................................................ 12
Figure 6 Gel electrophoresis result for LAMP reaction with T1, T2 and T3 being combined with S1, S2 and S3. ............................................................................................................................ 13
Figure 7 Fluorescence device electrode layout with detailed information about inlets, outlets and its regions. Region 1 for LAMP mix placement, regions 2 and 3 for DNA sample placement, regions 4 and 5 for real-time LAMP and regions 6 and 7 for final product retrieval. ................... 15
Figure 8 Gel Electrophoresis result for positive (“P”) and negative (“N”) controls with 0.1×, 0.5×, 1×, 1.5× EvaGreen® concentration. ............................................................................................ 17
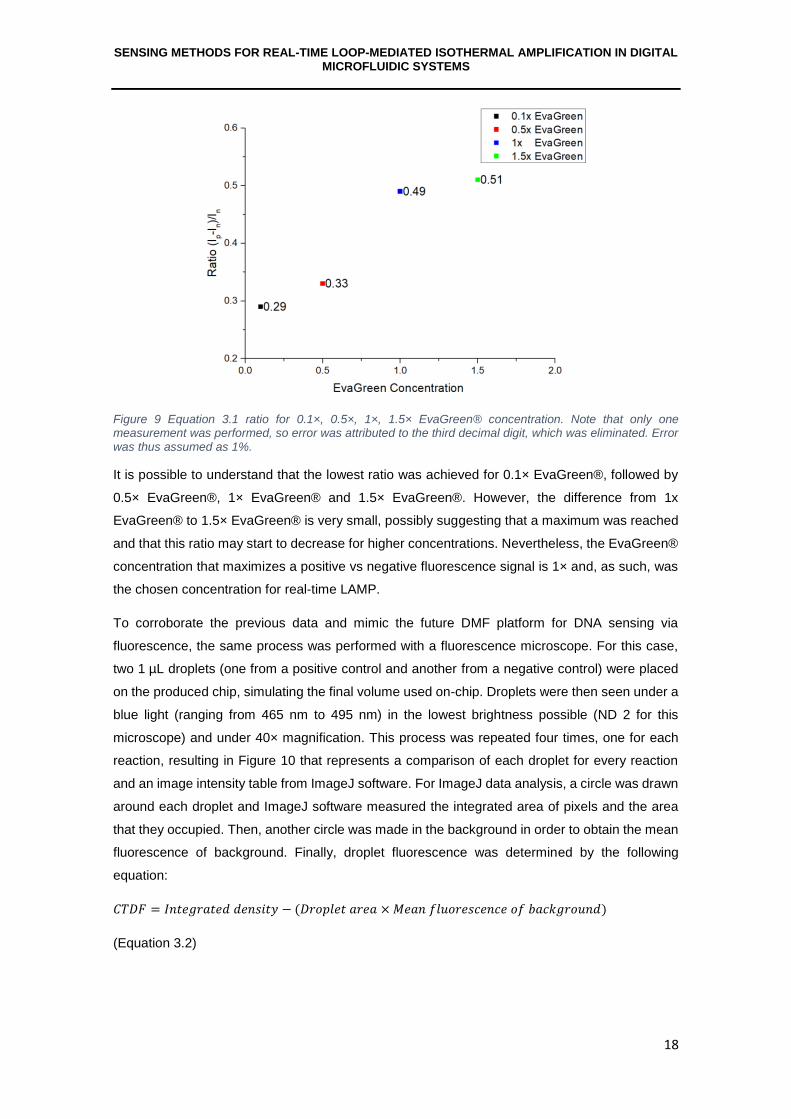
Figure 9 Equation 3.1 ratio for 0.1×, 0.5×, 1×, 1.5× EvaGreen® concentration. Note that only one measurement was performed, so error was attributed to the third decimal digit, which was eliminated. Error was thus assumed as 1%. ............................................................................... 18
Figure 10a) Fluorescence microscope results with an edited outline for each droplet to help visualization; b) EvaGreen® concentration relation with ratio 3.1 calculated for Annex 7 data. . 19
Figure 11 Impedance device electrode layout with numbered sections. Region 1 depicts the electrode area and regions 2 depict pads…………………………………………………………….20
Figure 12 Side view with each fabrication steps of the device: a) glass is used as substrate; b) photolithography and chromium deposition; c) PDMS sealing onto chromium electrodes; d) chemical vapor deposition of parylene; e) sealing of PDMS lid; f) complete chip in work with a droplet of a LAMP mix; g) top view of a complete chip. Note: Ta2O5 would be deposited in a similar way to parylene C. ....................................................................................................................... 21
Figure 13 Impedance and phase example plot with frequency scan for a device with 100 nm parylene C as dielectric. .............................................................................................................. 22
Figure 14 No dielectric device performing impedance measurements for LAMP end-points at 50 kHz in a random order. Note: Inset of negative control from experience 1. ................................ 23
Figure 15 No dielectric device performing phase measurements for LAMP end-points at 50 kHz in a random order. ....................................................................................................................... 24
Figure 16 Parylene C impedance variation for 90 minutes, with water placed on top of the electrodes for 100 nm and 400 nm layer. Note: Vertical axis presents a break from 6.5 kΩ to 24 kΩ. ............................................................................................................................................... 25
Figure 17 Parylene C phase variation for 90 minutes, with water placed on top of the electrodes for 100 nm and 400 nm layer. ..................................................................................................... 25
Figure 18 Column plot for 100 nm parylene C dielectric device performing impedance measurements with LAMP end-points at 50 kHz in a random order. .......................................... 26
Figure 19 Column plot for 400 nm parylene C dielectric device performing impedance measurements with LAMP end-points at 50 kHz in a random order. .......................................... 27

SENSING METHODS FOR REAL-TIME LOOP-MEDIATED ISOTHERMAL AMPLIFICATION IN DIGITAL MICROFLUIDIC SYSTEMS
xi
Figure 20 LAMP reaction products when polymerase is taking place (left); Ta2O5 layer interaction with ions from LAMP (right). Adapted from: [40] ......................................................................... 28
Figure 21 Impedance and phase variation for 90 min, for a 300 nm Ta2O5 layer device with water on top of the dielectric. ................................................................................................................ 28
Figure 22 Column plot for LAMP end-points impedance measurements performed with a 300 nm Ta2O5 dielectric device, at 50 kHz and in a random order .......................................................... 29
Figure 23 CV curves for pH measurements with a Ta2O5 dielectric device, ranging from -1 V to 1 V. ................................................................................................................................................. 30
Figure 24 CV for Ta2O5 dielectric device from -1 V to 1 V with commercial solutions for pH 4 and 7 (left); and for pH 4 (right) .......................................................................................................... 30
Figure A5.1 Gel electrophoresis analysis for PCR reaction for template 3, where annealing temperature is varied between 50 °C and 60 °C……………………………………………………...44
Figure A6.1 Gel electrophoresis result for “standard” and altered LAMP protocols………………………………………………………………………………………………….45
Figure A6.2 Equation 3.1 ratio vs wavelength at 530 nm plot for altered and standard LAMP protocols………………………………………………………………………………………………….46
Figure A8.1 Impedance and phase example plot with frequency scan for a device with no dielectric………………………………………………………………………………………………….48
Figure A8.2 Impedance and phase example plot with frequency scan for a device with 400 nm
parylene c dielectric……………………………………………………………………………………..49
Figure A8.3 Impedance and phase example plot with frequency scan for a device with no dielectric………………………………………………………………………………………………….50
Figure A9.1 LAMP real-time impedance measured at 50 kHz variation with time for 100 nm parylene C device (left) and phase measured at 50 kHz variation for the same device (right)……………………………………………………………………………………………………..51
Figure A9.2 Gel electrophoresis analysis for LAMP positive (“P”) and negative (“N”) controls in a thermocycler and positive control on device…………………………………………………………..52
Figure A9.3 Study to avoid bubble formation with Bst buffer at 65 °C. Rectangular shaped PDMS, with 8 mm × 4 mm dimensions for the inner rectangular, cut with laser, for 80% power and 75% velocity, cleaned with 15 min IPA bath, 15 min acetone and scrubbed with a brush and clean room paper……………………………………………………………………………………………….53
Figure A9.4 Study to avoid bubble formation with degassed Bst buffer for 10 min at 65 °C. Rectangular shaped PDMS with 1 mm thickness and squared PDMS thickness with 2 mm thickness. Cut with a scalp, cleaned with 15 min IPA bath and scrubbed with a brush and clean room paper……………………………………………………………………………………………….53
SENSING METHODS FOR REAL-TIME LOOP-MEDIATED ISOTHERMAL AMPLIFICATION IN DIGITAL MICROFLUIDIC SYSTEMS
xii
List of tables
Table 1 Design specifications for a fluorescence measuring device…………………………………………………………………………………...........................16
Table 2 Design specifications for an impedance measuring device…………………………………………………………………………………………………….21
Table A 1.1 Comparison table of PCR and LAMP amplification characteristics….………………38
Table A 3.1 c-Myc and respective primer sequences……………………………………….………41
Table A 3.2 18S target fragments and respective primer sequences………………………………42
Table A 4.1 LAMP reagents and respective final concentrations in LAMP reaction…………….43
Table A 7.1 ImageJ software analysis for positive and negative controls of 0.1×, 0.5×, 1× and 1.5× concentration of EvaGreen®……………………………………………………………………..47

SENSING METHODS FOR REAL-TIME LOOP-MEDIATED ISOTHERMAL AMPLIFICATION IN DIGITAL MICROFLUIDIC SYSTEMS
xiii
SENSING METHODS FOR REAL-TIME LOOP-MEDIATED ISOTHERMAL AMPLIFICATION IN DIGITAL MICROFLUIDIC SYSTEMS
xiv
List of Abbreviations
AC - Alternating current
BIP - Backward inner primer
Bp - Base pair
cDNA - complementary DNA
CV - Cyclic voltammetry
CEMOP - Centro de Excelência de Optoeletrónica e Microeletrónica de Processos
CENIMAT - Centro de Investigação de Materiais
CVD - Chemical vapor deposition
DCV - Departamento de Ciências da Vida
DMF - Digital Microfluidics
DNA - Deoxyribonucleic acid
dsDNA - double-stranded DNA
E. coli - Escherichia coli
EIS - Eletrochemical Impedance Spectroscopy
FIP - Forward inner primer
ITO - Indium-Tin-Oxide
LAMP - Loop-mediated isothermal amplification
LB medium - Luria-Bertani medium
PCB - Printed circuit boards
PCR - Polymerase Chain Reaction
PDMS - Polydimethylsiloxane
PoC - Point-of-care
RMS - Root mean square
SAW - Surface acoustic waves
UV - Ultraviolet

SENSING METHODS FOR REAL-TIME LOOP-MEDIATED ISOTHERMAL AMPLIFICATION IN DIGITAL MICROFLUIDIC SYSTEMS
xv
SENSING METHODS FOR REAL-TIME LOOP-MEDIATED ISOTHERMAL AMPLIFICATION IN DIGITAL MICROFLUIDIC SYSTEMS
xvi
List of symbols
C* - Complex capacitance
C’ - Real part of capacitance
C’’ – Imaginary part of capacitance
Z - Impedance
Z* - Complex impedance
Z’ - Real part of impedance
Z’’ - Imaginary part of impedance
Ω – Angular frequency
εr – relative permittivity

SENSING METHODS FOR REAL-TIME LOOP-MEDIATED ISOTHERMAL AMPLIFICATION IN DIGITAL MICROFLUIDIC SYSTEMS
xvii
SENSING METHODS FOR REAL-TIME LOOP-MEDIATED ISOTHERMAL AMPLIFICATION IN DIGITAL MICROFLUIDIC SYSTEMS
xviii
Motivation and Objectives
Digital Microfluidics (DMF) is a highly flexible and resourceful technology capable of fluid
manipulation through an array of electrodes, which in turn use electric fields to move picoliter to
microliter droplets.1,2,3 These systems can be used for a wide variety of disciplines like Medicine,
Biology, Chemistry, Engineering, etc. and are still growing in many other fields. The most
noteworthy applications consist of portable assays for deoxyribonucleic acid (DNA) and
Proteomics.1 Due to its individual control of droplets, smaller sample volumes (and hence higher
portability), multiplexing and simple integration with other systems, DMF proves having all the
requirements for lab-on-chip or point-of-care applications.3
PCR is the golden standard for nucleic acid amplification and DNA analysis, being only
disadvantageous for its three-step thermal cycling process with three different temperatures for
denaturation, annealing and elongation.4 However, isothermal amplification methods have been
developed to reduce amplification complexity and facilitate implementation in point-of-care
systems. One of these techniques is loop-mediated isothermal amplification (LAMP) 5, whose
implementation in DMF platforms has been attempted6,7.
The main objective of this thesis is to create a sensing device capable of nucleic acid amplification
and real-time measurement of a LAMP reaction, to be implemented in a digital microfluidics
platform previously created. To do so, two separate devices were developed: one for
fluorescence-based real-time LAMP and another for impedance-based real-time LAMP.
The first device, designed for primary studies, consists of a bottom plate withdrawn from a two-
plate DMF configuration, where chromium electrodes/pads are deposited on a glass substrate,
followed by a parylene C dielectric layer and a Teflon® hydrophobic layer. The chromium
electrodes form an H-shaped pattern, which will enable a multiplex LAMP reaction for two distinct
genes. DNA amplification would be measured through a fluorescence microscope when present
on top of the plate. The final DMF device would also present a top plate with an Indium-Tin-Oxide
(ITO) layer and another Teflon® layer with openings overlapping inlet/outlet pad locations, for
sample insertion/removal with micro-pipette. Fiber optics would be placed on each side of the
device, pointing towards to the mixing pad, one of which would radiate the excitation wavelength
of EvaGreen® fluorophore and the other would filter EvaGreen®’s emitted wavelength.
Measurements would be performed throughout the LAMP reaction and would be accomplished
by a phototransistor coupled with this DMF device.
For the second device, a single plate configuration on a glass substrate was produced, where this
plate presents chromium electrodes/pads, parylene C dielectric layer and a PDMS frame, from
bottom to top. Real-time, impedance-based LAMP measurements have never been attempted (to
the best of my knowledge), thus an intermediate device was firstly developed, as to facilitate
LAMP reaction study via impedance measurements, prior to DMF integration. It is important to
mention that this device was not produced to be readily implemented in a DMF platform, in order
SENSING METHODS FOR REAL-TIME LOOP-MEDIATED ISOTHERMAL AMPLIFICATION IN DIGITAL MICROFLUIDIC SYSTEMS
xix
to facilitate testing and modifications if needed, since this kind of measurements were never
attempted for real-time LAMP. Thus, interdigitated electrodes were produced with a central area
where impedance measurements were performed and two pads in each side of the device where
an impedance analyzer was connected.
For both devices, all electrodes and pads were patterned by conventional lithography and
chromium was deposited by a home-made electron beam (e-beam) system; parylene C dielectric
was deposited by Chemical Vapor Deposition (CVD) and, for fluorescence devices, Teflon®
hydrophobic layer was deposited by spin-coating. The first device used DNA samples from both
human c-Myc and 18S genes and the second device only used human c-Myc gene. c-Myc is a
known proto-oncogene, associated to some human cancers when overexpressed by cells and
18S is a housekeeping gene, necessary for basic cellular function maintenance. 18S expression
functions as reference concentration to allow expression quantification.
SENSING METHODS FOR REAL-TIME LOOP-MEDIATED ISOTHERMAL AMPLIFICATION IN DIGITAL MICROFLUIDIC SYSTEMS
1
1 Introduction
1.1 Digital Microfluidics
Digital Microfluidics (DMF) is a recent technology for fluid handling in a microdroplet form, based
on microfluidics.8 DMF devices allow for independent and individual control of droplets
manipulated through an array of electrodes, instead of a system in which a continuous fluid flow
is manipulated inside enclosed microchannels.2,9 Both microfluidics and DMF systems have the
benefits of using low reagent and sample volumes, faster reactions, increased sensitivity and
simple combination with analytical techniques. Adding to this, the small scale of these systems
allows increased portability and process automation which ease the process’ industrialization.1,10
There has been growing interest in droplet-based microfluidic systems as an alternative to the
channel-based microfluidics, mainly due to their capability to control single droplets
independently.1,2 Several approaches have been developed for droplet control in DMF, such as
electrowetting11, dieletrophoresis12, thermocapillary13, surface acoustic waves (SAW)14 and
magnetic methods15, which eliminate the need for channels, pumps, valves and mechanical
mixers. These systems allow multiple procedures such as mixing, merging and splitting, which
can be done simultaneously with a simple and miniaturized design through digital control
commands.16 DMF platforms are generic and can operate in any order, resulting in different
experiments being done in the same platform (multiplexing). Furthermore, solid samples can be
used without the risk of clogging.3
1.2 Loop Mediated Isothermal Amplification
Loop-mediated isothermal amplification (LAMP) is a nucleic acid amplification method performed
in isothermal conditions and characterized by its high efficiency, specificity and speed. This
method allows an accumulation of up to 109 copies of target DNA in 1 hour, at a temperature
between 60 °C and 65 °C. Annex 1 shows a comparative table of LAMP characteristics when
compared to today’s gold standard for nucleic acid amplification, PCR. LAMP requires a DNA
polymerase with high strand displacement, two inner primers and two outer primers. Both inner
and outer primers are used in the beginning of a LAMP reaction, however later during that reaction
only the inner primers are used for DNA amplification. The inner primers (forward inner primer
(FIP) and backward inner primer (BIP)) are two distinct sequences that correspond to the sense
and antisense sequences of portions of the target DNA. One of these sequences, of both FIP and
BIP, is used to start the priming process at the beginning of the reaction. Meanwhile, the other
sequence self-primes the reaction at later stages. For simpler explanation, both ends of the target
DNA are divided in three regions. From the outer region to the inner region: F3c, F2c and F1c for
the forward section and B3, B2 and B1 for the backward section. Given this structure, FIP is
designed with F1c sequence and with F2 sequence complementary to F2c, of the target DNA.
BIP is designed with B1c sequence complementary to B1, of the target DNA, and B2 sequence.
Finally, the two outer primer are B3 and F3, complementary to F3c of the target DNA (Figure 1a).
SENSING METHODS FOR REAL-TIME LOOP-MEDIATED ISOTHERMAL AMPLIFICATION IN DIGITAL MICROFLUIDIC SYSTEMS
2
The mechanism begins when FIP’s F2 sequence hybridizes with F2c of the target DNA initiating
complementary strand synthesis. F3 hybridizes to F3c in the target DNA, thus beginning strand
displacement DNA synthesis and triggering the release of a complementary strand with a FIP
sequence. This step usually results in a single-stranded DNA with loop structures at one end and
Figure 1 LAMP reaction amplification steps and possible results with: a) DNA template with primer and target DNA locations; b) starting material producing step with all phases presented; c) cycling amplification step with possible LAMP outcomes and beginning probes for elongation and recycling step; d) Elongation
and recycling step with final LAMP outcomes with greater size. Image adapted from: [17,18]
SENSING METHODS FOR REAL-TIME LOOP-MEDIATED ISOTHERMAL AMPLIFICATION IN DIGITAL MICROFLUIDIC SYSTEMS
3
is used as template for inner primer BIP which hybridizes with B1 initiating DNA synthesis.
Subsequently B3 hybridizes with B3c, causing strand displacement DNA synthesis and triggering
the release of a complementary strand with FIP and BIP sequences, thus producing a dumb-bell
shaped DNA. This product self-primes itself being stopped only by lack of LAMP conditions
(temperature, reagents concentration, pH) and produces a stem-loop DNA that serves as
template for the next LAMP step. Process illustrated in Figure 1b). This ends the starting material
step and starts cycling amplification step of LAMP.
For this processes’ second step, the loop in the stem-loop DNA is hybridized by FIP which starts
strand displacement DNA synthesis producing a secondary stem-loop DNA with an inverted copy
of target sequence and a loop structure at the opposite end. Strand displacement DNA is caused
by self-priming, producing a stem-loop DNA with a copy of the target DNA plus the same structure
elongated to twice as long (double target DNA) and a loop at the opposite end (Figure 1c)). The
output of this step is used as template for BIP strand displacement, forming structures with the
same size as the template or with further elongation. The end point of LAMP has multiple stem-
loops from structures with several stem lengths to cauliflower assemblies with numerous loops
formed by annealing sense and antisense repeats of the target sequence alternately in the same
strand.6 This elongation and recycling step is shown in Figure 1d).
LAMP is an exceptional amplification technique for application in sensitive and simple detection
tools for fast identification of molecular biomarkers. More importantly, LAMP has the necessary
features for real-time assays through turbidity, fluorescence or colorimetry.6,19,20 Considering this,
the main objective of this thesis is to create a device where real-time LAMP is measured in a
simple DMF system. These measurements will be accomplished by a phototransistor accoupled,
for fluorescence assays, with the DMF device or by an impedance analyzer, for impedance
measurements, that verifies differences between samples with and without DNA.
1.3 DNA detection methods
To efficiently determine a target gene amplification through any amplification technique, such as
PCR or LAMP, it is essential to add an external method to monitor the reaction. Such methods
are based on fluorescence, turbidity, gel electrophoresis, electrochemistry, enzyme-linked
immunosorbent assay or lateral flow dipsick.21 However, only optical methods (e.g. fluorescence
and turbidity) and electrochemical methods allow real-time monitorization.22,23
1.3.1 Fluorescence
Fluorescence starts by illuminating a sample with a specific wavelength (excitation wavelength
characteristic of the fluorophore). Light is absorbed by the sample exciting the fluorophore, or its
electrons, causing a transition to a higher energy level. However, the excited electrons do not
come back to the original energy state. Instead they fall to an intermediate level, only to fall once
again to its original energy state. During its second fall, fluorescent light is emitted, being the
emitted light higher in wavelength than the excitation wavelength.24,25
SENSING METHODS FOR REAL-TIME LOOP-MEDIATED ISOTHERMAL AMPLIFICATION IN DIGITAL MICROFLUIDIC SYSTEMS
4
The difference between fluorescence and absorbance measurements for concentration
determination is that the fluorophore is not measured directly, being for the first case detected
only when intercalated to a double-stranded DNA (dsDNA). Most fluorophores share a similar
structure with an aromatic core that binds to the dsDNA forming hydrogen bonds to its trenches.
These fluorescent agents intercalate to DNA in a sequence-independent way and once bound
they light-up due to the elimination of quenching effects with water, being instead connected to
the dsDNA hydrophobic trenches.26 Examples of fluorophores include ethidium bromide, SYBR
Green and EvaGreen®. EvaGreen® is the chosen agent for this thesis due to its high brightness,
low toxicity, low LAMP inhibition and high thermal stability making it very appealing for research
and clinical purposes with dsDNA.27
1.3.2 Electrochemical impedance spectroscopy
Electrochemical impedance spectroscopy (EIS) is a label-free method capable of monitoring
phenomena that occur in the electrode-electrolyte interface. Therefore, it can be a resourceful
way to analyze molecule concentrations.28 EIS can be divided in two types of measurements:
Faradaic and non-Faradaic. Faradaic methods use charge transfer reactions, sensed by redox
sensitive materials that facilitate current flow throughout electrodes. Potential across this
electrode depends on the concentration ratio between oxidized and reduced forms of the redox
couple, changing when this ratio shifts.29 Experiments with Faradaic measurements involve the
recording of variations in current produced by the redox couple when detected by electrodes.30
Non-Faradaic methods measure the capacitance on the double layer, without any charge transfer
reactions. In this case, current can be neglected, thus the capacitive component is the main
contribution to impedance. If we assume a nonspecific EIS experiment with the following
impedance:
𝑍∗ = 𝑍′ + 𝑗𝑍′′ (Equation 1.1)
Being Z* the complex impedance, Z’ the real component of impedance and Z’’ the imaginary
component of impedance. If we too assume that a complex capacitance is given by the following
equation:
𝐶∗ =1
𝑗𝜔𝑍 (Equation 1.2)
Being C* the complex capacitance, 𝜔 the angular frequency and Z the impedance, then using
equations 1.1 and 1.2 it is possible to calculate the capacitance of the device:
𝐶∗ = −𝑍′
𝜔|𝑍|2 − 𝑗𝑍′′
𝜔|𝑍|2 = 𝐶′ + 𝑗𝐶′′ (Equation 1.3)
From measuring Z’ and Z’’ values it is then possible to calculate C’ and C’’, producing the complex
capacitance C* plot. Most sensors based in this method use interdigitated electrodes which
measure changes in the relative permittivity (εr), given by a biological sample.29,30

SENSING METHODS FOR REAL-TIME LOOP-MEDIATED ISOTHERMAL AMPLIFICATION IN DIGITAL MICROFLUIDIC SYSTEMS
5
EIS impedance measurements of DNA aqueous solutions with varying DNA concentration and
size have already been reported.28 However, these measurements were achieved with end-point
results and never done in real-time or with an unpurified DNA solution. We propose a simple and
innovative DMF system that not only performs LAMP, but also measures it in real-time through a
label-free detection method, EIS.

SENSING METHODS FOR REAL-TIME LOOP-MEDIATED ISOTHERMAL AMPLIFICATION IN DIGITAL MICROFLUIDIC SYSTEMS
6
2 Materials and Methods
2.1 DNA Extraction
Before performing a nucleic acid amplification, it is necessary to extract DNA with a target
sequence to use as template. Human c-Myc gene was extracted as described elsewhere31.
However, for the 18S gene, Escherichia Coli (E. coli) harboring a cloned fragment of human 18S
gene were grown in 100 mL of Luria-Bertani (LB) medium and 200 µL of ampicillin (Sigma-Aldrich)
being incubated at 37 °C, for 14 hours, under constant agitation. 18S gene fragment contained in
the plasmid was extracted via alkaline lysis (details in Annex 2). After extraction, a PCR reaction
was performed to ensure that the extracted product was indeed c-Myc and 18S gene. PCR was
executed for 20 µL total volume, with 0.4 mM dNTP (Fermentas), 1 µM (StabVida), 1×
DreamTaqTM buffer (ThermoFisher Scientific), 0.04 U/µL Taq Polymerase (ThermoFisher
Scientific) and 9.3 ng/µL of extracted DNA. The PCR steps used for this reaction were firstly 5
minutes denaturation at 95 °C, followed by 30 cycles with: 1) 30 seconds denaturation at 95 °C,
2) 30 seconds annealing at 50 °C and 3) 30 seconds elongation at 72 °C. Finally, a last step for
5 minutes of elongation time at 72 °C.
2.2 Primer choice for LAMP reaction with 18S gene
To study real-time LAMP in a digital microfluidics system with the human c-Myc and 18S genes,
it is important to optimize the amplification conditions. Both genes were comprehensibly studied
in the literature31,32. However, in order to study new custom-built primers for the 18S gene, three
PCR reactions were made with three sets of primers (see Annex 4 for primer details). Set 1 (S1)
with F3-1 and B3-1, set 2 (S2) with F3-2 and B3-2 and set 3 (S3) with F3-2 and B3-1 produce
what I called template 1 (T1), template 2 (T2) and template 3 (T3), respectively. These templates
are different from each other in size and/or in nucleotide sequence. Figure 2 represents an
illustration of the used primers and each result for the following PCR reactions.
SENSING METHODS FOR REAL-TIME LOOP-MEDIATED ISOTHERMAL AMPLIFICATION IN DIGITAL MICROFLUIDIC SYSTEMS
7
Figure 2 Illustration with each PCR result, respective primers and their location in T3; Table with each set of
primers and their respective results with total base pairs (bp) number
These reactions were followed by LAMP reactions (see reaction details in Annex 3), with T1, T2
and T3 as templates, for the three sets of primers (inner and outer primers for LAMP), being set
1 formed by F3-1, B3-1, FIP-1 and BIP-1, set 2 formed by F3-2, B3-2, FIP-2 and BIP-2 and set 3
formed by F3-2, B3-1, FIP-2 and BIP-1. These products, plus negative controls, would produce a
total of twelve reactions all meant to test which set of primers would be more suitable to be used
in a LAMP reaction with human 18S gene.
2.3 DNA Fluorescence optimization
To optimize fluorescence measurements after LAMP reaction some changes had to be done to
the reaction. Our objective was to greatly boost the fluorescence signal in a positive control and
greatly reduce the fluorescence signal in a negative control. To do so, we used human c-Myc
gene as template and performed LAMP with variations in betaine concentration from 1 M to 0.8 M
and variations in magnesium chloride (MgCl2) concentration from 4 mM to 6 mM. The remaining
reagents maintained their concentrations and conditions (as mentioned above in 2.2 for real-time
LAMP). After this study, the effects of EvaGreen® concentration were also explored, for 0.1×,
0.5×, 1× and 1.5× of EvaGreen® for the previously optimized betaine and MgCl2 concentrations.
LAMP results were analyzed through gel electrophoresis, fluorimeter and a fluorescence
microscope. The first to assess DNA amplification, second and third to analyze the reactions
fluorescence.
2.4 Device design and fabrication
To produce the two devices required for this thesis, different designs and slightly different
fabrication specifications were used. Both designs used different mask configurations, made
SENSING METHODS FOR REAL-TIME LOOP-MEDIATED ISOTHERMAL AMPLIFICATION IN DIGITAL MICROFLUIDIC SYSTEMS
8
using CoralDRAW X7® software and printed on emulsion film photomasks (JD Photodata, UK).
These masks had patterned electrodes, connection lines and pads, which were printed into a
glass substrate by photolithography. To prepare a substrate for a photolithography process, glass
was thoroughly cleaned by immersion in acetone, isopropyl alcohol and pure water recipients.
Glass immersed in an acetone recipient would be placed in an ultrasound bath for 15 min, then
immersed in the following recipients and dried with a nitrogen jet. Photolithography started with
cleaned glass substrates being covered with ECI 3032 1.2 µm grade photoresist (MicroChemicals
GmbH) by spin-coating (Model WS-650MZ-23NPP-Laurell) at 2000 rpm for 10 s, plus 4000 rpm
for 20 s. Prebake process placed the substrates on a hot plate (Isotemp – Fisher Scientific) at
115 °C, for 75 seconds, followed by crude alignment (only one step of photolithography required)
in a mask aligner (Karl Suss) and exposed to UV light for 5 s. Photoresist revelation used AZ®726
MIF developer (MicroChemicals GmbH) for 35 s, followed by immersion in distilled water to stop
revelation and dried with a nitrogen jet. Next came metal deposition, which was performed with a
home-made electron-beam (e-beam) evaporation system depositing a 200 nm of chromium layer
on the substrates, at a temperature of 100 °C. Subsequent lift-off used three acetone recipients
where substrates were immersed, being cautiously agitated to facilitate photoresist removal. This
process was supervised visually with a magnifier (Leica M80) and if necessary, a fine brush would
be used to help remove photoresist. From here on, fabrication specifications vary for both devices.
For the device meant for fluorescence measurements, a 100 µm layer of Parylene C (CAS 28804-
46-8) was deposited, by means of a chemical vapor deposition system (SCS Labcoater® - PDS
2010) followed by a 50 nm hydrophobic layer of Teflon® AF 1600 (DuPont). This last layer was
deposited using a solution of 0.6% wt/wt of Teflon® AF 1600 in Fluorinert FC-40 (DuPont) by
spin-coating at 1000 rpm for 30 s, with an acceleration of 100 rpm/s2, and post-bake at 160 °C for
10 minutes. However, for the device meant for impedance measurements, no Teflon layer was
deposited since this method was not yet meant to be tested in a DMF system. For this device, a
parylene C layer was deposited with the fabrication process mentioned above, but with 100 nm
and 400 nm thickness. Lastly, another device was produced with 300 nm of tantalum pentoxide
(Ta2O2) dielectric layer deposited by an ATC 1300-F sputtering device (AJA International), using
100 W power, at 2.3 mTorr and at room temperature. Finally, to hold a LAMP solution on top of
the electrodes, a PDMS structure was produced by mixing elastomer with curing agent in a 10:1
weight ratio (Sylgard 184 kit, Dow Corning). Air bubbles, which resulted from mix blending, were
eliminated through a desiccator for 1 hour and baked at 65 °C for 30 min. Oxygen plasma was
used to activate the PDMS surface and fuse it with the produced substrate. To end the fabrication
process, the merged PDMS and substrate would be placed in a hot plate for 20 min at 65 °C.
2.5 Device characterization
To better understand parylene C behavior in both fluorescence and impedance devices, some
characterization processes were used. The fluorescence device was studied as described
elsewhere33. Furthermore, dielectric constant (dielectric behavior) for impedance devices were
studied using an impedance analyzer (4294A Precision Impedance Analyzer – Agilent) with VRMS

SENSING METHODS FOR REAL-TIME LOOP-MEDIATED ISOTHERMAL AMPLIFICATION IN DIGITAL MICROFLUIDIC SYSTEMS
9
of 500 mV. Both parylene C and Ta2O5 devices were submitted to stability tests where water was
placed on top of the electrodes and measurements for impedance and phase were done with a 2
minute interval for 90 minutes. Finally, Ta2O5 devices were tested by cyclic voltammetry (CV) with
a scanning from -1 V to 1 V, for commercial solutions with pH 4, 7 and 10 (Si Analytics Technical
Buffer)
SENSING METHODS FOR REAL-TIME LOOP-MEDIATED ISOTHERMAL AMPLIFICATION IN DIGITAL MICROFLUIDIC SYSTEMS
10
3 Results and Discussion
3.1 DNA Extraction
A PCR reaction specific for each target was performed to evaluate whether the extracted DNA
was indeed originating from the c-Myc and 18S fragments. These reactions used the respective
LAMP outer primers (F3 and B3), being performed for a final volume of 20 µL. For these sets of
primers, it was expected that human 18S would have a final product with 215 bp and c-Myc a final
product with 229 bp. Reagents were in the following concentrations: 0.4 mM dNTPs (each), 1 µM
F3/B3 outer primers, 0.04 U/µL Taq Polymerase and 1× DreamTaq™ buffer. For each test, four
controls were made: three positive controls with DNA as template and a negative control with
distilled water instead of DNA to verify possible contaminations during reagents handling leading
to amplification. DNA templates contained 10-fold dilutions ranging from 1347.5 ng/µL* to 13.5
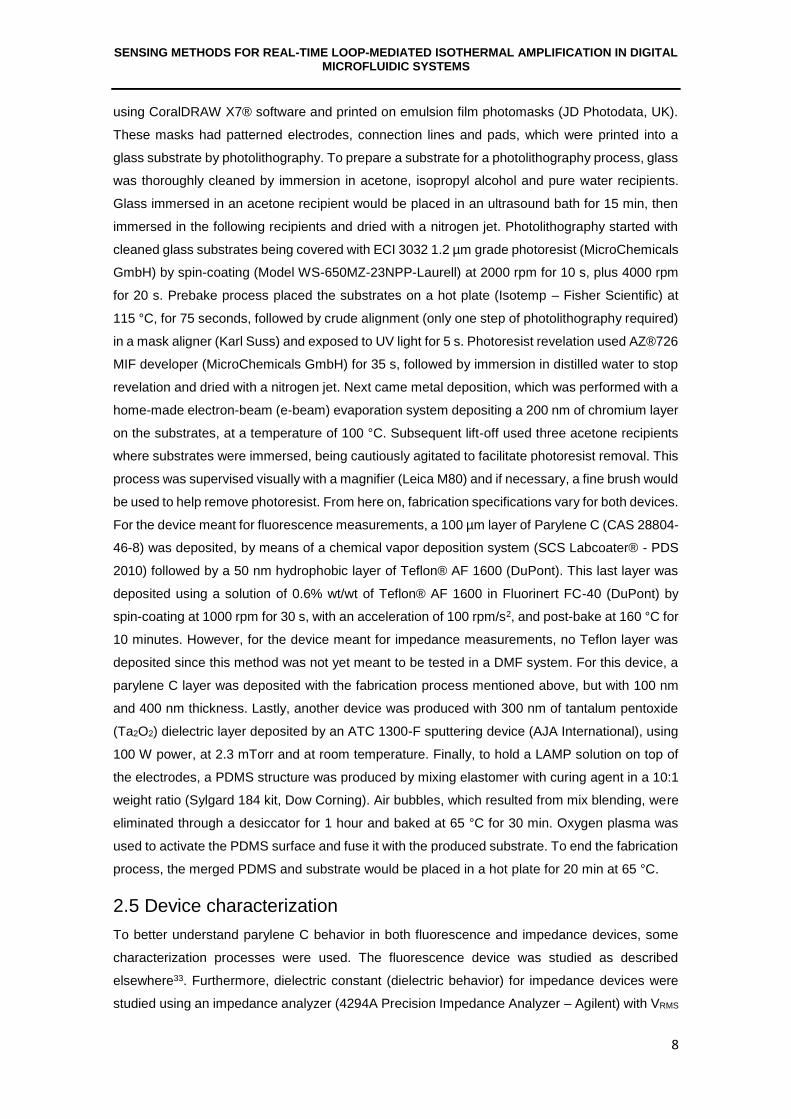
ng/µL for c-Myc gene fragment and from 934.2 ng/µL* to 9.3 ng/µL for 18S gene fragment. Figure
3 shows electrophoresis result for the performed PCR, for both c-Myc and 18S gene fragments,
resorting to 1% (m/v) agarose gel.
Figure 3 Gel electrophoresis result for a PCR reaction with 10-fold dilutions of Human c-Myc and 18S
genes.
Results show that human 18S amplification did not occur as predicted, since an amplicon with
215 bp was expected and these reactions resulted in a product with 1000 bp. This indicates that
18S gene was indeed extracted, since amplification occurred, but primers attached to the wrong
sequences. Also, primer dimers are present in higher concentrations for superior template
*signalled concentrations were measurered using NanoDrop™ spectrophotometer (ThermoFischer Scientific).
SENSING METHODS FOR REAL-TIME LOOP-MEDIATED ISOTHERMAL AMPLIFICATION IN DIGITAL MICROFLUIDIC SYSTEMS
11
concentrations, indicating that reaction reaches a plateau faster for higher DNA concentrations.
Human c-Myc amplification indicates a product above the 200 bp DNA ladder marker, being
expected an amplicon with 229 bp. This indicates success in the extraction of this gene and that
even for lower template concentrations, the reaction still plateaus in the same amount of time.
DNA extraction did not go as expected for the 18S gene, suggesting that primers for this gene
should be optimized, but c-Myc extraction was successful. Since both these genes were already
studied extensively, as shown in literature, primer choice tests for the 18S gene were the next
step towards LAMP optimization.
3.2 Primer choice for LAMP reaction with 18S gene
To produce a LAMP reaction with a higher efficiency, three sets of primers were studied. In order
to do this, the first step was to perform a PCR reaction, where 18S cDNA was amplified by S1,
S2 and S3 with the outer primers only (see section 2.2). PCR was performed for 5 minutes
denaturation at 95 °C, plus 30 cycles with: 1) 30 seconds denaturation at 95 °C, 2) 30 seconds
annealing at 50 °C and 3) 30 seconds elongation at 72 °C and step for 5 minutes of elongation
time at 72 °C. The following figure (Figure 3) represents two gel electrophoresis analysis for the
reaction mentioned above.
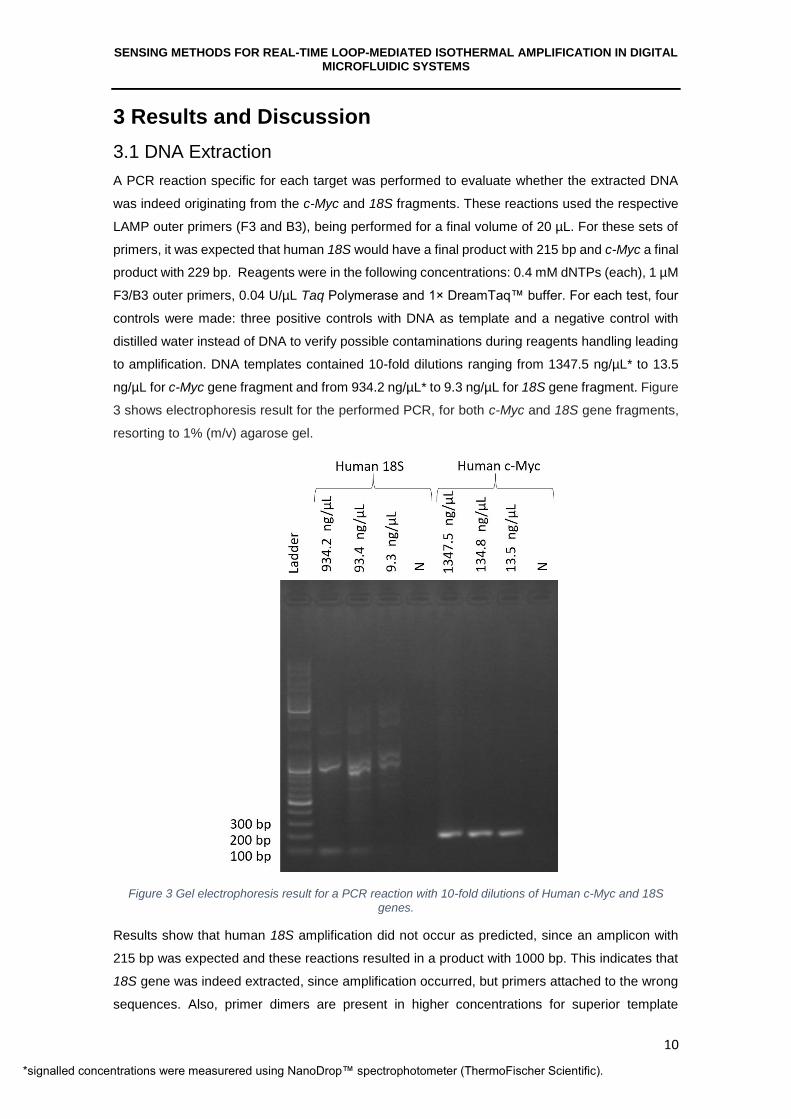
Figure 4a) represents gel electrophoresis analysis for a triple PCR reaction with S1 primers; 4b) triple PCR
reaction with S2 primers and single reaction with S3 primers.
Figure 4a) shows that amplification did not occur in the negative controls, and that all three
reactions were amplified. The expected result was a product with 225 bp, and it’s shown a single
band (as expected from a PCR reaction, since this amplification method amplifies a single sized
sequence) slightly above 200 bp ladder marker. However, all reactions show another band below
100 bp ladder marker, being this a result from primer dimers production (19 to 20 bp). This means
that primers are forming unspecific dsDNA with each other, diminishing PCR efficiency, since
SENSING METHODS FOR REAL-TIME LOOP-MEDIATED ISOTHERMAL AMPLIFICATION IN DIGITAL MICROFLUIDIC SYSTEMS
12
instead of being used to amplify target DNA, they are bonding to each other, plateauing the
reaction sooner than expected. Figure 4b) shows four amplification results, where the first three
are PCR reactions for S2 primers and present no contaminations whatsoever. It was expected a
resulting sequence with 215 bp and it is presented a band slightly above 200 bp ladder marker.
No primer dimers were encountered for these reactions. Finally, the fourth reaction shows no
contamination but a different result from what it was expected. It was expected a 628 bp product,
however figure 4b) shows a continuous flow of DNA sequences with different sizes. This may be
a result of primer annealing in sequences almost equal to its target, but not perfect matches,
resulting in amplicons with as many sizes as total number of unperfect matched primers/DNA
annealing sequences. Nevertheless, the first reaction from Figure 4a) and the second reaction
from figure 4b) seem less bright when compared to other reactions, indicating lower DNA
concentration. All reactions were done simultaneously and with the same protocols, possibly
indicating operator error while pipetting.
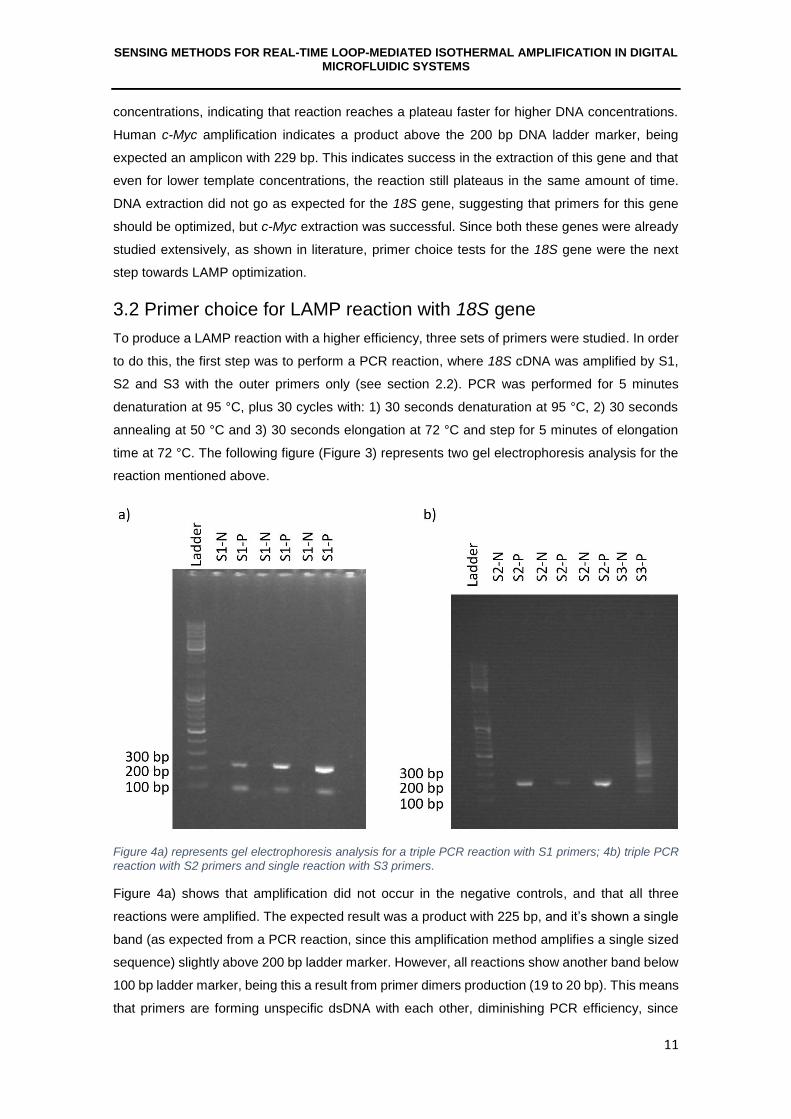
To reduce DNA amplicons for S3 primers, a study was performed where the annealing
temperature was increased for a PCR reaction. Higher temperature forces primers to anneal
perfectly to their target sequence, making them more thermally stable with higher nucleotide pairs
formed between primer and DNA target. Primer bonds are broken by temperature if not aligned
correctly. This study was performed in two segments: in the first segment, temperature was varied
between 50 °C and 60 °C with 2 °C steps (see details in Annex 5) and the second segment,
temperature was varied from 61 °C to 65 °C with 1 °C steps (Figure 5). These temperatures were
only changed in the second step of the PCR cycle, being the remaining protocol left the same
(steps duration, reagents, concentration).
Figure 5 Gel electrophoresis result for PCR reaction with S3 primers, changing annealing temperature from 61 °C to 65 °C.
SENSING METHODS FOR REAL-TIME LOOP-MEDIATED ISOTHERMAL AMPLIFICATION IN DIGITAL MICROFLUIDIC SYSTEMS
13
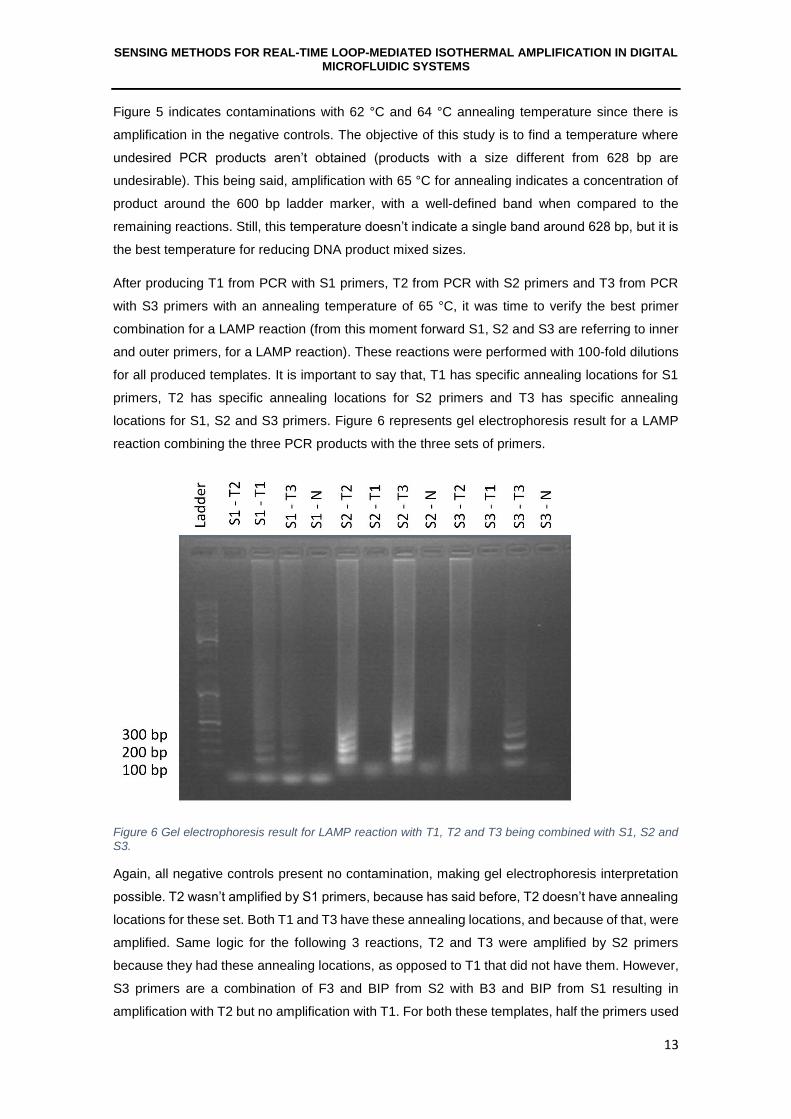
Figure 5 indicates contaminations with 62 °C and 64 °C annealing temperature since there is
amplification in the negative controls. The objective of this study is to find a temperature where
undesired PCR products aren’t obtained (products with a size different from 628 bp are
undesirable). This being said, amplification with 65 °C for annealing indicates a concentration of
product around the 600 bp ladder marker, with a well-defined band when compared to the
remaining reactions. Still, this temperature doesn’t indicate a single band around 628 bp, but it is
the best temperature for reducing DNA product mixed sizes.
After producing T1 from PCR with S1 primers, T2 from PCR with S2 primers and T3 from PCR
with S3 primers with an annealing temperature of 65 °C, it was time to verify the best primer
combination for a LAMP reaction (from this moment forward S1, S2 and S3 are referring to inner
and outer primers, for a LAMP reaction). These reactions were performed with 100-fold dilutions
for all produced templates. It is important to say that, T1 has specific annealing locations for S1
primers, T2 has specific annealing locations for S2 primers and T3 has specific annealing
locations for S1, S2 and S3 primers. Figure 6 represents gel electrophoresis result for a LAMP
reaction combining the three PCR products with the three sets of primers.
Figure 6 Gel electrophoresis result for LAMP reaction with T1, T2 and T3 being combined with S1, S2 and S3.
Again, all negative controls present no contamination, making gel electrophoresis interpretation
possible. T2 wasn’t amplified by S1 primers, because has said before, T2 doesn’t have annealing
locations for these set. Both T1 and T3 have these annealing locations, and because of that, were
amplified. Same logic for the following 3 reactions, T2 and T3 were amplified by S2 primers
because they had these annealing locations, as opposed to T1 that did not have them. However,
S3 primers are a combination of F3 and BIP from S2 with B3 and BIP from S1 resulting in
amplification with T2 but no amplification with T1. For both these templates, half the primers used
SENSING METHODS FOR REAL-TIME LOOP-MEDIATED ISOTHERMAL AMPLIFICATION IN DIGITAL MICROFLUIDIC SYSTEMS
14
are a perfect match to their annealing locations, leaving the remaining half to be bonded. Yet, the
most important step in LAMP is the first one, when FIP and F3 start the reaction, making the
remaining reaction happen, even if B3 and BIP are bonded imperfectly. T2 has the annealing
locations for FIP and F3 from S2, but T1 doesn’t, making the reaction happen only with T2. Finally,
T3 didn’t have enough reaction time, since we start to see some products, but not the total LAMP
expected results probably because of the large template when compared to T1 and T2. Some
important notes: when compared for the same template (T3), S2 has a bigger efficiency than S1,
being nevertheless both capable of using a target with 628 bp (relatively large). Also, even with
specific targets (T1 for S1 and T2 for S2), S2 still remains the most efficient one. S3 primers can’t
be compared with S2, for T2 amplification, since S3-T2 product isn’t an exact copy of its target.
As explained before, F3 and FIP forced the reaction, but B3 and BIP weren’t in the original
sequence, thus resulting in a hybrid between T2, B3 and BIP primers from S1. This makes S2
primers superior again and allow us to choose them as primers for a LAMP reaction with human
18S gene.
3.3 Fluorescence measurements on device
Before studying real-time LAMP technique on-chip, DMF devices meant for fluorescence
measurements were designed and fabricated. In this segment, DMF layouts as well as hardware
prerequisites meant for this purpose are presented.
3.3.1 Device layout
The produced DMF chip is intended to have a two-plate configuration coupled with two fiber
optics. The first channel would radiate the excitation light characteristic of the fluorophore and the
second channel would receive the emitted light from the excited molecule. To facilitate excitation
and emitted light discrimination, a filter would be attached to the second optic fiber, which would
only allow a single wavelength to pass through.
However, for testing purposes, the chip was left incomplete (as described in section 2.4) with a
single bottom plate on a glass substrate, which includes a chromium deposited pattern covered
by a parylene C layer and coated by a Teflon® hydrophobic layer. Before chip fabrication, it is
necessary to define the layout of the device, previously designed and studied in related work33.
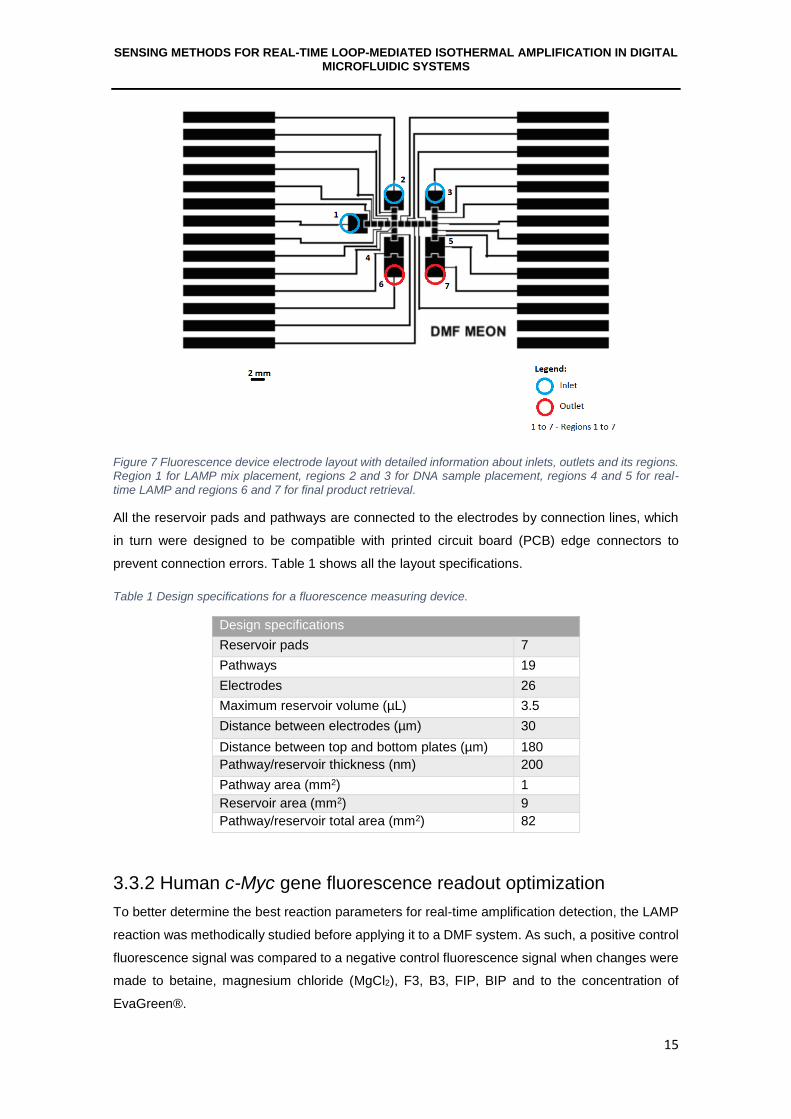
An H-shaped design is proposed, with seven essential regions (Figure 7). The first region is used
as a reservoir for LAMP reagents, the second and third regions as reservoirs for DNA samples,
the fourth and fifth regions as amplifying regions where the real-time reaction will take place for
each DNA sample and finally the sixth and seventh regions as retrieving reservoirs. Furthermore,
there are nineteen pathway electrodes which connect the seven regions mentioned above and
are used as both paths and mixing areas for the LAMP reaction.
SENSING METHODS FOR REAL-TIME LOOP-MEDIATED ISOTHERMAL AMPLIFICATION IN DIGITAL MICROFLUIDIC SYSTEMS
15
Figure 7 Fluorescence device electrode layout with detailed information about inlets, outlets and its regions. Region 1 for LAMP mix placement, regions 2 and 3 for DNA sample placement, regions 4 and 5 for real-
time LAMP and regions 6 and 7 for final product retrieval.
All the reservoir pads and pathways are connected to the electrodes by connection lines, which
in turn were designed to be compatible with printed circuit board (PCB) edge connectors to
prevent connection errors. Table 1 shows all the layout specifications.
Table 1 Design specifications for a fluorescence measuring device.
Design specifications
Reservoir pads 7
Pathways 19
Electrodes 26
Maximum reservoir volume (µL) 3.5
Distance between electrodes (µm) 30
Distance between top and bottom plates (µm) 180
Pathway/reservoir thickness (nm) 200
Pathway area (mm2) 1
Reservoir area (mm2) 9
Pathway/reservoir total area (mm2) 82
3.3.2 Human c-Myc gene fluorescence readout optimization
To better determine the best reaction parameters for real-time amplification detection, the LAMP
reaction was methodically studied before applying it to a DMF system. As such, a positive control
fluorescence signal was compared to a negative control fluorescence signal when changes were
made to betaine, magnesium chloride (MgCl2), F3, B3, FIP, BIP and to the concentration of
EvaGreen®.
SENSING METHODS FOR REAL-TIME LOOP-MEDIATED ISOTHERMAL AMPLIFICATION IN DIGITAL MICROFLUIDIC SYSTEMS
16
Multiple studies were performed where betaine and MgCl2 were used in a multitude of
concentrations.34,35,36. Both these reagents are used to control LAMP’s efficiency and velocity,
whereas betaine assists in strand separation for high cytosine/guanin DNA targets and MgCl2
increases the activity of the used DNA polymerase, depriving specificity at higher concentrations.
Betaine was reduced from 1 M to 0.8 M, with the purpose of diminishing possible reactions with
the used fluorophore when attempting real-time LAMP. To contradict this effect in terms of
efficiency and velocity, MgCl2 was increased from 4 mM to 6 mM, in accordance with the literature.
Also, F3, B3, FIP and BIP concentration may affect the difference in fluorescence signal between
a positive control and a negative control, as described elsewhere37. Results from primer
concentration reduction to 75% of their “standard” value are present in Annex 6, with associated
fluorescence measurements. For this case, it was indicated that the standard protocol for primer
concentration had the best fluorescence signal ratio.
3.3.2.1 EvaGreen® optimization
EvaGreen® was the chosen dye for LAMP reaction monitoring, for its non-inhibitory capabilities,
high sensitivity and thermal stability. Being this reagent the one that makes real-time LAMP
possible, it is important to study what happens when different concentrations are used in a
reaction. Thus, a study was performed where the fluorescence signal of a positive control was
compared to the fluorescence signal of a negative control, for four reactions: the first reaction with
0.1× EvaGreen®, the second with 0.5× EvaGreen®, the third with 1× EvaGreen® and the fourth
with 1.5× EvaGreen®. These reactions were performed with the already changed betaine and
MgCl2 concentrations, maintaining standard concentration of primers and remaining LAMP
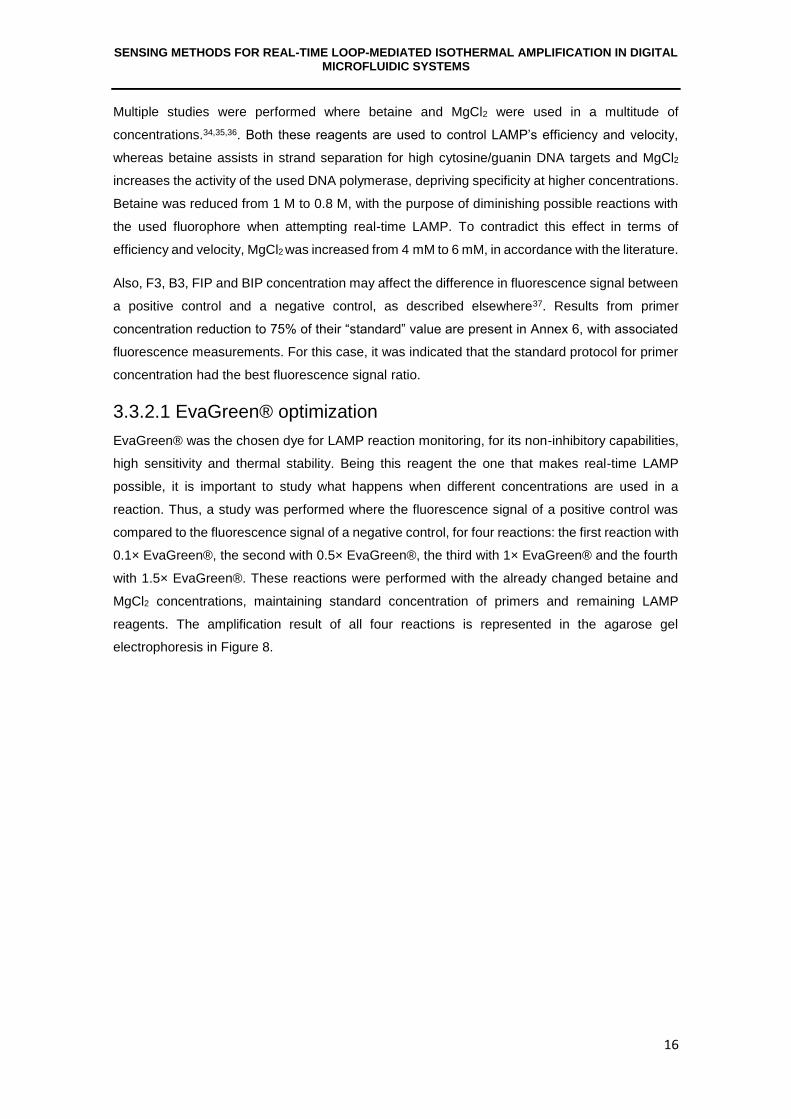
reagents. The amplification result of all four reactions is represented in the agarose gel
electrophoresis in Figure 8.

SENSING METHODS FOR REAL-TIME LOOP-MEDIATED ISOTHERMAL AMPLIFICATION IN DIGITAL MICROFLUIDIC SYSTEMS
17
Figure 8 Gel Electrophoresis result for positive (“P”) and negative (“N”) controls with 0.1×, 0.5×, 1×, 1.5×
EvaGreen® concentration.
In summary, all positive controls amplified their DNA targets regardless of EvaGreen®
concentration. Nevertheless, it is clear that the reaction efficiency was not the same for all
concentrations, having 1.5× EvaGreen® and 0.5× EvaGreen® evidence of lower product
concentration than for 0.5× EvaGreen® and 1× EvaGreen®.
Moreover, a fluorimeter was used to determine the positive control fluorescence and the negative
control fluorescence. This equipment detects the emitted wavelength spectrum of all reactions
after being excited by a 500 nm-wavelength light, corresponding to the excitation wavelength of
EvaGreen®. Also, 530 nm is the peak emission wavelength of EvaGreen®, and to better compare
fluorescence results from positive and negative controls, only this point, where fluorescence is at
its maximum, will be compared, instead of the full emitted spectrum. To make different reactions
comparable, the following ratio was made:
𝑅𝑎𝑡𝑖𝑜 =𝐼𝑝−𝐼𝑛
𝐼𝑛 (Equation 3.1)
Where Ip is the fluorescence in the positive control at 530 nm and In is the fluorescence in the
negative control at 530 nm, in arbitrary units.
A fluorimeter determined the positive vs negative ratio as mentioned in section 3.1.2.2, and
equation 3.1 allowed data treatment and signal comparison between every reaction produced
with the resulting graph (Figure 9) comparing all four positive vs negative ratios.
SENSING METHODS FOR REAL-TIME LOOP-MEDIATED ISOTHERMAL AMPLIFICATION IN DIGITAL MICROFLUIDIC SYSTEMS
18
Figure 9 Equation 3.1 ratio for 0.1×, 0.5×, 1×, 1.5× EvaGreen® concentration. Note that only one measurement was performed, so error was attributed to the third decimal digit, which was eliminated. Error was thus assumed as 1%.
It is possible to understand that the lowest ratio was achieved for 0.1× EvaGreen®, followed by
0.5× EvaGreen®, 1× EvaGreen® and 1.5× EvaGreen®. However, the difference from 1x
EvaGreen® to 1.5× EvaGreen® is very small, possibly suggesting that a maximum was reached
and that this ratio may start to decrease for higher concentrations. Nevertheless, the EvaGreen®
concentration that maximizes a positive vs negative fluorescence signal is 1× and, as such, was
the chosen concentration for real-time LAMP.
To corroborate the previous data and mimic the future DMF platform for DNA sensing via
fluorescence, the same process was performed with a fluorescence microscope. For this case,
two 1 µL droplets (one from a positive control and another from a negative control) were placed
on the produced chip, simulating the final volume used on-chip. Droplets were then seen under a
blue light (ranging from 465 nm to 495 nm) in the lowest brightness possible (ND 2 for this
microscope) and under 40× magnification. This process was repeated four times, one for each
reaction, resulting in Figure 10 that represents a comparison of each droplet for every reaction
and an image intensity table from ImageJ software. For ImageJ data analysis, a circle was drawn
around each droplet and ImageJ software measured the integrated area of pixels and the area
that they occupied. Then, another circle was made in the background in order to obtain the mean
fluorescence of background. Finally, droplet fluorescence was determined by the following
equation:
𝐶𝑇𝐷𝐹 = 𝐼𝑛𝑡𝑒𝑔𝑟𝑎𝑡𝑒𝑑 𝑑𝑒𝑛𝑠𝑖𝑡𝑦 − (𝐷𝑟𝑜𝑝𝑙𝑒𝑡 𝑎𝑟𝑒𝑎 × 𝑀𝑒𝑎𝑛 𝑓𝑙𝑢𝑜𝑟𝑒𝑠𝑐𝑒𝑛𝑐𝑒 𝑜𝑓 𝑏𝑎𝑐𝑘𝑔𝑟𝑜𝑢𝑛𝑑)
(Equation 3.2)
SENSING METHODS FOR REAL-TIME LOOP-MEDIATED ISOTHERMAL AMPLIFICATION IN DIGITAL MICROFLUIDIC SYSTEMS
19
Where CTDF is the corrected total droplet fluorescence. This was produced for all reactions
performing a total of 8 analysis which are depicted in Annex 7.
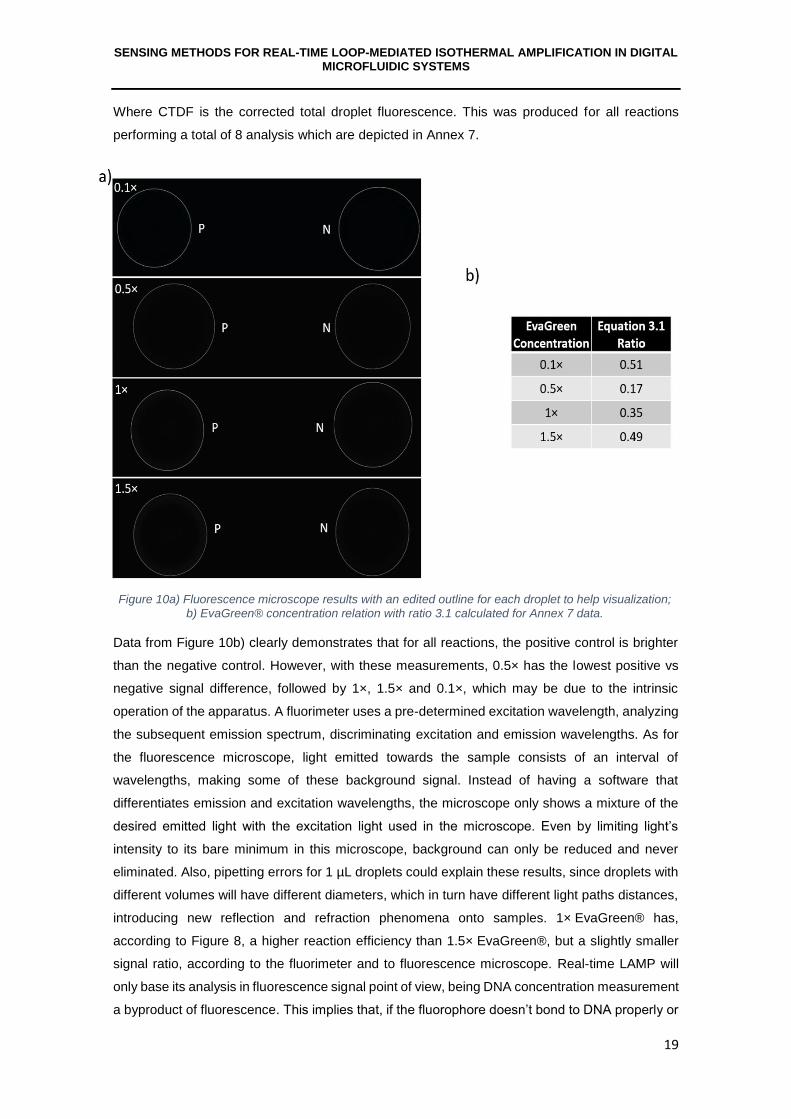
Data from Figure 10b) clearly demonstrates that for all reactions, the positive control is brighter
than the negative control. However, with these measurements, 0.5× has the lowest positive vs
negative signal difference, followed by 1×, 1.5× and 0.1×, which may be due to the intrinsic
operation of the apparatus. A fluorimeter uses a pre-determined excitation wavelength, analyzing
the subsequent emission spectrum, discriminating excitation and emission wavelengths. As for
the fluorescence microscope, light emitted towards the sample consists of an interval of
wavelengths, making some of these background signal. Instead of having a software that
differentiates emission and excitation wavelengths, the microscope only shows a mixture of the
desired emitted light with the excitation light used in the microscope. Even by limiting light’s
intensity to its bare minimum in this microscope, background can only be reduced and never
eliminated. Also, pipetting errors for 1 µL droplets could explain these results, since droplets with
different volumes will have different diameters, which in turn have different light paths distances,
introducing new reflection and refraction phenomena onto samples. 1× EvaGreen® has,
according to Figure 8, a higher reaction efficiency than 1.5× EvaGreen®, but a slightly smaller
signal ratio, according to the fluorimeter and to fluorescence microscope. Real-time LAMP will
only base its analysis in fluorescence signal point of view, being DNA concentration measurement
a byproduct of fluorescence. This implies that, if the fluorophore doesn’t bond to DNA properly or
Figure 10a) Fluorescence microscope results with an edited outline for each droplet to help visualization;
b) EvaGreen® concentration relation with ratio 3.1 calculated for Annex 7 data.
SENSING METHODS FOR REAL-TIME LOOP-MEDIATED ISOTHERMAL AMPLIFICATION IN DIGITAL MICROFLUIDIC SYSTEMS
20
if too much fluorophore is used, fluorescence measurements would not indicate variation in DNA
concentration. Nevertheless, it would be more important that fluorescence signal indicates a real
DNA concentration than being a maximized value. This said, 1× EvaGreen® would be more
suitable for a real-time LAMP.
Simultaneously, multiple devices were built in order to test if LAMP could be measured through
EIS systems. As such, the following chapters explain how these devices were made and how
these measurements were obtained.
3.4 Impedance measurements on device
In an alternative way, I purpose an impedance measurement device that would be capable of
detecting resistivity changes in a LAMP reaction, as the reaction progresses in time. This way, it
would be possible to perform real-time LAMP with impedance measurements, being necessary
to create a new chip design with this goal.
3.4.1 Device layout
Impedance measurements were performed in a smaller chip before being introduced in a DMF
system, since this type of measurements, to the best of my knowledge, were never tested for
LAMP mixes. To facilitate problem solving, the device was composed of a small glass substrate
with a chromium electrodes, a parylene C dielectric layer and hta PDMS frame. This last structure
would restrict liquid movement, preventing LAMP mix from spreading to undesirable parts of the
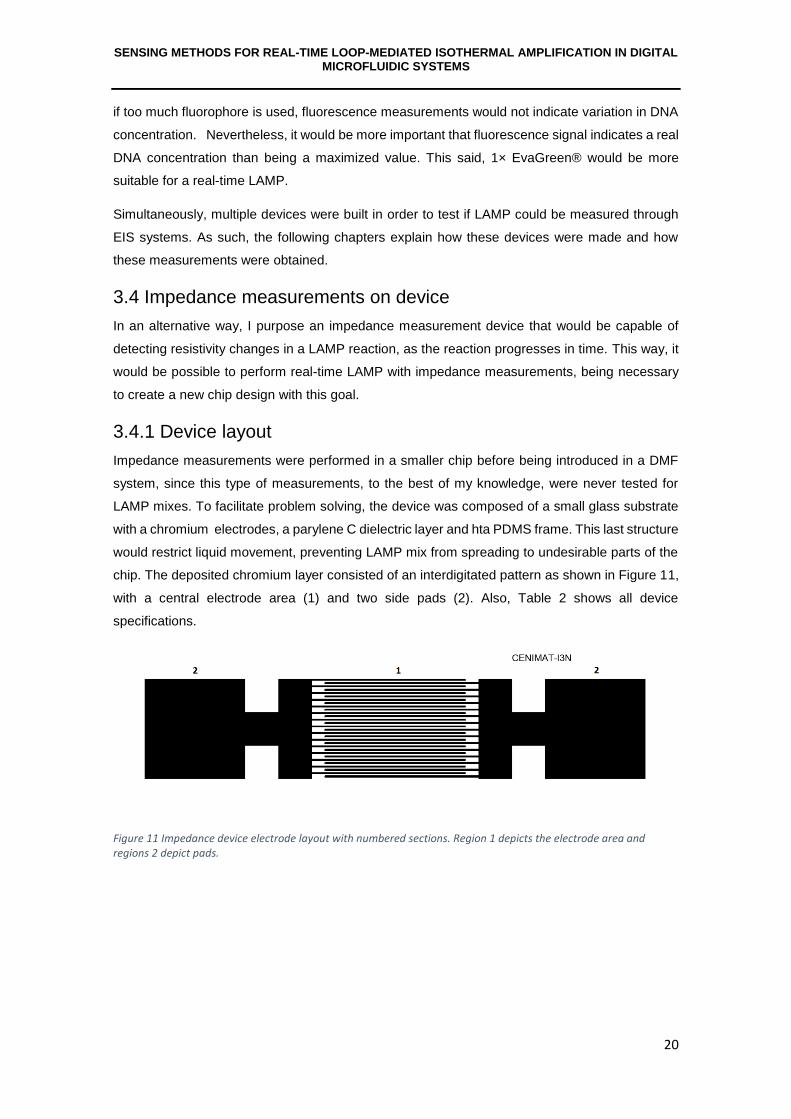
chip. The deposited chromium layer consisted of an interdigitated pattern as shown in Figure 11,
with a central electrode area (1) and two side pads (2). Also, Table 2 shows all device
specifications.
Figure 11 Impedance device electrode layout with numbered sections. Region 1 depicts the electrode area and regions 2 depict pads.
SENSING METHODS FOR REAL-TIME LOOP-MEDIATED ISOTHERMAL AMPLIFICATION IN DIGITAL MICROFLUIDIC SYSTEMS
21
Table 2 Design specifications for an impedance measuring device.
Design specifications
Pads 2
Fingers connected to each pad 15
Total number of fingers 30
Finger width (µm) 50
Distance between fingers (µm) 50
Pad area (mm2) 9
Electrode area (mm2) 15
This pattern was chosen due to its high regards in sensor uses, since they maximize capacitance
and increase the effective area of the sensor. The first section was where measurements took
place and LAMP mix was positioned. The two side areas contained two small pads, one on each
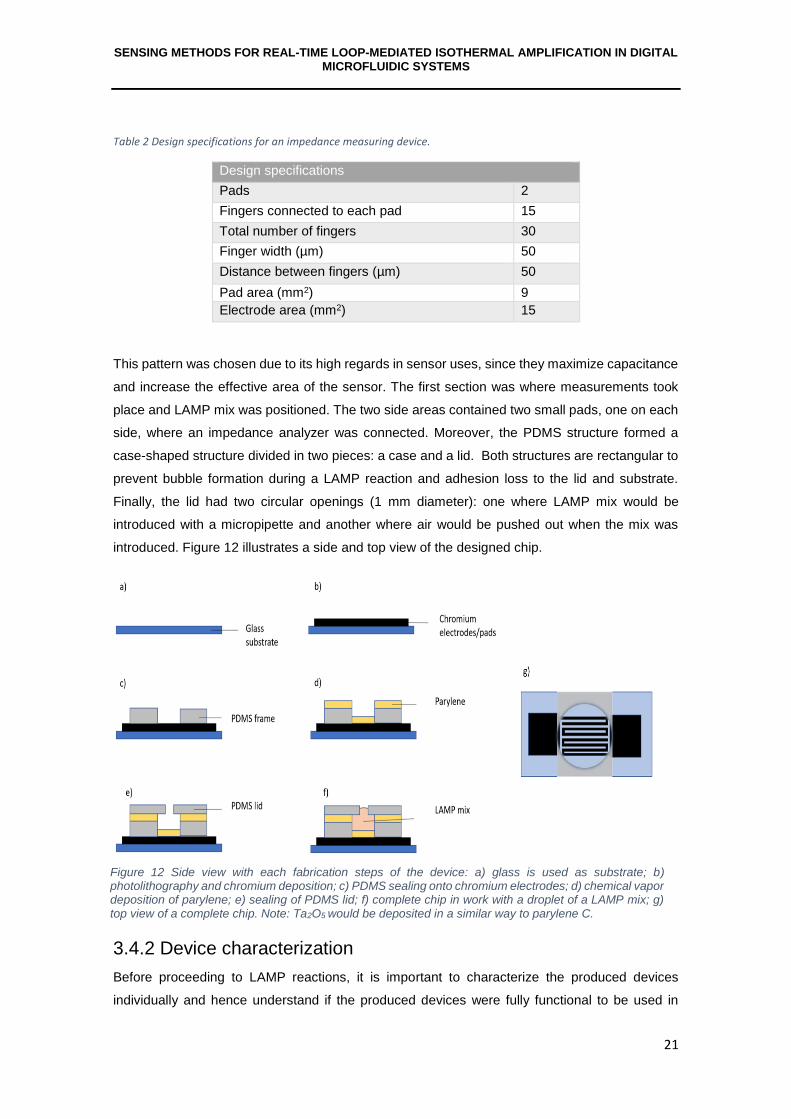
side, where an impedance analyzer was connected. Moreover, the PDMS structure formed a
case-shaped structure divided in two pieces: a case and a lid. Both structures are rectangular to
prevent bubble formation during a LAMP reaction and adhesion loss to the lid and substrate.
Finally, the lid had two circular openings (1 mm diameter): one where LAMP mix would be
introduced with a micropipette and another where air would be pushed out when the mix was
introduced. Figure 12 illustrates a side and top view of the designed chip.
3.4.2 Device characterization
Before proceeding to LAMP reactions, it is important to characterize the produced devices
individually and hence understand if the produced devices were fully functional to be used in
Figure 12 Side view with each fabrication steps of the device: a) glass is used as substrate; b) photolithography and chromium deposition; c) PDMS sealing onto chromium electrodes; d) chemical vapor deposition of parylene; e) sealing of PDMS lid; f) complete chip in work with a droplet of a LAMP mix; g) top view of a complete chip. Note: Ta2O5 would be deposited in a similar way to parylene C.
SENSING METHODS FOR REAL-TIME LOOP-MEDIATED ISOTHERMAL AMPLIFICATION IN DIGITAL MICROFLUIDIC SYSTEMS
22
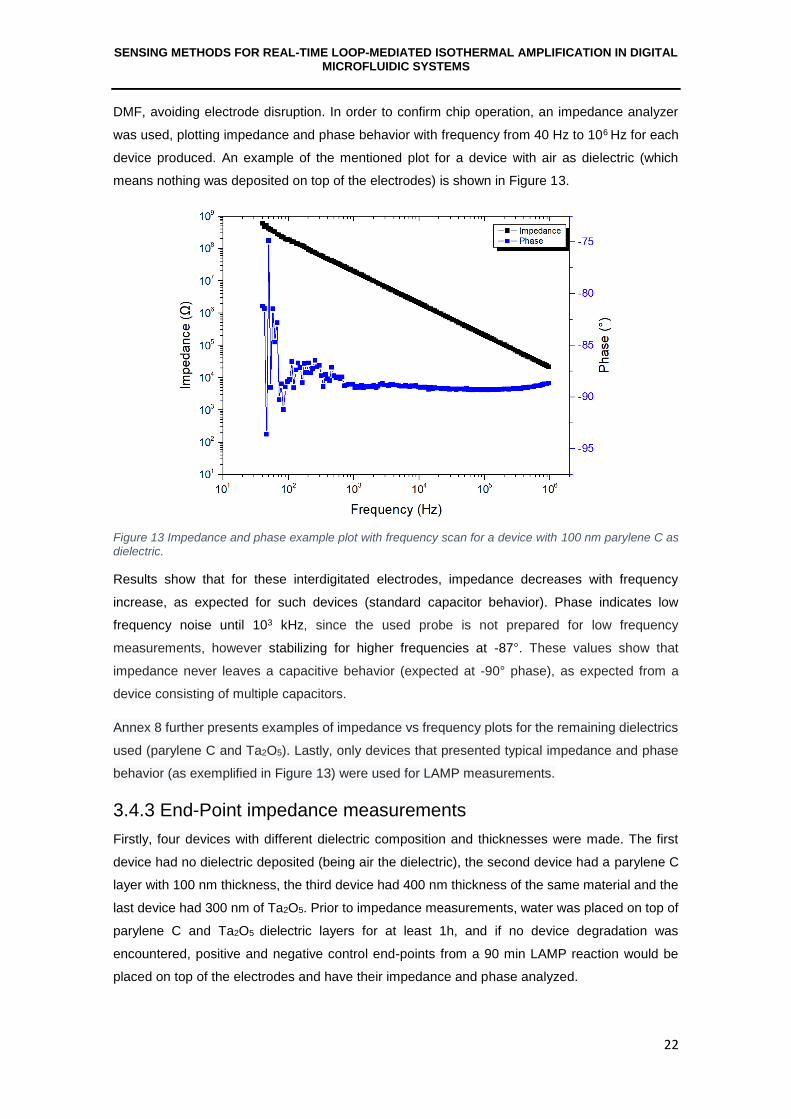
DMF, avoiding electrode disruption. In order to confirm chip operation, an impedance analyzer
was used, plotting impedance and phase behavior with frequency from 40 Hz to 106 Hz for each
device produced. An example of the mentioned plot for a device with air as dielectric (which
means nothing was deposited on top of the electrodes) is shown in Figure 13.
Figure 13 Impedance and phase example plot with frequency scan for a device with 100 nm parylene C as dielectric.
Results show that for these interdigitated electrodes, impedance decreases with frequency
increase, as expected for such devices (standard capacitor behavior). Phase indicates low
frequency noise until 103 kHz, since the used probe is not prepared for low frequency
measurements, however stabilizing for higher frequencies at -87°. These values show that
impedance never leaves a capacitive behavior (expected at -90° phase), as expected from a
device consisting of multiple capacitors.
Annex 8 further presents examples of impedance vs frequency plots for the remaining dielectrics
used (parylene C and Ta2O5). Lastly, only devices that presented typical impedance and phase
behavior (as exemplified in Figure 13) were used for LAMP measurements.
3.4.3 End-Point impedance measurements
Firstly, four devices with different dielectric composition and thicknesses were made. The first
device had no dielectric deposited (being air the dielectric), the second device had a parylene C
layer with 100 nm thickness, the third device had 400 nm thickness of the same material and the
last device had 300 nm of Ta2O5. Prior to impedance measurements, water was placed on top of
parylene C and Ta2O5 dielectric layers for at least 1h, and if no device degradation was
encountered, positive and negative control end-points from a 90 min LAMP reaction would be
placed on top of the electrodes and have their impedance and phase analyzed.
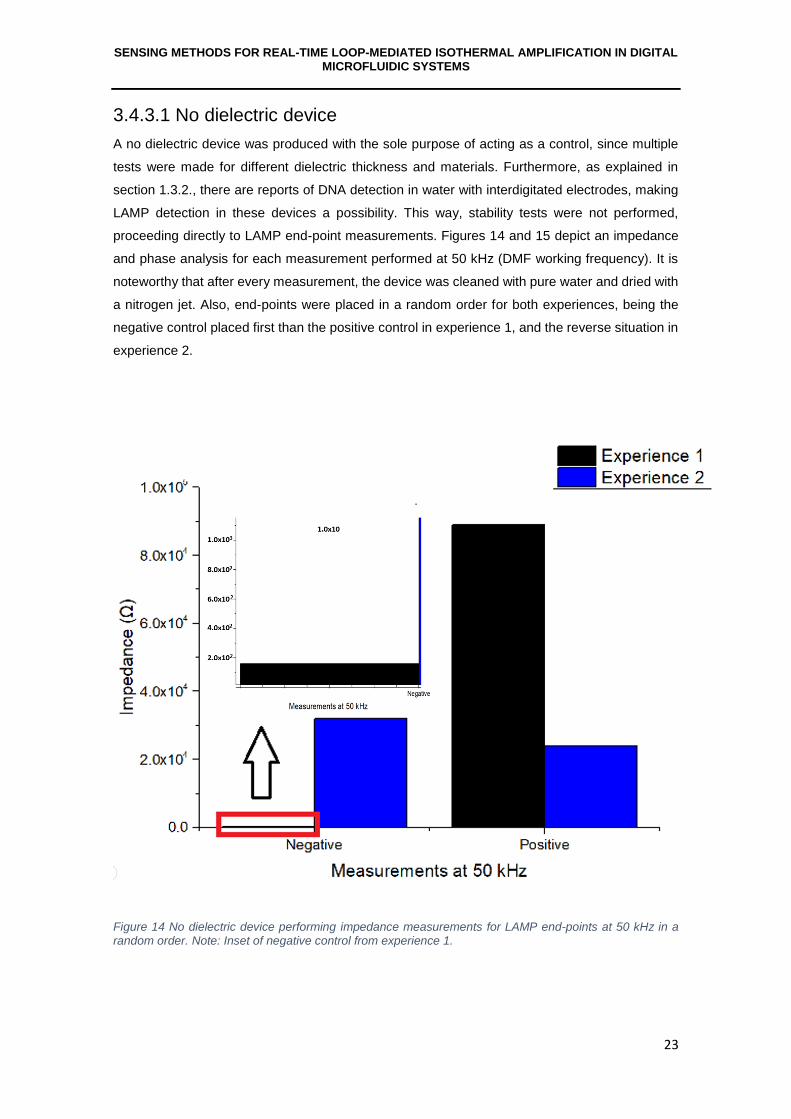
SENSING METHODS FOR REAL-TIME LOOP-MEDIATED ISOTHERMAL AMPLIFICATION IN DIGITAL MICROFLUIDIC SYSTEMS
23
3.4.3.1 No dielectric device
A no dielectric device was produced with the sole purpose of acting as a control, since multiple
tests were made for different dielectric thickness and materials. Furthermore, as explained in
section 1.3.2., there are reports of DNA detection in water with interdigitated electrodes, making
LAMP detection in these devices a possibility. This way, stability tests were not performed,
proceeding directly to LAMP end-point measurements. Figures 14 and 15 depict an impedance
and phase analysis for each measurement performed at 50 kHz (DMF working frequency). It is
noteworthy that after every measurement, the device was cleaned with pure water and dried with
a nitrogen jet. Also, end-points were placed in a random order for both experiences, being the
negative control placed first than the positive control in experience 1, and the reverse situation in
experience 2.
Figure 14 No dielectric device performing impedance measurements for LAMP end-points at 50 kHz in a random order. Note: Inset of negative control from experience 1.
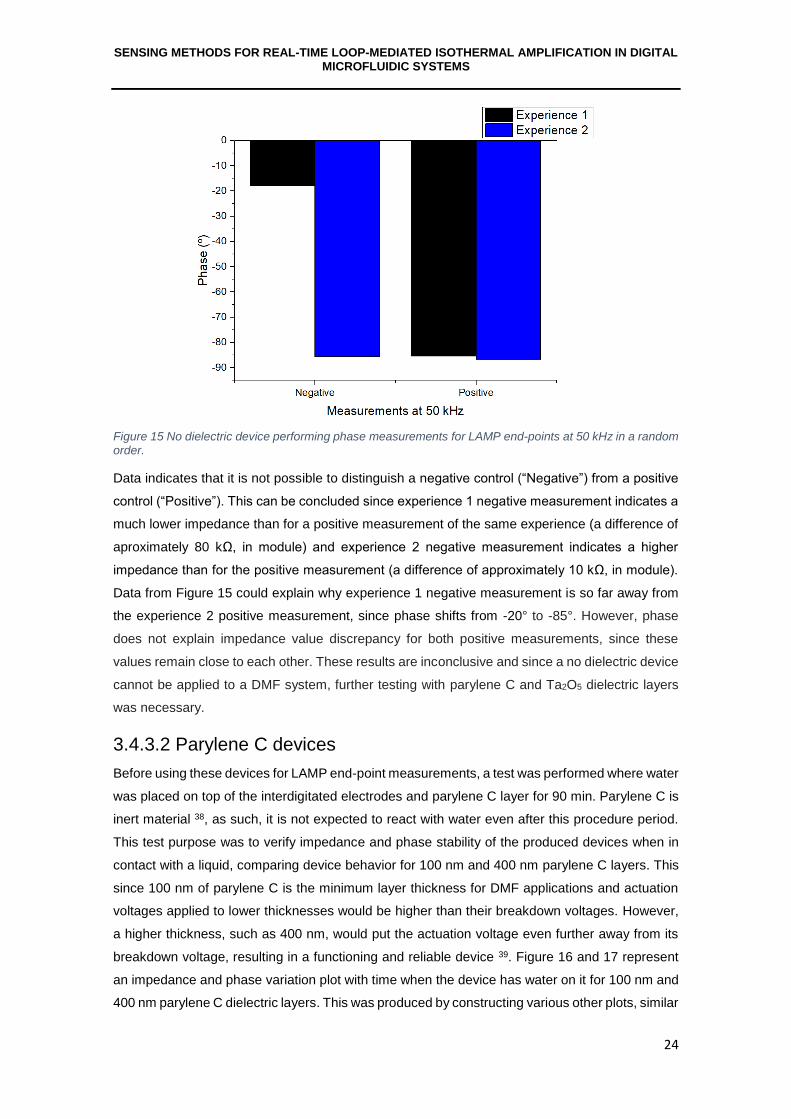
SENSING METHODS FOR REAL-TIME LOOP-MEDIATED ISOTHERMAL AMPLIFICATION IN DIGITAL MICROFLUIDIC SYSTEMS
24
Figure 15 No dielectric device performing phase measurements for LAMP end-points at 50 kHz in a random order.
Data indicates that it is not possible to distinguish a negative control (“Negative”) from a positive
control (“Positive”). This can be concluded since experience 1 negative measurement indicates a
much lower impedance than for a positive measurement of the same experience (a difference of
aproximately 80 kΩ, in module) and experience 2 negative measurement indicates a higher
impedance than for the positive measurement (a difference of approximately 10 kΩ, in module).
Data from Figure 15 could explain why experience 1 negative measurement is so far away from
the experience 2 positive measurement, since phase shifts from -20° to -85°. However, phase
does not explain impedance value discrepancy for both positive measurements, since these
values remain close to each other. These results are inconclusive and since a no dielectric device
cannot be applied to a DMF system, further testing with parylene C and Ta2O5 dielectric layers
was necessary.
3.4.3.2 Parylene C devices
Before using these devices for LAMP end-point measurements, a test was performed where water
was placed on top of the interdigitated electrodes and parylene C layer for 90 min. Parylene C is
inert material 38, as such, it is not expected to react with water even after this procedure period.
This test purpose was to verify impedance and phase stability of the produced devices when in
contact with a liquid, comparing device behavior for 100 nm and 400 nm parylene C layers. This
since 100 nm of parylene C is the minimum layer thickness for DMF applications and actuation
voltages applied to lower thicknesses would be higher than their breakdown voltages. However,
a higher thickness, such as 400 nm, would put the actuation voltage even further away from its
breakdown voltage, resulting in a functioning and reliable device 39. Figure 16 and 17 represent
an impedance and phase variation plot with time when the device has water on it for 100 nm and
400 nm parylene C dielectric layers. This was produced by constructing various other plots, similar
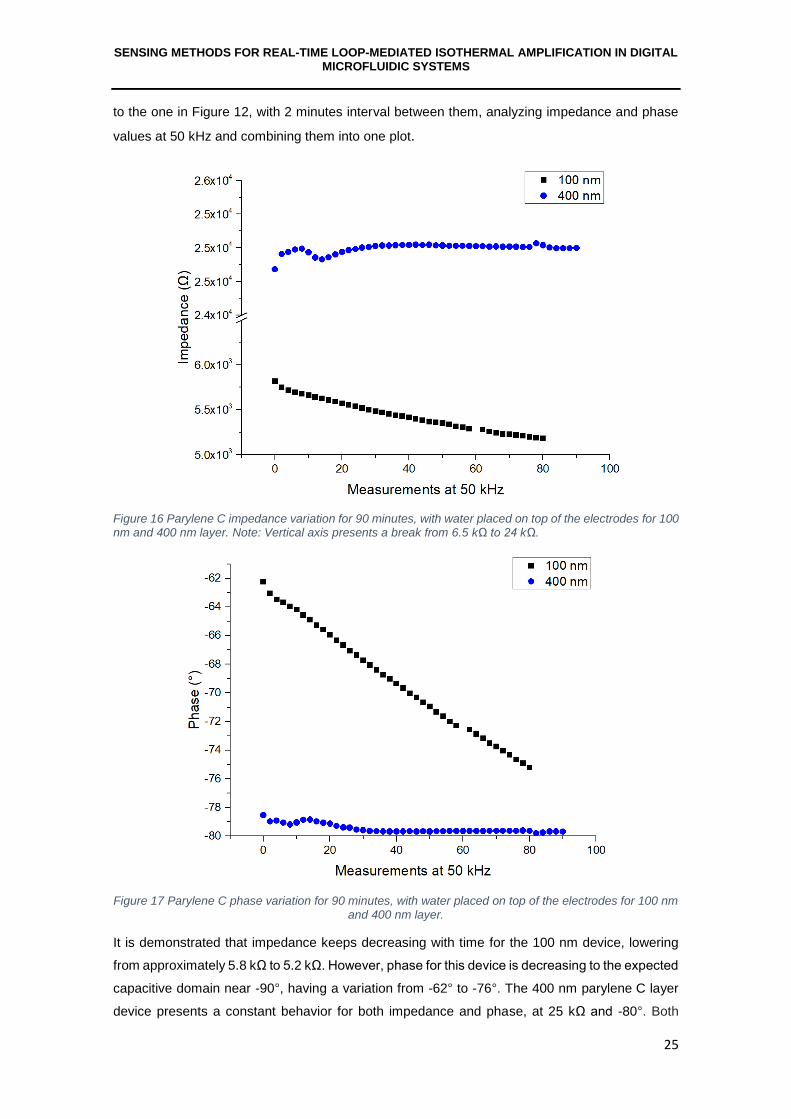
SENSING METHODS FOR REAL-TIME LOOP-MEDIATED ISOTHERMAL AMPLIFICATION IN DIGITAL MICROFLUIDIC SYSTEMS
25
to the one in Figure 12, with 2 minutes interval between them, analyzing impedance and phase
values at 50 kHz and combining them into one plot.
Figure 16 Parylene C impedance variation for 90 minutes, with water placed on top of the electrodes for 100 nm and 400 nm layer. Note: Vertical axis presents a break from 6.5 kΩ to 24 kΩ.
Figure 17 Parylene C phase variation for 90 minutes, with water placed on top of the electrodes for 100 nm and 400 nm layer.
It is demonstrated that impedance keeps decreasing with time for the 100 nm device, lowering
from approximately 5.8 kΩ to 5.2 kΩ. However, phase for this device is decreasing to the expected
capacitive domain near -90°, having a variation from -62° to -76°. The 400 nm parylene C layer
device presents a constant behavior for both impedance and phase, at 25 kΩ and -80°. Both
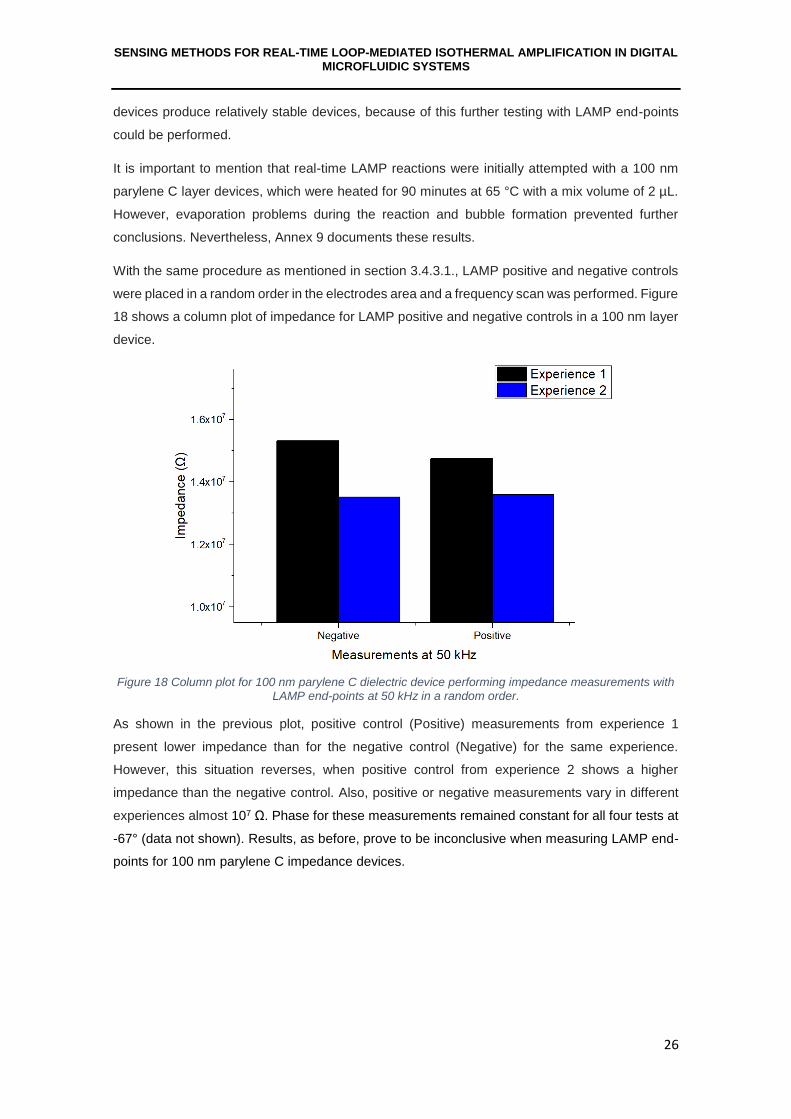
SENSING METHODS FOR REAL-TIME LOOP-MEDIATED ISOTHERMAL AMPLIFICATION IN DIGITAL MICROFLUIDIC SYSTEMS
26
devices produce relatively stable devices, because of this further testing with LAMP end-points
could be performed.
It is important to mention that real-time LAMP reactions were initially attempted with a 100 nm
parylene C layer devices, which were heated for 90 minutes at 65 °C with a mix volume of 2 µL.
However, evaporation problems during the reaction and bubble formation prevented further
conclusions. Nevertheless, Annex 9 documents these results.
With the same procedure as mentioned in section 3.4.3.1., LAMP positive and negative controls
were placed in a random order in the electrodes area and a frequency scan was performed. Figure
18 shows a column plot of impedance for LAMP positive and negative controls in a 100 nm layer
device.
Figure 18 Column plot for 100 nm parylene C dielectric device performing impedance measurements with LAMP end-points at 50 kHz in a random order.
As shown in the previous plot, positive control (Positive) measurements from experience 1
present lower impedance than for the negative control (Negative) for the same experience.
However, this situation reverses, when positive control from experience 2 shows a higher
impedance than the negative control. Also, positive or negative measurements vary in different
experiences almost 107 Ω. Phase for these measurements remained constant for all four tests at
-67° (data not shown). Results, as before, prove to be inconclusive when measuring LAMP end-
points for 100 nm parylene C impedance devices.
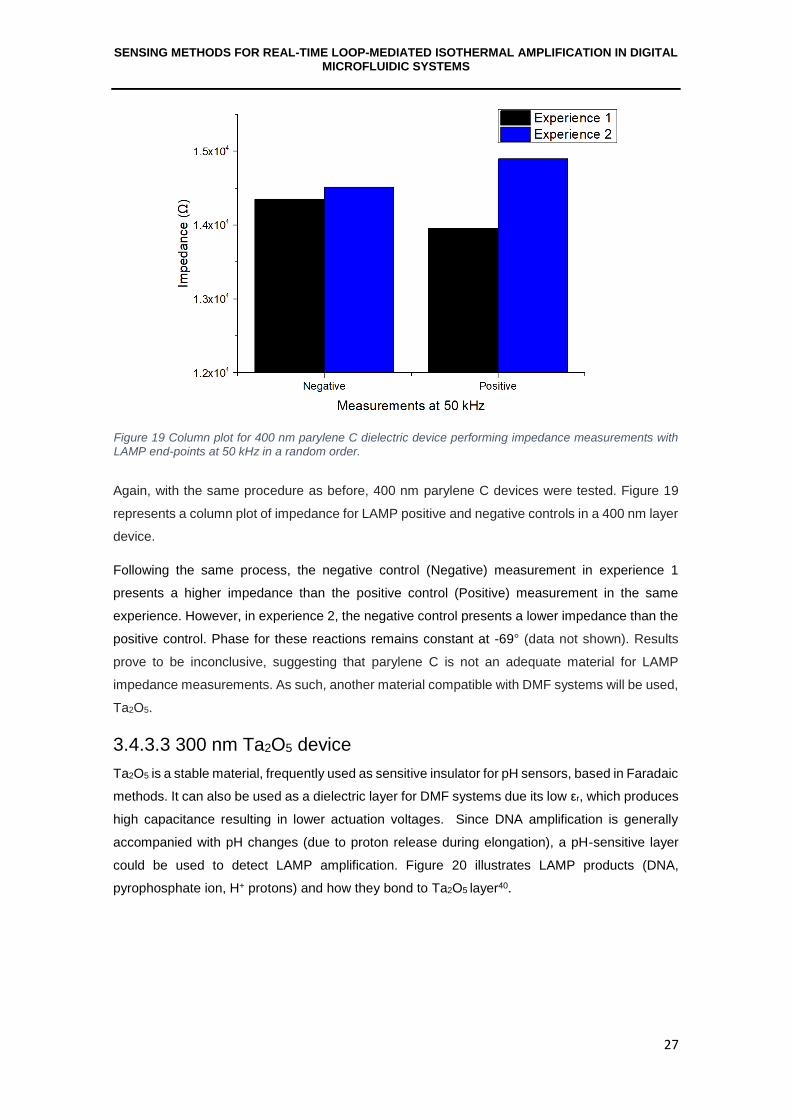
SENSING METHODS FOR REAL-TIME LOOP-MEDIATED ISOTHERMAL AMPLIFICATION IN DIGITAL MICROFLUIDIC SYSTEMS
27
Again, with the same procedure as before, 400 nm parylene C devices were tested. Figure 19
represents a column plot of impedance for LAMP positive and negative controls in a 400 nm layer
device.
Following the same process, the negative control (Negative) measurement in experience 1
presents a higher impedance than the positive control (Positive) measurement in the same
experience. However, in experience 2, the negative control presents a lower impedance than the
positive control. Phase for these reactions remains constant at -69° (data not shown). Results
prove to be inconclusive, suggesting that parylene C is not an adequate material for LAMP
impedance measurements. As such, another material compatible with DMF systems will be used,
Ta2O5.
3.4.3.3 300 nm Ta2O5 device
Ta2O5 is a stable material, frequently used as sensitive insulator for pH sensors, based in Faradaic
methods. It can also be used as a dielectric layer for DMF systems due its low εr, which produces
high capacitance resulting in lower actuation voltages. Since DNA amplification is generally
accompanied with pH changes (due to proton release during elongation), a pH-sensitive layer
could be used to detect LAMP amplification. Figure 20 illustrates LAMP products (DNA,
pyrophosphate ion, H+ protons) and how they bond to Ta2O5 layer40.
Figure 19 Column plot for 400 nm parylene C dielectric device performing impedance measurements with LAMP end-points at 50 kHz in a random order.
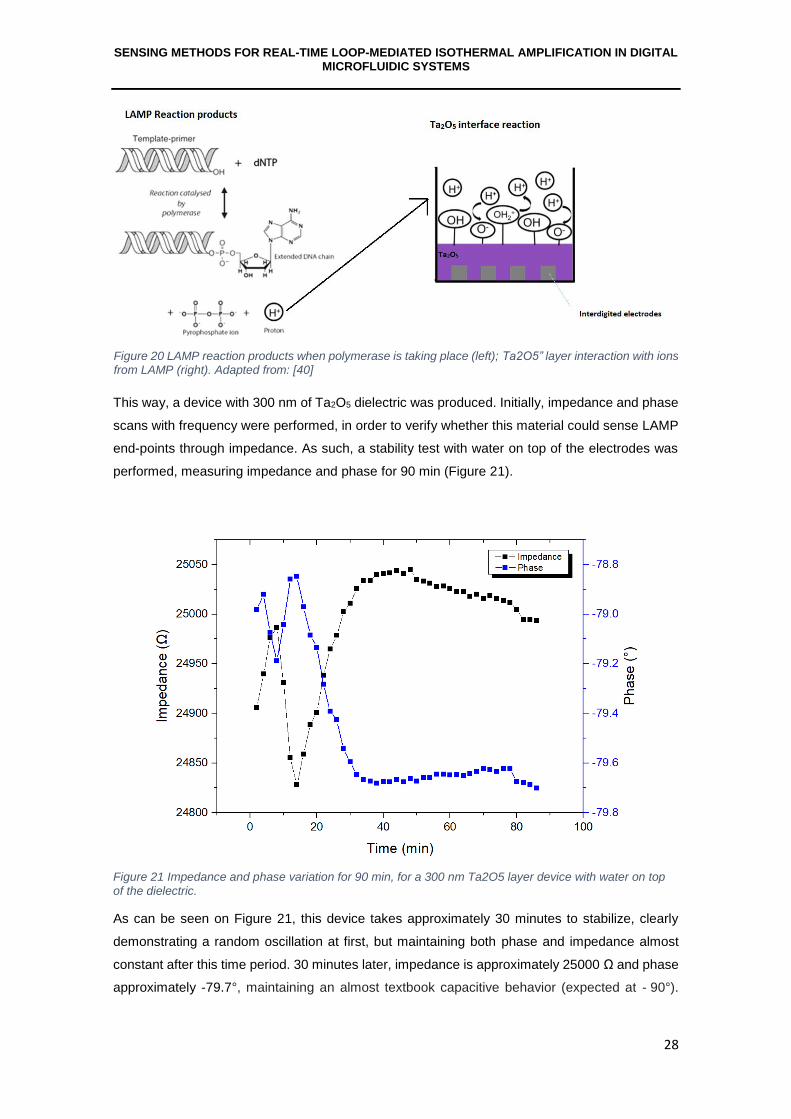
SENSING METHODS FOR REAL-TIME LOOP-MEDIATED ISOTHERMAL AMPLIFICATION IN DIGITAL MICROFLUIDIC SYSTEMS
28
This way, a device with 300 nm of Ta2O5 dielectric was produced. Initially, impedance and phase
scans with frequency were performed, in order to verify whether this material could sense LAMP
end-points through impedance. As such, a stability test with water on top of the electrodes was
performed, measuring impedance and phase for 90 min (Figure 21).
Figure 21 Impedance and phase variation for 90 min, for a 300 nm Ta2O5 layer device with water on top
of the dielectric.
As can be seen on Figure 21, this device takes approximately 30 minutes to stabilize, clearly
demonstrating a random oscillation at first, but maintaining both phase and impedance almost
constant after this time period. 30 minutes later, impedance is approximately 25000 Ω and phase
approximately -79.7°, maintaining an almost textbook capacitive behavior (expected at - 90°).
Figure 20 LAMP reaction products when polymerase is taking place (left); Ta2O5” layer interaction with ions from LAMP (right). Adapted from: [40]
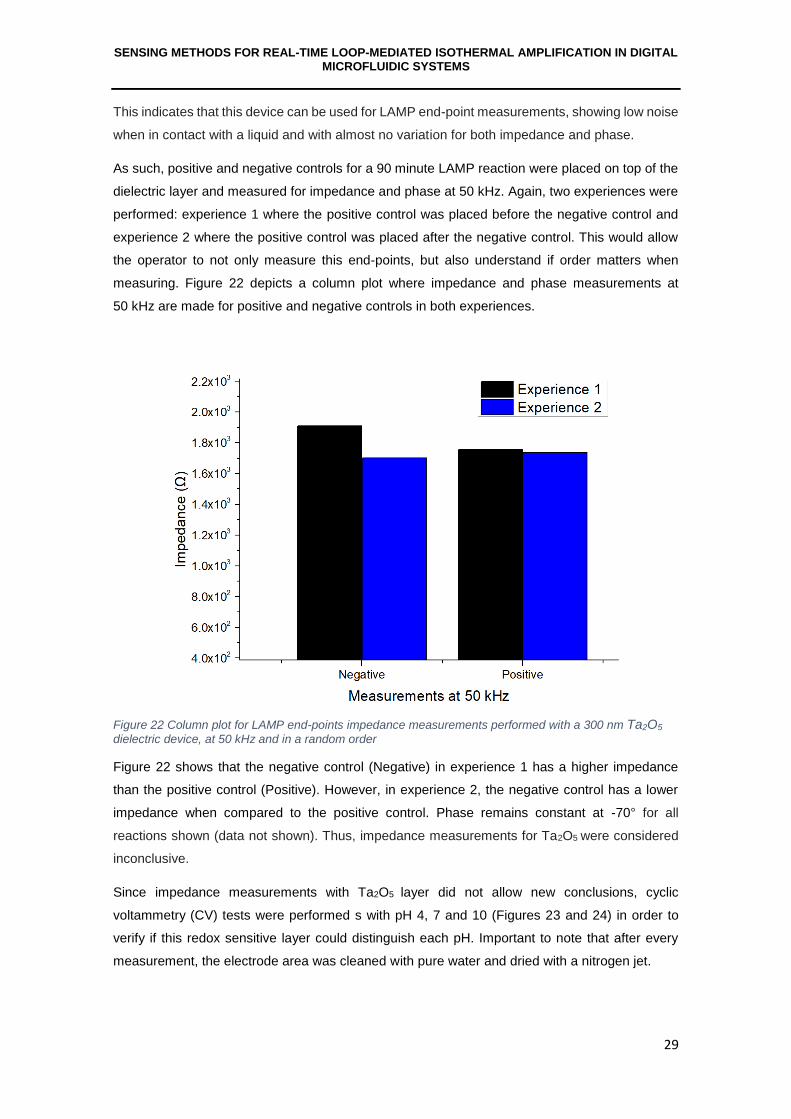
SENSING METHODS FOR REAL-TIME LOOP-MEDIATED ISOTHERMAL AMPLIFICATION IN DIGITAL MICROFLUIDIC SYSTEMS
29
This indicates that this device can be used for LAMP end-point measurements, showing low noise
when in contact with a liquid and with almost no variation for both impedance and phase.
As such, positive and negative controls for a 90 minute LAMP reaction were placed on top of the
dielectric layer and measured for impedance and phase at 50 kHz. Again, two experiences were
performed: experience 1 where the positive control was placed before the negative control and
experience 2 where the positive control was placed after the negative control. This would allow
the operator to not only measure this end-points, but also understand if order matters when
measuring. Figure 22 depicts a column plot where impedance and phase measurements at
50 kHz are made for positive and negative controls in both experiences.
Figure 22 Column plot for LAMP end-points impedance measurements performed with a 300 nm Ta2O5
dielectric device, at 50 kHz and in a random order
Figure 22 shows that the negative control (Negative) in experience 1 has a higher impedance
than the positive control (Positive). However, in experience 2, the negative control has a lower
impedance when compared to the positive control. Phase remains constant at -70° for all
reactions shown (data not shown). Thus, impedance measurements for Ta2O5 were considered
inconclusive.
Since impedance measurements with Ta2O5 layer did not allow new conclusions, cyclic
voltammetry (CV) tests were performed s with pH 4, 7 and 10 (Figures 23 and 24) in order to
verify if this redox sensitive layer could distinguish each pH. Important to note that after every
measurement, the electrode area was cleaned with pure water and dried with a nitrogen jet.
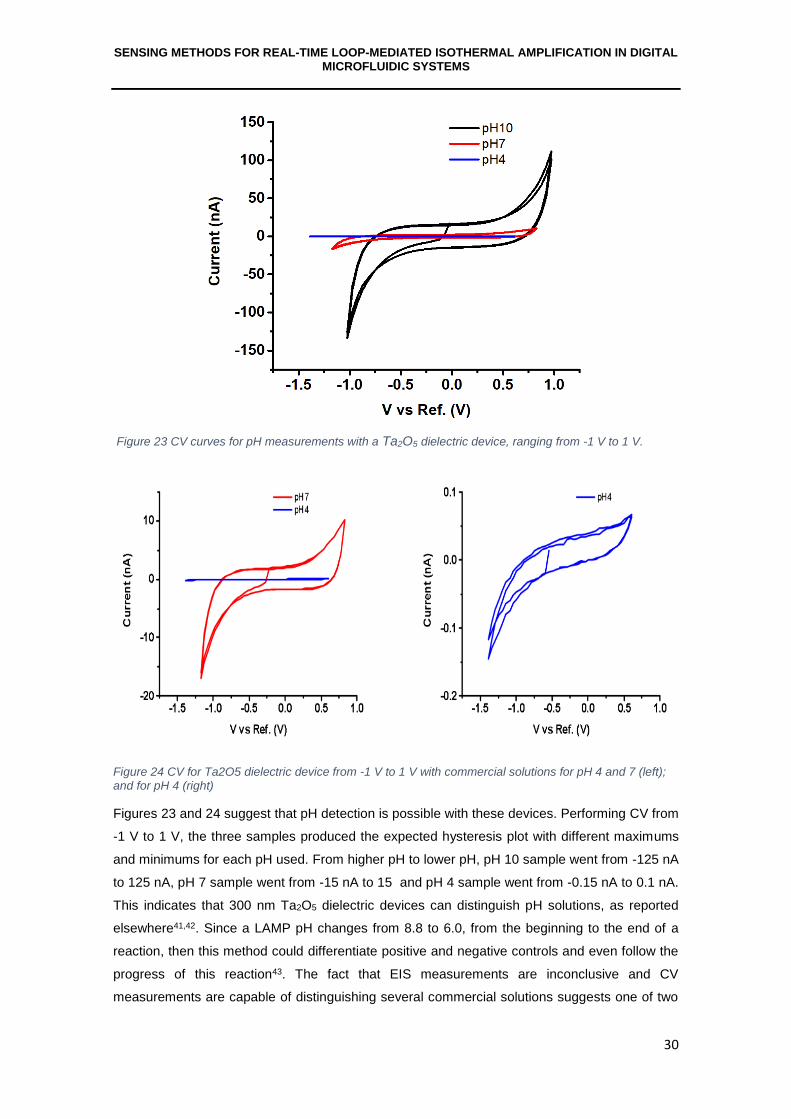
SENSING METHODS FOR REAL-TIME LOOP-MEDIATED ISOTHERMAL AMPLIFICATION IN DIGITAL MICROFLUIDIC SYSTEMS
30
Figure 23 CV curves for pH measurements with a Ta2O5 dielectric device, ranging from -1 V to 1 V.
Figure 24 CV for Ta2O5 dielectric device from -1 V to 1 V with commercial solutions for pH 4 and 7 (left); and for pH 4 (right)
Figures 23 and 24 suggest that pH detection is possible with these devices. Performing CV from
-1 V to 1 V, the three samples produced the expected hysteresis plot with different maximums
and minimums for each pH used. From higher pH to lower pH, pH 10 sample went from -125 nA
to 125 nA, pH 7 sample went from -15 nA to 15 and pH 4 sample went from -0.15 nA to 0.1 nA.
This indicates that 300 nm Ta2O5 dielectric devices can distinguish pH solutions, as reported
elsewhere41,42. Since a LAMP pH changes from 8.8 to 6.0, from the beginning to the end of a
reaction, then this method could differentiate positive and negative controls and even follow the
progress of this reaction43. The fact that EIS measurements are inconclusive and CV
measurements are capable of distinguishing several commercial solutions suggests one of two

SENSING METHODS FOR REAL-TIME LOOP-MEDIATED ISOTHERMAL AMPLIFICATION IN DIGITAL MICROFLUIDIC SYSTEMS
31
theories. Or the problem is in the LAMP reaction in itself and the reagents mixture (ions, DNA,
enzymes) mask EIS measurements or this method is not sensitive enough to measure differences
in the DNA concentration of this reaction.
Also, in order to show error bars for the produced graphs, at least three replicates of each
experiment should be performed. However, the probes used for impedance and phase
measurements were damaged during this thesis, therefore no replicates were produced, in any
moment. As such, error bars are not shown and are assumed to be 5% of the measured value.
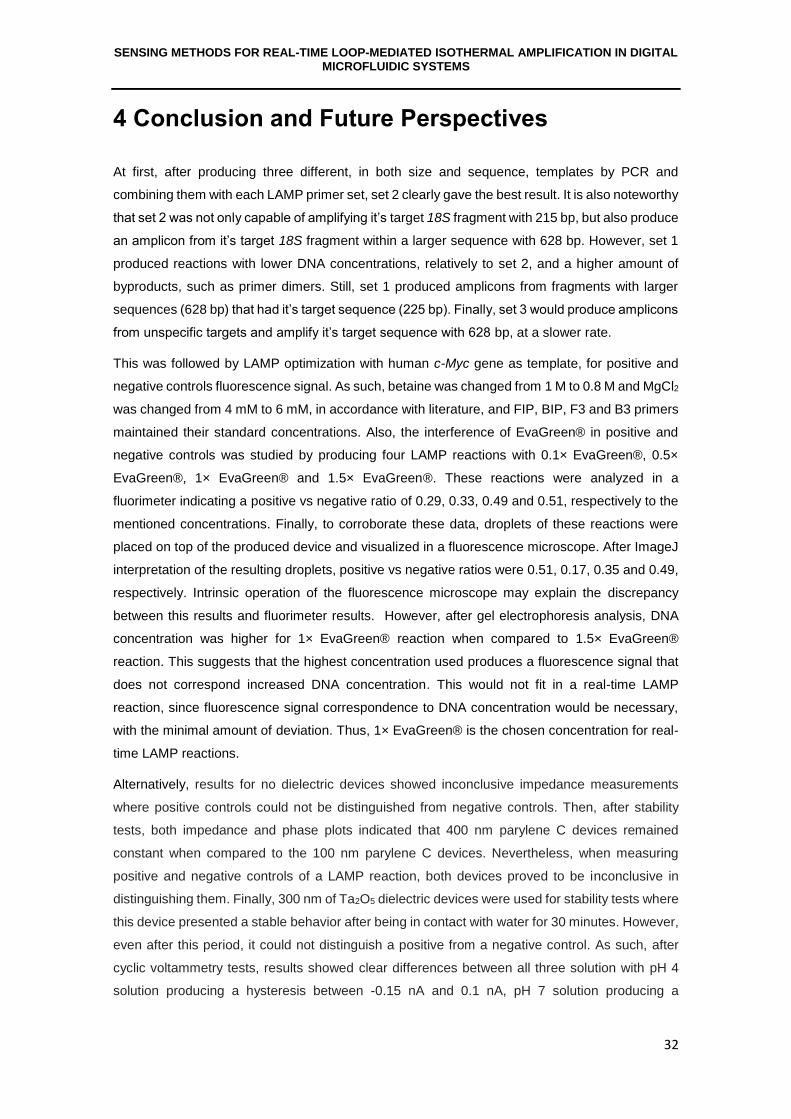
SENSING METHODS FOR REAL-TIME LOOP-MEDIATED ISOTHERMAL AMPLIFICATION IN DIGITAL MICROFLUIDIC SYSTEMS
32
4 Conclusion and Future Perspectives
At first, after producing three different, in both size and sequence, templates by PCR and
combining them with each LAMP primer set, set 2 clearly gave the best result. It is also noteworthy
that set 2 was not only capable of amplifying it’s target 18S fragment with 215 bp, but also produce
an amplicon from it’s target 18S fragment within a larger sequence with 628 bp. However, set 1
produced reactions with lower DNA concentrations, relatively to set 2, and a higher amount of
byproducts, such as primer dimers. Still, set 1 produced amplicons from fragments with larger
sequences (628 bp) that had it’s target sequence (225 bp). Finally, set 3 would produce amplicons
from unspecific targets and amplify it’s target sequence with 628 bp, at a slower rate.
This was followed by LAMP optimization with human c-Myc gene as template, for positive and
negative controls fluorescence signal. As such, betaine was changed from 1 M to 0.8 M and MgCl2
was changed from 4 mM to 6 mM, in accordance with literature, and FIP, BIP, F3 and B3 primers
maintained their standard concentrations. Also, the interference of EvaGreen® in positive and
negative controls was studied by producing four LAMP reactions with 0.1× EvaGreen®, 0.5×
EvaGreen®, 1× EvaGreen® and 1.5× EvaGreen®. These reactions were analyzed in a
fluorimeter indicating a positive vs negative ratio of 0.29, 0.33, 0.49 and 0.51, respectively to the
mentioned concentrations. Finally, to corroborate these data, droplets of these reactions were
placed on top of the produced device and visualized in a fluorescence microscope. After ImageJ
interpretation of the resulting droplets, positive vs negative ratios were 0.51, 0.17, 0.35 and 0.49,
respectively. Intrinsic operation of the fluorescence microscope may explain the discrepancy
between this results and fluorimeter results. However, after gel electrophoresis analysis, DNA
concentration was higher for 1× EvaGreen® reaction when compared to 1.5× EvaGreen®
reaction. This suggests that the highest concentration used produces a fluorescence signal that
does not correspond increased DNA concentration. This would not fit in a real-time LAMP
reaction, since fluorescence signal correspondence to DNA concentration would be necessary,
with the minimal amount of deviation. Thus, 1× EvaGreen® is the chosen concentration for real-
time LAMP reactions.
Alternatively, results for no dielectric devices showed inconclusive impedance measurements
where positive controls could not be distinguished from negative controls. Then, after stability
tests, both impedance and phase plots indicated that 400 nm parylene C devices remained
constant when compared to the 100 nm parylene C devices. Nevertheless, when measuring
positive and negative controls of a LAMP reaction, both devices proved to be inconclusive in
distinguishing them. Finally, 300 nm of Ta2O5 dielectric devices were used for stability tests where
this device presented a stable behavior after being in contact with water for 30 minutes. However,
even after this period, it could not distinguish a positive from a negative control. As such, after
cyclic voltammetry tests, results showed clear differences between all three solution with pH 4
solution producing a hysteresis between -0.15 nA and 0.1 nA, pH 7 solution producing a
SENSING METHODS FOR REAL-TIME LOOP-MEDIATED ISOTHERMAL AMPLIFICATION IN DIGITAL MICROFLUIDIC SYSTEMS
33
hysteresis between -15 nA and 15 nA and pH 11 solution producing a hysteresis between -125
nA and -125 nA.
To pursuit real-time LAMP in a DMF system by fluorescence methods, it would be necessary to
complete the produced device. This would be done by adding a top plate with an Indium-Tin-
Oxide layer and another Teflon® layer with openings overlapping inlet/outlet pad locations, for
sample insertion/removal with micro-pipette. To conclude, fiber optics would be added on each
side of the device pointed to the mixing pad, where one radiates the excitation wavelength of
EvaGreen® fluorophore and another has filter to only let through emitted wavelength of
EvaGreen®. Measurements would be performed throughout the LAMP reaction and would be
accomplished by a phototransistor coupled with this DMF device. With the device completed and
the fluorescence of LAMP optimized, only a real-time LAMP study would be necessary.
According to literature, a LAMP positive control has a pH of 6 and a negative control has a pH
of 8.8. So, if Ta2O5 dielectric can distinguish commercial solution with different pH, then it could
distinguish a LAMP’s positive and negative control. If this situation was verified, instead of simply
using a constant voltage for droplet movement in a DMF system, it would also be necessary to
apply a scanning voltage for a cyclic voltammetry. To solve this, chromium interdigitated
electrodes could be deposited in the top plate, allowing droplet movement and measurement
separately. In alternative, chromium interdigitated electrodes could be deposited in the bottom
plate, using to operation modes: one for measurement and another for droplet movement.
Furthermore, a study should be performed in order to understand if the setback in impedance
measurements was in the LAMP reaction itself or in EIS sensitivity for this reaction. For this,
impedance and phase should be analyzed for 300 nm Ta2O5 devices using commercial solutions
with pH 4, 7 and 10. If these solutions are distinguished, it is likely that LAMP reagents and
products (ions, enzymes, DNA) are masking the EIS measurements. However, if these solutions
cannot be distinguished, it is likely that EIS sensitivity for these reactions is inappropriate for the
intended real-time measurements.
Finally, since impedance and phase probes were severely damaged during this thesis course, no
error bars are presented, at any point, in this manuscript. To solve this, three replicates of each
experience should be performed, and error bars should be added for each experience made.
SENSING METHODS FOR REAL-TIME LOOP-MEDIATED ISOTHERMAL AMPLIFICATION IN DIGITAL MICROFLUIDIC SYSTEMS
34
References
[1] Agarwal, A. (2013). Digital Microfluidics: Techniques, Their Applications and Advantages.
Journal of Bioengineering & Biomedical Science, 03(03), 1–6.
[2] Sista, R., Hua, Z., Thwar, P., Sudarsan, A., Srinivasan, V., Eckhardt, A., & Pamula, V. (2008).
Development of a digital microfluidic platform for point of care testing. Lab on a Chip, 8(12),
2091–2104.
[3] Choi, K., Ng, A. H. C., Fobel, R., & Wheeler, A. R. (2012). Digital Microfluidics. Annual Review
of Analytical Chemistry, 5(1), 413–440.
[4] Garibyan, L., & Avashia, N. (2013). Polymerase chain reaction. Journal of Investigative
Dermatology, 133(3), 1–4.
[5] Notomi, T., Okayama, H., Masubuchi, H., Yonekawa, T., Watanabe, K., Amino, N., & Hase,
T. (2000). Loop-mediated isothermal amplification of DNA. Nucleic Acids Research, 28(12),
E63.
[6] Coelho, B., Veigas, B., Águas, H., Fortunato, E., Martins, R., Baptista, P., & Igreja, R. (2017).
A Digital Microfluidics Platform for Loop-Mediated Isothermal Amplification Detection.
Sensors, 17(11), 2616.
[7] Wan, L., Chen, T., Gao, J., Dong, C., Wong, A. H. H., Jia, Y., & Martins, R. P. (2017). A digital
microfluidic system for loop-mediated isothermal amplification and sequence specific
pathogen detection. Scientific Reports, 7(1), 1–11.
[8] Teh, S. Y., Lin, R., Hung, L. H., & Lee, A. P. (2008). Droplet microfluidics. Lab on a Chip,
8(2), 198–220.
[9] Pollack, MG. [PhD thesis]. (2001). Electrowetting-based microactuation of droplets for digital
microfluidics. Duke University.
[10] Miller, E. M., & Wheeler, A. R. (2009). Digital bioanalysis. Analytical and Bioanalytical
Chemistry, 393(2), 419–426.
[11] Jebrail, M. J., & Wheeler, A. R. (2010). Let’s get digital: Digitizing chemical biology with
microfluidics. Current Opinion in Chemical Biology, 14(5), 574–581.
[12] Cho, S. K., Moon, H., & Kim, C. (2003). Creating, Transporting, Cutting and Merging Liquid
Droplets. Electrowetting-Based Actuation for Digital Microfluidic Circuits, 12(1), 70–80.
[13] Gascoyne, P. R. C., Vykoukal, J. V., Schwartz, J. A., Anderson, T. J., Vykoukal, D. M.,
Current, K. W., & Andrews, C. (2004). Dielectrophoresis-based programmable fluidic
processors. Lab on a Chip, 4(4), 299–309.
[14] Darhuber, A. A., Valentino, J. P., Davis, J. M., Troian, S. M., & Wagner, S. (2003).
Microfluidic actuation by modulation of surface stresses. Applied Physics Letters, 82(4),
657–659.
SENSING METHODS FOR REAL-TIME LOOP-MEDIATED ISOTHERMAL AMPLIFICATION IN DIGITAL MICROFLUIDIC SYSTEMS
35
[15] Wixforth, A. (2003). Acoustically driven planar microfluidics. Superlattices and
Microstructures, 33(5–6), 389–396.
[16] Lehmann, U., Hadjidj, S., Parashar, V. K., Rida, a., & Gijs, M. a. M. (2005). Two dimensional
magnetic manipulation of microdroplets on a chip - The 13th International Conference on
Solid-State Sensors, Actuators and Microsystems. Digest of Technical Papers.
TRANSDUCERS ’05., 1(figure 1), 77–80.
[17] Niessen, L. (2014). Current state and future perspectives of loop-mediated isothermal
amplification (LAMP)-based diagnosis of filamentous fungi and yeasts. Applied
Microbiology and Biotechnology, 99(2), 553–574.
[18] Mori, Y., Kitao, M., Tomita, N., & Notomi, T. (2004). Real-time turbidimetry of LAMP reaction
for quantifying template DNA. Journal of Biochemical and Biophysical Methods, 59(2),
145–157.
[19] Hunt, T. P., Issadore, D., & Westervelt, R. M. (2007). Integrated circuit/microfluidic chip to
programmably trap and move cells and droplets with dielectrophoresis. Lab on a Chip, 8(1),
81–87.
[20] Abdullah, E., Idris, A., & Saparon, A. (2017). Papr reduction using scs-slm technique in stfbc
mimo-ofdm. ARPN Journal of Engineering and Applied Sciences, 12(10), 3218–3221.
[21] Zhang, X., Li, Q., Jin, X., Jiang, C., Lu, Y., Tavallaie, R., & Gooding, J. J. (2015). Quantitative
determination of target gene with electrical sensor. Scientific Reports, 5(1), 1–7.
[22] Tomita, N., Mori, Y., Kanda, H., & Notomi, T. (2008). Loop-mediated isothermal amplification
(LAMP) of gene sequences and simple visual detection of products. Nature Protocols, 3(5),
877–882.
[23] Drummond, T. G., Hill, M. G., & Barton, J. K. (2003). Electrochemical DNA sensors. Nature
Biotechnology, 21(10), 1192–1199.
[24] Eppendorf, G. (2012). A microvolume measuring system for high precision photometric
detection of nucleic acids and proteins in the Eppendorf BioPhotometer® and Eppendorf
BioSpectrometer®. Eppendorf µCuvetteTM G1.0, 1–10.
[25] Armbrecht, M., Gloe, J., & Goemann, W. (2003). Determination of nucleic acid
concentrations using fluorescent dyes in the Eppendorf BioSpectrometer® fluorescence.
Biotechniques, 22(6), 1170-4.
[26] Navarro, E., Serrano-Heras, G., Castaño, M. J., & Solera, J. (2015). Real-time PCR
detection chemistry. Clinica Chimica Acta, 43(9), 231–250.
[27] Mao, F., Leung, W. Y., & Xin, X. (2007). Characterization of EvaGreen and the implication
of its physicochemical properties for qPCR applications. BMC Biotechnology, 7, 1–16.
SENSING METHODS FOR REAL-TIME LOOP-MEDIATED ISOTHERMAL AMPLIFICATION IN DIGITAL MICROFLUIDIC SYSTEMS
36
[28] Liu, Y.-S., Banada, P. P., Bhattacharya, S., Bhunia, A. K., & Bashir, R. (2008). Electrical
characterization of DNA molecules in solution using impedance measurements. Applied
Physics Letters, 92(14), 143-902.
[29] Kazemi, S. H., Shanehsaz, M., & Ghaemmaghami, M. (2015). Non-Faradaic
electrochemical impedance spectroscopy as a reliable and facile method: Determination of
the potassium ion concentration using a guanine rich aptasensor. Materials Science and
Engineering C, 52, 151–154.
[30] Formisano, N. [PhD thesis]. (2015). A study on the optimisation of electrochemical
impedance spectroscopy biosensors. University of Bath.
[31] Coelho, B. J. [MSc thesis]. (2016). A Digital Microfluidics Platform for Loop-Mediated
Isothermal Amplification of DNA. Universidade Nova de Lisboa.
[32] Fernández-Soto, P., Mvoulouga, P. O., Akue, J. P., Abán, J. L., Santiago, B. V., Sánchez,
M. C., & Muro, A. (2014). Development of a highly sensitive Loop-Mediated Isothermal
Amplification (LAMP) method for the detection of Loa loa. PLoS ONE, 9(4), 1–7.
[33] Vieira, M. G. [MSc thesis]. (2017). Digital Microfluidics for the amplification of DNA with
LAMP technique. Universidade Nova de Lisboa.
[34] Hamburger, J., Abbasi, I., Kariuki, C., Wanjala, A., Mzungu, E., Mungai, P., & King, C. H.
(2013). Evaluation of loop-mediated isothermal amplification suitable for molecular
monitoring of schistosome-infected snails in field laboratories. American Journal of Tropical
Medicine and Hygiene, 88(2), 344–351.
[35] Zhang, H., Zeng, L., Fan, Y., Zhou, Y., Xu, J., & Ma, J. (2014). A Loop-Mediated Isothermal
Amplification Assay for Rapid Detection of Cyprinid Herpesvirus 2 in Gibel Carp. Scientific
World Journal, 14(1), 413-715
[36] Zhao, H. B., Yin, G. Y., Zhao, G. P., Huang, A. H., Wang, J. H., Yang, S. F., & Kang, W. J.
(2014). Development of Loop-Mediated Isothermal Amplification (LAMP) for Universal
Detection of Enteroviruses. Indian Journal of Microbiology, 54(1), 80–86.
[37] Li, C. (2011). One-step ultrasensitive detection of microRNAs with loop-mediated isothermal
amplification (LAMP). The Royal Society of Chemistry, 22(4), 104-198.
[38] Meng, E., Li, P. Y., & Tai, Y. C. (2008). Plasma removal of Parylene C. Journal of
Micromechanics and Microengineering, 18(4).
[39] Alexandre, V., & Rodrigues, V. [MSc thesis]. (2014). Digital Microfluidic devices: the role of
the dielectric layer. Universidade Nova de Lisboa. 34(1), 92-102.
[40] Veigas, B., Branquinho, R., Pinto, J. V., Wojcik, P. J., Martins, R., Fortunato, E., & Baptista,
P. V. (2014). Ion sensing (EIS) real-time quantitative monitorization of isothermal DNA
amplification. Biosensors and Bioelectronics, 52(1), 50–55.
SENSING METHODS FOR REAL-TIME LOOP-MEDIATED ISOTHERMAL AMPLIFICATION IN DIGITAL MICROFLUIDIC SYSTEMS
37
[41] Wan, L., Chen, T., Gao, J., Dong, C., Wong, A. H. H., Jia, Y., & Martins, R. P. (2017). A
digital microfluidic system for loop-mediated isothermal amplification and sequence specific
pathogen detection. Scientific Reports, 7(1), 1–11.
[42] Manjakkal, L., Zaraska, K., Cvejin, K., Kulawik, J., & Szwagierczak, D. (2016).
Potentiometric RuO2- Ta2O5pH sensors fabricated using thick film and LTCC technologies.
Talanta, 147, 233–240.
[43] Wan, L., Chen, T., Gao, J., Dong, C., Wong, A. H. H., Jia, Y., & Martins, R. P. (2017). A
digital microfluidic system for loop-mediated isothermal amplification and sequence specific
pathogen detection. Scientific Reports, 7(1), 1–11.
[44] Chang, C-M., Chang, W-H., Wang, C-H., Wang, J-H., & Mai, J. (2013). Nucleic acid
amplification using microfluidic systems. Lab Chip, 13(7),1225-1242.
[45] Mullis, K., Faloona, F., Scharf, S., Saiki, R., Horn, G., & Erlich, H. (1986). Specific Enzymatic
Amplification of DNA In Vitro: The Polymerase Chain Reaction. Cold Spring Harb Symp
Quant Biol, 51(1),263-273.
[46] Nagamine, K., Hase, T., Notomi, T. (2002) Accelerated reaction by loop-mediated
isothermal amplification using loop primers. Mol Cell Probes, 16(3):223-229.
[47] Kumar, Y., Bansal, S., & Jaiswal, P. (2017). Loop-Mediated Isothermal Amplification
(LAMP): A Rapid and Sensitive Tool for Quality Assessment of Meat Products.
Comprehensive Reviews in Food Science and Food Safety, 16(6), 1359–1378.
[48] Wang, G., Shang, Y., Wang, Y., Tian, H., & Liu, X. (2013). Comparison of a loop-mediated
isothermal amplification for orf virus with quantitative real-time PCR. Virology Journal, 10,
1–8.
[49] Zelman, B. W., Baral, R., Zarlinda, I., Coutrier, F. N., Sanders, K. C., Cotter, C., & Hsiang,
M. S. (2018). Costs and cost-effectiveness of malaria reactive case detection using loop-
mediated isothermal amplification compared to microscopy in the low transmission setting
of Aceh Province, Indonesia. Malaria Journal, 17(1), 1–12.
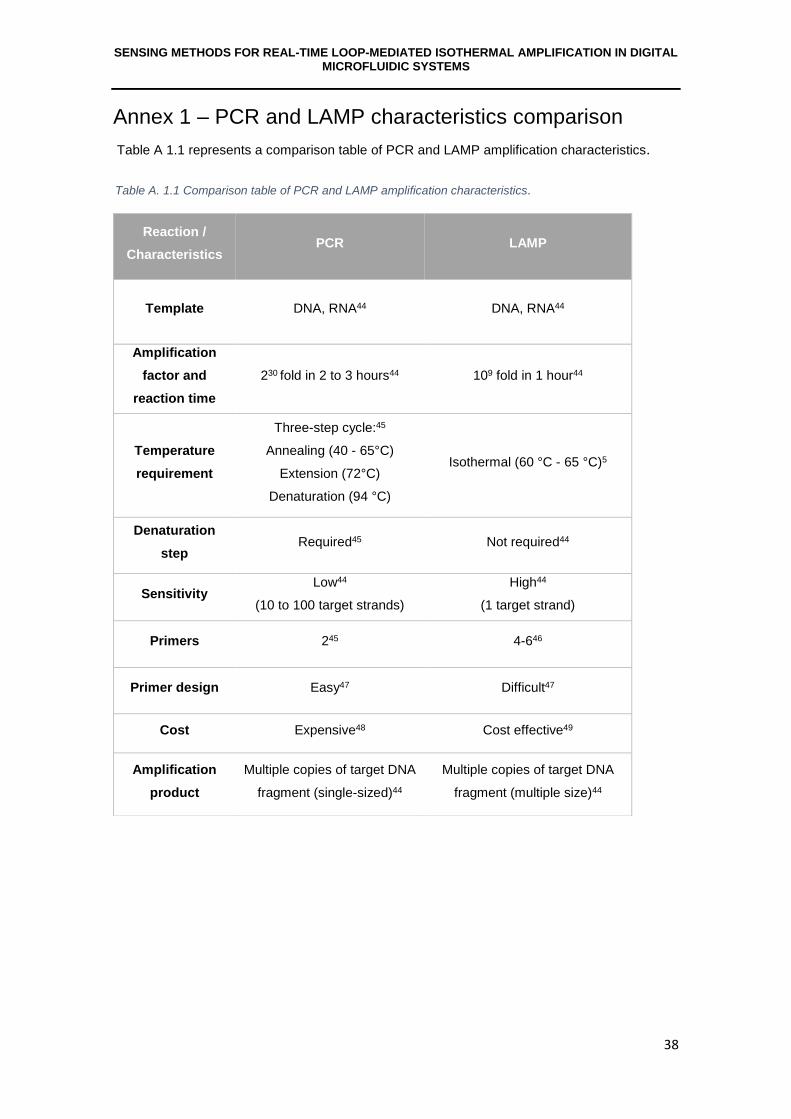
SENSING METHODS FOR REAL-TIME LOOP-MEDIATED ISOTHERMAL AMPLIFICATION IN DIGITAL MICROFLUIDIC SYSTEMS
38
Annex 1 – PCR and LAMP characteristics comparison
Table A 1.1 represents a comparison table of PCR and LAMP amplification characteristics.
Table A. 1.1 Comparison table of PCR and LAMP amplification characteristics.
Reaction /
Characteristics PCR LAMP
Template DNA, RNA44 DNA, RNA44
Amplification
factor and
reaction time
230 fold in 2 to 3 hours44
109 fold in 1 hour44
Temperature
requirement
Three-step cycle:45
Annealing (40 - 65°C)
Extension (72°C)
Denaturation (94 °C)
Isothermal (60 °C - 65 °C)5
Denaturation
step Required45 Not required44
Sensitivity Low44
(10 to 100 target strands)
High44
(1 target strand)
Primers 245 4-646
Primer design Easy47 Difficult47
Cost Expensive48 Cost effective49
Amplification
product
Multiple copies of target DNA
fragment (single-sized)44
Multiple copies of target DNA
fragment (multiple size)44
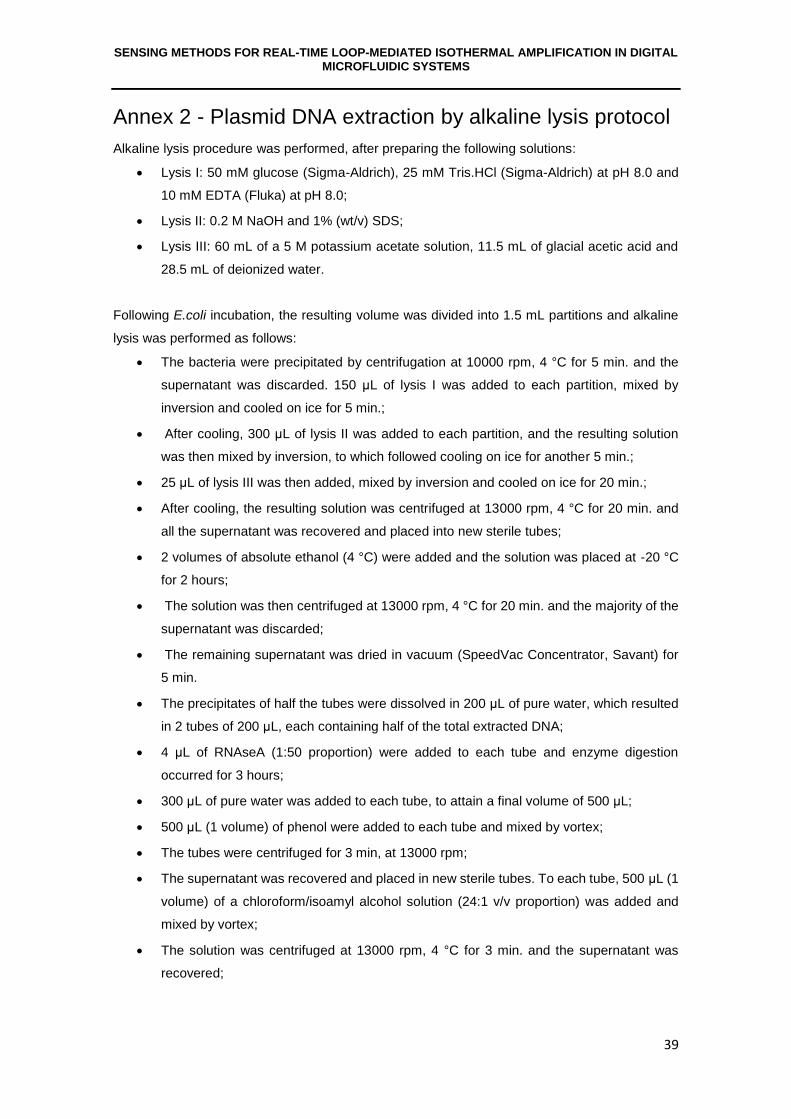
SENSING METHODS FOR REAL-TIME LOOP-MEDIATED ISOTHERMAL AMPLIFICATION IN DIGITAL MICROFLUIDIC SYSTEMS
39
Annex 2 - Plasmid DNA extraction by alkaline lysis protocol
Alkaline lysis procedure was performed, after preparing the following solutions:
• Lysis I: 50 mM glucose (Sigma-Aldrich), 25 mM Tris.HCl (Sigma-Aldrich) at pH 8.0 and
10 mM EDTA (Fluka) at pH 8.0;
• Lysis II: 0.2 M NaOH and 1% (wt/v) SDS;
• Lysis III: 60 mL of a 5 M potassium acetate solution, 11.5 mL of glacial acetic acid and
28.5 mL of deionized water.
Following E.coli incubation, the resulting volume was divided into 1.5 mL partitions and alkaline
lysis was performed as follows:
• The bacteria were precipitated by centrifugation at 10000 rpm, 4 °C for 5 min. and the
supernatant was discarded. 150 μL of lysis I was added to each partition, mixed by
inversion and cooled on ice for 5 min.;
• After cooling, 300 μL of lysis II was added to each partition, and the resulting solution
was then mixed by inversion, to which followed cooling on ice for another 5 min.;
• 25 μL of lysis III was then added, mixed by inversion and cooled on ice for 20 min.;
• After cooling, the resulting solution was centrifuged at 13000 rpm, 4 °C for 20 min. and
all the supernatant was recovered and placed into new sterile tubes;
• 2 volumes of absolute ethanol (4 °C) were added and the solution was placed at -20 °C
for 2 hours;
• The solution was then centrifuged at 13000 rpm, 4 °C for 20 min. and the majority of the
supernatant was discarded;
• The remaining supernatant was dried in vacuum (SpeedVac Concentrator, Savant) for
5 min.
• The precipitates of half the tubes were dissolved in 200 μL of pure water, which resulted
in 2 tubes of 200 μL, each containing half of the total extracted DNA;
• 4 μL of RNAseA (1:50 proportion) were added to each tube and enzyme digestion
occurred for 3 hours;
• 300 μL of pure water was added to each tube, to attain a final volume of 500 μL;
• 500 μL (1 volume) of phenol were added to each tube and mixed by vortex;
• The tubes were centrifuged for 3 min, at 13000 rpm;
• The supernatant was recovered and placed in new sterile tubes. To each tube, 500 μL (1
volume) of a chloroform/isoamyl alcohol solution (24:1 v/v proportion) was added and
mixed by vortex;
• The solution was centrifuged at 13000 rpm, 4 °C for 3 min. and the supernatant was
recovered;

SENSING METHODS FOR REAL-TIME LOOP-MEDIATED ISOTHERMAL AMPLIFICATION IN DIGITAL MICROFLUIDIC SYSTEMS
40
• 1 mL (2 volumes) of absolute ethanol (4 °C) was added to each tube and the mix was
cooled at 20 °C for 2 hours;
• The solution was centrifuged at 13000 rpm, 4 °C for 3 min and stored at -20 °C overnight
before using.
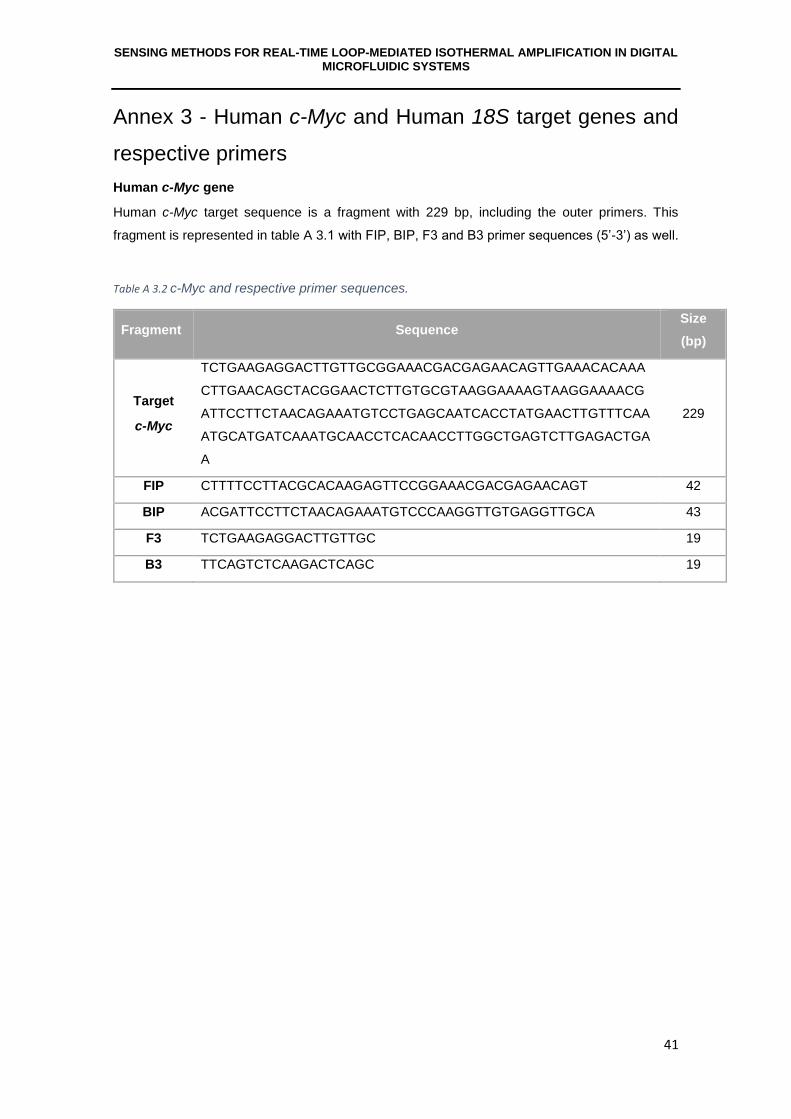
SENSING METHODS FOR REAL-TIME LOOP-MEDIATED ISOTHERMAL AMPLIFICATION IN DIGITAL MICROFLUIDIC SYSTEMS
41
Annex 3 - Human c-Myc and Human 18S target genes and
respective primers
Human c-Myc gene
Human c-Myc target sequence is a fragment with 229 bp, including the outer primers. This
fragment is represented in table A 3.1 with FIP, BIP, F3 and B3 primer sequences (5’-3’) as well.
Table A 3.2 c-Myc and respective primer sequences.
Fragment Sequence Size
(bp)
Target
c-Myc
TCTGAAGAGGACTTGTTGCGGAAACGACGAGAACAGTTGAAACACAAA
CTTGAACAGCTACGGAACTCTTGTGCGTAAGGAAAAGTAAGGAAAACG
ATTCCTTCTAACAGAAATGTCCTGAGCAATCACCTATGAACTTGTTTCAA
ATGCATGATCAAATGCAACCTCACAACCTTGGCTGAGTCTTGAGACTGA
A
229
FIP CTTTTCCTTACGCACAAGAGTTCCGGAAACGACGAGAACAGT 42
BIP ACGATTCCTTCTAACAGAAATGTCCCAAGGTTGTGAGGTTGCA 43
F3 TCTGAAGAGGACTTGTTGC 19
B3 TTCAGTCTCAAGACTCAGC 19
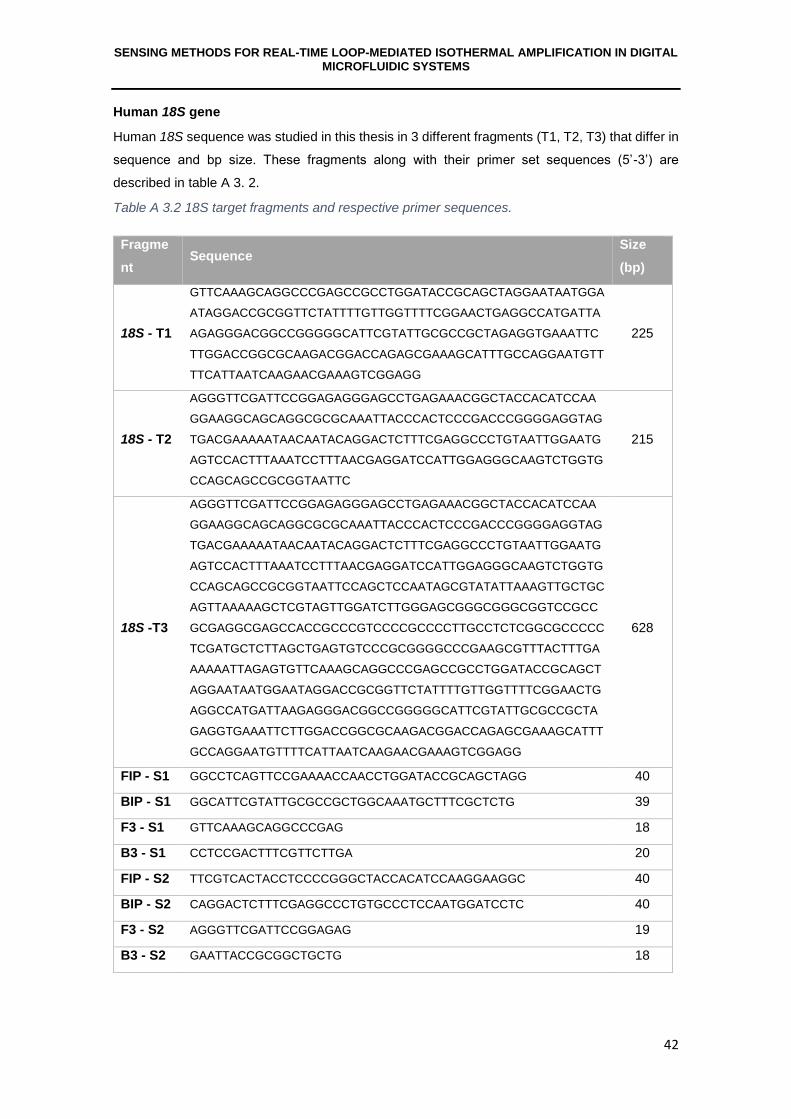
SENSING METHODS FOR REAL-TIME LOOP-MEDIATED ISOTHERMAL AMPLIFICATION IN DIGITAL MICROFLUIDIC SYSTEMS
42
Human 18S gene
Human 18S sequence was studied in this thesis in 3 different fragments (T1, T2, T3) that differ in
sequence and bp size. These fragments along with their primer set sequences (5’-3’) are
described in table A 3. 2.
Table A 3.2 18S target fragments and respective primer sequences.
Fragme
nt Sequence
Size
(bp)
18S - T1
GTTCAAAGCAGGCCCGAGCCGCCTGGATACCGCAGCTAGGAATAATGGA
ATAGGACCGCGGTTCTATTTTGTTGGTTTTCGGAACTGAGGCCATGATTA
AGAGGGACGGCCGGGGGCATTCGTATTGCGCCGCTAGAGGTGAAATTC
TTGGACCGGCGCAAGACGGACCAGAGCGAAAGCATTTGCCAGGAATGTT
TTCATTAATCAAGAACGAAAGTCGGAGG
225
18S - T2
AGGGTTCGATTCCGGAGAGGGAGCCTGAGAAACGGCTACCACATCCAA
GGAAGGCAGCAGGCGCGCAAATTACCCACTCCCGACCCGGGGAGGTAG
TGACGAAAAATAACAATACAGGACTCTTTCGAGGCCCTGTAATTGGAATG
AGTCCACTTTAAATCCTTTAACGAGGATCCATTGGAGGGCAAGTCTGGTG
CCAGCAGCCGCGGTAATTC
215
18S -T3
AGGGTTCGATTCCGGAGAGGGAGCCTGAGAAACGGCTACCACATCCAA
GGAAGGCAGCAGGCGCGCAAATTACCCACTCCCGACCCGGGGAGGTAG
TGACGAAAAATAACAATACAGGACTCTTTCGAGGCCCTGTAATTGGAATG
AGTCCACTTTAAATCCTTTAACGAGGATCCATTGGAGGGCAAGTCTGGTG
CCAGCAGCCGCGGTAATTCCAGCTCCAATAGCGTATATTAAAGTTGCTGC
AGTTAAAAAGCTCGTAGTTGGATCTTGGGAGCGGGCGGGCGGTCCGCC
GCGAGGCGAGCCACCGCCCGTCCCCGCCCCTTGCCTCTCGGCGCCCCC
TCGATGCTCTTAGCTGAGTGTCCCGCGGGGCCCGAAGCGTTTACTTTGA
AAAAATTAGAGTGTTCAAAGCAGGCCCGAGCCGCCTGGATACCGCAGCT
AGGAATAATGGAATAGGACCGCGGTTCTATTTTGTTGGTTTTCGGAACTG
AGGCCATGATTAAGAGGGACGGCCGGGGGCATTCGTATTGCGCCGCTA
GAGGTGAAATTCTTGGACCGGCGCAAGACGGACCAGAGCGAAAGCATTT
GCCAGGAATGTTTTCATTAATCAAGAACGAAAGTCGGAGG
628
FIP - S1 GGCCTCAGTTCCGAAAACCAACCTGGATACCGCAGCTAGG 40
BIP - S1 GGCATTCGTATTGCGCCGCTGGCAAATGCTTTCGCTCTG 39
F3 - S1 GTTCAAAGCAGGCCCGAG 18
B3 - S1 CCTCCGACTTTCGTTCTTGA 20
FIP - S2 TTCGTCACTACCTCCCCGGGCTACCACATCCAAGGAAGGC 40
BIP - S2 CAGGACTCTTTCGAGGCCCTGTGCCCTCCAATGGATCCTC 40
F3 - S2 AGGGTTCGATTCCGGAGAG 19
B3 - S2 GAATTACCGCGGCTGCTG 18
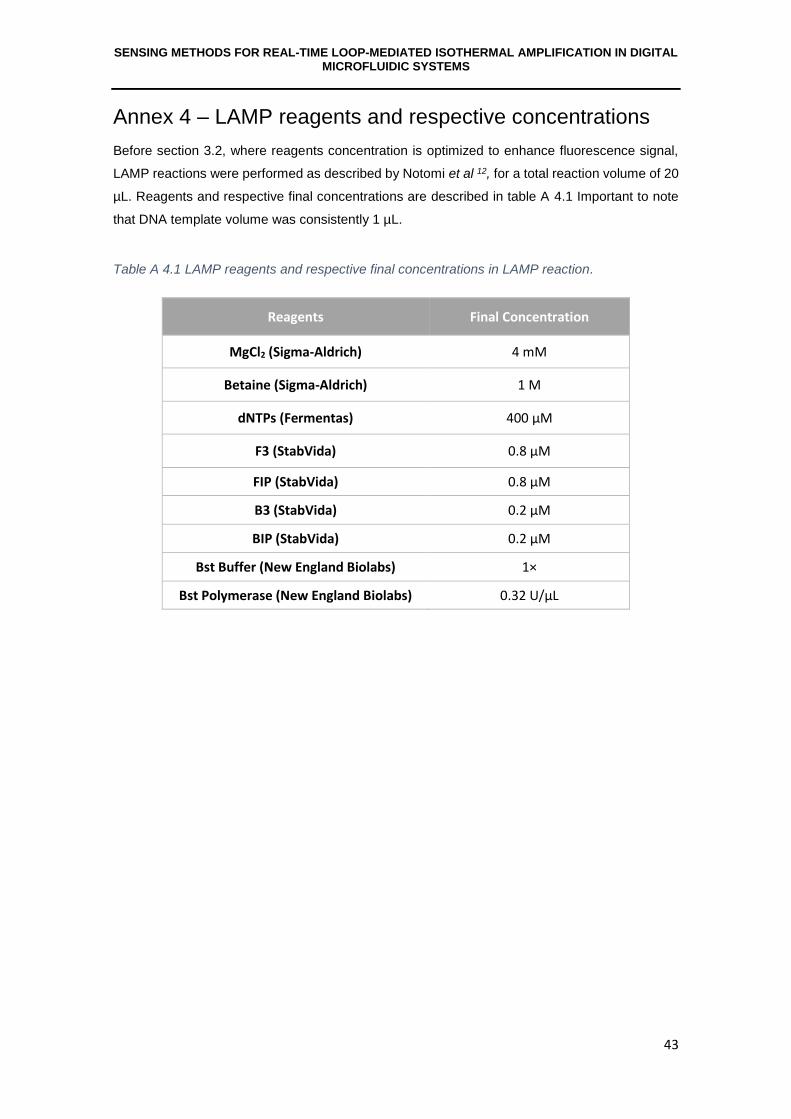
SENSING METHODS FOR REAL-TIME LOOP-MEDIATED ISOTHERMAL AMPLIFICATION IN DIGITAL MICROFLUIDIC SYSTEMS
43
Annex 4 – LAMP reagents and respective concentrations
Before section 3.2, where reagents concentration is optimized to enhance fluorescence signal,
LAMP reactions were performed as described by Notomi et al 12, for a total reaction volume of 20
µL. Reagents and respective final concentrations are described in table A 4.1 Important to note
that DNA template volume was consistently 1 µL.
Table A 4.1 LAMP reagents and respective final concentrations in LAMP reaction.
Reagents Final Concentration
MgCl2 (Sigma-Aldrich) 4 mM
Betaine (Sigma-Aldrich) 1 M
dNTPs (Fermentas) 400 µM
F3 (StabVida) 0.8 µM
FIP (StabVida) 0.8 µM
B3 (StabVida) 0.2 µM
BIP (StabVida) 0.2 µM
Bst Buffer (New England Biolabs) 1×
Bst Polymerase (New England Biolabs) 0.32 U/µL
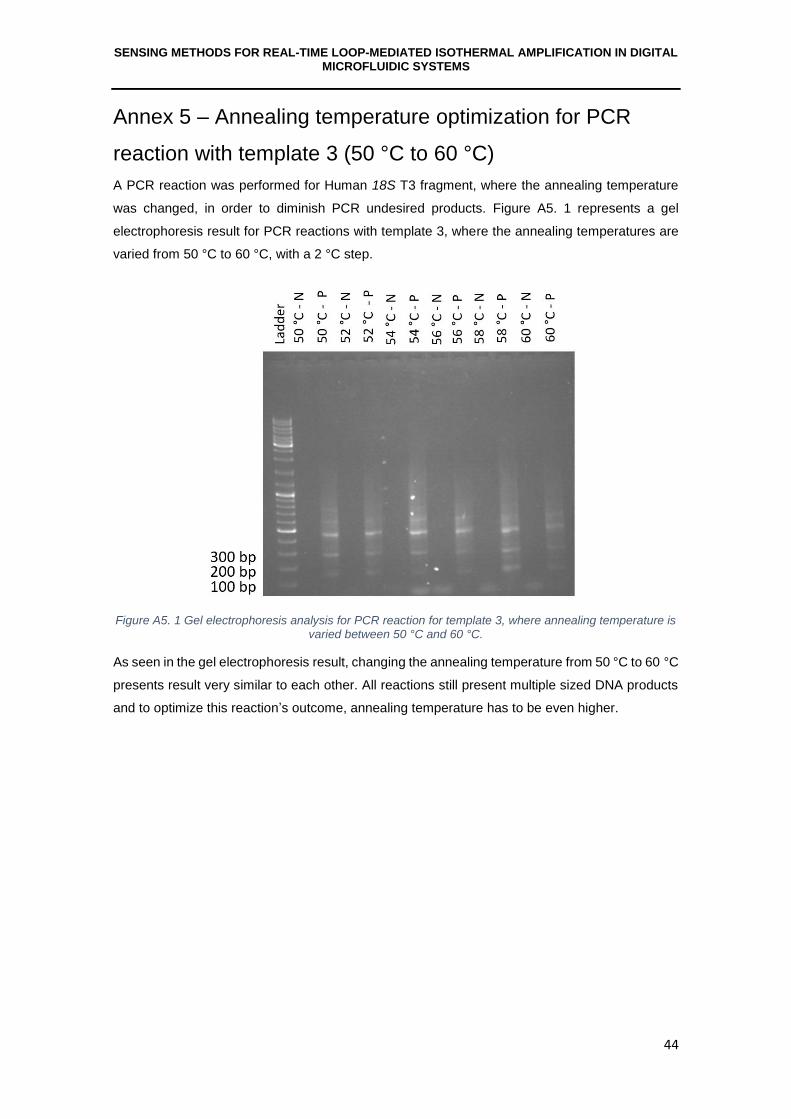
SENSING METHODS FOR REAL-TIME LOOP-MEDIATED ISOTHERMAL AMPLIFICATION IN DIGITAL MICROFLUIDIC SYSTEMS
44
Annex 5 – Annealing temperature optimization for PCR
reaction with template 3 (50 °C to 60 °C)
A PCR reaction was performed for Human 18S T3 fragment, where the annealing temperature
was changed, in order to diminish PCR undesired products. Figure A5. 1 represents a gel
electrophoresis result for PCR reactions with template 3, where the annealing temperatures are
varied from 50 °C to 60 °C, with a 2 °C step.
Figure A5. 1 Gel electrophoresis analysis for PCR reaction for template 3, where annealing temperature is varied between 50 °C and 60 °C.
As seen in the gel electrophoresis result, changing the annealing temperature from 50 °C to 60 °C
presents result very similar to each other. All reactions still present multiple sized DNA products
and to optimize this reaction’s outcome, annealing temperature has to be even higher.
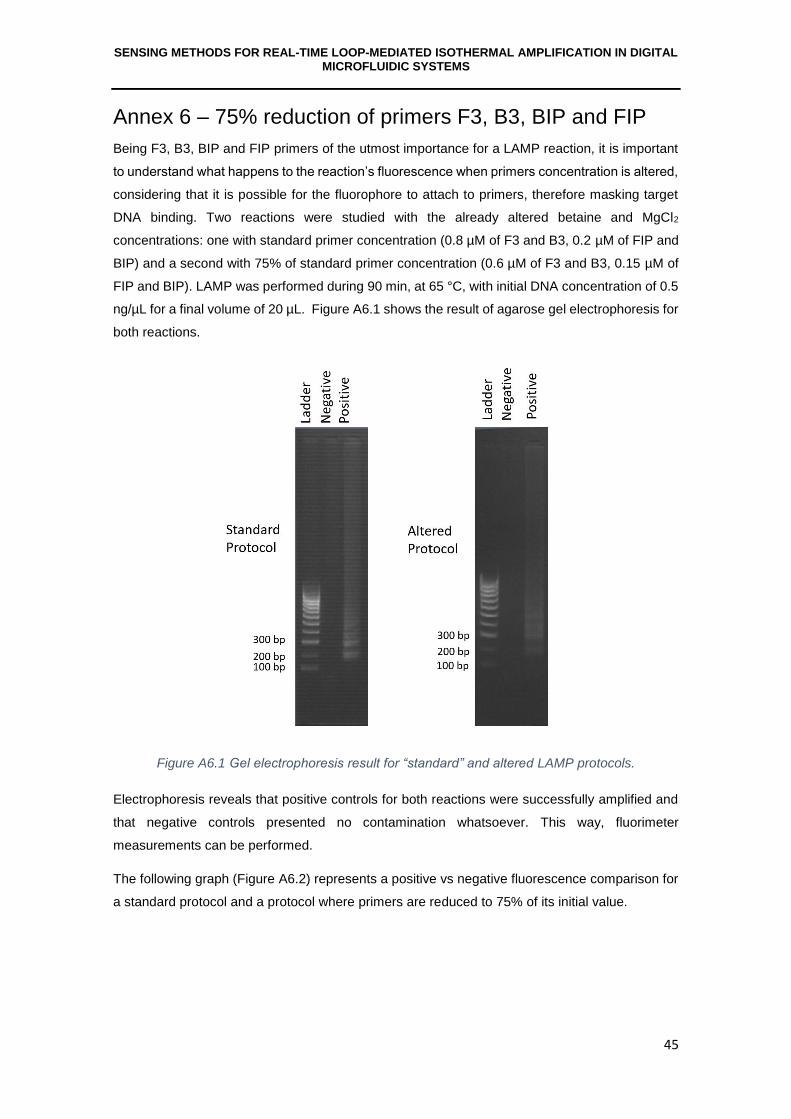
SENSING METHODS FOR REAL-TIME LOOP-MEDIATED ISOTHERMAL AMPLIFICATION IN DIGITAL MICROFLUIDIC SYSTEMS
45
Annex 6 – 75% reduction of primers F3, B3, BIP and FIP
Being F3, B3, BIP and FIP primers of the utmost importance for a LAMP reaction, it is important
to understand what happens to the reaction’s fluorescence when primers concentration is altered,
considering that it is possible for the fluorophore to attach to primers, therefore masking target
DNA binding. Two reactions were studied with the already altered betaine and MgCl2
concentrations: one with standard primer concentration (0.8 µM of F3 and B3, 0.2 µM of FIP and
BIP) and a second with 75% of standard primer concentration (0.6 µM of F3 and B3, 0.15 µM of
FIP and BIP). LAMP was performed during 90 min, at 65 °C, with initial DNA concentration of 0.5
ng/µL for a final volume of 20 µL. Figure A6.1 shows the result of agarose gel electrophoresis for
both reactions.
Figure A6.1 Gel electrophoresis result for “standard” and altered LAMP protocols.
Electrophoresis reveals that positive controls for both reactions were successfully amplified and
that negative controls presented no contamination whatsoever. This way, fluorimeter
measurements can be performed.
The following graph (Figure A6.2) represents a positive vs negative fluorescence comparison for
a standard protocol and a protocol where primers are reduced to 75% of its initial value.
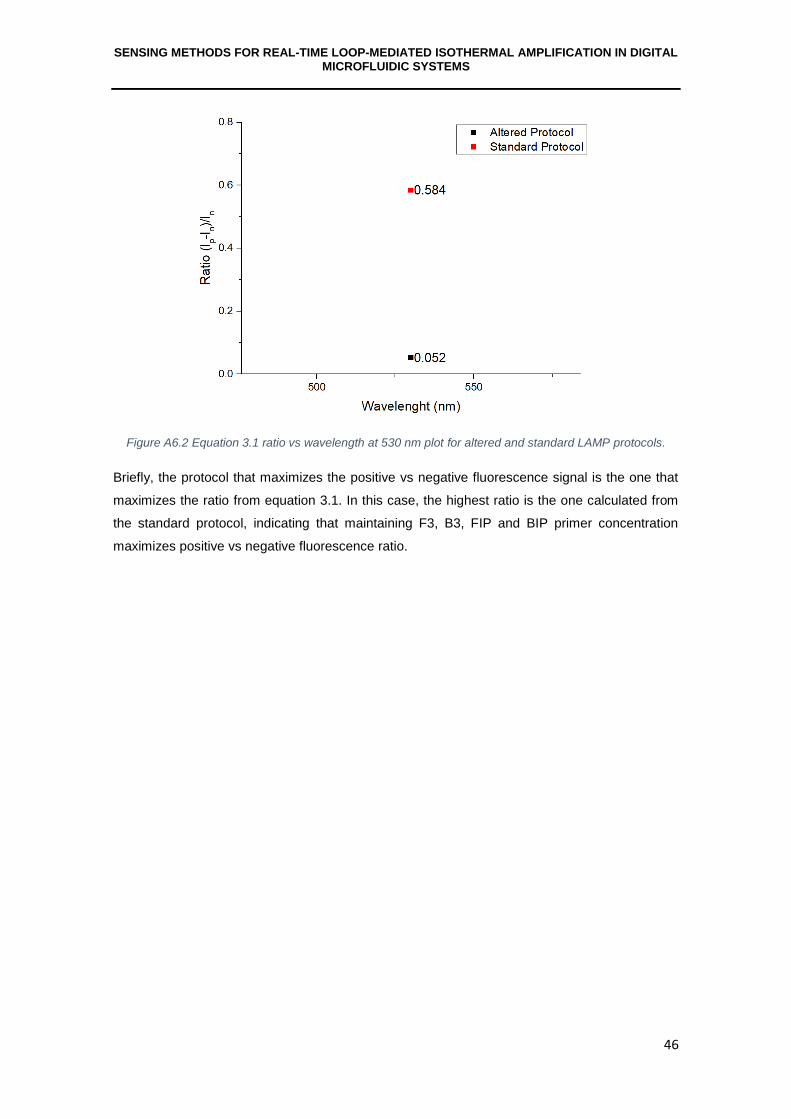
SENSING METHODS FOR REAL-TIME LOOP-MEDIATED ISOTHERMAL AMPLIFICATION IN DIGITAL MICROFLUIDIC SYSTEMS
46
Figure A6.2 Equation 3.1 ratio vs wavelength at 530 nm plot for altered and standard LAMP protocols.
Briefly, the protocol that maximizes the positive vs negative fluorescence signal is the one that
maximizes the ratio from equation 3.1. In this case, the highest ratio is the one calculated from
the standard protocol, indicating that maintaining F3, B3, FIP and BIP primer concentration
maximizes positive vs negative fluorescence ratio.
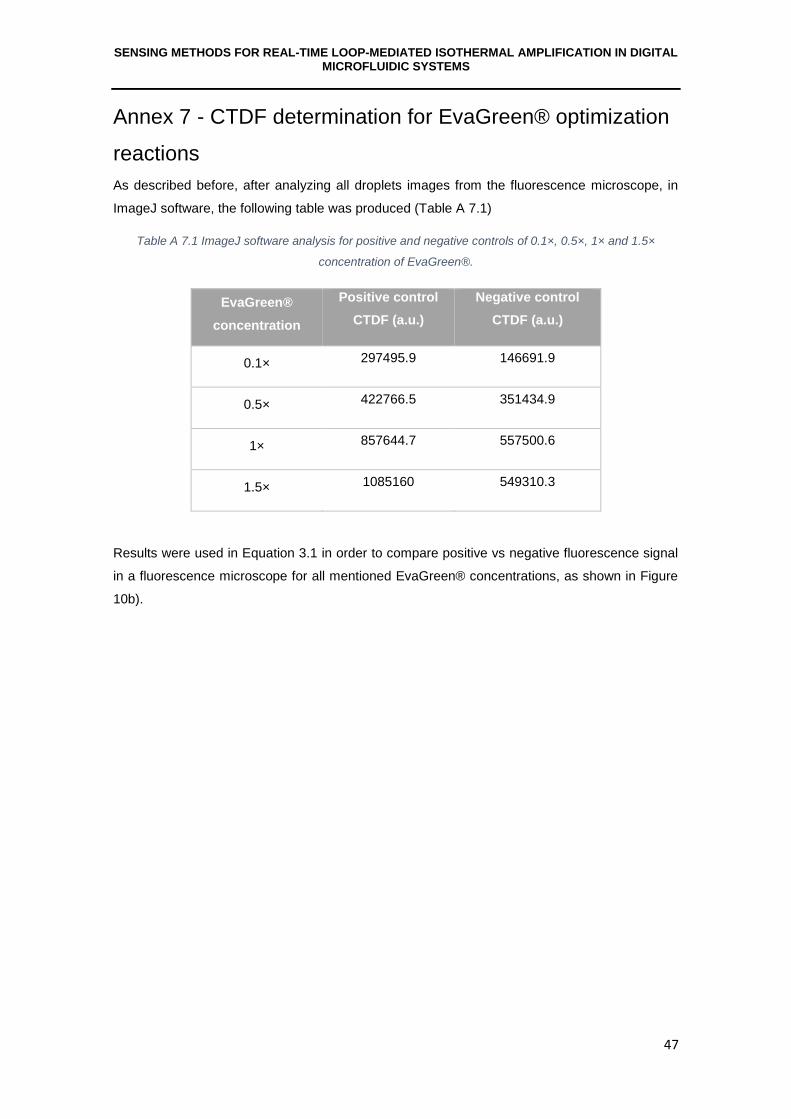
SENSING METHODS FOR REAL-TIME LOOP-MEDIATED ISOTHERMAL AMPLIFICATION IN DIGITAL MICROFLUIDIC SYSTEMS
47
Annex 7 - CTDF determination for EvaGreen® optimization
reactions
As described before, after analyzing all droplets images from the fluorescence microscope, in
ImageJ software, the following table was produced (Table A 7.1)
Table A 7.1 ImageJ software analysis for positive and negative controls of 0.1×, 0.5×, 1× and 1.5×
concentration of EvaGreen®.
EvaGreen®
concentration
Positive control
CTDF (a.u.)
Negative control
CTDF (a.u.)
0.1× 297495.9 146691.9
0.5× 422766.5 351434.9
1× 857644.7 557500.6
1.5× 1085160 549310.3
Results were used in Equation 3.1 in order to compare positive vs negative fluorescence signal
in a fluorescence microscope for all mentioned EvaGreen® concentrations, as shown in Figure
10b).
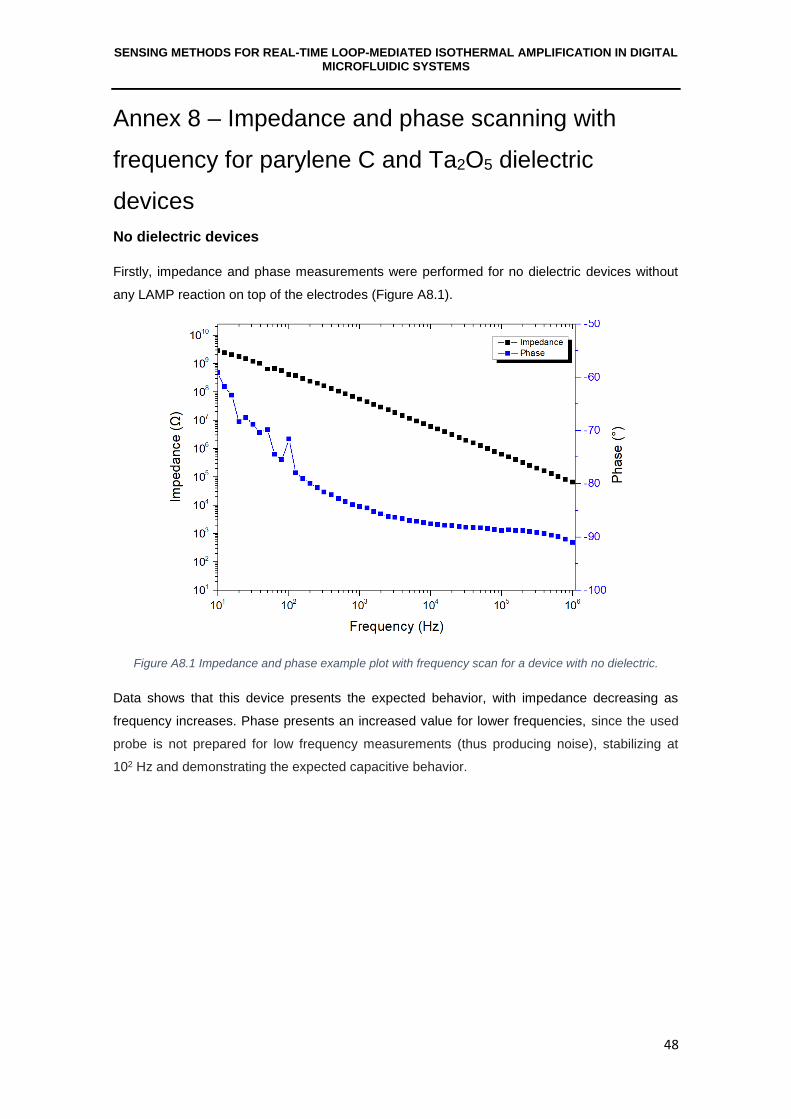
SENSING METHODS FOR REAL-TIME LOOP-MEDIATED ISOTHERMAL AMPLIFICATION IN DIGITAL MICROFLUIDIC SYSTEMS
48
Annex 8 – Impedance and phase scanning with
frequency for parylene C and Ta2O5 dielectric
devices
No dielectric devices
Firstly, impedance and phase measurements were performed for no dielectric devices without
any LAMP reaction on top of the electrodes (Figure A8.1).
Figure A8.1 Impedance and phase example plot with frequency scan for a device with no dielectric.
Data shows that this device presents the expected behavior, with impedance decreasing as
frequency increases. Phase presents an increased value for lower frequencies, since the used
probe is not prepared for low frequency measurements (thus producing noise), stabilizing at
102 Hz and demonstrating the expected capacitive behavior.
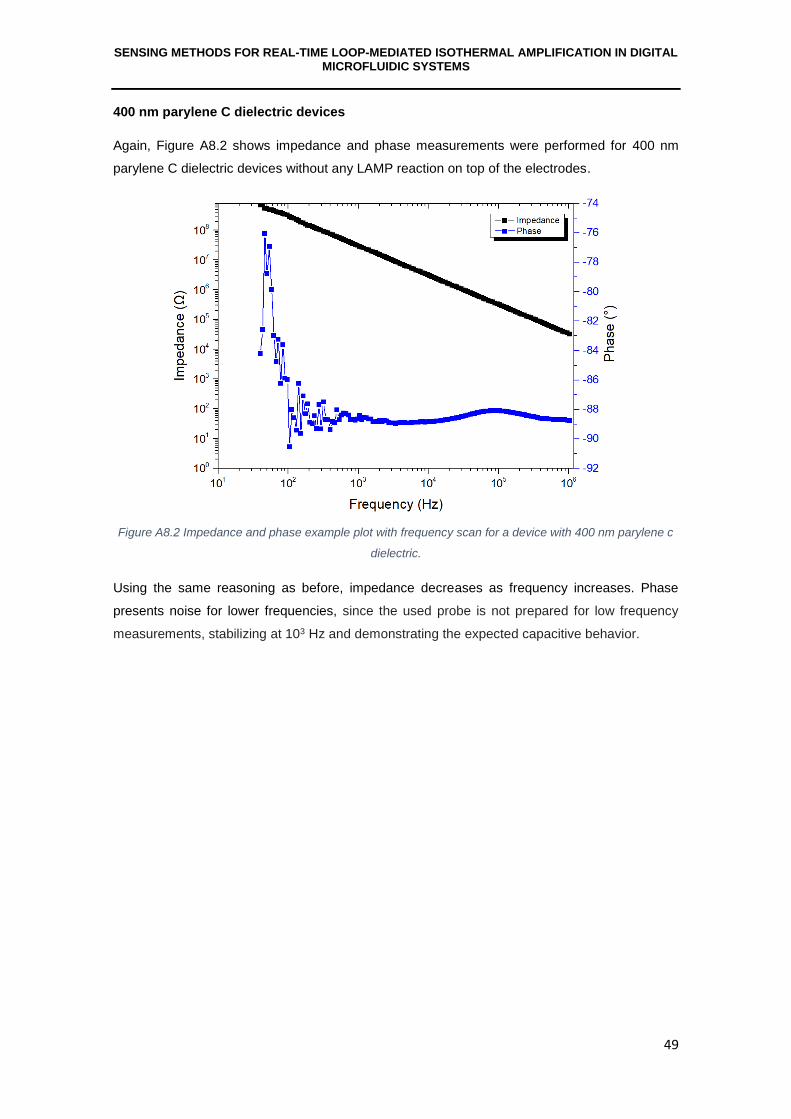
SENSING METHODS FOR REAL-TIME LOOP-MEDIATED ISOTHERMAL AMPLIFICATION IN DIGITAL MICROFLUIDIC SYSTEMS
49
400 nm parylene C dielectric devices
Again, Figure A8.2 shows impedance and phase measurements were performed for 400 nm
parylene C dielectric devices without any LAMP reaction on top of the electrodes.
Figure A8.2 Impedance and phase example plot with frequency scan for a device with 400 nm parylene c
dielectric.
Using the same reasoning as before, impedance decreases as frequency increases. Phase
presents noise for lower frequencies, since the used probe is not prepared for low frequency
measurements, stabilizing at 103 Hz and demonstrating the expected capacitive behavior.
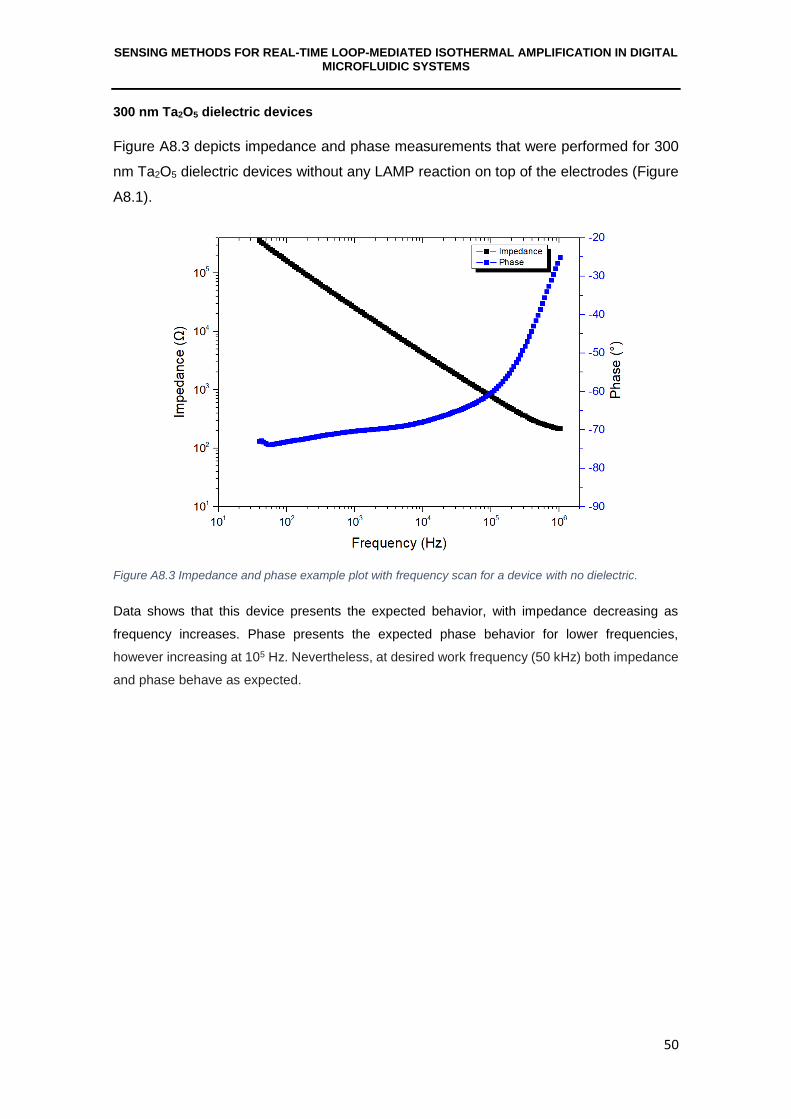
SENSING METHODS FOR REAL-TIME LOOP-MEDIATED ISOTHERMAL AMPLIFICATION IN DIGITAL MICROFLUIDIC SYSTEMS
50
300 nm Ta2O5 dielectric devices
Figure A8.3 depicts impedance and phase measurements that were performed for 300
nm Ta2O5 dielectric devices without any LAMP reaction on top of the electrodes (Figure
A8.1).
Figure A8.3 Impedance and phase example plot with frequency scan for a device with no dielectric.
Data shows that this device presents the expected behavior, with impedance decreasing as
frequency increases. Phase presents the expected phase behavior for lower frequencies,
however increasing at 105 Hz. Nevertheless, at desired work frequency (50 kHz) both impedance
and phase behave as expected.
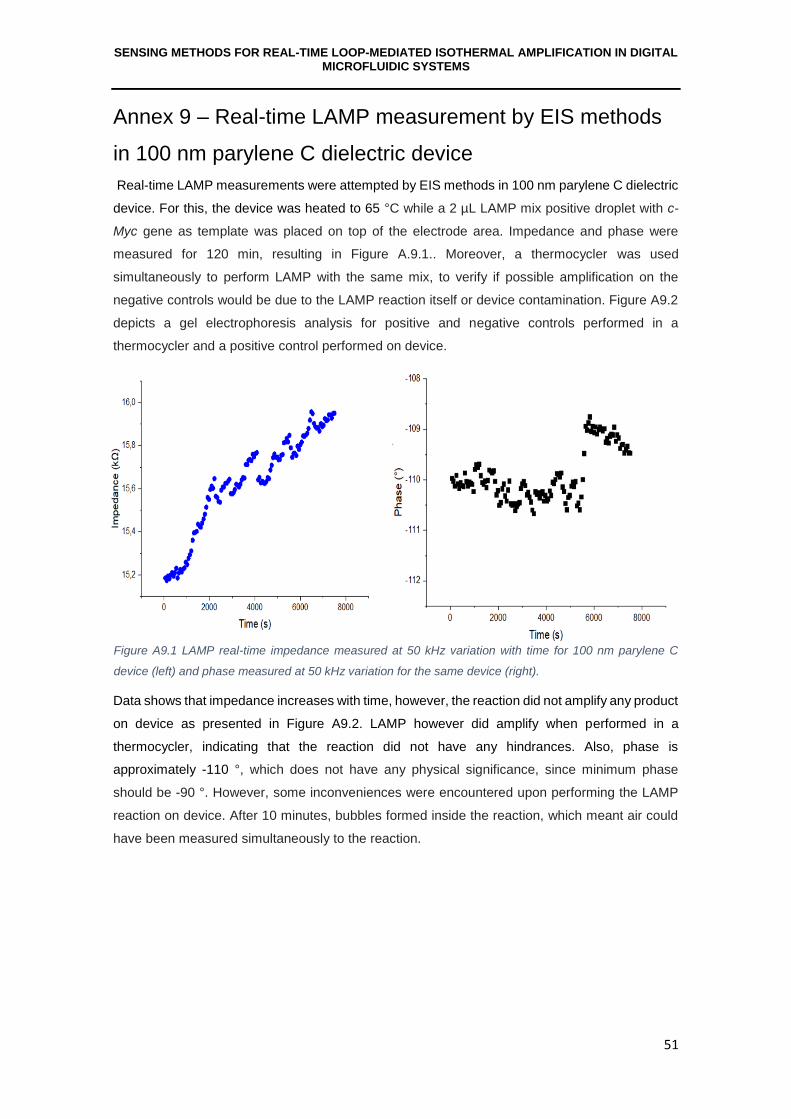
SENSING METHODS FOR REAL-TIME LOOP-MEDIATED ISOTHERMAL AMPLIFICATION IN DIGITAL MICROFLUIDIC SYSTEMS
51
Annex 9 – Real-time LAMP measurement by EIS methods
in 100 nm parylene C dielectric device
Real-time LAMP measurements were attempted by EIS methods in 100 nm parylene C dielectric
device. For this, the device was heated to 65 °C while a 2 µL LAMP mix positive droplet with c-
Myc gene as template was placed on top of the electrode area. Impedance and phase were
measured for 120 min, resulting in Figure A.9.1.. Moreover, a thermocycler was used
simultaneously to perform LAMP with the same mix, to verify if possible amplification on the
negative controls would be due to the LAMP reaction itself or device contamination. Figure A9.2
depicts a gel electrophoresis analysis for positive and negative controls performed in a
thermocycler and a positive control performed on device.
Data shows that impedance increases with time, however, the reaction did not amplify any product
on device as presented in Figure A9.2. LAMP however did amplify when performed in a
thermocycler, indicating that the reaction did not have any hindrances. Also, phase is
approximately -110 °, which does not have any physical significance, since minimum phase
should be -90 °. However, some inconveniences were encountered upon performing the LAMP
reaction on device. After 10 minutes, bubbles formed inside the reaction, which meant air could
have been measured simultaneously to the reaction.
Figure A9.1 LAMP real-time impedance measured at 50 kHz variation with time for 100 nm parylene C
device (left) and phase measured at 50 kHz variation for the same device (right).

SENSING METHODS FOR REAL-TIME LOOP-MEDIATED ISOTHERMAL AMPLIFICATION IN DIGITAL MICROFLUIDIC SYSTEMS
52
Since it was not possible to determine what was being measured, a study was performed to avoid
bubble formation during LAMP. For this, a glass substrate was fused to a PDMS frame. These
frames were fused with PDMS lids with 2 punctures (1 mm wide) and had sealing tape on top of
them to avoid evaporation. Finally, instead of a LAMP, and major sources for bubble formation
due to the presence of a detergent, was used for this study. Chips were heated to 65 °C and
observed for bubble formation.
Two PDMS frame shapes were used, which were rectangular and circular. Multiple frame
dimensions were tested and multiple PDMS cutting techniques were used such as laser cutting
(VLS3.50, Universal Laser Systems), with multiple power and velocity specifications, or scalp
cutting. Also, multiple cleaning techniques were used such IPA baths, acetone baths, brush
scrubbing and clean room paper scrubbing. Figure A9.3 demonstrates an example of this study,
with a rectangular shaped PDMS, with 6 mm × 4 mm × 1 mm dimensions for the inner rectangular,
cut with laser, for 80% power and 75% velocity, cleaned with 15 min IPA bath, 15 min acetone
bath and scrubbed with a brush and clean room paper.
Figure A9.2 Gel electrophoresis analysis for LAMP positive (“P”) and negative (“N”) controls in a
thermocycler and positive control on device.
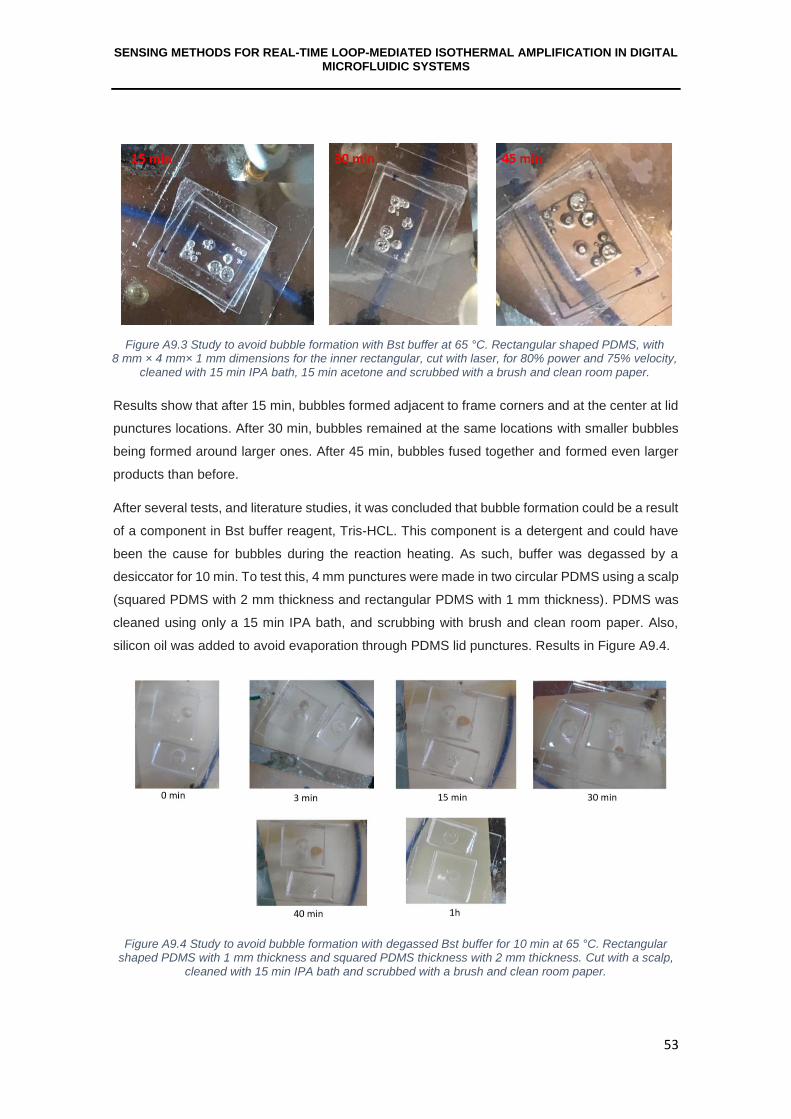
SENSING METHODS FOR REAL-TIME LOOP-MEDIATED ISOTHERMAL AMPLIFICATION IN DIGITAL MICROFLUIDIC SYSTEMS
53
Results show that after 15 min, bubbles formed adjacent to frame corners and at the center at lid
punctures locations. After 30 min, bubbles remained at the same locations with smaller bubbles
being formed around larger ones. After 45 min, bubbles fused together and formed even larger
products than before.
After several tests, and literature studies, it was concluded that bubble formation could be a result
of a component in Bst buffer reagent, Tris-HCL. This component is a detergent and could have
been the cause for bubbles during the reaction heating. As such, buffer was degassed by a
desiccator for 10 min. To test this, 4 mm punctures were made in two circular PDMS using a scalp
(squared PDMS with 2 mm thickness and rectangular PDMS with 1 mm thickness). PDMS was
cleaned using only a 15 min IPA bath, and scrubbing with brush and clean room paper. Also,
silicon oil was added to avoid evaporation through PDMS lid punctures. Results in Figure A9.4.
Figure A9.4 Study to avoid bubble formation with degassed Bst buffer for 10 min at 65 °C. Rectangular shaped PDMS with 1 mm thickness and squared PDMS thickness with 2 mm thickness. Cut with a scalp,
cleaned with 15 min IPA bath and scrubbed with a brush and clean room paper.
Figure A9.3 Study to avoid bubble formation with Bst buffer at 65 °C. Rectangular shaped PDMS, with 8 mm × 4 mm× 1 mm dimensions for the inner rectangular, cut with laser, for 80% power and 75% velocity,
cleaned with 15 min IPA bath, 15 min acetone and scrubbed with a brush and clean room paper.

SENSING METHODS FOR REAL-TIME LOOP-MEDIATED ISOTHERMAL AMPLIFICATION IN DIGITAL MICROFLUIDIC SYSTEMS
54
Results show that after 30 min a bubble was formed, because of oil adding during this process,
however, this bubble ruptured after this picture was taken. After 1h, no bubbles were formed,
and results improved when compared to previous ones. But, since silicon oil had to be added
continuously during this experiment to avoid evaporation, experiments with end-point LAMP
results were pursued.