Embed Size (px)
Citation preview
THE TEXTILE INDUSTRY
K. K. Mohamed “Financial management in textile mills in Kerala ” Thesis. Department of Commerce and Management Studies , University of Calicut, 1997
CHAPTER n
THE TEXTILE INDUSTRY
THE TEXTILE INDUSTRY
The textile industry is one of the oldest manufacturing industries
in the world. It is the oldest and largest single industry in India. Besides
satisfying the basic human need of c l o h g , this industry offers
employment to many d l i o n s and earns much wealth to our exchequer.
In recent years textile industry has emerged as India's biggest foreign
exchange earner. Thus the textile industry occupies a unique position
in the economy of India.
This Chapter is divided in to two sections. Section I gives a short
account of Indian textile industry and Section I1 presents an overview of
the textile industry in Kerala.
SECTION I
The term 'textile' derived from Latin word ?exereS. (to weave)
originally applied to only woven fabrics. has become a general term for
fabrics, yarns and other materials that can be made into fabrics and for
fabrics produced by interlacing or any other construction method l . The
cluster of activities extending from the cotton field through the textile
mill is some times referred to as the "cotton" and cotton textile
industry '. Cotton, wool, and flax fibres were used as textile materials
in ancient Egypt. Silk production is mentioned in Chmese chronicles
. dating to about 3000 B.C. Specimen of dyed fabrics has been found in
Roman ruins of second century B.C. There is evidence of production
of printed textiles in India during the third century B.C. In Sicily, after
the Arab conquest in A.D 827, beautiful fabrics were produced in the
palace workshops at Palenno.
The textile industry has often been considered as a purely
traditional and hence static, rather than a dynamic industry since it is
labour intensive rather than capital intensive. Such an image of the
industry might have been true until the 1950s, due to a long spell of
technological stagnation. However, during the last four and half
decades, increasing wage costs and scarcity of labour in the West have
compelled development of textile indushy. The technoiogical
advancement has been rapid leading to increase in production rates,
reduction in the processing stages and to automation.
Development of Indian Textile Industry
There is reason to believe that cotton, the whte gold, was first
grown and put to use in h&a before anywhere else in the world. Indian
handloom fabrics have a hoary past. The discovery of red dyed cotton
cloth and twine at Mohanjo-Daro has proved beyond doubt that the a~?
of weaving and dyeing was mastered here five thousand years ago.
Centuries ago when Western Europe, the birth place of modem science
and technology, had little industrial production to boast of, India was
famous for the high artistic skill of her craftsman. The artisans who
spun the yam and wove the fabncs there &m possessed extra ordinary
s M s in creating intricate designs and patterns unknown to their
counterparts h other wuntries. So dextrous did the artisans for the
famous "Dacca Muslin" turn out the yam that it was called the web of
the woven wind. In ancient times, lndian cotton textiles were in
universal demand for their beauty and fineness. The calicoes of Calicut
wd muslins of Dacca had earned worldwide reputations 3. Mummies in
E w a n tomb have been found wrapped in muslins of finest quality
even in 2000 B.C. Foreign travellers like Marco Polo in the thirteenth
century md Tavernier in the seventeenth century wrote with enthusiasm
about the supreme excellence of Indian conon fabrics 4. Places like
Dacca and Varanasi in the north and Kanjeevaram and Madurai in the
south were famous for their products and from where the fabrics were
exported to other countries 5. During the Mughal period, India was the
major supplier of textiles - not just fine cloths, but every day wear for
the masses - to the whole of south - east Asia, Iran, the Arabian
countries and the east Ahca 6. The Indian exports consisted of more
than two hundred varieties of cotton textiles, the manufacture of which
was scattered throughout India. Different regions specialised in the
production of certain well-known varieties of cloth. The first place
among the piece goods went to Dacca Muslin of Bengal. S o u . India
specialised in plain and printed cloth to such an extent that Calicut gave
its name to Calicoes 7. After the Industrial Revolution in Europe, cheap
machine-made fabrics from factories in England flooded Indian market
and this almost completely destroyed lndian handlooms.
Development of Textile Milk
The hdian cotton textile mill owes its genesis to some early
British pioneers and entrepreneurs. Factory cotton manufacture in
India, as with industry in general, was introduced by the British in the
wake of political conquest of the sub continent. In the begmmg most
of the mills were spinning mills, spinning coarse y m British traders,
Parsi community, the adventmists among the agricdturists, and money
lending class were the early starters. The earliest beginrung of textile
manuf-e on a factory scale dates back to 1818 when the Fort
Golster Mills was estabshed by Mr. Henry Googer, an English
merchant at Fort Golster, 15 miles away from Calcutta, whch was later
known as Bowreah Cotton Mills Co. Ltd-, '. But it did not turn out to
be a commercial success. In south India, the French Ambassador
General of Pondichery set up a cotton mill known as Blin and Deibrick
~ i 1 1 ~ . A a o t h ~ mill known as Savanna Mill in Pondichery started
working m 1830. The first Indian to start a cotton mill was Mr.
Cowasjee Nanabhoy Davar. He set up a mill in Bombay in 1854 with
an English man as his partner. It was Davar's mill, which laid the
foundation for a strong and growing mill in Bombay. Thus Bombay
took the lead in establishmg a large number of mills since 1854. The
Broach Cotton Mill near Ahmedabad was set up in 1855 1°. Up to 1925
the cotton textile industry of India was predominantly localised in the
city and island of Bombay. But later the industry was decentralised to a
number of other states. In Coimbatore Sir Robert Stanes a European,
started the fmt textile mill in the year 1890. There were only 5 mills in
Coirnbatore till 1930. However, there was an acceleration of industrial
activity from 1930 onwards and between 1930 and 1939, when the
Second World War broke out, 27 spinning mills were established
almost all of them by agriculturists. Now Coimbatore has the largest
concentration of textile mills in the country with 485 textile mills, of
which 463 are spinning mills. Because of the predominance of textile
mills in Coimbatore, tlus city is known popularly as 'Texcity'.
Coimbatore is the largest supplier of yarn to the decentraked =or.
The noteworthy aspect of the mills in Coimbatore is that they attach
greater importance to technological excellence.
Since independence, we have witnessed the m e I I o u s gro'~.th of
Indian Texdle industrq.. A significant highlight of this growth is
modernisation of its old and established facilities and s&ng up of new
mills covering a wider range of areas. Table 2.1 shows the growth of
the mill industry fi-om 1 95 1 to 1 993. The spindleage increked fiom l l
million in 195 1 to 28.09 rmllion in March 1993, rotors increased from
45 thousand in 1989 to 127 thousand in March 1993. In the organised
sector, however, the loomage declined fiom 210 thousand in 1989 to
158 thousand in March 1993. Of 1227 cotton / man-made fibre textile
mds, 188 mills are in public sector, 124 mills are in the co-operative
sector and 9 15 mills are in the private sector.
As can be seen from the Table 2.1 the number of the textile mills
have increased fiom 378 in March 195 1 to 1 142 in March 1993, while
the number of spinning mills and spindles registered an increase
throughout the period, the number of composite d s and the loomage
showed a declining trend.
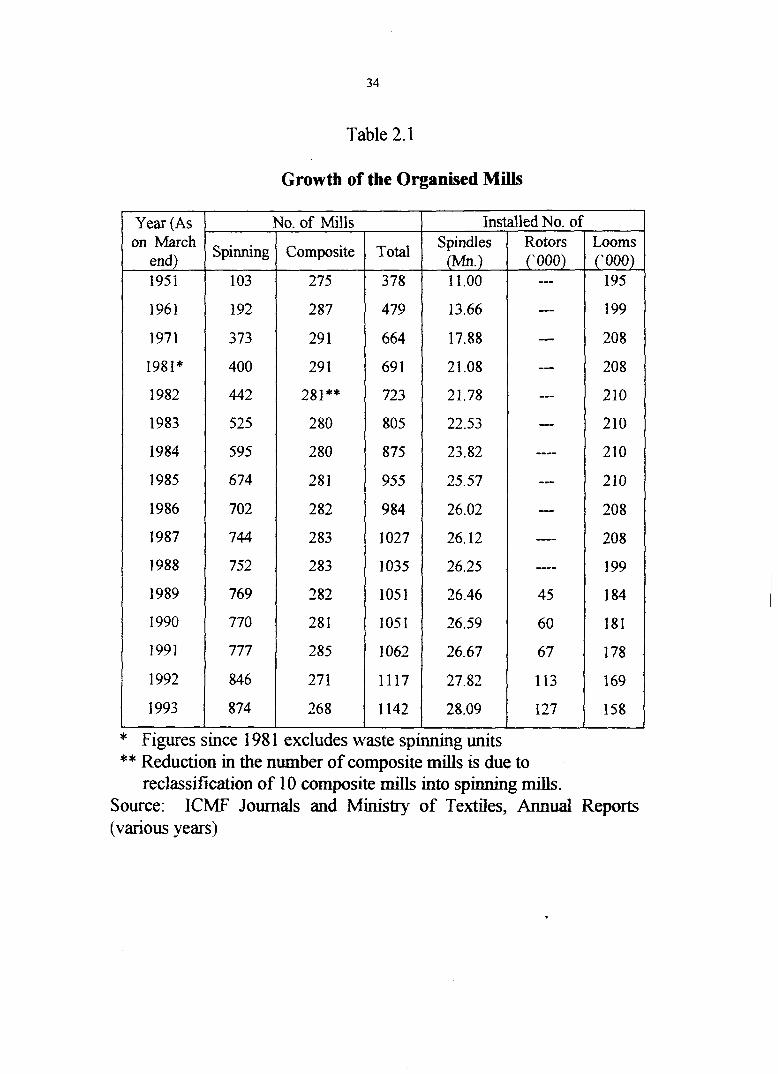
Table 2.1
Growth of the Organised Mills
* Figures since 1 98 1 excludes waste spinning units ** Reduction in the number of composite mills is due to
reclassification of 10 composite mills into spinning mills. Source: ICMF Journals and Ministry of Textiles, Annual Reports (various years)
Year (As on March
end) 195 1
1961
1971
1981*
1982
1983
1984
1985
1986
I987
1988
1989
1990
1991
1992
1993
Looms (' 000)
195
199
208
208
2 10
210
2 10
210
208
208
199
1 84
181
178
169
158
Spindles (Mn.) 1 1 .OO
13.66
17.88
2 1.08
21.78
22.53
23.82
25.57
26.02
26.12
26.25
26.46
26.59
26.67
27.82
28.09
Spinning
103
1 92
373
400
442
525
595
674
702
744
752
769
770
777
846
874
Installed No. of Rotors (' 000)
--- --m
--- --- --- --- ---- --- -- ---- --
45
60
67
113
127
No. of f i l l s
Composite
275
287
29 1
29 1
281**
280
280
28 1
2 82
283
283
2 82
28 1
,385
271
268
Total
3 78
479
664
69 1
723
805
875
955
984
1027
1035
1051
1051
1 062
1117
1142
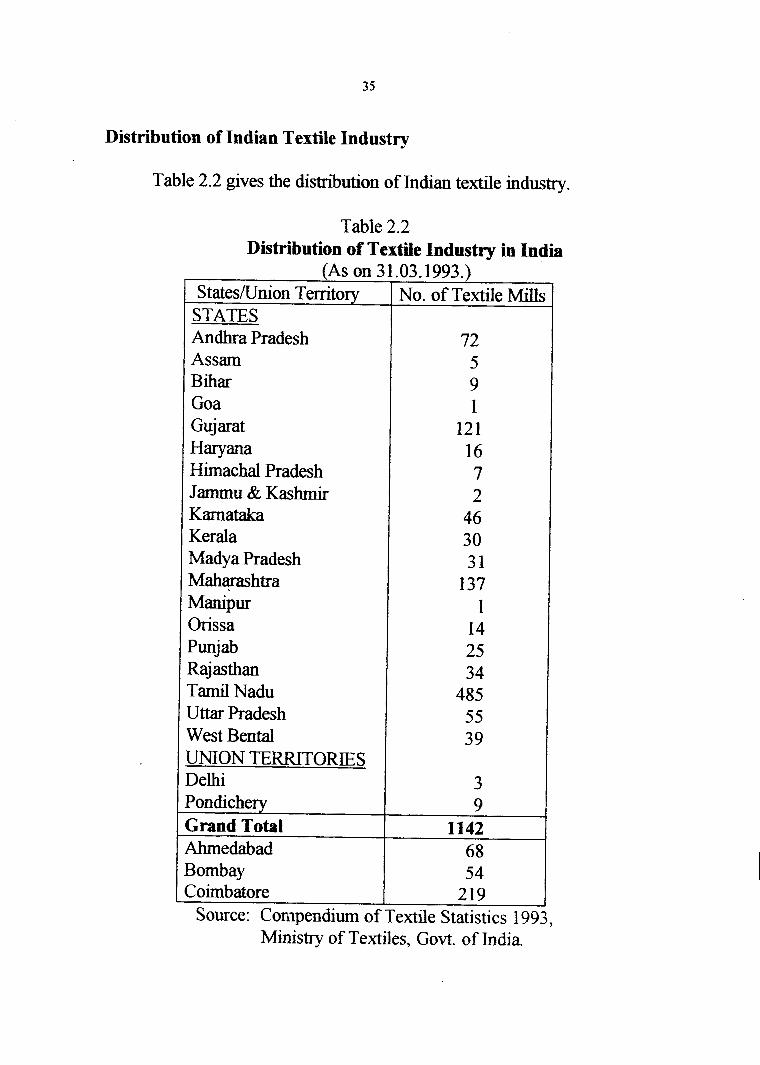
Distribution of Indian Textile Industry
Table 2.2 gives the distribution of Indian textile industry.
Table 2.2 Distribution of Textile Industry in India
(As on S tatesmnion Territory
STATES Andhra Pradesh Assam Bihar Goa Guj arat Hary ana Himachal Pradesh Jammu & Kashrmr Karnataka Kerala Madya Pradesh Mahsashtra Manipur Orissa Punjab Raj asthan Tarnil Nadu Uttar Pradesh West Bental UNION TERRITORIES Delhi
31.03.1993.) No. of Textile Mills
72 5 9 l
121 16 7 2 46 30 3 1
137 l
14 25 34
485 55 39
3 Pondichery Grand Total Ahrnedabad Bombay Coimbatore
9 1142
68 54
219 Source: Conlpendiurn of Textile Statistics 1993,
Ministry of Textiles, Govt. of India.
Though the textile industry is scattered all over the country the
T a d Nadu has the largest number of mills with 485 mills, followed by
Maharashtra and Gujarat with 137 and 121 mills respectively. Among
spinning d s also the Tamil Nadu tops first with 463 mills followed by
Andra Pradesh and Maharashtra with 70 and 62 spinning mllls
respectively. h the case of composite mills, Gujarat has largest number
of such mdls, that is, 87 composite m& followed by Maharashtra and
Tamil Nadu with 75 and 22 mills respectively. Thus our textile mllls
are concentrated in three cities of Coimbatore, Ahrnedabad and
Bombay. There are 21 9 textile d s in Coimbatore alone.
Table 2.3 shows the capacity of spindles, rotors, looms and the
number of workers in different states.
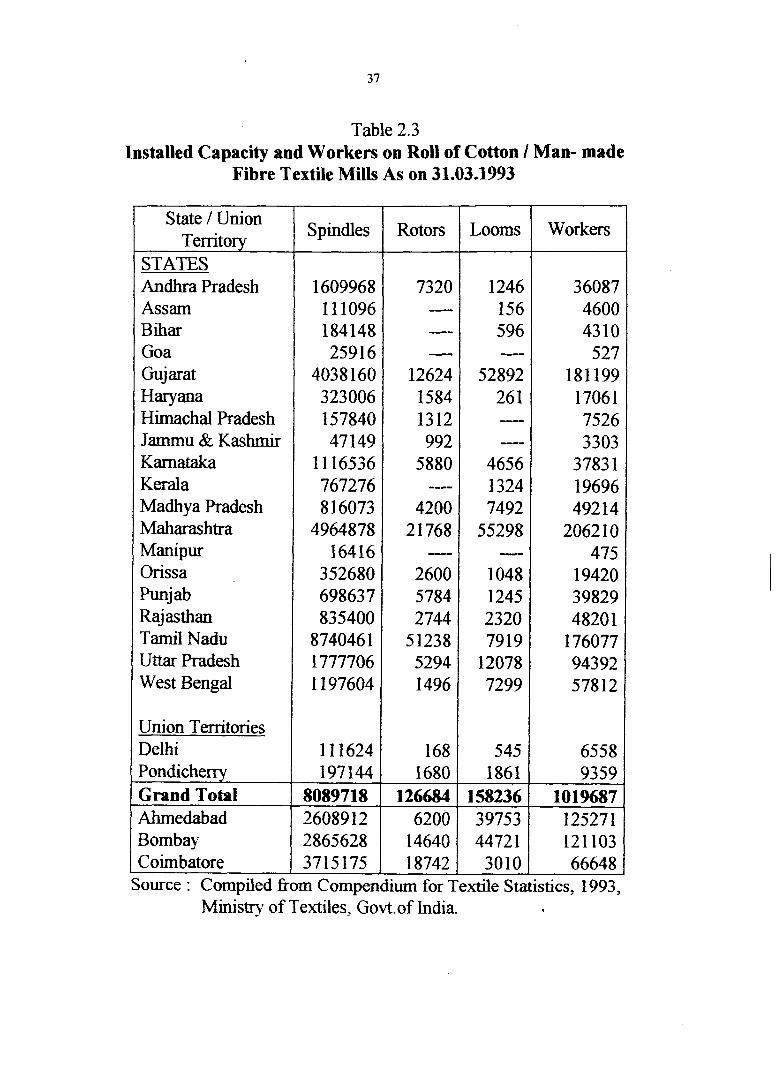
Table 2.3 Installed Capacity and Workers on Roll of Cotton l Man- made
Fibre Textile Mills As on 31.03.1993
State 1 Union Territorv 1 s p d e s
J I
STATES Andhra Pradesh Assam Bihar Goa Guj arat Haryana Himachal Pradesh Jamrnu & Kashmir Karnataka Kerala Madhya Pradesh Maharashtra Manipur Onssa Punjab Raj asthan Tarnil Nadu Uttar Pradesh West Bengal
Rotors Looms Workers
Union Territories / 1116241 1 6 8 5451 65581 Ponhche 197144 Grand Total 8089718
26089 12
Source : Compiled fkom Compendium for Textile Statistics, 1993, Ministry of Textiles, Govt.of India.
Bombay Coimbatore
2865628 3715175
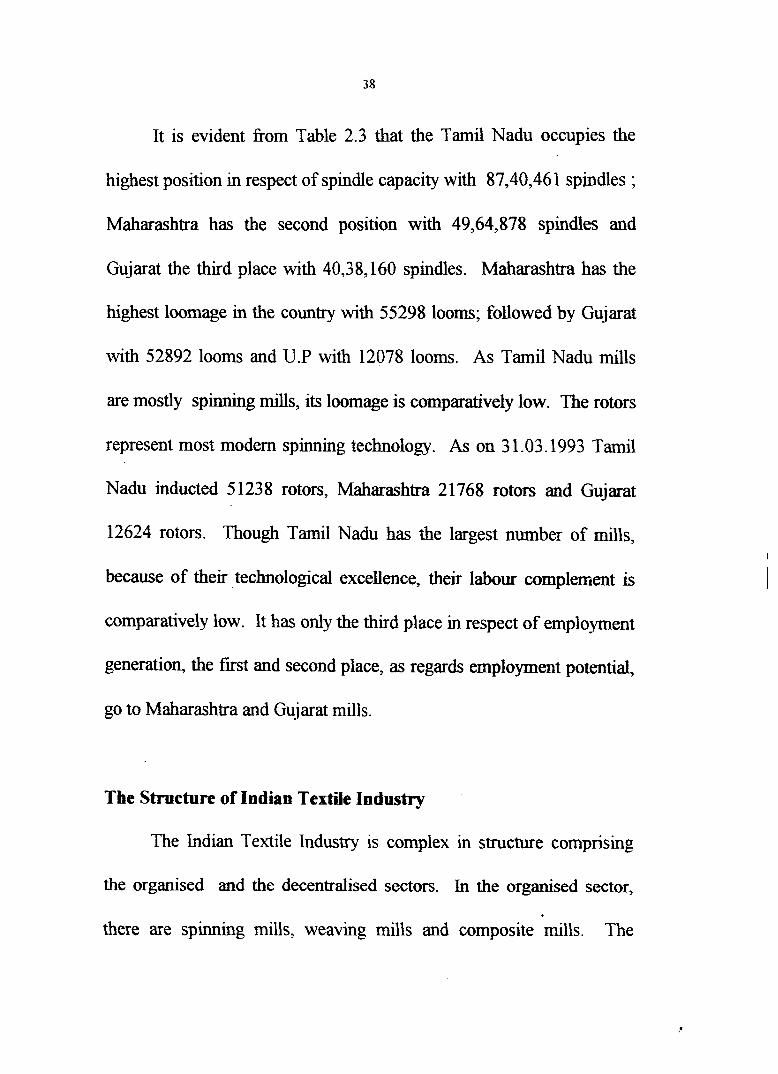
It is evident fiom Table 2.3 that the Tamil Nadu occupies the
highest position in respect of spindle capacity with 87,40,461 spindles ;
Maharashtra has the second position with 49,64,878 spindles and
Gujarat the third place with 40,38,160 spindles. Maharashtra has the
highest loomage in the country with 55298 looms; followed by Gujarat
with 52892 looms and U.P with 12078 looms. As Tamil Nadu mills
are mostly spinning d s , its loomage is comparatively low. The rotors
represent most modern spinning technology. As on 3 1 -03.1993 Tamil
Nadu inducted 51238 rotors, Maharashtra 21768 rotors and Gujarat
12624 rotors. Though T d Nadu has the largest number of mills,
because of their technological excellence, their labour complment is
comparatively low. It has only the third place in respect of employment
generation, the fmt and second place, as regards employment potential,
go to Maharashtra and Gujarat mills.
The Structure of Indian Textile Industry
The Indian Textile Industry is complex in structure comprising
the organised and the decentralised sectors. In the organised sector,
there are spinning m&, weaving mills and composite mills. The
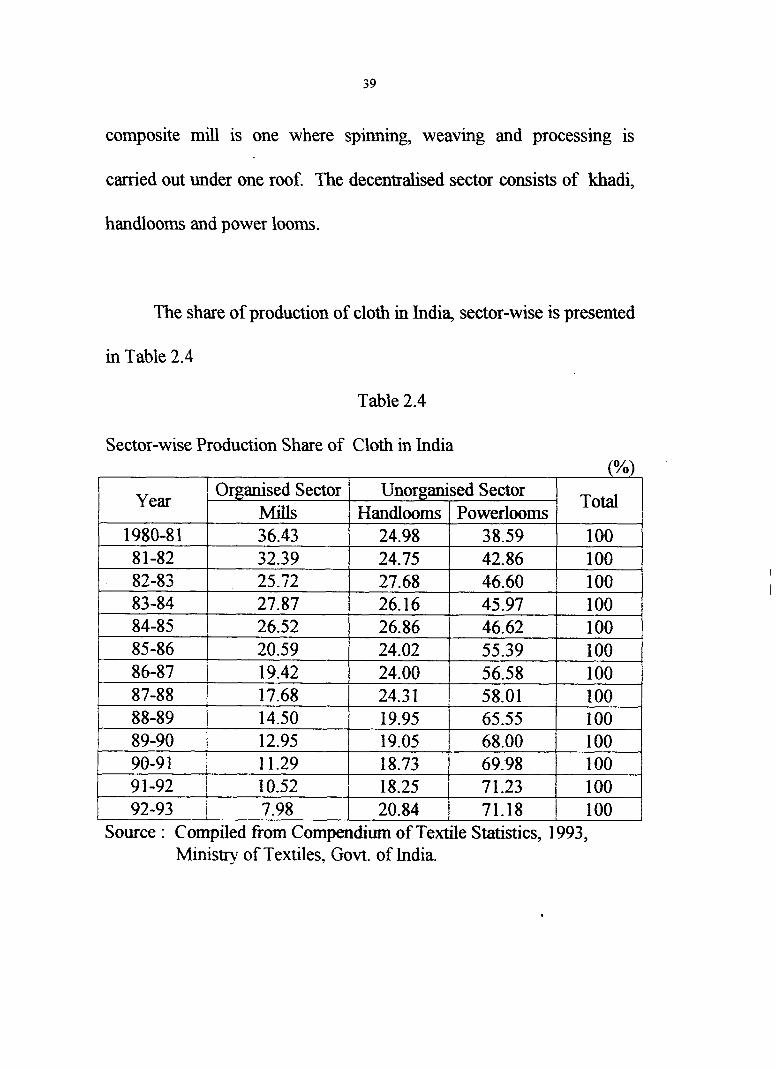
composite mdl is one where spinning, weaving and processing is
carried out under one roof. The decentralised sector consists of khadi,
handlooms and power looms.
The share of production of cloth in India, sector-wise is presented
in Table 2.4
Table 2.4
Source : Compiled from Compendium of Textile Statistics, 1993, Ministry of Textiles, Govt. of India.
Sector-wise Production Share of Cloth in India (%)
Year
1980-8 1 8 1-82 82-83 83-84 84-85
Total
100 100 100 100 100
Organised Sector Mills 36.43 32.39 25.72 27.87 26.52
100 100 100 100 100 100 100 -
Unorganised Sector
85-86 86-87 87-88 88-89
Handlooms 24.98 24.75 27.68 26.16 26.86 24.02 24.00 24.3 1 19.95 19.05 18.73 18.25
20.59 19.42 17.68 14.50
PO werlooms 38.59 42.86 46.60 45.97 46.62 55.39 56.58 58.01 65.55 68.00 69.98 7 1.23
89-90 1 12.95 90-9 1 1 1.29 91-92 1 10.52 -
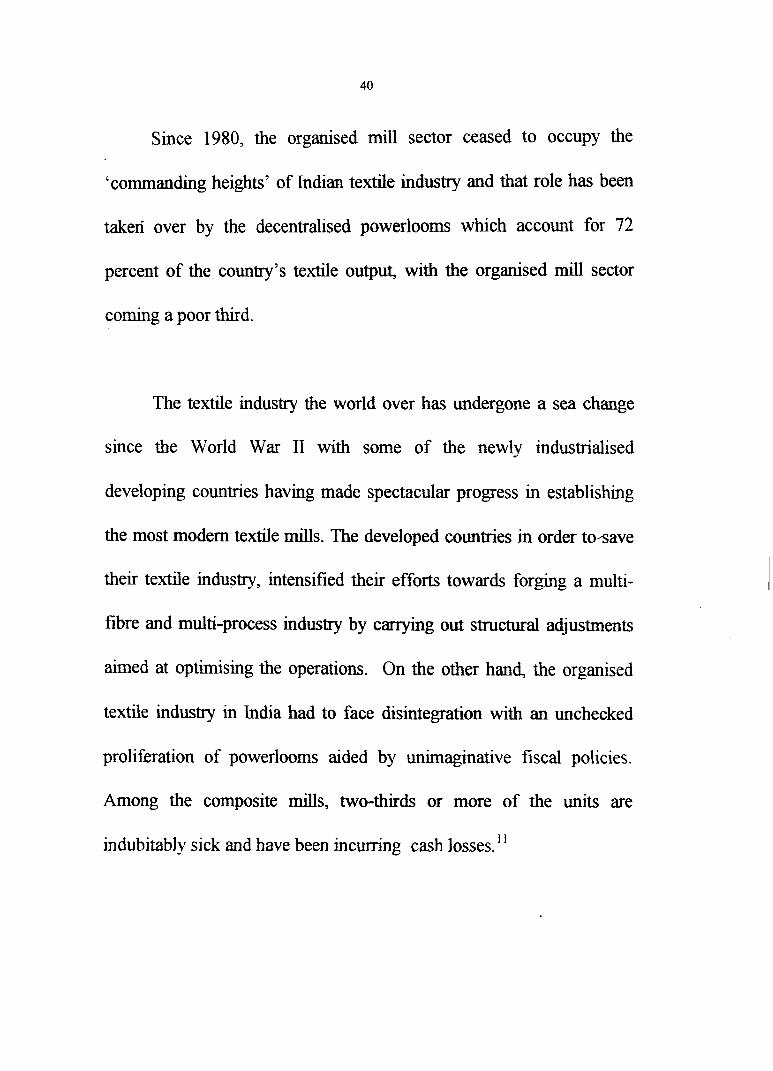
Since 1980, the organised mill sector ceased to occupy the
'commanding heights' of Indian textile industry and that role has been
taken over by the decentralised powerlooms wbch account for 72
percent of the country's textile output, with the organised mill sector
coming a poor thud.
The textile industry the world over has undergone a sea change
since the World War I1 with some of the newly industrialised
developing countries having made spectacular progress in establishing
the most modem textile mills. The developed countries in order tosave
their textile indushy, intensified their efforts towards forging a multi-
fibre and multi-process industry by canying out structural adjustments
aimed at optimising the operations. On the other hand, the organised
textile industry in India had to face disintegration with an unchecked
proliferation of powerlooms aided by unimaginative fiscal policies.
Among the composite mills, two-thirds or more of the units are
indubitably sick and have been incurring cash losses. l '
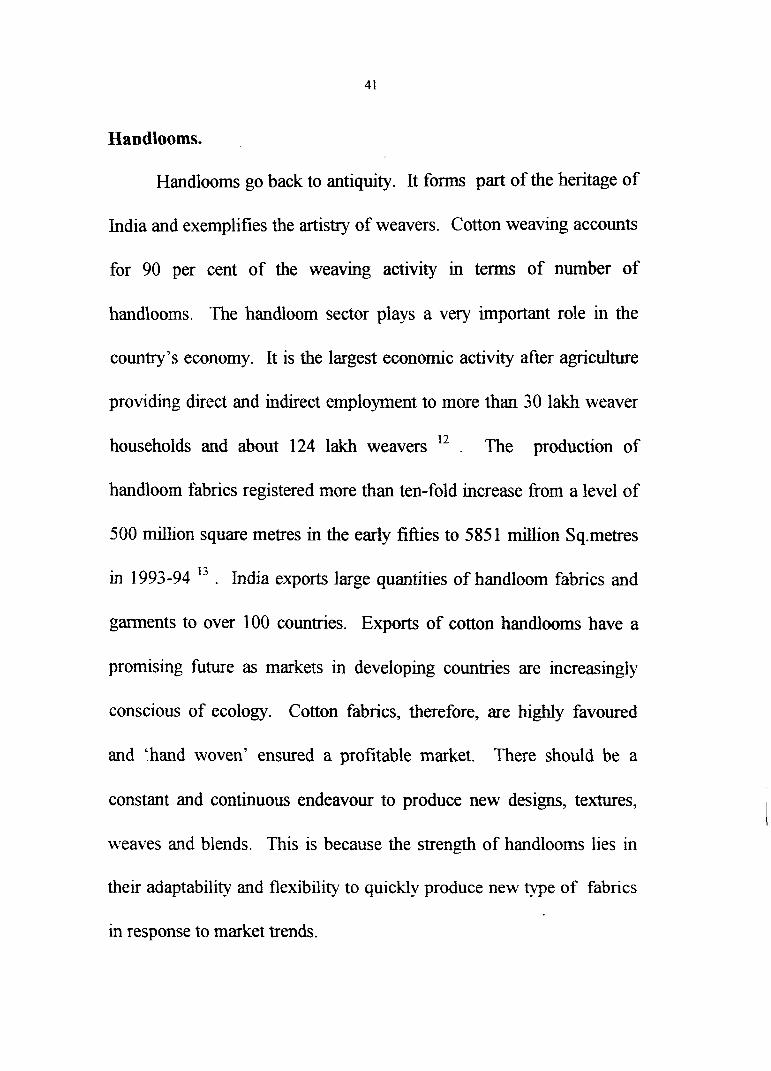
Handlooms.
Handlooms go back to antiquity. It forms part of the heritage of
India and exemplifies the artistry of weavers. Cotton weaving accounts
for 90 per cent of the weaving activity in terms of number of
handlooms. The handloom sector plays a very important role in the
country's economy. It is the largest economic activity after agriculture
providing direct and indirect employment to more than 30 lakh weaver
12 households and about 124 lakh weavers . The production of
handloom fabrics registered more than ten-fold increase fiom a level of
500 million square metres in the early fifties to 5851 million Sq.metres
in 1993-94 l' . India exports large quantities of handloom fabrics and
garments to over 100 countries. Exports of cotton handlooms have a
promising future as markets in developing countries are increasingly
conscious of ecology. Cotton fabrics, therefore, are highly favoured
and '.hand woven' ensured a profitable market. There should be a
constant and continuous endeavour to produce new designs, textures,
weaves and blends. This is because the strength of handlooms lies in
their adaptability and flexibility to quickly produce new type of fabrics
in response to market trends.
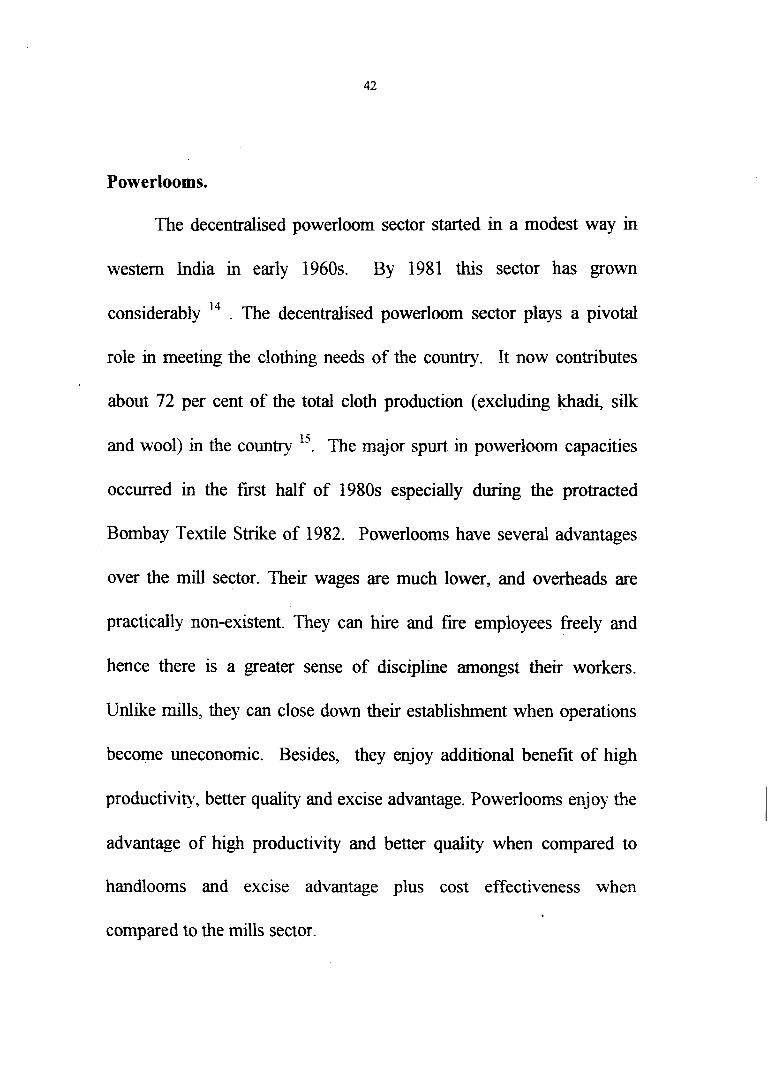
Powerlooms.
The decentralised powerloom sector started in a modest way in
western India in early 1960s. By 1981 th~s sector has grown
14 considerably . The decentralised powerloom sector plays a pivotal
role in meeting the clothing needs of the country. It now contributes
about 72 per cent of the total cloth production (excluding khah, silk
and wool) in the country l'. The major spurt in powerloom capacities
occurred in the first half of 1980s especially during the protracted
Bombay Textile Stnke of 1982. Powerlooms have several advantages
over the mill sector. Their wages are much lower, and overheads are
practically non-existent. They can hire and fire employees freely and
hence there is a greater sense of discipline amongst their workers.
Unllke mills, they can close down their establishment when operations
become uneconomic. Besides, they enjoy additional benefit of high
productivity, better quality and excise advantage. Powerlooms enjoy the
advantage of high productivity and better quality when compared to
handlooms and excise advantage plus cost effectiveness when
compared to the mills sector.
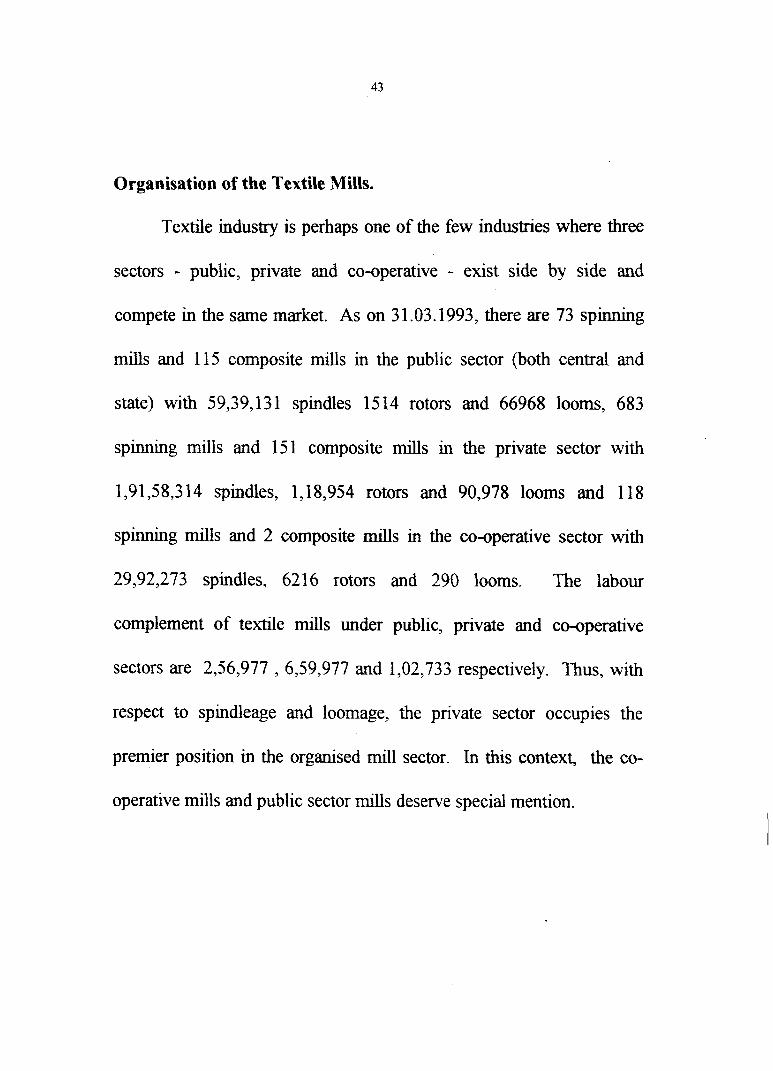
Organisation of the Textile Mills.
Textile industry is perhaps one of the few industries where three
sectors - public, private and co-operative - exist side by side and
compete in the same market. As on 3 1.03.1993, there are 73 spinning
mills and 115 composite d s in the public sector (both central and
state) with 59,39,131 spindles 1514 rotors and 66968 looms, 683
spinning mills and 15 1 composite mills in the private sector with
1,91,58,314 spindles, 1,18,954 rotors and 90,978 looms and 118
spinning rnills and 2 composite rn i l ls in the co-operative sector with
29,92,273 spindles, 6216 rotors and 290 looms. The labour
complement of textile d s under public, private and co-operative
sectors are 2,56,977 , 6,59,977 and 1,02,733 respectively. Thus, with
respect to spindleage and loomage, the private sector occupies the
premier position in the organised mill sector. In this context, the co-
operative mills and public sector mills deserve special mention.
Co-operative Mills.
Co-operative mills are of relatively recent origin. In 1942, the
Fact Finding Committee on Handloom Industry suggested the setting up
of co-operative spinning mills to supply yarn to the handlooms.
Accordingly, the first co-operative spinning mill was established at
Guntakkal in 1954 by the Madras State Handloom Weavers Federal Co-
operative Society. With the growth of the decentralised sector, it
became essential to develop a fill fledged spinning sector, as a support
primarily in the rural and semi-urban areas to cater to the needs of the
small and scattered weavers both in handloom and powerloom sectors.
As on 3 1.03.1993 there are 120 co-operative textile d s of which 1 1 8
are spinning rmlls. In the co-operative sector, Maharashtra has the
largest concentration of spinning capacity with 39 co-operative spinning
rmlls. Tarnil Nadu ranks next with 19 spinning mills followed by U.P
with 11 mills. There are only two composite d s in the co-operative
sector. They are in Assam and in Gujarat. More co-operative spinning
mills are likely to be started in the near future. Hence co-operative
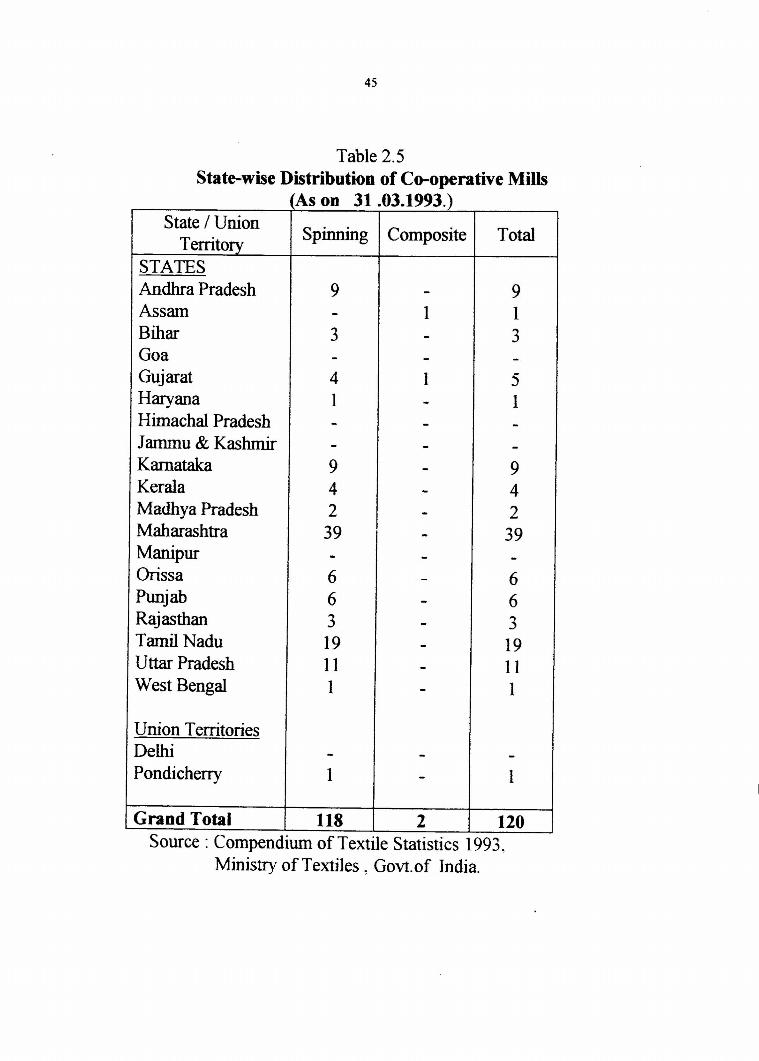
spinning rnills are an emerging sector. Table 2.5 shows the State-wise
distribution of co-operative rnills.
Ministry of Textiles , Govt.of India.
Table 2.5 State-wise Distribution of Co-operative Mills
State / Union Territory
STATES Andhra Pradesh Assam Blhar Goa Guj arat Haryana Hirnachal Pradesh Jammu & Kashrmr Karnataka Kerala Madhya Pradesh Maharashtra Manipur Orissa Punjab Raj asthan Tamil Nadu Uttar Pradesh West Bengal
Union Territories Delhi Pondicherry
Grand Total Source : Compendium
(As on 31.03.1993.)
Spinning
9 - 3 - 4 1 - - 9 4
Composite
1 - - 1 - - - - -
Total
9 1 3 - 5 1 - - 9 4 2 39 - 6 6 3 19 11 1
1
120 1993.
1 - 39 - 6 6 3 19 11 1
- l
118
- - - - - - - -
- -
2 of Textile Statistics
National Textile Corporation Ltd. (NTC)
The NTC was set up in the year 1968 with the objective of taking
over sick mills, which had been closed down. But as more and more
mills closed down, there was pressure fiom the state governments for
the quick take over of these mills. In order to facilitate such take over
and enable the state governments to participate in the running of these
mills, State Textile Corporations (STCs) were set up in those states in
which a sizeable number of mills were closed down. The take over of
closed rmlls was mamly intended as an unemployment relief scheme for
the benefit of workers who were thrown out of employment It was
also proposed to modernise those mills and to rehabilitate the
employees in order to make them economically viable. At present
there -are 124 mills under the fold of NTC. With a view to ensuring
effective management on decentralised basis, NTC has formed 9
subsidiary corporations. The paid up capital of NTC as on 3 1.03.1994
stands at Rs. 457.85 crores 1 6 . The entire net worth has been eroded as
its net accumulated losses amounted to Rs. 3652.64 crores" as on
31.03.1994. The capacity of NTC as on 31.03.1994 was 36.5 lakh
spindles and 37385 looms 18. Eight out of nine subsidiary corporations
of NTC have been referred to BFR, whrch declared them to be sick
industrial companies under the provisions of SICA 1985. A Turn
around Plan for revival of the NTC mills is currently under
examination of the government. To keep the NTC mills going, the
Government sunk, from time to time, Rs.1860 crores by way of
reimbursements. In addition, Government waived subsidised interest of
Rs. 1049 crores on loans provided to the NTC for working capital 19.
The Key Role of Textile Industry in the Indian Economy
Next to food, clothing is the most important item of family
expenditure in India, accounting for about 10 per cent 'O. Inspite of
considerable industrialisation that has taken place in hdia, the textile
induspy still occupies a key position in the economy of the country.
This industry has an important role to play both in the economic
prosperity of the country and in the supply of an essential commodity
for the entire population.
48
The cotton textile industry is the forerunner of India's
transformation fiom an agrarian economy to the industrial
advancement. It laid the foundation for the development of a number
of allied industries and services. The Indian enterpreneurshp had its
training ground in textile manufacture and the subsequent proliferation
into manifold avenues of industrial progress and economic venture was '
made possible by the pioneering efforts of the textile industry. In terms
of size, India is the biggest with 29.10 million spindles. It is the largest
in the country as it accounts for 20 to 25 per cent in the total industrial
production index. It employs about 20 million people 21.
The pre-eminent place of this industry in the national economy is
obvious fiom the fact that it caters to the clothing needs of the vast
population, contributing over Rs. 5000 crores to the Central and State
exchequers by way of indirect taxes. The textile industry contributes
about one-tlnrd of the foreign exchange earnings to the country while
the import intensity of textile production is minimal ". Textile exports
during 1993-94 amounted to Rs. 21,3 14 crores. During 1993-94 the
exports registered 30 per cent increase over the previous year. The item-
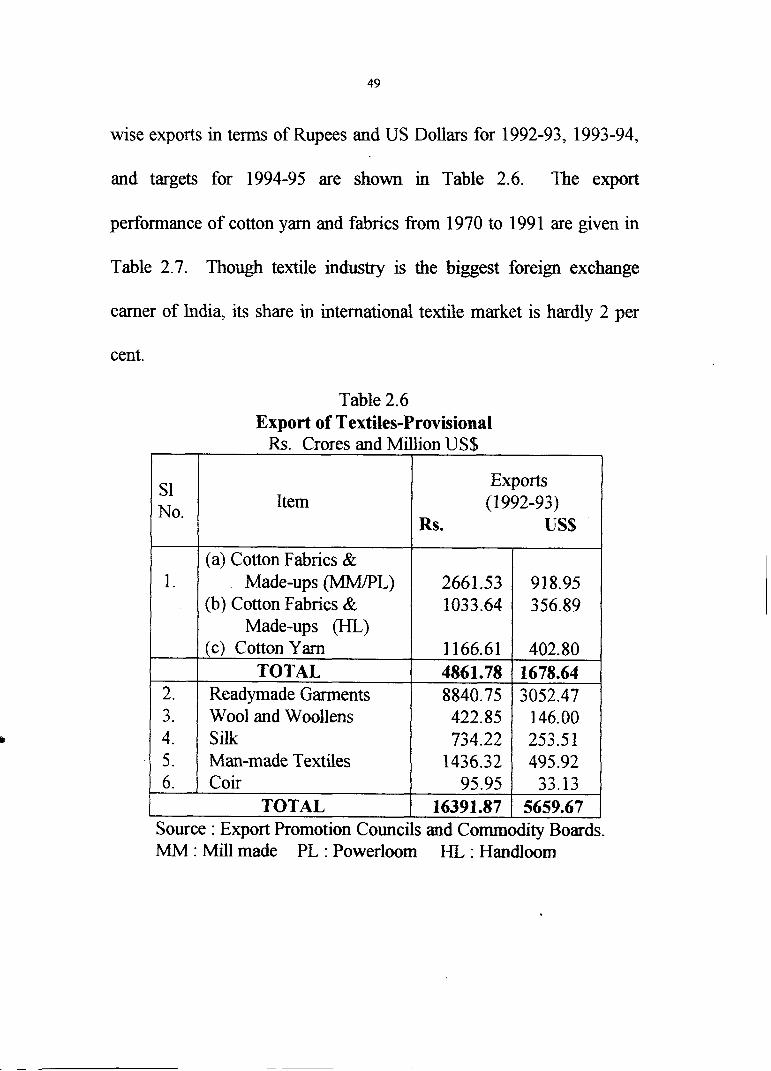
wise exports in terms of Rupees and US Dollars for 1992-93, 1993-94,
and targets for 1994-95 are shown in Table 2.6. The export
performance of cotton yarn and fabrics fiom 1970 to 199 1 are given in
Table 2.7. Though textile industry is the biggest foreign exchange
earner of India, its share in international textile market is hardly 2 per
cent.
Table 2.6 Export of Textiles-Provisional
Rs. Crores and Million US$ I 1 I 1
S1 No. Item
Exports (1 992-93)
Rs. US$
1.
2. 3. 4. 5. 6.
Source : Export Promotion Councils and Commodity Boards. MM : Mill made PL : Powerloom HL : Handloom
I
(a) Cotton Fabrics & Made-ups OMM/PL)
(b) Cotton Fabrics & Made-ups (HL)
(c ) Cotton Yarn TOTAL
Readymade Garments Wool and Woollens S& Man-made Textiles Coir
2661.53 1033.64
1 166.61 4861.78 8840.75 422.85 734.22
1436.32 95.95
16391.87 TOTAL
918.95 356.89
402.80 1678.64 3052.47
146.00 253.5 1 495.92
33.13 5659.67
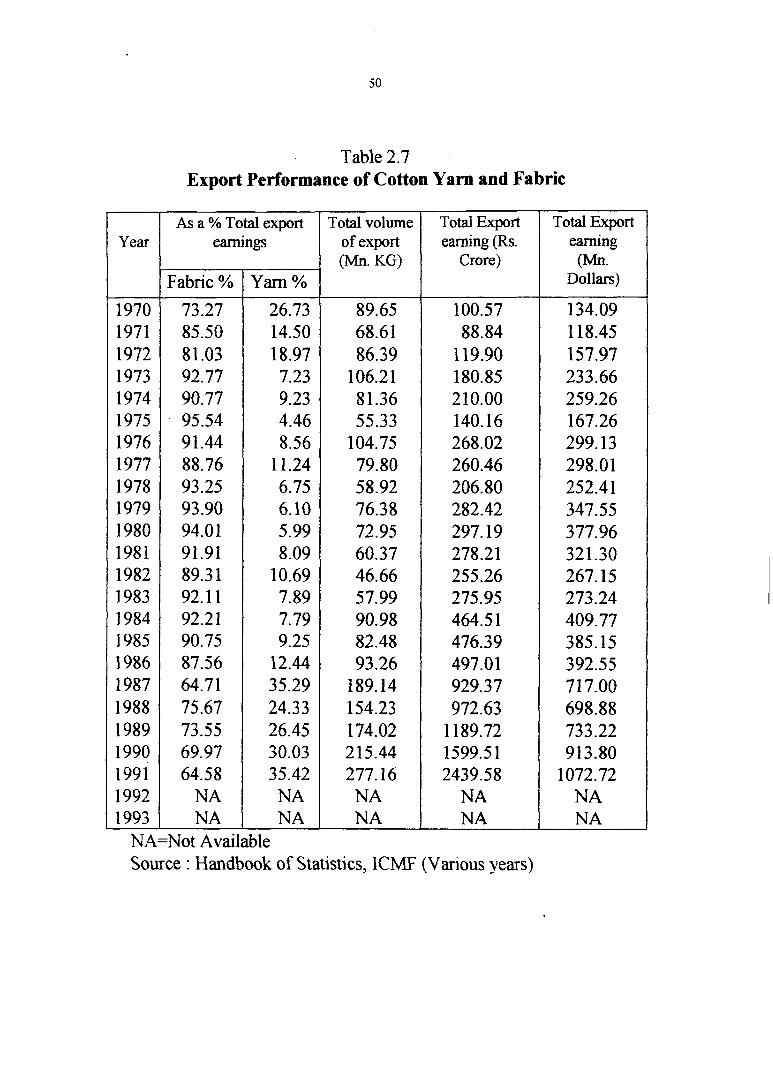
Table 2.7 Export Performance of Cotton Yam and Fabric
NA=Not Available Source : Handbook of Statistics, lCMF (Various years)
Total Export earning (Mn.
Dollars)
134.09 1 18.45 157.97 233.66 259.26 167.26 299.13 298.01 252.4 1 347.55 377.96 32 1.30 267.15 273.24 409.77 385.15 392.55 71 7.00 698.88 733.22 913.80
1072.72 NA NA
Total Export earning (Rs.
Crore)
100.57 88.84
119.90 180.85 210.00 140.16 268.02 260.46 206.80 282.42 297.19 278.21 255.26 275.95 464.5 1 476.39 497.01 929.37 972.63
1 189.72 1599.5 1 2439.58
NA NA
Total volume of export (Mn. KG)
89.65 68.61 86.39
106.2 1 8 1.36 55.33
104.75 79.80 58.92 76.38 72.95 60.37 46.66 57.99 90.98 82.48 93.26
189.14 154.23 174.02 215.44 277.16 NA NA
Year
1970 1971 1972 1973 1974 1975 1976 1977 1978 1979 1980 1981 1982 1983 1984 1985 1986 1987 1988 1989 1990 1991 1992 1993
As a % Total export earnings
Fabric %
73.27 85.50 81.03 92.77 90.77 95.54 91.44 88.76 93.25 93.90 94.01 91.91 89.31 92.11 92.21 90.75 87.56 64.71 75.67 73.55 69.97 64.58
NA NA
Yarn %
26.73 14.50 18.97 7.23 9.23 4.46 8.56
1 1.24 6.75 6.10 5.99 8.09
10.69 7.89 7.79 9.25
12.44 35.29 24.33 26.45 30.03 35.42 NA NA
Problems of Indian Textile Industry
There is a saying in industry circle that the textile industry passes
through a three year boom, a two year gloom and two year doom.
Financial problems, instability in raw material prices, poor or no
returns, sickness and closure of mills, obsolete capacity, low capacity
utilisation, high incidence of fiscal levies, poor off-take of cloth etc are
the major problems haunting the industry.
1. Financial Problems
The situation of the textile industry leaning heavily on debt
financing is due to poor or no returns and consequent erosion of equity.
Quite often the mills are not able to service the debt and are therefore
subject to the risk of insolvency. The d s also face acute liquidity
problems consequent upon heavy invesments in sluggish inventories
and receivables. The textile industry also experiences scarcity of funds
to modernise its obsolete facility.
2. Instability in Raw Material Prices
The Indian textile industry is primarily based on agricultural raw
material, the cotton. The cotton prices tend to fluctuate a great deal
depending on the size of the crop. With widely fluctuating cotton
prices, the fortunes of textile industry also swing fiom year to year. The
domestic prices of raw materials for man-made fabrics and fdament
yarn are very hlgh when compared to their international prices. The
high price of polyester and viscose staple fibre is another discouragmg
factor for the growth of spinning mills. The variations in prices of
different raw materials for the period 1988-89 to 1992-93 are
represented in Fig. 2.1
3. Poor or No Returns
Mills at large are incurring heavy losses. Compared to other
industries, the profitability of Indian textile industry has been low over
several years, and it declined in both absolute and relative terms till
1987-88. Since then the industry is picking up. A comparison of the
gross profit as a percentage of sales and profit after tax as a percentage
of net worth in cotton textile industry and all industry from 1980-81 to
1992-93 is given in Table 2.8
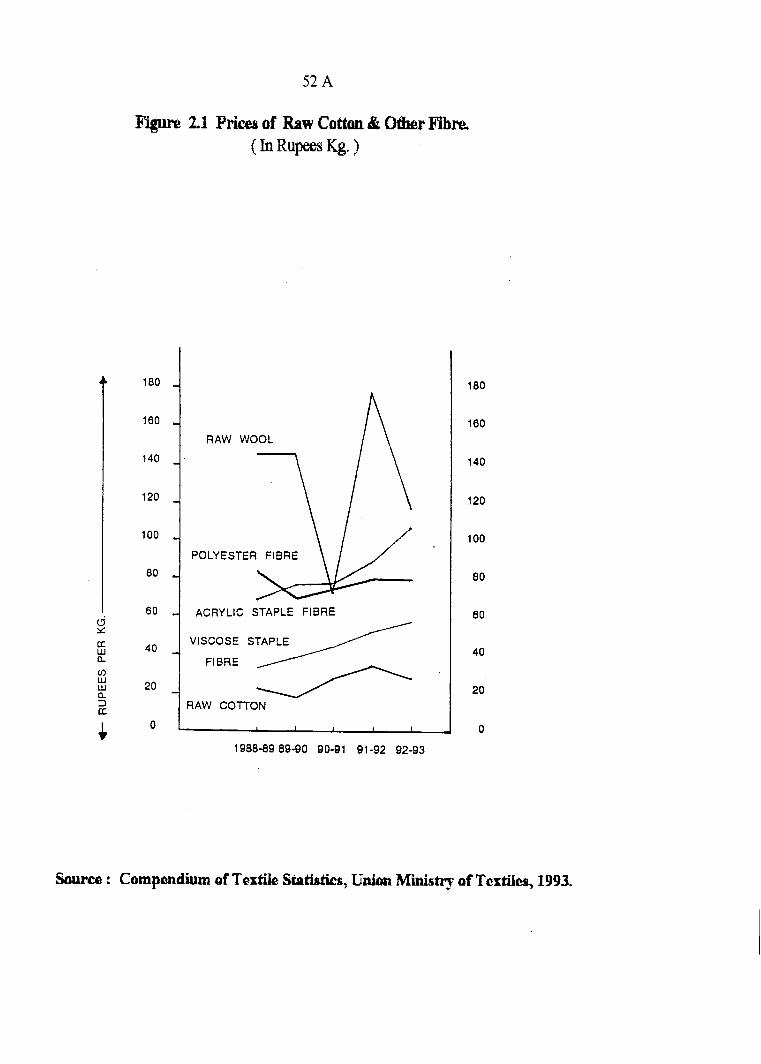
Figure 21 Prices of Raw Cottan & W r Fibm [ hi R u p s Kg. 1
RAW WOOL
POLYESTER FIBRE
I 60 ACRYLIC STAPLE FIBRE
:: U VISCOSE STAPLE W n FlaRE 0 W W n
20
3 [I
RAW COTTON
Source : Compendium ef Textile htistics, U n h Nlirtism of Textiiezi, 1993.
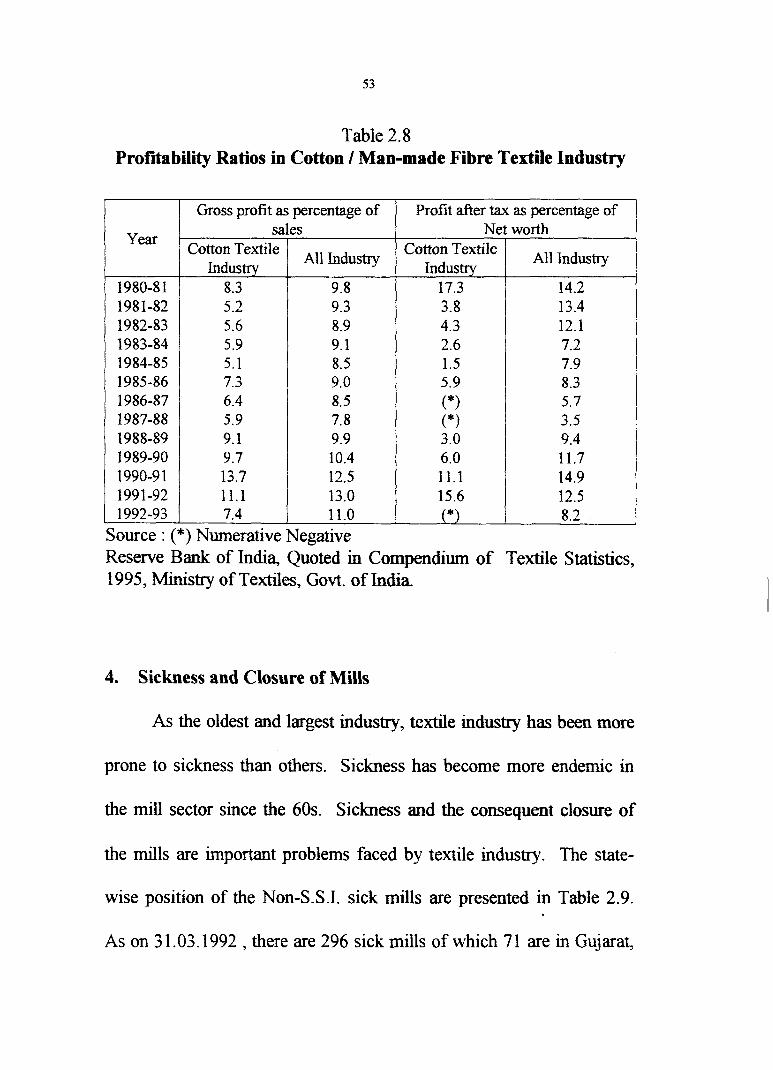
Table 2.8 Profitability Ratios in Cotton / Man-made Fibre Textile Industry
I I Gross profit as percentage of I Profit after tax as percentage of I Year
-
Reserve Bank of India, Quoted in Compendium of Textile Statistics, 1995, Ministry of Textiles, Govt. of India
1 1992-93 1 7.4
4. Sickness and Closure of Mills
All Indushy Industry
All Industry Indus
sales Cotton Textile
As the oldest and largest industry, textile industry has been more
Net worth Cotton Textile
Source : (*) Numerative Negative 11.0
prone to sickness than others. Sickness has become more endemic in
the mill sector since the 60s. Sickness and the consequent closure of
*
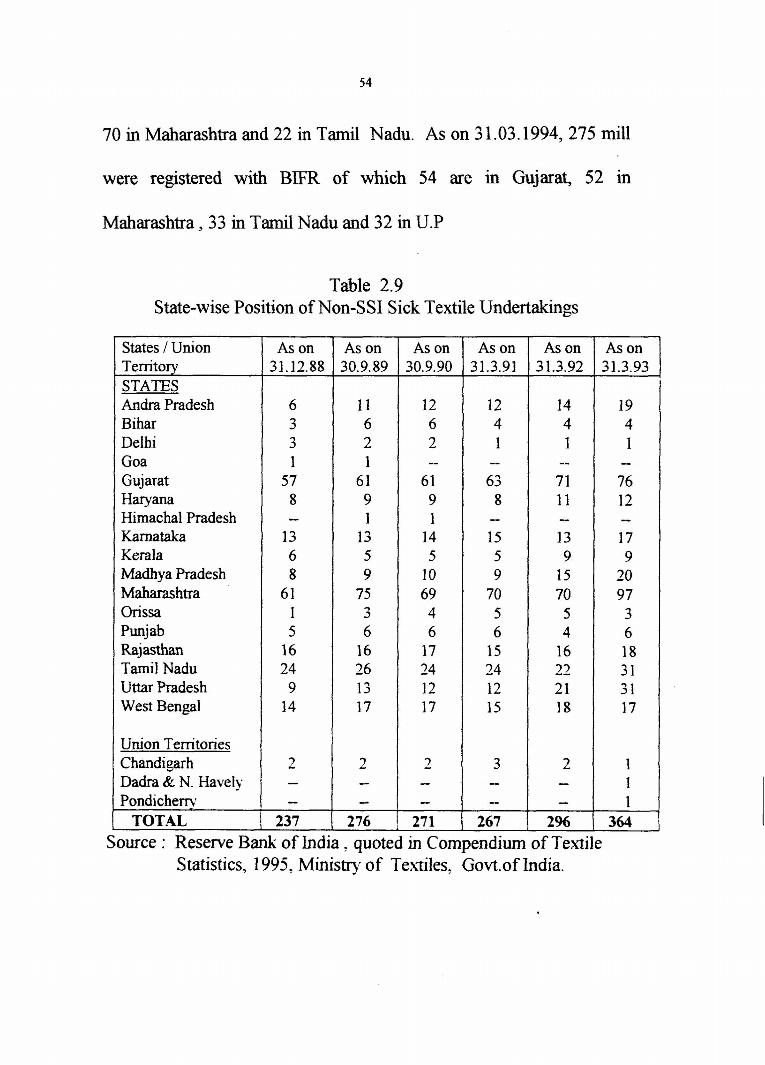
the mills are important problems faced by textile industry. The state-
8.2
wise position of the Non-S.S.I. sick d s are presented in Table 2.9.
As on 3 1.03.1992 , there are 296 sick mills of which 71 are in Gujarat,
54
70 in Maharashtra and 22 in Tamil Nadu. As on 3 1.03.1994, 275 mill
were registered with BIFR of which 54 are in Gujarat, 52 in
Maharashtra ,33 in T d Nadu and 32 in U.P
Table 2.9 State-wise Position of Non-SS1 Sick Textile Undertalungs
Statistics, 1 995, Ministry of Textiles, Govt.of India.
States 1 Union Territory STATES Andra Pradesh Bihar Delh Goa Gujarat Haryana Himachal Pradesh Kamataka Kerala Madhya Pradesh Maharashtra Orissa Punjab Raj asthan Tamil Nadu Uttar Pradesh West Bengal
Union Tenitories C handi garh Dadra & N. Havely Pondichery
L TOT.4L l
Source : Reserve Bank of India, quoted in Compendium of Textile
As on 31.12.88
6 3 3 1
5 7 8 --
13 6 8
6 1 1 5
16 24
9 14
2 -
237
As on 31.3.92
14 4 l
-- 7 l 11 - 13 9
15 70 5 4
16 22 2 1 18
2 - -
2%
As on 31.3.93
19 4 l
-- 76 12 -- 17 9
20 9 7 3 6 18 3 1 3 1 17
1 1 1
364
As on 30.9.89
11 6 2 1
6 1 9 1
13 5 9
75 3 6
16 26 13 17
7
- -
276
As on 30.9.90
12 6 2 --
6 1 9 1
14 5
10 69 4 6
17 24 12 17
- 7 - -
1 2 7 1
As on 31.3.91
12 4 1
-- 63 8
-- 15 5 9
70 5 6
15 24 12 15
3
- 267
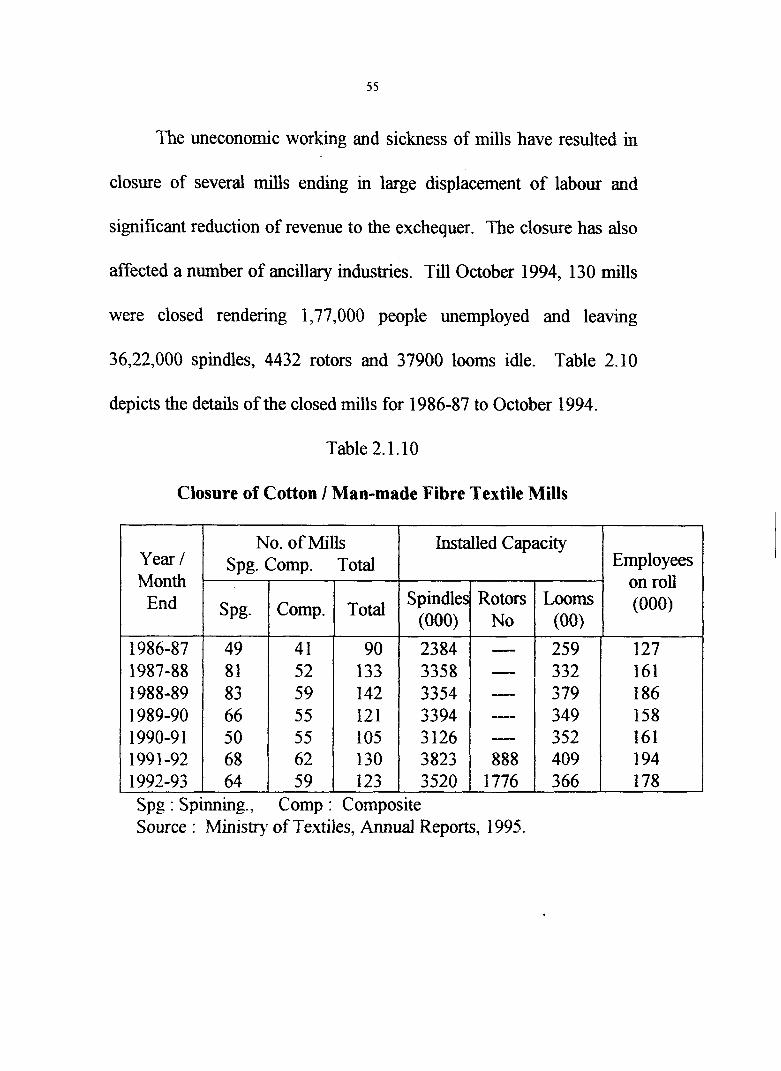
The uneconomic working and sickness of mills have resulted in
closure of several mills ending in large displacement of labour and
significant reduction of revenue to the exchequer. The closure has also
affected a number of ancillary industries. Till October 1994, 130 mills
were closed rendering 1,77,000 people unemployed and leaving
36,22,000 spindles, 4432 rotors and 37900 looms idle. Table 2.10
depicts the detarls of the closed mills for 1986-87 to October 1994.
Table 2.1.10
Closure of Cotton / Man-made Fibre Textile Mills
Year/ Month
End
1986-87 1987-88 1988-89 1989-90 1990-9 1 1991-92 1992-93 Spg : Spinning., Comp : Composite Source : Ministr). of Textiles, Annual Reports, 1995.
No. of Mills ~ p g . Comp. ~ o t a l
~ p g .
49 8 1 83 66 50 68 64
Employees on roll (000)
Installed Capacity
Comp.
41 52 59 55 55 62 59
Spindles (000)
~ o t a l
90 133 142 121 105 130 123
2384 3358 3354 3394 3126 3823 3520
Rotors No
Looms (00)
- - - -- - 888
1776
259 332 379 349 352 409 366
127 161 186 158 161 194 178
5. Obsolete Capacity
Most of the textile d s in the country are technologically
backward and are not in a position to turn out quality products
conforming to international standards. Consequent on the phasing out
of quota system, tremendous opportunities for exports are opened up.
If the mills are not modernised on a continuing basis, we would not be
able to take advantage of the opportunities in the world market.
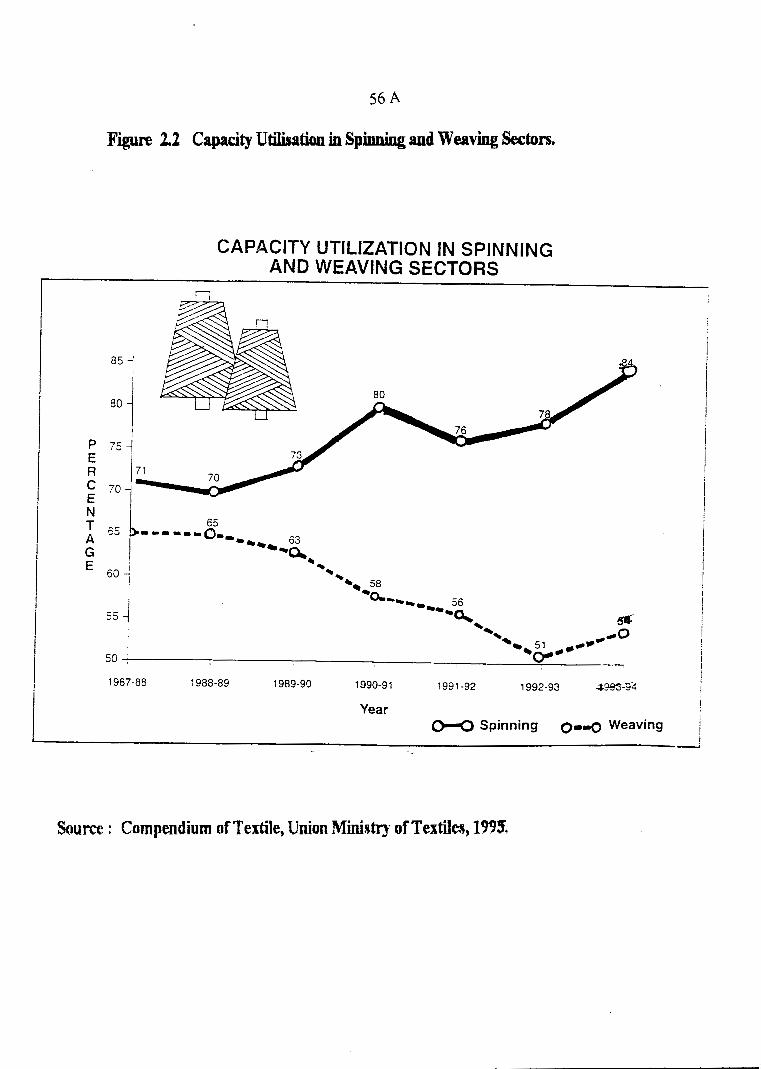
6. Low Capacity Utilisation
Figure 2.2 shows the capacity utilisation in the spinning and
weaving sectors. It can be seen that the capacity utilisation declined
considerably in the organised weaving sector from 62 % in 1985-86 to
54% in 1993-94. But the spinning mdls made significant improvement
in the utilisation of capacity, it rose from 69% in 1985-86 to 84% in
1993-94. According to spinning standards, 95 per cent and above is
the standard capacity utilisation ". In fact the low capacity utilisation
also contributes to the ills of the mill industry.
56 A
Figure 2.2 Capacity Utilisation in Spindug and Weaving Seetors.
CAPACITY UTILIZATION IN SPINNING AND WEAVING SECTORS
' l
I 1967-88 1988-89 1989-90 1990-91 1991-92 1992-93 &%-3L l
Year
I 010 Spinning 0-4 Weaving / i -
Source : Compendium of Textile, Unim MinistrJ of Textilm, 1993.
7. High Incidence of Fiscal Levies
Textiles form a basic item in the consumer basket. With a
majority of population in the low income brackets, clothing needs have
to be met at a price, which the community can afford. The present
structure of excise duty puts constraints in the consumption of textiles.
The overall duty incidence on dutiable textile products works out 1 1 per
24 cent . The incidence of excise duty on such an item of mass
consumption at this rate is extremely high. There is, therefore, a strong
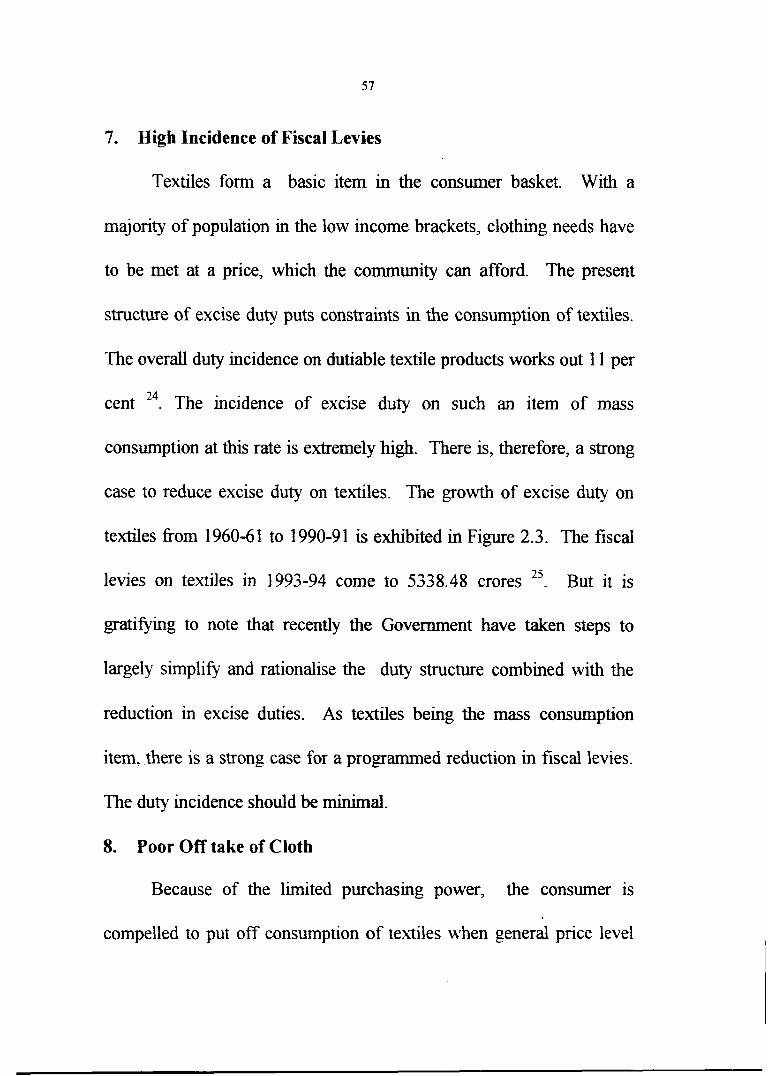
case to reduce excise duty on textiles. The growth of excise duty on
textiles fi-om 1960-6 1 to 1990-9 1 is exhibited in Figure 2.3. The fiscal
25 levies on textiles in 1993-94 come to 5338.48 crores . But it is
gratifying to note that recently the Government have taken steps to
largely simplifj, and rationalise the duty structure combined with the
reduction in excise duties. As textiles being the mass consumption
item. there is a strong case for a programmed reduction in fiscal levies.
The duty incidence should be minimal.
8. Poor Off take of Cloth
Because of the limited purchasing power, the consumer is
compelled to put off consumption of tex-tiles when general price level
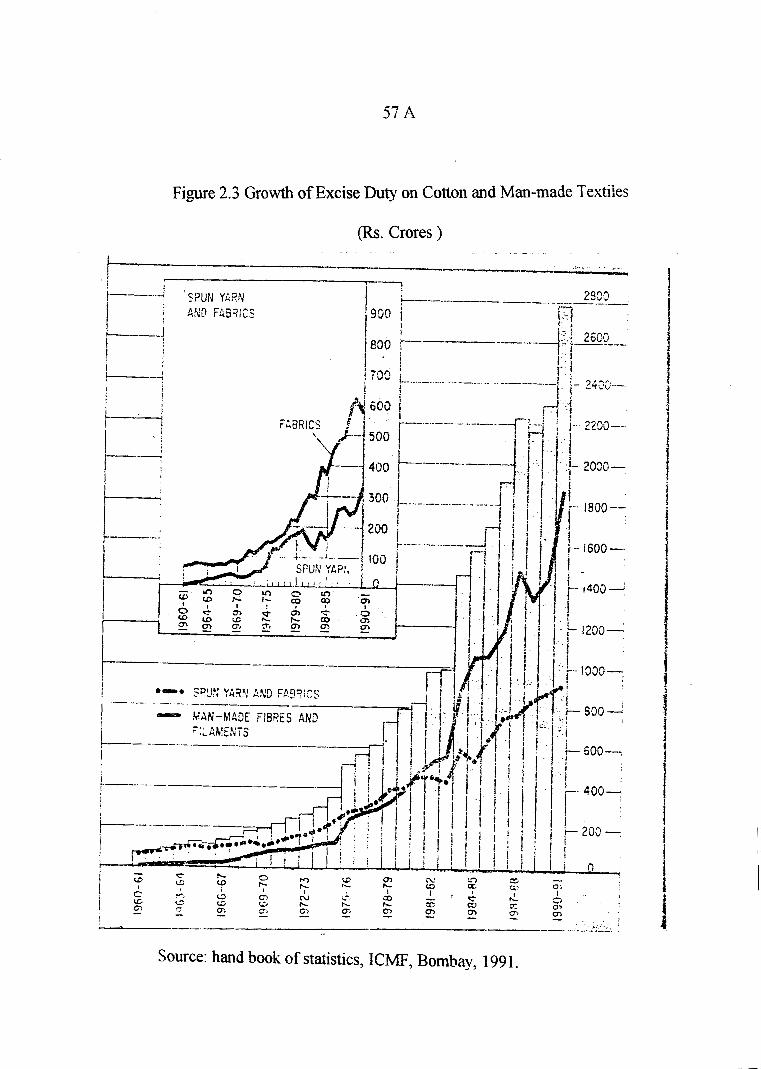
Figure 2.3 Growth of Excise Duty on Con011 and Man-made Textiles
-
(Rs. Crores )
Source: hand book of statistics, ICMF, Bombay, 1991.
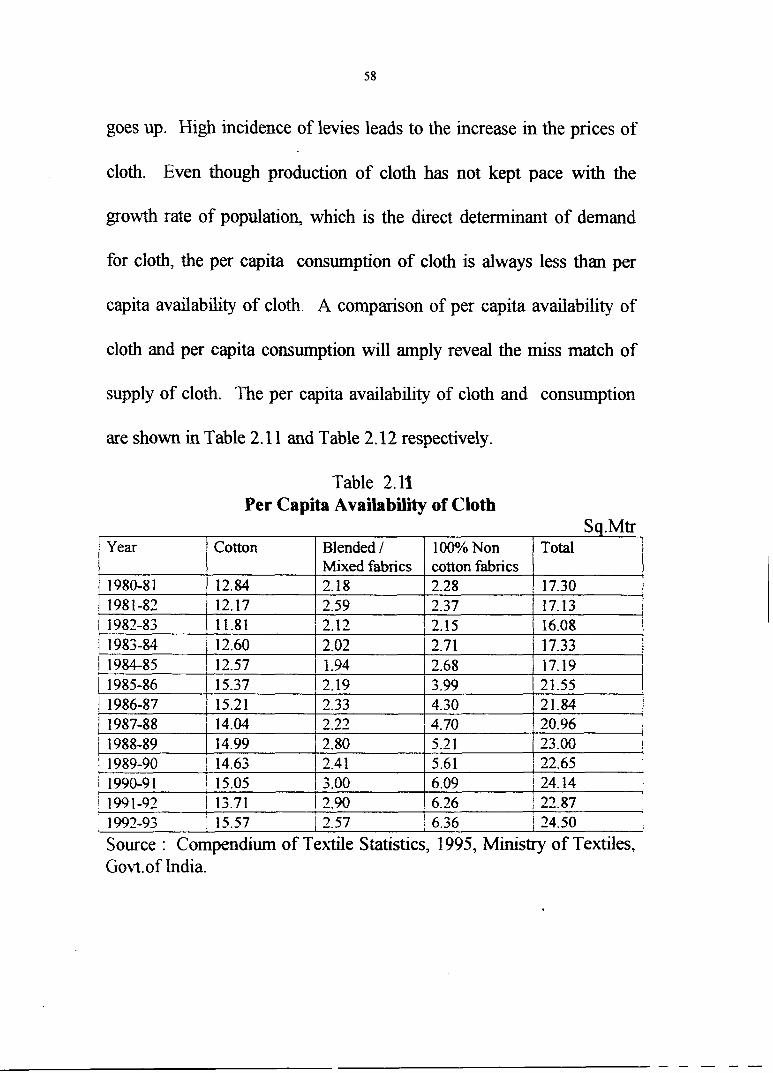
goes up. High incidence of levies leads to the increase in the prices of
cloth. Even though production of cloth has not kept pace with the
growth rate of population, wh~ch is the direct determinant of demand
for cloth, the per capita consumption of cloth is always less than per
capita availability of cloth. A comparison of per capita availability of
cloth and per capita consumption will amply reveal the miss match of
supply of cloth. The per capita availability of cloth and consumption
are shown in Table 2. l 1 and Table 2.12 respectively.
Table 2.12 Per Capita Availability of Cloth
Sq.Mtr I year 1 Cotton I Blended 1 1 100% Non I Total 1
Source : Compendium of Texqile Statistics, 1995, Ministry of Textiles, Govt.of India.
1980-8 1 / 1981-82
12.84 12.17
Mixed fabrics 2.18 2.59
cotton fabrics 2.28 17.30 2.37 1 17.13
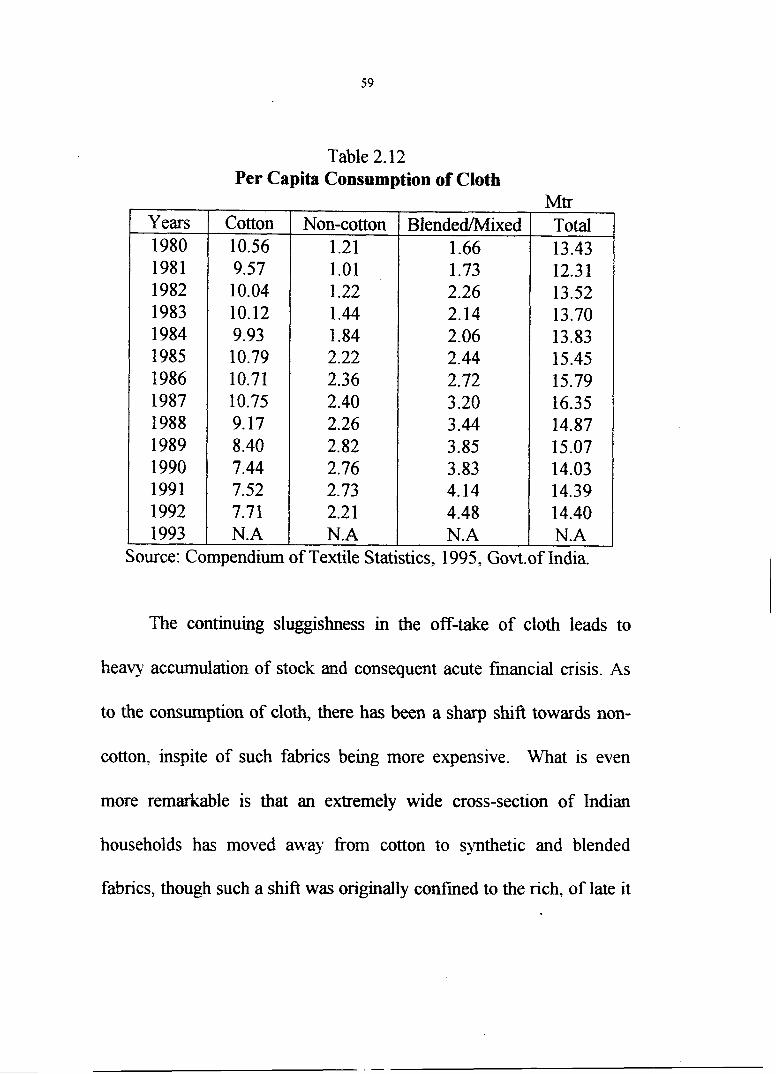
Table 2.12 Per Capita Consumption of Cloth
Mtr Total 13 -43 12.3 1 13.52 13.70 13.83 15.45 15.79 16.35 14.87 15.07 14.03 14.39 14.40
Source: Compendium of Textile Statistics, 1995, Govt.of India.
The continuing sluggishness in the off-take of cloth leads to
heavy accumulation of stock and consequent acute financial crisis. As
to the consumption of cloth, there has been a sharp shift towards non-
cotton, inspite of such fabrics being more expensive. What is even
more remarkable is that an extremely wide cross-section of Indian
households has moved away from cotton to synthetic and blended
fabrics, though such a shift was originally confined to the rich, of late it
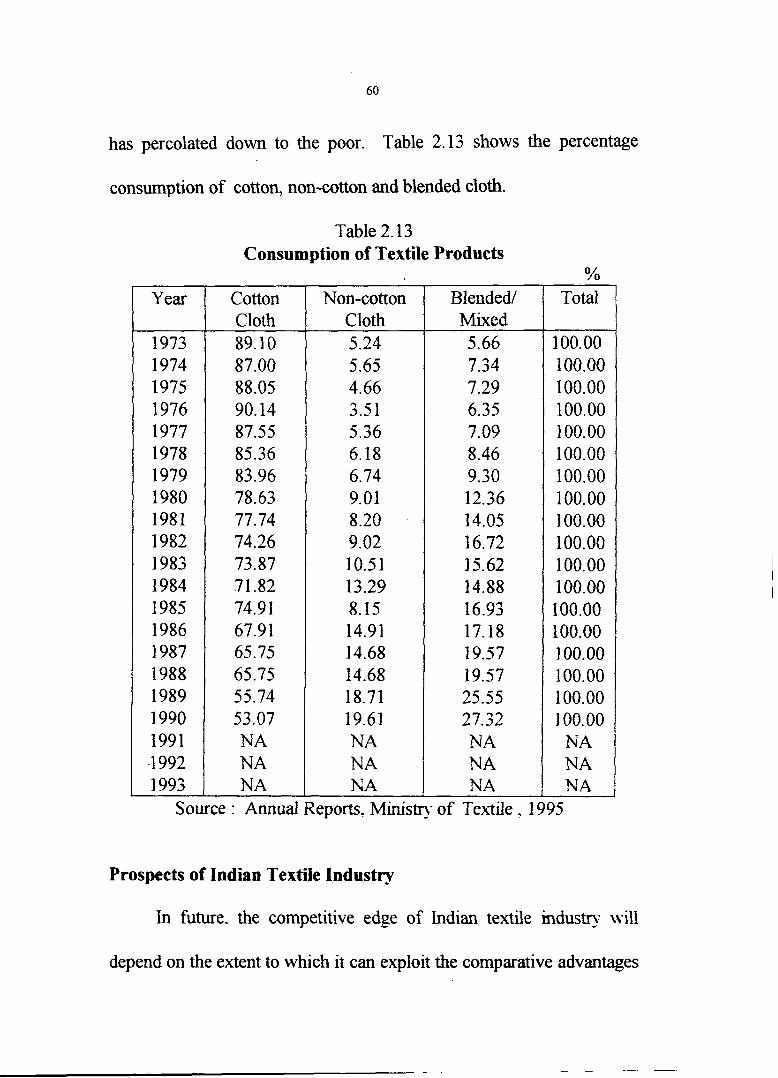
has percolated down to the poor. Table 2.13 shows the percentage
consumption of cotton, non-cotton and blended cloth.
Table 2.13 Consumption of Textile Products
Yo I Year I Cotton I Non-cotton 1 Blended/ I Total I
1973
Prospects of Indian Textile Industry
1974 1975 1976 1977 1978 1979 1980 1981 1982 1983 1984 1985 1986 1987 1988 1989 1990 1991 -1 992 1993
In future. the competitive edge of Indian textile industry will
Cloth 89.10
depend on the extent to which it can exploit the comparative advantages
Source : Annual Reports, Ministry of Textile . 1995
87.00 88.05 90.14 87.55 85.36 83.96 78.63 77.74 74.26 73.87 71.82 74.9 I 67.9 1 65.75 65.75 55.74 53.07 NA NA NA
Cloth 5.24 5.65 4.66 3.51 5.36 6.18 6.74 9.0 1 8.20 9.02 10.51 13.29 8.15 14.91 14.68 14.68 18.71 19.61 NA NA NA
Mixed 5.66 1 00.00 7.34 7.29 6.35 7.09 8.46 9.30 12.36 14.05 16.72 15.62 14.88 16.93 17.18 19.57 19.57 25.55 2 7.32 NA NA NA
100.00 100.00 100.00 1 00.00 100.00 100.00 l 00.00 100.00 100.00 1 00.00 1 00.00 100.00 100.00 1 00.00 100.00 1 00.00 l 00.00
NA NA NA
that the country enjoys in relation to other countries. Till recently, most
of the textile manufacture was located in Europe, U.S and East Asian
countries. But rising labour costs have, of late, been displacing the
industry to cotton rich countries with low wage rates. Increasing wage
costs have eroded the competitiveness of even the East Asian countries
like South Korea, Honkong, Taiwan and Malayasia. In Japan also
labour cost is on the increase. The significant development on the
global fiont is that China is diverting its land under sericulture to food
crops. The comparative advantages of India are availability of one of
the finest varieties of cotton in the world, cheap labour, technical and
managerial slulls and lax pollution control norms. Now the industry is
also delicensed. Further, the agreement on textiles and clothing whlch
forms a part of GATT treaty signalled the end of Multi Fibre
Arrangement (MFA) in which discriminatory restraints were put up by
the developed countries on India. GATT, therefore, means open market
and abolition of the quota system. India can thus export its textile
goods to 188 countries of the world. In the context of changed world
trade scenario and closure of textile mills in Japan and Europe
consequent upon increasing labour cost. our textile industry has ven
bright future. h short the climate is just right for India to give a boost
to her exports.
Conclusion
Indian Textile Industry is the oldest and single largest industry in
the country. Considering the supply of clothing needs of the vast
population, its contribution to the exchequer, employment generation,
industrial production and foreign exchange earnings, the textile
industry plays a crucial role in the economy of Inha. Indian Textile
Industry comprises the organised and unorganised sectors. As long as
there exists disparity in wage costs, overheads and excise advantages,
powerlooms will continue to be the major suppliers of fabrics in India,
with handloorns coming poor second and the mills a distant third. The
sustained and balanced growth and development of the industry is very
vital to the economy as also for the fulfilment of the most essential need
of the people. The handloorns can survive if it concentrates on the high
value and skill intensive products. Similarly. the composite mills can
do well if it produces high value brand named items whereby the mill
can earn handsome margins as the competition there is more in terms of
quality, brand images and fashon than prices. Financial problems,
poor or no returns, heavy indebtedness and associated problems,
sickness, closure, obsolete capacity, low utilisation of capacity, high
incidence of fiscal levies, poor off-take of cloth etc. pose severe threat
to the industry. Though textile industry is the biggest foreign exchange
earner, India's share in international textile market is hardly 2 per cent.
With the phasing out of quota system, we can gain entry to the new
markets. But the vast opportunity opened before us can be taken
advantage of only if our mills are modernised to produce the cloth
easily acceptable in the world market at lower prices for which
reduction in excise and customs duty on textiles, stability in the price of
cotton, reduction in power tariffs etc. are necessary.
Having given a review of the Indian textile industry, it is attempted to
examine the growth and development of the textile industry in Kerala in
Section 11.
SECTION II
Textile Industry in Kerala
Section I highlighted the state of Indian textile industry. This
section focuses on the t e d e industry in Kerala.
Introduction
The Kerala state was formed on November 01,1956 by joining
together the princely states of Travancore and C o c h and the Malabar
region of Madras State. Kerala lies between 8'1 8' and 12" 48' north
latitude and 74" 52' and 77" 22' east longitude, walled off by the
Western Ghats and watered by the Arabian Sea. The total geographcal
area of Kerala is 38863 square kilometres which is 1.18 per cent of the
total area of the country and accordingly ranks 18th among various
states of Indian Union 26. With only a little over one per cent of the
geographical size of the countq, she houses a population as large as
Canada and almost double that of Sri Lanka and ten times that of Costa
Rica. Though this little state has attracted world wide acclaim for its
achevements in human development, industry has not been expanding
along desired lines. The economy of Kerala is dominated by the
service sector, followed by agriculture and industry. Though Kerala
presents a healthy picture in the spheres of mass literacy, public health,
demographc profile and physical quality of life, her contribution to the
national income is low at 3.2 % 27. The rate of unemployment is about
11 times more than that of the national average 28. At all India level ,
29 its share of value addition in the factory sector is very low . The
Industrial base of Kerala comprises of capital intensive , small and
traditional industries; of these, the traditional sector is highly labour
intensive.
Origin and Development of Textile Industry in Kerala
The textile industry in Kerala consists of both organised and
decentralised sectors. Khadi, handlooms, powerloorns, composite mills
and spinning mills exist in Kerala. The textile industry of the state has a
rich past. The textile item " calicoes" originated from the place
Calicut in Kerala. Similarly, the famous cotton 'crepe' which is in
@eat demand all over the world for summer wear is a product of the
state of Kerala. Barthalomiyo, the foreign traveller who visited
Travancore, Cochin and Malabar during 1776 to 1789 had reported
about the existence of handlooms in Kerala during that period. It was
the German Base1 Mission that brought handlooms to Kannur in 1864.
The first factory based unit in Travancore was the textile mill started by
an American at Quilon. But the operation of t h s mill came to a
grinding halt with the out break of the World War I. In 1883, the
Malabar Spinning and Weaving Mills Ltd. was promoted by Mr.
Velayudhan Mudaliar of Kozhikode. This mdl, the grand old textile
mill in Kerala, is located at Thuzlvannur in Kozhikode. It started
operations in 1884 with 300 mule spindles, 200 workers and with an
initial outlay of Rs. 600,000. But now it is exposed to the weariness
and weakness of old age. Presently this mill is managed by the KSTC.
The Sitaram Spinning and Weaving Mills, a powerloom factory, was
started in 1908 in Trichur District. Due to innumerable problems th~s
mill was placed for public auction by the court and in 1972 the
Government of Kerala bought the mill at the public auction and in
1978, it was commissioned as The Sitaram Textiles Ltd., h the
thirties, banian factories were started at Feroke and ~ozhikode. In
1939, the Aysha Hosiery Factory, a kmtting unit was started at
Palapparamba in Kannur District. The development of textile industry
gained momentum since 1940. Thanks to the invitation of
C.P.Ramaswamy Iyer, the Sasoon Group, the reputed textile
industrialists of that time, set up a textile mill in 1940 at Kalamassery in
Ernakulam District. Later in 1957, it was taken over by the Cakkolas
Group by floating a public limited company known as the Chakkolas
Spinning and Weaving Mills. In the forties, six textile mills were
started of whch one was composite &l and among the five spinning
mills one was engaged in the manufacture of sewing threads. The
development of textile mills was not so fervent in the fifties and only
three mills were set up during this time of which one was a composite
mill. The sixties witnessed a flurry of activities in the textile scene.
Sixteen mills were started during this decade; among them there was
only one composite mill. In seventies four mills came up. The
remarkable feature in the seventies was that no textile mills were floated
in the private sector. Another significant development during this
period was the formation of the KSTC. in 1972 with the objective of
reviving the closed and sick mills in the state. The Govt. of India
entrusted KSTC with the management of five closed textile mills of
Kerala. Later those d l s were nationalised and brought under the
NTC. In 1984, the Govt. of Kerala nationalised the Malabar Spinning
and Weaving Mills , Kozhikode, the Kottayam Textiles , Kottayarn and
the Prabhuram Mills, Alappuzha under the Kerala Sick Textile
Undertalungs ( Acquisition and Transfer of Undertakings ) Act 1984
and put them under the KSTC. In 1986 a unit of the KSTC came up
at Edarikkode in Malappuram District. Further, it has taken steps to
establish a spinning mill at Uduma in Kasaragod District. The setting
up of two co-operative spinning mills at Malappuram and Quilon was
another notable development in the seventies. The eighties witnessed
the starting of the Trichur Co-operative Spinning mills at Vazhani.
Trichur District. The Govt. of Kerala have decided to establish seven
spinning mills under the co-operative fold at Meenadam, Alappuzha,
Mala Palai. Kazhakkootam, Kuttippuram and Kasaragod. The
Alappuzha Co-operative Spinning Mills will be commissioned soon. A
100% elport oriented unit is also coming up in Palakkad District under
the private sector.
The Role of the Textile Industry in the Economy of Kerala.
The textile industry plays a key role in the economy of Kerala by
supplying the basic needs of c l o h g to the people , providing
employment to many thousands and earning much wealth to the
exchequer by way of taxes, excise duty and foreign exchange. Among t
the industries of Kerala, the textile indus6y is ranked the second in
wage distribution, fourth in value addition, fifth in employment of
workers and seventh in investment of capital.30.
Distribution of Textile Industry in Kerala
As on 3 1.03.1993, there are 33 textile mills in Kerala, the
distribution of whlch is shown in Table 2.14
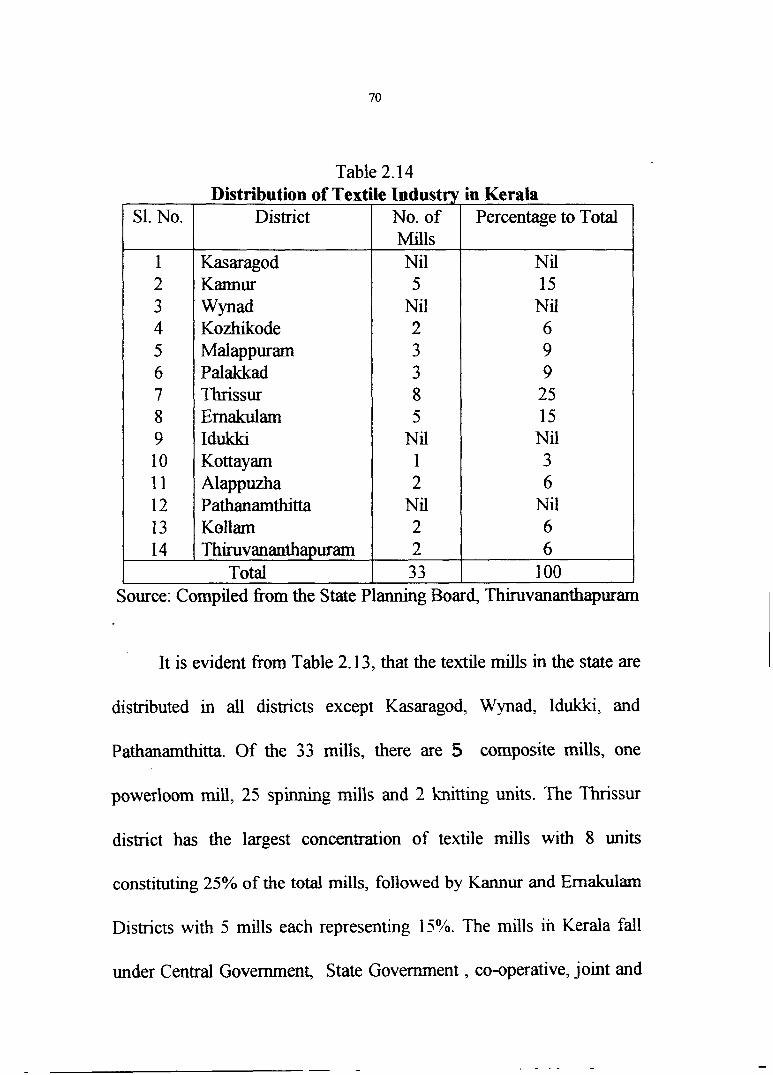
Table 2.14 Distribution of Textile Industry in Kerala
It is evident from Table 2.13, that the textile mills in the state are
distributed in all districts except Kasaragod, Wynad, Iduklu, and
Pathanamthitta. Of the 33 mills, there are 5 composite mills, one
powerloom mill, 25 spinning mills and 2 hining units. The Thnssur
district has the largest concentration of textile mills with 8 units
constituting 25% of the total mills, followed by Kannur and Ernakulm
Districts with 5 mills each representing 15%. The mills ~ Kerala fall
under Central Government, State Government , co-operative, joint and
S1. No.
1 2 3 4 5 6 7 8 9 10 11 12 13 1 4
District
Kasaragod Kannur Wynad Kozhikode Malappuram Palakkad Thrissur Ernakulam Iduklu Kottayam Alappuzha Pathanamthitta Kollam Thiruvananthapuram
Total
No. of Mllls Nil 5
Nil 2 3 3 8 5
Nil 1 2
Nil 2 2
Percentage to Total
Source: Compiled fiom the State Planning Board, hvananthapuram
Nil 15
Nil 6 9 9
25 15
Nil 3 6
Nil 6 6
33 1 00
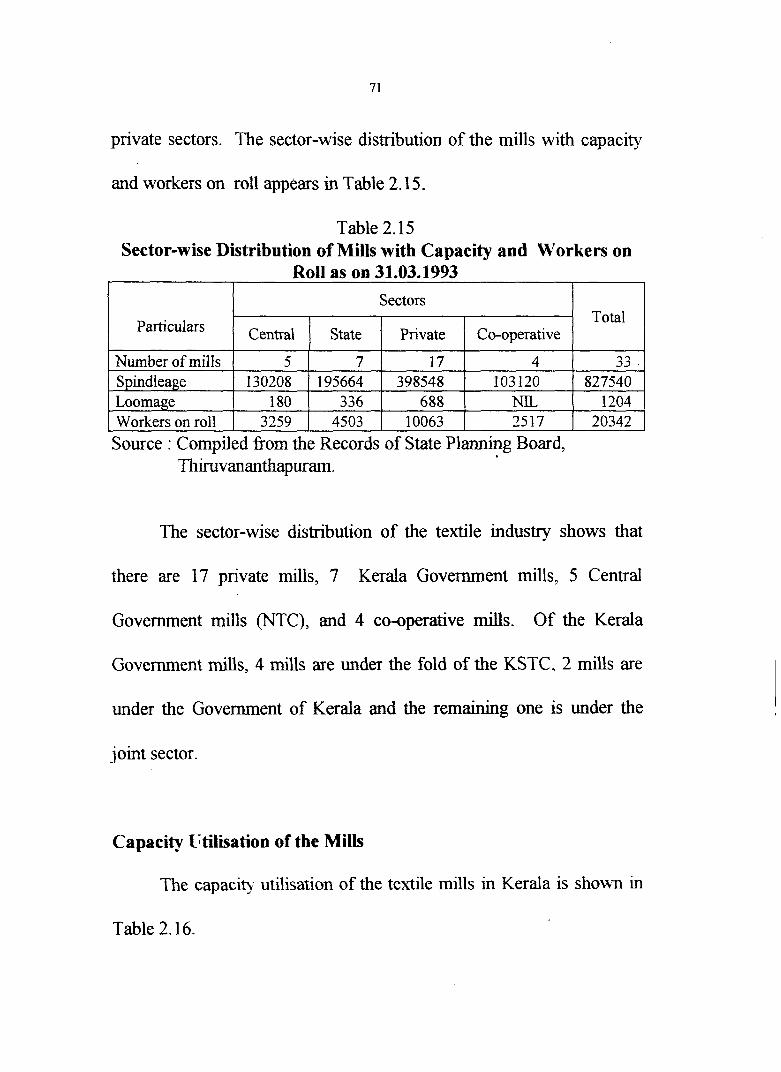
private sectors. The sector-wise distribution of the mills with capacity
and workers on roll appears in Table 2.1 5.
Workers on roll I 3259 1 4503 1 10063 1 2517 1 20342 1 Source : Compiled from the Records of State Planning Board,
Thiruvananthapurarn.
Table 2.1 5 Sector-wise Distribution of Mills with Capacity and Workers on
Roll as on 31.03.1993
The sector-wise distribution of the textile industry shows that
there are 17 private mills, 7 Kerala Government mills, 5 Central
Particulars
Number of mills Spindleage Loomage
Government mdls (NTC), and 4 co4perative mills. Of the Kerala
Government mills, 4 mills are under the fold of the KSTC, 2 mills are
under the Government of Kerala and the remaining one is under the
joint sector.
Capacity I;tilisation of the Mills
The capacity utilisation of the textile mills in Kerala is shown in
Table 2.16.
Total
3 3 827540
1204
Sectors
Central
5 130208
180
State
7 195664
336
Private
17 398548
688
Co-operative
4 103 120
NIL
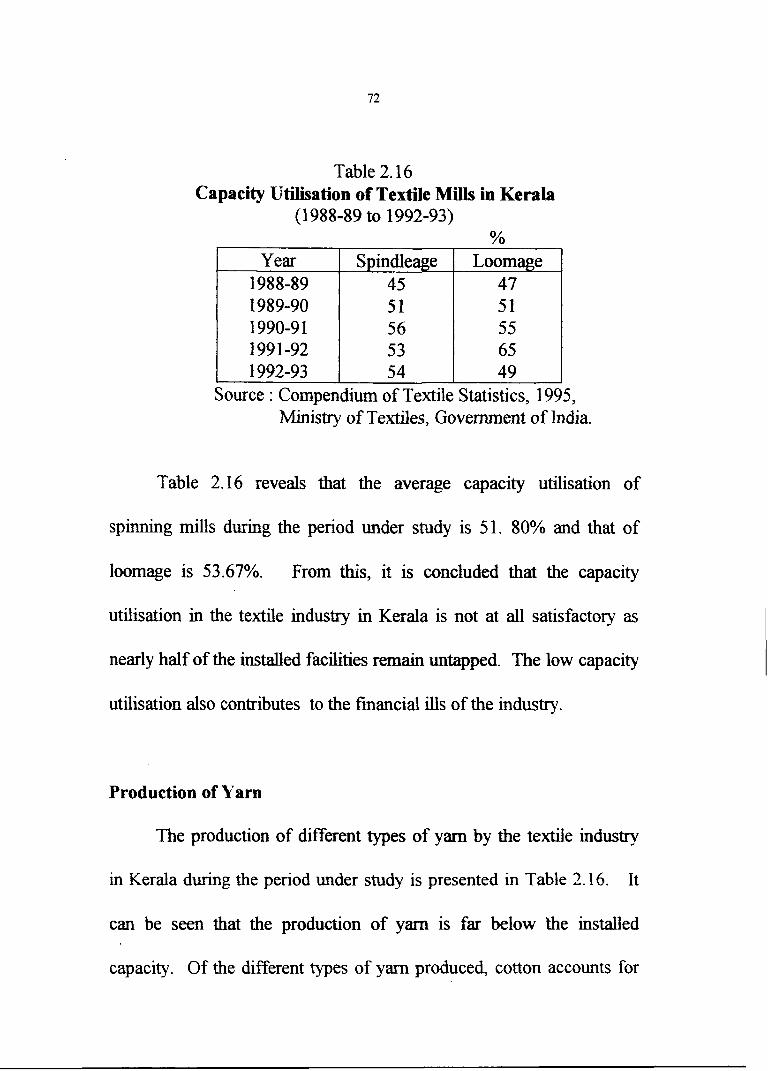
Table 2.16 Capacity Utilisation of Textile Mills in Kerala
(1 988-89 to 1992-93) %
Source : Compendium of ext tile Statistics, 1995, Ministry of Textiles, Government of India.
Year 1988-89 1989-90 1990-9 1 199 1-92 1992-93
Table 2.16 reveals that the average capacity utilisation of
spinning mills during the period under study is 51. 80% and that of
loomage is 53.67%. From this, it is concluded that the capacity
utilisation in the textile industry in Kerala is not at aU satisfactory as
nearly half of the installed facilities remain untapped. The low capacity
utilisation also contributes to the financial ills of the industry.
Spindleage 45 51 56 53 54
Production of Yarn
The production of different types of yarn by the textile industry
in Kerala during the period under study is presented in Table 2.16. It
can be seen that the production of yarn is far below the installed
capacity. Of the different types of yarn produced, cotton accounts for
. -
Loomage 47 51 55 65 49
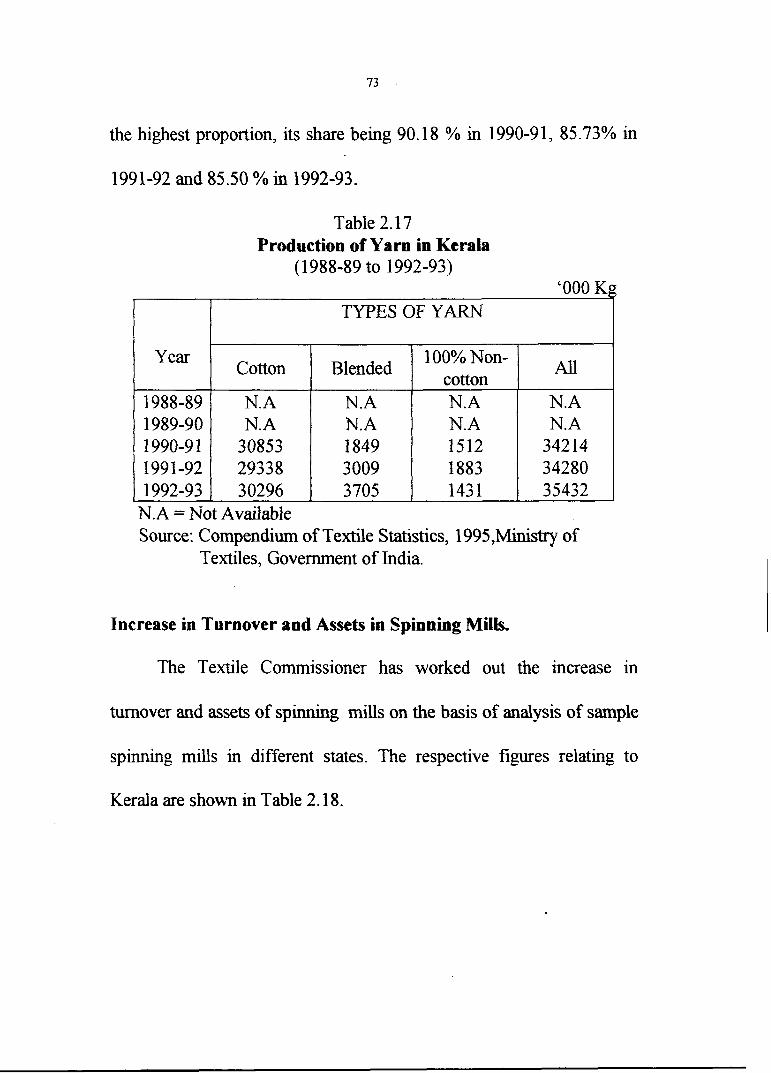
the hlghest proportion, its share being 90.18 % in 1990-91, 85.73% in
1991-92 and 85.50 % in 1992-93.
Table 2.17 Production of Yarn in Kerala
(1988-89 to 1992-93) '000 Kg
TYPES OF YARN
Year
N.A = Not Avdable Source: Compendium of Textile Statistics, 1995,Minist~y of
Textiles, Government of India.
Cotton
Increase in Turnover and Assets in Spinning Mills.
The Textile Commissioner has worked out the increase in
turnover and assets of spinning mills on the basis of analysis of sample
spinning mills in different states. The respective figures relating to
Kerala are shown in Table 2.1 8.
Blended 100% Non-
cotton All
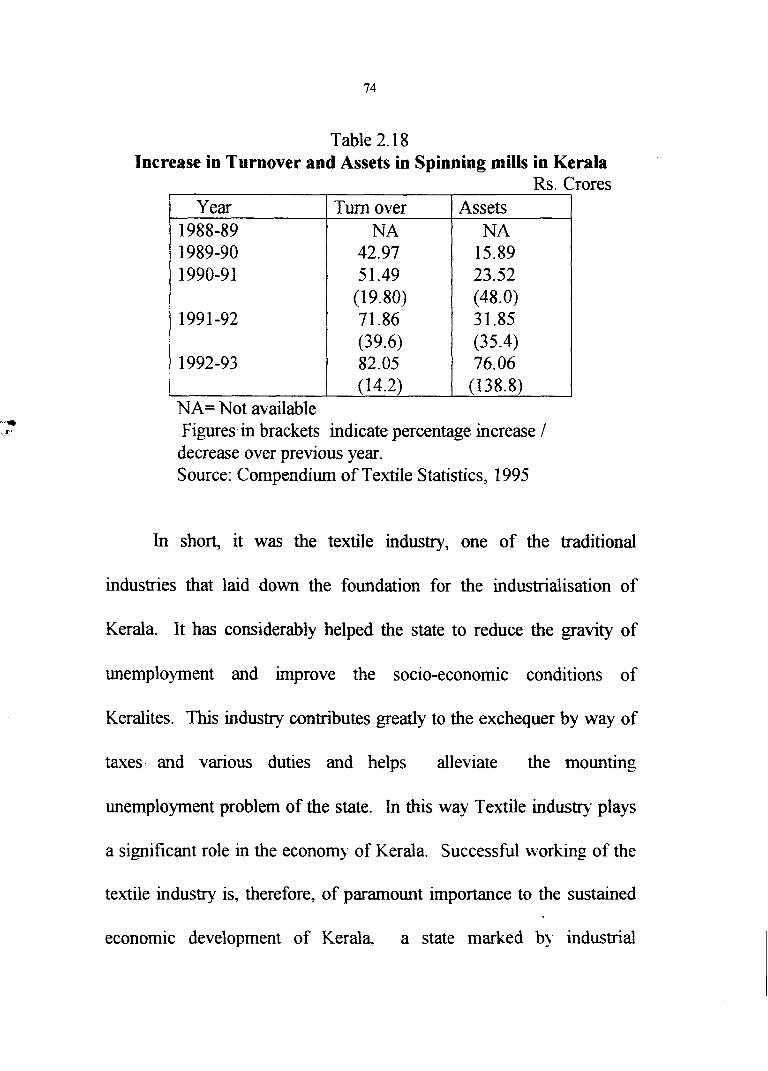
Table 2.1 8
Figures in brackets indicate percentage increase /
Increase in Turnover and Assets in Spinning mills in Kerala Rs. Crores
decrease over previous year. Source: Compendium of Textile Statistics, 1995
Year 1988-89 1989-90 1 990-9 1
199 1-92
1992-93
In short, it was the textile industry, one of the traditional
industries that laid down the foundation for the industrialisation of
NA= Not available
Turn over NA
42.97 5 1.49
(1 9.80) 71.86 (39.6) 82.05 (14.2)
Kerala. It has considerably helped the state to reduce the gravity of
Assets NA
15.89 23.52 (48.0) 31.85 (35.4) 76.06
(138.8)
unemployment and improve the socio-economic conditions of
Keralites. This industry contributes greatly to the exchequer by way of
taxes and various duties and helps alleviate the mounting
unemployment problem of the state. In this way Textile industry plays
a significant role in the economy of Kerala. Successful w o r h g of the
textile industry is, therefore, of paramount importance to the sustained
economic development of Kerala, a state marked by industrial
backwardness, large scale unemployment and low per capita income.
Further it has greater prospects as the textile production in Kerala is less
than 30% of its requirements.
Conclusion
The textile industry is one of the basic industries started in the
process of industrialisation in India. It occupies a unique position in the
economy of India by virtue of its contributions to supplying man's
basic need of clothing, employment generations, foreign exchange
earnings and industrial output. Recently the textile industry has
emerged as the largest foreign exchange earner in the country. But the
industry is gripped in deep crises characterised by weak financial base,
heavy indebtedness, inability to service debt,.continuing losses, obsolete
capacity, growing sickness and closure, shortage of funds for
modernisation and replacements etc. Inspite of these weaknesses, our
textile industry has better prospects. In the contex3 of the changed
world trade scenario and closure of textile mills in Japan and Europe,
the climate is just right for India to give a boost to her exports. Even
though the textile industry plays a significant role in the economy of
Kerala, it is entangled in different problems. Of the various problems
faced by the textile industry in Kerala, finance appears to be more
grave. Against thls broad canvass of the textile industry in India and
Kerala it is attempted to focus on the financial management in textile
mills in Kerala. Chapter III analyses the capital structure in select
mills.
References
l . The New Encyclopaedia of Britannica, 15 th Edition
2. Erich W. Zirnmermann., World Resources and Industries, New
York : Harper & Row Publishers, 1 95 1 p. 3 3 8.
3. Ibid., p. 373.
4. V. B. K u M . , History of Indian Cotton Textile Industry,
Bombay: The Mill Owners Association, 1979 p. 1
5 . Kasturi Sreenivasan., India S Textile Industry( A Socio-Economic
Ana[vsis), Coimbatore: SITRA, 1984 P.4..
6. Biswanath Ghosh., The Changzng Profile of India 's Industrial
Econom-v, Calcutta The World Press Pvt. Ltd., 1974. p. 15.
7. T.R. Sharma and S .D. S. Chauhan., Indian Industries, Agra: Shiv
La1 Agarcl~al& Co., 1972, p. 507.
8. S.J. Koh., Stages of Industrial Development in Asia. A
comparative History of Cotton Indus0 in Japan, India,
China and Korea, Phrladelphia : University of Pensylvannia
Press, 1966, p.88.
9. H.R.Iyer.,Economics of Textile Trade and Industry in India,
Bombay: Vora & Co., Pvt. Ltd., 1977. pp.4-5
1 0. S.D. Mehta., The Cotton Mills of India, 1 854-1954. Bombay: The
Textile Association, 1954. p. 12.
11. Omkar Goswamy., Economic and Political Weekly, iVo.38.
1985,~. 1063.
12. The Annual Report, Ministry of Textiles, 1994-95 p. 1 2.
l . Ibid.
14. Omkar Goswamy., '' Sickness and Growth of India's Textile m
Industry , Analysis and Policy Options" , Economic and
Political Weekly Nov. 10, 1990 , pp. 2496-2506.
15. Minis- of Textiles, Op. cit., p. 10
16. Ibid..
17. Ibid.,
18. Ibid..
19. H.N. Kaul., " N.T.C.: Challenges Before Modernisation " , Textile
Magazine, July 1995, p. 78.
20. D.U.Sastry., The Cotton Mill Industry in India, Delhi: Oxford
University Press, 1984, p. l .
21. The Textile Magazine, Madras February 1995, p.25
22. The Textile India Progress, Bombay July 1993, p.4.
23. Annual Report and Review (1 982-83), The AlFCSM, Bombay.
24. The Textile India Progress Loc.cit.,
25. Ibid.,
26. Report on the Second All India Census of Small Scale Industrial
Units , Trivandrum: Directorate of industries and Commerce,
Govt. of Kerda
27. Kerala Profile-95, Economic Times, p.6.
28. Vyavasaya Keralam, June 1996. , Dept. of Industries, p.7.
29. K.K.Subramanniam and P.M.Mohanan Pilla., .4n Exploration of
Alternative fivpothesis, Trivandrum: The Centre for
Development Studies, 1985, p. 10.
30. Report on Annual Survey of Industries, 1986-87, Trivandnun :
Dept. of Economics & Statistics 1993.