Embed Size (px)
Citation preview
The potential for further reductions
of PM emissions
in Europe
M. Amann, J. Cofala, Z. Klimont
International Institute for Applied Systems Analysis (IIASA)
Contents
• CAFE baseline emission projections
• Scope for further technical and non-technical reductions of primary PM emissions
• How do measures directed at PM10 affect PM2.5?
• Cost-optimized reductions to reduce ambient PM2.5 concentrations in Europe
CAFE baseline emission projections
PM10
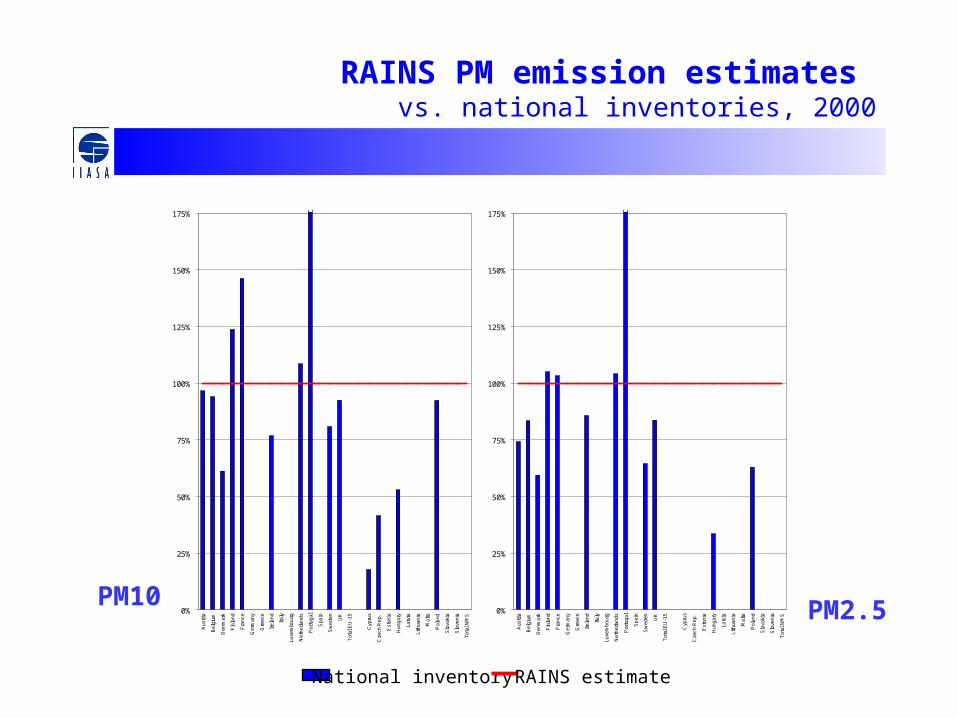
RAINS PM emission estimates vs. national inventories, 2000
0%
25%
50%
75%
100%
125%
150%
175%
Aus
tria
Bel
gium
Den
mar
k
Fin
land
Fra
nce
Ger
man
y
Gre
ece
Irel
and
Italy
Luxe
mbo
urg
Net
herla
nds
Por
tuga
l
Spa
in
Sw
eden UK
Tot
al E
U-1
5
Cyp
rus
Cze
ch R
ep.
Est
onia
Hun
gary
Latv
ia
Lith
uani
a
Mal
ta
Pol
and
Slo
vaki
a
Slo
veni
a
Tot
al N
MS
0%
25%
50%
75%
100%
125%
150%
175%
Aus
tria
Bel
gium
Den
mar
k
Fin
land
Fra
nce
Ger
man
y
Gre
ece
Irel
and
Italy
Luxe
mbo
urg
Net
herla
nds
Por
tuga
l
Spa
in
Sw
eden UK
Tot
al E
U-1
5
Cyp
rus
Cze
ch R
ep.
Est
onia
Hun
gary
Latv
ia
Lith
uani
a
Mal
ta
Pol
and
Slo
vaki
a
Slo
veni
a
Tot
al N
MS PM2.5
National inventory RAINS estimate
0%
25%
50%
75%
100%
125%
150%
175%
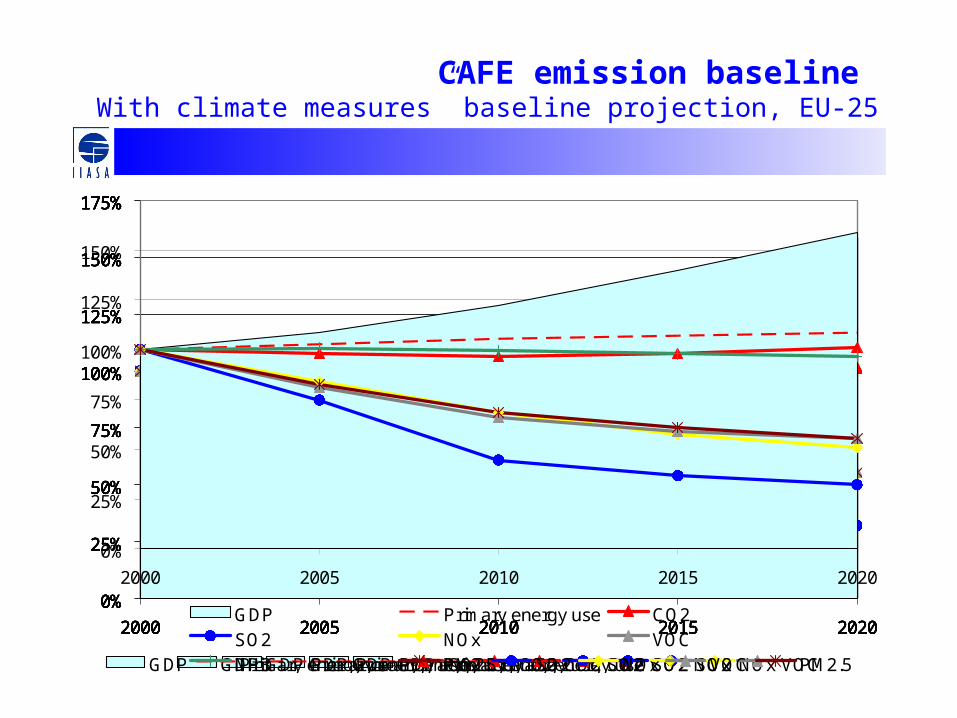
2000 2005 2010 2015 2020
GDP Primary energy use
CAFE emission baseline With climate measures” baseline projection, EU-25
0%
25%
50%
75%
100%
125%
150%
175%
2000 2005 2010 2015 2020
GDP Primary energy use CO2
0%
25%
50%
75%
100%
125%
150%
175%
2000 2005 2010 2015 2020
GDP Primary energy use CO2 SO2
0%
25%
50%
75%
100%
125%
150%
175%
2000 2005 2010 2015 2020
GDP Primary energy use CO2 SO2 NOx
0%
25%
50%
75%
100%
125%
150%
175%
2000 2005 2010 2015 2020
GDP Primary energy use CO2 SO2 NOx VOC
0%
25%
50%
75%
100%
125%
150%
175%
2000 2005 2010 2015 2020
GDP Primary energy use CO2 SO2 NOx VOC PM2.5
0%
25%
50%
75%
100%
125%
150%
175%
2000 2005 2010 2015 2020
GDP Primary energy use CO2SO2 NOx VOCNH3 PM2.5
Scope for further technical emission reductions
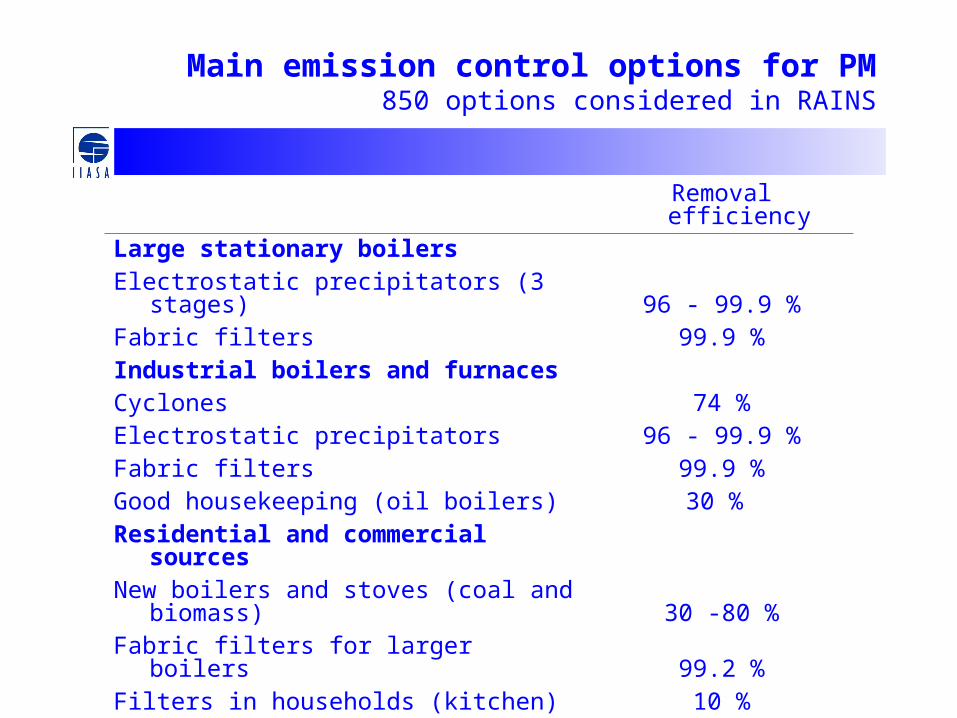
Main emission control options for PM850 options considered in RAINS
Removal efficiency
Large stationary boilersElectrostatic precipitators (3 stages) 96 - 99.9 %Fabric filters 99.9 %
Industrial boilers and furnacesCyclones 74 %Electrostatic precipitators 96 - 99.9 %Fabric filters 99.9 %Good housekeeping (oil boilers) 30 %
Residential and commercial sourcesNew boilers and stoves (coal and biomass) 30 -80 %Fabric filters for larger boilers 99.2 %Filters in households (kitchen) 10 %Fireplaces - inserts (catalytic, non-catalytic) 44 – 70 %Good housekeeping (oil boilers) 30 %Ban on open burning of waste 100 %
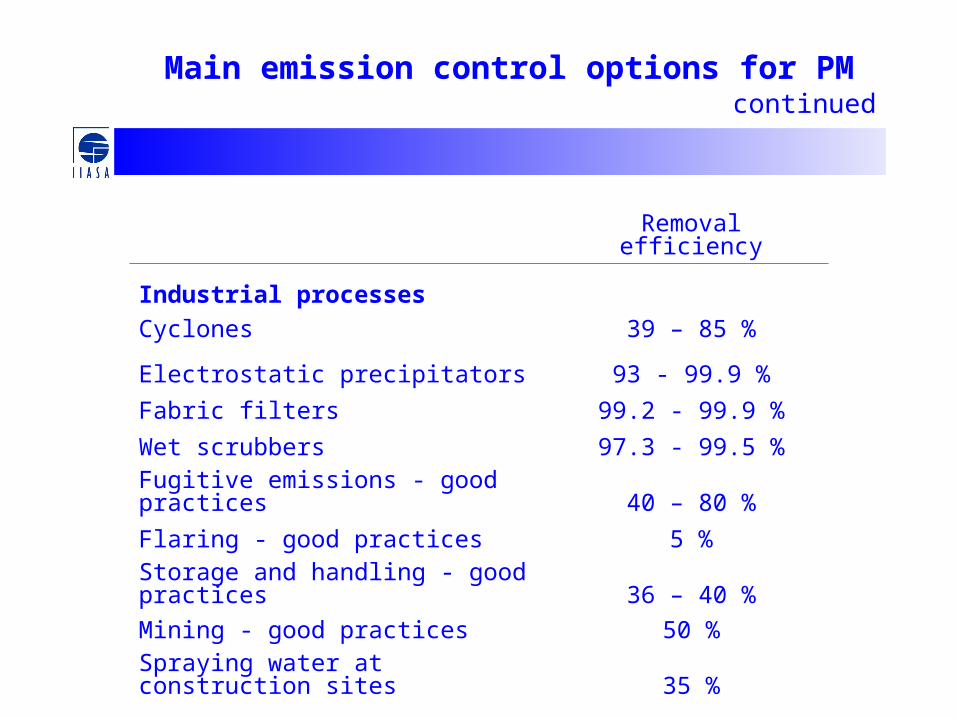
Main emission control options for PM continued
Removal efficiency
Industrial processes
Cyclones 39 – 85 %
Electrostatic precipitators 93 - 99.9 %
Fabric filters 99.2 - 99.9 %
Wet scrubbers 97.3 - 99.5 %
Fugitive emissions - good practices 40 – 80 %
Flaring - good practices 5 %
Storage and handling - good practices 36 – 40 %
Mining - good practices 50 %
Spraying water at construction sites 35 %

Main emission control options for PM continued
Removal efficiency
Transport
Cars and light duty trucks:
EURO 1 - EURO 5 standards 35 – 99 %
Heavy duty trucks:
EURO 1 - EURO 5 standards 36 – 98 %
Street washing ??
Non-road sector:
Euro equivalents 36 – 98 %
Agriculture
Free range poultry 28 %
Low till farming, alternative cereal harvesting 39 %
Feed modification 38 %
Hay silage 54 %
Ban on open burning of waste 100 %
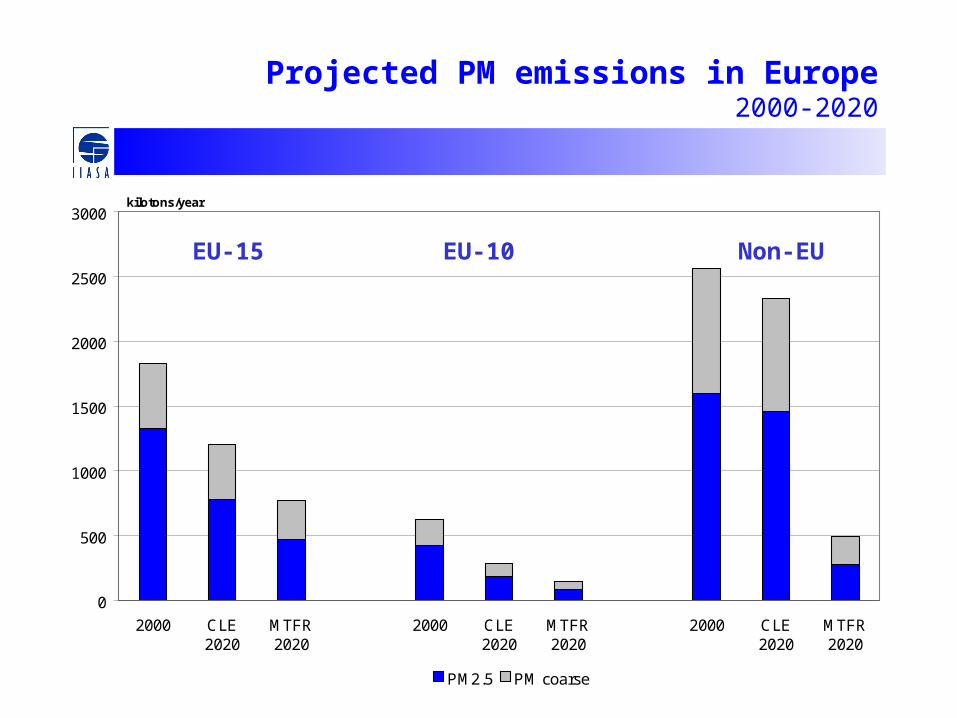
Projected PM emissions in Europe2000-2020
0
500
1000
1500
2000
2500
3000
2000 CLE2020
MTFR2020
2000 CLE2020
MTFR2020
2000 CLE2020
MTFR2020
kilotons/year
PM2.5 PM coarse
EU-15 EU-10 Non-EU
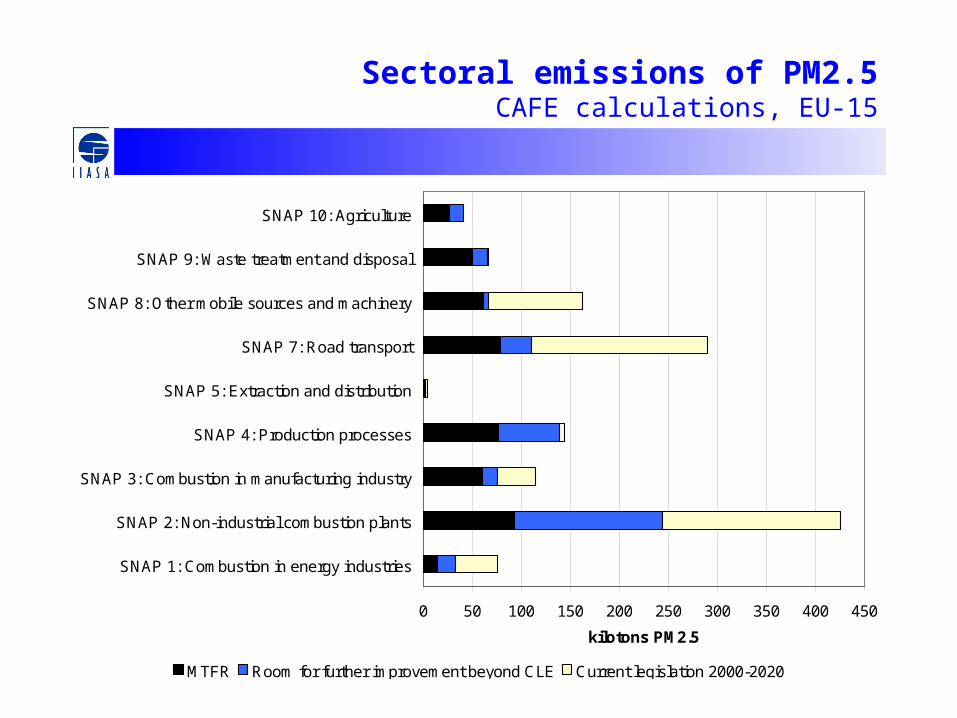
Sectoral emissions of PM2.5CAFE calculations, EU-15
0 50 100 150 200 250 300 350 400 450
SNAP 1: Combustion in energy industries
SNAP 2: Non-industrial combustion plants
SNAP 3: Combustion in manufacturing industry
SNAP 4: Production processes
SNAP 5: Extraction and distribution
SNAP 7: Road transport
SNAP 8: Other mobile sources and machinery
SNAP 9: Waste treatment and disposal
SNAP 10: Agriculture
kilotons PM2.5
MTFR Room for further improvement beyond CLE Current legislation 2000-2020
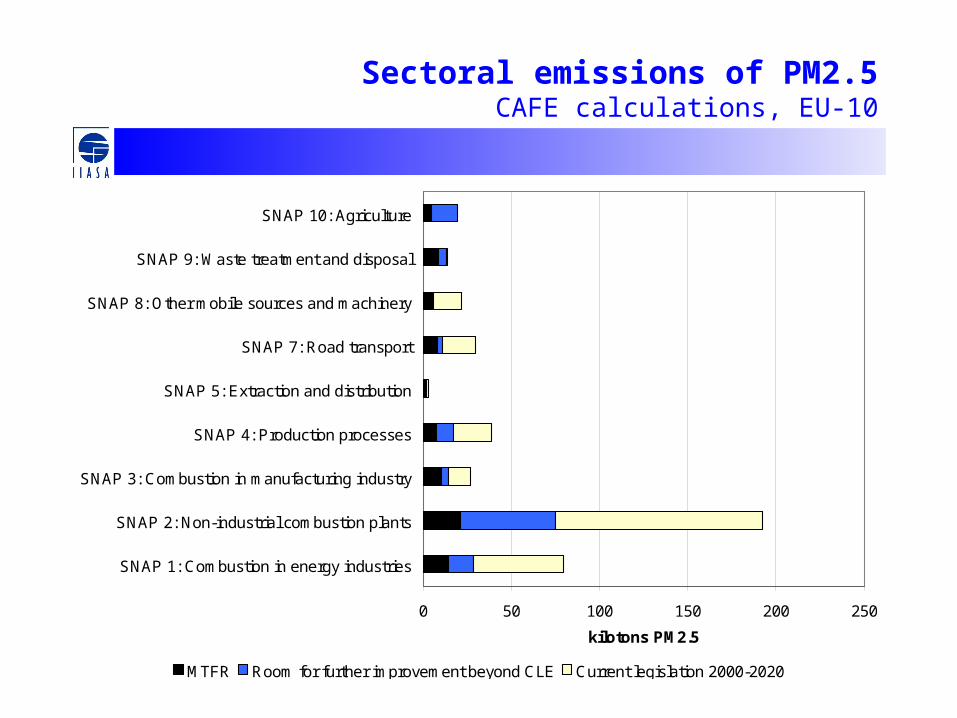
Sectoral emissions of PM2.5CAFE calculations, EU-10
0 50 100 150 200 250
SNAP 1: Combustion in energy industries
SNAP 2: Non-industrial combustion plants
SNAP 3: Combustion in manufacturing industry
SNAP 4: Production processes
SNAP 5: Extraction and distribution
SNAP 7: Road transport
SNAP 8: Other mobile sources and machinery
SNAP 9: Waste treatment and disposal
SNAP 10: Agriculture
kilotons PM2.5
MTFR Room for further improvement beyond CLE Current legislation 2000-2020
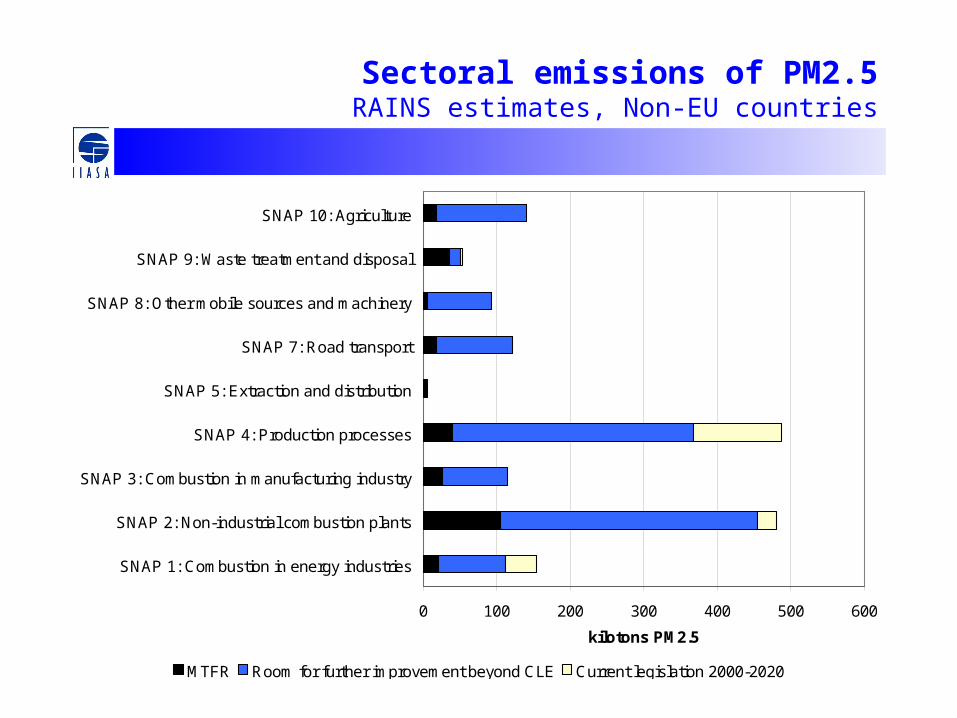
Sectoral emissions of PM2.5RAINS estimates, Non-EU countries
0 100 200 300 400 500 600
SNAP 1: Combustion in energy industries
SNAP 2: Non-industrial combustion plants
SNAP 3: Combustion in manufacturing industry
SNAP 4: Production processes
SNAP 5: Extraction and distribution
SNAP 7: Road transport
SNAP 8: Other mobile sources and machinery
SNAP 9: Waste treatment and disposal
SNAP 10: Agriculture
kilotons PM2.5
MTFR Room for further improvement beyond CLE Current legislation 2000-2020
Contribution to primary PM2.5 emissions “With climate measures” scenario, EU-15 [kt]
Industrial combustionIndustrial combustion
Industrial processes
Industrial processes
Diesel exhaust, cars
Diesel exhaust, cars
Diesel exhaust, HDT
Non-exhaust
Non-exhaust
Off-road
Off-road
Agriculture
Agriculture
Domestic, wood stoves
Domestic, wood stoves
0
200
400
600
800
1000
1200
1400
2000 2020
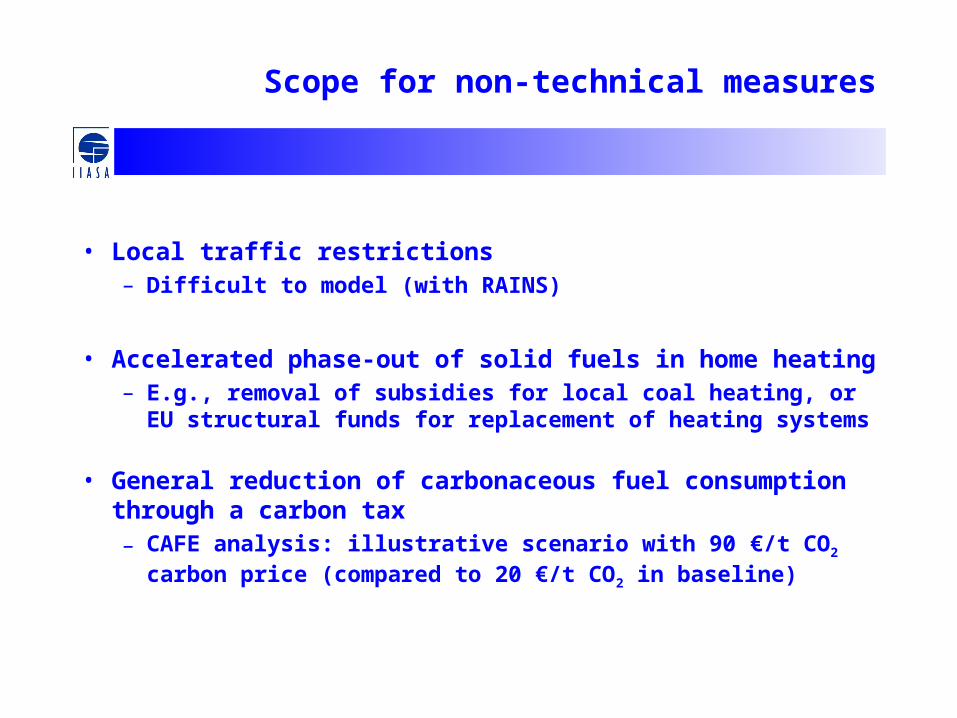
Scope for non-technical measures
• Local traffic restrictions– Difficult to model (with RAINS)
• Accelerated phase-out of solid fuels in home heating– E.g., removal of subsidies for local coal heating, or EU
structural funds for replacement of heating systems
• General reduction of carbonaceous fuel consumption through a carbon tax– CAFE analysis: illustrative scenario with 90 €/t CO2
carbon price (compared to 20 €/t CO2 in baseline)
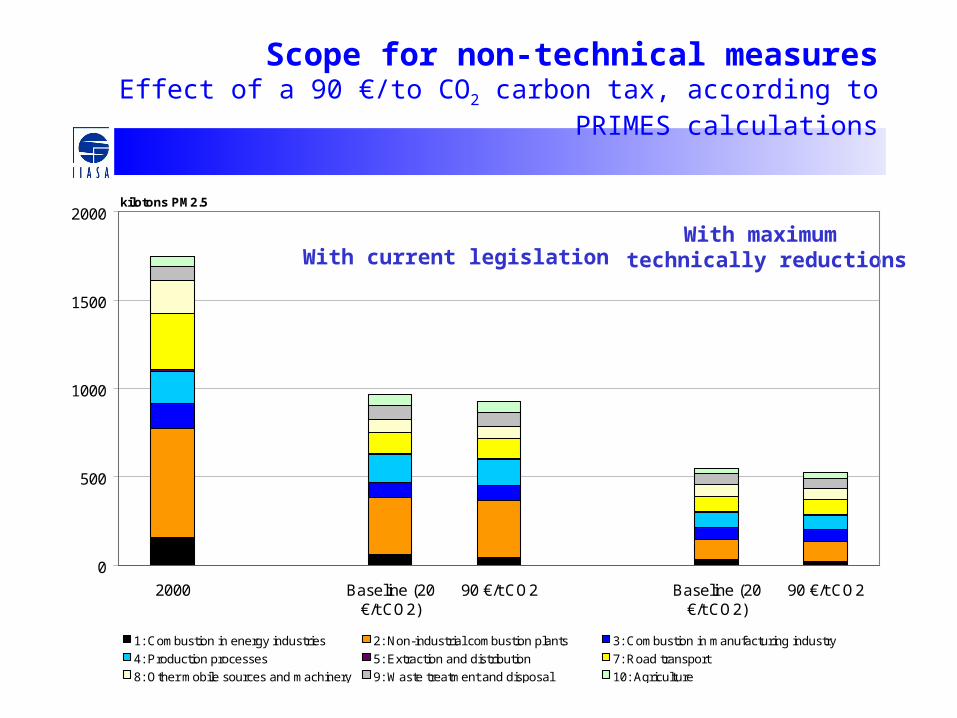
Scope for non-technical measuresEffect of a 90 €/to CO2 carbon tax, according to PRIMES
calculations
With current legislationWith maximum
technically reductions
0
500
1000
1500
2000
2000 Baseline (20€/t CO2)
90 €/t CO2 Baseline (20€/t CO2)
90 €/t CO2
kilotons PM2.5
1: Combustion in energy industries 2: Non-industrial combustion plants 3: Combustion in manufacturing industry
4: Production processes 5: Extraction and distribution 7: Road transport
8: Other mobile sources and machinery 9: Waste treatment and disposal 10: Agriculture

PM10 vs. PM2.5
How do measures directed at PM10 affect PM2.5?
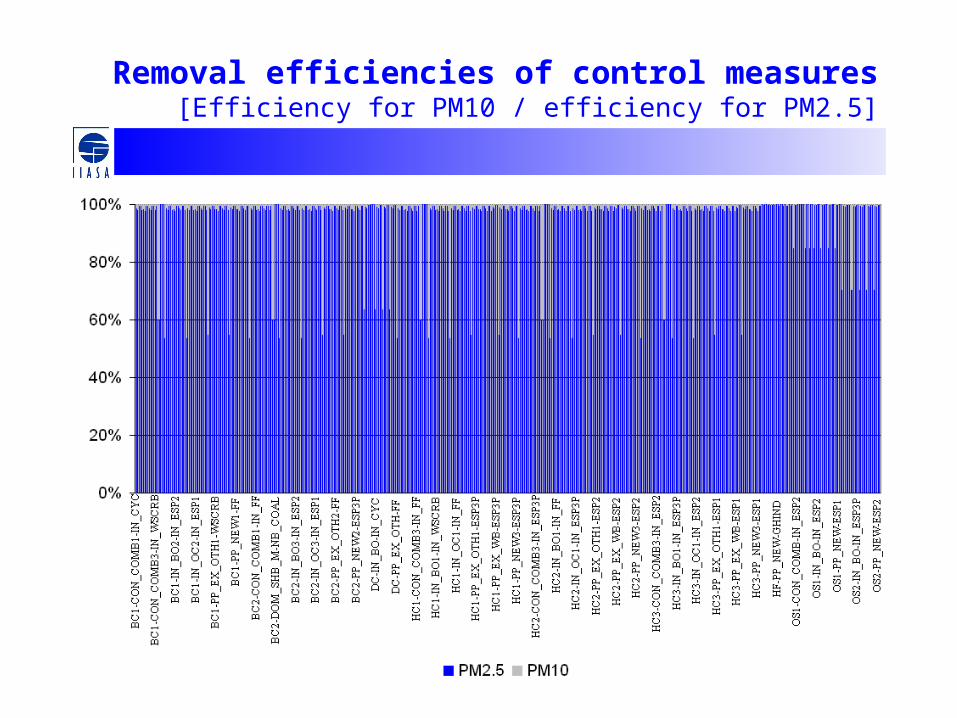
Removal efficiencies of control measures[Efficiency for PM10 / efficiency for PM2.5]
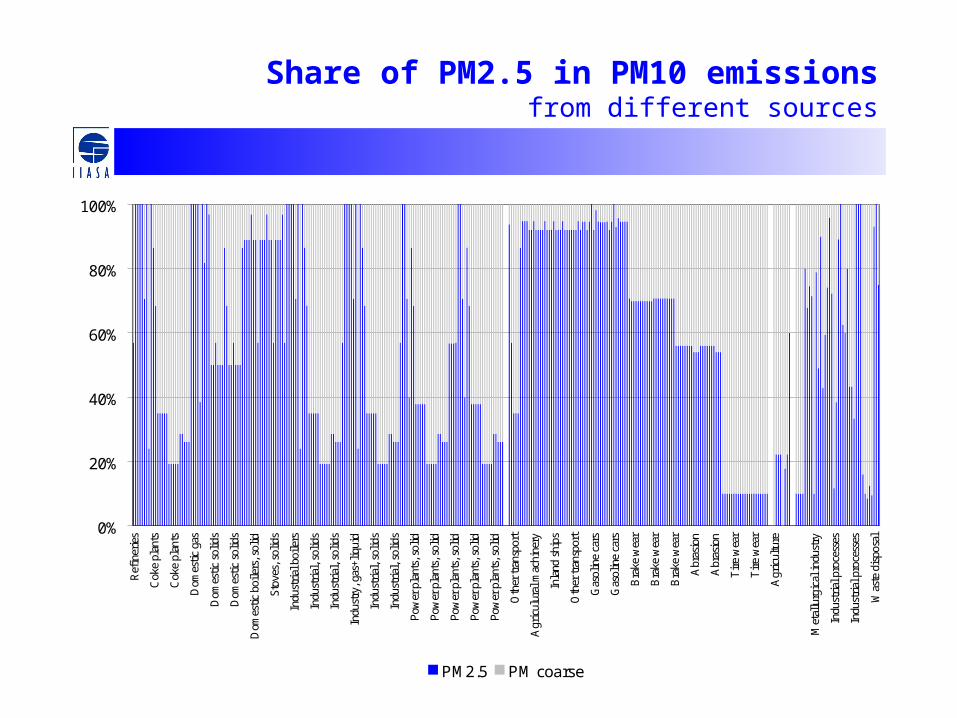
Share of PM2.5 in PM10 emissionsfrom different sources
0%
20%
40%
60%
80%
100%
Ref
iner
ies
Cok
e pl
ants
Cok
e pl
ants
Dom
esti
c ga
s
Dom
esti
c so
lids
Dom
esti
c so
lids
Dom
esti
c bo
ilers
, sol
id
Sto
ves,
sol
ids
Indu
stri
al b
oile
rs
Indu
stri
al, s
olid
s
Indu
stri
al, s
olid
s
Indu
stry
, gas
+liq
uid
Indu
stri
al, s
olid
s
Indu
stri
al, s
olid
s
Pow
er p
lant
s, s
olid
Pow
er p
lant
s, s
olid
Pow
er p
lant
s, s
olid
Pow
er p
lant
s, s
olid
Pow
er p
lant
s, s
olid
Oth
er tr
ansp
ort
Agr
icul
ural
mac
hine
ry
Inla
nd s
hips
Oth
er tr
ansp
ort
Gas
olin
e ca
rs
Gas
olin
e ca
rs
Bra
ke w
ear
Bra
ke w
ear
Bra
ke w
ear
Abr
asio
n
Abr
asio
n
Tir
e w
ear
Tir
e w
ear
Agr
icul
ture
Met
allu
rgic
al in
dust
ry
Indu
stri
al p
roce
sses
Indu
stri
al p
roce
sses
Was
te d
ispo
sal
PM2.5 PM coarse

Cost-optimized emission reductions
to reduce
health-relevant PM2.5 concentrations
in Europe
Based on WHO advice
of assuming equal potency of
all anthropogenic PM components
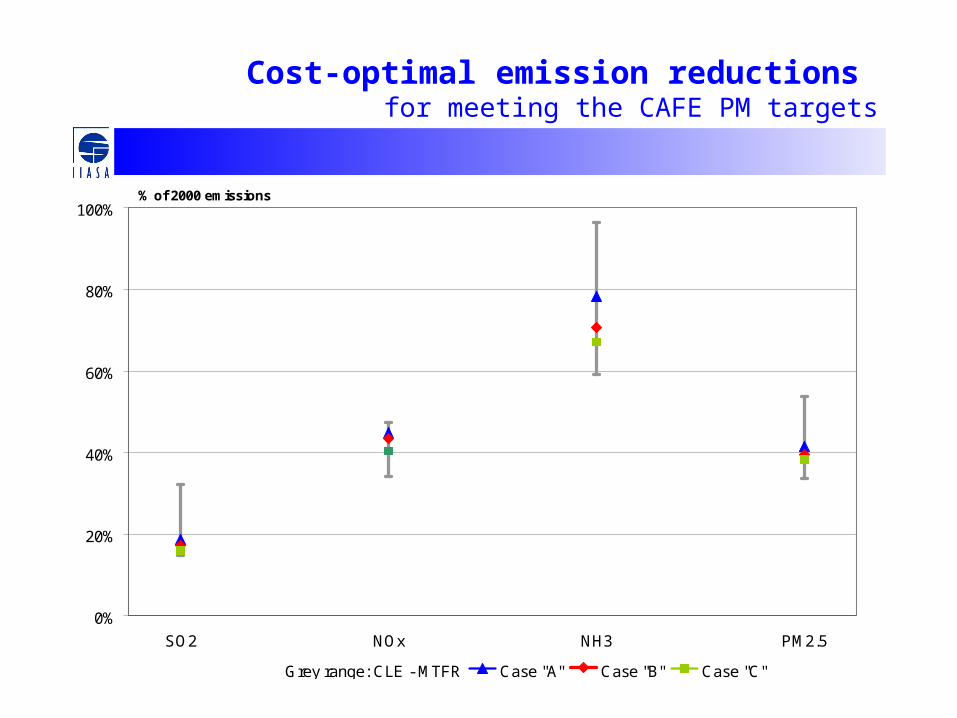
Cost-optimal emission reductions for meeting the CAFE PM targets
0%
20%
40%
60%
80%
100%
SO2 NOx NH3 PM2.5
% of 2000 emissions
Grey range: CLE - MTFR Case "A" Case "B" Case "C"
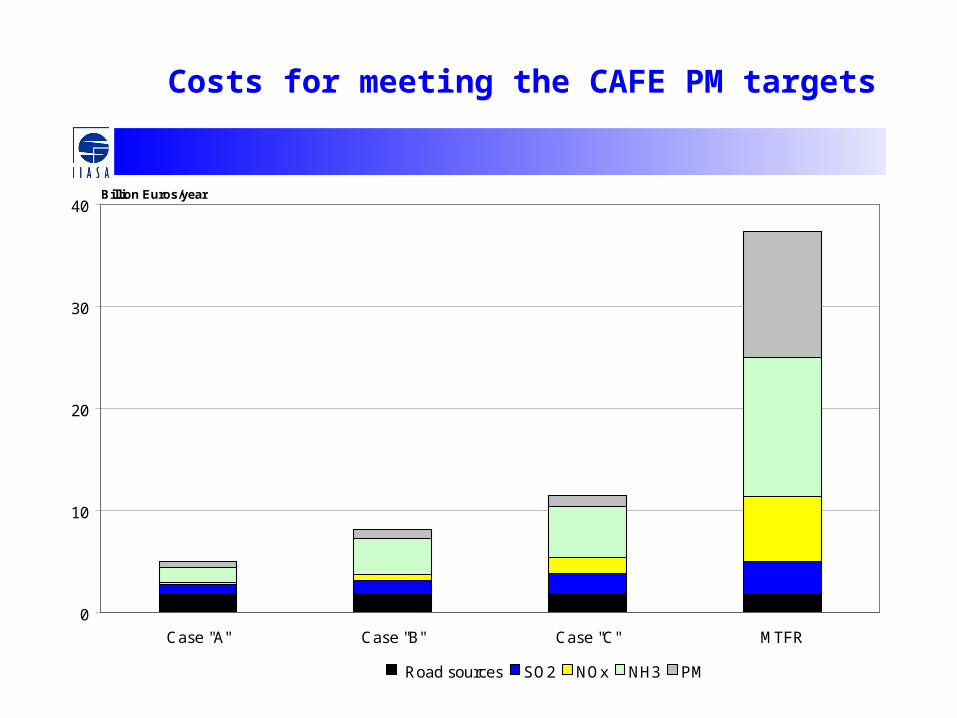
Costs for meeting the CAFE PM targets
0
10
20
30
40
Case "A" Case "B" Case "C" MTFR
Billion Euros/year
Road sources SO2 NOx NH3 PM
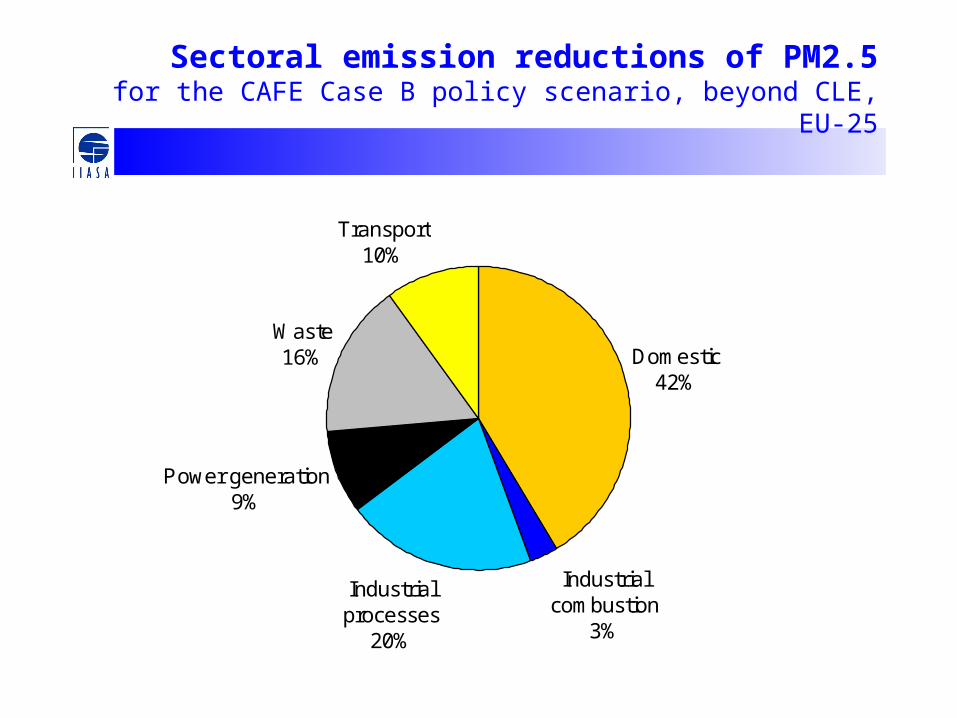
Sectoral emission reductions of PM2.5for the CAFE Case B policy scenario, beyond CLE, EU-25
Domestic42%
Industrial combustion
3%
Industrial processes
20%
Power generation9%
Waste16%
Transport10%
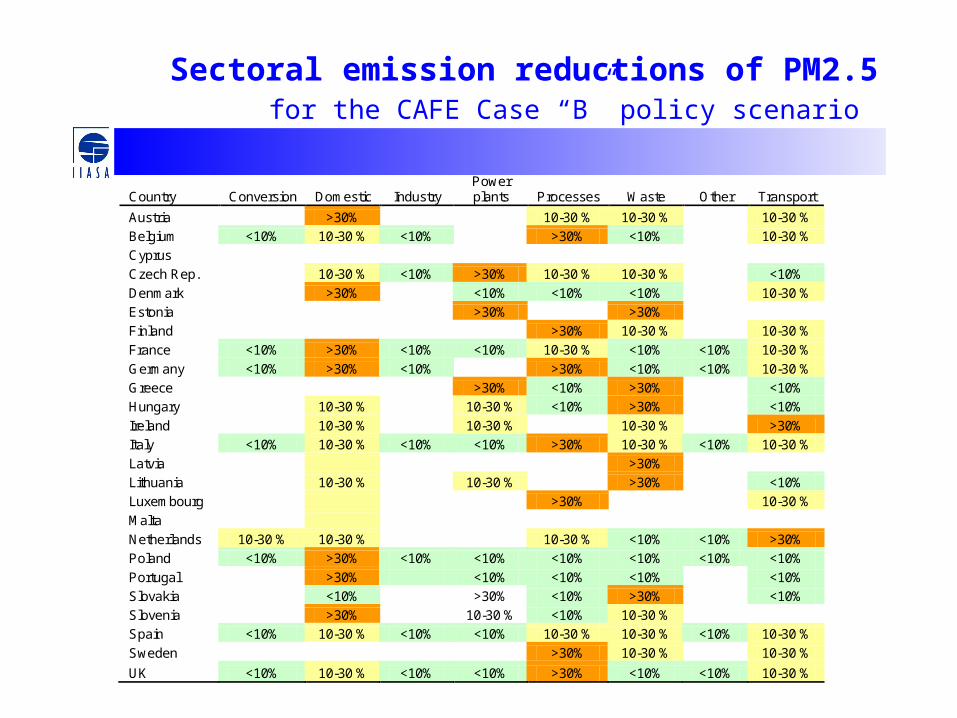
Sectoral emission reductions of PM2.5for the CAFE Case “B” policy scenario
Country Conversion Domestic Industry Power plants Processes Waste Other Transport
Austria >30% 10-30 % 10-30 % 10-30 %
Belgium <10% 10-30 % <10% >30% <10% 10-30 %
Cyprus
Czech Rep. 10-30 % <10% >30% 10-30 % 10-30 % <10%
Denmark >30% <10% <10% <10% 10-30 %
Estonia >30% >30%
Finland >30% 10-30 % 10-30 %
France <10% >30% <10% <10% 10-30 % <10% <10% 10-30 %
Germany <10% >30% <10% >30% <10% <10% 10-30 %
Greece >30% <10% >30% <10%
Hungary 10-30 % 10-30 % <10% >30% <10%
Ireland 10-30 % 10-30 % 10-30 % >30%
Italy <10% 10-30 % <10% <10% >30% 10-30 % <10% 10-30 %
Latvia >30%
Lithuania 10-30 % 10-30 % >30% <10%
Luxembourg >30% 10-30 %
Malta
Netherlands 10-30 % 10-30 % 10-30 % <10% <10% >30%
Poland <10% >30% <10% <10% <10% <10% <10% <10%
Portugal >30% <10% <10% <10% <10%
Slovakia <10% >30% <10% >30% <10%
Slovenia >30% 10-30 % <10% 10-30 %
Spain <10% 10-30 % <10% <10% 10-30 % 10-30 % <10% 10-30 %
Sweden >30% 10-30 % 10-30 %
UK <10% 10-30 % <10% <10% >30% <10% <10% 10-30 %
Conclusions
• In EU-25, primary PM emissions will decline by approx. 40% between 2000 and 2020 because of CLE (as are NOx and VOC emissions). No significant changes in non-EU countries.
• In EU-25, equal amount could be reduced in addition with currently available technical measures.
• Largest potentials for further reductions in domestic sector and for industrial processes.
• Co-benefits of PM2.5 reduction on PM10 depend on sector and measure chosen (and vice versa).
• Cost-effective approaches to reduce health-relevant PM concentrations involve other precursor emissions. Majority of costs occur for controlling other pollutants than for PM.
• In a cost-effective approach, largest reduction of primary PM should come from small sources and from industrial processes.