Embed Size (px)
Citation preview

1
March 26, 2014
The Length and Characteristics of the Grandparent Phase of Life: Variation by Race/Ethnicity
[Draft prepared for PAA 2014: Please do not cite without permission.]
Rachel Margolis
Abstract Demographic changes impact the absolute and relative length of time that we spend in different family roles. In this paper, I examine variation in the length and characteristics of grandparenthood. First, I examine the timing and frequency of grandparenthood among older Americans and examine the sources of race/ethnic differences in why older Americans are not (yet) grandparents- childlessness, children are childless, or child/grandchild mortality. Second, I use the Sullivan method to chart the absolute and relative time spent in two states – grandchild-less and with grandchildren – by sex and race/ethnicity. Last, I examine whether there are race/ethnic differences in key characteristics of grandparenthood that may affect the amount or quality of interaction with grandchildren, such as disability status, labor force participation, and proximity to grandchildren. Results highlight large subgroup differences in the demography of grandparenthood. Implications for family relationships and care-giving are discussed. Author Contact Information Rachel Margolis, Assistant Professor, Department of Sociology, University of Western Ontario Social Science Center #5326, London, Ontario N6C 5C2, Canada Email: [email protected]

2
Background
Demographic changes impact the absolute and relative length of time that we spend in different
family roles (Bengtson 2001; Crosnoe and Elder 2002; Glick and Park 1965; Treas and Bengtson
1982; Watkins, Menken and Bongaarts 1987; White and Preston 1996). One type of family
relationship that has been much affected by mortality and fertility decline is grandparenthood.
Americans will spend longer now as grandparents than earlier in history, due to mortality decline
(White and Preston 1996; Watkins, Menken and Bongaarts 1987). Children and grandchildren
are more likely to survive, and people more often live long enough to see grandchildren grow.
However, the level of fertility and family formation patterns have also changed (Bongaarts and
Feeney 1998; Bongaarts 2002; Bumpass and Lu 2000; Cherlin 2004; Teachman et al. 2000).
Fertility decline and the postponement of partnership, marriage, and fertility affect the proportion
of the population that ever become grandparents and the age at which grandparenthood begins.
Changes in mortality and fertility may offset each other to some degree, with mortality
increasing the length of time that one can spend as a grandparent and fertility pushing
grandparenthood later.
Documenting the demography of grandparenthood and its characteristics is important for
four main reasons. First, grandparents can provide key inputs to children, for cognitive
achievement and personal development (Hareven 1978; Hagestad and Burton 1986). Second,
grandparents can provide childcare if they live close enough and are in good health, which may
ease the strain for the sandwich generation and also allow the parents in the middle generation to
participate in the labor force (Aassve, Meroni and Pronzato 2012; Glaser and di Gessa 2012;
Hank and Buber 2009; Igel and Szydlik 2011). Third, grandmothers play an important role in
evolutionary explanations of longevity (Hawkes 2003) and if grandparenthood is being pushed

3
later and later, then this could help explain continued mortality decline at more advanced ages.
Last, grandparenthood is reported to be one of the most satisfying parts of older age (Lye 1996),
but it may be most satisfying when grandparents are in good health, retired from full-time work,
and live close to grandchildren. If people look forward to the grandparent phase, then a longer
than expected grandparent phase could positively affect inputs to health in order to be alive and
active during this phase.
Race/ethnic differences in family formation, fertility, and mortality create large subgroup
variation in the demography of grandparenthood. Earlier childbearing among African Americans
and Hispanics lead to an earlier transition to grandparenthood among these groups than non-
Hispanic whites in the U.S. (Smith et al. 1996. NCHS 2012; Raley and Sweeney 2009; Yang
and Morgan 2003) and different patterns of family integration and multigenerational living
arrangements mean different degrees of interaction with younger generations (Cherlin and
Furstenberg 1986; Coward and Cutler 1991; Cohen and Casper 2002; Keene and Batson 2010;
Mindel 1979). However, becoming a grandparent earlier may not mean a longer grandparent
phase of life, given race/ethnic differences in mortality. In this paper, I examine whether earlier
transitions to grandparenthood for ethnic minorities in the U.S. translate into longer
grandparenthood phases of life, or whether this is offset by mortality differences. I also examine
race/ethnic differences in the reasons for being grandchild-less by age, and whether there are
race/ethnic differences in key characteristics of grandparenthood (disability, labor force
participation, and proximity), which may affect the quality or degree of interaction with
grandchildren.

4
Race/Ethnic Differences in Grandparenthood in the United States
The vast majority of research on grandparenthood in the United States focuses on
multigenerational households, kin support and function, or grandparent-grandchild relationships.
There are clear race/ethnic differences in household membership and three generation
households (Coward and Cutler 1991; Cohen and Casper 2002; Keene and Batson 2010; Mindel
1979). This research shows that Hispanics and Blacks are much more likely than whites to live
with grandchildren, but it doesn’t tell us whether people have grandchildren. A second area of
research is on race/ethnic differences in kin support and kin functions (Lee and Aytac 1998;
Raley 1995; Roschelle 1997; Sarkisian et al. 2007; Stack 1974; Swartz 2009), with a focus on
specific population subgroups like young grandparents of black single mothers (Cherlin and
Furstenberg 1986; King and Elder 1995). A third area of research focuses on grandparent-
grandchild relationships (Barranti 1985; Crosnoe and Elder 2002; Silverstein and Long 1998;
Uhlenberg and Hammill 1998; Whitbeck, Hoyt, and Huck 1993).
Compared to these three areas of work, the demography of grandparenthood has been
much less studied. Several researchers examined the demographics of grandparenthood in the
1980s and 1990s, charting the average age at becoming a grandparent and the average number of
grandchildren (Sprey and Matthews 1982; Szinovacz 1998; Uhlenberg 1996). For example,
Sprey and Matthews (1982) find that the age at becoming a grandparent has not changed over
time. They write, “The median age at which mothers become grandmothers and has changed
very little during this century. Women who married in the 1950s and 60s can expect to become
grandmothers at slightly earlier ages 42 or 43 but for all the mothers who married in the 20th
century, the median age is only slightly higher than 45” (Sprey and Matthews 1982). Similarly,
using the National Survey of Families and Households, Szinovacz (1998) found that the

5
transition to grandparenthood (mean age at first grandchild among those who ever become
grandparents) occurred at 45.8 for women and 48.7 for men occurs during middle age whereas
the transition to great-grandparenthood typically happens in young old age 60-65. The mean,
however, obscures a lot of variation by race and socioeconomic status (Swartz 2009). Szinovacz
(1998) cites that close to one third experience off-time transitions, defined as either before 40 or
after 60.
There are several reasons why a new study of the demography of grandparenthood is
necessary. First, there have been important changes in fertility and mortality patterns over the 20-
30 years since the most recent studies of the demography of grandparenthood in the U.S. On the
one hand, grandparents are living longer, but on the other hand, fertility is lower and the mean
age at first birth has increased. It is unclear to what extent these changes cancel each other out in
determining the length of grandparenthood. Second, existing studies do not explicitly examine
what proportion of people never become grandparents or the reasons for being grandchild-less at
each age. I examine the reasons why there are differences in the frequency and timing of
grandparenthood. Third, the length of grandparenthood depends not only on when one becomes a
grandparent, but also on how long one will live. Previous work on race/ethnic differences in
grandparenthood has not taken account of the large differences in mortality by race/ethnicity in
the U.S. I use demographic methods to examine the absolute and relative length of
grandparenthood, taking into account the timing of grandparenthood and the number of
remaining years at each age. I examine to what extent earlier transitions to grandparenthood may
be offset by differential mortality.
In summary, this paper contributes to the literature on race/ethnic differences in
grandparenthood in the U.S. by examining two open questions. First, how does the frequency of
6
grandparenthood vary by sex and race/ethnicity and what are the sources of these differences
today? Second, how do the absolute and relative time spent as a grandparent differ by sex and
race/ethnicity, including both grandparenthood and remaining years of life given mortality
conditions?
Variation in Key Characteristics of the Grandparent Phase of Life
In addition to large differences in fertility and mortality by race/ethnicity, there are also large
differences in disability, labor force participation rates, and proximity to kin (Crimmins and
Saito 2001; Mendes de Leon et al. 2005; Lee and Mather 2008; Sarkisian, Gerena and Gerstel
2007; Sarkisian and Gerstel 2004), all of which can affect the amount or quality of interaction
between grandparents and grandchildren. These characteristics of grandparents also affect
whether they are available and able to provide childcare for grandchildren or whether they
require care themselves. It may be that grandparenthood is the most satisfying when one is in
good health, no longer works full-time and lives close to grandchildren. I examine how common
this is and how it varies by race/ethnicity in the US.
Research Questions
In this paper, I address three main research questions:
1. How common is grandparenthood among older Americans and how does the frequency
of grandparenthood vary by sex and race/ethnicity? I examine the source of race/ethnic
differences in why older Americans are not (yet) grandparents – childlessness and their
children being childless.

7
2. How do the absolute and relative time spent as a grandparent differ by sex and
race/ethnicity in the United States?
3. Are there race/ethnic differences in key characteristics of grandparenthood that may
affect the amount or quality of interaction with grandchildren, such as disability status,
labor force participation, and proximity to grandchildren?
Data
Data for this analysis are drawn from two data sources. The first is the Health and Retirement
Study (HRS), an aging study that is nationally representative of the U.S. population above age
50. The HRS Family Data file and Fat file, both prepared by RAND, contain information on the
numbers of types of children and grandchildren. Other information about respondents, such as
their disability status, labor force participation, and proximity to grandchildren are also available.
These data are ideal because they include a nationally representative sample of older Americans,
include an oversample of Hispanics and blacks, and include detailed data on respondents’
characteristics. The second data source used is U.S. life tables by sex and race/ethnicity from the
National Center for Health Statistics for the year 2008 (NCHS 2012). The year 2008 is examined
because this is the most recent year for which the RAND family file includes information on
children and grandchildren.
The analytic sample from the Health and Retirement Study is comprised of respondents
who were alive in 2008 and interviewed in that survey wave, either directly or through a proxy
interviewer (N=17,217). The sample includes only respondents ages 50 and above, thus
excluding younger spouses (N=16,858). Two exclusions are made. The first is that 295
respondents who were noted as “other” race are excluded because life tables were not available
8
for this population. Last, 41 respondents who were missing data on children and grandchildren
were excluded. The analytic sample for the HRS is 16,522, 98% of the age-eligible respondents.
The data are weighted to be nationally representative of individuals over age 50 in the United
States in 2008.
Key Measures
The demographic characteristics of age and sex are noted in the HRS tracker file. Race/ethnicity
is coded as non-Hispanic white, non-Hispanic black, and Hispanic. Children and grandchildren
are coded in an inclusive way, including biological and non-biological children and their
progeny. Respondents are coded as having children is they report any of their own biological,
step, or other types of children. Whether respondents have any grandchildren is coded from the
RAND Family Data file. If respondents have any grandchildren from biological, step, children
in-law or other children, they are coded as being a grandparent.
Other Measures
Disability is coded as whether the respondent reports having any difficulty with any of the
following tasks: walking several blocks, walking one block, walking across the room, climbing
several flights of stairs, and climbing one flight of stairs. Labor force participation is coded as a
dichotomous variable – whether the respondent is working full-time or not. Proximity to
grandchildren is measured as whether the respondent lives within 10 miles of any of his/her
children.
9
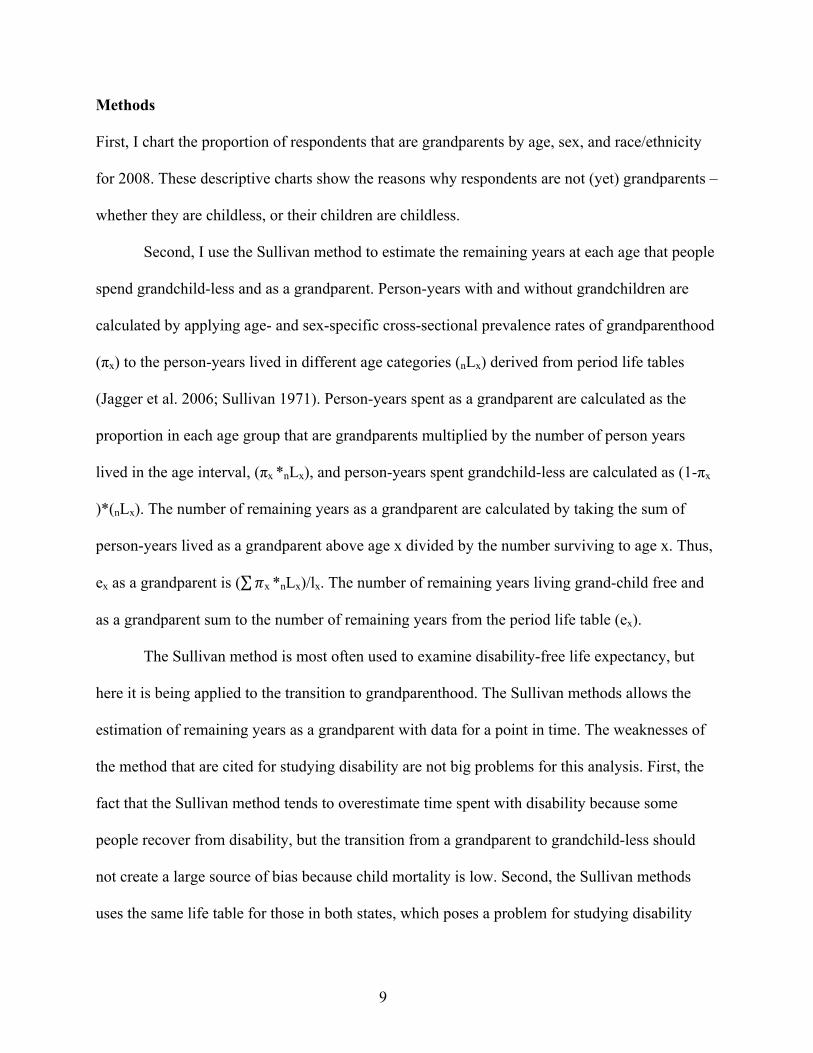
Methods
First, I chart the proportion of respondents that are grandparents by age, sex, and race/ethnicity
for 2008. These descriptive charts show the reasons why respondents are not (yet) grandparents –
whether they are childless, or their children are childless.
Second, I use the Sullivan method to estimate the remaining years at each age that people
spend grandchild-less and as a grandparent. Person-years with and without grandchildren are
calculated by applying age- and sex-specific cross-sectional prevalence rates of grandparenthood
(πx) to the person-years lived in different age categories (nLx) derived from period life tables
(Jagger et al. 2006; Sullivan 1971). Person-years spent as a grandparent are calculated as the
proportion in each age group that are grandparents multiplied by the number of person years
lived in the age interval, (πx *nLx), and person-years spent grandchild-less are calculated as (1-πx
)*(nLx). The number of remaining years as a grandparent are calculated by taking the sum of
person-years lived as a grandparent above age x divided by the number surviving to age x. Thus,
ex as a grandparent is ( 𝜋x *nLx)/lx. The number of remaining years living grand-child free and
as a grandparent sum to the number of remaining years from the period life table (ex).
The Sullivan method is most often used to examine disability-free life expectancy, but
here it is being applied to the transition to grandparenthood. The Sullivan methods allows the
estimation of remaining years as a grandparent with data for a point in time. The weaknesses of
the method that are cited for studying disability are not big problems for this analysis. First, the
fact that the Sullivan method tends to overestimate time spent with disability because some
people recover from disability, but the transition from a grandparent to grandchild-less should
not create a large source of bias because child mortality is low. Second, the Sullivan methods
uses the same life table for those in both states, which poses a problem for studying disability

10
because mortality is higher among the disabled than the healthy. However, there is no evidence
that mortality differs by grandparent status.
The last part of the analysis examines whether there are race/ethnic differences in key
characteristics of grandparenthood that may affect the intensity or quality of interaction with
grandchildren –whether the respondent is disabled, whether he/she works full-time, and whether
the respondent lives within 10 miles of at least one child. I use latent class analysis (LCA) to
estimate how many classes of grandparent characteristics there are for each age group (50-59,
60-69, 70-79) and what the classes represent. Latent class analysis estimates the sizes and
characteristics of a model with n classes, and then examines the log odds an individual i falls into
a given latent class relative to the reference class. LCA models were estimated using the LCA
Stata plugin and all models were weighted to be representative of the U.S. population above age
50 in 2008 (LCA Stata Plugin Version 1.0 2013; Lanza et al. 2011). After estimating the classes
for each age group, I test whether there are race/ethnic differences in the propensities to be in the
different classes of grandparenthood.
Results
The first set of results examines how the frequency of grandparenthood varies by sex and
race/ethnicity, and the reasons why older Americans are not (yet) grandparents (childlessness or
children being childless). Figure 1 presents the weighted percentages of adults that are
grandparents by age, sex, and race/ethnicity in the U.S. in 2008. Among respondents in their 50s,
there is a lot of variation by sex and race/ethnicity in the percentage with grandchildren. Less
than half of non-Hispanic whites are grandparents at ages 50-54, 46% of white women and 37%
of white men. However, about three quarters of Hispanics are grandparents by this time. Among
11
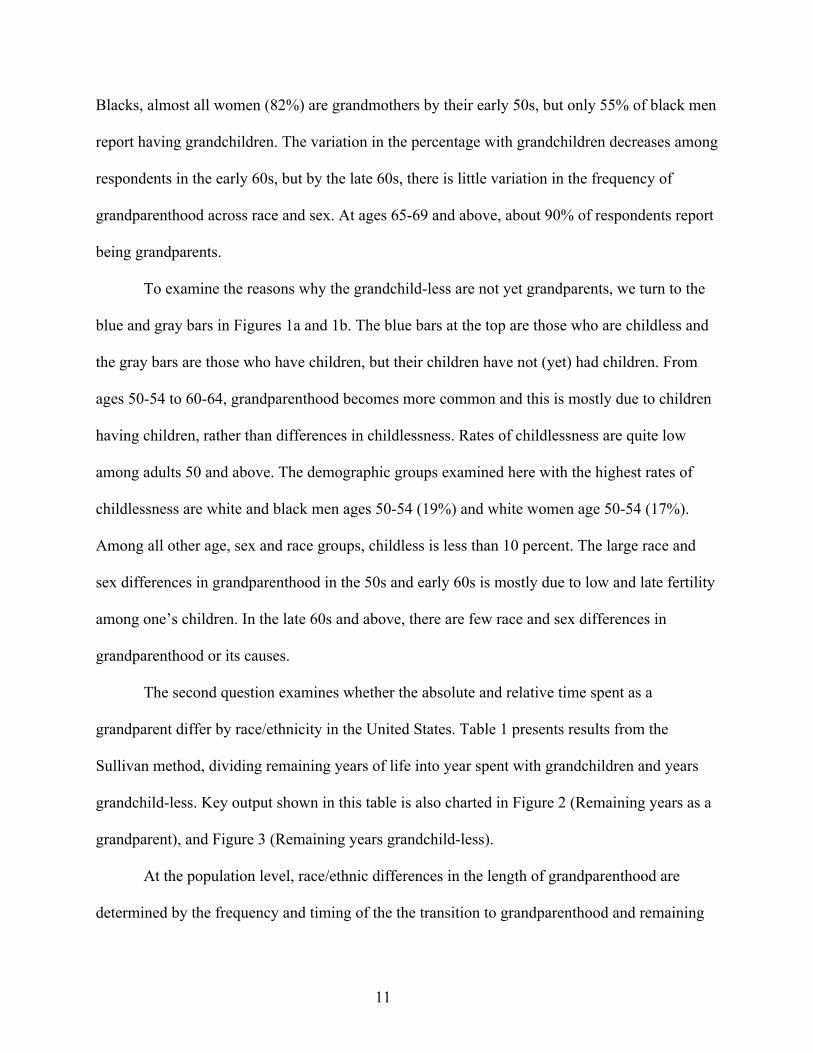
Blacks, almost all women (82%) are grandmothers by their early 50s, but only 55% of black men
report having grandchildren. The variation in the percentage with grandchildren decreases among
respondents in the early 60s, but by the late 60s, there is little variation in the frequency of
grandparenthood across race and sex. At ages 65-69 and above, about 90% of respondents report
being grandparents.
To examine the reasons why the grandchild-less are not yet grandparents, we turn to the
blue and gray bars in Figures 1a and 1b. The blue bars at the top are those who are childless and
the gray bars are those who have children, but their children have not (yet) had children. From
ages 50-54 to 60-64, grandparenthood becomes more common and this is mostly due to children
having children, rather than differences in childlessness. Rates of childlessness are quite low
among adults 50 and above. The demographic groups examined here with the highest rates of
childlessness are white and black men ages 50-54 (19%) and white women age 50-54 (17%).
Among all other age, sex and race groups, childless is less than 10 percent. The large race and
sex differences in grandparenthood in the 50s and early 60s is mostly due to low and late fertility
among one’s children. In the late 60s and above, there are few race and sex differences in
grandparenthood or its causes.
The second question examines whether the absolute and relative time spent as a
grandparent differ by race/ethnicity in the United States. Table 1 presents results from the
Sullivan method, dividing remaining years of life into year spent with grandchildren and years
grandchild-less. Key output shown in this table is also charted in Figure 2 (Remaining years as a
grandparent), and Figure 3 (Remaining years grandchild-less).
At the population level, race/ethnic differences in the length of grandparenthood are
determined by the frequency and timing of the the transition to grandparenthood and remaining

12
years of life at each age. Table 1 shows that there are large race/ethnic differences in both of
these measures for women and men. Among women in their early 50s, blacks are most often
grandparents, followed by Hispanics and then non-Hispanic whites. However, Hispanics have
the lowest mortality, with 35.0 remaining years at age 50, while blacks have 30.4 years and non-
Hispanic whites have 32.8 remaining years. When we take into account both grandparenthood
and mortality, we see that at age 50, Hispanics have the longest period of grandparenthood ahead
of them (29.8 years) and that the differences between black and white women decrease. Black
women have 26.0 years of grandparenthood at age 50 and white women have 25.3 years. We see
a similar pattern among Hispanic men as we did for the women, but not among black and white
men. At age 50, Hispanic men have the longest period of remaining years (31.4) followed by
white men (29.3 years) and then black men (25.4 years). Due to the high prevalence of
grandparenthood among Hispanic men and low mortality rates, they have many years of
grandparenthood ahead of them, 26.5 years at age 50. This is much higher than the remaining
years of grandparenthood for white men (20.7 years) or black men (19.1 years). The results for
remaining years as a grandparent are charted in Figure 3. Hispanic women have the most
remaining years as a grandparent, followed by black and white women and Hispanic men. The
groups with the fewest remaining years as a grandparent are white and then black men, given
their higher mortality than women of their race group and lower frequency of grandparenthood at
each age than the women.
Remaining years of life without grandchildren also varies by race and sex. This column
of data from Table 1 is plotted in Figure 3. This period is largest among white men and then
white women. At age 50, white men have 8.5 years grandchild-less and white women have 7.5

13
years. Black men have fewer grandchild-less years (6.3 years). Black women and Hispanic men
and women have the fewest grandchild-less years, between 4 and 5.2 years at age 50.
The last research question addresses whether there are race/ethnic differences in key
characteristics of grandparenthood that may affect the degree or quality of interaction with
grandchildren. Using latent class analysis, I estimated the best fitting number of classes given
four characteristics that affect interaction with grandchildren: disability status, labor force
participation, geographic proximity to grandchildren, and whether one is a grandparent. The
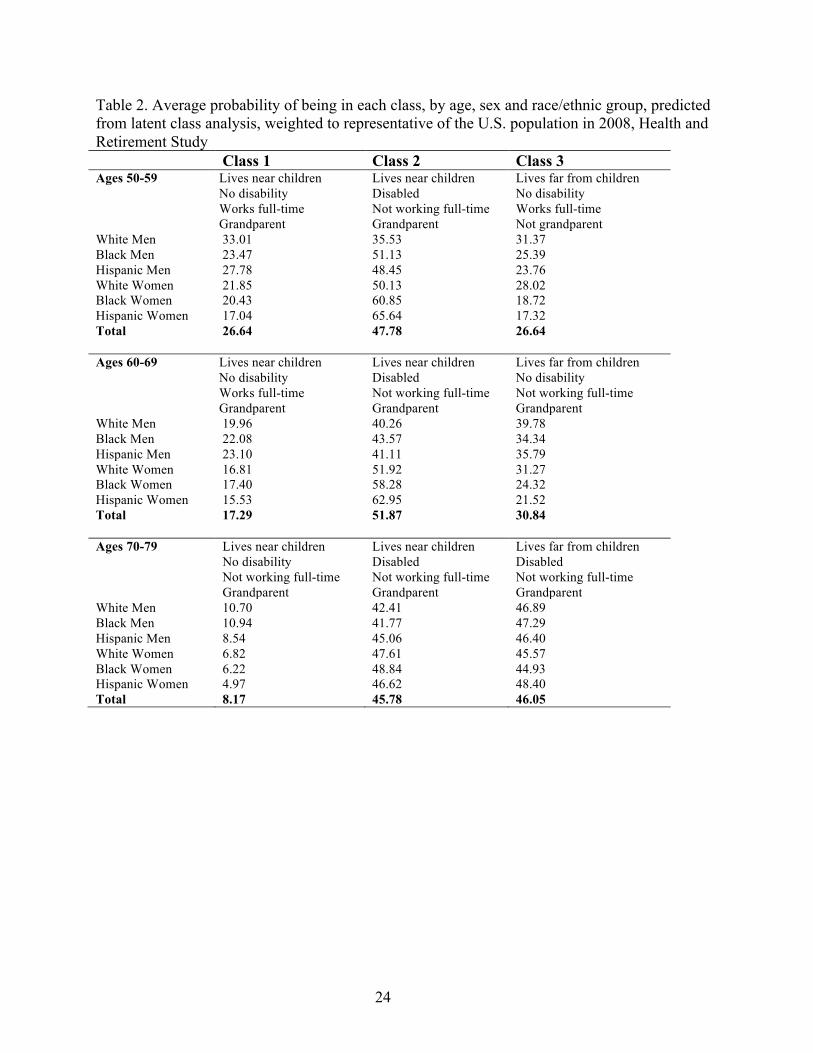
classes are shown in Table 2 for three age groups: ages 50-59, 60-69, and 70-79. The proportion
of each race and sex group in each class is shown in the table. Three classes fit the data best for
each of the three age groups, although the characteristics of the classes change over age. There
are large differences by race and sex in the proportion of these demographic groups in the
different classes.
Among respondents ages 50-59, most respondents were in a class characterized by being
a grandparent and living within 10 miles of a child (Classes 1 and 2). Class one is characterized
by grandparents who live close to children and are healthy and engaged in full-time work. This
includes one third of white men, about a quarter of black and Hispanic men, and about one fifth
of women. The second class also has grandchildren and have children that live nearby, but they
are disabled and not working full-time. This group includes 35 percent of white men, about half
of black and Hispanic men and white women, and almost two thirds of black and Hispanic
women. The third class is characterized by those who do not have grandchildren, live more than
10 miles from children, and are healthy and engaged in the labor force full-time. Membership in
this group was most common among white men (32%), white women (28%), and black men
(25%), but less common among black women and Hispanics.

14
Among respondents ages 60-69, the three classes are all characterized by
grandparenthood but vary on the other dimensions, some of which facilitate interaction with
grandchildren, some of which may interfere with it. The first class lives close to children and is
healthy and working full-time. This class comprises about 17% of the population and is more
common among men than women. The second class lives close to children and is characterized
by mobility problems and not working full-time. This is about half the sample and is more
common among women (52-63%) than men (40-43%). The third class lives far from children
and is in good health and fully engaged in the labor force. This group is 31 percent of the sample
and is more prevalent among men, especially white men, of which 40 percent belong to this
group and is least prevalent among Hispanic and black women (21-24%).
For respondents in their 70s, all three classes are characterized by having grandchildren
and not working full-time. However, they vary on proximity to children and health status. The
first class can be most engaged with grandchildren, as they live nearby and are in good health.
This is a relatively small group, about 8 percent of the population. Membership is more common
among white and black men (11%) and less common among women (5-7%). The second and
third classes are both comprised by people with mobility problems, but the second class lives
close to children and the third lives far from children. These two groups are split evenly, with 46
percent of the population in each group.
In summary, the characteristics that can facilitate or impede the quality and frequency of
interaction with grandchildren in older age vary in importance over the adult life course.
Moreover, there are large race and sex differences in the relative membership into different
classes, which point to the importance of different factors by subgroup. There are three
interesting points to note. First, between ages 50 and 69, non-Hispanic whites are much more
15
likely than other race groups to live further from their children, pointing to distance as a more
important impediment to interaction with grandchildren among this group. Second, at younger
ages, black and Hispanic women are much more likely to be disabled than other race and sex
groups, but also more likely to not be working full-time, pointing to different patterns of
interaction and care. Third, the group which is characterized by the most factors which facilitate
interaction with grandchildren – living nearby, not being disabled, not working full-time, and
having grandchildren, is a class only in the 70-79 age range. This group is comprised a relatively
small proportion of the sample, about eight percent.
Discussion
Large differences by race/ethnicity in family formation, fertility, and mortality create varied
demographic characteristics of grandparenthood. This paper builds on a large literature on
grandparenthood in the United States in three ways. First, I examine whether earlier transitions to
grandparenthood for Blacks and Hispanics are offset by differential mortality. Second, I examine
the reasons why respondents are not (yet) grandparents and whether being childless or children
being childless are more important for explaining why some groups are not (yet) grandparents.
Last, I examine race/ethnic differences in key characteristics of grandparenthood which may
affect the quality of degree of interaction with grandchildren.
Between ages 50 and 64, there are large differences by race and sex in the proportion
with grandchildren. Less than half of non-Hispanic whites are grandparents at ages 50-54 (46%
of white women and 37% of white men), but the majority of blacks and Hispanics are already
grandparents by ages 50-54. The later transition to grandparenthood among whites reflects
fertility postponement of both generations. Despite the large race and sex differences in the
16
frequency of having grandchildren among those 50-64, there are surprisingly few group
differences above age 65. After 65, 87-91 percent of women and 80-85 percent of men have
grandchildren. Between 10 and 20 percent of those above 65 report no grandchildren, half of
which is due to childlessness and half which is due to their children being childless.
To what extent are the earlier transitions to grandparenthood among blacks and Hispanics
offset by differential mortality? Using the Sullivan method, I estimated remaining years as a
grandparent at each age for each race/sex group. Among women, Hispanics have the longest
grandparent phase of life, due to earlier transitions to grandparenthood and low mortality. At age
50, Hispanic women have the longest period of grandparenthood ahead of them, 29.8 years.
Despite higher mortality among black women, black and white women have similar remaining
years as a grandparent at age 50, 26 years among black women and 25.3 years among white
women. The earlier transitions to grandparenthood among blacks are canceled out by high
mortality rates than whites. Among men, Hispanics have the longest grandparent phase, followed
by white men, and then black men. There is tremendous variation across race/sex groups in the
grandparent phase of life remaining at age 50. There is a decade of difference between the group
with the most years as a grandparent- Hispanic women with 29.8 years and the group with the
least time as a grandparent- black men with 19.1 years.
In addition to large differences in the length of the grandparent phase of life, there are
also large race/ethnic differences in the characteristics of grandparents that may facilitate greater
interaction with grandchildren. The specific characteristics that affect the quality of interaction
with grandchildren vary in importance over the adult life course. Between ages 50 and 69, non-
Hispanic whites are much more likely than other race groups to live further from their children,
pointing to distance as a more important impediment to interaction with grandchildren among

17
this group. Among black and Hispanic women, disability is the factor that impede interaction
with grandchildren, but among men, full-time work is a more important factor. Women may
have more frequent interaction with grandchildren earlier in life than their partners, a finding
which is paralleled in older work on grandparenthood (Cherlin and Furstenberg 1986). In the 60s
and 70s, disability and distance become more important factors in inhibiting interaction with
grandchildren, while work becomes a less important factor. The small size of the group
characterized by all factors which facilitate interaction with grandchildren – living nearby, not
being disabled, not working full-time, and having grandchildren. This was a class of older
Americans only in the 70-79 age range is comprised a relatively small proportion of the sample,
about eight percent.
There are limitations of this analysis. One is that the data do not allow the analysis of the
prevalence of grandparenthood for a representative sample younger than age 50. Thus, this
analysis focuses on the length of grandparenthood at the population level above age 50. Data
sources with representative data on grandparenthood among a younger sample would be ideal,
but are not available. Second, samples were not large enough to examine grandparenthood
among other race groups. Last, the latent class analysis is preliminary and needs to be further
developed to formally model and test group differences.
Despite limitations, this paper offers a new perspective on the examination of the length
and characteristics of the grandparenthood phase of life and how it varies by sex and
race/ethnicity in the U.S. Differences in fertility, family formation, and mortality create these
large group differences in the length of grandparenthood and social factors like mobility and
work affect types of interactions that occur. The length, timing, and characteristics of

18
grandparenthood have implications for the types and quality of family interactions and
caregiving both upwards and downwards.

19
References Aassve, Arnstein, Elena Meroni and Chiara Pronzato. 2012. Grandparenting and Childbearing in the Extended Family. European Journal of Population 28:499-518. Barranti Chrystal C. Ramirez. 1985. The Grandparent/Grandchild Relationship: Family Resource in an Era of Voluntary Bonds. Family Relations 34(3):343-352. Bengtson, V. 2001. Beyond the nuclear family: The increasing importance of multigenerational bonds. Journal of Marriage and Family 63:1-16. Bongaarts, John and Griffith Feeney. 1998. On the Quantum and Tempo of Fertility. Population and Development Review 24(2):271-291. Bongaarts, John. 2002. The end of the Fertility Transition in the Developed World. Population and Development Review 28(3):419-443. Bumpass, Larry and Hsien-Hen Lu. 2000. Trends in cohabitation and implications for children’s family contexts in the United States. Population Studies 54:29-41. Cherlin, Andrew J. 2004. The Deinstitutionalization of American Marriage. Journal of Marriage and Family 66:848-861. Cherlin, Andrew and Frank F. Furstenberg. 1986. The new American grandparent. New York: Basic Books. Cohen, Philip N. and Lynne M. Casper. 2002. In whose home? Multigenerational families in the United States, 1998-2000. Sociological Perspectives 45(1):1-20. Coward, Raymond T. and Stephen J. Cutler. 1991. The composition of multigenerational households that include elders. Research on Aging 1:55-73. Crimmins, Eileen M. and Yasuhiko Saito. 2001. Trends in healthy life expectancy in the United States, 1970-1990: gender, racial, and educational differences. Social Science & Medicine 52(11):1629-1641. Crosnoe, Robert and Glen Elder Jr. 2002. Life Course Transitions, the Generational Stake, and Grandparent-Grandchild Relationships. Journal of Marriage and Family 64:1089-1096. Glaser, Karen and Giorgio de Gessa. 2012. Grandparenting in Europe: Main Study Preliminary Findings Briefing. Online Memo. Glick, Paul C. and Robert Parke, Jr. 1965. New Approaches to Studying the Cycle of the Family. Demography 2:187-202. Hagestad, Gunhild O. and Linda M. Burton. 1986. Grandparenthood, Life Context, and Family Development. American Behavioral Scientist. 29:471.

20
Hank, Karsten and Isabella Buber. Grandparents Caring for their Grandchildren: Findings from the 2004 Survey of Health Ageing and Retirement in Europe. Journal of Family Issues 30(1):53. Hareven, Tamara K. 1978. The dynamics of kin in an industrial community. American Journal of Sociology 84 (Suppl.):S151-S182 Hawkes, Kristen. 2003. Grandmothers and the evolution of human longevity. American Journal of Human Biology 15(3):380-400. Igel, C. and Marc Szydlik. 2011. Grandchild care and welfare state arrangements in Europe. Journal of European Social Policy 21:210. Imai, K. and S. Soneji. 2007. On the Estimation of Disability-Free Life Expectancy: Sullivan's Method and Its Extension. Journal of the American Statistical Association 102(480):1199-1211. Jagger C., Cox, B., Le Roy, S., EHEMU. 2006. Health Expectancy Calculation by the Sullivan Method. Third Edition. EHEMU Technical Report September 2006. Keene, Jennifer Reid and Christie D. Batson. 2010. Under One Roof: A Review of Research on Intergenerational Coresidence and Multigenerational Households in the United States. Sociology Compass 4(8):642-657. King, Valerie and Elder, Glen H. 1995. American children view their grandparents: Linked lives across three rural generations. Journal of Marriage and the Family 57:166-178. LCA Stata Plugin (Version 1.0) Software. 2013. University Park: The Methodology Center, Penn State. Retrieved from methodology.psu.edu. Lanza, S.T., Dziak, J.J., Huang L., Wagner, A.T., & Collins, L.M. (2011). LCA Stata plugin users’ guide (Version 1.0). University Park: The Methodology Center, Penn State. Retrieved from methodology.psu.edu. Lee, Yean-Ju and Isik A. Aytac. 1998. Intergenerational Financial Support among Whites, Blacks, and Latinos. Journal of Marriage and the Family 60:426-41. Lye, N. Diane. 1996. Adult Child-Parent Relationships. Annual Review of Sociology. 22:79-102. Mendes de Leon, Carlos F., Lisa L. Barnes, Julia L. Bienias, Kimberly A. Skarupski, and Denis A. Evans. 2005. Racial Disparities in Disability: Recent Evidence from Self-Reported and Performance-Based Disability Measures in a Population-Based Study of Older Adults. Journal of Gerontology B Social Sciences 60(5):S263-S271. Mindel, Charles H. 1979. Multigenerational Family Households: Recent Trends and Implications for the Future. The Gerontologist 19(5):456-463.

21
NCHS 2012. United States Life Tables, 2008. National Vital Statistics Reports. Volume 61, Number 3. U.S. Department of Health and Human Services. Lee, Marlene A. and Mark Mather. 2008. U.S. Labor Force Trends. Population Bulletin: A publication of the Population Reference Bureau. Raley, R. Kelly. 1995. Black-White Differences in Kin Contact and Exchange Among Never Married Adults. Journal of Family Issues 16(1):77-103. Raley, R. Kelly and Megan M. Sweeney. 2009. Explaining race and ethnic variation in marriage: Directions for Future Research. Race and Social Problems 1:132-142. Roschelle, Anne R. 1997. No More Kin: Exploring Race, Class, and Gender in Family Networks. Thousand Oaks, CA: Sage Publications. Sarkisian, Natalia and Naommi Gerstel. 2004. Kin Support among Blacks and Whites: Race and Family Organization. American Sociological Review 69:812. Sarkisian, Natalia, Mariana Gerena and Naomi Gerstel. 2007. Extended Family Integration Among Euro and Mexican Americans: Ethnicity, Gender, and Class. Journal of Marriage and Family 69:40-54. Silverstein, Merril and Jeffrey D. Long. 1998. Trajectories of Grandparents' Perceived Solidarity with Adult Grandchildren: A Growth Curve Analysis over 23 Years. Journal of Marriage and Family 60(4):912-923. Smith, Herhert L. S. Philip Morgan and Tanya Koropeckyj-Cox. 1996. A decomposition of trends in the nonmarital fertility ratios of blacks and whites in the United States. 1960-1992. Demography 33(2):141-151. Sprey, Jetse and Sarah H. Matthews. 1982. Contemporary Grandparenthood: A Systematic Transition. Annals of the American Academy of Political and Social Science 464:91-103. Stack, Carol. B. 1974. All our kin: Strategies for survival in a Black community. New York: Harper and Row. Sullivan, D. 1971. A Single Index of Mortality and Morbidity. HSMHA Health Reports 86, 347-354. Swartz, Tereesa Toguchi. 2009. Intergenerational Family Relations in Adulthood: Patterns, Variations, and Implications in the Contemporary United States. Annual Review of Sociology 35:191-212. Szinovacz, Maximiliane E. 1998. Grandparents Today: A Demographic Profile. The Gerontologist 38(1):37-52.
22
Teachman, Jay D., Lucky M Tedrow, and Kyle D. Crowder. 2000. The Changing Demography of America’s Families. Journal of Marriage and Family 62:1234-1246. Treas, J. and V.L. Bengtson 1982. The demography of mid and later life transitions. Annals of the American Academy of Political and Social Science 464: 11-21. Uhlenberg, P. 1996. Mutual Attraction: Demography and Life Course Analysis. The Gerontologist 5(4):226-29. Uhlenberg, Peter and Bradley G. Hammill. 1998. Frequency of Grandparent Contact with Grandchild Sets: Six Factors that Make a Difference. The Gerontologist 38(3):276-285. Watkins, S., Menken and Bongaarts. 1987. Demographic Foundations of Family Change. American Sociological Review. White and Samuel H. Preston 1996. How many Americans are alive today because of 20th c improvements in mortality? Population and Development Review. Whitbeck, Les B., Danny R Hoyt, and Shirley M. Huck. 1993; Family Relationship History, Contemporary Parent-Grandparent Relationship Quality and the Grandparent-Grandchild Relationship. Journal of Marriage and Family 55(4):1025-1035. Yang, Yang and S. Philip Morgan. 2003. How big are educational and racial fertility differentials in the U.S.? Biodemography and Social Biology 50(3-4):167-187. Zhang, Y., Engelman, M., Agree, E.M. 2012. Moving considerations: A longitudinal analysis of parent-child residential proximity for older Americans. Research on Aging

23
Table 1. Remaining life expectancy with and without grandchildren by sex and race/ethnicity, 2008 Age % with
Grandchildren
Remaining years (ex)
Remaining years as Grandparent
Remaining years Grandchild-less
% Remaining years as Grandparent
% Remaining years Grandchild-less
NH White Women 50-54 46.5 32.85 25.31 7.54 0.7705 0.2295 55-59 64.5 28.40 23.43 4.97 0.8249 0.1751 60-64 79.9 24.07 20.77 3.30 0.8627 0.1373 65-69 87.0 19.96 17.55 2.41 0.8790 0.1210 70-74 90.3 16.12 14.21 1.90 0.8819 0.1181 75-79 88.7 12.58 10.98 1.60 0.8731 0.1269 80+ 86.5 9.42 8.15 1.27 0.8650 0.1350 NH Black Women 50-54 82.8 30.43 26.03 4.39 0.8556 0.1444 55-59 78.3 26.34 22.68 3.66 0.8609 0.1391 60-64 86.1 22.44 19.71 2.72 0.8787 0.1213 65-69 91.1 18.77 16.59 2.19 0.8836 0.1164 70-74 91.3 15.36 13.43 1.93 0.8742 0.1258 75-79 86.4 12.20 10.46 1.74 0.8571 0.1429 80+ 85.3 9.41 8.02 1.38 0.8530 0.1470 Hispanic Women 50-54 74.5 35.06 29.84 5.21 0.8514 0.1486 55-59 77.8 30.51 26.51 4.00 0.8689 0.1311 60-64 90.2 26.08 23.12 2.96 0.8865 0.1135 65-69 87.0 21.81 19.26 2.55 0.8829 0.1171 70-74 87.6 17.79 15.77 2.02 0.8867 0.1133 75-79 87.8 14.03 12.50 1.53 0.8906 0.1094 80+ 89.7 10.65 9.55 1.10 0.8970 0.1030 NH White men 50-54 37.2 29.26 20.73 8.53 0.7086 0.2914 55-59 53.4 25.10 19.50 5.60 0.7767 0.2233 60-64 74.0 21.11 17.64 3.47 0.8356 0.1644 65-69 82.5 17.34 14.98 2.36 0.8641 0.1359 70-74 86.5 13.85 12.18 1.68 0.8790 0.1210 75-79 90.0 10.70 9.48 1.22 0.8860 0.1140 80+ 87.6 7.96 6.97 0.99 0.8760 0.1240 NH Black Men 50-54 54.8 25.43 19.11 6.31 0.7517 0.2483 55-59 65.8 21.71 17.37 4.34 0.8000 0.2000 60-64 79.3 18.38 15.44 2.93 0.8404 0.1596 65-69 84.4 15.28 13.09 2.19 0.8569 0.1431 70-74 88.9 12.47 10.76 1.71 0.8626 0.1374 75-79 80.1 9.83 8.33 1.50 0.8475 0.1525 80+ 88.4 7.59 6.71 0.88 0.8840 0.1160 Hispanic Men 50-54 75.8 31.42 26.46 4.96 0.8422 0.1578 55-59 68.7 27.11 23.26 3.85 0.8579 0.1421 60-64 89.4 23.03 20.63 2.40 0.8958 0.1042 65-69 80.0 19.13 17.14 1.98 0.8963 0.1037 70-74 91.4 15.52 14.41 1.11 0.9287 0.0713 75-79 88.9 12.19 11.40 0.79 0.9351 0.0649 80+ 96.3 9.17 8.83 0.34 0.9630 0.0370
24
Table 2. Average probability of being in each class, by age, sex and race/ethnic group, predicted from latent class analysis, weighted to representative of the U.S. population in 2008, Health and Retirement Study Class 1 Class 2 Class 3 Ages 50-59 Lives near children
No disability Works full-time Grandparent
Lives near children Disabled Not working full-time Grandparent
Lives far from children No disability Works full-time Not grandparent
White Men 33.01 35.53 31.37 Black Men 23.47 51.13 25.39 Hispanic Men 27.78 48.45 23.76 White Women 21.85 50.13 28.02 Black Women 20.43 60.85 18.72 Hispanic Women 17.04 65.64 17.32 Total 26.64 47.78 26.64 Ages 60-69 Lives near children
No disability Works full-time Grandparent
Lives near children Disabled Not working full-time Grandparent
Lives far from children No disability Not working full-time Grandparent
White Men 19.96 40.26 39.78 Black Men 22.08 43.57 34.34 Hispanic Men 23.10 41.11 35.79 White Women 16.81 51.92 31.27 Black Women 17.40 58.28 24.32 Hispanic Women 15.53 62.95 21.52 Total 17.29 51.87 30.84 Ages 70-79
Lives near children No disability Not working full-time Grandparent
Lives near children Disabled Not working full-time Grandparent
Lives far from children Disabled Not working full-time Grandparent
White Men 10.70 42.41 46.89 Black Men 10.94 41.77 47.29 Hispanic Men 8.54 45.06 46.40 White Women 6.82 47.61 45.57 Black Women 6.22 48.84 44.93 Hispanic Women 4.97 46.62 48.40 Total 8.17 45.78 46.05

25
Figures 1a (Men) and 1b (Women). Proportion grandparents, with childless children, and childless, by age, sex, and race/ethnicity, weighted to be representative of the U.S. population in 2008. (Data source: HRS)
0.2
.4.6
.81
50-54 55-59 60-64 65-69 70-74 75-79 80+W B H W B H W B H W B H W B H W B H W B H
Summary of grandparenthood by race, Men 2008
Grandparent Children childlessChildless
0.2
.4.6
.81
50-54 55-59 60-64 65-69 70-74 75-79 80+W B H W B H W B H W B H W B H W B H W B H
Summary of grandparenthood by race, Women 2008
Grandparent Children childlessChildless

26
Figure 2. Remaining years as a grandparent by sex, age and race/ethnicity
Notes: H denotes Hispanics. B denotes non-Hispanic blacks. W denotes non-Hispanic whites. Figure 3. Remaining years grandchild-less by sex, age, and race/ethnicity
Notes: H denotes Hispanics. B denotes non-Hispanic blacks. W denotes non-Hispanic whites.
0
5
10
15
20
25
30
35
50-54 55-59 60-64 65-69 70-74 75-79 80+
H Men
B Men
W Men
H Women
B Women
W Women
0
1
2
3
4
5
6
7
8
9
50-54 55-59 60-64 65-69 70-74 75-79 80+
H Men
B Men
W Men
H Women
B Women
W Women