Embed Size (px)
Citation preview

intu properties plc Annual report 2015
The intu difference

At intu we are passionate about providing people with their perfect shopping experience.
We create compelling experiences that surprise and delight our customers.
And it’s this that powers our business, creating value for our retailers, our communities and our investors and drives our long-term success.
Go online intugroup.co.uk/ar2015
Welcome to our annual report 2015

Read more content in the
annual report
Read more content at
intugroup.co.uk
Overview
Key highlights of 2015 2
Top properties – our portfolio at a glance 4
Strategic report
Chairman’s statement 6
Interview with the Chief Executive 8
Our growth story 10
Investment case 12
The intu difference
What drives our success 15
Understanding our market 16
Optimising asset performance 19
UK development momentum 20
Making the brand count 23
Seizing the growth opportunity in Spain 24
A national company with a local face 27
Our business model 28
Relationships 30
Strategy overview 32
Key performance indicators 34
intu Potteries case study 36
Principal risks and uncertainties 37
Operating review 40
Financial review 46
Corporate responsibility 52
Our people 56
Governance
Chairman’s introduction 58
Board of Directors 60
Executive Committee 62
The Board 63
Relations with shareholders 69
Focus on risk 70
Audit Committee 72
Nomination and Review Committee 76
Directors’ remuneration report 78
Directors’ report 92
Statement of Directors’ responsibilities 94
Accounts
Independent auditors’ report 96
Consolidated income statement 102
Consolidated statement
of comprehensive income 103
Balance sheets 104
Statements of changes in equity 105
Statements of cash flows 108
Notes to the accounts 109
Other information
Investment and development property 160
Financial covenants 162
Financial information including
share of joint ventures 164
Underlying profit statement 167
EPRA performance measures 168
Financial record 172
Glossary 173
Dividends 175
Shareholder information 176
Corporate responsibilitypage 52 Our growth story
page 10
with our Chief Executive David Fischelpage 8
Operating review page 40
Financial reviewpage 46
The intudifferencepage 13
How have we performed in the year?
intugroup.co.uk 1Contents

Key highlights of 2015
Key financial highlights1
Our results for the year show growth in net rental income, underlying earnings, property valuation and net asset value:
— net rental income increased by 8 per cent, due to a
return to like-for-like growth of 1.8 per cent and the
full-year impact of acquisitions
— property revaluation surplus of £351 million represents
a like-for-like increase in capital values of 4.0 per cent
in the year, outperforming the IPD monthly retail index
which increased by 2.8 per cent
— profit for the year of £518 million included £351 million
property revaluation surplus (2014: £600 million included
£648 million property revaluation surplus)
— underlying earnings per share increased by 7 per cent
to 14.2 pence (2014: 13.3 pence)
— net asset value per share (diluted, adjusted) increased
to 404 pence, an increase of 25 pence, delivering a total
financial return in the year of 10 per cent including dividend
— debt to assets ratio improved to 43.1 per cent and on
a pro forma basis to 41.0 per cent, after the disposal
of the Equity One investment in January 2016
— cash and available facilities of £588 million at
31 December 2015 with a further £202 million
received from the disposal of Equity One shares
in January 2016
Net rental income2
£428m(2014: £397m)
Property revaluation surplus2
£351m(2014: £648m)
Underlying EPS
14.2p(2014: 13.3p)
Market value of investment properties2
£9,602m(2014: £8,963m)
NAV per share (diluted, adjusted)
404p(2014: 379p)
Underlying earnings
£187m(2014: £162m)
Profit for the year
£518m(2014: £600m)
Dividend per share
13.7p(2014: 13.7p)
Net external debt2
£4,139m(2014: £3,963m)
Debt to assets ratio2
43.1%3
(2014: 44.2%)
1 Please refer to glossary for definition of terms.
2 Including Group’s share of joint ventures.
3 Pro forma of 41.0 per cent after cash realised from
disposal of Equity One investment in January 2016.
Presentation of information
Amounts are presented including the Group’s share
of joint ventures.
See financial review, page 46, for details
intu properties plc Annual report 20152

Optimising asset performance
Our focus is to deliver attractive long-term total property returns from strong, stable income streams and capital appreciation
— increased like-for-like net
rental income by 1.8 per cent
in the year, a return to growth,
reflecting the benefits of
active asset management
over the last few years
— signed 261 long-term leases
for £46 million new annual
rent at an average 10 per cent
above previous passing rent
— increased occupancy to 96 per
cent from strong levels of new
lettings (December 2014:
95 per cent)
— increased retailer sales
by 2 per cent and footfall
remained robust across
the portfolio
UK development momentum
By extending and enhancing our existing locations we aim to deliver superior returns
— completed the £42 million
mall refreshment and
restaurant quarter at intu
Victoria Centre and the £19
million leisure extension at
intu Potteries, generating
a combined £3.6 million of
new annual rent
— on site with three restaurant
projects costing £30 million
(intu share) at intu Eldon
Square (20 units), intu
Metrocentre (11 units) and
intu Bromley (five units). All
are due to complete in 2016
and are substantially let
— on site with the £178 million
leisure and retail extension
of intu Watford anchored by
Cineworld and Debenhams
— due to commence
redevelopment of intu
Broadmarsh and the leisure
extension at intu Lakeside
in 2016
Making the brand count
We aim to leverage the strength of our brand to create compelling experiences that deliver results
— over 24 million website
visits in 2015, a year-on-year
increase of over 30 per cent
— delivered strong metrics on
marketing campaigns from an
active marketing database of
over two million subscribers
— continued improvement
in net promoter score, up
20 per cent year-on-year,
and driving dwell times
— delivered nationwide,
immersive multichannel
events with global brands,
such as MasterCard and
20th Century Fox
Seizing the growth opportunity in Spain
Our Spanish strategy is to create a business of national scale through acquisitions and development projects
— completed the €451 million
acquisition of Puerto Venecia,
Zaragoza and brought in
CPPIB as our 50 per cent
joint venture partner
— introduced the intu brand
to Spain, rebranding Parque
Principado, Oviedo, as
intu Asturias
— delivered positive operating
metrics from these two
top-10 centres with footfall
and sales up 3 per cent and
10 per cent respectively,
both outperforming the
Spanish benchmarks
— exercised option to take
ownership of development
site and furthered tenant
demand for the planned
shopping resort development,
intu Costa del Sol, near
Málaga. We anticipate being
on site before the end of 2016
intugroup.co.uk 3OverviewKey highlights of 2015

Top properties Our portfolio at a glanceintu owns and manages some of the best shopping centres, in some of the strongest locations, across the UK and in Spain, including nine of the UK’s top 20
intu Merry Hill
intu Lakeside
intu Asturias intu Trafford Centre
intu Victoria Centre
intu Derby
intu Metrocentre
intu properties plc Annual report 20154

Market
value
Size
(sq ft
000)
%
ownership
Number
of stores
Annual
property
income
Headline
rent
ITZA
ABC1
customers Key tenants
Super-regional centresintu Trafford Centre £2,305m 1,973 100% 234 £87.8m £425 67% Debenhams, Topshop, Selfridges, John Lewis,
Next, Apple, Ted Baker, Victoria’s Secret,
Odeon, Legoland Discovery Centre, H&M,
Hamleys, Marks & Spencer, Zara, Sea Life
intu Lakeside £1,334m 1,435 100% 248 £59.2m £350 67% House of Fraser, Debenhams,
Marks & Spencer, Topshop, Zara, Primark,
Forever 21, Vue, Hamleys, Victoria’s Secret
intu Metrocentre £952m 2,085 90% 342 £48.2m £300 57% House of Fraser, Marks & Spencer,
Debenhams, Apple, H&M, Topshop, Zara,
Primark, River Island, Odeon
intu Braehead £586m 1,127 100% 121 £26.2m £2501 58% Marks & Spencer, Primark, Apple, Next, H&M,
Topshop, Hollister, Superdry, Sainsbury’s,
David’s Bridal
intu Merry Hill £448m 1,671 50% 213 £22.5m £180 46% Marks & Spencer, Debenhams, Bhs, Primark,
Sainsbury’s, Next, Topshop, Asda, Boots,
H&M, Odeon
Cribbs Causeway £245m 1,075 33% 153 £11.7m £305 73% John Lewis, Marks & Spencer, Apple, Next,
Topshop, Timberland, Jigsaw, Hobbs, Hugo
Boss, H&M
In-town centresintu Derby £447m 1,300 100% 181 £30.6m £125 54% Marks & Spencer, Debenhams, Sainsbury’s,
Next, Boots, Topshop, Cinema de Lux,
Zara, H&M
Manchester Arndale £445m 1,600 48% 249 £21.9m £275 57% Harvey Nichols, Apple, Burberry, LK Bennett,
Topshop, Next, Ugg, Hugo Boss, Superdry,
Zara, Hollister
St David’s, Cardiff £369m 1,391 50% 201 £16.3m £212 66% John Lewis, Debenhams, Marks & Spencer,
Apple, Hollister, Hugo Boss, H&M, River
Island, Hamleys, Primark
intu Victoria Centre £356m 976 100% 113 £18.2m £250 54% House of Fraser, John Lewis, Next, Topshop,
River Island, Boots, Urban Outfitters,
Superdry, Office
intu Watford £336m 726 93% 137 £17.8m £250 82% John Lewis, Marks & Spencer, Apple, Zara,
Primark, Next, Lakeland, Phase Eight, Lego,
H&M, Topshop, New Look
intu Eldon Square £300m 1,350 60% 140 £14.5m £308 61% John Lewis, Fenwick, Debenhams, Waitrose,
Apple, Hollister, Topshop, Boots, River Island,
Next, Marks & Spencer
Spanish centres
Market
value
Size
(sq m
000)
%
ownership
Number
of stores
Annual
property
income Key tenants
Puerto Venecia,
Zaragoza
€225m 119 50% 202 €11.0m El Corte Inglés, Primark, Ikea, Apple,
Decathlon, Cinesa, H&M, Mediamarkt,
Zara, Hollister, Toys R Us, Fnac
intu Asturias €121m 75 50% 136 €6.8m Primark, Zara, H&M, Cinesa, Eroski, Mango,
Springfield, Fnac, Mediamarkt, Desigual
1 The amount presented is on the Scottish ITZA basis, the English equivalent is £335.
Super-regional centres
63%1. intu Trafford Centre (£2,305m)
2. intu Lakeside (£1,334m)
3. intu Metrocentre (£952m)
4. intu Braehead (£586m)
5. intu Merry Hill (£448m)
6. Cribbs Causeway, Bristol (£245m)
Spanish centres
3%17. Puerto Venecia, Zaragoza (£166m)
18. intu Asturias (£89m)
In-town centres
34%7. intu Derby (£447m)
8. Manchester Arndale (£445m)
9. St David’s Cardiff (£369m)
10. intu Victoria Centre (£356m)
11. intu Watford (£336m)
12. intu Eldon Square (£300m)
13. intu Milton Keynes (£280m)
14. intu Chapelfield (£273m)
15. intu Potteries (£175m)
16. intu Bromley (£174m)
* Including Group share of joint ventures.
** Other properties <£100 million (£323m).
1
2
3
456
7
8
9
10
11
12
13
1415
16 17
18**
Asset valuation at 31 December 2015
£9.6bn*
(2014: £9.0bn)
intugroup.co.uk 5OverviewPortfolio at a glance

Chairman’s statement
Our focus is to deliver strong returns over the medium term through rental growth in our existing assets and superior returns from our development pipeline
It is now nearly six years since we
demerged and three years since
we introduced the intu brand. Over
this period we have been shaping the
business to enable growth and ensure we
are well placed both to take advantage
of improvements in the market and
to withstand any adversity. We have
focused on delivering our strategic
objectives rather than being exclusively
preoccupied with short-term gains. This
has proved to be the right thing to do,
as our results this year show. Managed
this way, our prime retail real estate
is an attractive investment delivering
long-term security.
Overview of 2015 activityA key highlight of the year was the
return to positive like-for-like net
rental income growth. This, along
with strong operating metrics that have
outperformed national benchmarks,
is a validation of the repositioning work
we have done in the last few years.
The expertise and skills of our in-house
team in continually improving our
assets have been recognised by both
the industry and our end customers.
intu Lakeside and intu Eldon Square
both won BCSC Gold awards in the
last two years for their redevelopment
works. We have received excellent
customer feedback at our newly opened
developments at intu Victoria Centre
and intu Potteries where visitor numbers
have increased even beyond our
high expectations.
intu and its customer proposition continue
to increase brand traction with retail
customers, brand partners and shoppers
as well as wider audiences. The intu brand
made its presence felt in the Spanish
market when we rebranded Parque
Principado, Oviedo as intu Asturias in
June 2015 and this has been very well
received by both customers and retailers.
We continue to be at the forefront of
our sector in terms of digital and
customer experience. Our in-house
digital innovation team is fully integrated
into the wider business and delivering a
series of industry-leading developments
while the customer experience team has
a comprehensive programme of signature
experience initiatives – both focused on
delivering a compelling experience in
centre and online.
For more details of our performance
this year may I refer you to the interview
with our Chief Executive on pages
8 and 9 where David Fischel answers key
questions about our business and to the
financial review presented by our Chief
Financial Officer Matthew Roberts on
pages 46 to 51.
Corporate responsibilityOur centres are integral to the
communities we serve. Although we
are an international brand, we are rooted
in our local communities. We create
significant economic contributions to
these communities, through regional
We have focused on delivering our strategic objectives rather than being exclusively preoccupied with short-term gains. This has proved to be the right thing to do, as our results this year show
intu properties plc Annual report 20156
employment and development and by
supporting community groups to address
fundamental societal issues that are
important to our long-term success.
We measure total economic contribution
through the gross value added (GVA)
model; in 2015 this was valued at
£4.2 billion (2014: £3.5 billion).
Environmentally, we are focused on our
long-term goals and are working towards
our 2020 targets, including our new
carbon target which now measures
emissions intensity rather than an
absolute quantity. I am pleased to say
we remain on course to achieve these
and you can find more details on our
progress on pages 52 to 55.
intu staff are an important part of this
progress and have delivered impressive
results over the past year, particularly in
the areas of environmental management
and community engagement through
a multitude of partnerships.
Our peopleI would like to record my thanks to
the Board and all our staff for their
commitment and dedication to intu’s
values and vision in the year.
At the heart of intu’s success are the
people who deliver these results for
you, from apprentices, through senior
managers to the Board. We look to
employ and retain the very best people
to keep us at the forefront of the
shopping centre industry.
I welcome Rakhi (Parekh) Goss-Custard
and John Strachan to the Board. They
bring a wealth of experience from the
internet retail and retail property
environment respectively. We are
fortunate to have a Board which takes
a keen interest in our operations. This
gives a real vitality to our corporate
governance arrangements, while allowing
our executive team the freedom it needs.
I am also pleased to report that this year
we welcomed our first apprentices in our
new national apprenticeship scheme and
we achieved silver Investor in People
accreditation at 14 intu-branded shopping
centres. intu Trafford Centre retained its
gold standard.
Finally, on behalf of the Board I would like
to thank Neil Sachdev who will step down
as a Director at the 2016 AGM after over
nine years and Mike Butterworth who
retired as Chief Operating Officer in
December 2015. We have valued the
contributions they have both made
to our progress very highly.
DividendsYour Directors are recommending a final
dividend of 9.1 pence per share, bringing
the amount paid and payable in respect
of 2015 to 13.7 pence, unchanged from
the 2014 dividend. A scrip dividend
alternative may be offered.
Looking forwardWe continue to focus on our key strategic
objectives which put us in a position
where we can take advantage of a
continued upturn in the economy, and
also allow us to better withstand any
future downturns. The strong and
stable income streams from our quality
shopping centres will be supported and
supplemented by growth through our
development pipeline as we embark on
the next exciting phase of investment,
across both the UK and Spain.
Our brand proposition around events,
community, customer service and digital
will continue to enhance the customer
experience and attractiveness of intu
centres to both retailers and customers.
In Spain, we will replicate our successful
UK model both operationally in
our existing two centres and on the
development front at intu Costa del Sol.
Our focus is to deliver strong returns over
the medium term through rental growth
in our existing assets and superior returns
from our development pipeline.
Patrick Burgess
Chairman
26 February 2016
Like-for-like net rental income growth in 2015
1.8%(2014: -3.2%)
Our approach to corporate responsibilityAs a long-term and sustainable
business our corporate responsibility
approach is based on three pillars:
Communities and economic contribution
Environmental efficiency
Relationships with our stakeholders
Read more on pages 52 to 55
External recognition of our sustainability performance
GRESB[logo to be supplied]
CommunityMark
Reduction in CO2e emissions intensity since 2011
39%
intugroup.co.uk 7Strategic reportChairman’s statement

Interview with the Chief ExecutiveDavid Fischel, Chief Executive, answers questions on intu’s results demonstrating how the business expects to benefit further from rising consumer confidence and strengthening demand from retailers for quality space
How was 2015 for intu?
We are pleased to report a strong
set of results for 2015 with a 7 per cent
increase in underlying earnings per
share and a 4 per cent revaluation
surplus taking investment properties
to £9.6 billion. Particularly encouraging
was the return to like-for-like growth in
net rental income, the result of quality
lettings in aggregate 10 per cent ahead
of previous passing rent, improved
occupancy at 96 per cent and benefits
from our investment programme
with projects successfully concluded
in 2015 in Nottingham, Newcastle
and Stoke-on-Trent.
As economic recovery spreads out
from London and the south east to
the regions, consumer confidence is
positive, driving improved retailer
demand for space in our centres at a
time when new supply of quality retail
space is very limited. Investor interest
for prime regional shopping centres
remains keen.
These factors provide a favourable
background for our development
programme as we look to introduce
the next level of leisure concepts.
We expect to undertake around
£600 million of mixed retail and
leisure projects in the next three years
in the UK, in particular the intu Watford
extension, and commence our major
Spanish shopping resort development,
intu Costa del Sol.
Our top shopping destinations help
deliver high footfall and long dwell times
for our retailers and restaurateurs. We
attract some 400 million shopper visits
a year and focus on delivering a great
customer experience. We are continuing
to make the intu brand really count
through digital initiatives, including our
transactional website, and multichannel
promotional events, reflected in very
positive customer feedback via our
Tell intu programme.
While financial markets are volatile,
the improved economic environment
and tenant demand, together with
the returns we are achieving from
our investment in development, active
management, technology and branding
mean we are well positioned to achieve
further organic growth in 2016.
Can you explain the ‘intu difference’?
It is shorthand for what differentiates
intu from other retail landlords. It means
combining our scale, expertise and insight
to create compelling experiences for our
customers that deliver results for our
retailers and value for our investors.
In practical terms it is how we bring the
five elements of our brand proposition
to life – digital connectivity, events
with a difference, world class service,
moments of surprise and delight and
our commitment to the community.
As economic recovery spreads out from London and the south east to the regions, consumer confidence is positive, driving improved retailer demand for space in our centres
intu properties plc Annual report 20158
The whole business is centred around
our end customers. We want them to
be happier when they leave our centres
than when they walked through the
door. Our net promoter scores prove
that happy shoppers spend more which
means happy retailers. We are a people
business and everything our people
do is underpinned by our values of
creative, bold and genuine.
What can we expect in terms of developments to your UK centres over the next 12 months?
2016 will be another significant
year for our UK development pipeline
following a successful 2015 which
saw us complete over £60 million
worth of high impact developments
at intu Victoria Centre and intu Potteries.
These are already yielding results in
the form of increased asset values
and tenant demand.
This year our focus is on three major
projects as part of our near-term,
£580 million development pipeline:
transformational developments at
intu Watford and intu Broadmarsh and
an innovative leisure extension at intu
Lakeside, each of which is fully funded
from existing resources.
At intu Watford we have begun our
£178 million extension, demolishing
Charter Place to replace it with a
substantial retail and leisure offering
anchored by a nine-screen Cineworld
IMAX cinema and Debenhams. CACI
predict that Watford will be promoted
to a top-20 retail destination as a result
of the development and interest is
high with 50 per cent already let or
in solicitors’ hands.
With the refurbishment of intu Victoria
Centre complete, we are ready to turn
our attention to the second phase of our
Nottingham vision – the redevelopment
of intu Broadmarsh. This project will bring
a cinema, leisure uses and convenience
retail to the southern end of the city.
At intu Lakeside, we are in advanced talks
with an international brand to introduce a
new type of leisure offer to the shopping
centre experience. This will be the first
phase of a £95 million, 225,000 sq ft
leisure extension designed to increase
dwell time and the overall catchment
of the centre.
It has now been over two years since you bought your first centre in Spain. Has Spain delivered on its promise so far and where will the next two years take you?
Yes, investing in Spain in 2013 has
proven to be a timely move for intu. We
now have a strong foothold in a rapidly
improving market that has just seen its
17th successive quarter of retail sales
growth. intu Asturias and Puerto Venecia
are performing strongly with positive
sales growth, dwell and footfall above the
benchmarks. Our management team has
introduced exciting new retailers at both
centres, driving rental growth. Pleasingly
the rebrand of Parque Principado to
intu Asturias was very well-received and
validated through substantially improved
net promoter scores. We will look to
repeat this success when Puerto Venecia
goes through the rebranding process
later this year.
From a development point of view, our
new concept retail resorts are being well
received. At intu Costa del Sol, our first
iteration of the concept, tenant demand
is strong and the planning is well
advanced. When we have secured full
planning approval and our target level
of exchanged pre-lets, we expect to
be on site in the latter part of 2016. In
tandem with this, we will continue to
advance plans on the other development
sites in Valencia, Vigo and Palma.
You have stated your ambition to stay at the forefront of shopping centre innovation – what does this look like in practical terms?
There are five elements of our brand
proposition but let’s look at just one as
an example – digital connectivity. We are
the only landlord with an in-house digital
innovation team, and we were the first in
our industry to introduce a transactional
website to offer 24/7 shopping for
our customers and importantly give
our retailers another route to market.
intu.co.uk is already a top-10 affiliate
website with 350 ‘shoppable’ retailers.
However we are not standing still. With
the introduction of new technologies our
offering will continue to evolve. We are
running a number of innovation projects
and website enhancement trials that, once
proven, we can quickly and efficiently roll
out. In 2015 we worked with Apple who
digitally mapped our centres, another
industry first. This along with our high
quality wifi infrastructure has allowed
us to build a uniquely personalised
wayfinding and offers app that was
piloted last year and is now being
rolled out across intu branded centres.
Can you summarise what 2016 has in store for intu?
We are now well positioned to reap
the benefits of our single-minded focus
and brand strategy. 2016 is about building
on that solid foundation while continuing
to innovate to strengthen our market
leading position.
Our four strategic priorities remain:
optimising our assets to create essential
destinations for both our shoppers
and retailers; delivering the near-term
pipeline of UK development opportunities
that will add real value to our portfolio;
leveraging the strength and differentiation
of our brand across all proposition areas;
and building our Spanish presence.
We intend to deliver continued growth
in like-for-like net rental income which
we expect to be in the 2 per cent to
3 per cent range for 2016 subject to
no material tenant failures. This will
offset the dilution in earnings from the
disposals of the Equity One shares and
a 50 per cent stake in Puerto Venecia,
Zaragoza as we recycle capital into
other developments.
Strategic priorities for 2016Our focus in 2016 will be on four main goals
which we believe will result in strong total
returns over the medium term:
— optimise the performance of existing assets
— drive forward our UK development pipeline
— make the brand count
— seize the growth opportunity in Spain
Read more on pages 32 to 33
intugroup.co.uk 9Strategic reportInterview with the Chief Executive

Our growth story
intu cost to completion £178m
New space 380,000 sq ft
Indicative timing 2016-2018
Our development of the site of the old
Charter Place precinct adjacent to intu
Watford will transform the centre into a
1.4 million sq ft regional destination, with
CACI estimating that, as a result, Watford
will be promoted to a top 20 national
retail destination ranking alongside
Edinburgh and Bristol. The leisure-led
extension will enhance the night-time
economy in this affluent catchment
across north London and Hertfordshire.
Anchored by a nine-screen Cineworld
IMAX cinema, 10 restaurants and a
Debenhams department store, it will
also deliver new large format units
and a refurbishment of existing malls
to bring them to the standard of the
new extension.
intu Lakeside
intu cost to completion £95m
New space 225,000 sq ft
Indicative timing 2016-2018
The approved leisure extension will bring
additional restaurants and introduce new
concept leisure brands to intu Lakeside,
increasing catchment and dwell time. We
are in detailed discussions with the leisure
anchors which, along with the recent
letting to Hamleys, will increase the
family-oriented customer experience.
intu Watford
We have a strong pipeline of organic growth opportunities for the next decade in the UK and Spain. Over the past few years we have been moving forward with planning approvals to be ready for an upturn in tenant demand. We expect to start around £750 million of these projects in the next three years, with optionality on further projects beyond 2018
Over the next three years we will focus on projects where we see improved tenant
demand. We are commencing the project at intu Watford where pre-lets are now
over 50 per cent. Demand is approaching the required level at the other near-term
projects and we expect to commit to these in the next 12 months.
Near term£750mour development pipeline
over the next three years
intu properties plc Annual report 201510

intu Costa del Sol
intu cost to completion
€232m
(£172m)
New space 175,000 sq m
Indicative timing 2016-2018
intu Costa del Sol will be our first
development in Spain, creating a leisure
and retail destination for both residents
and tourists. In developing our shopping
resort concept we will look to build on
the leisure and retail offer demonstrated
by Puerto Venecia, Zaragoza and expand
the intu brand in Spain.
intu Broadmarsh
intu cost to completion £75m
New space 50,000 sq ft
Indicative timing 2016-2018
The second phase of our Nottingham
vision will redevelop the 500,000 sq ft
existing centre to provide a complementary
offer to that of intu Victoria Centre.
The redevelopment will focus on new
brands and uses to the city with a
cinema and restaurant-led upper level
and convenience-driven lower level.
Active asset management
intu cost to completion £185m
New space n/a
Indicative timing 2016-2018
Our active asset management capital
expenditure offers attractive returns, with
stabilised initial yield on costs of 6-10 per
cent. The projects vary in scale but they
all focus on improving the customer
experience, whether it is retail, catering or
leisure. Examples in 2016 will be a hotel at
intu Lakeside and bowling and mini-golf
at intu Derby.
intu Lakeside
We have planning approval for an additional
440,000 sq ft of retail space which will be
a natural development of the centre to
meet the increased catchment and footfall
from the leisure extension.
intu Victoria Centre
The third phase of our Nottingham vision,
following the successful refurbishment of
intu Victoria Centre and redevelopment of
intu Broadmarsh, is a retail extension to intu
Victoria Centre. This has planning approval
for up to 500,000 sq ft of retail and leisure.
intu Braehead
Our application is being re-determined
following an objection to Braehead’s
revised planning status within the Local
Development Plan. Our project has
widespread political and public support
and would bring significant investment to
Scotland. Approval of the plans will enable
us to progress this 475,000 sq ft retail
and leisure extension, creating 2,200 jobs
in the construction phase and 2,650
jobs thereafter.
intu Milton Keynes
In 2015 the council resolved to approve
our plans to develop 100,000 sq ft of
new floorspace, bringing more life and
entertainment to the Boulevard area
of the centre and creating 430 new jobs.
Disappointingly, this has since been called
in for a public inquiry by the Secretary of
State which is due to be held later in 2016.
Cribbs Causeway
We have submitted a planning application
for a 380,000 sq ft retail and leisure
extension to the centre reflecting growth
in the overall catchment area, especially
with the redevelopment of Filton airfield.
This will bring an estimated 2,900 jobs
to the local community.
Spain
We continue to progress our development
options at Valencia, Vigo and Palma
to create further shopping resorts
similar to Puerto Venecia, Zaragoza
and intu Costa del Sol.
Future potential beyond 2018
OverviewCost to completion
£m Total 2016 2017 2018
Committed 45 45 – –
Active asset management pipeline 185 60 63 62
Major extensions and redevelopments 348 60 160 128
Total UK 578 165 223 190
intu Costa del Sol* 172 22 40 110
Total 750 187 263 300
* Assumes 50 per cent joint venture partner.
intugroup.co.uk 11Strategic reportOur growth story

Investment case
Our investment case sets out how we use our market-leading position and unique insight to implement our strategy and deliver shareholder returns
— UK’s largest owner, developer and manager of prime shopping centres
— only UK nationwide shopping centre brand
— providing in centre and online customer experience
— talented, motivated and empowered employees focused on delivering
exceptional customer experience
— robust capital structure with access to a wide range of funding sources
— pure play focused shopping centre owner
— dynamic operator at the forefront of an evolving retail environment,
understanding the multichannel requirements of retailers
— unique insight into customer trends and demands for the perfect shopping
and leisure experience
— connecting retailer requirements with customer demands to deliver
compelling shopping experiences
— combining our scale, expertise and insight
— creating compelling experiences for our customers
— delivering results for our retailers
— adding value for our investors
— aim to deliver long-term total property returns from our prime properties,
an attractive asset
— strong, stable income streams from long-term lease structures
— development potential and capital appreciation
See business model page 28
See key market trends page 16
See strategy overview page 32 and 33
Market-leading position
Unique insight
Strategy
Shareholder returns
intu properties plc Annual report 201512

The intu difference
What makes intu different?We create compelling experiences that surprise and delight our customers, delivering success for our retailers, enhancing our communities
and driving value for our investors
Optimising asset performance
page 19
UK development momentum
page 20
Making the brand count
page 23
Seizing the growth opportunity in Spain
page 24

The intu difference is driving our success
The figures are impressive but it is
what we do with them that really
makes the difference.
With the whole business centred around
our customer, we bring together our
scale, experience and expertise to create
compelling experiences, in centre and
online, which deliver real results for our
retailers, caterers and leisure operators.
And it works – stores at intu centres are
very often among the top performers
in their businesses.
Our unique insight and research
programmes help us understand what
motivates customers to visit their local
intu centre, stay longer and return often.
We then combine the power of our
brand with our scale to attract the best
retailers, the most sought-after brands
and exciting immersive experiences to
do just that.
A culture of success
How we behave is an important part
of the intu difference and a big reason
behind our success. We encourage
and equip all our employees to look
at things differently and creatively,
to consider carefully and then to act
boldly and genuinely.
Signature experiences
Our in-house teams are always thinking
up new signature experiences that
express our brand proposition of world
class service, digital connectivity and
events with a difference. Joy jars, the new
customer lounges, the intu app – just
some of the ways we provide moments
of surprise and delight.
Our values
Our aim is to put a smile on the face of our customers. We want them to be happier when they leave our centres than when they walked through the door. Happy shoppers mean happy retailersDavid Fischel
Creative
We look at the familiar and we see
something different; we are insightful and
imaginative, but not for their own sake,
for we never lose sight of what is important
and relevant.
Bold
We act confidently and decisively, always
knowingly, perhaps at times controversially,
but never rashly or without consideration.
Genuine
We are true to ourselves, act fairly
and communicate clearly; we say what
we mean and we mean what we say.
We recognise our obligations to our
stakeholders and the wider society,
and commit to put our utmost into
everything we do.
400mcustomer visits in 2015
35mcustomers
24mwebsite visits
2mmarketing database
The intu differenceintugroup.co.uk 15

We understand our marketThe face of UK retail is changing and we are positioned to take advantage
of the opportunities this presents both in store and online
The intu difference
What are the major trends impacting our market?Trends Our response
Fewer stores, prime locations matter
— store strategy is evolving
– existing established retailers reduce store
numbers, but not necessarily trading space
– new entrants need a minimum footprint
of 30-50 stores to establish a viable
UK presence
— pure play online retailers now trialling
physical locations
— focus on the right locations in the right
environments, in particular the top
35 shopping centres
Optimising asset performance
— our focus on the top shopping
destinations delivers high footfall
and long dwell times to our retailers
— knowing our customers and
understanding retailer requirements
to help them flourish in our centres
— asset management initiatives deliver
the right space in the right location
A multichannel approach
— seamless shopping experience across
both online and in store sales channels,
with shoppers who use both channels
generating higher transaction values
— single view of customer with a focus
on personalisation
— stores also functioning as showrooms
showcasing the products and brand
Making the brand count
— we are the only UK nationwide
shopping centre landlord
who can offer retailers a
transactional website to mirror
their multichannel approach
— our customer database gives
retailers further routes to market
both online and in centre
Shopping is leisure
— family friendly experience to compete
with other leisure attractions
— centres need to have the right mix of
retail, catering and leisure to enhance
the customer’s day out
Development momentum
— introducing the optimal level of
restaurants and leisure into centres
— bringing the next level of leisure
concepts to intu Lakeside and
intu Costa del Sol in the near term
28,000Tell intu surveys completed annually
2,200customer exit surveys completed by CACI
6,000shopper view data points
House of Fraser’s multichannel approach
Department store group, House of Fraser, has transformed into a
successful multichannel customer-centric business, which has delivered
positive sales and margin growth both in store and online. House of Fraser
offers customers a seamless shopping experience with a consistency in
approach and communications across all channels.
This forward-looking approach mirrors its relationship with intu: in centre
it has just completed a multimillion-pound refurbishment of its store at
intu Metrocentre and online it is collaborating with our digital team to open
additional channels to customers.
Consumer insights
We continually monitor and respond
to customer trends both in centre
and online with touch points across
the whole customer journey.
16
Optimising asset performanceOur distinctive asset management approach combines expertise and experience
with the intu difference to make our centres vibrant places for leisure and shopping that draw in customers and help retailers flourish
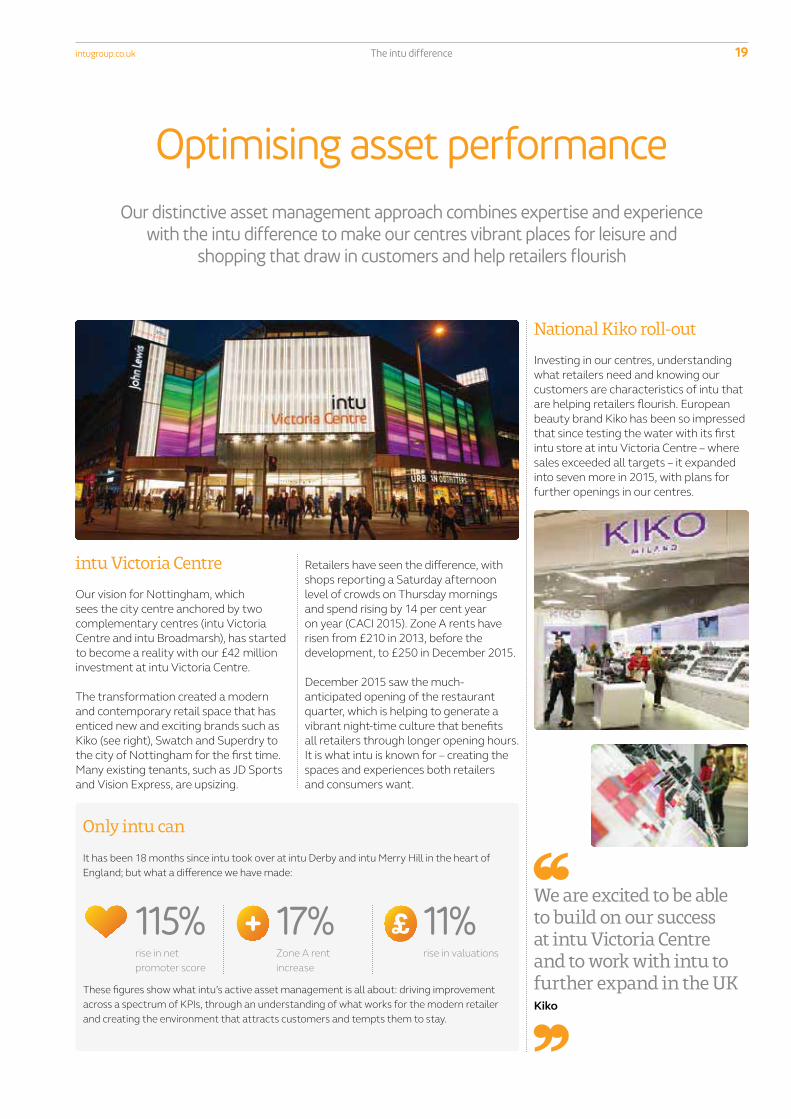
intu Victoria Centre
Our vision for Nottingham, which
sees the city centre anchored by two
complementary centres (intu Victoria
Centre and intu Broadmarsh), has started
to become a reality with our £42 million
investment at intu Victoria Centre.
The transformation created a modern
and contemporary retail space that has
enticed new and exciting brands such as
Kiko (see right), Swatch and Superdry to
the city of Nottingham for the first time.
Many existing tenants, such as JD Sports
and Vision Express, are upsizing.
National Kiko roll-out
Investing in our centres, understanding
what retailers need and knowing our
customers are characteristics of intu that
are helping retailers flourish. European
beauty brand Kiko has been so impressed
that since testing the water with its first
intu store at intu Victoria Centre – where
sales exceeded all targets – it expanded
into seven more in 2015, with plans for
further openings in our centres.
Only intu can
It has been 18 months since intu took over at intu Derby and intu Merry Hill in the heart of
England; but what a difference we have made:
17%Zone A rent
increase
115%rise in net
promoter score
11%rise in valuations
We are excited to be able to build on our success at intu Victoria Centre and to work with intu to further expand in the UKKiko
Retailers have seen the difference, with
shops reporting a Saturday afternoon
level of crowds on Thursday mornings
and spend rising by 14 per cent year
on year (CACI 2015). Zone A rents have
risen from £210 in 2013, before the
development, to £250 in December 2015.
December 2015 saw the much-
anticipated opening of the restaurant
quarter, which is helping to generate a
vibrant night-time culture that benefits
all retailers through longer opening hours.
It is what intu is known for – creating the
spaces and experiences both retailers
and consumers want.
These figures show what intu’s active asset management is all about: driving improvement
across a spectrum of KPIs, through an understanding of what works for the modern retailer
and creating the environment that attracts customers and tempts them to stay.
The intu differenceintugroup.co.uk 19

intu Eldon Square
Over the last ten years we have
effectively rebuilt intu Eldon Square to
create a dynamic shopping experience
in the heart of Newcastle. This includes
a stylish 400,000 sq ft extension and a
£22 million investment to refurbish the
mall, which have attracted new high-
quality tenants and increased revenues.
Occupancy is nearly 100 per cent, with
just two stores available to let.
Occupancy is nearly
100%The mall overhaul has all the features of
an intu reinvention – updating the centre
and infrastructure from the technical to
the technological, reducing operating
costs with energy efficient lighting and
ventilation, and attracting customers
through the top-quality redesign, full
intu Bromley
Insight means we can deliver dramatic
changes through small investments.
The £3 million transformation of
intu Bromley saw retailers competing
for space in the newly rebranded centre,
vying to get a share of the valuable
catchment (88 per cent of intu Bromley’s
customers are in the most affluent
ABC1 category).
New retailers over the past two years
include White Stuff, Thomas Sabo,
Smiggle, Hema, Carluccio’s, YO! Sushi,
Ecco, Jo Malone, Timberland and Fat Face.
Refurbishment and the revitalised mix of
tenants has tempted back affluent local
shoppers who are choosing to use their
local centre once again. The result has
been around 20 new lettings.
The opening of the restaurant terrace
at Queen’s Garden in 2016 will further
enhance the aspirational offer and
will be the catalyst for introducing a
longer trading day in the centre, to make
intu Bromley one of south east London’s
most compelling destinations.
New rents
£3m
UK development momentumOur investment in our UK assets creates the stylish and sought-after
shopping destinations retailers and customers want, revitalises city centres and brings economic benefits to communities
digital connectivity, new stores and
customer service points. New tenants
include Thomas Sabo, Skechers and
Smiggle, altogether generating over
£3 million per annum in new rents.
The next phase is the £25 million
restaurant development at Grey’s
Quarter which, on completion in 2016,
will bring 20 new restaurant brands to
central Newcastle.
Cost of the refurbishment
£22m
20 The intu difference

Making the brand countThree years on from creating the new brand our customers and retailers are starting to
understand the intu difference and what it means: a way of doing things that guarantees world class service, compelling events and the best digital connectivity in the business
Five ways we are using technology to improve customers’ experienceBridging the divide between online and in store and
creating the perfect personalised customer experience
– intu has embraced the digital revolution by putting
the customer first to benefit retailers
1. Two million database
A valuable bank of information
of customers’ digital interactions
which allows our customers to
benefit from an unrivalled online
and in-centre relationship
with retailers
2. Innovative wayfinding app
Our app gives customers access
to special offers based on their
location in centre, and enables
retailers to boost sales through
personalised real-time offers
3. Affiliate website
Less than 18 months after
launch intu.co.uk is one
of the country’s top-10
affiliate websites. intu is the
only UK-wide shopping
centre brand to have a
transactional website
4. Customer lounges
Bringing all intu’s digital
and physical services
together in one stylish
lounge, improving customer
satisfaction scores
5. Unrivalled connectivity
Free wifi and 4G across most
of our centres makes them
go-to destinations for today’s
digital natives
Sponsorships and partnerships
With a million people coming into an intu centre every day, and over
two million customers accessible via our marketing database, intu’s scale
and national presence make us an unbeatable partner
for global brands looking for access to a UK-wide
audience. In 2015 more brands than ever before
paid to promote their brands to the unmatched
customer base provided by intu. These include
20th Century Fox who have toured their films
Home and The Peanuts Movie in every intu-
branded centre, which have in turn provided
compelling half-term experiences for families,
leading to higher net promoter scores during
holiday periods.
Student Nights
Student nights are a regular part
of any shopping centre’s event
calendar, but intu Student Nights
really are events with a difference
for both students and retailers.
128,000students attended events in 2015
21% rise from 2014
By leveraging the intu consumer
brand and our national presence,
more retailers took part in the
2015 events than ever before –
1,045 across our portfolio,
17 per cent more than last year.
Quotes from retailers bear out
the events’ success:
“ We thought we’d take £8k,
we took £72k.”
“ Achieved +686 per cent against
our target – took £20,000 in
four hours.”
“ Can I just say how AMAZING
the student event on Wednesday
was for us. Made our store #1
in Scotland & Ireland.”
From the events we signed up
120,000 students to our database,
giving retailers access to a coveted
and hard-to-reach group of
shoppers. We are planning a spring
event for 2016, giving retailers and
students another great opportunity.
ty
t
’s
The intu differenceintugroup.co.uk 23

Seizing the growth opportunity in Spain
In Spain we are building a platform of the best centres through acquisition and development and we are creating a new class of regional destination centre – the retail resort
2015 was the year we proved that the
intu brand, with its distinctive approach
to asset management, customer
experience and digital connectivity,
could be as successful in the Spanish
market as it is in the UK.
In June our first Spanish acquisition,
Parque Principado, completed its first
stage of rebrand to intu Asturias after
a modernisation programme that saw
the centre upgraded with decorative
and lighting enhancements, new signage
and seating, free wifi and the customer
experience that bears the hallmark of
the intu brand.
The brand has proved eminently
transferable, adapting to the local culture
and community in much the same way it
does in the UK. The high level of digital
connectivity, compelling events and
the world class service for which intu
is already well-known, are proving as
popular with Spanish customers as
they are with British shoppers.
intu reigns in Spain
In Puerto Venecia, Zaragoza, the second of
Spain’s top-10 shopping centres that we
own, footfall is up 4 per cent and retailer
sales are up by 13 per cent, reflecting
improving economic conditions and the
work we have done on retail mix.
Our next step is to rebrand Puerto Venecia
and then get on site with intu Costa del Sol
near Málaga. The quality of what we’ve
achieved is already lending confidence to
the pre-letting of our next big venture.
We also have options on three key sites
in Valencia, Vigo and Palma.
Since Tell intu was introduced in March
2015, we have seen net promoter score
rise by 38 per cent in the first quarter
after the rebrand.
The effect on sales and footfall has been
just as striking – the first quarter after
rebranding saw a 6 per cent uplift in
footfall leading to a 13 per cent rise in
retailer sales.
These figures, along with the near 100 per
cent occupancy, show how much more
attractive intu Asturias now is to retailers
and customers alike. It is also increasing in
value, rising from €162m at purchase to
€242m in December 2015.
38%
6% rise in footfall*
13% rise in retailer sales*
* In the first quarter after rebranding,
July-September 2015.
Our successful brand goes international at intu Asturias
rise in net
promoter score*
24 The intu difference

A national company with a local faceAs a major employer in most of the UK towns and cities we operate in,
we have an important role in supporting our communities
Contributing to our communities
intu centres are vibrant hubs for the community, providing places for people
to meet, eat, socialise and be entertained while making a significant economic
contribution to communities through employment, taxation and investment.
Each year we report on our contribution through calculating the gross value
added, or GVA, to the local and national economy.
Our enduring relationships in Watford are creating community and prosperity
Opened in 1992, intu Watford is at
the heart of the town, physically and
figuratively. With over 6,000 local people
working there, it is a major employer
and the extension and mall upgrade
will increase that role further. The panel
on the right shows a snapshot of intu’s
contribution to the local area.
With almost 25 years in the town we
invest in long-term partnerships such
as the Peace Hospice. Our community
programme reflects the community’s
needs, from training young people,
regenerating open spaces, and helping
improve local health and wellbeing.
Our partnership with The Conservation
Volunteers, in the Colne River Park, has
attracted significant buy-in from local
people and strong endorsement from
the elected Mayor of Watford.
The relationships we nurture over the
long term make us an integral part of
the community and help us understand
a range of local needs – and when it came
to our plans for the development we got
the thumbs-up from the community,
with a 91 per cent approval rating.
intu’s contribution to Watford
1,575new direct and indirect
jobs from extension
£16mbusiness rates
£20,000community contributions
in 2015, with 260 intu staff
participating in community activity
100%waste diverted
from landfill
50%decrease in energy
use 2010 – 2015
Supporting local causes in Watford
Top: collecting for the local food bank.
Bottom: students try out their retail skills
on one of our employability programmes
Our annual economic contribution
to Watford
£296m GVA
6,000local people employed
91%approval rating for the development
The intu differenceintugroup.co.uk 27

Our business model
By meeting the needs of customers and retailers we have built a long-term, sustainable business that delivers value for our shareholders
Our assets and resources What we do
Create compelling shopping experiencesOur insight and management of
centres attract customers more
often, for longer and from further
away by offering the right mix of
retail, leisure and catering alongside
our distinctive brand proposition
Help retailers flourishOur scale, flexibility, high-footfall
locations and strong brand give
retailers the confidence that they
will trade successfully with intu,
which drives rental income
Develop long-term relationshipsWe develop enduring relationships
with retailers, customers, employees,
partners and communities that allow
us to take a creative, collaborative
approach to long-term investment
and growth
Our centresNational coverage of prime
retail and leisure destinations
visited by more than half the
UK’s population each year
Our brandNationwide shopping centre
brand focused on enriching
the customer experience
both in centre and online
Our employeesProfessional, motivated
and empowered teams are
specialists in their fields
Our financial strengthRobust capital structure
provides capacity to deliver
our objectives from a range
of funding sources
See the intu difference on pages 13 to 27
intu properties plc Annual report 201528

Optimise asset performance
UK developm
ent mom
entum
Make the brand count
Seize
the
grow
th o
ppor
tuni
ty in
Spa
in
The value we add
Our shareholdersStrong stable income and capital growth
9% total property return
Our retailersEnvironments that help retailers flourish
2% growth in estimated retailer sales
Our customersCompelling experiences
20% increase in net promoter score
Our peopleMotivated and empowered
7% rise in engagement index since 2012
Our communitiesSignificant economic contribution
£4.2bn GVA in 2015
Our environmentOperational and environmental efficiency
39% reduction in carbon intensity since 2011
How we do it
We apply our specialist knowledge, expertise and market insight to our prime portfolio and focus on our strategic objectives to deliver long term growth
See strategy overview on pages 32 and 33
Total propertyreturns
intugroup.co.uk 29Strategic reportOur business model

Relationships
People are what make us tick: people as customers, as communities, as employees and as interested parties invested in our success. We understand these connections and know that if they do not prosper, neither do we
CustomersKeeping our competitive edge means understanding what our customers are looking
for in a compelling shopping and leisure experience, from retailer mix to customer
service expectations
How we have engaged What we are doing
— through questionnaires, forums, tasks
and an online shopping panel
— our Tell intu customer feedback
programme (28,000 responses this year)
— our world class service makes
customers feel valued
— using insight to develop
signature experiences
— introducing the retailers that
customers say they want
RetailersMaintaining strong relationships and an open dialogue with our retailers and
occupiers is a prime focus. We want to make sure we are providing them with
the high-quality service they need
How we have engaged What we are doing
— attended or hosted a wide range of
retailer-focused events
— merchants’ association meetings
— sustainability performance discussed
with retailers and advice provided
where requested
— customer research shared with retailers
— introducing a customer relationship
management programme for retailers
— ensuring the right retail mix and the
next level of leisure
— an annual programme of events that
attract a wider range of customers
InvestorsConstructive engagement with our shareholders lets them know that we are
managing our centres responsibly and the environmental, social and governance
(ESG) risks we are exposed to
How we have engaged What we are doing
— 380 meetings with 190
investment institutions
— regular investor visits to our centres
— results presentations twice a year
— press release on all major
business activity
— keeping investors informed with
roadshows, meetings and conferences
— participating in and being recognised by
ESG indices (see Chairman’s statement
on page 7: awarded GRESB Green Star;
EPRA Gold award)
intu properties plc Annual report 201530

Our peopleOur employees are critical to the success of our business. Employee engagement
is key to a motivated workforce
How we have engaged What we are doing
— annual staff satisfaction survey
— ‘toolbox’ talks, intranet, staff meetings
— strategy and business plan presentations
— staff consultative forums
— staff survey action plans
— reward and recognition programmes
— extending leadership programmes
— working towards National
Equality Standard
— increasing awareness of
charitable-giving options
Local and national governmentFostering strong relationships with local authorities, town centre management bodies
and other community business partnerships is vital to the success of our business
How we have engaged What we are doing
— business rates submission to
HM Treasury
— Sunday trading submission to
Department of Business, Innovation
and Skills (BIS)
— meetings with individual MPs
— post-General Election
Parliamentary reception
— business rates/devolution submission
to Communities and Local Government
(CLG) committee
— meetings with ministers
— meetings with individual MPs
— ‘Contributing report’ produced each year
— Parliamentary dinner
SuppliersWe rely on our suppliers to help our business run smoothly. It is essential they
maintain the same high standards we set ourselves. An open and transparent
relationship makes it easier for us to do this
How we have engaged What we are doing
— key suppliers undergo intu brand-
awareness training
— pre-construction meetings to
communicate intu standards
and expectations
— partnership approach to achieve
environmental targets
— exploring opportunities for supply
chain accreditation
— implementing Modern Slavery Act
— improving supplier recording
and reporting
intugroup.co.uk 31Strategic reportRelationships

Strategy overview
We have clear strategic objectives to ensure the business model is put into action effectively
Optimising asset performance
We are achieving this by
— making our locations the most desirable for shopping and socialising
— astutely managing the assets to take advantage of new trends and occupiers
— building long-term partnerships with local authorities and communities
Progress in 2015
— increased the leisure and catering elements
of centres with the opening of the new
leisure development at intu Potteries and
restaurant quarter at intu Victoria Centre
— introduced new brands to our customers
including Kiko, David’s Bridal and
Red Dog Saloon
— built local authority and parliamentary
relationships and made representation on
retail issues including business rates and
Sunday trading
Priorities in 2016
— agree terms on final leases for catering
developments at intu Metrocentre,
intu Eldon Square and intu Bromley
— continue to introduce new entrants to
our centres to enhance the tenant mix.
This may be from online brands looking
for a store presence
— continue to deliver growth in like-for-like
net rental income
KPIs we use to measure our success
— optimising asset performance
encompasses our whole business
and as such is measured by all KPIs
Managing risk
— property market
— operations
— brand
UK development momentum
We are achieving this by
— delivering the required planning approvals for all projects
— generating the required level of demand to commence a project
— having the required funding to progress the pipeline
Progress in 2015
— started work on the major extension at
intu Watford
— started restaurant developments at
intu Metrocentre, intu Eldon Square
and intu Bromley
— achieved planning approval for the
redevelopment of intu Broadmarsh
Priorities in 2016
— complete ongoing developments at
intu Metrocentre, intu Eldon Square
and intu Bromley
— continue the extension at intu Watford
— commence major projects at
intu Broadmarsh and intu Lakeside
— resolve planning issues at
intu Braehead and intu Milton Keynes
KPIs we use to measure our success
— shareholder return
— total financial return
— prime property assets
— GVA
Managing risk
— property market
— financing
— developments and acquisitions
— brand
For more information on KPIs see
pages 34 and 35
For more information on risk see
pages 37to 39
1
2
intu properties plc Annual report 201532

Making the brand count
We are achieving this by
— offering a distinctive customer signature experience to all our centres
— having the best-in-class digital offering for retailers and customers
— delivering continued world class service to retailers and shoppers
Progress in 2015
— built on the Tell intu programme and
improved customer experience with net
promoter score increasing 20 per cent
— increased retailers trading on intu.co.uk
to over 350, increasing sales through
the website
— secured national brand promotions with
20th Century Fox and MasterCard
Priorities in 2016
— build on the success of our annual events,
such as Student Nights
— continue to build new partnerships with
global brands
— nationwide launch of the intu app
— increase revenues from in centre and
online initiatives
KPIs we use to measure our success
— footfall
— like-for-like net rental income
— shareholder return
— income performance
— GVA
Managing risk
— property market
— operations
— brand
Seizing the growth opportunity in Spain
We are achieving this by
— building a platform of the best centres in Spain through acquisition and development
— delivering the same brand experiences and returns in Spain as in the UK
— moving the development options forward to a point where we can consider exercising
them and commencing developments
Progress in 2015
— integrated Puerto Venecia into the Group
following its acquisition in January 2015
— rebranded Parque Principado as
intu Asturias, introducing the intu
brand to Spain
— exercised the option to acquire the land
near Málaga for the construction of
intu Costa del Sol
Priorities in 2016
— gain required planning approvals and level
of pre-lets to start intu Costa del Sol
— continue to improve asset performance
of Spanish centres
— increase the exposure of the intu brand
in Spain
KPIs we use to measure our success
— footfall
— like-for-like net rental income
— shareholder return
— total financial return
— income performance
— prime property assets
Managing risk
— property market
— financing
— developments and acquisitions
— brand
3
4
intugroup.co.uk 33Strategic reportStrategic overview

Key performance indicatorsWe measure progress against strategic objectives using the following financial and non-financial performance measures
Footfall (%)
-4-5
-3-2-1012
2011 2012 2013 2014 2015
+0%
-1%
intu Experian
Why is this important?
Footfall is an important
measure of a centre’s
popularity with customers.
Retailers use this measure
as a key part of their
decision-making process
on where to locate
their stores.
How is this measured?
Footfall numbers across
intu’s centres are captured
using a combination of
person or car counting
cameras located at specific
entrance and exit points
within the centre.
How have we performed?
Footfall was unchanged
in 2015, ahead of the
1 per cent reduction in
the national benchmark
as measured by Experian,
continuing the trend
of outperforming
this benchmark.
Strategic
objective
1
3
4
Occupancy (%)
95%
96%
2011 2012 2013 2014 2015
intu
IPD (retail)
100
98
96
94
92
90
Why is this important?
Attracting and retaining
the right mix of retailers
and catering and leisure
operators will enhance
our centres’ appeal and
trading environment.
How is this measured?
The passing rent of let
and under-offer units
expressed as a percentage
of the passing rent of let
and under-offer units plus
the ERV of unlet units.
How have we performed?
Occupancy has increased
during the year to
96 per cent and
remains above the IPD
(retail) monthly index
benchmark figure.
Strategic
objective
1
Like-for-like net rental income (%)
2011 2012 2013 2014 2015
+1.8%-3.2%-1.9%-2.7%+3.6%
-2
-4
0
2
4
Why is this important?
Measures the organic
growth in income
generated from the
Group’s properties
in the year.
How is this measured?
Removes from the
year-on-year movement
in net rental income
the impact of acquisitions,
developments
and disposals.
How have we performed?
Like-for-like net rental
income has returned to
growth in 2015 reflecting
improved occupancy,
better rental values from
strong retailer demand,
fewer tenants going
into administration
and development units
coming back on stream,
in particular in the second
half of the year.
Strategic
objective
1
3
4
Shareholder return (%)
2011 2012 2013 2014 2015
+11%
-1%
intu FTSE REIT index
-30-20-10
100
2030
Why is this important?
Combines share price
movement and dividends
to produce a direct
measure of the change
in shareholder value
in the year.
How is this measured?
Uses the movement
in share price during
the year plus dividends
paid in the year.
How have we performed?
The Group showed a small
negative shareholder
return in 2015 compared
to a rise in the REIT sector
which was largely driven
by REITs with exposure
to central London offices.
Strategic
objective
1
3
4
2
Key to strategic objectives
1 Optimise asset performance
2 UK development momentum
3 Make the brand count
4 Seize the growth opportunity in Spain
intu properties plc Annual report 201534

Total financial return (%)
2011 2012 2013 2014 2015
+10%+14%+1%+4%+4%
0
5
10
15
Why is this important?
This is a measure of
the movement in the
underlying value of assets
and liabilities underpinning
the value of a share
plus the dividend paid
to shareholders.
How is this measured?
The movement in adjusted
net asset value per share
plus dividends paid in the
year as a percentage of
the opening net asset
value per share.
How have we performed?
Total financial return
in the year was strong,
driven by property
valuation increases.
Strategic
objective
1
2
4
Income performance (pence)
2011 2012 2013 2014 2015
14.2p13.3p13.7p14.7p15.0p
0
5
10
15
Why is this important?
Underlying earnings per
share is based on the
underlying income
generated in the year
which gives an indication
of the Group’s ability
to pay dividends.
How is this measured?
Underlying earnings
exclude property and
derivative valuation
movements and
exceptional income
or charges.
How have we performed?
Underlying earnings per
share increased during the
year, reflecting the positive
like-for-like net rental
income movement, along
with the contribution from
2014 acquisitions.
Strategic
objective
1
3
4
Prime property assets (%)
2011 2012 2013 2014 2015
+4%
+2.8%
intu IPD monthly index (retail)
-9-6-3
30
69
Why is this important?
Measures the capital
return on the Group’s
property assets and
compares this with the
IPD index, a recognised
industry benchmark.
How is this measured?
The valuation gain or loss
in the year expressed as a
percentage of the book
value pre-valuation
assessed on a like-for-like
basis for the Group’s
investment property.
How have we performed?
The Group outpeformed
the IPD benchmark again
reflecting the overall
quality of the Group’s
assets and the active
asset management
and development
initiatives undertaken.
Strategic
objective
1
2
4
GVA of community investment (£bn)
2014 2015
4.23.5
0
1
2
3
5
4
Why is this important?
Shopping centres
create wealth and
employment for their
local communities. Gross
value added, or GVA,
measures the economic
contribution of intu to
local communities.
How is this measured?
GVA is calculated on
a range of different
activities and types of
economic output of our
UK assets, including:
investment expenditure,
intu operational jobs,
tenant jobs and tax
contributions. This data
is independently assured.
How have we performed?
GVA has increased by
20 per cent reflecting
increases in employment
by intu and at intu centres.
Strategic
objective
1
2
3
Greenhouse gas emissions intensity (CO2e kg/m2)
2011 2012 2013 2014 2015
738485108120
0
30
60
90
120
Why is this important?
Measures our
operational efficiency
and performance of our
existing assets. It also
measures performance
against our carbon
intensity reduction target
of 50 per cent by 2020
against the 2010 baseline.
How is this measured?
Greenhouse gas
equivalents are
calculated to work
out the greenhouse gas
intensity of the energy we
use. These include direct
and indirect emissions
of our directly-managed
UK centres.
How have we performed?
We have had award-
winning reductions
of 30 per cent from
2011-2014. We are on
track to meet our target
of 50 per cent reduction
by 2020.
Strategic
objective
1
intugroup.co.uk 35Strategic reportKey performance indicators

intu Potteries
A case study of how our developments add to the experience of customers, benefit our retailers and ultimately reap rewards for our business
The extension brings a nine-screen cinema and seven quality restaurants including
Nando’s, Coast-to-Coast and Pizza Express and opened to the public at the beginning
of December 2015.
We anticipated good local demand for the £19 million, 70,000 sq ft development, and
its impact was immediate, with footfall rising by 28 per cent in the first six weeks after
opening. Our belief that investment in leisure benefits retail has also been proven, with
retailers already reporting a rise in sales (one recorded taking 30 per cent more than in
the same period the previous year). A number of new brands are looking to take space
in the shopping centre as a result – H&M, the retailer most frequently requested by our
customers, is set to open in 2016. JD Sports and Pandora have upsized their stores.
And we are not finished yet. We have bought the land adjacent to the development for
a second phase, and are putting plans in place to refresh the mall. Our aim is to make
intu Potteries the major shopping and leisure destination for people living between
Birmingham and Manchester.
The leisure extension at intu Potteries
in Stoke-on-Trent is our latest
development project to complete
28%rise in footfall in the first
six weeks of opening
intu properties plc Annual report 201536

Principal risks and uncertaintiesFully integrated and thorough risk analysis underpins intu’s ability to achieve strategic objectives
intu’s Board has responsibility for
establishing the Group’s appetite for risk
based on the balance of potential risks
and returns, and has overall responsibility
for identifying and managing risks.
The Board has undertaken a robust
assessment of the principal risks facing
the Group, including those that would
impact the business model, future
performance, solvency or liquidity.
More detail on this process, including
how it is embedded into intu’s culture,
is set out in detail in the governance
section on pages 70 and 71.
We have identified principal risks and
uncertainties under five key headings:
property market; financing; operations;
developments and acquisitions; and
brand. These are discussed in detail on
the following pages. A principal risk is one
which has the potential to significantly
affect the Group’s strategic objectives,
financial position or future performance
and includes both internal and external
factors. We monitor movements in
likelihood and severity such that the risks
are appropriately mitigated in line with
the Group’s risk appetite.
The risk profile for 2015 has remained
broadly in line with 2014 with no
significant new risks identified nor
substantial changes in existing risks.
The main changes from 2014 are:
— we have started work on our
development pipeline with risk
around new developments such as
the intu Watford extension increasing
as funding is committed
— we have identified increased risk
around the brand as intu continues
to gain momentum with a launch in
Spain and a higher UK profile
— an additional sub-category of property
market risk has been identified,
highlighting the risk of not reacting to
changes in the retail environment such
as changes in customers’ preferences
in light of the increased importance of
multichannel retailing
1 Property market – macro-economic
2 Property market – retail environment
3 Operations – health and safety
4 Operations – cybersecurity
5 Operations – terrorism
6 Financing – availability of funds
7 Developments and
acquisitions – developments
8 Developments and
acquisitions – acquisitions
9 Brand – integrity of the brand
Impa
ct
1
1 6
7
8
9
2
4
3
5
5
9
2
6
43
87
Likelihood
intugroup.co.uk 37Strategic reportPrincipal risks and uncertainties

Principal risks and uncertainties continued
Risk and impact Mitigation 2015 commentary
Property market
1 Macro-economic
Weakness in the macro-economic
environment could undermine
rental income levels and property
values, reducing return on
investment and covenant headroom
— focus on prime assets and upgrading assets
— covenant headroom monitored and stress-tested
— make representation on key policies, for example
business rates
Likelihood and severity of potential impact are
unchanged during 2015 with continued strong
demand for assets and stable rental levels
— valuation increases continue to support
LTV headroom
— tenant administrations at relatively low levels
2 Retail environment
Failure to react to changes in the
retail environment could undermine
intu’s ability to attract customers
and tenants
— active management of tenant mix
— regular monitoring of tenant strength and diversity
— upgrading assets to meet demand, for example
increased leisure offering
— Tell intu customer feedback programme helps identify
changes in customer preferences
— work closely with retailers
— digital strategy that embraces technology and digital
customer engagement. This enables intu to engage in
and support multichannel retailing, and to take the
opportunities offered by ecommerce
Likelihood and severity of potential impact are
unchanged during 2015 with intu’s strategy continuing
to deliver strong footfall numbers and occupancy
— significant progress on planning and pre-letting
of near-term pipeline with a focus on leisure
and catering
— digital investment to improve relevance as
shopping habits change
— occupancy remains strong at 96 per cent
— footfall steady and continues to be ahead
of benchmark
Strategic objectives affected:1
2
3
4
Operations
3 Health and safety
Accidents or system failure leading
to financial and/or reputational loss
— strong business process and procedures, supported by
regular training and exercises
— annual audits of operational standards carried out
internally and by external consultants
— culture of visitor and staff safety
— crisis management and business continuity plans in place
and tested
— retailer liaison and briefings
— appropriate levels of insurance
— staff succession planning and development in place
to ensure continued delivery of world class service
— health and safety managers or coordinators in all centres
Likelihood and severity of potential impact have not
changed significantly during 2015
— accredited with OHSAS 18001 certification,
demonstrating the implementation of consistent
health and safety management process and
procedures across the portfolio
— work continuing towards achieving ISO 9001,
14001 and 55001 accreditation
— continued to deliver improvements in systems and
processes, including investment in new facilities
management and contractor tracking systems
— all individual intu centres and intu Retail Services
awarded Investors in People accreditation
4 Cybersecurity
Loss of data and information or
failure of key systems resulting in
financial and/or reputational loss
— implemented data and cybersecurity strategies
— regular testing programme
— appropriate levels of insurance
— crisis management and business continuity plans in
place and tested
— data committee
— monitoring of regulatory environment and best practice
Likelihood and severity of potential impact have not
changed significantly during 2015
— ongoing Group-wide cybersecurity project
with focus on proactive monitoring of technical
infrastructure to mitigate cyber threats
5 Terrorism
Terrorist incident at an intu
centre or another major shopping
centre resulting in loss of consumer
confidence with consequent impact
on lettings and rental growth
— strong business process and procedures, supported by
regular training and exercises, designed to adapt and
respond to changes in risk levels
— annual audits of operational standards carried out
internally and by external consultants
— culture of visitor and staff safety
— crisis management and business continuity plans in
place and tested
— retailer liaison and briefings
— appropriate levels of insurance
— strong relationships and frequent liaison with police,
NaCTSO and other agencies
Overall likelihood and severity of potential impact
have increased due to external factors
— national threat level remains at Severe following
the incidents in Paris in November
— all intu centres have reviewed their plans in
preparation should the national threat level move
to Critical
— new operating procedures issued to allow for
the introduction of further security measures
if required
Strategic objectives affected:1
3
intu properties plc Annual report 201538

Risk and impact Mitigation 2015 commentary
Financing6 Availability of funds
Reduced availability of funds could
limit liquidity, leading to restriction
of investing and operating activities
and/or increase in funding cost
— funding strategy regularly reported to the Board with
current and projected funding position
— effective treasury management aimed at balancing
long debt maturity profile and diversification of sources
of finance
— consideration of financing plans including potential for
recycling of capital before commitment to transactions
and developments
— strong relationships with lenders, shareholders and partners
Likelihood and severity of potential impact are
unchanged during 2015 with regular refinancing
activity undertaken continuing to evidence the
availability of funding
— extension of £351.8 million SGS term loan at
a significantly reduced margin
— secured €225 million of debt on acquisition
of Puerto Venecia, Zaragoza
— extension of joint venture relationship with
CPPIB in Spain
Strategic objectives affected:2
4
Developments and acquisitions
7 Developments
Developments fail to create
shareholder value
— Capital Projects Committee reviews detailed appraisals
before and monitors progress during significant projects
— fixed price construction contracts for developments
agreed with clear apportionment of risk
— significant levels of pre-lets exchanged prior to
scheme development
Likelihood and severity of potential impact have
increased during 2015 as the Group has started work
on its development pipeline
— demolition of the old Charter Place precinct in
December paving the way for the extension of
intu Watford
— detailed appraisal work and significant pre-lets
ahead of starting major development projects
— exercise of the option to acquire land in Málaga
completed in May
— new Spanish management structure implemented
to enhance delivery of strategic goals including
development pipeline
8 Acquisitions
Acquisitions fail to create
shareholder value
— research and third party due diligence undertaken
for transactions including local specialists in Spain
— local partner in Spain with market specialist knowledge
— investment risk reduced through financing and joint
venture investments
Likelihood and severity of potential impact have
remained unchanged in 2015
— substantial property and financial due diligence
undertaken before acquisition of Puerto Venecia,
Zaragoza
— acquisitions from Westfield in 2014 proven to be
successful with investment property valuations
up 11 per cent post acquisition
Strategic objectives affected:2
4
Brand9 Integrity of the brand
The integrity of the brand is
damaged leading to financial and/or
reputational loss
— intellectual property protection
— strong guidelines for use of brand
— strong underlying operational controls and crisis
management procedures
— ongoing training programme and reward and recognition
schemes designed to embed brand values and culture
throughout the organisation
— traditional and digital media monitoring and analysis
— Tell intu and shopper view customer feedback programmes
Likelihood and severity of potential impact have
increased during 2015 as the brand has continued
to gain momentum with a launch in Spain and a
higher UK profile
— introduced intu brand in Spain through intu Asturias
with key mitigating controls being implemented
— increased media interest in intu and our opinions
— increase in nationally promoted campaigns
— net promoter score has increased from
60 to 74 during 2015
Strategic objectives affected:1
2
3
4
Key to strategic objectives
1 Optimise asset performance
2 UK development momentum
3 Make the brand count
4 Seize the growth opportunity in Spain
Change in level of risk
Increased
Decreased
Remained the same
intugroup.co.uk 39Strategic reportPrincipal risks and uncertainties

Operating review
Our operating review analyses how we have performed in the year and sets out our strategy
On a like-for-like basis, ERV increased by
1.5 per cent in the year, outperforming
the IPD index which indicated a 0.7 per
cent increase.
There were three main drivers of the
increase in property values across the
portfolio in 2015:
— strong new lettings demonstrate
improvement in the occupier market
with rental values increasing across
most of our centres
— investment in improvements and
reconfigurations at centres have driven
above-average increases in rental
values. In particular this can be seen
at intu Eldon Square, intu Victoria
Centre and intu Potteries where our
investment programme has not only
added new rental income but also in
each case proved highly beneficial
in attracting new tenants to the
existing centre
— enhancements to the overall
market positioning of centres through
developments and improved tenant
mix along with continued investor
demand for top destination centres
has led to the 18 basis point
yield compression
The table right shows the main
components of the £350.7 million
revaluation surplus:
— intu Trafford Centre: new lettings
have increased rental values and
provided evidence for future growth
— intu Lakeside: strengthening of the
tenant mix and the upgraded dining
offer has had a favourable impact
on the attractiveness of this
centre and demand from tenants
— St David’s, Cardiff: improved tenant
mix has seen the centre achieve super
prime status as it becomes ever more
established in its market. Rental uplifts
from new lettings and the first series
of rent reviews have further driven
an exceptionally strong performance
Optimising asset performance
We focus on creating vibrant
environments where shoppers want
to be and retailers need to be. This
increases the value of our centres and
provides strong, stable income streams
and positive operating metrics. These
elements ensure we deliver attractive
long-term total property returns.
Valuation
The valuation gain on our investment
property, including the Group’s share
of joint ventures, was £350.7 million, up
4.0 per cent like-for-like in the year. This
was significantly ahead of the IPD monthly
retail index which reported a 2.8 per cent
increase, a sixth consecutive year of
outperformance.
The weighted average nominal equivalent
yield at 31 December 2015 was 5.14 per
cent, a reduction of 18 basis points in
the year, reflecting our ongoing asset
management initiatives and favourable
investment market conditions. Based on
the gross portfolio value, the net initial
yield ‘topped-up’ for the expiry of
rent-free periods was 4.52 per cent.
UK investment market
Investment demand remains strong for
prime regional shopping centres. Global
institutions perceive this asset class as
having reliable growth characteristics and
are prepared to invest beyond London
and the south east.
Shopping centre development remains
at low levels with the majority of
activity focused on extensions and
reconfigurations. The combination of
strong investor demand, limited supply
and the improving underlying economy has
seen continued strengthening in valuations.
Full year
2015
Second half
2015
First half
2015
Group1 revaluation surplus (like-for-like) +4.0% +2.1% +1.9%
IPD2 capital growth +2.8% +1.6% +1.2%
Group1 weighted average nominal equivalent yield 5.14% 5.14% 5.25%
Change in Group nominal equivalent yield -18bp -11bp -7bp
IPD2 equivalent yield shift -23bp -10bp -13bp
Group1 ‘topped-up’ initial yield (EPRA) 4.52% 4.52% 4.55%
Group1 change in like-for-like ERV +1.5% +1.0% +0.6%
IPD2 change in rental value index +0.7% +0.6% +0.1%
1 Including Group’s share of joint ventures.
2 IPD monthly index, retail.
intu properties plc Annual report 201540

— intu Victoria Centre: the benefits of
the mall refreshment work can now
be seen through competitive letting
activity driving Zone A rents from
£230 per sq ft to £250 per sq ft
— intu Derby: increased demand for
space has moved rental values
forward. In our first 18 months of
ownership, the value of this centre
has increased by over 13 per cent
— intu Eldon Square: the substantial
programme of investment we have
undertaken has provided an enhanced
environment with key new lettings
improving rental tone and heightened
tenant demand
— intu Braehead: the less buoyant
occupier and investment market in
Scotland has resulted in a reduction
in value of the centre
— intu Asturias: our proactive asset
management both in terms of tenant
mix and developments has seen
a continuation in the strong growth
of the centre, a third year of increased
values and a total increase of
36 per cent since acquisition
intu Victoria Centre
Valuation growth comes as a result of our
transformation of the centre
Occupancy is 96 per cent, an increase
of 1 per cent on December 2014 due
to proactive asset management and
improved tenant demand. The 4 per cent
vacancy rate outperforms the PMA’s unit
vacancy measure for ‘big shopping
centres’ of 10 per cent.
Like-for-like net rental income was up
1.8 per cent against 2014 due to the
better rental values from strong retailer
demand, improved occupancy, fewer
tenants going into administration and
development units coming back on
stream, in particular in the second half
of the year.
We agreed 261 new long-term leases
in the year, amounting to £46 million
new annual rent, at an average of
10 per cent above previous passing rent
(like-for-like units) and in line with valuers’
assumptions. Significant activity in the
year includes:
— continued strong demand from
catering operators, with 63 new
lettings across the portfolio.
Restaurant brands opening at
multiple centres in the year included
Byron, YO! Sushi, Thaikhun and
Barburrito. We also saw new brands
expanding into shopping centres,
for example Red Dog Saloon opened
its first restaurant outside central
London at intu Lakeside
— retailers using intu’s scale to assist
them in getting national coverage, with
Kiko and Smiggle signing leases for 10
units each, taking their UK portfolios
to 25 and 42 stores respectively
— intu Eldon Square where we saw a
total of 25 new lettings in response to
the refreshed malls (16 retail lettings)
and catering redevelopment (nine
restaurant lettings). Occupancy now
stands at 99 per cent
— intu Lakeside where tenant mix
improvements and several lease
renewals resulted in 26 lettings,
including Kurt Geiger and
Victoria’s Secret
— 350 shops opened or refitted in our
centres in 2015, 11 per cent of our
3,300 units. Tenants have invested
approximately £105 million in these
stores, a significant demonstration
of their commitment to our centres
We settled 147 rent reviews in the year
for new rents totalling £38 million, an
average uplift of 8 per cent on the
previous rents.
Total property return
9%(2014: 13%)
Property revaluation surplus
£351m(2014: £648m)
Market value
Surplus
£m
Like-for-like
surplus
%
31 December
2015
£m
31 December
2014
£m
intu Trafford Centre 2,305.0 2,200.0 102.8 5
intu Lakeside 1,334.0 1,255.0 73.1 6
St David’s, Cardiff 368.6 308.0 61.4 21
intu Victoria Centre 356.0 314.0 31.5 10
intu Derby 447.0 420.0 23.1 5
intu Eldon Square 299.7 272.6 20.3 8
intu Braehead 585.5 599.3 (15.6) (3)
intu Asturias 89.1 82.2 10.0 13
Other including non like-for-like 3,817.5 3,512.3 44.1
Investment and development
property including Group share
of joint ventures 9,602.4 8,963.4 350.7 4
intugroup.co.uk 41Strategic reportOperating review

Operating review continued
reviews and lease expiry. Of the
£42 million, £8 million relates to reversions
only realisable on expiry of leases with over
10 years remaining (for example anchor
units), leaving £34 million, 7 per cent, from
other lease expiries and rent reviews.
The weighted average unexpired lease
term is 7.9 years (31 December 2014:
7.4 years).
UK development momentum
We are advanced in our planning
for near-term developments
in the UK, and expect to spend
£578 million over the next three
years. These will deliver value-enhancing
returns which, along with a further
£1.1 billion of opportunities over
the next 10 years, provide a robust
platform for organic growth.
In 2015 we invested £78 million on active
asset management projects, including:
— at intu Victoria Centre we completed
the £42 million project adding new
restaurants, which opened in time for
Christmas, remodelled several units
at the northern end of the scheme
and fully refurbished the interiors.
The incremental rent on reconfigured
units was £2.4 million, with the impact
of the refurbished malls and improved
tenant demand increasing Zone A
rents in other parts of the centre.
New retailers in the year include
Kiko, Tiger, Swatch and Smiggle
Footfall outperformed the Experian
measure of UK national retail footfall
by 170 basis points with our customer-
focused events programme and world
class customer service delivering the
outperformance.
Estimated retailer sales in our centres
were up 2.1 per cent in 2015 against the
same period in 2014, continuing the trend
we saw in 2014 and in line with the British
Retail Consortium trends. The ratio of
rents to estimated sales for standard
units remained stable in the year at
12.5 per cent. This ratio has reduced from
14.6 per cent four years ago but, given the
current increased market demand and
low vacancy, we see good prospects of
the ratio reverting to higher levels from
growing rents.
The difference between annual property
income (see glossary) of £449 million
and ERV of £531 million represents
£40 million from vacant units and
reversion of £42 million from rent
Operating metrics2015 2014
Occupancy 96% 95%
– of which, occupied by tenants trading in administration 1% 1%
Like-for-like change in net rental income +1.8% -3.2%
Leasing activity – number, new rent
261,
£46m
210,
£34m
– new rent relative to previous passing rent +10% +5%
Footfall +0.3% +0.1%
Retailer sales (like-for-like centres) +2.1% +2.5%
Rent to estimated sales (exc. anchors and major space users) 12.5% 12.5%
2015 customer metrics
2hrs 7 minsestimated dwell time
(super-regional centres)
400mannual customer visits
21maverage customer
visits per centre
74net promoter score
£5.6bnestimated retailer sales
Relative consumer spend
Our insight shows that happier customers
stay longer and spend more
100
90
80
70
60
50
40
<1 1–2 2–4 4–6 >6
Ne
t p
rom
ote
r sc
ore
Dwell time (hours)
Size of bubble represents spend.
intu properties plc Annual report 201542

— at intu Potteries we opened the £19
million fully-let leisure extension. The
stand-alone project added £1.2 million
of new rent and we are already seeing
increased demand in the centre with
H&M signing a lease to open its first
store in the city and JD Sports and
Pandora upsizing their existing units
Near-term pipelineOur UK development pipeline over the
next three years amounts to £578 million.
We have £230 million of active
asset management projects either
committed or planned:
— committed capital expenditure of
£45 million includes intu Metrocentre,
intu Bromley and intu Eldon Square
where we are nearing completion of
three catering developments adding
36 new restaurants and costing
around £30 million in total (intu share).
We anticipate that all three schemes
will open fully let by summer 2016 and
deliver returns, on average, of around
8 per cent
— we have £185 million of active asset
management projects with every
centre having proposed projects,
including right sizing tenants at intu
Merry Hill and a catering development
at Manchester Arndale
UK occupier market
The majority of economic indicators show
improving markets, in particular those
that impact on retail. We continue to see
wage growth rising faster than inflation,
providing the customer with more
disposable income. The Asda benchmark
index indicates household income
7 per cent higher than the previous year.
Consumer confidence continues to rise
and was strong throughout 2015. The
proportion of consumers feeling positive
about their job prospects and willing to
spend money are both at their highest
levels for over seven years.
Retail spending, as shown by the
British Retail Consortium like-for-like
non-food retail sales, continues to
show an average growth rate of above
2 per cent year-on-year.
Retailer administrations in 2015 were at the
lowest levels since 2007, according to the
Centre for Retail Research, with USC and
Bank being the largest. These were the only
two significant failures in the intu portfolio
and accounted for just over 1 per cent of
our rent roll. Since the year end, Blue Inc.
has put some of its units into administration
(around 0.1 per cent of intu’s rent roll),
but the majority continue to trade.
We have progressed the next wave of
major extensions and redevelopments
and expect to invest an estimated
£348 million:
— at intu Watford we have commenced
site clearance for the £178 million
extension. Pre-lets stand at over
50 per cent with Cineworld and
Debenhams anchoring the leisure-led
extension. This project is expected
to deliver a return on costs of
6-7 per cent, including 1-2 per cent
generated through the existing centre
— we are finalising pre-lets before
commencing the £75 million
(intu share) redevelopment of
intu Broadmarsh and £95 million
leisure extension at intu Lakeside
+1.8
Change in like-for-like net rental income (%)
2001 2002 2003 2004 2005 2006 2007 2008 2009 2010 2011 2012 2013 2014 2015
-6
-4
-2
0
2
4
6
8
10
intu Potteries
Increased leisure opportunities are leading
to rising retailer demand
Funding
We will fund our near-term pipeline from
cash and available facilities and from
recycling capital to deliver superior returns.
On a pro forma basis, including the £202
million realised from the disposal of our
investment in Equity One in January 2016,
cash and available facilities would have
been £790 million. Further recycling
potential lies in the introduction of
partners into some of our centres.
In addition, to fund the future opportunities
we expect to raise finance on near-term
projects as they complete.
intugroup.co.uk 43Strategic reportOperating review

Operating review continued
intu on television
The first nationwide shopping centre TV
campaign, for Christmas 2015, had over
three million views on social media
trading on our transactional website,
giving customers access to the majority
of our retailers online and in centre and
our retailers an additional sales channel.
The power of our digital offering is
producing increased sales through
intu.co.uk and demand from retailers
for email marketing campaigns using
the intu platform.
In September 2015 we previewed our
new app before its national launch in early
2016. The app provides in centre blue dot
Apple wayfinding, personalised special
offers and centre information in one
easy-to-use service. It was developed
by our in-house digital innovation team,
working with Apple to map all intu
centres, and takes advantage of our
own high-quality wifi infrastructure which
allows accurate location-based services.
Events with a differenceOur national events programme gives
customers reasons to come more often
and stay longer which in turn provides
retailers with enhanced footfall and sales
opportunities. In early summer, our third
annual ‘Everyone’s Invited’ festival,
focusing heavily on the family audience,
showed net promoter scores increasing
by around 25 per cent for the weekend.
The start of the new university year saw
128,000 students, an increase of over
20 per cent on the 2014 event, attending
the student nights at 16 of our centres.
intu Experiences, our in-house team
which delivers immersive brand
partnerships, mall commercialisation
and advertising, generated net income
exceeding £15 million in 2015, around 4
per cent of our rent roll. A greater share
of this revenue is now from media and
promotional activity rather than the
traditional mall kiosks thereby enhancing
the customer experience.
Future opportunitiesBeyond 2018, we have a £1.1 billion
pipeline of opportunities across several
centres with major extensions planned
at intu Lakeside, intu Victoria Centre,
Cribbs Causeway and intu Braehead,
and an upgrade and remodelling of intu
Milton Keynes. The first two projects
have planning approvals and we are
in the planning process on the latter
three. We will bring these projects
forward in line with tenant demand.
For active asset management projects
we expect to generate a stabilised initial
yield of 6 to 10 per cent and around
7 per cent on major projects. Where
no significant additional space is
created we assess project returns
in the context of an internal rate
of return based on the anticipated
impact on overall centre performance.
For more information see our growth
story on pages 10 and 11.
Making the brand count
Over the last three years we have
created a national brand that our
shoppers and retailers know and
understand. By combining our
scale, expertise and insight to create
compelling experiences we are
seeing the benefit of the brand
grow year-on-year.
Digital connectivityWifi registrations at our centres have
continued to grow steadily to over
2.5 million individuals. We are still seeing
approximately 60 per cent of registrants
opt in to marketing communications and
offers which, along with sign ups through
other channels, has increased our active
marketing database to over two million
individuals. Our targeted marketing
campaigns are achieving well above
the industry standards for email
performance, including open and
click-through rates.
Traffic to intu.co.uk continues to grow
with over 24 million website visits in
the last 12 months, an increase of over
30 per cent on the previous year. We
now have more than 350 affiliate retailers
Industry recognition
— BSCS Opal Awards 2015 for
commercialisation – three
awards including the highest honour,
an Aurora Award, for our partnership
with Ratchet Clothing, providing a
multichannel environment suited to
the young retailer’s brand ethos,
including a pop-up at intu Lakeside
and an online boutique on intu.co.uk
— BSCS Purple Apple Marketing
Awards 2015 – eight awards including
the Golden Apple Award for intu
Metrocentre’s launch of ‘The Heart
of a Thousand Crystals’ chandelier
— Sceptre Awards 2015, recognising best
practice and best people – six awards
including the highest honour, the Grand
Prix, awarded for best overall owner/
managing agent
— Transform Awards Europe 2015 – three
gold awards recognising the impact of
our rebrand on our business, including
best visual identity in the retail sector
and best overall visual identity
intu properties plc Annual report 201544

intu Asturias
The rebranding and mall refresh have been
well-received, with increased sales and footfall
Puerto Venecia
The country’s leading retail resort is the model
for intu’s future developments in Spain
With over half of the UK’s population
visiting an intu centre at some point
through the year in person or online,
we are increasingly working with global
brands on a national basis to provide
high-quality promotional events, both
physically and digitally, to our customers.
We partnered with MasterCard to deliver
a multichannel campaign for the Rugby
World Cup 2015 and, following the
success of the launch of their film Home
at intu centres, 20th Century Fox again
teamed up with us to promote the
new Snoopy film over the autumn
half term holiday.
World class serviceThe Tell intu measure of net promoter
score continues to improve as we
constantly aim to enhance the customer
experience in our centres. Net promoter
score for 2015, where we have like-for-like
figures, is running at over 20 per cent
higher than the same period in 2014.
Seizing the growth opportunity in Spain
Our Spanish strategy is to create a
business of scale through the acquisitions
to date and our pipeline of development
projects. Concentrating on the top-10 key
catchments, we aim to establish a market-
leading position in the country through
ownership and management of prime
shopping resorts. We have consolidated
this position in 2015.
AcquisitionsIn January 2015 we completed the
€451 million acquisition of Puerto
Venecia shopping resort in Zaragoza.
In September 2015 we introduced CPPIB
as our 50 per cent joint venture partner,
extending our partnership, which
started with the purchase of intu
Asturias, to cover two of Spain’s
top-10 shopping centres.
We also exercised the option for the
prime development site for a shopping
resort near Málaga, now referred to as
intu Costa del Sol. The total cost to date
of the land and predevelopment
expenditure is €60 million.
Operational performanceOur two centres, intu Asturias and Puerto
Venecia, Zaragoza, are benefiting from
our active asset management approach
and the improving Spanish economy, with
footfall and retailer sales up by 3 per cent
and 10 per cent respectively.
Occupancy is 100 per cent at
intu Asturias and 95 per cent at
Puerto Venecia.
We agreed 22 new long-term lettings
in the year, amounting to €2 million
new annual rent, at an average of
12 per cent above previous passing rent
(like-for-like units) and in line with valuers’
assumptions. New names to our Spanish
centres included Adidas, Levi’s, Fnac
and Décimas.
intu’s 50 per cent share of Puerto
Venecia was valued at €225 million
at 31 December 2015, in line with the
acquisition price. intu’s share of intu
Asturias increased by €14 million (13 per
cent) in the year to €121 million, an
increase of 36 per cent since acquisition.
Development pipelineOur development pipeline in Spain
consists of the intu Costa del Sol project
on the site we acquired in 2015 near
Málaga and three future development
opportunities – we have options on sites
in Valencia, Vigo and Palma.
Our plan for intu Costa del Sol is a
175,000 sq m shopping resort positioned
on the main Costa del Sol highway with
access to a catchment of around three
million residents and 10 million tourists
annually. Discussions are progressing well
with the key retail and leisure anchors
who have shown strong interest in
the development.
We continue to develop plans at the three
other sites, with the next development,
likely to be intu Valencia, following on
from intu Costa del Sol.
Spanish market
The Spanish economy continues to recover
with improving labour market conditions,
customer confidence at the highest level
since 2000, increasing retailer sales and
GDP growth.
Occupiers, in particular major fashion
retailers, are looking to consolidate their
positions in the best locations as the
economy improves. Coupled with new
international entrants this is driving strong
leasing activity in prime locations.
The investment market remains vibrant
with intense competition from international
buyers and large SOCIMIs (Spanish
equivalent of a REIT) for the best assets.
intugroup.co.uk 45Strategic reportOperating review

Financial review
Recent acquisitions, positive like-for-like net rental income and continued increases in asset values have resulted in increases to both underlying earnings and NAV per share
Financing metrics remain strong due to
property valuation increases and recent
refinancing activity:
— debt to assets ratio at 43.1 per cent
(31 December 2014: 44.2 per cent),
below the Group’s target maximum
level of 50 per cent; debt to assets
ratio pro forma for the sale of the
Group’s interest in Equity One shares
in January 2016 of 41.0 per cent
— interest cover ratio of 1.91x (31
December 2014: 1.82x), above the
Group’s target minimum level of 1.60x
— cash and available facilities of
£588.4 million (31 December 2014:
£670.8 million) remains high but
has reduced due to acquisitions and
capital expenditure in the year; cash
and available facilities pro forma for
the sale of our interest in Equity One
shares of £790.3 million
Major transactions:
— in January the Group completed
the acquisition of Puerto Venecia,
Zaragoza for €450.8 million. The
acquired debt was refinanced on
acquisition with €225.0 million of
debt raised. In September the
Group introduced CPPIB as a
50 per cent joint venture partner
— in June the Group renegotiated the
£351.8 million term loan within the
Secured Group Structure (SGS),
extending this by two years to
March 2020 and reducing the
interest rate margin by 1.5 per cent
— in September the Group agreed a
one year extension to the £600 million
revolving credit facility (RCF) which
is now in place until 2020
— in December the Group agreed a
new facility of £95.8 million for intu
Bromley, drawn down in January 2016,
replacing the existing facility
Overview
Recent acquisitions, positive like-for-like
net rental income and continued
increases in asset values have resulted in
increases to both underlying earnings and
NAV per share:
— underlying earnings of £186.6 million,
up 15 per cent on 2014, reflecting
the acquisition of Puerto Venecia,
Zaragoza in January 2015 and a full
year’s impact from the acquisitions
and disposals in the first half of 2014
— underlying earnings per share of
14.2 pence, up 7 per cent on 2014
— NAV per share of 404 pence; total
financial return for the year of
10 per cent
Presentation of information
The Group accounts for its interests in
joint ventures using the equity method as
required by IFRS 11 Joint Arrangements
which applied for the first time in the 2014
consolidated financial statements. This
means that the income statement and
the balance sheet include single lines
for the Group’s total share of post-tax
profit and the net investment in joint
ventures respectively.
Management both review and monitor
the business, including the Group’s share
of joint ventures, on an individual line
basis rather than a post-tax profit or net
investment basis and therefore the figures
and commentary presented are consistent
with this management approach. The other
information section gives reconciliations
between the two bases on pages
164 to 166.
intu properties plc Annual report 201546

Results for the year
Income statementThe Group recorded a profit for the year
of £517.6 million, a reduction on the
£599.8 million reported for the year
ended 31 December 2014. This was
primarily due to a lower gain on property
valuations of £350.7 million including
the Group’s share of joint ventures
(2014: £648.2 million), offset by:
— a positive movement in the fair value
of the Group’s financial instruments.
2015 includes a credit of £5.3 million
(2014: charge of £157.0 million)
— lower exceptional finance costs of
£31.4 million (2014: £50.7 million)
largely due to the lower level of
interest rate swap terminations in
connection with debt refinancing
— lower exceptional administration costs
of £1.5 million (2014: £13.9 million).
2014 included costs in relation to
the acquisition of intu Merry Hill,
intu Derby and Sprucefield
The Group’s investments in joint ventures
contributed £108.6 million to the profit of
the Group in 2015 (2014: £99.7 million)
including £24.7 million of underlying
earnings (2014: £18.6 million) and a gain
on property valuations of £85.8 million
(2014: £80.4 million).
Year ended
31 December
2015
Year ended
31 December
2014
Profit for the year (£m) 517.6 599.8
Underlying earnings (£m) 186.6 161.7
Underlying EPS (pence) 14.2 13.3
Net rental income1 (£m) 427.8 396.6
1 Including Group share of joint ventures.
Underlying earnings increased by £24.9
million to £186.6 million with underlying
earnings per share increasing by 7 per
cent to 14.2 pence. Underlying amounts
exclude valuation movements,
exceptional items and related tax and are
presented as they are considered to be a
key measure of the Group’s performance
and an indication of the extent to which
dividend payments are supported by
underlying operations. The underlying
profit statement is presented in full in the
other information section on page 167.
The principal components of the change
in underlying earnings are as follows:
— net rental income increase of
£25.1 million due to the acquisition
of Puerto Venecia, Zaragoza in
2015, a full year’s impact from
2014 acquisitions and disposals
and property held for development
— like-for-like net rental income
increased by £6.1 million,
1.8 per cent (see operating review)
— underlying net finance costs increased
by £7.1 million reflecting the full
impact of funding 2014 acquisitions
and the acquisition of Puerto
Venecia, Zaragoza in 2015. These
are partially offset by the favourable
impact of lower interest rates
following debt refinancings
— ongoing administration expenses
increased by £6.9 million, largely
due to the costs of managing
recently acquired properties and
the administration of the Spanish
properties and developments
Year ended
31 December
2015
£m
Year ended
31 December
2014
£m
Gross rental income 514.0 480.4
Head rent payable (22.4) (23.4)
491.6 457.0
Net service charge expense and void rates (23.7) (21.2)
Bad debt and lease incentive write-offs (6.2) (7.2)
Property operating expense (33.9) (32.0)
Net rental income 427.8 396.6
Net rental income margin 87.0% 86.8%
EPRA cost ratio (excluding direct vacancy costs) 16.0% 15.5%
As detailed in the table below, the Group’s
net rental income margin including share
of joint ventures is in line with 2014 at
87.0 per cent. Property operating expenses
largely comprise car park operating costs
and the Group’s contribution to shopping
centre marketing programmes. The
Group’s ratio of total costs to income,
as calculated in accordance with EPRA
guidelines, remains low at 16.0 per cent.
0
50
100
150
200 161.7 6.125.1 -7.1 -6.9 7.7 186.6
20
14
Ne
t re
nta
l in
com
e –
acq
uis
itio
ns
/dis
po
sals
/de
ve
lop
me
nts
Ne
t re
nta
l in
co
me
– l
ike
-fo
r-li
ke
Ne
t fi
na
nce
co
sts
Ad
min
istr
ati
on
co
sts
Oth
er
20
15
Underlying earnings bridge (£m)
Underlying earnings increased by £24.9 million to £186.6 million
— other includes a saving of £2.9 million
following the conversion of the 3.75
per cent convertible bonds in July 2014
Strategic reportFinancial review
intugroup.co.uk 47

Financial review continued
National scale
Smiggle is using intu’s scale to get national
coverage, signing leases for 10 units in 2015,
which takes its UK portfolio to 42 stores
Balance sheetThe Group’s net assets attributable
to shareholders have increased by
£452.4 million to £4,976.4 million at
31 December 2015 reflecting the
retained profit for the year.
As detailed in the table, net assets
(diluted, adjusted) have increased by
£442.3 million from 31 December 2014
to £5,411.2 million at 31 December 2015.
Investment and development property
has increased by £634.9 million primarily
due to the £350.7 million valuation gain
in the year, capital expenditure of over
£120 million (including the exercise of
the option over land in Málaga) and the
acquisition of Puerto Venecia, Zaragoza,
with intu’s 50 per cent holding valued at
£166.1 million at 31 December 2015.
Investments of £265.0 million principally
comprise the Group’s interests in the
US and India. The US investment of
11.4 million shares in a US venture
controlled by Equity One, a listed US REIT,
is valued at £209.4 million based on the
31 December 2015 Equity One share
price. The Group subsequently sold this
investment on 19 January 2016 for
proceeds of £201.9 million. The India
investment largely comprises a 32 per
cent interest in Prozone (£36.4 million),
2015 2014
Group
balance sheet
as presented
£m
Share of
joint
ventures
£m
Group
including
share of joint
ventures
£m
Group
including
share of joint
ventures
£m
Investment and development property 8,403.9 1,119.8 9,523.7 8,888.8
Investment in joint ventures 991.9 (991.9) – –
Investment in associates and other investments 265.0 – 265.0 227.7
Net external debt (4,023.8) (115.3) (4,139.1) (3,963.4)
Derivative financial instruments (338.5) (2.0) (340.5) (347.2)
Other assets and liabilities (243.6) (10.6) (254.2) (209.1)
Net assets 5,054.9 – 5,054.9 4,596.8
Non-controlling interests (78.5) – (78.5) (72.8)
Attributable to shareholders 4,976.4 – 4,976.4 4,524.0
Fair value of derivatives (net of tax) 322.1 – 322.1 333.6
Other adjustments 96.5 – 96.5 89.1
Effect of dilution 16.2 – 16.2 22.2
Net assets (diluted, adjusted) 5,411.2 – 5,411.2 4,968.9
a shopping centre developer listed on
the Indian stock market, and a direct
interest in Empire (£18.3 million), owner
and operator of a shopping centre in
Aurangabad. See notes 24 and 25 for
further details.
Net external debt is discussed in the cash
flow and net external debt section below.
Derivative financial instruments comprise
the fair value of the Group’s interest rate
swaps. The net liability at 31 December
2015 is £340.5 million, a reduction of
£6.7 million in the year. Cash payments
in the year totalled £44.1 million,
£26.5 million of which has been classified
as an exceptional finance cost as it relates
to payments in respect of unallocated
swaps. The balance of the payments
has been included as underlying finance
costs as it relates to ongoing interest
rate swaps used to hedge debt.
As previously detailed, the Group has a
number of interest rate swaps, entered
into some years ago, which are unallocated
due to a change in lenders’ practice. At
31 December 2015 these swaps have a
market value liability of £239.1 million
(31 December 2014: £242.5 million). It is
estimated the Group will be required to
make cash payments on these swaps of
around £24 million in 2016.
The Group’s investment in joint
ventures, on an equity accounted basis,
is £991.9 million as at 31 December 2015
(2014: £851.5 million). The movement in
the year reflects increases from the net
investment in Puerto Venecia, Zaragoza
of £86.1 million and intu’s share of
property valuation gains of £85.8 million.
At 31 December 2015 the investment
in joint ventures reflects investment
property of £1,119.8 million (2014:
£869.2 million) and net debt of
£115.3 million (2014: £5.5 million).
The non-controlling interest at 31
December 2015 relates to our partner’s
40 per cent stake in intu Metrocentre.
The Group is exposed to foreign exchange
movements on its overseas investments.
The Group’s policy is to ensure that the
net exposure to foreign currency is less
intu properties plc Annual report 201548

Improving retail mix
Active asset management is bringing new
brands to Puerto Venecia such as Fnac
Cash flow and net external debtDuring 2015 the Group generated
an increase in cash of £61.1 million.
Cash flow from operating activities of
£160.2 million is £103.7 million higher
than 2014, primarily due to the lower
level of exceptional swap termination
costs compared to 2014 and working
capital movements.
Cash flows from investing activities
reflect the cash outflow for the
acquisition of Puerto Venecia, Zaragoza
of £203.1 million and an inflow of
£81.0 million from the subsequent sale
of a 50 per cent interest to CPPIB net of
new debt issued. Capital expenditure of
£100.8 million was incurred in the year.
2014 reflected a cash outflow on the
acquisition of intu Merry Hill, intu Derby
and Sprucefield of £851.3 million and an
inflow from the disposal of 80 per cent
of intu Uxbridge of £174.1 million.
Cash flows from financing activities
include net debt drawdowns of
£138.9 million primarily to fund the
acquisition of Puerto Venecia, Zaragoza.
Dividends paid in cash during the year
were £104.9 million. 2014 included an
inflow of £492.0 million from the
rights issue undertaken to part-fund
acquisitions and net borrowings raised
of £314.3 million.
Net external debt (including Group
share of joint ventures) has increased
by £175.7 million. Cash has increased
by £41.3 million. Debt has increased
by £217.0 million reflecting the key
cash flows above.
than 10 per cent of the Group’s net assets
attributable to shareholders. At 31
December 2015 the exposure was 8 per
cent, higher than the 6 per cent at 31
December 2014 due to the Group’s
acquisition of Puerto Venecia, Zaragoza in
January and the exercise of the Málaga
option in May. This exposure reduces to
less than 4 per cent pro forma for the sale
of our interest in Equity One shares in
January 2016.
Adjusted net assets per shareAs illustrated in the chart below, diluted,
adjusted net assets per share have
increased from 379 pence per share at 31
December 2014 to 404 pence per share at
31 December 2015. The increase was
driven by the property valuation gain of
26 pence per share.
2015
£m
2014
£m
Group cash flow as reported
Cash flows from operating activities 160.2 56.5
Cash flows from investing activities (175.0) (719.1)
Cash flows from financing activities 76.2 724.1
Foreign currency movements (0.3) (0.1)
Net increase in Group cash and cash equivalents 61.1 61.4
Net external debt (including Group share of joint ventures)
Cash (including Group share of joint ventures) 301.4 260.1
Debt (including Group share of joint ventures) (4,440.5) (4,223.5)
Net external debt (including Group share of joint ventures) (4,139.1) (3,963.4)
0
150
300
450 379 1426 -2 1 -14 404
31
De
c 2
01
4
Pro
pe
rty
re
va
lua
tio
n
Un
de
rly
ing
ea
rnin
gs
Ex
cep
tio
na
l co
sts
Va
lua
tio
n o
f in
ve
stm
en
ts
Div
ide
nd
pa
id
31
De
c 2
01
5
Adjusted net asset value per share bridge (pence)
intugroup.co.uk 49Strategic reportFinancial review

Financial review continued
The weighted average debt maturity
has reduced to 7.8 years and includes
the benefit from the extension of the
SGS term loan.
The weighted average cost of gross debt
has reduced to 4.6 per cent (excluding
the revolving credit facility) reflecting
the lower rates achieved on recent
refinancing activity.
The Group uses interest rate swaps to
fix interest obligations, reducing cash flow
volatility caused by changes in interest
rates. The proportion of debt with interest
rate protection has reduced slightly in the
year to 86 per cent within the Group’s
policy range of between 75 per cent and
100 per cent. The reduction is due to the
higher level of borrowing against the
Group’s revolving credit facility.
Cash and available facilities have reduced
to £588.4 million at 31 December 2015.
This comprises cash of £301.4 million
in addition to undrawn facilities of
£287.0 million.
The chart above illustrates that there is
no major refinancing requirement due
until 2017.
The table below summarises the Group’s
main debt measures, all including the
Group’s share of joint ventures.
The debt to assets ratio has reduced to
43.1 per cent with the increase in property
valuations offsetting the increase in
net external debt resulting from the
acquisition of Puerto Venecia, Zaragoza
and capital expenditure in the year. The
debt to assets ratio is well below the
Group’s target maximum level of 50 per
cent. Pro forma for the sale of the Group’s
interest in Equity One shares in January
2016 the debt to assets ratio would
reduce to 41.0 per cent.
Interest cover of 1.91x has increased
reflecting the impact of recent
acquisitions and lower interest rates
following recent debt refinancing and
remains above the Group’s targeted
minimum level of 1.60x.
31 December
2015
31 December
2014
Debt to assets 43.1% 44.2%
Interest cover 1.91x 1.82x
Weighted average debt maturity 7.8 years 8.4 years
Weighted average cost of gross debt 4.6% 4.7%
Proportion of gross debt with interest rate protection 86% 88%
Cash and available facilities £588.4m £670.8m
The debt to assets ratio has reduced to 43.1 per cent
Financing
Debt structure As a result of the significant refinancing
activity in recent years, the Group has
diversified its sources of funding. We
now have a range of debt instruments
including CMBS and other secured bonds
plus syndicated bank debt secured on
individual or pools of assets, with limited
or non-recourse from the borrowing
entities to other Group companies
outside of these arrangements.
Corporate-level debt remains limited
to the revolving credit facility and
the £300 million convertible bond.
During 2015 the main financing
activities undertaken included:
— in January, €225.0 million of new
debt was secured against Puerto
Venecia, Zaragoza, refinancing
the acquired debt
— in June the Group renegotiated
its £351.8 million Secured Group
Structure term loan, extending
the maturity by two years to March
2020 and reducing the margin
by 150 basis points
— in September the Group agreed
a one year extension to the RCF
which is now in place until 2020
— in December a new five year
£130.0 million facility was secured
against intu Uxbridge; intu’s share
is £26.0 million
— in December the Group agreed
a new facility of £95.8 million for
intu Bromley, drawn down in January
2016, replacing the existing facility
which was due in April 2016
0
200
400
600
800
1,000 24.3* 364.1** 418.9* 164.3 793.2 153.5 32.4 958.3 114.9 724.8 499.5 166.3
Debt maturity (£m)
2016 2017 2018 2019 2020 2021 2022 2023 2024 2024-
2029
2030-
2034
2035+
* Reflects the re-financing of intu Bromley agreed in December 2015 but not actioned until January 2016.
** 2017 includes £191 million relating to intu Merry Hill which has an initial maturity of 20 September 2016 extendable
at intu’s option to 20 September 2017. It is anticipated that this option will be exercised at the earliest opportunity.
intu properties plc Annual report 201550

CovenantsFull details of the debt financial
covenants are included in the financial
covenants section of this report on
pages 162 and 163. The Group is in
compliance with all of its covenants.
Capital commitmentsThe Group has an aggregate cash
commitment to capital projects of
£65.2 million at 31 December 2015
including the Group’s share of
joint ventures.
In addition to the committed expenditure,
the Group has an identified uncommitted
pipeline of active management projects,
major extensions and developments that
may become committed over the next
three years (see operating review on
page 43).
Other information
Tax policy position Like all Real Estate Investment Trusts
(REITs), tax on property operating profits
is paid at shareholder level to the UK
government rather than by intu itself.
REIT status brings with it the requirement
to operate within the rules of the REIT
regime (for further information see
glossary on pages 173 and 174).
As a good corporate citizen we believe
that paying and collecting taxes is an
important part of our role as a business
and our wider contribution to society.
We are committed to acting with integrity
and transparency in all tax matters and
have an open, up-front, and no surprises
policy in dealing with HMRC, and as a
result look to minimise the risk that
anything that we do could be considered
to be tax avoidance. In particular, the
Group carries out regular risk reviews,
seeks pre-clearance from HMRC in
complex areas and actively engages in
discussions on potential or proposed
changes in the taxation system that
might affect the Group.
The Group pays tax directly on overseas
earnings, any UK non-property income
under the REIT rules, business rates, and
transaction taxes such as stamp duty
land tax. In the year ended 31 December
2015 the total of such payments to tax
authorities was £23 million, of which
£19 million was in the UK, £0.5 million
in the US and £3.5 million in Spain. In
addition, the Group also collects VAT,
employment taxes and withholding tax
on dividends for HMRC and the Spanish
tax authorities. Business rates, principally
paid by tenants, in respect of the Group’s
UK properties amounted to around
£297 million in 2015 (2014: £297 million).
DividendsThe Directors are recommending a final
dividend of 9.1 pence per share bringing
the amount paid and payable in respect
of 2015 to 13.7 pence, unchanged from
2014. A scrip dividend alternative may
be offered. Details of the apportionment
between the PID and non-PID elements
per share will be confirmed in due course.
As at 31 December 2015 the Company
has distributable reserves in excess of
£1.3 billion, sufficient to cover around
seven years of dividends at the 2015
level. The Company typically pays
dividends which are covered by the
current year earnings of the Group and
does not anticipate that the Group’s
level of distributable reserves will create
any restrictions on this approach in the
foreseeable future.
Matthew Roberts
Chief Financial Officer
26 February 2016
intu Trafford Centre
The lasting appeal of the Orient
Strategic reportFinancial review
intugroup.co.uk 51

Corporate responsibility
We are committed to supporting our local communities, delivering economic growth and operating with environmental responsibility
Sustainable shopping centres create a
nicer shopping environment, meaning
people are happy to stay for longer.
We base our CR on three key pillars
that support the long-term success
of intu: communities and economic
contribution, environmental efficiency
and relationships. This approach allows us
to focus on the concerns and issues that
are most important to our many and
varied stakeholders and our business.
We believe CR must be driven by the
strategic aims of our business and be
subject to the same quality of governance
controls. We want intu to be a long-term
and sustainable business. We can only do
this if we care for the communities where
our shopping centres are located and look
after the communities we all share.
As such, CR forms part of our Board
Committee structure, giving it the
prominence in decision-making needed to
embed it into our day-to-day operations.
This year we have made significant
headway in achieving our long-term
2020 commitments to reduce our
environmental impact and increase our
community contributions. Notably, we
have saved a further 10 per cent in carbon
emissions, which means we are on track
to meet our 50 per cent reduction in
carbon intensity.
We have surpassed our target to divert
99 per cent of waste from landfill by
2020, this year achieving a diversion
rate of 99.7 per cent.
Our community contributions totalled
£1.8 million and the amount of time
given by our employees almost doubled,
showing the company-wide support
for our communities.
Why corporate responsibility matters As a national and growing international
brand, how people perceive us today and
in the future is essential to our long-term
success. This success benefits our local
communities, the people who work
at our centres, our tenants and our
shareholders. A responsible approach
to our corporate behaviour is intrinsically
linked to our day-to-day activities and
longer-term focus. Senior level buy-in
and employee engagement are key to
our continued corporate responsibility
(CR) activities; we believe it’s the only
way to do business.
Genuine and visible CR has never been
more important than now as businesses
operate increasingly in the public eye.
People have always wanted to do
business with people they trust and
their desire and ability to make informed
choices is increasing with technology.
As well as our customers we are
subject to external scrutiny from
investors, environmental, social and
governance indices, public bodies and
community leaders.
There are some significant external
trends that we know will impact us in the
future. The most important of these is
the changing face of retail and responding
to the changing needs and wants of
our consumers and retailers. Ageing
populations and significant urbanisation
will also put pressure on public resources
and change the use of public realm space,
something we will need to respond to in
order to remain relevant to customers.
These inform our material impacts and
the issues we should focus on.
Our approach to CRAt intu, we create not just compelling
experiences for our customers, but ones
that are for all to access and enjoy.
For more detail please see
our corporate responsibility report
£1.8mcash equivalent of total donations
£3.1mtotal energy savings since 2011
Customers engaged in surveys
28,000(2014: 26,500)
Employee engagement score
769(2014: 747)
Net promoter score
74 (2014: 60)
intu properties plc Corporate Responsibility Report 2015
Better together
intu properties plc Annual report 201552

Better for the environment in 2015
Pillar Impact Commitment 2015 performance
Communities Community Support relevant community initiatives £1.8m charitable donations
Extend employability programmes to all
centres by 2025
New retail employability
programme at intu Braehead
Improve community partner evaluation Positive feedback from
community partners
Economic
contribution
Demonstrate total economic impact £4.2bn GVA
Environment Energy and carbon 50% intensity reduction in carbon emissions
by 2020 against 2010 baseline 10% intensity reduction
Waste management 99% of waste diverted from landfill by 2020 99.7% diverted
75% of waste generated recycled by 2020 71% recycled
Water management 10% intensity reduction of m3/million
customers by 2020 against 2010 baseline 13% intensity reduction
Relationships Relationships Further develop engagement process Full participation
Improve customer experience score 74 (2014: 60)
People Increase employee volunteering 101 volunteers (2014: 95)
Increase employee awareness of CR
70% staff aware of CR programmes
Our progress in 2015
Absolute energy use and carbon emissions (CO2) at directly managed centres
2011 000tonnes
20152012 2013 2014
120
100
80
60
40
20
60
50
40
30
20
10
Electricity (thousand MWh)
Gas (thousand MWh)
District heating (thousand MWh)
CO2 emissions (thousand tonnes)
000MWh
00
Water use at directly managed centres
2011
0
20152012 2013 2014
420,000
390,000
360,000
330,000
300,000
270,000
1,500
1,250
1,000
750
500
250
Absolute water consumption (m3)
Water intensity m3/million customers
240,000
+20%
-13%
m3 m3/m
Waste disposal at directly managed centres
2011
10
%20152012 2013 2014
30
25
20
15
10
5
100
85
70
55
40
25
Waste recycled (tonnes)
Waste to landfill (tonnes)
Waste to energy (tonnes)
Waste diverted from landfill (%)
0
tonnes
Strategic reportCorporate responsibility
intugroup.co.uk 53

Why it is important
Our shopping centres are integral to the
communities we serve. We build social
cohesion by providing the space for people
to come together to eat, drink, socialise
and be entertained.
Why it is important
We have a responsibility to minimise our
operational environmental impacts, but
we also see the benefits of increasing our
operational efficiency to create a better retail
environment. We focus our efforts on the
common areas of our shopping centres
where we have direct control.
We also share good practice and influence our
delivery partners, retailers and visitors to more
sustainable behaviour so we can all enjoy the
benefits of environmental efficiency.
What we are doing
— our LED programme continues to reap
energy and carbon savings. This year we
have reduced our carbon intensity by
13 per cent
— implemented energy audits and presented
recommendations to senior management
— revised our waste contracts to ensure
better management and reporting of
waste streams
— explored and trialled options for reducing
water intensity at our centres
What we plan to do
— embark on phase four of our LED
lighting installation
— conduct feasibility studies to expand our
on-site generation beyond Ground Source
Heat Pumps at intu Victoria Centre
— attain ISO 50001 accreditation
Why it is important
Strong and open relationships are
fundamental to us doing business and
our long-term success. We use a variety
of channels to engage our stakeholders,
ensuring a continuous dialogue throughout
the year and engaging on key issues.
Understanding their concerns and
expectations means we can respond
accordingly, support our communities and
our people and serve our customers better.
What we are doing
— now in its third year, we have
reviewed and refreshed our annual
360 stakeholder engagement
— raised employee awareness of CR
and the eco hero scheme through
targeted communications
— held a community and local and national
government parliamentary reception
to bring together key stakeholders
What we plan to do
— introduce a new stakeholder session on
communication and sharing information
— appoint a community manager at intu
Eldon Square and intu Metrocentre
— better communicate our CR strategy
to customers
We create significant economic contributions
to our communities, not just in employment,
but also by supporting community groups
to address fundamental societal issues
affecting our long-term success such
as anti-social behaviour, young people
and education.
What we are doing
— we have increased our volunteering
to over 10 per cent of total employees
through expanding the opportunities
and better promoting them to staff
— our ‘apprenticeships for retail’ programme
expanded to intu Braehead with
26 young people already benefiting
What we plan to do
— increase volunteering to 15 per cent
of total intu staff
— set up a retail training programme
at intu Watford
— make partnership working easier by
sharing best practice between
charity partners
Sustainable travel
Every centre has a sustainable travel plan to
encourage people to use their car less and
make healthier travel choices
Challenging youth stereotypes
Supported by intu Lakeside, schoolchildren
take part in the Future Theatre Sugar & Spice
production in 2015
Graduates of retail employability programme at intu Braehead
Working in partnership with local skills
providers and retailers helps us to deliver the
next generation of high-quality retail workers
intu properties plc Annual report 201554
Our pillars in action
Communities Environment Relationships

A winning partnership
intu Trafford Centre partnered with local
autism charity, the Together Trust, to
become the first autism-friendly shopping
centre in the UK.
Busy, vibrant spaces can be challenging
environments for people who are on the
autism spectrum. We want all our
customers to enjoy visiting intu so 400 staff
were trained to understand the issues and
how to support people with autism.
We had extremely positive feedback and
plan to extend this programme to other
centres so all customers can enjoy a
consistent experience.
Business class at intu Derby
We are working with Business in the Community in Derby to create partnerships
between businesses and schools, aiming to make an impact in four core areas: leadership,
curriculum, enterprise and employment. intu is partnered with the City of Derby Academy
where we have provided employability support for 160 young people aged 11-16, such as
sending students through the same assessment centre that intu uses to recruit staff. The
programme gives them the opportunity to develop skills and improve their employability
and all those participating report a direct positive impact on their quality of life.
Making our staff eco heroes
This summer we launched our ‘eco hero’
campaign. Providing simple and informative
messages to help our staff be more
eco-friendly, not just at work, but at home
as well where they can see the benefit in
their energy bills.
The eco hero pack contains all the
information needed to become an intu
eco hero – energy use facts, energy-saving
tips for at home and at work, checklists
for energy use audits and thermometers
to help regulate heating.
Our contributions
We provide significant
local employment
93,000employed in our centres
intu centres directly
support a
£1.6bnwage bill per annum
£4.2 billionGVA
2,000people directly reached
by community projects
We work with our communities and help to protect the environment
We are investing in the future
£1.7bnUK development pipeline
over 10 years
Strategic reportCorporate responsibility
intugroup.co.uk 55
We contribute to the local
and national economy
£297mbusiness rates paid by intu
and our tenants
....all of which results in a total
economic contribution in 2014 of

Our people
Our people are at the heart of intu’s success and are passionate about what they do, helping to deliver compelling shopping experiences to our customers
change’ programme. We built on
the success of our world class service
programme with development sessions
for all staff focusing on delivering a
compelling experience and we introduced
a national apprenticeship scheme to ‘grow
our own talent’. An outstanding success
has been the achievement by intu Retail
Services of silver Investor in People
accreditation at 14 intu-branded shopping
centres and its central team, and retaining
the gold standard at intu Trafford Centre.
We increasingly recognise the
importance of our people to our
business. From apprentices to senior
managers, we look for the best people in
the business to keep us at the forefront
of the shopping centre industry and
provide the trademark intu experience
and embodiment of our values that sets
us apart from our competitors.
As our business grows our strategy is
to ensure our people grow with it. We
focus on finding and retaining the best
people, engaging them in our purpose,
developing their talent and rewarding
their effort. We measure our success
by reducing turnover and increasing
the number of posts we fill from
internal promotions.
Our employeesWe have 2,544 staff employed in 16
locations across the UK, in 15 centres and
at 40 Broadway, and in Spain. Of these,
2,131 are frontline shopping centre staff,
directly employed by intu Retail Services.
Turnover was 21 per cent for frontline
staff and 14 per cent at 40 Broadway.
Recruitment We ensure we have the right talent to be
able to promote from within the business
supported by processes that mean we
employ the best potential talent from
outside. This year we recruited 529 staff
externally and promoted 50 from within.
Talent developmentOur aim this year has been to give more
staff insight and understanding of the
strategic direction of the business and to
increase the opportunities for people to
take on new skills. We introduced the
Firefly leadership programme ‘Building
better futures’ to 11 senior managers
and 15 other managers embarked on
a ‘Leading self, leading others, leading
The apprentice
Adam Gillespie was among the initial
intake of intu’s first national apprenticeship
programme, joining the customer
services team at intu Lakeside in October
but circulating around a number of
departments for his first year to help
his longer-term career choice.
Adam says: “I thought apprenticeships
were a good way to get into the work
environment; you get paid and get a
qualification at the end. It is harder than
college but I prefer it. You can really make
a difference to people. I helped plan our
Halloween event and had a sense of
fulfilment watching the customers smile
as they looked at the display of pumpkins
knowing that I had played a part in it.”
Highlights of the year
— intu Retail Services achieved silver
Investor in People accreditation at
14 intu branded shopping centres
and for its central team, and retained
gold standard at intu Trafford Centre
— Every member of staff has taken part
in brand engagement development
— Our new national apprenticeship
scheme took on its first apprentices at
intu Lakeside and intu Milton Keynes
— 11 senior managers from across
the business took part in the Firefly
leadership development programme,
with a further 15 working through
other programmes which will feed in
Our values
We look at the familiar and we see something
different; we are insightful and imaginative, but
not for their own sake, for we never lose sight of
what is important and relevant
We act confidently and decisively, always
knowingly, perhaps at times controversially,
but never rashly or without consideration
We are true to ourselves, act fairly and
communicate clearly; we say what we mean
and we mean what we say. We recognise our
obligations to our stakeholders and the wider
society, and commit to put our utmost into
everything we do
intu properties plc Annual report 201556

Employee engagementMaking sure our staff understand
our business and know how they can
contribute to intu’s success is crucial
to our progress.
We use a range of channels to
communicate with our staff, wherever
they work in the business, from the
intranet and staff meetings to ‘toolbox
talks’. This year we have improved internal
communications networks further by
ensuring each location has its own staff
consultative forum.
Our annual staff survey continues
to reflect widespread employee
engagement, with 84 per cent (2014:
83 per cent) of staff proud to work for
intu, and 94 per cent (2014: 91 per cent)
agreeing intu puts customers at the heart
of everything we do. This year 89 per cent
of all staff took part in the survey, up
five per cent from 2014, and the overall
engagement index improved for the
fifth year in succession, from 747 to 769.
Understanding of intu’s values and
vision both now stand at 90 per cent
and there were major improvements
in staff recognition that performance
is accurately evaluated and rewarded
appropriately and that individuals could
contribute directly to our success.
We continue to encourage staff to achieve
their personal and professional goals
and to take part in our corporate
responsibility, community support
and sustainability programmes.
Our plans for 2016As the intu business spectrum expands
we will be providing more opportunities
for functional specialists to develop
a broader understanding of our
strategic direction.
We will continue to develop our
leadership programmes and extend
the capabilities of our talented
management, both in 40 Broadway
and in operational management in
our centres.
We will work to achieve the National
Equality Standard, a groundbreaking
initiative for businesses to set clear
equality, diversity and inclusion criteria
that can be independently assessed.
Our graduate programme is to be more
structured to enable graduates to gain a
broader experience across the business
and enhance their chances of becoming
future leaders in intu.
We are also going to link our induction
and training programmes, so that
employees benefit from a complete
development package that is more
consistent with intu’s values.
84%of staff are proud to work for intu
(2014: 83%)
89%of all staff took part in the survey
(2014: 84%)
Female
1,032(2014: 973)
Female
9(2014: 9)
Male
1,512(2014: 1,486)
Male
20(2014: 22)
Human rights
At intu we respect the dignity, liberty and
equality of everyone we work with. Our
policies and procedures are consistent with
the United Nations’ universal declaration
of human rights, which sets “a common
standard of achievement for all peoples
and all nations”. We are committed to
implementing the UN guiding principles
on business and human rights. We only
work with people who choose to work
freely and we respect their rights to equal
opportunities and freedom of association.
We work with our suppliers, retailers and
associated companies to ensure they meet
acceptable standards of human dignity
in their own sourcing policies. We will
continue to evaluate the pay and conditions
of all our employees, in particular new staff
on or near to minimum wage, to bring them
into line with the rest of our staff in terms of
wages and benefits and ensure fair working
conditions. Fair treatment of people who
work for intu or our suppliers is a key focus
of our corporate responsibility approach.
As appropriate our Board CR Committee
and CR Management Committee consider
the potential human rights risks faced by
intu and assess approaches to mitigate
those risks. We will implement the Modern
Slavery Act in 2016 to ensure our suppliers
meet our standards on human rights.
Gender profile
Gender profile senior managers
Reward and recognition
This year we introduced Win
Your Dream, a peer-to-peer
nomination programme that
acknowledges staff who have shown
exceptional performance in displaying
our values and delivering our brand
proposition. The programme includes a
tiered award structure with monthly prizes
at each centre and 40 Broadway, four
national quarterly winners and the ultimate
accolade, the annual winner who receives
£10,000 to spend on their dream.
intugroup.co.uk 57Strategic reportOur people

Governance
We have maintained our commitment to the highest standards of governance, with a focus during the year on refreshing composition of the Board and its Committees in line with our succession plans
Key strategic matters discussed in 2015
Areas of focus in 2016
— continuation of progressive refreshing of the Board, in line with agreed succession planning
— progression of Nomination and Review Committee processes for the new
Chairman appointment
— monitoring and progression of corporate objectives for 2016
— rigorous maintenance of a strong controls environment around UK and Spanish
development pipeline
— continuing oversight of strategic and operational delivery
Dear shareholder
I am pleased to introduce intu’s corporate governance report for 2015.
A revised version of the UK Corporate Governance Code (‘the Code’) was issued in
September 2014 and is applicable to the Company for the first time for the year
ended 31 December 2015.
The Board has reviewed its revised obligations under the 2014 version of the Code
and determined that it remains fully compliant with all Code provisions. This reflects
the Board’s robust approach to good governance, with a continuing emphasis on
matching or exceeding the best practice expectations of a major quoted company.
Other key matters discussed
— appointment and induction of two new Non-Executive Directors in accordance
with the Board’s succession planning
— formal commencement of succession planning for the Chairman’s scheduled
2017 retirement
— Committee governance, as a result of new appointments and the extension of the
Senior Independent Director’s term
— continuing focus on risk modelling and analysis, including cybersecurity risk
— the new viability statement
Optimise asset performance
— review and approval of the Group’s
strategic plan
— review and approval of
centre-focused refinancings
— Board visit to intu Merry Hill
Make the brand count
— supporting development of the
Group’s digital strategy and operations
— focus on Group net promoter
score performance
UK development momentum
— management and oversight of the
Group’s capital investment programme
— Board visit to intu Bromley
— regular Capital Projects
Committee meetings
Seize the growth opportunity in Spain
— the Group’s Spanish strategy
— the strengthening of the Group’s
partnership with CPPIB, announced
in June, to include our Puerto Venecia
shopping resort in Spain
— extended Board visit to review our
Spanish operations during the year
intu properties plc Annual report 201558

2015 governance highlightsComposition and succession planning
During the year I led our annual
review of the Board’s composition and
succession plans. The review took into
account the fact that experienced and
valued Board members were approaching
the maximum tenure permitted for
independent non-executive directors
under the Code.
As a direct consequence, the Board
decided to strengthen its composition
and in September welcomed two
new Non-Executive Directors,
Rakhi (Parekh) Goss-Custard and John
Strachan, with expertise in digital and
global real estate matters respectively.
The processes which led to Rakhi and
John’s selection and appointment were
co-ordinated by the Nomination and
Review Committee, in line with relevant
Board policies, and with appropriate input
from an independent executive search
adviser Korn Ferry. Further information
can be found in the Nomination and
Review Committee report on page 76.
In the light of Neil Sachdev not seeking
re-election at the 2016 annual general
meeting, we have made changes in the
composition of our Committees. During
the year the Board also extended the
term of the Senior Independent Director,
Andrew Huntley, for one year.
The Board has previously outlined its
support for the recommendations of
The Davies Review, and I am therefore
particularly pleased to confirm that,
as a result of the recent appointments
to the Board, intu met the target for
25 per cent female representation
before the end of 2015. We outline
our approach to diversity further in
the main report on pages 67 and 76.
The Group has presented a viability statement for the first time this year in line with the provisions of the Code. While the requirement to include this statement is new, the key inputs to this assessment are those which the Group produces as a matter of course
The Group has presented a viability
statement for the first time this year in
line with the provisions of the Code. While
the requirement to include the statement
is new, the key inputs to this assessment
are those which the Group produces
as a matter of course and would consider
to be best practice. These include the
Group’s strategic plan, analysis of
sensitivity to risks, operating metrics
such as the weighted average life of
debt and features of the industry in
which we operate.
The Audit Committee assessed the
Group’s viability position alongside its
review of going concern and reported
its recommendations to the Board.
The viability statement is presented
on page 71.
Patrick Burgess
Chairman
26 February 2016
Board communication
Having identified enthusiasm for
additional informal update meetings
by conference call, as an important area
for improvement last year, we improved
and streamlined the quality and focus
of Board materials both formally and
informally, further integrated electronic
papers and have encouraged more
informal interaction between Board
members. We took advantage of this
during centre visits, at the away day in
October, on Board update calls and at the
Chairman’s twice-yearly working dinners.
The Board visited intu Bromley in April
and the annual strategy away day was
held at intu Merry Hill, our super-regional
centre in the West Midlands.
In June the Board travelled as a group to
intu Asturias and Puerto Venecia in Spain
to carry out an assessment of the newly
acquired centres, receive presentations
from local advisers regarding local market
dynamics and prospects and gain closer
familiarity with the Spanish market.
Risk
The effective assessment and
management of risk is key to the delivery
of the Group’s strategy. The setting
of the Group’s risk appetite by the
Board provides the framework within
which the Group’s risk management
process operates.
Risk management is embedded
throughout the business with all
employees aware of the role they play in
this. The Board has overall responsibility
for risk management and the Audit
Committee monitors and reviews the
effectiveness of the risk management
process. The Group’s risk management
process is set out in more detail on pages
70 and 71, and the Group’s principal risks
are discussed on pages 37 to 39.
Given the high profile of cybersecurity
risks, Trevor Pereira, Group Digital
and Commercial Director, attends all
Board meetings to advise on digital
and cyber matters.
Governanceintugroup.co.uk 59

Board of Directors
Chairman, Deputy Chairman and Executive Directors Non-Executive Directors
Patrick Burgess OBE, DLChairmanAge 71
Appointed to the Board: Appointed as a
Non-Executive Director of the Group in 2001
and Chairman on 1 August 2008
Career: Patrick Burgess qualified as a solicitor in
1972 and became a partner in Gouldens in 1974,
serving as head of the Corporate Department for
14 years and as senior partner for six, culminating
with the merger of Gouldens with Jones Day in 2003,
from which he retired in 2007. He stepped down as
a Non-Executive Director of ICBC Standard Bank
in October 2015. He has also been active in a number
of charitable and community organisations.
Skills and experience: At Jones Day, Patrick
specialised in mergers and acquisitions and corporate
restructuring. He has considerable experience in
compliance, regulatory and stock exchange matters.
Other appointments: None.
Chairman of the Capital Projects Committee, Chairman of the Nomination and Review Committee, Chairman of the Corporate Responsibility Committee
David FischelChief ExecutiveAge 57
Appointed to the Board: Appointed Finance
Director in 1988, Managing Director in 1992
and Chief Executive in March 2001
Career: David Fischel qualified as a chartered
accountant in 1983 at Touche Ross & Co before
joining the Group in 1985.
Skills and experience: At Touche Ross, David
worked in the corporate finance department with
experience in acquisitions, flotations and capital
raisings. During his 30-year career with intu,
David has gained significant executive experience
in numerous aspects of the shopping centre
industry including shopping centre acquisitions and
developments. He has also been closely involved
with the Group’s corporate development including
equity and debt financings and a wide range of other
corporate transactions, including the 2010 demerger
of Capital & Counties from intu.
Other appointments: Non-Executive Director
of Prozone Intu Properties Limited, resigned
as a Non-Executive Director of Equity One, Inc
(NYSE: EQY) with effect 19 January 2016.
Chairman of the Executive Committee
John WhittakerDeputy ChairmanAge 73
Appointed to the Board: Appointed as Deputy
Chairman and a Non-Executive Director
on 28 January 2011
Career: John Whittaker is the Chairman of the
Peel Group which he founded in 1971 and developed
into a leading UK infrastructure, transport and
real estate enterprise.
Skills and experience: John is a highly regarded real
estate investor, and has overseen the growth of the
Peel Group across many sectors such as land, real
estate, ports, airports, renewable energy and media.
John is an experienced property developer and
business leader illustrated by projects such
as The Trafford Centre and MediacityUK. His
appointment to the Board followed the acquisition
by intu of The Trafford Centre from the Peel Group.
Other appointments: Chairman of the Peel Group.
Matthew RobertsChief Financial OfficerAge 52
Appointed to the Board: Appointed as Finance
Director on 3 June 2010
Career: Matthew Roberts was previously the Finance
Director of Debenhams plc from 1996 to 2003, and
Chief Financial Officer of Gala, subsequently Gala
Coral Group Ltd, from 2004 to 2008.
Skills and experience: Matthew Roberts (FCA)
joined intu as Finance Director in May 2010 and was
part of the team which acquired The Trafford Centre,
Manchester, in the UK’s largest ever single property
transaction. In spring 2013 he led the establishment
of intu’s secured Group structure with initial issue of
£1.15 billion of bond and bank debt. Since then he
has led a series of further transactions which have
raised over £2 billion of leverage. In January 2016
Matthew also assumed responsibility for intu’s
centre-based operations, while retaining his
existing responsibilities.
Adèle AndersonAge 50
Appointed to the Board: Appointed as a
Non-Executive Director on 22 February 2013
Career: Adèle Anderson commenced her career
at KPMG where she became a partner and held a
number of senior roles, including Chief Financial
Officer. She is currently Chairman of the Audit
Committee of easyJet plc and a trustee of Save
the Children UK.
Skills and experience: Adèle graduated from
Kent University with BSc Hons in mathematics
and computer science. She is a qualified ACA
and has gained extensive financial experience
throughout her career and has significant Audit
Committee experience.
Other appointments: Non-Executive Director
of easyJet plc; a member of the board of trustees
of Save the Children UK.
Chairman of the Audit Committee
Louise PattenAge 62
Appointed to the Board: Appointed as a
Non-Executive Director on 22 September 2011
Career: Louise Patten began her career at Citibank,
working mainly in retail financial services until she
joined global strategy advisers Bain & Company Inc in
1993 where since 1997 she has been a senior adviser.
Skills and experience: Louise has extensive Board
level experience at a number of retail and property
companies including as Chairman of Brixton plc
and interim Chairman of Somerfield plc, and
Non-Executive roles at Marks and Spencer plc,
where she chaired the Remuneration Committee,
GUS plc, Hilton Group plc, Harveys Furnishings plc
and Control Risks Group.
Other appointments: Non-Executive Director
at Abcam plc.
Chairman of the Remuneration Committee
intu properties plc Annual report 201560

GovernanceBoard of Directors
Richard GordonAge 57
Appointed to the Board: Appointed as a
Non-Executive Director in May 2010
Career: Richard Gordon previously served as a
Non-Executive Director of Capital Shopping Centres
plc between 1996 and 2006 and was appointed as
an alternate Director in respect of Graeme Gordon’s
Directorship of the Group in 2001.
Skills and experience: Richard has also served on
the boards of a number of companies within the
Liberty Life Group and various companies within the
commercial and residential real estate sector, mainly
in South Africa.
Neil SachdevAge 57
Appointed to the Board: Appointed as a
Non-Executive Director in November 2006.
Neil will step down from the Board at the
2016 annual general meeting in May.
Career: Neil Sachdev joined Tesco plc in 1978, rising
to the position of Property Director before joining J
Sainsbury plc as Commercial Director in March 2007.
He was subsequently appointed Property Director
in June 2010 and he held this position until leaving
J Sainsbury plc in March 2014. He was Chairman of
the Institute of Grocery Distribution until April 2014.
Skills and experience: Neil has an MBA from Stirling
University and has gained significant experience in
retail and property matters throughout his career.
Other appointments: Deputy Chairman of HSS
Hire Group plc. Chairman of Martins Property
Limited and Market Tech Holdings Limited. Director
of Barleygold Limited, Clevertec Limited, and Sixth
Sense Partnership Limited. Non-Executive Director
of NHS Property Services Limited. Council Member
of the University of Warwick.
Andrew HuntleyAge 77
Appointed to the Board: Appointed as a
Non-Executive Director on 8 July 2009 and
Senior Independent Director with effect from
1 August 2013
Career: Andrew Huntley’s career commenced
some 41 years ago with Richard Ellis where he
served as Chairman from 1993 until 2002. He was
a Non-Executive Director of Pillar Property plc
from 2000 to 2005 and a Non-Executive Director
of LondonMetric Property plc from 2010 until 2013.
Skills and experience: Andrew is a chartered
surveyor and an experienced property adviser.
Other appointments: Non-Executive Director
of Capital & Counties Properties plc.
Andrew StrangAge 63
Appointed to the Board: Appointed as a
Non-Executive Director on 8 July 2009.
Career: Andrew Strang started his career with
Richard Ellis 40 years ago. He served as Managing
Director of Threadneedle Property Investments
Limited for 17 years until January 2008. He was
Chairman of Hermes Real Estate Investment
Management from 2009 to 2011. He was a Director
of the British Property Federation from 1994 to
2013. He is a current member of the Norges Bank
Investment Management real estate advisory
board, a member of the investment and governance
committees at AEW UK and he was appointed as
Director of The Pollen Estate Trustee Company
Limited between August 2014 and January 2016.
Skills and experience: Andrew is a chartered
surveyor and has substantially focused on
property investment throughout his career.
Other appointments: Non-Executive Director
of Capital & Counties Properties plc.
Rakhi (Parekh) Goss-CustardAge 41
Appointed to the Board: Appointed as a
Non-Executive Director on 7 October 2015.
Career: Rakhi’s early career included roles at
TomTom, content management provider Article27
and 11 years at Amazon until 2014, where she
held a number of key roles including responsibility
for the Amazon UK Media category.
Skills and experience: Rakhi has an up-to-date
perspective on retail and consumer trends, as
well as deep insight and knowledge of the digital
environment. Rakhi has a BA in marketing and
communications from the University of
Pennsylvania.
Other appointments: Non-Executive Director
of Rightmove plc. Non-Executive Director at Be
Heard Group plc. With effect 1 February 2016,
a Non-Executive Director of Kingfisher plc.
John StrachanAge 65
Appointed to the Board: Appointed as a
Non-Executive Director on 7 October 2015
Career: John was Global Head of Retail Services
at Cushman and Wakefield until December 2015.
John’s career commenced at Healey and Baker in
1972 where he rose to become head of UK and
European retail from 1996 to 2000. Healey and Baker
was acquired by Cushman and Wakefield in 2000.
Skills and experience: John brings a wealth of
experience from the retail property sector, an
international perspective including extensive
knowledge of the Spanish retail property market.
He is known for his creative and entrepreneurial
approach to developing new business opportunities.
He is a fellow of the Royal Institution of
Chartered Surveyors.
Other appointments: Advisory Board member
of Truecap Private Equity; a member of the European
Executive Committee and Advisory Board of the
International Council of Shopping Centres.
Key to Committees
Audit Committee
Remuneration Committee
Nomination and Review Committee
Executive Committee
Corporate Responsibility Committee
Capital Projects Committee
intugroup.co.uk 61

Executive Committee
Executive management team
Biographies of the executive management
team are available on our website at:
intugroup.co.uk/who-we-are/our-people/
executive-management/
Kate Bowyer Director of FinanceJoined the Group in 2000 as Group Financial Controller and
managed the Group’s investor relations from 2008 until 2014.
She was appointed Director of Finance in August 2014. Kate
qualified as a chartered accountant with Coopers & Lybrand
(now PricewaterhouseCoopers) in 1995, working in their
Canadian and corporate finance practices.
Hugh Ford General Counsel & Group TreasurerJoined the Group as General Counsel in 2003. Appointed General
Counsel & Group Treasurer in April 2015. Previously he was General
Manager Legal at Virgin Atlantic Airways, and before that a
commercial lawyer with British Airways plc. He qualified as a
solicitor in 1992 with Freshfields.
Trevor Pereira Digital and Commercial DirectorJoined the Group in 2007 as Commercial Director, Capital Shopping
Centres plc. He was subsequently appointed Group Digital
and Commercial Director, responsible for digital activities,
commercialisation, marketing and customer experience. Previously
worked for airport Group BAA plc for 21 years, latterly as Retail and
Commercial Director for Heathrow Airport.
Martin Breeden Development DirectorJoined the Group in 2002 and was appointed Group Development
Director and a member of the Executive Committee in January 2016.
Martin has direct responsibility for intu’s development programme
across the UK and intu’s Spanish business. Martin has worked on
almost all of intu’s assets and has over 25 years’ experience in the
retail property industry. He is a fellow of the RICS and a member
of the advisory panel of the British Council of Shopping Centres.
Susan Marsden Group Company SecretaryJoined the Group as Company Secretary in 2000. A fellow of
the Institute of Chartered Secretaries and Administrators, Susan
began her career at the London Stock Exchange, and has been
company secretary of two FTSE real estate sector companies
before joining intu.
Dushyant Sangar Corporate Development DirectorJoined the Group in 2010 and appointed Corporate Development
Director and a member of the Executive Committee in 2014. He
has been closely involved in all of the Group’s major acquisitions
and new joint ventures in the UK and Spain. He previously worked
for MGPA, a real estate private equity investment advisory business
and for UBS. He is a Non-Executive Director of Prozone Intu
Properties Limited.
Julian Wilkinson Asset Management DirectorAppointed Group Asset Management Director and a member of the
Executive Committee in January 2016, Julian has responsibility for
optimising the performance of intu’s shopping centres. He has held
similar positions at director level over the last 25 years on behalf of
both retailers and landlords.
intu properties plc Annual report 201562

The Board
The role of the Board and its Committees
The Board
Led by the Chairman, the Board takes primary responsibility for
defining the Group’s strategic objectives, risk appetite and controls
environment; for monitoring delivery of strategy by the Executive
Directors; and for shaping the resourcing, culture and values
by which the wider business delivers targeted performance.
Audit Committee
Chairman
Adèle Anderson
Members
Neil Sachdev, Andrew Strang,
Rakhi (Parekh) Goss-Custard
Key responsibilities
Monitors the integrity of financial
statements, internal controls and
risk management process and
reviews the effectiveness of the
internal and external auditors.
See page 72 for more
information
See left for more
information
See page 52 for more
information
See page 78 for more
information
See page 76 for more
information
Executive Committee
Chairman
David Fischel
Members
Matthew Roberts, Kate Bowyer,
Martin Breeden, Hugh Ford,
Susan Marsden, Trevor Pereira,
Dushyant Sangar, Julian Wilkinson
Key responsibilities
Considers investment proposals,
reviews progress on projects and
project expenditure in detail and
receives updates on other business
matters. Has delegated authority,
within limits, to authorise initiatives
and expenditure.
The Executive Committee is not
a formal Committee of the Board.
Corporate Responsibility
Committee
Chairman
Patrick Burgess
Members
David Fischel, Neil Sachdev,
Alexander Nicoll (CR Director),
Jennifer Sandars/Helen Drury
(CR Manager)
Key responsibilities
Oversees the management of
the Group’s CR activities.
Capital Projects Committee
Chairman
Patrick Burgess
Members
John Whittaker, David Fischel,
Matthew Roberts, Andrew Huntley,
Neil Sachdev
Key responsibilities
Reviews new projects and project
expenditure in detail and, as
appropriate, comments on certain
projects for the Board. Has no power
to approve proposals or authorise
expenditure.
The Capital Projects Committee
is not a formal Committee of
the Board.
Remuneration Committee
Chairman
Louise Patten
Members
Adèle Anderson, Neil Sachdev,
Andrew Huntley
Key responsibilities
Sets remuneration policy for
all Executive Directors and the
Chairman and recommends
and monitors the level and
structure of remuneration
for senior management.
Nomination and Review
Committee
Chairman
Patrick Burgess
Members
Andrew Huntley, Neil Sachdev,
Louise Patten
Key responsibilities
Ensures that the Board is
comprised of individuals with
an appropriate balance of skills,
knowledge and experience.
Governanceintugroup.co.uk 63

The Board continued
Board culture
The intu Board and its workings are
characterised by the strong relationships
between individual Directors and the senior
executives. Those relationships have been
formed over several years of collaborative
working, with very few changes to the Board’s
composition or key positions necessary prior to
the new appointments announced in October.
The Chairman is directly accountable for the
culture of the Board, which is defined by a
conservative, measured approach to business,
allied to a willingness to take considered risks
through investment to achieve strategic goals,
as demonstrated by intu’s strategic growth in
Spain since 2013.
The Board’s culture permeates through the
Group’s operations, with a comprehensive
suite of policies to reinforce the open dialogue
between management and staff and tone set
by Board members.
Board processes have been refined over many
years of consistent application, and are
consequently now well understood with very
high levels of adherence. The Board’s culture
and thinking nevertheless remain reflective of
the Group’s values, which encourage all staff
to be creative, bold and genuine at all times.
The Board
The business model described on pages 28
and 29 illustrates the key value creation and
operational drivers for intu’s strategy and
the means by which the Board ultimately
delivers long-term growth and sustainable
returns for its shareholders and
debt investors.
Appropriate and effective corporate
governance is taken seriously at intu
and is intrinsic to all aspects of the
Board’s activities.
The Board has therefore established a
governance framework which underpins
the culture and workings of the Group.
This framework consists of:
— committees with specific delegated
responsibilities (as shown in the diagram
on page 63)
— delegated authority limits, which
apply at all levels of the business and
are incorporated into the standard
procedures for the execution of all
leases, licences, contracts and other
relevant documentation by the Group
— internal policies, procedures and
controls (including delegated authority
limits and a related parties protocol)
which are regularly reported on,
reviewed and updated by the
Board and relevant committees
— internal processes which are
communicated to all staff and are
available at all times on the Group’s
intranet site
Our approach to CR
The Group’s approach to corporate
responsibility is a key element of its
governance framework. We have
consistently demonstrated a strong
commitment to high standards of
corporate responsibility, particularly
focused on the local communities where
our shopping centres are embedded.
Further details of our related activities can
be found in the CR report on pages 52 to 55
Structure of the Board and independence
Board structure
Chairman 1
Executives 2
Non-Executives 9
Board independence (excluding Chairman)
Executives 2
Non-Executives 7
Non Independents 2
Gender split
Men 9
Women 3
Length of tenure of Directors
0 – 3 years 2
3 – 6 years 5
6 – 9 years 2
9+ years 3
The Board’s culture permeates through the Group’s operations, to reinforce the open dialogue between management and staff
Patrick Burgess
Chairman
intu properties plc Annual report 201564

Non-Independent Directors
intu has two representatives of different
significant shareholders appointed
to non-executive board positions, including
the Deputy Chairman John Whittaker. Those
representatives are also permitted to appoint
alternate directors in accordance with the
Company’s Articles of Association.
Direct shareholder Board representation
ensures that key strategic, operational and
governance decision making is shaped with
input from those individuals, and is more
closely aligned with the interests of both the
direct shareholder groups they represent
and other institutional and retail investors
generally. In this respect the Group surpasses
the expectations of the stewardship code.
However, the representative directors also
contribute strongly to the Board’s culture and
personality, adding insight and influence from
their varied commercial backgrounds, their
experience and expertise. We discuss the
rigorous Board policies and enhanced
processes the Board operates to manage
potential conflicts of interest arising from
these relationships in a specific case study
on page 66 of this report.
Roles of the Chairman and Chief Executive
The roles of the Chairman Patrick Burgess,
and of the Chief Executive David Fischel, are
separate and have been defined in writing
by the Board. In summary, the Chairman’s
responsibilities include leading the Board,
setting its agenda, achieving clarity of decision
making and ensuring its effectiveness on
all aspects of its remit. He also ensures
that the Board maintains effective two-way
communication with shareholders and senior
management and holds the management
to account.
The Chief Executive’s key responsibilities
include delivery of the Group strategy, primary
accountability for day-to-day operational
management, implementation of the policies
and strategies developed by the Board,
and developing the abilities and skills of the
Group’s personnel to their maximum potential.
Non-Executive Directors
The Non-Executive Directors bring an external
and independent view to the Board’s
discussions, providing constructive challenge
to executive management when appropriate.
Biographical details of each Director are set
out on pages 60 and 61.
The Senior Independent Director
Andrew Huntley was appointed as Senior
Independent Director in August 2013. In his
role, Andrew provides advice and additional
support and experience to the Chairman as
required, and is available to act as an
intermediary for the other directors if
necessary. Andrew also leads the appraisal
of the Chairman’s performance annually in
discussion with the other Non-Executive
Directors, and is available as an additional
point of contact for shareholders should they
feel that communication through the normal
channels of the Chairman, Chief Executive,
Secretariat or Investor Relations teams has
failed or is otherwise inappropriate.
During the year the Nomination and Review
Committee decided to extend Andrew’s
term of appointment as Senior Independent
Director for a further 12 months, through to
the 2017 annual general meeting. Andrew, in
his capacity as Senior Independent Director,
is expected to play a leading role in planning
and managing the Chairman’s succession.
Alternate Directors
John Whittaker and Richard Gordon,
both significant shareholders, have
appointed Steven Underwood and Raymond
Fine respectively as their alternates under
the terms of the Company’s Articles
of Association. The Board has generally
invited the Alternate Directors to attend
Board meetings.
The presence of John and Richard in person
on the Board ensures that key strategic and
operational decision making is best aligned
with the interests of all the Group’s
significant shareholders.
Roles and responsibilitiesOverview
Role Responsibility
Chairman Patrick Burgess Leading the Board, setting its agenda, achieving clarity of decision-making,
ensuring its effectiveness in all aspects of its remit and heading up the culture
of accountability
Chief Executive David Fischel Delivery of the Group strategy, primary accountability for day-to-day operational
management, implementation of the policies and strategies developed by the
Board, and developing the abilities and skills of the Group’s personnel to their
maximum potential
Chief Financial
Officer
Matthew Roberts Responsibility for the Group’s funding strategy, financing, reporting and investor
programme, encompassing leadership of the finance function. From January 2016
also responsible for intu’s centre-based operations
Non-Executive
Directors
Louise Patten, Adèle Anderson,
Neil Sachdev, Andrew Strang,
John Whittaker, Andrew Huntley
Rakhi (Parekh) Goss-Custard,
John Strachan, Richard Gordon
Bring an external and independent view to the Board’s discussions, providing
constructive challenge to executive management when appropriate
Senior Independent
Director
Andrew Huntley Provides advice and additional support and experience to the Chairman as required,
and is available to act as an intermediary for the other Directors if necessary
Alternate Directors Steven Underwood,
Raymond Fine
Ensure that key strategic and operational decision-making is best aligned with the
interests of the Group’s major shareholders
Governanceintugroup.co.uk 65

The Board continued
Matters reserved for the BoardResponsibility for day-to-day operational
management of the Group is delegated
by the Board to the Executive Directors,
the Executive Committee, and senior
management. Aspects of these delegated
powers are supported by delegated
authority limits which are documented
and kept under review by the Board.
Certain matters have been reserved solely
for decision by the whole Board and a
schedule setting out a list of these is
reviewed regularly.
These include, but are not limited to:
— all matters relating to strategy
— the application of the Board protocol
for dealing with related party matters
— dividend payments and policy
— major acquisitions and disposals,
other capital expenditure and controls
— risk management
— regulatory matters, including material
shareholder communications
The Board also receives regular reports
on the proceedings of its Committees and
considers their recommendations. It has
been the Board’s custom over many years
to ensure that major decisions are taken
after a reiterative process which involves
examination and review at several levels.
In part, this examination and review
process is dealt with by the Board and
other Committees as mentioned on
page 63.
Communication between Board meetingsDirectors are kept fully informed of
progress on key matters, including
operational and financial performance,
between formal meetings. This is in
particular achieved by way of either
scheduled conference calls or less formal
update meetings each month when there
is not a formal Board meeting. Ad hoc
meetings and working visits to centres
are also regularly arranged to support
the Chairman’s policy of open
communication. As the Chairman
Board: Related party protocol
The Group completed two transactions
with subsidiaries of the Peel Group in 2015.
The first involved the exercise in May of an
option granted by Peel to intu in 2012,
under which a site for a prime retail and
leisure resort in Málaga, Spain, was acquired
for development. The second, in November,
involved a lease for commercial use from
intu to Peel for a 30.96 acre site, known as
KGV West, which neighbours the Group’s
intu Braehead centre.
Given the presence of representative directors
on the Board, intu has a specific Board
protocol for related party matters. Those
procedures require all Directors to report
all contingent, potential or actual conflicts
of interest and to recuse themselves from
Board discussions when appropriate.
The governance procedures also require
independent verification and, for property
transactions, the Group’s real estate
advisers are asked to provide written
independent third-party validation for
the proposed valuation.
John Whittaker followed all aspects of the
Board protocol for both transactions with
the Peel Group in 2015.
In accordance with the requirements of the
Companies Act 2006, the Group also sought
shareholder approval prior to completion of
both the Málaga option and the KGV West
lease, and shareholders overwhelmingly
supported the proposed transactions at
specifically convened general meetings
during the year.
intu’s proposed Málaga development
An impression of the plans for the acquired land
Lease secured for KGV site, Braehead
An aerial image of the KGV West site for
which the lease was agreed in 2015
intu properties plc Annual report 201566

explains on page 59, this has been an
area of focus in 2015. The Chairmen of
the Audit Committee and Remuneration
Committee communicate regularly with
relevant staff and external advisers,
including but not limited to the Head
of Risk and Internal Audit, the Company
Secretary and the Remuneration
Committee’s consultants, Deloitte.
EffectivenessBalance, composition and culture
The Nomination and Review Committee
regularly reviews the balance (including
skills and experience) and composition of
the Board to ensure that it operates
efficiently. The Board determined that
new candidates for the role of non-
executive director should have sector
relevant qualifications and experience,
notably in property, retail, finance and
digital to ensure that these areas of
importance to intu are well represented.
Those criteria were applied to the
appointment of Rakhi (Parekh) Goss-
Custard and John Strachan during the
year, who bring experience of digital
strategy and global real estate markets
to the Board.
In November the Board approved
the following committee changes, in
anticipation of Neil Sachdev stepping
down from all positions with the Group
at the 2016 AGM: Louise Patten and
Andrew Huntley were appointed as
Chairman and as an additional member
of the Remuneration Committee
respectively, and Rakhi (Parekh)
Goss-Custard was appointed as a
member of the Audit Committee.
The appropriate balance of skills,
independence, experience and knowledge
does not in itself ensure the efficient
operation of a Board. To this end, the
Chairman’s style and leadership of the
Board are essential to creating an
environment where the Non-Executive
Directors are able to draw on their own
experience to constructively challenge
the views of the executive management.
The Chairman and Company Secretary
ensure that all Directors are provided with
fully accurate and timely information to
facilitate informed discussion at Board
meetings. The Chairman is particularly
mindful that the views of all Directors
should be taken into consideration and
that the range of experience of our
Non-Executive Directors must be drawn
upon to provide insight and alternative
perspectives to aid the Board’s decisions
on key strategic matters.
The Board reviews the independence
of its Non-Executive Directors on an
annual basis. With the exception of
John Whittaker and Richard Gordon,
both representatives of significant
shareholders, the Board has concluded
that all other Non-Executive Directors
continue to demonstrate their
independence and commitment
to their roles. The balance of the
Board is illustrated on page 64.
Board meetings
The attendance of Directors at all Board meetings held in 2015 is set out in the
table below:
Board attendance table 2015
Board 1 Audit
Nomination
& Review Remuneration
Patrick Burgess 4/42 4/44 3/32 5/64
John Whittaker 4/4 – – –
David Fischel 4/4 4/44 3/34 6/64
Matthew Roberts 4/4 4/44 – –
Andrew Huntley 3/4 – 3/3 1/1
Adèle Anderson 4/4 4/42 3/34 6/6
Richard Gordon 4/4 – – –
Rakhi (Parekh) Goss-Custard 0/15 0/0 – –
Louise Patten 3/4 – 3/3 6/63
Neil Sachdev 4/4 4/4 3/3 5/63
John Strachan 1/1 – – –
Andrew Strang 4/4 4/4 – –
1 Scheduled Board meetings only, excludes Board away day, Spanish centres visit and calendar
of Board update conference calls.
2 Board or Committee chair.
3 Louise Patten assumed the Committee chair with effect from 9 November 2015 from Neil Sachdev.
4 Attends meetings in a non-voting capacity.
5 Unavailable for Board meeting immediately following appointment, due to prior commitment.
The Board meets regularly during the course of the year and met a total of four times in 2015.
There were four scheduled meetings as well as a Board away day focused on strategy and
planning for 2016. No unscheduled meetings were held during the year as there were no
matters arising between the scheduled meetings which needed to be dealt with at short notice.
At each scheduled meeting, the Executive Directors, the Chief Operating Officer and the Digital
and Commercial Director, Trevor Pereira, each give reports on their key areas of responsibility.
In addition, the chairmen of the Audit, Remuneration and Nomination and Review Committees
give updates on the workings of and progress made by those Committees, highlighting any
areas requiring escalation to, or consideration by, the full Board. Other matters for discussion
are added to the agenda for scheduled Board meetings, or discussed at additionally convened
Board meetings, as required.
Key matters discussed/approved by the Board in 2015
A summary of the key matters discussed and approved by the Board in 2015 can be found
with the Chairman’s introduction on page 58.
Read more on page 64
Governanceintugroup.co.uk 67

The Board continued
The Board has adopted a formal
procedure for the identification of
conflicts under which Directors must
notify the Chairman of any potential
conflicts. The Chairman then decides
whether a conflict exists and
recommends its authorisation by the
Board where appropriate. In certain
circumstances, the conflicted Director
may be required to recuse himself from
the Board’s discussions on a matter in
which he or she is conflicted. Directors
must also notify the Chairman when they
take on any additional responsibilities
or external appointments, and it is
their responsibility to ensure that such
appointments will not prevent them
from meeting the time commitments
discussed above.
In addition, the Board has implemented
a related party protocol for situations
where a proposed transaction could be
captured by the related party provisions
of the Listing Rules or by the Companies
Act 2006, and maintains accurate records
of all actual and potential related party
transactions involving Directors and their
connected persons or associates. Further
detail on the protocol can be found on
page 66.
Time commitment, external activities
and conflicts of interest
Non-Executive Directors are generally
appointed for a three-year term and their
continuing service thereafter is subject
to review by the Board. Their annual time
commitment varies according to their
membership of Board Committees and
the specific corporate activities of the
business in any given year. The terms
of appointment of the Non-Executive
Directors set out minimum expectations
with regard to preparation for and
attendance at all Board meetings,
Board Committee meetings wherever
appropriate, ad hoc meetings and the
annual Board away day. Non-Executive
Directors are required to confirm on
accepting their appointment, and
annually, that they are able to allocate
sufficient time to meet the expectations
of their role.
The terms of appointment for each of the
Non-Executive Directors are available for
inspection at the Company’s registered
office, or on written request from the
Company Secretary.
Directors have a statutory duty under the
Companies Act 2006 to avoid situations in
which they have or may be deemed to
have interests that conflict with those
of intu, including when a Director takes
up a position with another company. The
obligations are relaxed wherever the
conflict is first authorised by the Board.
Strategic focus
CPPIB joint venture
In June 2015, the Group announced it had
agreed to introduce CPPIB as a 50 per cent
joint venture partner of Puerto Venecia,
Zaragoza. This followed intu’s acquisition of
the centre for €451 million in January 2015.
The transaction required that intu develop
new governance arrangements for the
operation of the centre with CPPIB.
To facilitate completion of the transaction
in September 2015, the Board agreed to
complete a listing of the asset management
holding company, Zaragoza Properties
SOCIMI S.A., as a Spanish real estate
investment trust on the Mercado Alternativo
Bursatil (‘MAB’) exchange. The complex
listing application, and associated Spanish
structuring transactions related to CPPIB’s
investment, were both led by our Company
Secretary, Susan Marsden, working in
conjunction with the Group’s Spanish
legal advisers, Linklaters, and the listing
sponsor, Renta4. As a result intu now
complies with obligations across three
separate jurisdictional listings in London,
Johannesburg and Madrid. Susan is pictured
opening trading at the MAB exchange in
Madrid in September.
The appointment of Rakhi (Parekh) Goss-Custard and John Strachan bring additional experience of digital strategy and global real estate markets to the Board
intu properties plc Annual report 201568

Relations with shareholders
Overall approachintu places considerable emphasis on
maintaining an open and frank dialogue
with investors. Our programme of
investor relations activities is based
around the financial reporting calendar
and seeks to:
— develop existing and potential
investors’ understanding of intu’s
business strategy, operations,
performance and investment case
— provide to the Board and executive
team an insight into the differing
views of intu’s institutional and other
significant investors together with a
cross-section of retail shareholders
380+investor meetings in 2015
190investment institutions
engaged with in 2015
5investor conferences
20sell-side institutions cover intu
With these objectives in mind, the
executive team (including, on occasion,
the Chairman) together with the Head of
Investor Relations attended over 380
meetings with representatives of 190
investment institutions during 2015 to
keep them informed of our performance
and plans, to answer their specific
questions and to understand their views.
In addition the investor section of our
Group website provides all shareholders
with a great deal of immediate as well as
general information and a feedback
facility. Regular visits to our centres
enable investors to learn more about the
culture and values of the Group and gain
insight into operational delivery.
Key components of the investor relations programme
One-on-one meetings with
principal shareholders: The
Chairman is available to meet
with key investors to answer
their questions and to better
understand their views,
particularly with regard to
governance matters.
Investor conferences:
Several investment banks hold
conferences for investors and
companies in the real-estate
sector. They are a good
opportunity for the executive
team to meet a large number of
current and potential investors
in a mixture of group and
one-to-one meetings, and
informally. intu attended five
such conferences in 2015 in the
UK, Europe and the US.
Results-related meetings:
Institutional shareholders are
invited to a presentation with a
question and answer session by
the executive team on the day
of announcement of final and
interim results. The Chairman and
a number of the Non-Executives
also attend these presentations.
General meetings: The annual
general meeting (AGM), usually
held in May, gives the opportunity
for all shareholders (private and
institutional) to ask questions
of the Board, including the
Chairmen of both the Audit and
Remuneration Committees. The
entire Board is also available to
talk to shareholders before and
after the meeting.
Road shows: Following results
announcements, executive
management conducts one-to-
one and Group meetings with
institutional shareholders in the
UK, South Africa, Europe and
the US, giving the opportunity
to meet other fund managers
as well as the sector specialist of
each institution. Unattributable
feedback from these meetings
is provided to the Board.
Interaction with ‘sell side’
analysts: Many investors
develop their understanding
of the Company partly through
discussions with independent
analysts. intu engages with
analysts from 20 institutions in
order to improve the accuracy
and insight of their research.
The Board is kept informed
of analyst commentary
and recommendations.
Investor and analyst property
visits: Institutional shareholders
are invited to attend at least one
property visit each year with
presentations on intu’s business.
This gives an opportunity for
formal and informal interaction
with the executive team and the
next tier of management. In
2015, investors visited Puerto
Venecia and intu Lakeside to
see recent changes and to hear
about our strategic objectives.
Debt investors: Representatives
of intu’s key relationship
banks are invited to the
results presentations and
meet periodically with the
Chief Financial Officer.
Institutional investors in certain
of the Group’s listed debt are
invited to periodic updates
on the Group’s business and
performance. We welcome
the moves by some credit-side
institutional investors towards
more openness regarding
holdings of debt instruments
and ‘road show’ style
one-to-one meetings.
Read more at intugroup.co.uk/investors
Governanceintugroup.co.uk 69

Mon
itori
ng
and
repo
rtin
g re
spon
sibi
lity
Implem
entation and compliance respon
sibility
Focus on risk
The effective assessment and management of risk is key to the delivery of the Group’s strategy
Risk appetiteOur risk appetite remains broadly
unchanged in 2015. Risk appetite is the
level of risk the Group is willing to take to
achieve its strategic objectives and is set
by the Board. The Board looks at the
Group’s appetite to risk across a number
of areas including the property market,
financing, operations, strategy and
execution, developments, cybersecurity
and technology and brand.
The Group’s risk appetite is set in the
context of our focus on one sector –
prime shopping centres. As experts in
this sector we are able to mitigate the
risk involved in growing the business by
acquisition, development and our active
The effective assessment and
management of risk is key to the delivery
of the Group’s strategy. The setting of
the Group’s risk appetite by the Board
provides the framework within which
the Group’s risk management process
operates. Risk management is embedded
throughout the business with all
employees aware of the role they play.
An independent review of the maturity
of the intu risk processes was performed
during 2015. intu’s risk management was
benchmarked as equivalent to or better
than that of peers in property and retail.
Risk processes were found to be sound
and the business was found to be
engaged in managing risk.
asset management strategy. This focus
on our core strengths is balanced by a
more cautious approach to risk in other
areas. In financing we set a target Group
debt-to-asset ratio of 40-50 per cent and
require interest cover of more than
160 per cent, giving us significant
headroom against our loan covenants
to ensure that we are in a strong position
in the event of any substantial falls in
property values. We continue to look to
minimise interest rate risk with a policy
of hedging at least 75 per cent of the
exposure and seek to refinance debt early
to reduce risk. This does not however
prevent us looking at innovative debt
structures that provide the Group with
diverse funding options.
Risk management framework
— ensure that risk is managed across the business
— define the Group’s appetite for risk
— with the Executive Committee, assess the Group’s principal risksBoard
Audit Committee — monitor and review the effectiveness of the Group’s risk management system
— monitor and review the Group’s overall approach to monitoring areas of risk
Risk and internal audit
— lead the development of risk management
— collate outputs of risk management exercises including risk registers for presentation
to Audit Committee, Executive Committee and Board
— identify emerging risks across the business
Executive Committee
— input into Board’s process for setting risk appetite
— implement strategy in line with the Group’s risk appetite
— lead operational management’s approach to risk
— with the Board, assess the Group’s principal risks
Operational management
— create an environment where risk management is embraced and the responsibility of
risk management is accepted by all employees
— implement and maintain risk management processes
— produce and maintain risk registers including identification of risks, mitigating controls
and actions required
Employees — active in the day-to-day management of risk
intu properties plc Annual report 201570

Risk management processintu’s Board has overall responsibility
for risk management. The effectiveness
of the risk management system is
monitored and reviewed by the Audit
Committee and through periodic
external review. Risk management is
embedded in intu’s culture, from cleaners
making sure that the centres are free
of hazards to the construction team
ensuring the right contractors are
selected for developments.
All businesses need to take risk in order
to generate returns. Risk management
assists in understanding the risks that
we are taking; it does not try to prevent
us from taking risks. Risks are identified
and assessed to ascertain if they are
within the acceptable risk appetite of
the business. If not, action is taken to
reduce the risk to an acceptable level.
Our assessment of risk is underpinned by
a formal risk review process conducted
for each area and every level of the
business including for each centre, each
department and the executive team.
These reviews identify risks and assess
them for controllability and stability.
Risks are measured for impact and
likelihood, and an assessment is made of
how quickly the risks would impact the
business and how long those risks would
impact the business for. Impact and
likelihood change as businesses and
external factors evolve. intu’s ongoing
risk management ensures that changes
in impact and likelihood are identified
and managed appropriately.
The risk registers created through this
process are subject to at least an annual
review, facilitated by the risk and internal
audit team. Operational management
are responsible for managing the risks
and for updating the risk registers.
The Audit Committee oversees the risk
management process, receiving risk
updates at least four times a year.
The principal risks identified by this
process are discussed in more detail
on pages 37 to 39.
Viability statement
In accordance with provision C.2.2 of The UK Corporate Governance Code, the Directors have
assessed the prospects of the Company over a longer period than that required in adopting
the going concern basis of accounting. Based on the result of this analysis, the Directors have
a reasonable expectation that the Company will be able to continue in operation and meet its
liabilities as they fall due over the next five years. This period is considered appropriate
because of the combination of the following factors:
— the Group’s strategic plan covers 10 years, with a greater degree of detail and rigour
applied to the first five years
— the Group’s weighted average unexpired lease term, which at 31 December 2015 was
7.9 years
— the Group’s weighted average debt maturity, which at 31 December 2015 was 7.8 years
— the term of the Group’s Revolving Credit Facility, which currently extends to 2020
The strategic plan incorporates the Group’s strategic objectives and considers the impact of
the principal risks. The plan considers net rental income, cash flows, development expenditure,
potential corporate transactions and refinancing plans over the 10 year period. It highlights
the impact of the relevant principal risks on key metrics such as debt to assets ratios, earnings
per share and financial headroom and models the impact of potential corporate transactions
and their impact. We also consider the impact on the Group’s financial position of changes in
key input assumptions including asset values, income and refinancing. Key assumptions and
sensitivities addressed include:
— refinancing of debt; £1.6 billion (around 35 per cent) of the Group’s debt is due for
repayment in the next five years
— falls in the value of investment property of up to 25 per cent
— falls in income of up to 10 per cent
Insurance renewal
As part of the renewal processes for
2015, insurers were invited to visit intu
centres to see the business in action.
As a result significant interest was
generated and a reduction in intu’s
insurance renewal rates of more than
£1 million on a like-for-like basis was
achieved and passed on to tenants.
The site visits were accompanied by
a detailed presentation highlighting
how intu’s proactive approach reduces
risk for both the insurers and the
business, for example:
— National Counter Terrorism Security
Office links for all centres
— documented crisis management plan
and procedures
— documented emergency plans, for
example threat level response, business
impact assessments
— annual desktop testing of emergency
plans for all centres
— investing in ongoing training and
development for employees to help
them carry out responsibilities to
a high standard
— retailer duct work inspection process
to mitigate risk of fire
— independent fire surveys carried out
at all managed centres
— direct relationships with loss mitigation
company to minimise the impact
of incidents
— 24-hour CCTV in use at all centres
— police presence at centres including
a number of police offices within
the centres
Governanceintugroup.co.uk 71

Audit Committee
Dear shareholder
As the Chairman of the Audit Committee
it is my role to present to you the Audit
Committee report for 2015.
The Committee has this year continued
to focus on risk management, particularly
in relation to the evolving digital
environment, our partners and joint
ventures and our expanding operations
in Spain. The Committee has carried out
a comprehensive risk review with the
results also presented to and discussed
with the full Board. The Group’s approach
to risk management is described in detail
on pages 70 and 71 and the principal
risks are detailed on pages 37 to 39.
Following our annual review of auditor
quality and independence (see page 74
for more detail), we have recommended
that PricewaterhouseCoopers (PwC)
be reappointed for the 2016 audit.
The EU Audit Regulation (537/2014)
and Audit Directive (2014/56/EU) become
applicable from 17 June 2016 and must
be implemented in the UK by the same
date. These limit the length of tenure
an audit firm can serve and put in place
requirements for the audit tender
process. PwC has been intu’s audit
firm for more than 20 years and a tender
process will be carried out to coincide
with the end of the current audit partner’s
five-year tenure such that a new audit
firm will be in place for the year ending
31 December 2018.
Adèle Anderson
Chairman of the Audit Committee
26 February 2016
Key Matters of 2015
— cybersecurity
— international operations
— partners and joint ventures
— viability statement
Members in 2015
Chairman
Adèle Anderson
(Independent Non-Executive Director)
Members
Rakhi (Parekh) Goss-Custard
(Independent Non-Executive Director)
Neil Sachdev
(Independent Non-Executive Director)
Andrew Strang
(Independent Non-Executive Director)
Areas of focus in 2016
— developments
— international operations
— partners and joint ventures
ResponsibilitiesThe Audit Committee’s key
responsibilities are to monitor and review:
— the integrity of the financial
statements, including a review of
the significant financial reporting
judgements and accounting policies
— the effectiveness of the Group’s
internal control and risk management
— the effectiveness of the internal
audit function, including the
work programme undertaken
by the function
— the Group’s policy on whistleblowing
— the Group’s overall approach
to monitoring areas of risk
— the Company’s relationship with
the external auditor, including
its independence
Main activities during the yearThe Audit Committee considered the
following key matters in 2015:
— the Group’s investment property
valuation process
— the Group’s cybersecurity plans
— accounting treatment of the most
significant transactions in the year
including the acquisition of Puerto
Venecia and subsequent creation
of a joint venture with CPPIB
— financial control of Spanish businesses
— the 2015 internal audit plan and
audit charter
— the new viability statement
— discussion on the appropriateness of
those items classified as ‘exceptional’
in the year and therefore excluded
from underlying earnings
— the results of a review of the carrying
value of the Group’s investment
in Prozone
— the Group’s counter-terrorism approach
intu properties plc Annual report 201572
Key financial reporting and significant judgementsDuring the year the Committee
discussed the planning, progress and
final conclusions of the external audit
process. The audit plan was reviewed
and approved at the July 2015 Committee
meeting. The significant risk areas
identified were: investment property
valuations; revenue recognition; and
management override of controls.
International Standards on Auditing
(UK and Ireland) identify these latter
two risks as significant for all companies.
Fair, balanced and understandable
At the request of the Board, the Committee
considered whether the 2015 annual report
was fair, balanced and understandable
and whether it provided the necessary
information for shareholders to assess
intu’s performance, business model,
position and strategy. As part of its
considerations the Committee took into
account the preparation process detailed
below which, together with opinions of key
executives and the external auditor, has
been designed to assist the Audit
Committee in reaching its view:
— at an early stage, a matrix is produced
identifying key themes and the
sections in which those themes
should be reflected
— individual sections of the annual
report are drafted by appropriate
senior management with regular
review meetings to ensure consistency
across the whole document
— a verification process is undertaken
to ensure that information contained
is appropriately supported and
factually accurate
— detailed reviews of drafts of the annual
report are undertaken by members of
the Executive Committee and other
senior management
— drafts are discussed with the Group’s
legal advisors and brokers
— a final draft is reviewed by the Audit
Committee and discussed with senior
management prior to consideration
by the Board
As a result of its considerations the
Committee is satisfied that, taken
as a whole, the annual report is fair,
balanced and understandable and has
recommended as such to the Board.
Issue Action taken
Valuation of
investment
and development
property
For the interim results at 30 June the Audit Committee carried out a review
of the investment property valuations. The full Board carried out a review
of the 31 December valuations included in this report.
Due to the overall importance of the valuations to the Group’s results,
the relevant Audit Committee and Board meetings included a presentation
from Cushman & Wakefield as part of the discussions considering the
valuation process.
The Audit Committee review included discussion with management and
the auditor of the key assumptions and results of the valuation process
undertaken by the independent third party valuers.
This review also included understanding which general factors had influenced
the valuers in concluding on appropriate yields to use in the valuations. This
involved factors affecting both the investment and occupier markets and
recent comparable market transactions.
Particular emphasis was given to understanding the factors that had resulted
in individual property valuations being either significantly above or below
the average movement in the Group’s valuations.
Presentation of
information
Operating through joint ventures is a core part of intu’s strategy.
Management both review and monitor the business, including the Group’s
share of joint ventures, on an individual line basis not on a post-tax profit or
net investment basis. The figures and commentary presented in the strategic
report have therefore been presented consistently with this management
approach. Reconciliations between the management and statutory bases
are provided in the other information section on pages 164 to 166.
The Committee has reviewed the prominence given to both statutory
information and information on a management basis, and concluded that the
approach adopted provides the most useful analysis of the results for the
year.
Going concern The Company’s ‘going concern’ review which is based on an 18-month cash
flow projection with particular focus on the next 12 months, was discussed
with management. The projections cover the major trading cash flows, being
rental income and interest expense, and capital expenditure plans in the
context of the latest debt maturity profile.
Stress tests of the projections were considered, covering reductions in net
rental income levels and the value of the Group’s properties and what impact
such changes may have on both the Group’s liquidity and its ability to meet
the financial covenants on its debt facilities. The discussion also considered
what actions were available to the Group to mitigate the impact of such
reductions on the cash flow projections.
Following discussions with management, the Committee agreed with the
conclusions reached and the treatments relating to the above issues adopted
in these financial statements.
Viability
statement
In accordance with provision C.2.2 of The UK Corporate Governance Code,
the Board has assessed the prospects of the Company over a longer period
than that required in adopting the going concern basis of accounting. The
viability statement is included on page 71 and sets out the conclusion of
that assessment. The Audit Committee assessed the viability position and
reported its recommendations to the Board.
These issues were discussed by the
Committee following finalisation
of the audit.
The Committee takes into account
the views of the external auditor in
understanding and assessing whether
suitable accounting policies have been
adopted, whether management has
made appropriate estimates and
judgements and whether disclosures
are balanced and fair. The main issues
discussed by the Committee in the
year are detailed in the table below.
Governanceintugroup.co.uk 73

Audit Committee continued
Details of the amounts paid to the external
auditor for audit and non-audit services
are included in note 9 to the financial
statements. The Company engaged PwC
to carry out certain non-audit work in 2015
including assurance services in respect of
the Group’s 2015 interim report and
work associated with the listing of Puerto
Venecia, Zaragoza as a SOCIMI in Spain.
The above safeguards were adhered to
when awarding this non-audit work and
PwC were chosen for the work on Puerto
Venecia as this primarily related to
producing interim review reports for the
entities in the structure. Fees paid to PwC
in respect of non-audit work represented
15 per cent of the total fees paid. During
2015 the Group used accounting firms other
than PwC for a number of assignments.
The EU Audit Regulation (537/2014)
and Audit Directive (2014/56/EU), which
come into force on 17 June 2016, impose
restrictions on certain non-audit services.
A number of non-audit services will be
prohibited and others will require approval
by the Audit Committee. There will be
an overall fee limit of 70 per cent of the
average of audit fees charged in the past
three years, though this and other rules are
expected to be subject to transitional
arrangements and it is anticipated that
non-audit services required under EU or
national regulation will be excluded from
this test. Further to recent consultations
the UK regulator is expected to release the
final text on the implementation of these
directives in the UK in the second quarter
of 2016. intu’s current policy on non-audit
services set out above continues in force
for the time being. As soon as there is
more clarity on the new regulations, and
in particular which services are impacted,
intu will review its policy and make any
necessary amendments to comply with
the new rules.
The table below summarises the fees paid
to auditors over the last three years. The
three-year average ratio of non-audit fees
to audit fees is 109 per cent. The higher
levels of non-audit fees in 2013 and 2014
principally related to reporting accountant
External auditorThe Audit Committee has assessed
the effectiveness of the external auditor,
PwC, in line with the approach set out in
the Financial Reporting Council’s Audit
Quality Practice Aid. In carrying out their
evaluation the Audit Committee has held
discussions without the auditor, asked the
auditor to explain the risks to audit quality
that they have identified and their
firm-wide controls relied upon, enquired
about the findings from internal and
external inspections of their audit, probed
and challenged the auditor’s strategy and
plan and discussed the outputs of the
audit with the auditor. This included direct
meetings, review of reporting issued by
the external auditor and review of
independent reports:
— senior finance staff reviewed the
detailed execution of the 2014 audit
plan with the engagement team and
identified specific improvements
for the 2015 plan
— the report of the Financial Reporting
Council (FRC)’s May 2015 Audit Quality
Inspection review of PwC was reviewed
and found to be supportive of the firm’s
overall systems of quality control
— the Chairman of the Audit Committee
and the Chief Financial Officer each
met privately with a senior partner
of PwC unrelated to the engagement
shortly after the publication
of the Group’s annual report to
review the performance of the firm
— the Audit Committee reviewed the
audit plan provided by PwC, including
the risks identified and its approach
to these
The Company has complied with the
provisions of The Statutory Audit Services
for Large Companies Market Investigation
(Mandatory Use of Competitive Tender
Processes and Audit Committee
Responsibilities) Order 2014 and in doing
so has applied the transitional provisions
related to the audit tender process. PwC
has been intu’s audit firm for more than
20 years without a formal tender process
having been completed in recent years.
A tender process will be carried out to
coincide with the end of the current audit
partner’s five-year tenure such that a new
audit firm will be in place for the year
ending 31 December 2018.
2015
£000
2014
£000
2013
£000
Audit fees 628 566 370
Non-audit fees 96 1,034 573
Total fees paid to auditors 724 1,640 943
Ratio of non-audit fees to audit fees 15% 190% 155%
The EU Audit Regulation (537/2014) and
Audit Directive (2014/56/EU) become
applicable from 17 June 2016 and must
be implemented in the UK by the same
date. The above plans are in line with the
requirements of these.
A resolution to reappoint PwC for the
2016 audit will be proposed at the 2016
annual general meeting.
The Committee will continue to review
the effectiveness and independence of
PwC each year.
Non-audit servicesThe Group has a policy to ensure that
the provision of any non-audit services
by the incumbent external auditor
does not impair the external auditor’s
independence or objectivity.
The Audit Committee has considered the
option of putting material non-audit work
out to tender. While recognising that the
circumstances of a particular transaction
may make it most sensible to use the
incumbent external auditor for such work
(for example where the nature of the
transaction would not allow a new firm
sufficient time to assimilate the requisite
knowledge of the Group’s operations in
order to carry out the non-audit work),
the Audit Committee has recommended
that non-audit work should be undertaken
by someone other than the external
auditor wherever practical.
The Audit Committee has delegated to
the Executive Directors the authority to
contract for non-audit services with the
external auditor subject to observing
certain guidelines including:
— Executive Directors have the authority
to commission the external auditor
to undertake non-audit work up to a
specified value
— the Executive Directors must consider
whether the proposed arrangements
will maintain audit independence
— the external auditor must satisfy
the Company that it is acting
independently
intu properties plc Annual report 201574

Audit Committee effectivenessAs part of the Board evaluation process,
the Audit Committee reviewed its own
effectiveness and this confirmed that
the Committee remained effective at
meeting its objectives.
Adèle Anderson
Chairman of the Audit Committee
26 February 2016
work in respect of raising debt and the
2014 rights issue. This analysis does not
remove certain non-audit fees which may
be excluded from the calculation of the
ratio when it comes into force in 2016.
Risk management and internal controlThe Board has overall responsibility to
oversee the Group’s system of internal
control and to keep its effectiveness
under review, as well as to determine the
nature and extent of the risks it is willing
to take in achieving its strategic objectives
based on the balance of potential risks
and reward. The Group’s approach to
risk management is described in detail
on pages 70 to 71 and the principal risks
are detailed on pages 37 to 39.
The Board conducts an annual
review of the effectiveness of the risk
management and internal control
systems. During this review the Board
has not identified nor been made aware
of any failing or weakness which it has
determined to be significant.
The key elements taken into account
in this review include:
— the Group’s internal audit function’s
work during the year (see below)
— the Group’s risk management
process (see pages 70 to 71)
— the Group’s controls over its financial
reporting process including: the
comprehensive system for reporting
results to the Board; the process for
producing the consolidated financial
statements; and the experience and
quality of the team involved in the
financial reporting processes
Internal auditThe Group has a risk and internal audit
function which reports to the Audit
Committee. The risk and internal audit
function reviews internal controls and
reports to the Audit Committee on
whether such controls are in place and
are being operated effectively. The
function covers intu properties plc
and its subsidiaries and joint ventures.
The risk and internal audit function has
a rolling programme of reviews ensuring
that all centres, functions and areas of
the business are reviewed regularly. The
most significant areas covered in 2015
included shopping centre healthchecks
(or follow-up reviews) at six centres, a
post-acquisition review of Puerto
Venecia, Zaragoza, information and
communication technology change
management, valuations, construction
and development, treasury and anti-
terrorism processes. Additionally, annual
assurance activities were performed,
including a review of gifts and hospitality
and executive expenses.
The Audit Committee regularly reviews
the effectiveness of the risk and internal
audit function and in particular ensures
that the function remains sufficiently
independent of the wider business to
ensure it can carry out its work effectively.
An independent review of the risk and
internal audit function is carried out every
five years and was last performed at the
end of 2013. An external review of the
Group’s risk management process was
carried out during 2015 as discussed in
the focus on risk section on page 70.
Whistleblowing policyThe Audit Committee is responsible for
overseeing the Group’s whistleblowing
policy and procedures, under which
employees can raise concerns about
possible improprieties (whether financial
or otherwise) within the Group on a
confidential basis. The arrangements are
monitored by the committee throughout
the year. All whistleblowing incidents are
reported to the Committee and fully
investigated with procedures reviewed
and improved where appropriate.
During 2015, the Committee:
— continued to review the scope,
resourcing and application of the
existing whistleblowing policy to make
sure this remained appropriate to intu’s
operations and employees
— extended the policy to cover the
Group’s operations in Spain, in
particular Puerto Venecia,
Zaragoza acquired in January 2015
— initiated a process to extend the
Group’s policy to include key suppliers
There were two whistleblowing
incidents relating to the intu Group
during 2015. The first related to alleged
misuse of CCTV and was found to be
unsubstantiated. The outcome was not
challenged by the original complainant.
The second, an allegation against a
staff member, was not corroborated by
evidence on investigation, but has been
noted by the Audit Committee for
follow-up action.
Governanceintugroup.co.uk 75

Nomination and Review Committee
ensure that a range of suitable candidates
is taken into account when drawing up
shortlists. The priority of the Committee
is to ensure that the Group continues to
have the most effective Board possible
and all appointments to the Board are
made on merit against objective criteria.
Board composition The Committee’s discussions regarding
the composition of the Board continued
to be framed by the Company’s previously
stated goal of reducing the overall size of
the Board. The Committee is satisfied
that the balance of skills, knowledge
and experience on the Board and its
Committees is appropriate following
the appointment of the new Non-
Executive Directors in October. The
Committee has begun the process of
planning for the retirements at the
AGM in 2017 of the Chairman and
Senior Independent Director.
Appointment of John StrachanThe Committee considers that John
Strachan is fully independent. The
Committee has taken account of the fact
that John was, until December 2015, a
partner of Cushman & Wakefield which
is one of several real estate advisory firms
which carries out valuation work for intu.
He continues on a limited consultancy
basis with Cushman & Wakefield, serving
as a member of the International Council
of Shopping Centres.
John has in the past provided strategic
advice to intu, notably in relation to the
Group’s entry into Spain, but he has not
had any direct involvement in valuation
work carried out by Cushman & Wakefield
for intu during the three years prior to
his appointment.
Dear shareholder
2015 has been an important and
busy year for the Committee.
As Chairman of the Committee it is my
responsibility to ensure that we follow
a robust process and best governance
practice whenever key decisions are taken
by this Committee, in particular relating
to new appointments.
The Committee was pleased to
recommend the appointments of
Rakhi (Parekh) Goss-Custard and John
Strachan to the Board with effect from
7 October 2015. The Board is already
benefiting from their respective expertise
in digital and global real estate areas.
As a result of the changes in Directors,
intu now has 25 per cent female
representation on the Board. The Board
is supportive of Lord Davies’s aspirational
target of 33 per cent female Board
representation by 2020. Further
information regarding our diversity
policy is set out below.
Responsibilities and how they were discharged in 2015 The principal role of the Nomination
and Review Committee is to evaluate
the skills available on the Board and
to determine when appointments and
retirements are appropriate.
In addition to its key responsibilities
set out above, the Committee is also
responsible for carrying out the annual
performance evaluation of the Board, its
Committees and individual Directors, as
well as making recommendations to the
Board on appointments to the Board,
including the induction programme for
newly appointed Directors, and on
succession planning.
The Committee met three times in 2015
with its main focus on the composition
of the Board and succession planning.
Statement on diversity policy The Nomination and Review Committee,
and the Board, recognise the importance
of boardroom diversity and the
Committee’s policy is to seek to
The Committee’s main focus in 2015 was the composition of the Board and succession planning
Highlights of 2015
— Appointment of Rakhi (Parekh)
Goss-Custard and John Strachan
in October
— Changes to Board Committee
governance in line with
new appointments
— Advanced medium-term
succession planning and
governance risk assessment
Members in 2015
Chairman
Patrick Burgess
(Chairman of the Board)
Members
Andrew Huntley
(Independent Non-Executive Director)
Louise Patten
(Independent Non-Executive Director)
Neil Sachdev
(Independent Non-Executive Director)
Areas of focus 2016
— Continued refreshing of
Board composition in line with
succession plans
— Commencement of process for new
Chairman to be appointed in 2017
intu properties plc Annual report 201576

The Board also recognises the need for
Directors to keep up to date with relevant
legislative and regulatory developments
as well as changes to corporate
governance best practice and investor
expectations. The Company Secretary
reports to each Board meeting on these
matters, drawing attention to any issues
of particular relevance. In addition, the
Company Secretary maintains an
up-to-date comprehensive schedule
summarising legislative and regulatory
developments relevant to the Company
and rated according to risk/impact on
the Group, which is available to the
Board and senior management.
Patrick Burgess
Chairman
26 February 2016
Talent developmentTalent development is a key focus of the
Committee and a comprehensive talent
and leadership development programme,
including succession planning, has been
implemented for senior management
across the entire Group. The Committee
receives regular update reports regarding
progress and remains confident in the
future potential of the Group’s most
promising executives and staff.
Renewal of Non-Executive appointmentsAll Directors, other than Neil Sachdev
who is stepping down, will submit
themselves for election or re-election
at the forthcoming annual general
meeting in May 2016.
Training and developmentThe Chairman, with the assistance of
the Nomination and Review Committee,
regularly considers the need for Directors
to update and expand their skills and
knowledge. Training is provided for
Non-Executive Directors in the form
of presentations at Board meetings, as
well as attendance at relevant seminars
and courses.
Performance evaluation
Every year, the Board conducts an evaluation of the performance of the Board and its Committees. In addition, the Chairman reviews the
performance of each Director and the Senior Independent Director oversees the review of the Chairman’s performance. The evaluation exercise
conducted during 2014 identified three areas requiring attention during 2015. Progress against those areas is shown in the table below:
Areas identified for attention in 2015 Action taken
Board succession planning Rakhi (Parekh) Goss-Custard and John Strachan were appointed in the year in anticipation of forthcoming
retirements from the Board
Enhancing Board communication Board members have taken every opportunity to meet, formally or informally, on numerous occasions throughout
the year in order to enhance communication and forge stronger relationships. This has included additional centre
visits, including to the Group’s Spanish centres as further described on page 59
Risk as a standard agenda item The Audit Committee discusses risk as a standard agenda item at each meeting
2015 performance evaluation
The 2015 performance evaluation was conducted by way of an internal questionnaire, with the expectation that the 2016 evaluation will be
conducted by an external facilitator. The key points identified in 2015 formed the basis for recommendations which the Board used to establish
a specific action plan for 2016. The main areas covered by the action plan are:
— succession and development planning – planning for the forthcoming retirement of the Chairman and the Senior Independent Director
— Nomination and Review Committee – increase in number of meetings and Board succession as a standard agenda item
— Board Committees – review of Board Committees’ terms of reference, and in particular a review of the interaction between the Capital
Projects Committee and the Board
Induction for new Directors
There is a comprehensive induction
programme for new directors which is
tailored by the Chairman, in consultation
with the Chief Executive and Company
Secretary, depending on the type of
appointment. The programme ordinarily
includes meetings with Board members,
senior management and external advisers,
as well as a high-level review of all current
projects, Board strategy and an in-depth
review of the Group’s assets. Additional
elements are added to the programme on
discussion between the Chairman and the
individual Director.
Where required, the Company Secretary
provides guidance or facilitates the
provision of training on Directors’ duties
under the Companies Act 2006 and on
legal, regulatory and governance matters
with which the Company, Board and
individual Directors must comply.
Governanceintugroup.co.uk 77

Directors’ remuneration reportDear shareholder
I am pleased to present intu’s 2015
Directors’ remuneration report to you,
which has been prepared by the
Remuneration Committee and
approved by the Board.
This is my first year as Chairman of the
Remuneration Committee and I would
like to thank Neil Sachdev for his work
as Committee Chairman prior to my
appointment. The substantive review
of our remuneration arrangements,
which Neil oversaw during 2012, was
well received by shareholders and we
have been pleased to have received
a consistently positive response from
shareholders to our remuneration
approach. This is in large part due to Neil’s
guidance and hard work during his tenure.
Results and context of remunerationintu continues to focus on delivering
long-term strategic objectives. In 2015
we have seen benefits from this focus,
with the return to positive like-for-like
net rental income growth and
strong operating metrics that have
outperformed national benchmarks.
We have also delivered a total
shareholder return of 10 per cent and
have received excellent customer
feedback and improved customer metrics
at our newly opened developments. We
continue to develop our in-house digital
operations and are at the forefront of our
sector in terms of digital and customer
experience. While achieving these results
we have maintained financial headroom
throughout the year. Our forward-looking
financial strategy is well progressed and
we have made significant progress in the
Spanish market.
Remuneration policyWe are not proposing to make any
changes to our Directors’ remuneration
policy this year. Our Directors’
remuneration policy, which was approved
by shareholders at the 2014 annual
general meeting, will continue to apply
for a third year. In the interests of succinct
reporting we have not reproduced the
full policy report. A summary table,
setting out an overview of remuneration
elements and policy for 2015 is included
in the body of the report. The approved
policy table is included at the end of this
report for ease of reference. The full
policy report can be found on our website,
intugroup.co.uk. In 2016 we will be
Members and meetings in 2015
Remuneration
Committee1
(6 meetings)
A B
Louise Patten (Chairman
– appointed 9 November
2015) (Independent
Non-Executive Director)
6 6
Neil Sachdev (Stepped
down as Chairman
9 November 2015)
(Independent
Non-Executive Director)
6 5
Adèle Anderson
(Independent
Non-Executive Director)
6 6
Andrew Huntley
(with effect from
9 November 2015)
(Independent
Non-Executive Director)
1 1
A = Maximum number of meetings eligible to attend.
B = Number of meetings actually attended.
1 The Committee normally invites the Chairman
and the Chief Executive to attend the scheduled
meetings. The Chairman attended five of the
scheduled meetings in 2015. The Chief Executive
attended all of the six scheduled meetings. No
individual is present when his or her
remuneration is being determined.
Key areas of focus and decisions in 2015 and for 2016
Remuneration governance aligned features
Malus provisions for both the annual
bonus and the PSP
Clawback provision for both the
annual bonus and the PSP
Time horizon extending to five
years for a portion of the PSP
Full retrospective disclosure of
annual bonus financial targets
including minimum and maximum
target range
The key decisions made in applying our policies in 2015 and for 2016 included the following:
— the Chief Executive’s salary will be increased by 3.9 per cent to £587,000, and the
Chief Financial Officer’s salary by 4 per cent to £463,320. The average salary increase
for executive directors was lower than the average increase for other staff in the business
— the annual bonus awarded to the Executive Directors for the year ended 31 December
2015 was 114.4 per cent of salary representing 95.3 per cent of maximum opportunity,
based on EPS performance in the year and the achievement of key strategic objectives
— the first tranche of the 2013 PSP award is due to vest at 37.6 per cent, reflecting intu’s
strong Absolute Total Return (NAV per share plus dividends) over a three-year period
— no changes have been made to the performance measures for the annual bonus and
performance share plan
— performance share plan awards of 250 per cent of salary were made to each of the
Executive Directors. These will only vest subject to the achievement of stretching Total
Shareholder Return (TSR) and Absolute Total Return performance conditions, over
three, four and five years
— all incentive awards in respect of 2015 have malus and clawback provisions under
which incentive amounts delivered to the Executive Directors may be reclaimed in
certain circumstances
intu properties plc Annual report 201578

Short-term incentive
Compliance statement
This is the Directors’ remuneration report
of the Company which has been produced
pursuant to, and in accordance with, the
Listing Rules, section 420 of the Companies
Act 2006 and Schedule 8 to the Large and
Medium-sized Companies and Groups
(Accounts and Reports) Regulations 2008
(as amended 2013). The Company also
complies with the requirements of the UK
Corporate Governance Code (the ‘Code’).
This report contains both auditable and
non-auditable information. The information
subject to audit is set out in the Directors’
remuneration report, in sections marked
with §.
A copy of our shareholder-approved
Directors’ remuneration policy can
be found on the Company’s website
at intugroup.co.uk/who-we-are/
governance/corporate-policies
Shareholder annual general meeting The Directors’ remuneration report
will be put to the shareholder vote at
our 2016 AGM and we look forward
to receiving your views and support.
Louise Patten
Chairman of the
Remuneration Committee
26 February 2016
undertaking a review of the Policy ahead
of submitting it to shareholder vote at the
2017 annual general meeting, as required
by regulations. We would consult with
shareholders prior to any substantive
changes to our policy.
Alignment with long-term successThe Committee believes that our
remuneration philosophy and incentive
policy is aligned with the long-term
success of the Company. Our long-term
incentive plan has time horizons
extending to five years, and 50 per cent
of our annual bonus is deferred into
shares. Performance pay is linked to:
— out-performance of total shareholder
return (TSR) against our peers
— delivering absolute total return
for our shareholders
— annual EPS performance
— achievement of our strategic initiatives
that will build value for the longer term
Short-term incentive
Overview of Executive Director remuneration An overview of the key remuneration elements in place for Executive Directors is set out below. We have made no changes to the
operation of our policy this year.
— Salaries for 2016 are: – David Fischel, Chief Executive: £587,000 – Matthew Roberts, Chief Financial Officer: £463,320
— This is in line with increases to staff across the business
Details of policy for 2016
— Salaries are reviewed annually and will take into account factors such as: market pay levels for the role, increases for the rest of the Group and individual and Company performance
— The Company operates an approved defined contribution pension arrangement, where the contribution is 24 per cent of basic salary. The Chief Executive receives an extra six per cent in recognition of the benefit foregone on the closure of the defined benefit scheme
— Benefits include a car allowance (up to £18,000), private medical insurance, life assurance and long-term sickness insurance
Summary of policy
— Maximum opportunity of 120 per cent of salary — A proportion earned is deferred into intu shares,
which vest over two and three years subject to continued employment
— At least two-thirds of this award is based on Group financial measures or quantitative key performance measures
— The normal maximum grant size is 250 per cent of salary per annum; however this may be increased to 375 per cent in exceptional circumstances
— Awards under the plan vest one-third after each of three, four and five years
— Executive Directors must build up, over a period of three to five years, a holding with a value equivalent to 200 per cent of salary (Chief Executive) and 150 per cent of salary (Chief Financial Officer)
— For 2016 performance is based two-thirds on EPS and one-third on strategic and operational objectives. This is the same framework which applied for 2015
— 50 per cent of the award deferred into shares
— Awards of 250 per cent of salary — For 2016, the awards will be based:
– 50 per cent on TSR relative to the top five listed REITs
– 50 per cent on Absolute Total Return (NAV per share growth plus dividends)
— Targets unchanged from 2015
Key elements
2016 2017 2018 2019 2020
Base salary
Pension and benefits
Annual bonus
Long-term incentives
Shareholdingguidelines
Vesting period
Vesting period
intugroup.co.uk 79GovernanceDirectors’ remuneration report

Directors’ remuneration report continued
Annual remuneration reportThis report sets out how the Directors’ remuneration policy of the Company has been applied in the year and details of how the
Committee intends to apply the policy going forward. In accordance with section 439 of the Companies Act 2006, an advisory
shareholder resolution to approve this report will be proposed at the 2016 annual general meeting of the Company. Subsections
marked with § have been audited in accordance with the relevant statutory requirements.
Key responsibilities
The principal role of the Remuneration Committee is to determine and then agree with the Board the framework and policy for the
remuneration of the Chief Executive, the Chief Financial Officer, the Chairman of the Company and such other members of the
executive management as it is tasked to consider.
Key principles of remuneration policy
The Company’s remuneration policy aims to attract, motivate and retain high-calibre executives by rewarding them appropriately
with competitive compensation and benefit packages. The policy seeks to align the interests of Executive Directors with the
performance of the Company and the interests of its shareholders.
Our incentive arrangements are designed to reward performance on our key performance indicators. Our aim is to focus
management on delivering sustainable long-term performance and support the retention of critical talent.
Total remuneration in 2015 §The table below sets out the total remuneration received by each Director for the year to 31 December 2015.
Salary or fees
£000
Benefits
£000
Annual bonus
(cash and
deferred shares)
£000
Long-term
incentive
(PSP)
£000
Pension
£000
Total
remuneration
£000
Director 2015 2014 2015 2014 2015 2014 2015 2014 2015 2014 2015 2014
Executive
David Fischel 560 545 20 20 646 425 259 – 168 164 1,653 1, 154
Matthew Roberts 442 427 20 20 510 327 199 – 106 103 1,277 877
Chairman
Patrick Burgess 407 400 8 7 – – – – – – 415 407
Independent Non-Executive
Adèle Anderson 78 76 – – – – – – – – 78 76
Andrew Huntley 79 77 – – – – – – – – 79 77
Louise Patten 70 66 – – – – – – – – 70 66
Neil Sachdev 91 89 – – – – – – – – 91 89
Andrew Strang 63 61 – – – – – – – – 63 61
Rakhi (Parekh) Goss-Custard
(appointed 7 October 2015) 15 – – – – – – – – – 15 –
John Strachan
(appointed 7 October 2015) 14 – – – – – – – – – 14 –
Other Non-Executive
Richard Gordon 58 56 – – – – – – – – 58 56
John Whittaker1 – – – – – – – – – – – –
Total 1,877 1,797 48 47 1,156 752 458 – 274 267 3,813 2,863
1 John Whittaker did not receive any remuneration in 2015 or 2014 in connection with his position as Deputy Chairman and Non-Executive Director of the Company.
A management fee of £207,500 was paid to Peel Management Limited for the provision by Peel of management and advisory services, as further described on page 89.
The figures have been calculated as follows:
— Base salary: amount earned for the year.
— Benefits: the taxable value of annual benefits received in the year. The main benefits are life assurance, long-term sickness insurance, private healthcare and company
car cash allowance. The value of the company car cash allowance is £18,000.
— Pension: the value of the Company’s contribution during the year (30 per cent salary supplement in lieu of contributions for the Chief Executive, 24 per cent SIPP
contribution, part taken as a salary supplement in lieu of SIPP contributions, for the Chief Financial Officer).
— Annual bonus (cash and deferred): the value at grant of the annual incentive payable for performance over 2015.
— PSP: awards made in 2013, one third subject to each of three-, four- and five-year performance periods. The amount shown is the amount due to vest in respect of the first
tranche, with a three-year performance period to 31 December 2015 and calculated using a three month average share price of £3.28. Further information regarding the
vesting can be found on page 83.
intu properties plc Annual report 201580

Performance out-turns and incentivesAnnual bonus §
The maximum award for both the Chief Executive and Chief Financial Officer in 2015 was 120 per cent of salary, of which 50 per cent
is deferred for two and three years. This will remain unchanged for 2016.
Annual bonus payments are based on pre-determined performance measures. Two-thirds is based on adjusted EPS performance in
the year, split evenly between performance versus budget and prior year figures. The overall structure ensures that the maximum
EPS related bonus is only achievable if management deliver both the Board’s expectations for the year and if there is an increase in
EPS on the prior year.
The remaining third is based on achievement of strategic and operational objectives against a scorecard of measures. The
Remuneration Committee considers the objectives carefully each year to align with intu’s strategic objectives, and include
quantitatively assessed financial and operational measures and milestones. Each objective relates directly to the strategic plan.
Under the scorecard approach, the weightings of each objective vary between Executive Directors to reflect their roles and
responsibilities. For 2016, the scorecard will include objectives in the following key areas:
— optimising assets
— key capital expenditure projects
— building the intu brand and delivering customer experience
— maximising the growth opportunities internationally
— financial flexibility
— talent development and staff engagement.
Annual bonus – 2015 out-turn §
Performance against the targets for the 2015 short-term incentive arrangements is given below. As in previous years, full
retrospective disclosure of financial targets is provided.
Performance element Weighting
Target 2015
performance
Out-turn
(% max element)Threshold Target Maximum
Adjusted EPS vs. budget 33% 12.5p 13.2p 13.9p 14.2p 100%
Adjusted EPS vs. prior year 33% 100% 102.5% 105% 106.8% 100%
Scorecard of strategic and
operational measures
David Fischel Matthew Roberts
33% See details of scorecard achievements 86% 86%
Total 95.3% 95.3%
The strategic objectives in the annual bonus are a key part of the remuneration framework for incentivising and rewarding
achievements and milestones which are the foundation for value creation in the future. The Committee follows a rigorous
process in the setting and monitoring of scorecard objectives and then exercises judgement in assessing performance in the
key areas selected. This includes determination of objectives by reference to the approved Board strategy, quarterly reviews of
quantitative and qualitative data, and an end of year full review with supporting evidence, to ensure a robust assessment of
performance against the objectives.
intugroup.co.uk 81GovernanceDirectors’ remuneration report

Directors’ remuneration report continued
For 2015, the scorecard weightings and out-turns were as follows:
Scorecard Weighting Summary achievement against objectives
(Including specific objectives
under each area of focus)
David
Fischel
Matthew
Roberts
Optimising performance
of existing assets
25% 20% — Delivery of key strategic priorities, including year-on-year improvement in
net rental income in 2015
— Material outperformance of IPD index and other industry benchmarks
— Strong regional and centre specific strategic delivery, together with active
management initiatives, contributing to strong pan-portfolio performance in
UK and Spain
UPPER QUARTILE ACHIEVEMENT
Progress on key capital
expenditure projects
20% 20% — Good progress with existing centre developments, with construction phases at both
intu Victoria Centre, Nottingham (restaurants and reconfigurations) and intu Potteries,
Stoke-on-Trent (cinema and restaurants) completed to schedule
— Renovation projects commenced at intu Bromley, intu Eldon Square and
intu Metrocentre
— Improvements to forecast returns, including yields, for extensions and renovated
centres through construction phases
— Achievement of planning and pre-construction milestones for Charter Place
redevelopment at intu Watford, commencing construction in early 2016 and supported
by exchange for anchor tenancy with Debenhams; planning progress made for
extension at intu Broadmarsh, Nottingham, on track to commence construction in 2017
UPPER QUARTILE ACHIEVEMENT
Branding and
customer relationships
20% 15% — Significant outperformance across net promoter score performance measures and
targets in year, following introduction in 2014
— Clear improvement against new ‘Baseline Spontaneous Awareness’ metric
— Continued integration of digital offering, including further strengthening of online,
wifi and mobile infrastructure and content in accordance with digital strategy
— Strong performance by digital operations against financial budget and traffic
KPI measures
UPPER QUARTILE ACHIEVEMENT
Financial flexibility 10% 20% — Maintained financial flexibility throughout 2015, exceeding the Board’s minimum
headroom threshold throughout year
— Centre-specific refinancing projects successfully delivered
— Financing strategy for 2016 and subsequent years well progressed, in particular for
newly acquired Spanish centres and development pipeline
MAXIMUM ACHIEVEMENT
International growth
opportunity
15% 15% — Spanish centres both delivering net rental income improvements, and valuation uplifts
in excess of forecast at acquisition
— Acquisition and integration of Puerto Venecia, Zaragoza delivered, with strategic joint
venture with existing partner CPPIB agreed in June
— Planning approval for intu Costa del Sol advancing well, with regional government
approval anticipated in 2016
UPPER QUARTILE ACHIEVEMENT
Talent development
and staff engagement
10% 10% — Strong improvement in employee satisfaction, by 23 points to 769 (2014: 747)
— ‘Second tier’ talent management initiative delivered to support the leadership
development program commenced in 2014
— Phased introduction of enhanced leadership training modules
UPPER QUARTILE ACHIEVEMENT
The resulting total short-term incentive payouts for David Fischel and Matthew Roberts in respect of 2015 were 114.4 per cent and
114.4 per cent of salary (95.3 per cent and 95.3 per cent of maximum opportunity), respectively.
intu properties plc Annual report 201582

Deferral into shares
50 per cent of the 2015 short-term incentive for both David Fischel and Matthew Roberts was deferred into shares of the Company.
Executive Directors must remain in employment with the Company for a period of two years (half of award) and three years
(half of award) after the date of award before such shares are released.
Long-term incentives §Awards with performance periods ending in the year – Performance Share Plan (PSP)
The LTIP awards shown in the single figure relate to the first tranche of the 2013 PSP awards which is due to vest in May 2016.
The second and third tranches of this award are due to vest in May 2017 and May 2018 respectively.
The performance condition was as follows:
— half of awards vest by reference to TSR relative to the top-five UK-listed REITs with 25 per cent minimum vesting for TSR in line
with the third-ranked company; vesting of 60 per cent for TSR in line with the second-ranked company; full vesting for TSR in
line with the top-ranked company; and straight line vesting between points, proportionate to TSR achieved. This portion is also
subject to a committee-operated discretionary assessment of underlying financial performance
— half of the awards vest by reference to Absolute Total Return (NAV growth per share plus dividends) with 25 per cent minimum
vesting for 6 per cent per annum; full vesting for 10 per cent per annum; straight-line vesting in between). Awards will lapse for
growth of less than 6 per cent per annum
Over the three-year period to 31 December 2015:
— intu’s TSR was ranked 6th against the comparator group resulting in 0 per cent vesting for this element of the tranche.
— Absolute Total Return was 8.7 per cent per annum resulting in 75.3 per cent vesting for this element of the tranche.
Based on the above performance the Remuneration Committee has determined that 37.6 per cent of the first tranche of the
2013 PSP awards will vest in May 2016.
Awards granted during the year §
This table summarises awards granted during the year in March 2015:
Individual Type of interest
Face value of 2015 award* % vesting
at threshold
Performance period end
£ % of salary 3 years 4 years 5 years
David Fischel PSP**
(nil cost options)
1,364,000 250% 25%
31 December
2017
31 December
2018
31 December
2019
Matthew Roberts 1,075,000 250% 25%
31 December
2017
31 December
2018
31 December
2019
David Fischel Deferred
bonus award
(restricted shares)
213,000 38.3%
Matthew Roberts 169,000 38.3%
* Face value calculated using an average share price at date of grant of £3.49 for the PSP and £3.49 for the Deferred Bonus Award.
** Vesting of awards is based 50 per cent on relative TSR and 50 per cent on Absolute Total Return (NAV growth per share plus dividends) performance, with targets equivalent
to the 2016 award.
intugroup.co.uk 83GovernanceDirectors’ remuneration report

Directors’ remuneration report continued
Awards for 2016
Awards for 2016 will be 250 per cent of salary.
Awards under the plan vest one-third after each of three, four and five years.
A summary of the applicable targets are as follows:
Absolute Total Return
(NAV growth per share plus dividends)
(50% of award)
Total Shareholder Return relative to top-five UK-listed REITs
(50% of award)
Minimum vesting (25% of element vesting) 6 per cent per annum TSR in line with the third-ranked company
Full vesting (100% of element vesting) 10 per cent per annum TSR in line with the top-ranked company
Straight line vesting between points Straight line vesting between points, proportionate
to TSR achieved, with 60% vesting for TSR in line with
the second-ranked company. Subject to a Committee-
operated discretionary assessment of underlying
financial performance
Malus and clawbackShares awarded under the deferred bonus plan and the performance share plan are subject to malus provisions. The Committee
may apply malus at its discretion in circumstances including (but not limited to):
— a material misstatement of the Company’s audited financial results
— a material failure of risk management by the Company, any Group company or business unit
— a material breach of any applicable health and safety or environmental regulations by the Company, any Group company
or business unit
— serious reputational damage to the Company, any Group company or business unit
— serious misconduct of the individual
The annual bonus and the performance share plan (PSP) are also subject to clawback provisions. The Committee may at its
discretion seek to apply clawback in circumstances of:
— a material misstatement of the Company’s audited financial results where the individual is responsible or accountable
(and where Executive Directors would always be deemed to have management responsibility)
— serious misconduct of the individual
Clawback provisions may be applied up to two years following the determination of the annual incentive and up to one further
year following vesting for awards under the performance share plan. Taking into account the three, four and five year vesting
timescales, this means that PSP awards may be reclaimed for up to four, five and six years, respectively, from the date of award.
Other share scheme informationThe Company operates an employee share ownership plan (‘ESOP’) which has in the past used funds provided to purchase shares
required under the annual bonus scheme.
The Company operates a share incentive plan (‘SIP’) for all eligible employees, including Executive Directors, who may receive up to
£3,600 worth of shares as part of their annual bonus arrangements. As part of the SIP arrangements, the Company offers eligible
employees the opportunity to participate in a ‘partnership’ share scheme, the terms of which are governed by HM Revenue &
Customs regulations.
intu properties plc Annual report 201584

Season ticket loanAll employees of the Group are entitled to an interest-free travel season ticket loan which is repaid over the year via deductions
from salary. Neither David Fischel nor Matthew Roberts received a season ticket or other loan from the Group during 2015.
Chief Executive pay increase in relation to all employeesThe table below sets out details of the percentage change in salary, benefits and annual bonus for Chief Executive and wider
employee comparator group. For these purposes, head office employees (who have been in employment over both periods)
have been used as a comparator group as this is considered to be a reasonable, practical sub-set of the all-employee population.
Percentage change in remuneration from
31 December 2014 to 31 December 2015
Percentage change
in base salary
Percentage change
in benefits
Percentage change
in annual bonus
Chief Executive 3.6% (0.7)% 51.9%
Head office employees 5.7% 0.7% 33.6%
Shareholding and share interests §Executive Directors must build up, over a period of three to five years, a holding of intu shares with a value equivalent to
200 per cent of salary (David Fischel) and 150 per cent of salary (Matthew Roberts). This requirement has been effective
from 1 January 2013.
The graph below illustrates the shareholdings of the Executive Directors as a percentage of salary. Note that only actual holdings
count towards the shareholding requirements. Shares subject to deferral and/or performance conditions have also been shown
for reference.
Shareholding of intu ordinary shares as at 31 December 2015 (% of salary)*
David Fischel
Matthew
Roberts
Actual shareholding
Deferred shares
Unexercised share options (vested)
Shares subject to performance conditions
Shareholding requirement
0
£000
250 500 750 1,000 1,250 1,500 1,750 2,000 2,250 2,500
* Value of shareholding calculated based on 12 month average share price to 31 December 2015.
As shown above, both David Fischel and Matthew Roberts have exceeded their shareholding requirements.
intugroup.co.uk 85GovernanceDirectors’ remuneration report

The table below sets out the Directors’ interests in shares as at 31 December 2015.
Number of shares owned
(including connected persons)
Unvested awards Vested awards
Conditional shares not subject
to performance conditions
Held in
own name
Held in SIP
trust for
> 5 years
Deferred
Shares
Held in SIP
trust for
< 5 years
PSP
subject to
performance
conditions1
Options
subject to
performance
conditions
Unexercised
unapproved
options 2
Unexercised
approved
options
Options
exercised in
the year 3
Executive
David Fischel 993,534 5,963 120,206 10,273 1,488,342 – 1,469,021 12,906 1,469,021
Matthew Roberts 213,133 – 95,364 8,384 1,152,390 – 511,339 11,203 511,339
1 PSP awards held as fixed-value zero-cost options and jointly owned shares.
2 Held as jointly owned shares. The outstanding options represent the unexercised element of the jointly owned shares portion of the 2009 unapproved options.
3 On 9 March 2015, David Fischel exercised capped options granted in 2009 and 2010 and Matthew Roberts exercised capped options granted in 2010. These capped options
formed part of the jointly owned shares arrangement.
4 Outstanding share awards were adjusted as a result of the 25 April 2014 rights issue.
5 No changes in the interests of Directors have occurred between 31 December 2015 and 26 February 2016.
Vested
2009 ESOS awards Awards of market value share options, with an exercise price of 232.41 pence. These awards became
exercisable on 28 February 2013 and may be exercised until 28 May 2019.
2010 ESOS awards Awards of market value share options, with an exercise price of 267.75 pence. These awards became
exercisable on 26 May 2013 and may be exercised until 26 May 2020.
Unvested
2013 PSP award Awards of performance shares, granted on 21 May 2013. Vesting is based on TSR (relative to the top five
UK-listed REITs) and Absolute Total Return performance (ranging from 6 per cent pa to 10 per cent pa), in
three equal tranches over three, four and five years. Any awards that vest may be exercised until 21 May 2023.
2014 PSP award Awards of performance shares, granted on 12 May 2014. Vesting is based on TSR (relative to the top five
UK-listed REITs) and Absolute Total Return performance (ranging from 6 per cent pa to 10 per cent pa), in
three equal tranches over three, four and five years. Any awards that vest may be exercised until 12 May 2024.
2015 PSP award Awards of performance shares, granted on 11 March 2015. Vesting is based on TSR (relative to the top five
UK-listed REITs) and Absolute Total Return performance (ranging from 6 per cent pa to 10 per cent pa), in
three equal tranches over three, four and five years. Any awards that vest may be exercised until 11 March 2025.
Seven-year TSR chartThe following graph shows the Total Shareholder Return (TSR) for intu properties plc over the seven-year period ended
31 December 2015, compared with our closest comparator group for this purpose, the FTSE 350 Real Estate. TSR is defined as share
price growth plus reinvested dividends.
1 Jan 2009 31 Dec 2009 31 Dec 2010 31 Dec 2011 31 Dec 2012 31 Dec 2013 31 Dec 201531 Dec 2014
0
50
100
150
250
200
intu properties plc
FTSE 350 Real Estate
Seven-year Total Shareholder Return (TSR) performance
intu properties plc Annual report 201586
Directors’ remuneration report continued

UK real estate is a cyclical sector. Since 2009, a key driver for growth in value within the UK real estate market has been exposure
to central London properties. As a result of the demerger of Capital & Counties from Liberty International (now intu properties plc)
in 2010, intu’s portfolio does not include properties in central London and intu has therefore not benefited from the recent uplift
experienced by those property companies with exposure to London. However, given the cyclical nature of the property sector,
we would not expect this trend to endure over the long-term cycle.
For additional context, the following graph shows the Absolute Total Return (NAV growth plus dividends).
2009 2010 2011 2012 2013 2014 2015
0
10
20
30
50
60
40
Absolute Total Return (cumulative) (%)
Chief Executive remuneration historyThe table below sets out historical details of Chief Executive pay.
2009 2010 2011 2012 2013 2014 2015
CEO single figure of total remuneration £1,044k £1,350k £1,275k £1,810k £1,081k £1,154k £1,653k
Annual bonus payout (% maximum) 50% 100% 83% 70% 55% 65% 95.3%
Long-term incentive plan vesting in year (% maximum) 0% 0% 0% 100% 0% 0% 37.6%
Shareholder contextThe table below shows the advisory vote on the 2014 Directors’ remuneration report at the 2015 AGM. It is the Committee’s policy to
consult with major shareholders prior to any major changes, and to maintain an ongoing dialogue on executive remuneration matters.
For Against Abstentions
2014 Annual Remuneration Report 91.36% 8.64% 0.6m
Additional disclosuresOther directorships
Executive Directors are not generally encouraged to hold external directorships unless the Chairman determines that such
appointment is in the Group’s interest and does not cause any conflict of interest. Where such appointments are approved and
held, it is a matter for the Chairman to agree whether fees paid in respect of the appointment are retained by the individual or
paid to the Company.
During 2015, David Fischel held three external directorships. His principal external appointments were with Equity One, Inc.
and Prozone Intu Properties Limited. Equity One, Inc. is a US real estate investment trust with which intu operated a US venture
controlled by Equity One until 19 January 2016 and at this point David Fischel stepped down as a Non-Executive Director.
Prozone Intu Properties Limited is an Indian shopping centre owner and developer in which intu has a 33 per cent interest.
David Fischel also holds an external appointment as a Non-Executive Director of Marlowe Investments (Kent) Limited, a UK private
company which relates to his family affairs and does not require any significant time commitment and does not conflict in any way
with his role as Chief Executive of intu.
During 2015, David Fischel did not receive a fee in respect of his appointment as a Non-Executive Director of Prozone Intu Properties
Limited. He received a fee of $65,500 in respect of his directorship of Equity One, Inc. He retained the fees paid in respect of his
appointment with the Board’s consent. In addition to his fee, restricted stock in Equity One, Inc. awarded to David Fischel vested
during the year with a value on vesting of $95,253. He also received and retained a fee of £5,000 in respect of his non-executive
directorship of Marlowe Investments (Kent) Limited.
intugroup.co.uk 87GovernanceDirectors’ remuneration report

Payments to former Directors §
A life presidency fee of £150,000 per annum (2014: £150,000) was paid to Sir Donald Gordon, the Group’s Life President and former
Chairman who founded the Company in 1980. The life presidency fee was agreed by the Board at the time of his retirement in June
2005 in recognition of his outstanding contribution to the Group. The payment is payable for the remainder of Sir Donald’s life and is
secured by deed.
Payments for loss of office §
There were no payments for loss of office made to Directors in the year.
Alternate Directors §
Steven Underwood and Raymond Fine serve as Alternate Directors to John Whittaker and Richard Gordon respectively. Neither
Steven Underwood nor Raymond Fine received any fees in 2015 in respect of their appointment as Alternate Directors. Raymond
Fine received a fee of £164,864 in respect of consultancy services provided to the Company in connection with South African tax and
shareholder issues (particularly in respect of South African dividends tax), liaison with the Gordon Family and other related matters.
Service contractsExecutive Directors and the Chairman have rolling service contracts which are terminable on 12 months’ notice on either side.
All Non-Executive Directors have been appointed under letters of appointment on fixed terms of two or three years, subject to
renewal thereafter. Richard Gordon is deemed to have served for more than nine years and is now subject to a one-year term.
All are subject to annual re-election by shareholders.
Notice period
David Fischel 12 months
Matthew Roberts 12 months
Patrick Burgess 12 months
Contract term expires
Adèle Anderson 2016 AGM
Richard Gordon 2016 AGM
Andrew Huntley 2017 AGM
Rakhi (Parekh) Goss-Custard* 2019 AGM
Louise Patten 2017 AGM
Neil Sachdev 2016 AGM
John Strachan* 2019 AGM
Andrew Strang 2018 AGM
John Whittaker 2017 AGM
* Newly appointed directors, terms subject to election at 2016 annual general meeting.
Distribution statementThe table below shows the percentage change in underlying earnings, dividends, and total employee compensation spend from the
financial year ended 31 December 2014 to the financial year ended 31 December 2015.
The Group employed an average number of staff of 2,446 during the financial year to 31 December 2015 (2014: 2,177).
Underlying earnings (£m) +15.4%
0
40
80
120
200
160
£162m £187m
2014 2015
0
40
80
120
200
160
Dividend (£m) +15.1%*£156m £179m
2014 2015
* Increase due to issued share capital.
Dividend per share was £0.14 (2014: £0.14).
Total employee pay expenditure (£m) +8%**
20
0
40
60
80 £72.3m £77.9m
2014 2015
** 2014 includes full year impact of intu Retail Services
for first time. Average increase in staff salaries for
2015 was 5.7 per cent.
intu properties plc Annual report 201588
Directors’ remuneration report continued

Chairman and Non-Executive Director fees for 2016 §The Chairman receives a fee of
£410,000 per annum.
The basic Non-Executive Director fee
is £59,000 per annum. The Senior
Independent Director receives an
additional fee of £10,000 per annum.
Committee Chairmen receive £15,000
per annum, and Committee members
receive £5,000 per annum. Fees were
last increased in April 2015 and will
remain unchanged in 2016.
John Whittaker does not receive a fee
in respect of his position as Deputy
Chairman and Non-Executive Director.
The Board has authorised the payment
of a management fee of £210,000 per
annum to Peel Management Limited for
the provision by Peel of a Non-Executive
Director and an Alternate Director and
other management and advisory
services, together with reasonable
costs and out-of-pocket expenses.
The management fee was last reviewed
and increased with effect from April
2015. It is anticipated that the agreement
will be renewed annually thereafter by
agreement between the parties. This
payment is disclosed in the related party
transactions note on page 153.
Remuneration Committee membership in 2015The principal responsibilities of the
Committee, which take full account of
the recommendations contained within
the Code, include:
— determining the remuneration
policy for the Company’s Executive
Directors and senior executives
— determining individual remuneration
packages for the Chairman, Executive
Directors and senior executives
— setting appropriately stretching and
achievable targets for the Company’s
incentive schemes in order to motivate
executives to deliver high levels of
performance in the interests of our
shareholders, customers and employees
— overseeing any significant changes
to remuneration policy for the wider
employee population
The full duties and responsibilities are
set out in the terms of reference of the
Committee which are available on the
Company’s website.
The Remuneration Committee
currently comprises four independent
Non-Executive Directors. Throughout
the year the Committee consisted of Neil
Sachdev, Louise Patten, Adèle Anderson
and Andrew Huntley (who joined the
Committee in November 2015). During
the year Louise Patten took over from
Neil Sachdev as the Remuneration
Committee Chairman. Neil Sachdev
will not be seeking re-election at the
May 2016 AGM.
The Chairman, Chief Executive, Company
Secretary, HR Director and on occasion
Chief Financial Officer are invited to
attend Committee meetings to contribute
to the Committee in its deliberations.
However, no individual is present when his
or her remuneration is being determined.
The Remuneration Committee met a
total of six times in 2015, including four
scheduled meetings and two additional
drafting meetings. A summary of
attendance at each scheduled meeting
is set out on page 78.
Advisers to the CommitteeDeloitte LLP was appointed as the
Committee’s independent remuneration
adviser in October 2013, following a
competitive tender process.
During the year, Deloitte provided
advice on remuneration governance
developments, corporate reporting
and investor engagement, market data
and other remuneration matters that
materially assisted the Committee.
Representatives also attended
Committee meetings during the year.
The fees paid to Deloitte in respect
of this work in 2015 totalled £75,750.
During the year Deloitte also
provided to the Group tax compliance
services, share scheme advice and
financial advisory planning services
in relation to intu Trafford Centre
and intu Milton Keynes.
Deloitte is a founding member of the
Remuneration Consultants Group, and
adheres to its code of conduct. Deloitte
was appointed directly by the Committee
and the Committee is satisfied that
the advice received was objective
and independent.
The Committee also makes use of various
published surveys to help determine
appropriate remuneration levels.
On behalf of the Board
Louise Patten
Chairman of the
Remuneration Committee
26 February 2016
intugroup.co.uk 89GovernanceDirectors’ remuneration report

Appendix: Policy table extract from the Directors’ remuneration policy approved by shareholders on 8 May 2014.A full copy of our Directors’ remuneration policy, binding for three years from May 2014, is included in the 2013 annual report
(starting on page 83), which can be found on the Company’s website, at intugroup.co.uk/investors/reports-presentations/
annual-report-2013/. The Directors’ remuneration policy was approved by 99.77 per cent of share holders at the 2014 annual
general meeting.
Element and link to strategy Operation Maximum potential value Performance metrics
Executive Directors
Base salary
To provide an appropriately
competitive level of base pay
to attract and retain talent.
Reviewed annually.
Salary levels take account of:
— size and nature of the responsibilities
of each role
— market pay levels for the role
— increases for the rest of the Group
— the executive’s experience
— changes to the size and complexity of
the Group
— implications for total remuneration
— overall affordability
— individual and Company performance
The Committee may award an
out-of-cycle increase if it considers
it appropriate.
Base salary increases may be
applied, taking into account the
factors considered as part of
the annual review. There is no
maximum increase or opportunity.
For new appointments salaries may
be set at a lower level. In such cases,
there may be scope for higher than
usual salary increases in the first
three years as the individual
progresses in the role.
None.
Pension
To help provide for an
appropriate retirement benefit.
The Company operates an
approved defined contribution
pension arrangement.
A cash alternative may be offered in
certain circumstances, for example
where HMRC statutory limits have
been reached.
Company pension contribution
is 24 per cent of base salary.
The Chief Executive receives an
additional 6 per cent of salary in
recognition of the additional value
of the benefit foregone on the
closure of the defined benefit
scheme. This amount was
actuarially determined to be
cost-neutral to the Company.
None.
Other benefits
To provide an appropriately
competitive level of benefits.
Benefits include a car allowance, private
medical insurance, life assurance and
long-term sickness insurance. Other
benefits may be provided if the
Committee considers it appropriate.
In the event that an Executive Director
is required by the Group to relocate,
benefits may include, but are not
limited to, relocation allowance and
housing allowance.
Car allowance of up to £18,000
per annum.
The cost of insurance benefits may
vary from year to year depending on
the individual’s circumstances.
There is no overall maximum
benefit value but the Committee
aims to ensure that the total value
of benefits remains proportionate.
None.
Short-term incentive
To align annual reward with
annual performance and to
support retention and
alignment with shareholders’
interests through significant
deferral of bonus into shares.
intu operates a short-term incentive
arrangement with a maximum
individual opportunity.
A proportion of any earned bonus
is normally deferred in intu shares,
vesting over two years and three years,
subject to continued employment.
The Committee awards dividend
equivalents in respect of dividends over
the deferral period which may assume
reinvestment on a cumulative basis.
The Committee has discretion to apply
malus to unvested deferred bonus
awards in certain circumstances
including if there is a material
misstatement in the annual financial
statements or a material failure of
risk management.
Maximum annual opportunity of
120 per cent of salary.
Executives’ performance is measured
relative to targets in key financial,
operational and strategic objectives
in the year.
The measures selected and their
weightings vary each year according
to the strategic priorities, however at
least two thirds will be based on Group
financial measures or quantitative
reported key performance indicators.
Entry award level for financial
measures is normally between
0 and 25 per cent of maximum.
intu properties plc Annual report 201590
Directors’ remuneration report continued

Element and link to strategy Operation Maximum potential value Performance metrics
Executive Directors (continued)
Long-term incentives
To reward good long-term
decisions which help grow
the value of intu over a three
to five-year horizon and
support the retention of
critical executives.
intu operates a performance share
plan (‘PSP’), which was approved by
shareholders at the 2013 AGM.
Grants are made to eligible employees
at the discretion of the Committee.
Awards can be made as performance
shares, nil-cost options or jointly owned
equity, and vest one third, one third,
one third after three, four and five
years respectively.
The Committee awards dividend
equivalents in respect of dividends over
the vesting period, which may assume
reinvestment on a cumulative basis.
The Committee has discretion to apply
malus to unvested awards in certain
circumstances including if there is a
material misstatement in the annual
financial statements or a material failure
of risk management by the Company.
Normal maximum grant size of
250 per cent of salary per annum.
In exceptional circumstances
opportunity of up to 375 per cent
of salary. To ensure that participants
were not unduly disadvantaged as
a result of the move towards longer
time horizons, the first award under
the plan had an opportunity of
375 per cent.
Long-term incentive performance
conditions are reviewed on an annual
basis, and are chosen to be aligned
with the long-term success of
the business.
The intention is that measures will
be one or more of TSR, total return/
NAV growth, EPS growth, relative total
property return or return on capital.
For 2014, awards will be based:
— 50 per cent on relative TSR
— 50 per cent on total return
(NAV growth plus dividends)
If the Committee considers that the
level of vesting based on the extent
to which the performance conditions
have been satisfied is not a fair
reflection of underlying financial
performance, the Committee may
adjust the level of vesting (upwards
or downwards) accordingly. For the
current performance measures this
applies to the TSR portion only.
Entry vesting is 25 per cent
of maximum.
All employee share plans
To align interests of employees
with Company performance.
Executive Directors may participate in
the HMRC-approved share incentive
plan (SIP) on the same basis as
all employees.
Participants can contribute up
to the relevant HMRC limit.
None.
Non-Executive Directors
Fees
To remunerate
Non-Executive Directors
Independent Non-Executive Directors
The Chairman’s fees are determined by the Remuneration Committee.
The Non-Executive Directors’ fees are determined by the Board.
The level of fees takes into account the time commitment, responsibilities,
market levels and the skills and experience required.
Non-Executive Directors normally receive a basic fee and an additional
fee for specific Board responsibilities, including membership and chairmanship
of committees.
The Chairman is entitled to receive certain benefits in addition to fees as
detailed on page 87 of the 2013 annual report.
Additional fees may be paid to Non-Executive Directors on a per diem basis
to reflect increased time commitment in certain limited circumstances.
Expenses incurred in the performance of non-executive duties for the Company
may be reimbursed or paid for directly by the Company, as appropriate,
including any tax due on the expenses.
None.
Other Non-Executive Directors
In addition to the above, in certain circumstances Non-Executive Directors.
(other than those deemed to be independent) may receive a fee in relation
to consultancy services (including alternate Directors).
Such fees may be provided directly to the Director or, in certain circumstances,
paid to a third-party company under a consultancy services agreement. Such
agreements may provide for the payment of an annual fee and reimbursement
of expenses.
Such an agreement is currently in place with the Peel Group for the provision
of non-executive director services (including alternative director services).
None.
intugroup.co.uk 91GovernanceDirectors’ remuneration report

The Directors present their annual
report and the audited financial
statements of the Group and Company
for the year ended 31 December 2015.
Pages 2 to 93 inclusive of this annual
report comprise the Directors’ report
that has been drawn up and presented
in accordance with English company
law and the liabilities of the Directors
in connection with that report will be
subject to the limitations and restrictions
provided by such law.
Use of financial Instruments The financial review on pages 46 to 51,
accounting policies on pages 109 to 113
and note 35 on pages 136 to 141 contain
information on the use of financial
instruments.
Dividends The Directors declared an interim
ordinary dividend of 4.6 pence (2014: 4.6
pence) per share on 30 July 2015, which
was paid on 24 November 2015, and have
recommended a final ordinary dividend
of 9.1 pence per share (2014: 9.1 pence).
Share capital and control of the Company Details of the Company’s share capital
including changes during the year in the
issued share capital and details of the
rights attaching to the Company’s
ordinary shares are set out in note
37 on pages 142 and 143.
No shareholder holds securities carrying
special rights with regard to control of the
Company. Shares held by the Company’s
employee share ownership plan rank pari
passu with the shares in issue and have no
special rights, but voting rights and rights
of acceptance of any offer relating to the
shares rest with the plan’s Trustee and are
not exercisable by the employees. There
are no restrictions on voting rights or
any arrangements by which, with the
Company’s co-operation, financial rights
are held by a person other than the
shareholder, or any agreements between
shareholders known to the Company
which may result in restrictions on the
transfer of shares or on voting rights.
Under a £600 million revolving-facility
agreement dated 25 February 2009 (as
amended and restated on 19 February
2010, 18 November 2011, and 30 October
2014) between, among others, the
Company and HSBC Bank PLC (as
‘Agent’)on a change of control, if directed
by a lender, the Agent may by notice to
the Company cancel the commitment of
that lender and declare the participation
of that lender in all outstanding loans,
together with accrued interest and all
other amounts accrued and owing to
that lender under the finance documents,
immediately due and payable.
Under the terms and conditions of the
£300 million 2.5 per cent Guaranteed
Convertible Bonds issued on 4 October
2012 by Intu (Jersey) Limited (the ‘Issuer’)
and guaranteed by the Company, on
a change of control of the Company
bondholders would have a right for a
limited period of 60 days to exercise their
exchange rights at an enhanced exchange
price (ie lower than the prevailing
exchange price). In addition, bondholders
would become entitled for a limited
period of 60 days to require the Issuer
to redeem their bonds at their principal
amount, together with accrued and
unpaid interest.
The Company is not party to any other
significant agreements that would take
effect, alter or terminate following a
change of control of the Company.
The Company does not have any
agreements with any Executive
Director or employee that would
provide compensation for loss of office
or employment resulting from a takeover
except that provisions of the Company
share schemes may cause options and
awards outstanding under such schemes
to vest on a takeover. The terms of
appointment of the Non-Executive
Directors currently provide that in the
event of change of control, the Directors
will be compensated for any additional
time commitment in certain limited
circumstances, to be calculated on a
per diem basis.
Internal control The statement on corporate governance
on pages 58 to 93 includes the Board’s
assessment following a review of internal
controls and consideration of the 2005
Financial Reporting Council’s internal
control guidance for directors.
DirectorsThe Directors of intu who held office
during the year were as follows:
Chairman
Patrick Burgess
Deputy Chairman
John Whittaker1
Executive
David Fischel
Matthew Roberts
Non-Executive
Adèle Anderson
Richard Gordon1
Andrew Huntley
Rakhi (Parekh) Goss-Custard
(appointed with effect 7 October 2015)
Louise Patten
Neil Sachdev
John Strachan
(appointed with effect 7 October 2015)
Andrew Strang
1 John Whittaker and Richard Gordon have appointed
Steven Underwood and Raymond Fine respectively
as their alternates under the terms of the
Company’s Articles of Association.
In accordance with provision B.7.1 of
the UK Corporate Governance Code,
all continuing directors are subject
to re-election, or election, at the
forthcoming annual general meeting.
Pursuant to the Articles of Association
of the Company, the Company has
indemnified the Directors to the full
extent allowed by law. The Company
maintains directors’ and officers’
insurance which is reviewed annually.
Additional information relating to the
Directors can be found in note 50 on
pages 158 and 159 on Directors’ interests,
in the governance section on pages 58 to
77, and in the Directors’ remuneration
report on pages 78 to 91.
Directors’ report
intu properties plc Annual report 201592

The powers of the Directors are
determined by UK legislation and the
Articles of Association of the Company,
together with any specific authorities
that may be given to the Directors by
shareholders from time to time, such
as the power to allot shares and the
power to make market purchases of
the Company’s shares which are
described in note 37 on page 143.
Articles of Association The rules governing the appointment and
replacement of Directors are contained
in the Company’s Articles of Association.
Changes to the Articles of Association
must be approved by shareholders in
accordance with the legislation in force
from time to time.
Substantial shareholdings The table at the foot of the page shows
the holdings of major shareholders in
intu’s issued ordinary shares as at 31
December 2015 and 19 February 2016.
Employees intu actively encourages employee
involvement and consultation and places
emphasis on keeping its employees
informed of the Group’s activities and
financial performance by such means
as employee briefings and publication
to all staff of relevant information and
corporate announcements. In 2015,
intu conducted one all-employee survey
covering a range of topics. More details
are provided in the our people section
on pages 56 and 57.
The annual bonus plan arrangements
help develop employees’ interest in the
Company’s performance; full details of
these arrangements are given in the
Directors’ remuneration report on pages
78 to 91. Note 50 on pages 158 to 159
contains details of conditional awards of
shares under the annual bonus scheme
and bonus shares currently outstanding.
intu operates a non-discriminatory
employment policy and full and fair
consideration is given to applications for
employment from people with disabilities
or other protected characteristics under
the Equality Act where they have the
appropriate skills and abilities, and to
the continued employment of staff
who become disabled.
intu encourages the continuous
development and training of its
employees and the provision of equal
opportunities for the training and career
development of disabled employees and
those with protected characteristics.
Further information relating to employees
is given on pages 56 to 57 and in note 8
on page 116. The Group provides
retirement benefits for the majority of its
employees. Details of the Group pension
arrangements are set out in note 48 on
page 158.
The environment We have an independent corporate
responsibility (CR) strategy and details
of our policies and the Group’s aims
alongside the latest full version of our
annual CR report are to be found on the
Company’s website. An overview of the
Group’s CR activity (which includes
disclosures relating to greenhouse gas
emissions) is on pages 52 to 55, and a
summary booklet is also available for
download from the website or on request
from the Company Secretary’s office.
The Company recognises the importance
of minimising the adverse impact on
the environment of its operations and
the obligation to carefully manage
energy and water consumption and
waste recycling.
The Company strives continuously to
improve its environmental performance.
The environmental management system
and associated environmental policy
and guide are regularly reviewed to
ensure that the Company maintains its
commitment to environmental matters.
Additional disclosures For the purpose of LR 9.8.4CR, the only
information required to be disclosed by
LR 9.8.4R relates to sub-section (1)
thereof (interest capitalised) where the
amount is £2.1 million (2014: nil) (see note
10 to the accounts). All other sub-sections
of LR 9.8.4R are not applicable.
Directors’ disclosure of information to the auditors So far as the Directors are aware,
there is no relevant audit information
of which the auditors are unaware and
each Director has taken all reasonable
steps to make himself or herself aware
of any relevant audit information and to
establish that the auditors are aware
of that information.
Auditors The auditors, PricewaterhouseCoopers
LLP, have indicated their willingness to
continue in office and a resolution seeking
to reappoint them will be proposed at the
forthcoming annual general meeting.
Annual general meeting The notice convening the 2016 annual
general meeting of the Company will
be published separately and will be
available on the Company’s website and
distributed to those shareholders who
have elected to receive hard copies of
shareholder information.
By order of the Board
Susan Marsden
Company Secretary
26 February 2016
Substantial shareholdersAt 31 December 2015 At 19 February 2016
Shareholder
Number of
shares notified
% interest in
share capital
Number of
shares notified
% interest
in share capital
The Peel Group 336,492,751 25.02 336,492,751 25.02
Coronation Asset Management
(Pty) Limited 194,601,724 14.47 188,804,760 14.04
The family interests of
Sir Donald Gordon 110,336,261 8.20 110,336,261 8.20
Black Rock, Inc. 78,363,390 5.83 78,363,390 5.83
Public Investment Corporation 90,197,225 6.71 89,433,457 6.65
intugroup.co.uk 93GovernanceDirectors’ report

Statement of Directors’ responsibilities The Directors are responsible for
preparing the annual report, the
Directors’ remuneration report and
the financial statements in accordance
with applicable law and regulations.
Company law requires the Directors
to prepare financial statements for
each financial year. Under that law the
Directors have prepared the Group and
Company financial statements in
accordance with International Financial
Reporting Standards (IFRSs) as adopted
by the European Union. Under company
law the Directors must not approve the
financial statements unless they are
satisfied that they give a true and fair view
of the state of affairs of the Group and
the Company and of the profit or loss of
the Group and Company for that period.
In preparing these financial statements,
the Directors are required to:
(a) select suitable accounting policies
and then apply them consistently
(b) make judgements and accounting
estimates that are reasonable
and prudent
(c) state whether applicable IFRSs as
adopted by the European Union have
been followed, subject to any material
departures disclosed and explained
in the financial statements
(d) prepare the financial statements on
the going concern basis, unless it is
inappropriate to presume that the
Company will continue in business
The Directors are responsible for keeping
adequate accounting records that are
sufficient to show and explain the
Company’s transactions and disclose
with reasonable accuracy at any time
the financial position of the Company
and the Group and enable them to ensure
that the financial statements and the
Directors’ remuneration report comply
with the Companies Act 2006 and, as
regards the Group financial statements,
Article 4 of the IAS Regulation. They are
also responsible for safeguarding the
assets of the Company and the Group
and hence for taking reasonable steps
for the prevention and detection of
fraud and other irregularities.
The Directors are responsible for
the maintenance and integrity of the
Company’s website. Legislation in
the United Kingdom governing the
preparation and dissemination of financial
statements may differ from legislation
in other jurisdictions.
The Directors consider that the annual
report and accounts, taken as a whole,
is fair, balanced and understandable and
provides the information necessary for
shareholders to assess the Company’s
and the Group’s performance, business
model and strategy. Each of the Directors,
whose names and functions are listed
in the governance section on pages
60 and 61 confirm that, to the best
of their knowledge:
(a) the Group financial statements,
which have been prepared in
accordance with IFRSs as adopted
by the European Union, give a true
and fair view of the assets, liabilities,
financial position and profit of
the group
(b) the Directors’ report includes a
fair review of the development and
performance of the business and the
position of the Group, together with
a description of the principal risks
and uncertainties that it faces
Signed on behalf of the Board on
26 February 2016
David Fischel
Chief Executive
Matthew Roberts
Chief Financial Officer
intu properties plc Annual report 201594

Accounts
Independent auditors’ report 96
Consolidated income statement 102
Consolidated statement of comprehensive income 103
Balance sheets 104
Statements of changes in equity 105
Statements of cash flows 108
Notes to the accounts 109
intugroup.co.uk 95Accounts

Independent auditors’ report to the members of intu properties plc
Report on the financial statements
Our opinion
In our opinion:
— intu properties plc’s Group financial statements and Company financial statements (the “financial statements”) give a true and
fair view of the state of the Group’s and of the Company’s affairs as at 31 December 2015 and of the Group’s profit and the
Group’s and the Company’s cash flows for the year then ended;
— the Group financial statements have been properly prepared in accordance with International Financial Reporting Standards
(“IFRSs”) as adopted by the European Union;
— the Company financial statements have been properly prepared in accordance with International Financial Reporting Standards
(“IFRSs”) as adopted by the European Union and as applied in accordance with the provisions of the Companies Act 2006; and
— the financial statements have been prepared in accordance with the requirements of the Companies Act 2006 and, as regards
the Group financial statements, Article 4 of the IAS Regulation.
What we have audited
The financial statements, included in the Annual Report, comprise:
— the Group and Company balance sheets as at 31 December 2015;
— the Group consolidated income statement and consolidated statement of comprehensive income for the year then ended;
— the Group and Company statements of changes in equity for the year then ended;
— the Group and Company statements of cash flows for the year then ended; and
— the notes to the accounts, which include a summary of significant accounting policies and other explanatory information.
Certain required disclosures have been presented elsewhere in the Annual Report, rather than in the notes to the accounts.
These are cross-referenced from the financial statements and are identified as audited.
The financial reporting framework that has been applied in the preparation of the financial statements is applicable law and IFRSs as
adopted by the European Union and, as regards the Company financial statements, as applied in accordance with the provisions of
the Companies Act 2006.
Our audit approach
Context
During the year to 31 December 2015, there have been no significant changes to business operations, investment property market
yields, or to accounting standards relevant to the Group. The most significant transactional activity was in relation to the acquisition
and subsequent part disposal of Puerto Venecia, Zaragoza, in Spain. As a result our audit approach is largely consistent with the
prior year, with the same recurring areas of focus.
Overview
Materiality — Overall Group materiality: £101 million (2014: £96 million) which represents 1 per cent of total assets
— Specific materiality: £9 million (2014: £8 million) which represents 5 per cent of underlying profit before tax
and associates
Audit scope — The Group and Company financial statements are produced by the Group’s central finance department using a single,
consolidated general ledger, and the whole business was subject to the same audit scope
Areas of focus — Valuation of investment properties
— Acquisition of Puerto Venecia, Zaragoza, and subsequent part disposal, resulting in the Group’s interest being
accounted for as a joint venture
The scope of our audit and our areas of focus
We conducted our audit in accordance with International Standards on Auditing (UK and Ireland) (“ISAs (UK & Ireland)”).
We designed our audit by determining materiality and assessing the risks of material misstatement in the financial statements. In
particular we looked at where the Directors made subjective judgements, for example in respect of significant accounting estimates
that involved making assumptions and considering future events that are inherently uncertain. As in all of our audits, we also
addressed the risk of management override of internal controls, including evaluating whether there was evidence of bias by the
Directors that represented a risk of material misstatement due to fraud.
The risks of material misstatement that had the greatest effect on our audit, including the allocation of our resources and effort, are
identified as “areas of focus” in the table below. We have also set out how we tailored our audit to address these specific areas in
order to provide an opinion on the financial statements as a whole, and any comments we make on the results of our procedures
should be read in this context. This is not a complete list of all risks identified by our audit.
intu properties plc Annual report 201596

Area of focus How our audit addressed the area of focus
Valuation of investment properties
The existence of significant estimation uncertainty, coupled with the
fact that only a small percentage difference in individual property
valuations, when aggregated, could result in a material change,
warrants specific audit focus in this area.
The Group’s investment properties are all shopping centres and
comprise the majority of the assets in the Group balance sheet, their
carrying value amounting to £8.4 billion. Refer to note 19. Additionally
the carrying value of the Group’s share of investment properties held
within joint ventures is £1.1 billion. Refer to note 22.
The valuation of the Group’s property portfolio is inherently subjective
due to, among other factors, the individual nature of each property,
its location and the expected future rental revenues for that
particular property.
The valuations were carried out by third party valuers, CBRE, Knight
Frank, Jones Lang LaSalle and Cushman & Wakefield (the “Valuers”).
The Valuers were engaged by the Directors, and performed their work in
accordance with the Royal Institution of Chartered Surveyors (“RICS”)
Valuation – Professional Standards. The Valuers used by the Group are
well-known firms, with considerable experience of the market in which
the Group operates.
In determining a property’s valuation the Valuers take into account
property specific information such as the current tenancy agreements
and rental income attached to the asset. They then apply assumptions
as regards yield and Estimated Rental Value, which are influenced by
prevailing market yields and comparable market transactions, to arrive
at the final valuation. Due to the unique nature of each shopping centre,
the assumptions to be applied are determined having regard to the
individual property characteristics at a granular, unit-by-unit level, as
well as considering the qualities of the shopping centre as a whole.
Given the inherent subjectivity involved in the valuation of investment
properties, the need for deep market knowledge when determining the
most appropriate assumptions, and the technicalities of valuation
methodology, we engage our internal valuation specialists (qualified
chartered surveyors) to assist us in our audit of this significant risk area.
We read the valuation reports for all properties and attended meetings
with each of the Valuers. We confirmed that the valuation approach for
each was in accordance with RICS and suitable for use in determining
the carrying value in the Group balance sheet.
We assessed the Valuers’ qualifications and expertise and read their
terms of engagement with the Group to determine whether there were
any matters that might have affected their objectivity or may have
imposed scope limitations upon their work. We also considered other
engagements which might exist between the Group and the Valuers.
We found no evidence to suggest that the objectivity of any Valuer in
their performance of the valuations was compromised.
We carried out procedures, on a sample basis, to test whether property-
specific standing data supplied to the Valuers by management reflected
the underlying property records held by the Group and which had been
tested during our audit. We found them to be consistent.
Our work focused on the largest properties in the portfolio and those
properties where the assumptions used and / or year-on-year capital
value movement suggested a possible outlier versus market data for
the shopping centre sector. We compared the investment yields used by
the Valuers to an estimated range of expected yields, determined via
reference to published benchmarks, and to recent transactions. We also
considered the reasonableness of other assumptions that are not so
readily comparable to published benchmarks, such as Estimated Rental
Value, void rates and rent free periods. Finally, we evaluated year-on-
year movements in capital value with reference to published
benchmarks. Where assumptions were outside the expected range or
otherwise deemed unusual, and/or valuations appeared to experience
unexpected movements, we undertook further investigations and, when
necessary, held further discussions with the Valuers in order to challenge
the assumptions.
It was evident from our interaction with management and the Valuers
and from reading the valuation reports that close attention had been
paid to each property’s individual characteristics at a granular, unit-by-
unit level, as well as considering the overall quality, geographic location
and desirability of the asset as a whole. The evaluation of what were the
right assumptions to apply to any given property included determining
the level of impact that recent significant market transactions
should have on each individual property’s valuation, given its unique
characteristics. We observed discussions between management and the
Valuers which evidenced that alternative assumptions were considered
and evaluated before the final valuation was determined. We found that
the assumptions used in the valuations were supportable in light of
available and comparable market evidence.
Accountsintugroup.co.uk 97

Independent auditors’ report to the members of intu properties plc continued
Area of focus How our audit addressed the area of focus
Acquisition of Puerto Venecia, Zaragoza and subsequent part disposal
On 19 January 2015 intu acquired the Puerto Venecia shopping centre
in Zaragoza, Spain, with consideration of €273.5 million paid in return
for investment property valued at €450.8 million, together with other
assets and liabilities (including €181.0 million of external debt which was
repaid and refinanced on acquisition). The acquisition was treated as a
business combination. Refer to note 40.
Subsequently, on 30 September 2015, the Group entered into a joint
venture agreement with CPPIB (intu properties’ partner in the Parque
Principado shopping centre), selling 50 per cent of its interest in Puerto
Venecia for consideration of €122.3 million. This part disposal has
resulted in Puerto Venecia, previously accounted for as a subsidiary,
being accounted for as a joint venture from the date of part disposal.
Refer to note 41.
With respect to the acquisition of Puerto Venecia we inspected the
purchase agreements and assessed management’s determination of
the fair value of assets and liabilities acquired, including the valuation
methodology applied and the assumptions underlying the acquisition
date valuation. We assessed whether the classification as a business
combination and treatment of the various aspects of the transaction
were in accordance with IFRS 3 Business Combinations which defines a
business as “an integrated set of activities and assets that is capable of
being conducted and managed for the purpose of providing a return in
the form of dividends, lower costs or other economic benefits directly
to investors or other owners, members or participants”. Key factors we
considered were that the acquisition involved the purchase of relevant
inputs (the property and leases) and processes (including staff and
management contracts to run the centre) that would enable the
purchased business to operate independently of the rest of the
Group in order to generate a return.
With respect to the part disposal, we read the sale and purchase
agreement and other documents related to the sale to check whether
it was appropriate to account for Puerto Venecia as a joint venture.
No issues arose from these procedures: the shareholders’ agreement
grants each party an equal number of board members all with equal
voting rights and, because all decisions about the relevant activities of
the business require the consent of both parties, Puerto Venecia was
deemed to be subject to joint control.
We also considered the disclosures in the financial statements in respect
of the initial acquisition and the subsequent part disposal and found
that they were in accordance with applicable accounting standards
(IFRS 3 Business Combinations and IFRS 12 Disclosure of Interests in
Other Entities).
How we tailored the audit scope
In establishing the overall approach to our audit, we assessed the risk of material misstatement, taking into account the nature,
likelihood and potential magnitude of any misstatement. Following this assessment, we applied professional judgement to
determine the extent of testing required over each balance in the financial statements.
We tailored the scope of our audit to ensure that we performed enough work to be able to give an opinion on the financial
statements as a whole, taking into account the geographic structure of the Group, the accounting processes and controls, and the
industry in which the Group operates.
Although the Group has some interests in shopping centre operations outside the UK and the Group is structured as two operating
segments, it operates a single reporting process with a centralised accounting function, therefore the whole business was subject to
the same audit scope. The Group and Company financial statements are produced using numbers which are maintained on a single,
consolidated trial balance, by the Group’s finance department. The majority of the underlying accounting records are maintained on
the Group’s single general ledger.
For Manchester Arndale, Cribbs Causeway, Centaurus Retail Park and St David’s, Cardiff rental income and property expense
numbers are submitted quarterly by external property managers to the Group’s finance department, who then review and enter the
numbers onto the Group’s general ledger. We perform tests of controls over the review of the quarterly submissions and entry onto
the Group’s general ledger, and tests of details over the numbers within those submissions.
Quarterly submissions are also submitted to the Group’s finance department for intu Asturias and Puerto Venecia, from the intu
Spain finance team. We carry out controls testing over these submissions in the same manner as for the UK submissions. The UK
audit team instructs the audit team in PwC Spain to perform specified substantive procedures on the submission packs for the
Spanish centres. Puerto Venecia was in scope for the first time this year, following acquisition in 2015. The UK audit team
determined the level of audit work required over the Spain submission packs by the audit team in Spain, and held regular discussions
throughout the planning and execution phases of the audit. We assessed the findings of the work performed by the audit team in
Spain in order to conclude whether sufficient appropriate audit evidence had been obtained as a basis for our opinion on the Group
financial statements as a whole.
intu properties plc Annual report 201598

Materiality
The scope of our audit was influenced by our application of materiality. We set certain quantitative thresholds for materiality.
These, together with qualitative considerations, helped us to determine the scope of our audit and the nature, timing and extent of
our audit procedures on the individual financial statement line items and disclosures and in evaluating the effect of misstatements,
both individually and on the financial statements as a whole.
Based on our professional judgement, we determined materiality for the financial statements as a whole as follows:
Overall Group materiality £101 million (2014: £96 million)
How we determined it 1 per cent of total assets
Rationale for benchmark applied in arriving at this judgement we had regard to the carrying value of the Group’s assets,
acknowledging that the primary measurement attribute of the Group is the carrying value of
investment property. This represents a consistent year-on-year basis for determining materiality
Specific Group materiality £9 million (2014: £8 million). Applied to net rental income and expenses
How we determined it 5 per cent of underlying profit before tax and associates
Rationale for benchmark applied in arriving at this judgement we have had regard to underlying operating profit acknowledging that
this is a secondary measurement attribute of the Group
We agreed with the Audit Committee that, for areas based on overall Group materiality, we would report to them misstatements
identified during our audit above £10 million (2014: £8 million) as well as misstatements below that amount that, in our view,
warranted reporting for qualitative reasons.
Going concern
Under the Listing Rules we are required to review the Directors’ statement, set out on page 109, in relation to going concern. We
have nothing to report having performed our review.
Under ISAs (UK & Ireland) we are required to report to you if we have anything material to add or to draw attention to in relation to
the Directors’ statement about whether they considered it appropriate to adopt the going concern basis in preparing the financial
statements. We have nothing material to add or to draw attention to.
As noted in the Directors’ statement, the Directors have concluded that it is appropriate to adopt the going concern basis in
preparing the financial statements. The going concern basis presumes that the Group and Company have adequate resources to
remain in operation, and that the Directors intend them to do so, for at least one year from the date the financial statements were
signed. As part of our audit we have concluded that the Directors’ use of the going concern basis is appropriate. However, because
not all future events or conditions can be predicted, these statements are not a guarantee as to the Group’s and Company’s ability
to continue as a going concern.
Other required reporting Consistency of other information
Companies Act 2006 opinions
In our opinion:
— the information given in the strategic report and the Directors’ report for the financial year for which the financial statements
are prepared is consistent with the financial statements; and
— the information given in the Corporate Governance Statement set out on pages 58 to 93 with respect to internal control and
risk management systems and about share capital structures is consistent with the financial statements.
Accountsintugroup.co.uk 99

Independent auditors’ report to the members of intu properties plc continued
ISAs (UK & Ireland) reporting
Under ISAs (UK & Ireland) we are required to report to you if, in our opinion:
— Information in the Annual Report is:
– materially inconsistent with the information in the audited financial statements; or
– apparently materially incorrect based on, or materially inconsistent with, our knowledge of the Group and
Company acquired in the course of performing our audit; or
– is otherwise misleading.
We have no exceptions
to report.
— the statement given by the Directors on page 94, in accordance with provision C.1.1 of the UK Corporate
Governance Code (“the Code”), that they consider the Annual Report taken as a whole to be fair, balanced and
understandable and provides the information necessary for members to assess the Group’s and Company’s
position and performance, business model and strategy is materially inconsistent with our knowledge of the
Group and Company acquired in the course of performing our audit.
We have no exceptions
to report.
— the section of the Annual Report on pages 72 to 75, as required by provision C.3.8 of the Code, describing
the work of the Audit Committee does not appropriately address matters communicated by us to the
Audit Committee.
We have no exceptions
to report.
The Directors’ assessment of the prospects of the Group and of the principal risks that would threaten the solvency or liquidity of the Group
Under ISAs (UK & Ireland) we are required to report to you if we have anything material to add or to draw attention to in relation to:
— the Directors’ confirmation on page 37 of the Annual Report, in accordance with provision C.2.1 of the Code,
that they have carried out a robust assessment of the principal risks facing the group, including those that would
threaten its business model, future performance, solvency or liquidity.
We have nothing material to
add or to draw attention to.
— the disclosures in the Annual Report that describe those risks and explain how they are being managed
or mitigated.
We have nothing material to
add or to draw attention to.
— the Directors’ explanation on page 71 of the Annual Report, in accordance with provision C.2.2 of the Code, as to
how they have assessed the prospects of the Group, over what period they have done so and why they consider
that period to be appropriate, and their statement as to whether they have a reasonable expectation that the
Group will be able to continue in operation and meet its liabilities as they fall due over the period of their
assessment, including any related disclosures drawing attention to any necessary qualifications or assumptions.
We have nothing material to
add or to draw attention to.
Under the Listing Rules we are required to review the Directors’ statement that they have carried out a robust assessment of the
principal risks facing the group and the Directors’ statement in relation to the longer-term viability of the group. Our review was
substantially less in scope than an audit and only consisted of making inquiries and considering the Directors’ process supporting
their statements; checking that the statements are in alignment with the relevant provisions of the Code; and considering whether
the statements are consistent with the knowledge acquired by us in the course of performing our audit. We have nothing to report
having performed our review.
Adequacy of accounting records and information and explanations received
Under the Companies Act 2006 we are required to report to you if, in our opinion:
— we have not received all the information and explanations we require for our audit; or
— adequate accounting records have not been kept by the Company, or returns adequate for our audit have not been received
from branches not visited by us; or
— the Company financial statements and the part of the Directors’ remuneration report to be audited are not in agreement with
the accounting records and returns.
We have no exceptions to report arising from this responsibility.
Directors’ remuneration
Directors’ remuneration report – Companies Act 2006 opinion
In our opinion, the part of the Directors’ remuneration report to be audited has been properly prepared in accordance with the
Companies Act 2006.
Other Companies Act 2006 reporting
Under the Companies Act 2006 we are required to report to you if, in our opinion, certain disclosures of Directors’ remuneration
specified by law are not made. We have no exceptions to report arising from this responsibility.
intu properties plc Annual report 2015100

Corporate governance statement
Under the Companies Act 2006 we are required to report to you if, in our opinion, a corporate governance statement has not been
prepared by the Company. We have no exceptions to report arising from this responsibility.
Under the Listing Rules we are required to review the part of the corporate governance statement relating to ten further provisions
of the Code. We have nothing to report having performed our review.
Responsibilities for the financial statements and the audit Our responsibilities and those of the Directors
As explained more fully in the statement of Directors’ responsibilities set out on page 94, the Directors are responsible for the
preparation of the financial statements and for being satisfied that they give a true and fair view.
Our responsibility is to audit and express an opinion on the financial statements in accordance with applicable law and ISAs
(UK & Ireland). Those standards require us to comply with the Auditing Practices Board’s Ethical Standards for Auditors.
This report, including the opinions, has been prepared for and only for the Company’s members as a body in accordance with
Chapter 3 of Part 16 of the Companies Act 2006 and for no other purpose. We do not, in giving these opinions, accept or assume
responsibility for any other purpose or to any other person to whom this report is shown or into whose hands it may come save
where expressly agreed by our prior consent in writing.
What an audit of financial statements involves
An audit involves obtaining evidence about the amounts and disclosures in the financial statements sufficient to give reasonable
assurance that the financial statements are free from material misstatement, whether caused by fraud or error. This includes an
assessment of:
— whether the accounting policies are appropriate to the Group’s and the Company’s circumstances and have been consistently
applied and adequately disclosed;
— the reasonableness of significant accounting estimates made by the Directors; and
— the overall presentation of the financial statements.
We primarily focus our work in these areas by assessing the Directors’ judgements against available evidence, forming our own
judgements, and evaluating the disclosures in the financial statements.
We test and examine information, using sampling and other auditing techniques, to the extent we consider necessary to provide a
reasonable basis for us to draw conclusions. We obtain audit evidence through testing the effectiveness of controls, substantive
procedures or a combination of both.
In addition, we read all the financial and non-financial information in the Annual Report to identify material inconsistencies with the
audited financial statements and to identify any information that is apparently materially incorrect based on, or materially
inconsistent with, the knowledge acquired by us in the course of performing the audit. If we become aware of any apparent material
misstatements or inconsistencies we consider the implications for our report.
Ranjan Sriskandan (Senior Statutory Auditor)
for and on behalf of PricewaterhouseCoopers LLP
Chartered Accountants and Statutory Auditors
London
26 February 2016
Notes
— The maintenance and integrity of the intu properties plc website is the responsibility of the Directors; the work carried out by the
auditors does not involve consideration of these matters and, accordingly, the auditors accept no responsibility for any changes
that may have occurred to the financial statements since they were initially presented on the website.
— Legislation in the United Kingdom governing the preparation and dissemination of financial statements may differ from
legislation in other jurisdictions.
Accountsintugroup.co.uk 101

Consolidated income statement for the year ended 31 December 2015
Notes 2015
£m 2014
£m
Revenue 3 571.6 536.4
Net rental income 3 381.8 362.6
Net other income 4 6.9 4.8
Revaluation of investment and development property 19 264.9 567.8
(Loss)/gain on acquisition of businesses 5 (0.8) 1.6
Gain on disposal of subsidiaries 41 2.2 0.6
Gain on sale of other investments 0.9 –
Administration expenses – ongoing (37.3) (30.8)
Administration expenses – exceptional 6 (1.0) (13.8)
Operating profit 617.6 892.8
Finance costs 10 (206.6) (197.1)
Finance income 11 18.7 11.9
Other finance costs 12 (37.3) (56.8)
Change in fair value of financial instruments 13 6.0 (157.6)
Net finance costs (219.2) (399.6)
Profit before tax, joint ventures and associates 398.4 493.2
Share of post-tax profit of joint ventures 22 108.6 99.7
Share of post-tax profit of associates 24 6.0 0.8
Profit before tax 513.0 593.7
Current tax 14 (0.4) (0.5)
Deferred tax 14 5.0 6.6
Taxation 14 4.6 6.1
Profit for the year 517.6 599.8
Attributable to:
Owners of intu properties plc 518.4 586.2
Non-controlling interests (0.8) 13.6
517.6 599.8
Basic earnings per share 17 39.3p 48.0p
Diluted earnings per share 17 37.5p 46.3p
Details of underlying earnings are presented in the underlying profit statement on page 167. Underlying earnings per share
are shown in note 17(c).
intu properties plc Annual report 2015102

Consolidated statement of comprehensive income for the year ended 31 December 2015
Notes 2015
£m2014
£m
Profit for the year 517.6 599.8
Other comprehensive income
Items that may be reclassified subsequently to profit or loss:
Revaluation of other investments 25 12.8 21.1
Exchange differences 7.6 7.0
Tax relating to components of other comprehensive income 14 (5.0) (6.6)
Total items that may be reclassified subsequently to profit or loss 15.4 21.5
Reclassified to income statement on sale of other investments (0.6) –
Other comprehensive income for the year 14.8 21.5
Total comprehensive income for the year 532.4 621.3
Attributable to:
Owners of intu properties plc 533.2 608.1
Non-controlling interests (0.8) 13.2
532.4 621.3
Accountsintugroup.co.uk 103

Balance sheets as at 31 December 2015
Notes
Group2015
£m
Group 2014
£m
Company 2015
£m
Company2014
£m
Non-current assets
Investment and development property 19 8,403.9 8,019.6 – –
Plant and equipment 20 5.0 5.1 4.2 3.9
Investment in group companies 21 – – 2,866.6 2,704.7
Investment in joint ventures 22 991.9 851.5 – –
Investment in associates 24 54.7 38.0 – –
Other investments 25 210.3 189.7 – –
Goodwill 26 4.0 4.0 – –
Deferred tax 36 – – 1.1 0.4
Derivative financial instruments 29 – 9.0 – –
Trade and other receivables 27 89.3 99.7 – –
9,759.1 9,216.6 2,871.9 2,709.0
Current assets
Trade and other receivables 27 108.8 114.7 1,266.9 1,286.8
Derivative financial instruments 29 3.2 0.7 – –
Cash and cash equivalents 28 275.8 230.0 0.3 1.0
387.8 345.4 1,267.2 1,287.8
Total assets 10,146.9 9,562.0 4,139.1 3,996.8
Current liabilities
Trade and other payables 30 (275.5) (251.5) (346.3) (394.1)
Current tax liabilities (0.4) (0.6) (0.4) (0.4)
Borrowings 31 (139.3) (21.3) – –
Derivative financial instruments 29 (12.0) (80.7) – –
(427.2) (354.1) (346.7) (394.5)
Non-current liabilities
Borrowings 31 (4,332.3) (4,332.7) (353.7) (230.0)
Derivative financial instruments 29 (329.7) (275.8) (26.4) (25.6)
Other payables (2.8) (2.6) – –
(4,664.8) (4,611.1) (380.1) (255.6)
Total liabilities (5,092.0) (4,965.2) (726.8) (650.1)
Net assets 5,054.9 4,596.8 3,412.3 3,346.7
Equity
Share capital 37 672.3 658.4 672.3 658.4
Share premium 37 1,303.1 1,222.0 1,303.1 1,222.0
Treasury shares 38 (43.3) (45.1) (43.3) (45.1)
Other reserves 39 372.8 358.0 61.4 61.4
Retained earnings 2,671.5 2,330.7 1,418.8 1,450.0
Attributable to owners of intu properties plc 4,976.4 4,524.0 3,412.3 3,346.7
Non-controlling interests 78.5 72.8 – –
Total equity 5,054.9 4,596.8 3,412.3 3,346.7
These consolidated financial statements have been approved for issue by the Board of Directors on 26 February 2016.
David Fischel Matthew Roberts Chief Executive Chief Financial Officer
The notes on pages 109 to 159 form part of these consolidated financial statements.
intu properties plc Annual report 2015104
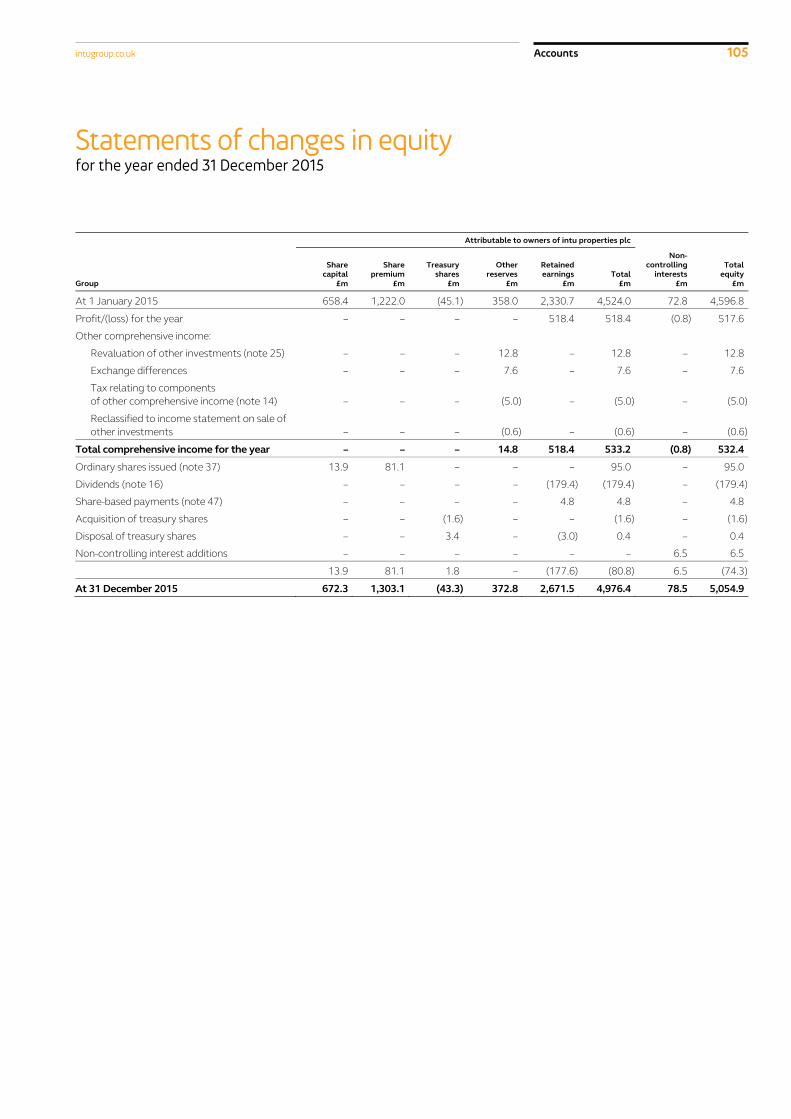
Statements of changes in equity for the year ended 31 December 2015
Attributable to owners of intu properties plc
Group
Sharecapital
£m
Sharepremium
£m
Treasuryshares
£m
Otherreserves
£m
Retained earnings
£m Total
£m
Non-controlling
interests£m
Totalequity
£m
At 1 January 2015 658.4 1,222.0 (45.1) 358.0 2,330.7 4,524.0 72.8 4,596.8
Profit/(loss) for the year – – – – 518.4 518.4 (0.8) 517.6
Other comprehensive income:
Revaluation of other investments (note 25) – – – 12.8 – 12.8 – 12.8
Exchange differences – – – 7.6 – 7.6 – 7.6
Tax relating to components
of other comprehensive income (note 14) – – – (5.0) – (5.0) – (5.0)
Reclassified to income statement on sale of
other investments – – – (0.6) – (0.6) – (0.6)
Total comprehensive income for the year – – – 14.8 518.4 533.2 (0.8) 532.4
Ordinary shares issued (note 37) 13.9 81.1 – – – 95.0 – 95.0
Dividends (note 16) – – – – (179.4) (179.4) – (179.4)
Share-based payments (note 47) – – – – 4.8 4.8 – 4.8
Acquisition of treasury shares – – (1.6) – – (1.6) – (1.6)
Disposal of treasury shares – – 3.4 – (3.0) 0.4 – 0.4
Non-controlling interest additions – – – – – – 6.5 6.5
13.9 81.1 1.8 – (177.6) (80.8) 6.5 (74.3)
At 31 December 2015 672.3 1,303.1 (43.3) 372.8 2,671.5 4,976.4 78.5 5,054.9
Accountsintugroup.co.uk 105

Statements of changes in equity continued for the year ended 31 December 2015
Attributable to owners of intu properties plc
Group
Share capital
£m
Share premium
£m
Treasuryshares
£m
Convertiblebonds
£m
Otherreserves
£m
Retainedearnings
£mTotal
£m
Non-controlling
interests£m
Totalequity
£m
At 1 January 2014 486.9 695.6 (48.2) 143.7 500.5 1,740.3 3,518.8 102.3 3,621.1
Profit for the year – – – – – 586.2 586.2 13.6 599.8
Other comprehensive income:
Revaluation of other investments
(note 25) – – – – 21.1 – 21.1 – 21.1
Exchange differences – – – – 7.4 – 7.4 (0.4) 7.0
Tax relating to components of
other comprehensive income
(note 14) – – – – (6.6) – (6.6) – (6.6)
Total comprehensive income
for the year – – – – 21.9 586.2 608.1 13.2 621.3
Conversion of bond (note 33) 21.2 122.5 – (143.7) – – – – –
Other ordinary shares issued (note 37) 150.3 403.9 – – – – 554.2 – 554.2
Dividends (note 16) – – – – – (155.9) (155.9) – (155.9)
Interest on convertible bonds
(note 33) – – – – – (2.9) (2.9) – (2.9)
Share-based payments (note 47) – – – – – 2.5 2.5 – 2.5
Acquisition of treasury shares – – (1.0) – – – (1.0) – (1.0)
Disposal of treasury shares – – 4.1 – – (3.9) 0.2 – 0.2
Non-controlling interest additions – – – – – – – 27.2 27.2
Distribution to
non-controlling interest – – – – – – – (1.2) (1.2)
Disposal of subsidiaries (note 41) – – – – – – – (68.7) (68.7)
Realisation of merger reserve
(note 39) – – – – (164.4) 164.4 – – –
171.5 526.4 3.1 (143.7) (164.4) 4.2 397.1 (42.7) 354.4
At 31 December 2014 658.4 1,222.0 (45.1) – 358.0 2,330.7 4,524.0 72.8 4,596.8
intu properties plc Annual report 2015106

Attributable to owners of intu properties plc
Company
Sharecapital
£m
Sharepremium
£m
Treasury shares
£m
Other reserves
£m
Retainedearnings
£mTotal
£m
At 1 January 2015 658.4 1,222.0 (45.1) 61.4 1,450.0 3,346.7
Profit for the year (note 15) – – – – 146.4 146.4
Total comprehensive income for the year – – – – 146.4 146.4
Ordinary shares issued (note 37) 13.9 81.1 – – – 95.0
Dividends (note 16) – – – – (179.4) (179.4)
Share-based payments (note 47) – – – – 4.8 4.8
Acquisition of treasury shares – – (1.6) – – (1.6)
Disposal of treasury shares – – 3.4 – (3.0) 0.4
13.9 81.1 1.8 – (177.6) (80.8)
At 31 December 2015 672.3 1,303.1 (43.3) 61.4 1,418.8 3,412.3
Attributable to owners of intu properties plc
Company
Sharecapital
£m
Sharepremium
£m
Treasuryshares
£m
Convertible bonds
£m
Other reserves
£m
Retainedearnings
£mTotal
£m
At 1 January 2014 486.9 695.6 (48.2) 143.7 225.8 1,287.4 2,791.2
Profit for the year (note 15) – – – – – 158.4 158.4
Total comprehensive income for the year – – – – – 158.4 158.4
Conversion of bond (note 33) 21.2 122.5 – (143.7) – – –
Other ordinary shares issued (note 37) 150.3 403.9 – – – – 554.2
Dividends (note 16) – – – – – (155.9) (155.9)
Interest on convertible bonds (note 33) – – – – – (2.9) (2.9)
Share-based payments (note 47) – – – – – 2.5 2.5
Acquisition of treasury shares – – (1.0) – – – (1.0)
Disposal of treasury shares – – 4.1 – – (3.9) 0.2
Realisation of merger reserve (note 39) – – – – (164.4) 164.4 –
171.5 526.4 3.1 (143.7) (164.4) 4.2 397.1
At 31 December 2014 658.4 1,222.0 (45.1) – 61.4 1,450.0 3,346.7
Accountsintugroup.co.uk 107

Statements of cash flows for the year ended 31 December 2015
Notes
Group2015
£m
Group 2014
£m
Company 2015
£m
Company2014
£m
Cash generated from operations 44 366.5 292.7 (23.3) (349.5)
Interest paid (222.5) (244.6) (17.3) (6.3)
Interest received 16.6 8.8 2.6 –
Taxation (0.4) (0.4) – –
Cash flows from operating activities 160.2 56.5 (38.0) (355.8)
Cash flows from investing activities
Purchase and development of property, plant and equipment (100.8) (69.7) (2.3) (1.4)
Sale of property 1.8 – – –
Acquisition of businesses net of cash acquired 40 (203.1) (851.3) – –
Sale/(acquisition) of other investments 4.7 (3.8) – –
Additions to investment in associates 24 (10.0) – – –
Investment in subsidiaries 21 – – – (182.8)
Redemption of preference shares 21 – – – 197.2
Realisation of short-term investments – 69.3 – –
Disposal of subsidiaries net of cash sold with business 41 81.0 162.5 – –
Investment in joint ventures 22 – (0.4) – –
Repayment of capital by joint ventures 22 25.6 14.3 – –
Loan advances to joint ventures 22 (0.8) (97.6) – –
Loan repayments by joint ventures 22 17.6 52.7 – –
Distributions from joint ventures 22 9.0 4.9 – –
Cash flows from investing activities (175.0) (719.1) (2.3) 13.0
Cash flows from financing activities
Issue of ordinary shares 22.0 492.0 22.0 492.0
Acquisition of treasury shares (1.6) (1.0) (1.6) (1.0)
Sale of treasury shares 0.4 0.2 0.4 0.2
Non-controlling interest funding received 6.5 27.2 – –
Cash transferred from/(to) restricted accounts 14.9 (15.9) – –
Borrowings drawn 329.2 989.4 123.7 –
Borrowings repaid (190.3) (675.1) – (55.0)
Interest on convertible bonds 33 – (2.9) – (2.9)
Equity dividends paid (104.9) (89.8) (104.9) (89.8)
Cash flows from financing activities 76.2 724.1 39.6 343.5
Effects of exchange rate changes on cash and cash equivalents (0.3) (0.1) – –
Net increase/(decrease) in cash and cash equivalents 61.1 61.4 (0.7) 0.7
Cash and cash equivalents at 1 January 28 212.5 151.1 1.0 0.3
Cash and cash equivalents at 31 December 28 273.6 212.5 0.3 1.0
intu properties plc Annual report 2015108

Notes to the accounts
1 Accounting convention and basis of preparation These consolidated financial statements have been prepared
in accordance with International Financial Reporting Standards
as adopted by the European Union (‘IFRS’), interpretations
issued by the International Financial Reporting Standards
Interpretations Committee and with those parts of the
Companies Act 2006 applicable to companies reporting under
IFRS. The Directors have taken advantage of the exemption
offered by Section 408 of the Companies Act not to present
a separate income statement or statement of comprehensive
income for the Company.
The consolidated financial statements have been prepared
under the historical cost convention as modified by the
revaluation of property, available-for-sale investments, and
certain other financial assets and liabilities. A summary of the
more significant accounting policies applied is set out in note 2.
These accounting policies are consistent with those applied in
the last annual financial statements, as amended to reflect the
adoption of new standards, amendments and interpretations
which became effective in the year. During 2015 amendments
arising from the Annual Improvements Cycle to IFRSs 2011-
2013 became effective for the first time for the Group’s 31
December 2015 financial statements. These amendments
have not had an impact on the financial statements.
A number of standards have been issued but are not yet
adopted by the EU and so are not available for early adoption.
The most significant of these are IFRS 9 Financial Instruments
along with related amendments to other IFRSs, IFRS 15
Revenue from Contracts with Customers and IFRS 16 Leases.
Based on the Group’s current circumstances, with the exception
of IFRS 16 Leases issued in January 2016 for which the impact is
still being assessed, these standards are not expected to have a
material impact on the financial statements.
Use of estimates and assumptions
The preparation of financial statements in conformity with
generally accepted accounting principles requires the use of
estimates and assumptions that affect the reported amounts of
assets and liabilities at the date of the financial statements and
the reported amounts of income and expenses during the
reporting period. Although these estimates are based on
management’s best knowledge of the amount, event or actions,
actual results ultimately may differ from those estimates. In
particular, significant judgement is required in the use of
estimates and assumptions in the valuation and accounting for
investment and development property and derivative financial
instruments. Additional detail on these two areas is provided in
the relevant accounting policy in note 2 and in notes 19 and 35.
Going concern
The Group’s business activities, together with the factors likely
to affect its future development, performance and position are
set out in the strategic report on pages 6 to 57. The financial
position of the Group, its cash flows, liquidity position and
borrowing facilities are described in the financial review on
pages 46 to 51. In addition, note 35 includes the Group’s risk
management objectives, details of its financial instruments
and hedging activities, its exposures to liquidity risk and details
of its capital structure.
The Group prepares regular forecasts and projections which
include sensitivity analysis taking into account a number of
downside risks to the forecast including reasonably possible
changes in trading performance and asset values and assesses
the potential impact of these on the Group’s liquidity position
and available resources.
In preparing the most recent projections, factors taken into
account include £301.4 million of cash (including the Group’s
share of cash in joint ventures of £25.6 million) and £287.0
million of undrawn facilities at 31 December 2015. The Group’s
weighted average debt maturity of 7.8 years and the relatively
long-term and stable nature of the cash flows receivable under
tenant leases were also factored into the forecasts.
After reviewing the most recent projections and the sensitivity
analysis, the Directors consider it appropriate to continue to
adopt the going concern basis of accounting in preparing the
Group’s financial statements.
2 Accounting policies – Group and Company Basis of consolidation
The consolidated financial information includes the Company
and its subsidiaries and their interests in joint arrangements
and associates.
All intra-group transactions, balances and unrealised gains
on transactions between Group companies are eliminated
on consolidation.
– subsidiaries
A subsidiary is an entity which the Company controls. That is
when it is exposed, or has rights, to variable returns from its
involvement with the entity and has the ability to affect those
returns through its power over the investee. Subsidiaries are
fully consolidated from the date on which control is transferred
to the Group and are de-consolidated from the date that
control ceases.
The Company’s investment in Group companies is carried at
cost less accumulated impairment losses.
Accountsintugroup.co.uk 109

Notes to the accounts continued
2 Accounting policies – Group and Company (continued) – joint arrangements
A joint arrangement is an arrangement over which two or more
parties have joint control. Joint control is the contractually
agreed sharing of control of an arrangement where decisions
about the relevant activities require the unanimous consent of
the parties sharing joint control.
A joint operation is a joint arrangement where the parties that
have joint control of the arrangement have rights to the assets,
and obligations for the liabilities, relating to the arrangement.
The Group’s interest in a joint operation is accounted for by
consolidating the Group’s share of the assets, liabilities, income
and expenses on a line-by-line basis.
A joint venture is a joint arrangement where the parties that
have joint control of the arrangement have rights to the net
assets of the arrangement.
The Group’s interest in a joint venture is accounted for using the
equity method as described below.
– associates
An associate is an entity over which the Company, either directly
or indirectly, is in a position to exercise significant influence.
Significant influence is the power to participate in the financial
and operating policies of the entity but is not control or joint
control of those policies. The Group’s interest in an associate is
accounted for using the equity method as described below.
– the equity method
Under the equity method of accounting, interests in joint
ventures and associates are initially recognised at cost and
adjusted thereafter to recognise the Group’s share of the post-
acquisition profits or losses and movements in other
comprehensive income. Loan balances relating to long-term
funding from Group companies to joint ventures and associates
are presented on the face of the balance sheet as part of
the investment.
– non-controlling interest
A non-controlling interest is the equity in a subsidiary not
attributable, directly or indirectly, to the Company. Non-
controlling interests are presented within equity, separately
from the amounts attributable to owners of the Company.
Profit or loss and each component of other comprehensive
income is attributed to owners of the Company and to non-
controlling interests in the appropriate proportions.
Foreign currencies
Items included in the financial statements of each of the
Group’s entities are measured using the currency of the primary
economic environment in which it operates. The consolidated
financial statements are presented in pounds sterling, which is
the Group’s presentational currency.
The assets and liabilities of foreign entities are translated into
pounds sterling at the rate of exchange ruling at the reporting
date and their income statement and cash flows are translated
at the average rate for the period. Exchange differences arising
are dealt with in other comprehensive income.
At entity level, transactions in currencies other than an entity’s
functional currency are recorded at the exchange rate prevailing
at the transaction dates. Foreign exchange gains and losses
resulting from settlement of these transactions and from
retranslation of monetary assets and liabilities denominated in
foreign currencies are recognised in the income statement
except where these relate to loans to foreign subsidiary entities
considered to be part of the net investment in those entities in
which case these amounts are recorded through other
comprehensive income.
Revenue recognition
The Group recognises revenue when the amount of revenue can
be reliably measured and it is probable that future economic
benefits will flow to the Group.
Rental income receivable is recognised on a straight-line basis
over the term of the lease. Directly attributable lease incentives
are recognised within rental income on the same basis.
Contingent rents, being those lease payments that are not
fixed at the inception of a lease, for example increases arising
on rent reviews or rents linked to tenant revenues, are recorded
as income in the periods in which they are earned. Rent reviews
are recognised as income from the date of the rent review,
based on management’s estimates. Estimates are derived
from knowledge of market rents for comparable properties
determined on an individual property basis and updated for
progress of negotiations.
Service charge income is recognised on an accruals basis
in line with the service being provided.
Facilities management income and management fees
are recognised on an accruals basis in line with the
services provided.
Interest income
Interest income is accrued on a time basis, by reference to the
principal outstanding and the effective interest rate.
Dividend income
Dividend income is recognised when the right to receive
payment has been established.
Share-based payments
The cost of granting share options and other share-based
remuneration is recognised through the income statement
with reference to the fair value of the equity instrument,
assessed at the date of grant. This cost is charged to the income
statement over the vesting period of the awards. All awards are
accounted for as equity settled with the credit entry being taken
directly to equity. For awards with non-market related criteria,
the charge is reversed if it is expected that the performance
criteria will not be met.
intu properties plc Annual report 2015110

2 Accounting policies – Group and Company (continued) For share options an option pricing model is used applying
assumptions around expected yields, forfeiture rates, exercise
price and volatility. Where the share awards have non-market
related performance criteria the Group has used the Black-
Scholes option valuation model to establish the relevant fair
values. Where the share awards have a TSR market related
performance criteria the Group has used the Monte Carlo
simulation valuation model to establish the relevant fair values.
Investments held in the Company’s own shares in connection
with employee share plans and other share-based payment
arrangements are accounted for as treasury shares (see
accounting policy below).
Exceptional items
Exceptional items are those items that in the Directors’ view are
required to be separately disclosed by virtue of their size, nature
or incidence to enable a full understanding of the Group’s
financial performance.
Taxation
Current tax is the amount payable on the taxable income for the
year and any adjustment in respect of prior years. It is calculated
using rates that have been enacted or substantively enacted by
the balance sheet date.
Deferred tax is provided using the balance sheet liability method
in respect of temporary differences between the carrying
amounts of assets and liabilities in the balance sheet and their
tax bases.
Temporary differences are not provided on the initial
recognition of assets or liabilities that affect neither accounting
nor taxable profit, and differences relating to investments in
subsidiaries to the extent that they will not reverse in the
foreseeable future.
Deferred tax is determined using tax rates that have been
enacted or substantively enacted by the balance sheet date
and are expected to apply when the related deferred tax asset
is realised or the deferred tax liability is settled.
Deferred tax assets are recognised only to the extent that
management believe it is probable that future taxable profit
will be available against which the temporary differences can be
utilised. Deferred tax assets and liabilities are offset only when
they relate to taxes levied by the same authority and the Group
intends to settle them on a net basis.
Tax is included in the income statement except when it relates
to items recognised directly in other comprehensive income or
equity, in which case the related tax is also recognised directly
in other comprehensive income or equity.
Investment and development property
Investment and development property is owned or leased
by the Group and held for long-term rental income and
capital appreciation.
The Group has elected to use the fair value model. Properties
are initially recognised at cost and subsequently revalued at the
balance sheet date to fair value as determined by professionally
qualified external valuers on the basis of market value with the
exception of recently acquired development land where an
assessment of fair value may be made internally. Valuations
conform with the Royal Institution of Chartered Surveyors
(‘RICS’), Valuation – Professional Standards 2014.
The main estimates and judgements underlying the valuations
are described in note 19.
Properties held under leases are stated gross of the recognised
finance lease liability.
The cost of investment and development property includes
capitalised interest and other directly attributable outgoings
incurred during development. Interest is capitalised on the basis
of the average rate of interest paid on the relevant debt
outstanding. Interest ceases to be capitalised on the date of
practical completion.
Gains or losses arising from changes in the fair value of
investment and development property are recognised
in the income statement.
Depreciation is not provided in respect of investment and
development property.
Gains or losses arising on the sale of investment and
development property are recognised when the significant risks
and rewards of ownership have been transferred to the buyer.
The gain or loss recognised is the proceeds received less the
carrying value of the property and costs directly associated
with the sale.
Leases
Leases are classified as a finance or operating lease according
to the substance of the transaction. A lease that transfers
substantially all the risks and rewards of ownership to the
lessee is classified as a finance lease. All other leases are
normally classified as operating leases.
– Group as lessee
Leases of investment property are accounted for as finance
leases and recognised as an asset and an obligation to pay
future minimum lease payments. The investment property
asset is included in the balance sheet at fair value, gross of
the recognised finance lease liability. Contingent rents are
recognised as they accrue.
Other finance lease assets are capitalised at the lower of the fair
value of the leased asset or the present value of the minimum
lease payments and depreciated over the shorter of the lease
term and the useful life of the asset.
Lease payments are allocated between the liability and finance
charges so as to achieve a constant financing rate.
Rentals payable under operating leases are charged to the
income statement on a straight-line basis over the lease term.
Accountsintugroup.co.uk 111
Notes to the accounts continued
2 Accounting policies – Group and Company (continued) – Group as lessor
Investment properties are leased to tenants under operating
leases, with rental income being recognised on a straight-line
basis over the lease term. For more detail see the revenue
recognition accounting policy.
Plant and equipment
Plant and equipment consists of vehicles, fixtures, fittings
and other equipment. Plant and equipment is stated at cost
less accumulated depreciation and any accumulated
impairment losses.
Depreciation is charged to the income statement on a straight-
line basis over an asset’s estimated useful life up to a maximum
of five years.
Other investments
Available-for-sale investments, being investments intended to
be held for an indefinite period, are initially and subsequently
measured at fair value. For listed investments, fair value is the
current bid market value at the reporting date. For unlisted
investments where there is no active market, fair value is
assessed using an appropriate methodology as described in
note 25.
Gains or losses arising from changes in fair value are included
in other comprehensive income, except to the extent that
losses are considered to represent a permanent impairment,
in which case they are recognised in the income statement.
Upon disposal, accumulated fair value adjustments are
reclassified from reserves to the income statement.
Goodwill
Goodwill arising on business combinations is carried at cost
less accumulated impairment losses. Goodwill is assessed for
impairment on an annual basis.
Impairment of assets
The Group’s assets are reviewed at each balance sheet date to
determine whether events or changes in circumstances exist
that indicate that their carrying amount may not be recoverable.
If such an indication exists, the asset’s recoverable amount is
estimated. The recoverable amount is the higher of an asset’s
fair value less costs to sell and its value in use. An impairment
loss is recognised in the income statement for the amount by
which the asset’s carrying amount exceeds its recoverable
amount. For the purposes of assessing impairment, assets are
grouped at the lowest levels for which there are separately
identifiable cash flows.
At each balance sheet date the Group reviews whether there is
any indication that an impairment loss recognised in previous
periods may have decreased. If such an indication exists the
asset’s recoverable amount is estimated. An impairment loss
recognised in prior periods is reversed if, and only if, there has
been a change in the estimates used to determine the asset’s
recoverable amount. In this case the asset’s carrying amount is
increased to its recoverable amount but not exceeding the
carrying amount that would have been determined had no
impairment loss been recognised. The reversal of an impairment
loss is recognised in the income statement. No impairment
reversals are permitted to be recognised on goodwill.
Trade receivables
Trade receivables are recognised initially at fair value and
subsequently measured at amortised cost.
The Directors exercise judgement as to the collectability of
trade receivables and determine if it is appropriate to impair
these assets. Factors such as days past due, credit status
of the counterparty and historical evidence of collection
are considered.
Cash and cash equivalents
Cash and cash equivalents comprise cash in hand, deposits
with banks, whether restricted or unrestricted, and other
short-term liquid investments with original maturities of
three months or less.
Trade payables
Trade payables are recognised initially at fair value and
subsequently measured at amortised cost.
Pensions
The costs of defined contribution schemes and contributions
to personal plans are charged to the income statement in the
year in which they are incurred. The Group has no defined
benefit schemes.
Borrowings
Borrowings are recognised initially at their net proceeds on issue
and subsequently carried at amortised cost with the exception
of certain financial instruments such as convertible bonds as
detailed in note 33. Any transaction costs and premiums or
discounts are recognised over the contractual life using the
effective interest method.
In the event of early repayment, all unamortised transaction
costs are recognised immediately in the income statement.
Derivative financial instruments
The Group uses derivative financial instruments to manage
exposure to interest rate and foreign exchange risk. They
are initially recognised on the trade date at fair value and
subsequently re-measured at fair value. In assessing fair value
the Group uses its judgement to select suitable valuation
techniques and make assumptions which are mainly based
on market conditions existing at the balance sheet date. The
fair value of interest rate swaps is calculated by discounting
estimated future cash flows based on the terms and maturity
of each contract and using market interest rates for similar
instruments at the measurement date. These values are tested
for reasonableness based upon broker or counterparty quotes.
Amounts paid under interest rate swaps, both on obligations as
they fall due and on early settlement, are recognised in the
income statement as finance costs. Fair value movements on
revaluation of derivative financial instruments are shown
in the income statement through changes in fair value of
financial instruments.
The Group does not currently apply hedge accounting to its
interest rate swaps.
intu properties plc Annual report 2015112
2 Accounting policies – Group and Company (continued) Share capital
Ordinary shares are classified as equity. Incremental costs
directly attributable to the issue of new ordinary shares are
shown in equity as a deduction, net of tax, from the proceeds.
Dividends
Dividends are recognised when they become legally payable.
In the case of interim dividends to owners, this is the date of
payment. In the case of final dividends, this is when declared
by shareholders at the annual general meeting.
Convertible bonds
Convertible bonds are assessed on issue, as to whether they
should be classified as a financial liability, as equity or as a
compound financial instrument with both debt and equity
components. This assessment is based on the terms of the
bond and in accordance with IAS 32. Each bond is assessed
separately and the detailed accounting treatment of each is
given in note 33.
Treasury shares
Investments held in the Company’s own shares are deducted
from equity at cost. Where such shares are subsequently sold,
any consideration received is recognised directly in equity.
Current/non-current classification
Current assets include assets held primarily for trading
purposes, cash and cash equivalents, and assets expected to
be realised in, or intended for sale or consumption in, the course
of the Group’s operating cycle. All other assets are classified as
non-current assets.
Current liabilities include liabilities held primarily for trading
purposes, liabilities expected to be settled in the course of the
Group’s operating cycle and those liabilities due within one
year from the reporting date. All other liabilities are classified
as non-current liabilities.
Business combinations
Business combinations are accounted for in accordance with
IFRS 3 Business Combinations using the acquisition method
of accounting. The consideration for the acquisition of a
subsidiary is the total of the fair values of the assets transferred,
the liabilities incurred and the equity interests issued by the
Group. The consideration includes the fair value of any asset or
liability resulting from a contingent consideration arrangement.
Costs associated with the acquisition are expensed as
incurred. Identifiable assets and liabilities assumed in a business
combination are measured initially at their fair values at the
acquisition date.
Goodwill arising on an acquisition is the excess of the
consideration over the fair value of the identifiable assets
and liabilities acquired. Where the fair value of the identifiable
assets and liabilities acquired exceeds the consideration this
difference is recognised in the income statement at the date
of the acquisition.
Accountsintugroup.co.uk 113

Notes to the accounts continued
3 Segmental reporting Operating segments are determined based on the internal reporting and operational management of the Group. The Group is
primarily a shopping centre focused business and, following recent acquisition activity, has two reportable operating segments
being UK and Spain.
The principal profit indicator used to measure performance is net rental income. An analysis of net rental income is given below:
2015
Group including share of joint ventures Less share of
joint ventures £m
UK£m
Spain£m
Total£m
Group total£m
Rent receivable 492.5 21.5 514.0 (53.0) 461.0
Service charge income 103.0 4.5 107.5 (10.6) 96.9
Facilities management income from joint ventures 7.9 – 7.9 5.8 13.7
Revenue 603.4 26.0 629.4 (57.8) 571.6
Rent payable (22.4) – (22.4) 1.1 (21.3)
Service charge costs (116.7) (4.8) (121.5) 11.7 (109.8)
Facilities management costs recharged to joint ventures (7.9) – (7.9) (5.8) (13.7)
Other non-recoverable costs (48.0) (1.8) (49.8) 4.8 (45.0)
Net rental income 408.4 19.4 427.8 (46.0) 381.8
2014
Group including share of joint ventures Less share of
joint ventures £m
UK£m
Spain£m
Total£m
Group total£m
Rent receivable 473.2 7.2 480.4 (39.3) 441.1
Service charge income 95.9 1.8 97.7 (9.5) 88.2
Facilities management income from joint ventures 4.1 – 4.1 3.0 7.1
Revenue 573.2 9.0 582.2 (45.8) 536.4
Rent payable (23.4) – (23.4) 1.2 (22.2)
Service charge costs (107.0) (2.0) (109.0) 10.3 (98.7)
Facilities management costs recharged to joint ventures (4.1) – (4.1) (3.0) (7.1)
Other non-recoverable costs (48.1) (1.0) (49.1) 3.3 (45.8)
Net rental income 390.6 6.0 396.6 (34.0) 362.6
There were no significant transactions within net rental income between operating segments.
An analysis of investment and development property, capital expenditure and revaluation surplus is presented below:
Investment and development property Capital expenditure Revaluation surplus
2015
£m2014
£m2015
£m2014
£m2015
£m 2014
£m
United Kingdom 9,222.3 8,806.6 75.6 65.6 342.2 633.8
Spain 301.4 82.2 47.9 1.4 8.5 14.4
Group including share of joint ventures 9,523.7 8,888.8 123.5 67.0 350.7 648.2
Less share of joint ventures (1,119.8) (869.2) (2.5) (1.0) (85.8) (80.4)
Group 8,403.9 8,019.6 121.0 66.0 264.9 567.8
intu properties plc Annual report 2015114

3 Segmental reporting (continued) The Group’s geographical analysis of non-current assets (excluding financial instruments) is set out below. This represents where
the Group’s assets reside and, where relevant, where revenues are generated. In the case of investments this reflects where the
investee is located.
2015
£m2014
£m
United Kingdom 9,447.2 8,934.4
Spain 46.9 49.7
United States 209.4 184.7
India 55.6 38.8
9,759.1 9,207.6
4 Net other income
2015
£m2014
£m
Dividends received from other investments 6.7 6.1
Management fees 3.0 1.6
intu Digital (2.8) (2.9)
Net other income 6.9 4.8
5 (Loss)/gain on acquisition of businesses The net loss on acquisition of businesses in the year was £0.8 million. This consists of a gain on the acquisition of Puerto Venecia,
Zaragoza of £0.8 million (see note 40) and an adjustment increasing the contingent consideration relating to the 2012 acquisition of
StyleMeTV Limited (renamed IntuDigital Limited) resulting in the recognition of a loss of £1.6 million. The 2014 gain related to the
acquisition of intu Derby and intu Merry Hill (see note 40).
6 Administration expenses – exceptional Exceptional administration expenses (see note 2 for definition of exceptional items) in the year totalled £1.0 million (2014: £13.8
million). 2015 costs relate to corporate transactions, principally the acquisition of Puerto Venecia, Zaragoza. 2014 costs principally
related to the acquisition of intu Merry Hill, intu Derby and Sprucefield.
7 Operating profit
2015
£m2014
£m
Operating profit is arrived at after charging:
Staff costs (note 8) 77.9 72.3
Depreciation (note 20) 2.6 2.1
Remuneration paid to the Company’s auditors (note 9) 0.7 1.6
Accountsintugroup.co.uk 115

Notes to the accounts continued
8 Employees’ information
Group 2015
£m
Group2014
£m
Wages and salaries 63.9 61.3
Social security costs 6.1 5.8
Pension costs (note 48) 3.1 2.7
Share-based payments (note 47) 4.8 2.5
77.9 72.3
At 31 December 2015 the number of persons employed by the Group was 2,544 (2014: 2,459). The Company had no employees
during the year (2014: nil). The monthly average number of persons employed by the Group during the year was:
2015
Number 2014
Number
40 Broadway, London 323 261
Shopping centres 2,123 1,916
2,446 2,177
9 Auditors’ remuneration
2015 £000
2014£000
Fees payable to the Company’s auditors and their associates for:
The audit of the Company’s annual accounts 237 214
Other services to the Group – audit of the Company’s subsidiaries 391 352
Fees related to the audit of the Company and its subsidiaries 628 566
Audit-related assurance services1 71 40
Total fees for audit and audit related services 699 606
Other assurance services2 25 1,034
Total non-audit related services 25 1,034
Total fees 724 1,640
Fees payable to PricewaterhouseCoopers LLP (‘PwC’) and its associates for non-audit services to the Company are not required
to be disclosed separately as they are included on a consolidated basis. Fees payable by the Group’s joint ventures in respect of 2015
were £93,000 (intu’s share) all of which related to audit and audit related services. The Group also used accounting firms other than
PwC for a number of assignments.
1 Relates to review of the interim report of the Group, and interim reviews of certain subsidiary undertakings.
2 2014 included £916,000 in respect of reporting accountant work associated with the rights issue and raising debt on intu Trafford Centre and within the Secured Group
Structure (SGS).
The role of the reporting accountant requires detailed knowledge of the entities involved. If a firm other than the audit firm were to undertake this work then they would have
to spend a significant amount of additional time becoming familiar with those entities. PwC was therefore chosen to undertake this work as it was considered to be sensible and
more efficient both in terms of time and costs. For the same reasons, certain elements of the SGS work were undertaken by another firm that had performed the most recent
audit for those entities.
2014 also included £118,000 in respect of financial due diligence related to the acquisition of intu Merry Hill, intu Derby and Sprucefield. PwC was chosen to undertake this work
on efficiency grounds given the overall assignment, including reporting accountant work on the rights issue. Additionally, as for all non-audit work, consideration was given as to
whether PwC’s independence could be affected by undertaking this work. It was concluded that this would not be the case.
10 Finance costs
2015
£m 2014
£m
On bank loans and overdrafts 195.4 186.0
On convertible bonds (note 33) 7.5 7.5
On obligations under finance leases 3.7 3.6
Finance costs 206.6 197.1
Finance costs of £2.1 million were capitalised in the year ended 31 December 2015 (2014: £nil).
intu properties plc Annual report 2015116

11 Finance income
2015
£m2014
£m
Interest receivable on loans to joint ventures 17.1 10.7
Other finance income 1.6 1.2
Finance income 18.7 11.9
12 Other finance costs
2015
£m2014
£m
Amortisation of Metrocentre compound financial instrument 5.9 6.1
Cost of termination of derivative financial instruments and other costs1 28.6 48.4
Foreign currency movements1 2.8 2.3
Other finance costs 37.3 56.8
1 Amounts totalling £31.4 million in the year ended 31 December 2015 are treated as exceptional items, as defined in note 2 (2014: £50.7 million). These finance costs include
termination of interest rate swaps on repayment of debt, payments on unallocated swaps and other fees.
13 Change in fair value of financial instruments
2015
£m2014
£m
Gain/(loss) on derivative financial instruments 6.8 (144.8)
Loss on convertible bonds designated as at fair value through profit or loss (note 33) (0.8) (12.8)
Change in fair value of financial instruments 6.0 (157.6)
Included within the change in fair value of derivative financial instruments are gains totalling £44.1 million (2014: £70.3 million)
resulting from the payment of obligations under derivative financial instruments during the year. Of these £26.5 million related to
unallocated swaps. In 2014 £27.0 million related to unallocated swaps and £17.1 million to the termination of swaps.
14 Taxation Taxation for the year:
2015
£m2014
£m
Overseas taxation 0.6 0.5
UK taxation – adjustment in respect of prior years (0.2) –
Current tax 0.4 0.5
Deferred tax:
On investment and development property (0.8) –
On other investments (0.2) (0.9)
On derivative financial instruments (2.8) (5.6)
On other temporary differences (1.2) (0.1)
Deferred tax (5.0) (6.6)
Total tax credit (4.6) (6.1)
Accountsintugroup.co.uk 117

Notes to the accounts continued
14 Taxation (continued) The tax credits for 2015 and 2014 are lower than the standard rate of corporation tax in the UK. The differences are explained below:
2015
£m 2014
£m
Profit before tax, joint ventures and associates 398.4 493.2
Profit before tax multiplied by the standard rate in the UK of 20.25% (2014: 21.5%) 80.7 106.0
Exempt property rental profits and revaluations (90.3) (140.6)
(9.6) (34.6)
Additions and disposals of property and investments (0.2) (0.8)
Prior year corporation tax items (0.2) –
Non-deductable and other items (0.4) (0.1)
Overseas taxation 0.6 0.5
Unprovided deferred tax 5.2 28.9
Total tax credit (4.6) (6.1)
Tax relating to components of other comprehensive income of £5.0 million (2014: £6.6 million) relates entirely to deferred tax in
respect of other investments.
15 Profit for the year attributable to owners of intu properties plc Profits of £146.4 million are recorded in the accounts of the Company in respect of the year (2014: £158.4 million). No income
statement or statement of comprehensive income is presented for the Company as permitted by Section 408 of the Companies
Act 2006.
16 Dividends
2015
£m 2014
£m
Ordinary shares
Prior year final dividend paid of 9.1 pence per share (2014: 9.11 pence per share) 118.3 96.2
Interim dividend paid of 4.6 pence per share (2014: 4.6 pence per share) 61.1 59.7
Dividends declared 179.4 155.9
Proposed final dividend of 9.1 pence per share 122.4
1 Adjusted for the 2014 rights issue bonus factor.
In 2015, the Company offered shareholders the option to receive ordinary shares instead of cash for the 2014 final and 2015 interim
dividends of 9.1 pence and 4.6 pence respectively under the Scrip Dividend Scheme. As a result of elections made by shareholders
16,071,625 new ordinary shares of 50 pence each were issued on 28 May 2015 and 5,420,299 new ordinary shares of 50 pence each
were issued on 24 November 2015 in lieu of dividends otherwise payable. This resulted in £73.0 million of cash being retained in
the business.
In 2014, the Scrip Dividend Scheme resulted in £62.2 million of cash being retained in the business.
Details of the shares in issue and dividends waived are given in notes 37 and 38.
intu properties plc Annual report 2015118

17 Earnings per share (a) Earnings per share
Basic and diluted earnings per share as calculated in accordance with IAS 33 Earnings per Share:
2015 2014
Earnings£m
Sharesmillion
Pence per share
Earnings £m
Sharesmillion
Pence pershare
Profit for the year attributable to owners of intu properties plc 518.4 586.2
Interest on convertible bonds recognised directly in equity (note 33) – (2.9)
Basic earnings per share1 518.4 1,318.1 39.3p 583.3 1,214.6 48.0p
Dilutive convertible bonds, share options and share awards 8.4 87.3 23.2 96.4
Diluted earnings per share 526.8 1,405.4 37.5p 606.5 1,311.0 46.3p
1 The weighted average number of shares used for the calculation of basic earnings per share has been adjusted to remove shares held in the ESOP.
(b) Headline earnings per share
Headline earnings per share has been calculated and presented as required by the Johannesburg Stock Exchange
listing requirements.
2015 2014
Gross £m
Net1 £m
Gross£m
Net1
£m
Basic earnings 518.4 583.3
Remove:
Revaluation of investment and development property (note 19) (264.9) (261.9) (567.8) (552.9)
Gain on acquisition of businesses (0.8) (0.8) (1.6) (1.6)
Gain on disposal of subsidiaries (2.2) (2.2) (0.6) (0.6)
Gain on sale of other investments (0.9) (0.9) – –
Share of joint ventures’ items (85.8) (85.1) (80.4) (80.4)
Share of associates’ items (0.3) (0.3) (0.8) (0.8)
Headline earnings/(loss) 167.2 (53.0)
Dilution2 8.4 23.2
Diluted headline earnings/(loss) 175.6 (29.8)
Weighted average number of shares 1,318.1 1,214.6
Dilution2 87.3 96.4
Diluted weighted average number of shares 1,405.4 1,311.0
Headline earnings/(loss) per share (pence) 12.7p (4.4)p
Diluted headline earnings/(loss) per share (pence) 12.5p (2.3)p
1 Net of tax and non-controlling interests.
2 The dilution impact is required to be included as calculated in note 17(a) even where this is not dilutive for headline earnings per share.
Accountsintugroup.co.uk 119

Notes to the accounts continued
17 Earnings per share (continued) (c) Underlying earnings per share
Underlying earnings per share is a non-GAAP measure but has been included as it is considered to be a key measure of the Group’s
performance and an indication of the extent to which dividend payments are supported by underlying earnings (see underlying
profit statement on page 167).
2015 2014
Earnings£m
Sharesmillion
Pence pershare
Earnings £m
Sharesmillion
Pence pershare
Basic earnings per share (per note 17(a)) 518.4 1,318.1 39.3p 583.3 1,214.6 48.0p
Remove:
Revaluation of investment and development property (note 19) (264.9) (20.1)p (567.8) (46.7)p
Loss/(gain) on acquisition of businesses 0.8 0.1p (1.6) (0.1)p
Gain on disposal of subsidiaries (2.2) (0.2)p (0.6) –
Gain on sale of other investments (0.9) (0.1)p – –
Exceptional administration expenses (note 6) 1.0 0.1p 13.8 1.1p
Exceptional finance costs (note 12) 31.4 2.4p 50.7 4.2p
Change in fair value of financial instruments (note 13) (6.0) (0.4)p 157.6 13.0p
Tax on the above (5.1) (0.4)p (6.7) (0.6)p
Share of joint ventures’ adjusting items (83.9) (6.4)p (81.1) (6.7)p
Share of associates’ adjusting items (5.8) (0.4)p (0.8) (0.1)p
Non-controlling interests in respect of the above 3.8 0.3p 14.9 1.2p
Underlying earnings per share 186.6 1,318.1 14.2p 161.7 1,214.6 13.3p
Dilutive convertible bonds, share options and share awards 7.5 87.3 10.4 96.4
Underlying, diluted earnings per share 194.1 1,405.4 13.8p 172.1 1,311.0 13.1p
18 Net asset value per share (a) NAV per share (diluted, adjusted)
NAV per share (diluted, adjusted) is a non-GAAP measure but has been included as it is considered to be a key measure of the
Group’s performance.
2015 2014
Netassets
£mShares million
NAV per sharepence
Net assets
£m Shares million
NAV per share
pence
NAV per share attributable to owners of intu properties plc1 4,976.4 1,331.9 374p 4,524.0 1,303.7 347p
Dilutive convertible bonds, share options and awards 16.2 6.4 22.2 8.6
Diluted NAV per share 4,992.6 1,338.3 373p 4,546.2 1,312.3 347p
Remove:
Fair value of derivative financial instruments (net of tax) 322.1 24p 333.2 26p
Deferred tax on investment and development property
and other investments 18.9 1p 14.1 1p
Share of joint ventures’ adjusting items 6.3 1p 4.1 –
Add:
Non-controlling interest recoverable balance not recognised 71.3 5p 71.3 5p
NAV per share (diluted, adjusted) 5,411.2 1,338.3 404p 4,968.9 1,312.3 379p
1 The number of shares used has been adjusted to remove shares held in the ESOP.
intu properties plc Annual report 2015120

18 Net asset value per share (continued) (b) NNNAV per share (diluted, adjusted)
NNNAV per share (diluted, adjusted) is a non-GAAP measure but has been included as it is considered to be an industry standard
comparable measure.
2015 2014
Netassets
£mShares million
NAV per share pence
Net assets
£m Shares million
NAV per share
pence
NAV per share (diluted, adjusted) 5,411.2 1,338.3 404p 4,968.9 1,312.3 379p
Fair value of derivative financial instruments (net of tax) (322.1) (24)p (333.2) (26)p
Excess of fair value of debt over book value (194.4) (14)p (310.2) (24)p
Deferred tax on investment and development property
and other investments (18.9) (1)p (14.1) (1)p
Share of joint ventures’ adjusting items (8.1) (1)p (6.0) –
Non-controlling interests in respect of the above 11.0 1p 17.0 1p
NNNAV per share (diluted, adjusted) 4,878.7 1,338.3 365p 4,322.4 1,312.3 329p
19 Investment and development property Freehold
£m Leasehold
£mTotal
£m
At 1 January 2014 5,038.1 2,240.6 7,278.7
Acquisition of intu Derby and Sprucefield (note 40) 458.4 – 458.4
Additions 48.5 17.5 66.0
Disposal of subsidiaries1 (350.4) – (350.4)
Surplus on revaluation 468.9 98.9 567.8
Foreign exchange movements (0.9) – (0.9)
At 31 December 2014 5,662.6 2,357.0 8,019.6
Acquisition of Puerto Venecia, Zaragoza (note 40) 344.2 – 344.2
Additions 84.4 36.6 121.0
Disposals (1.5) (0.3) (1.8)
Disposal of subsidiaries2 (331.7) – (331.7)
Surplus on revaluation 223.6 41.3 264.9
Foreign exchange movements (12.3) – (12.3)
At 31 December 2015 5,969.3 2,434.6 8,403.9
1 Relates to intu Asturias (£142.2 million) and intu Uxbridge (£208.2 million). See note 41.
2 Relates to Puerto Venecia, Zaragoza. See note 41.
A reconciliation to market value is given in the table below:
2015
£m2014
£m
Balance sheet carrying value of investment and development property 8,403.9 8,019.6
Tenant incentives included within trade and other receivables (note 27) 101.0 96.9
Head leases included within finance leases in borrowings (note 31) (34.2) (34.9)
Market value of investment and development property 8,470.7 8,081.6
All investment and development property is measured at fair value in the Group’s balance sheet and categorised as Level 3 in the
fair value hierarchy (see note 35 for definition) as one or more significant inputs to the valuation are partly based on unobservable
market data.
Transfers into and transfers out of the fair value hierarchy levels are recognised on the date of the event or change in
circumstances that caused the transfer. There were no transfers in or out of Level 3 for investment properties during the year.
The market value of investment and development property at 31 December 2015 includes £144.4 million (31 December 2014:
£74.4 million) in respect of property considered to be developments. These are accounted for as investment property and are
valued using the same methodology as other investment property with the exception of certain recently acquired development
land as detailed on page 122.
Accountsintugroup.co.uk 121

Notes to the accounts continued
19 Investment and development property (continued) The Group has only one class of investment and development property asset. All the Group’s significant investment and
development property relates to prime shopping centres which are of a similar nature and share characteristics and risks.
Valuation process
It is the Group’s policy to engage independent external valuers to determine the market value of its investment and development
property at both 30 June and 31 December. The Group provides information to the valuers, including current lease and tenant data
along with asset specific business plans. The valuers use this and other inputs including market transactions for similar properties to
produce valuations (see valuation methodology below). These valuations and the assumptions they have made are then discussed
and reviewed with the Group’s asset management team and Directors.
The Group engages independent valuation experts to undertake the Group’s property valuations. A summary of the valuers and the
value of property assets they have been engaged to value is given below:
2015
£m 2014
£m
Cushman & Wakefield 7,132.8 6,823.5
CBRE 1,275.0 1,248.1
Assets not valued externally 62.9 10.0
8,470.7 8,081.6
In addition to the above, investment properties in the Group’s joint ventures were valued by Cushman & Wakefield, Knight Frank
and Jones Lang LaSalle.
Assets not valued externally, relates to recently acquired development land, the main element being the site in Malága, Spain.
These amounts have been reviewed internally and it has been concluded that the cost of these assets continues to be in line with
market values and so no valuation adjustment is needed. As the developments advance these will be valued by independent
external valuers.
Valuation fees are a fixed amount agreed between the Group and the valuers in advance of the valuation and are not linked to
the valuation output.
Valuation methodology
The fair value of the Group’s investment and development property as at 31 December 2015 was determined by independent
external valuers at that date other than certain recently acquired development land as detailed above. The valuations are in
accordance with the Royal Institution of Chartered Surveyors (RICS) Valuation – Professional Standards 2014 and were arrived at by
reference to market transactions for similar properties. Fair values for investment properties are calculated using the present value
income approach. The main assumptions underlying the valuations are in relation to rent profile and yields as discussed below.
The key driver of the property valuations is the terms of the leases in place at the valuation date. These determine the majority
of the cash flow profile of the property for a number of years and therefore form the base of the valuation. The valuation assumes
adjustments from these rental values to current market rent at the time of the next rent review (where a typical lease allows only
for upward adjustment) and as leases expire and are replaced by new leases. The current market level of rent is assessed based
on evidence provided by the most recent relevant leasing transactions and negotiations. This is based on evidence available at the
date of valuation and does not assume future increases in market rent.
The nominal equivalent yield is applied as a discount rate to the rental cash flows which, after taking into account other input
assumptions such as vacancies and costs, generates the market value of the property. The nominal equivalent yield applied is
assessed by reference to market transactions for similar properties and takes into account, amongst other things, any risks
associated with the rent uplift assumptions.
Annual property income as disclosed in the table below reflects current annualised gross income.
The net initial yield is calculated as the current net income over the gross market value of the asset and is used as a sense check and
to compare against market transactions for similar properties.
Full definitions of nominal equivalent yield, annual property income and net initial yield are provided in the glossary.
The valuation output, inputs and assumptions, are reviewed to ensure that they are in line with those of market participants.
A significant change in the nominal equivalent yield in isolation, would result in a significant change in the value of investment and
development property. A decrease in nominal equivalent yield of 50 basis points would result in an increase in the total market value
of £953 million (31 December 2014: £874 million), while a 50 basis point increase would result in a decrease in the total market
value of £748 million (31 December 2014: £718 million).
intu properties plc Annual report 2015122

19 Investment and development property (continued) The tables below provide details of the assumptions used in the valuation and key unobservable inputs:
2015
Market value £m
Net initial yield (EPRA)
Nominal equivalent yield
Annual property income
£m
intu Trafford Centre 2,305.0 3.7% 4.3% 87.8
intu Lakeside 1,334.0 4.2% 4.7% 59.2
intu Metrocentre 952.3 4.7% 5.4% 48.2
intu Braehead 585.5 3.9% 6.0% 26.2
intu Derby 447.0 5.9% 6.0% 30.6
Manchester Arndale 445.0 4.6% 5.1% 21.9
intu Victoria Centre 356.0 4.3% 6.0% 18.2
intu Watford 336.0 4.7% 6.3% 17.8
intu Eldon Square 299.7 4.1% 5.9% 14.5
intu Milton Keynes 280.0 4.1% 4.8% 13.3
intu Chapelfield 272.5 5.3% 5.8% 16.2
Cribbs Causeway 245.1 4.4% 5.4% 11.7
intu Potteries 175.1 4.7% 7.5% 9.4
intu Bromley 174.1 5.5% 7.1% 10.7
2014
Market value £m
Net initial yield (EPRA)
Nominal equivalent yield
Annual property income
£m
intu Trafford Centre 2,200.0 3.9% 4.5% 86.9
intu Lakeside 1,255.0 4.2% 5.0% 59.7
intu Metrocentre 928.1 4.3% 5.4% 46.8
intu Braehead 599.3 3.7% 5.9% 25.5
Manchester Arndale 430.2 4.6% 5.2% 21.7
intu Derby 420.0 6.3% 6.2% 28.4
intu Watford 335.0 4.5% 6.3% 17.3
intu Victoria Centre 314.0 4.0% 6.2% 16.9
intu Milton Keynes 277.5 4.5% 4.9% 13.8
intu Eldon Square 272.6 4.1% 6.1% 14.0
intu Chapelfield 261.0 5.0% 6.0% 15.1
Cribbs Causeway 242.9 4.1% 5.5% 12.6
intu Bromley 170.7 5.3% 7.1% 10.5
intu Potteries 164.5 5.3% 7.5% 10.5
Accountsintugroup.co.uk 123

Notes to the accounts continued
20 Plant and equipment
Group
2015 2014
Cost £m
Accumulated depreciation
£mNet £m
Cost £m
Accumulated depreciation
£m Net £m
At 1 January 15.2 (10.1) 5.1 13.5 (8.0) 5.5
Additions 2.5 – 2.5 1.7 – 1.7
Disposals (0.5) 0.5 – – – –
Charge for the year – (2.6) (2.6) – (2.1) (2.1)
At 31 December 17.2 (12.2) 5.0 15.2 (10.1) 5.1
Company
2015 2014
Cost £m
Accumulated depreciation
£mNet £m
Cost £m
Accumulated depreciation
£m Net £m
At 1 January 10.4 (6.5) 3.9 9.0 (4.8) 4.2
Additions 2.3 – 2.3 1.4 – 1.4
Charge for the year – (2.0) (2.0) – (1.7) (1.7)
At 31 December 12.7 (8.5) 4.2 10.4 (6.5) 3.9
Plant and equipment consists of vehicles, fixtures, fittings and other office equipment.
21 Investment in group companies
Company
2015 2014
Cost £m
Accumulated impairment
£mNet £m
Cost £m
Accumulated impairment
£m Net £m
At 1 January 3,313.7 (609.0) 2,704.7 3,328.1 (817.1) 2,511.0
Additions – – – 182.8 – 182.8
Redemption of preference shares – – – (197.2) – (197.2)
Impairment reversed in the year – 161.9 161.9 – 208.1 208.1
At 31 December 3,313.7 (447.1) 2,866.6 3,313.7 (609.0) 2,704.7
The impairment charge reversed in the year was principally the result of property valuation increases seen in the relevant
subsidiaries. Details of related undertakings are provided in note 45.
intu properties plc Annual report 2015124

22 Joint ventures The Group’s principal joint ventures own and manage investment and development property.
2015
intu Merry Hill £m
St David’s, Cardiff
£m
Puerto Venecia
£m
intu Asturias
£m Other
£mTotal
£m
At 1 January 2015 433.0 310.9 – 47.3 60.3 851.5
Puerto Venecia, Zaragoza (note 41) – – 86.1 – – 86.1
Share of underlying profit 7.5 13.8 0.6 0.6 2.2 24.7
Share of other net profit/(loss) 12.2 61.4 (0.8) 8.4 2.7 83.9
Share of profit/(loss) 19.7 75.2 (0.2) 9.0 4.9 108.6
Distributions (5.7) – – – (3.3) (9.0)
Repayment of capital – – – – (25.6) (25.6)
Loan advances – – – – 0.8 0.8
Loan repayments – (17.6) – – – (17.6)
Foreign exchange movements – – – (2.9) – (2.9)
At 31 December 2015 447.0 368.5 85.9 53.4 37.1 991.9
Represented by:
Loans to joint venture 386.2 111.0 82.3 29.3 2.3 611.1
Group’s share of net assets 60.8 257.5 3.6 24.1 34.8 380.8
2014
intu Merry Hill £m
St David’s, Cardiff
£m
intu Asturias
£m Other
£mTotal
£m
At 1 January 2014 – 194.6 – 14.9 209.5
Acquisition of intu Merry Hill (note 40) 403.8 – – – 403.8
intu Uxbridge (note 41) – – – 43.0 43.0
intu Asturias (note 41) – – 71.3 – 71.3
Other additions – – – 0.4 0.4
Share of underlying profit 5.1 11.3 0.4 1.8 18.6
Share of other net profit 26.8 38.8 13.9 1.6 81.1
Share of profit 31.9 50.1 14.3 3.4 99.7
Distributions (2.7) – – (2.2) (4.9)
Repayment of capital – – (14.3) – (14.3)
Loan advances – 79.7 17.1 0.8 97.6
Loan repayments – (13.5) (39.2) – (52.7)
Foreign exchange movements – – (1.9) – (1.9)
At 31 December 2014 433.0 310.9 47.3 60.3 851.5
Represented by:
Loans to joint venture 386.2 128.6 31.6 1.9 548.3
Group’s share of net assets 46.8 182.3 15.7 58.4 303.2
At 31 December 2015, the boards of joint ventures had approved £5.3 million (2014: £0.5 million) of future expenditure for the
purchase, construction, development and enhancement of investment property. Of this, £2.0 million (2014: £0.1 million) is
contractually committed. These amounts represent the Group’s share.
It is intended that the exemption, conferred by regulation 7 of The Partnerships (Accounts) Regulations 2008, from needing to
prepare and file accounts will be taken in respect of the following limited partnerships which are dealt with on a consolidated basis
in these financial statements: MH (No. 1) Limited Partnership, MH (No. 2) Limited Partnership, MH (No. 3) Limited Partnership, MH
(No. 4) Limited Partnership, MH (No. 5) Limited Partnership, MH (No. 6) Limited Partnership, MH (No. 7) Limited Partnership and
MH (No. 8) Limited Partnership.
Accountsintugroup.co.uk 125

Notes to the accounts continued
22 Joint ventures (continued) Set out below is the summarised information of the Group’s joint ventures with financial information presented at 100 per cent.
The summarised income statement of Puerto Venecia, Zaragoza is presented for the period from 30 September 2015 when it
became a joint venture.
2015
intu Merry Hill £m
St David’s, Cardiff
£m
Puerto Venecia
£m
intu Asturias
£m Other
£m Total
£m
Summary information
Group’s interest 50% 50% 50% 50%
Principal place of business England Wales Spain Spain
Summarised income statement
Revenue 58.8 41.0 5.4 13.2 19.6 138.0
Net rental income 43.3 27.6 4.5 9.9 13.4 98.7
Net other income – 0.1 – – – 0.1
Revaluation of investment and development property 24.4 122.7 (0.9) 20.0 13.9 180.1
Administration expenses – underlying (1.2) – (0.3) (0.7) (2.1) (4.3)
Administration expenses – exceptional – – (0.2) (0.7) – (0.9)
Finance costs (27.2) – (3.0) (8.0) (0.5) (38.7)
Finance income 0.1 – – – – 0.1
Change in fair value of derivative financial instruments – – (0.5) (0.9) – (1.4)
Taxation – underlying – – – (0.1) – (0.1)
Taxation – exceptional – – – (1.5) – (1.5)
Profit/(loss) 39.4 150.4 (0.4) 18.0 24.7 232.1
Group’s share of profit/(loss) 19.7 75.2 (0.2) 9.0 4.9 108.6
Summarised balance sheet
Investment and development property 895.8 718.1 331.5 177.8 252.2 2,375.4
Other non-current assets 1.1 2.8 0.4 4.0 4.4 12.7
Total non-current assets 896.9 720.9 331.9 181.8 256.6 2,388.1
Cash and cash equivalents 18.6 7.7 13.0 8.5 7.3 55.1
Other current assets 4.9 23.7 2.3 2.6 6.1 39.6
Total current assets 23.5 31.4 15.3 11.1 13.4 94.7
Current financial liabilities (5.3) (1.2) (3.9) (3.6) (2.4) (16.4)
Other current liabilities (21.1) (14.1) (7.4) (0.3) (3.7) (46.6)
Total current liabilities (26.4) (15.3) (11.3) (3.9) (6.1) (63.0)
Partners’ loans (772.4) (222.0) (164.6) (58.6) (131.1) (1,348.7)
Non-current financial liabilities – – (164.1) (70.0) – (234.1)
Other non-current liabilities – – – (12.2) – (12.2)
Total non-current liabilities (772.4) (222.0) (328.7) (140.8) (131.1) (1,595.0)
Net assets 121.6 515.0 7.2 48.2 132.8 824.8
Group’s share of net assets 60.8 257.5 3.6 24.1 34.8 380.8
intu properties plc Annual report 2015126

22 Joint ventures (continued) 2014
intu Merry Hill £m
St David’s, Cardiff
£m
intu Asturias
£m Other
£mTotal
£m
Summary information
Group’s interest 50% 50% 50%
Principal place of business England Wales Spain
Summarised income statement
Revenue 43.0 38.8 10.5 12.0 104.3
Net rental income 29.6 27.2 6.8 8.7 72.3
Net other income – 1.2 – – 1.2
Revaluation of investment and development property 53.7 75.5 28.8 1.5 159.5
Administration expenses (0.7) (0.1) (0.7) (0.8) (2.3)
Finance costs (18.8) (5.6) (5.4) – (29.8)
Finance income 0.1 – 0.1 – 0.2
Change in fair value of derivative financial instruments – 2.0 (0.9) – 1.1
Profit 63.9 100.2 28.7 9.4 202.2
Group’s share of profit 31.9 50.1 14.3 3.4 99.7
Summarised balance sheet
Investment and development property 868.9 594.1 164.4 245.1 1,872.5
Other non-current assets 0.5 20.6 4.4 2.3 27.8
Total non-current assets 869.4 614.7 168.8 247.4 1,900.3
Cash and cash equivalents 30.0 13.1 12.1 9.0 64.2
Other current assets 5.9 7.5 1.6 1.9 16.9
Total current assets 35.9 20.6 13.7 10.9 81.1
Current financial liabilities (17.8) (0.3) (3.8) (1.6) (23.5)
Other current liabilities (21.4) (13.3) (0.9) (5.3) (40.9)
Total current liabilities (39.2) (13.6) (4.7) (6.9) (64.4)
Partners’ loans (772.5) (257.2) (63.2) (1.4) (1,094.3)
Non-current financial liabilities – – (72.0) – (72.0)
Other non-current liabilities – – (11.2) – (11.2)
Total non-current liabilities (772.5) (257.2) (146.4) (1.4) (1,177.5)
Net assets 93.6 364.5 31.4 250.0 739.5
Group’s share of net assets 46.8 182.3 15.7 58.4 303.2
Accountsintugroup.co.uk 127
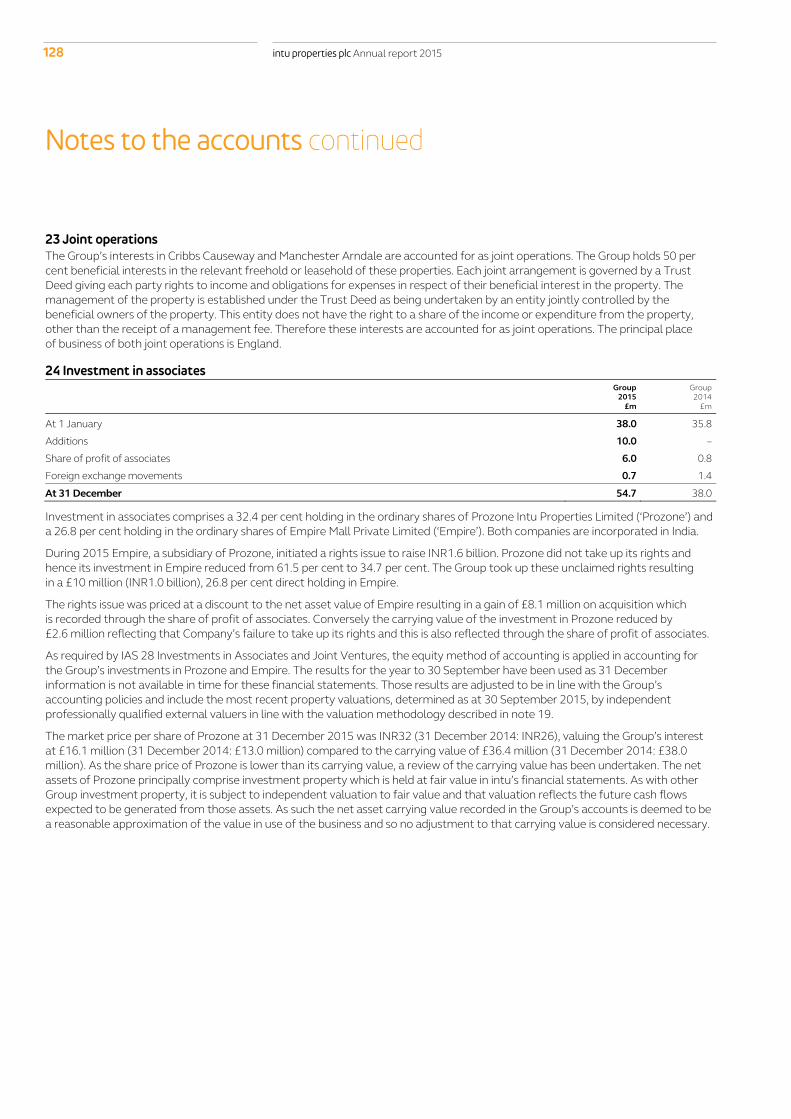
Notes to the accounts continued
23 Joint operations The Group’s interests in Cribbs Causeway and Manchester Arndale are accounted for as joint operations. The Group holds 50 per
cent beneficial interests in the relevant freehold or leasehold of these properties. Each joint arrangement is governed by a Trust
Deed giving each party rights to income and obligations for expenses in respect of their beneficial interest in the property. The
management of the property is established under the Trust Deed as being undertaken by an entity jointly controlled by the
beneficial owners of the property. This entity does not have the right to a share of the income or expenditure from the property,
other than the receipt of a management fee. Therefore these interests are accounted for as joint operations. The principal place
of business of both joint operations is England.
24 Investment in associates
Group 2015
£m
Group2014
£m
At 1 January 38.0 35.8
Additions 10.0 –
Share of profit of associates 6.0 0.8
Foreign exchange movements 0.7 1.4
At 31 December 54.7 38.0
Investment in associates comprises a 32.4 per cent holding in the ordinary shares of Prozone Intu Properties Limited (‘Prozone’) and
a 26.8 per cent holding in the ordinary shares of Empire Mall Private Limited (‘Empire’). Both companies are incorporated in India.
During 2015 Empire, a subsidiary of Prozone, initiated a rights issue to raise INR1.6 billion. Prozone did not take up its rights and
hence its investment in Empire reduced from 61.5 per cent to 34.7 per cent. The Group took up these unclaimed rights resulting
in a £10 million (INR1.0 billion), 26.8 per cent direct holding in Empire.
The rights issue was priced at a discount to the net asset value of Empire resulting in a gain of £8.1 million on acquisition which
is recorded through the share of profit of associates. Conversely the carrying value of the investment in Prozone reduced by
£2.6 million reflecting that Company’s failure to take up its rights and this is also reflected through the share of profit of associates.
As required by IAS 28 Investments in Associates and Joint Ventures, the equity method of accounting is applied in accounting for
the Group’s investments in Prozone and Empire. The results for the year to 30 September have been used as 31 December
information is not available in time for these financial statements. Those results are adjusted to be in line with the Group’s
accounting policies and include the most recent property valuations, determined as at 30 September 2015, by independent
professionally qualified external valuers in line with the valuation methodology described in note 19.
The market price per share of Prozone at 31 December 2015 was INR32 (31 December 2014: INR26), valuing the Group’s interest
at £16.1 million (31 December 2014: £13.0 million) compared to the carrying value of £36.4 million (31 December 2014: £38.0
million). As the share price of Prozone is lower than its carrying value, a review of the carrying value has been undertaken. The net
assets of Prozone principally comprise investment property which is held at fair value in intu’s financial statements. As with other
Group investment property, it is subject to independent valuation to fair value and that valuation reflects the future cash flows
expected to be generated from those assets. As such the net asset carrying value recorded in the Group’s accounts is deemed to be
a reasonable approximation of the value in use of the business and so no adjustment to that carrying value is considered necessary.
intu properties plc Annual report 2015128

24 Investment in associates (continued) Set out below is the summarised information of the Group’s investments in associates with financial information presented
at 100 per cent. The summarised income statement of Empire is presented for the period from 26 September 2015 when it
became an associate.
Prozone2015
£m
Empire 2015
£m
Total2015
£m
Prozone2014
£m
Summary information
Group’s interest 32.4% 26.8% 32.4%
Summarised income statement
Revenue 8.8 1.6 10.4 4.6
Revaluation of investment and development property 1.2 (0.2) 1.0 2.3
Other income statement items 0.8 (0.2) 0.6 0.1
Loss on Empire rights issue (8.1) – (8.1) –
(Loss)/profit reported by associate (6.1) (0.4) (6.5) 2.4
Group’s share of (loss)/profit reported by associate (2.0) (0.1) (2.1) 0.8
Group’s gain on Empire rights issue – 8.1 8.1 –
Group’s share of (loss)/profit (2.0) 8.0 6.0 0.8
Summarised balance sheet
Investment and development property 197.9 69.6 267.5 185.5
Other non-current assets 11.4 0.2 11.6 3.3
Current assets 23.4 8.6 32.0 20.3
Current liabilities (5.4) (2.8) (8.2) (8.7)
Non-current liabilities (25.0) (7.5) (32.5) (20.9)
Net assets 202.3 68.1 270.4 179.9
Non-controlling interests (89.9) – (89.9) (62.2)
Net assets attributable to owners 112.4 68.1 180.5 117.3
Group’s share of net assets attributable to owners 36.4 18.3 54.7 38.0
Accountsintugroup.co.uk 129
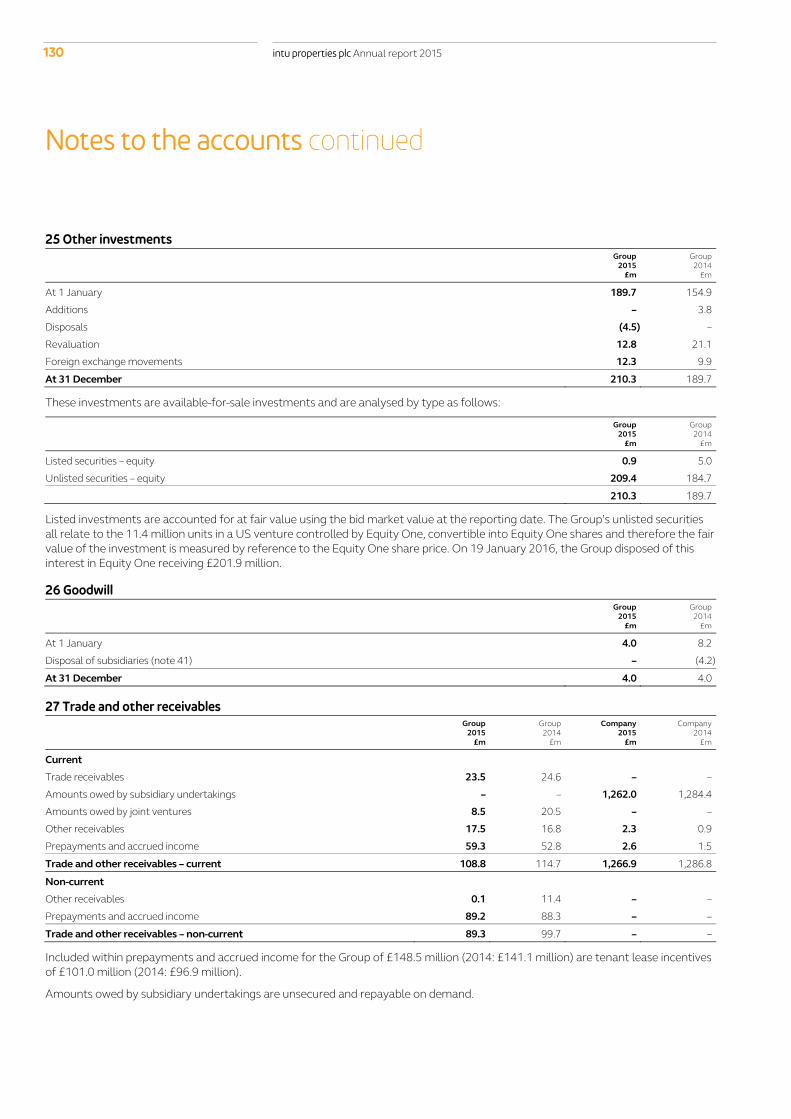
Notes to the accounts continued
25 Other investments
Group 2015
£m
Group2014
£m
At 1 January 189.7 154.9
Additions – 3.8
Disposals (4.5) –
Revaluation 12.8 21.1
Foreign exchange movements 12.3 9.9
At 31 December 210.3 189.7
These investments are available-for-sale investments and are analysed by type as follows:
Group 2015
£m
Group2014
£m
Listed securities – equity 0.9 5.0
Unlisted securities – equity 209.4 184.7
210.3 189.7
Listed investments are accounted for at fair value using the bid market value at the reporting date. The Group’s unlisted securities
all relate to the 11.4 million units in a US venture controlled by Equity One, convertible into Equity One shares and therefore the fair
value of the investment is measured by reference to the Equity One share price. On 19 January 2016, the Group disposed of this
interest in Equity One receiving £201.9 million.
26 Goodwill
Group 2015
£m
Group2014
£m
At 1 January 4.0 8.2
Disposal of subsidiaries (note 41) – (4.2)
At 31 December 4.0 4.0
27 Trade and other receivables Group
2015£m
Group 2014
£m
Company 2015
£m
Company2014
£m
Current
Trade receivables 23.5 24.6 – –
Amounts owed by subsidiary undertakings – – 1,262.0 1,284.4
Amounts owed by joint ventures 8.5 20.5 – –
Other receivables 17.5 16.8 2.3 0.9
Prepayments and accrued income 59.3 52.8 2.6 1.5
Trade and other receivables – current 108.8 114.7 1,266.9 1,286.8
Non-current
Other receivables 0.1 11.4 – –
Prepayments and accrued income 89.2 88.3 – –
Trade and other receivables – non-current 89.3 99.7 – –
Included within prepayments and accrued income for the Group of £148.5 million (2014: £141.1 million) are tenant lease incentives
of £101.0 million (2014: £96.9 million).
Amounts owed by subsidiary undertakings are unsecured and repayable on demand.
intu properties plc Annual report 2015130

28 Cash and cash equivalents Group
2015£m
Group 2014
£m
Company2015
£m
Company2014
£m
Unrestricted cash 273.6 212.5 0.3 1.0
Restricted cash 2.2 17.5 – –
Cash and cash equivalents 275.8 230.0 0.3 1.0
In 2015, restricted cash primarily relates to cash deposits to fund compulsory purchase orders related to the intu Watford
extension.
In 2014, restricted cash represented the deposit paid in relation to the acquisition of Puerto Venecia, Zaragoza.
A number of the Group’s borrowing arrangements place certain restrictions on the rent received each quarter. These do not prevent
access to or use of this funding within the borrowing entities, however they do place certain restrictions on moving those funds
around the wider group, typically requiring debt servicing costs to be paid before restrictions are lifted.
29 Derivative financial instruments All derivative financial instruments held by the Group relate to interest rate swaps which are classified as held for trading
(see note 35).
The derivative financial instrument held by the Company relates to the bondholder option (see note 33) and is classified as held
for trading.
30 Trade and other payables Group
2015£m
Group 2014
£m
Company2015
£m
Company2014
£m
Current
Rents received in advance 99.3 97.2 – –
Trade payables 4.6 2.7 – –
Amounts owed to joint ventures 0.4 2.7 – –
Amounts owed to subsidiary undertakings – – 326.8 376.8
Accruals and deferred income 132.0 110.7 11.2 10.6
Other payables 12.1 11.6 0.1 0.4
Other taxes and social security 27.1 26.6 8.2 6.3
Trade and other payables 275.5 251.5 346.3 394.1
Amounts owed to subsidiary undertakings are unsecured and repayable on demand.
Accountsintugroup.co.uk 131

Notes to the accounts continued
31 Borrowings 2015
Group
Carryingvalue
£mSecured
£m Unsecured
£m
Fixed rate £m
Floating rate £m
Fairvalue
£m
Current
Bank loans and overdrafts 122.8 122.8 – – 122.8 122.8
Commercial mortgage backed securities (‘CMBS’) notes 14.1 14.1 – 14.1 – 16.4
Current borrowings, excluding finance leases 136.9 136.9 – 14.1 122.8 139.2
Finance lease obligations 2.4 2.4 – 2.4 – 2.4
139.3 139.3 – 16.5 122.8 141.6
Non-current
Revolving credit facility 2020 353.7 353.7 – – 353.7 353.7
CMBS notes 2019 19.6 19.6 – 19.6 – 20.2
CMBS notes 2022 50.9 50.9 – 50.9 – 60.6
CMBS notes 2024 87.5 87.5 – 87.5 – 91.4
CMBS notes 2029 83.7 83.7 – 83.7 – 94.1
CMBS notes 2033 339.0 339.0 – 339.0 – 400.1
CMBS notes 2035 188.4 188.4 – – 188.4 194.7
Bank loans 2017 346.9 346.9 – – 346.9 346.9
Bank loans 2020 380.0 380.0 – – 380.0 380.0
Bank loan 2021 120.6 120.6 – – 120.6 120.6
3.875% bonds 2023 441.3 441.3 – 441.3 – 461.3
4.125% bonds 2023 476.6 476.6 – 476.6 – 504.0
4.625% bonds 2028 341.2 341.2 – 341.2 – 380.8
4.250% bonds 2030 344.5 344.5 – 344.5 – 358.1
Debenture 2027 228.2 228.2 – 228.2 – 227.7
2.5% convertible bonds 2018 (note 33) 326.4 – 326.4 326.4 – 326.4
Non-current borrowings, excluding finance leases and Metrocentre
compound financial instrument 4,128.5 3,802.1 326.4 2,738.9 1,389.6 4,320.6
Metrocentre compound financial instrument 172.0 – 172.0 172.0 – 172.0
Finance lease obligations 31.8 31.8 – 31.8 – 31.8
4,332.3 3,833.9 498.4 2,942.7 1,389.6 4,524.4
Total borrowings 4,471.6 3,973.2 498.4 2,959.2 1,512.4 4,666.0
Cash and cash equivalents (275.8)
Net debt 4,195.8
Analysis of the Group’s net external debt is provided in the other information section.
The Group substantially eliminates its interest rate exposure to floating rate debt through interest rate swaps as described in
note 35.
The market value of investment property secured, either directly or indirectly, as collateral against borrowings at 31 December
2015 is £9,473.7 million including £1,118.7 million of investment property held within joint ventures (2014: £8,844.0 million
including £824.9 million held within joint ventures). In most circumstances the Group can realise up to 50 per cent without
restriction providing the Group continues to manage the asset. Realising an amount in excess of this would trigger a change
of control and mandatory repayment of the facility.
The Company had non-current borrowings of £353.7 million at 31 December 2015 consisting of a revolving credit facility expiring
in 2020 (2014: £230.0 million). This debt is floating rate, secured and its fair value is equal to book value.
The fair value of fixed rate borrowings and CMBS is assessed based on quoted market prices, and as such are categorised as
Level 1 in the fair value hierarchy (see note 35 for definition). The fair values of unlisted floating rate borrowings are equal to
their carrying value.
intu properties plc Annual report 2015132

31 Borrowings (continued) 2014
Group
Carryingvalue
£mSecured
£m Unsecured
£m
Fixed rate £m
Floatingrate£m
Fairvalue
£m
Current
Bank loans and overdrafts 1.7 1.7 – – 1.7 1.7
Commercial mortgage backed securities (‘CMBS’) notes 16.5 16.5 – 13.3 3.2 19.1
Current borrowings, excluding finance leases 18.2 18.2 – 13.3 4.9 20.8
Finance lease obligations 3.1 3.1 – 3.1 – 3.1
21.3 21.3 – 16.4 4.9 23.9
Non-current
Revolving credit facility 2019 230.0 230.0 – – 230.0 230.0
CMBS notes 2019 19.5 19.5 – 19.5 – 20.3
CMBS notes 2022 51.2 51.2 – 51.2 – 62.8
CMBS notes 2024 87.4 87.4 – 87.4 – 95.4
CMBS notes 2029 88.6 88.6 – 88.6 – 101.9
CMBS notes 2033 351.8 351.8 – 351.8 – 429.5
CMBS notes 2035 186.2 186.2 – – 186.2 208.4
Bank loans 2016 330.8 330.8 – – 330.8 330.8
Bank loan 2017 166.5 166.5 – – 166.5 166.5
Bank loan 2018 347.9 347.9 – – 347.9 347.9
Bank loan 2021 120.3 120.3 – – 120.3 120.3
3.875% bonds 2023 440.2 440.2 – 440.2 – 474.1
4.125% bonds 2023 475.8 475.8 – 475.8 – 518.4
4.625% bonds 2028 340.6 340.6 – 340.6 – 392.7
4.250% bonds 2030 344.5 344.5 – 344.5 – 376.8
Debenture 2027 227.9 227.9 – 227.9 – 241.0
2.5% convertible bonds 2018 (note 33) 325.6 – 325.6 325.6 – 325.6
Non-current borrowings, excluding finance leases and Metrocentre
compound financial instrument 4,134.8 3,809.2 325.6 2,753.1 1,381.7 4,442.4
Metrocentre compound financial instrument 166.1 – 166.1 166.1 – 166.1
Finance lease obligations 31.8 31.8 – 31.8 – 31.8
4,332.7 3,841.0 491.7 2,951.0 1,381.7 4,640.3
Total borrowings 4,354.0 3,862.3 491.7 2,967.4 1,386.6 4,664.2
Cash and cash equivalents (230.0)
Net debt 4,124.0
The maturity profile of debt (excluding finance leases) is as follows:
Group2015
£m
Group2014
£m
Repayable within one year 136.9 18.2
Repayable in more than one year but not more than two years 346.6 328.4
Repayable in more than two years but not more than five years 1,150.5 1,148.1
Repayable in more than five years 2,803.4 2,824.4
4,437.4 4,319.1
Certain borrowing agreements contain financial and other conditions that, if contravened, could alter the repayment profile. During
the year there were no breaches of these conditions (see financial covenants section on pages 162 and 163).
Accountsintugroup.co.uk 133

Notes to the accounts continued
31 Borrowings (continued) As at 31 December 2015 the Group had committed borrowing facilities of £640.7 million, £600.0 million expiring in 2020 and
£40.7 million expiring in 2021. At 31 December 2015, £287.0 million was undrawn (2014: facilities £640.7 million, undrawn
£410.7 million).
Finance lease disclosures:
Group 2015
£m
Group2014
£m
Minimum lease payments under finance leases fall due:
Not later than one year 4.2 4.2
Later than one year and not later than five years 17.0 17.0
Later than five years 62.5 64.3
83.7 85.5
Future finance charges on finance leases (49.5) (50.6)
Present value of finance lease liabilities 34.2 34.9
Present value of finance lease liabilities:
Not later than one year 2.4 3.1
Later than one year and not later than five years 13.9 13.5
Later than five years 17.9 18.3
34.2 34.9
Finance lease liabilities are in respect of head leases on investment property. A number of these leases provide for payment of
contingent rent, usually a proportion of net rental income, in addition to the rents above.
32 Movement in net debt 2015
Group
Cash andcash
equivalents£m
Current borrowings
£m
Non- current
borrowings £m
Netdebt
£m
Balance at 1 January 2015 230.0 (21.3) (4,332.7) (4,124.0)
Acquisition of businesses (200.7) – (138.2) (338.9)
Disposal of subsidiaries 78.6 – 161.8 240.4
Borrowings drawn 329.2 – (329.2) –
Borrowings repaid (190.3) 20.3 170.0 –
Issue of ordinary shares 22.0 – – 22.0
Cash flows with joint ventures 51.4 – – 51.4
Other net cash movements (44.4) – – (44.4)
Other non-cash movements – (138.3) 136.0 (2.3)
Balance at 31 December 2015 275.8 (139.3) (4,332.3) (4,195.8)
intu properties plc Annual report 2015134

32 Movement in net debt (continued) 2014
Group
Cash andcash
equivalents£m
Current borrowings
£m
Non-current
borrowings£m
Netdebt
£m
Balance at 1 January 2014 156.7 (70.9) (3,944.0) (3,858.2)
Acquisition of businesses (851.3) – – (851.3)
Disposal of subsidiaries 162.5 – – 162.5
Borrowings drawn 989.4 – (989.4) –
Borrowings repaid (675.1) 1.4 672.7 (1.0)
Issue of ordinary shares 492.0 – – 492.0
Cash flows with joint ventures (26.1) – – (26.1)
Other net cash movements (18.1) – – (18.1)
Other non-cash movements – 48.2 (72.0) (23.8)
Balance at 31 December 2014 230.0 (21.3) (4,332.7) (4,124.0)
33 Convertible bonds 2.5 per cent convertible bonds (‘the 2.5 per cent bonds’)
On 4 October 2012 Intu (Jersey) Limited (the ‘Issuer’) issued £300.0 million 2.5 per cent Guaranteed Convertible Bonds due 2018
at par all of which remain outstanding at 31 December 2015. At 31 December 2015 the exchange price was £3.4398 per ordinary
share. intu properties plc has unconditionally and irrevocably guaranteed the due and punctual performance by the Issuer of all
of its obligations (including payments) in respect of the 2.5 per cent bonds and the obligations of the Company, as guarantor,
constitute direct, unsubordinated and unsecured obligations of the Company.
Subject to certain conditions, the 2.5 per cent bonds are convertible into preference shares of the Issuer which are automatically
transferred to the Company in exchange for ordinary shares in the Company or (at the Company’s election) any combination of
ordinary shares and cash. The 2.5 per cent bonds can be converted at any time from 14 November 2012 up to the 20th dealing
day before the maturity date.
The initial exchange price was £4.3752 per ordinary share, a conversion rate of approximately 22,856 ordinary shares for every
£100,000 nominal of the 2.5 per cent bonds. Under the terms of the 2.5 per cent bonds, the exchange price is adjusted upon
certain events including the rights issue on 22 April 2014 and the payment of dividends by the Company.
The 2.5 per cent bonds may be redeemed at par at the Company’s option subject to the Company’s ordinary share price having
traded at 30 per cent above the conversion price for a specified period, or at any time once 85 per cent by nominal value of the
2.5 per cent bonds originally issued have been converted or cancelled. If not previously converted, redeemed or purchased and
cancelled, the 2.5 per cent bonds will be redeemed at par on 4 October 2018.
The 2.5 per cent bonds are designated as at fair value through profit or loss and so are presented on the balance sheet at fair
value with all gains and losses taken to the income statement through the changes in fair value of financial instruments line.
At 31 December 2015, the fair value of the 2.5 per cent bonds was £326.4 million (2014: £325.6 million), with the change in fair
value reflected in note 13. The 2.5 per cent bonds are listed on the Professional Securities Market of the London Stock Exchange.
During the year interest of £7.5 million (2014: £7.5 million) in respect of these bonds has been recognised within finance costs.
In the Company’s balance sheet the bondholder option is held at its fair value of £26.4 million as a derivative financial instrument
(2014: £25.6 million).
3.75 per cent convertible bonds (‘the 3.75 per cent bonds’)
In 2011 intu properties plc issued £154.3 million, 3.75 per cent perpetual subordinated convertible bonds, with a conversion price
of £4.00 per ordinary share, in connection with the acquisition of intu Trafford Centre. These were accounted for as equity at their
fair value on issue which totalled £143.7 million. Following the rights issue on 22 April 2014, the conversion price was adjusted to
£3.64 per ordinary share. On 2 July 2014 a conversion notice was issued for all the bonds resulting in 42,394,779 new ordinary
shares being issued.
During 2014 interest of £2.9 million was recognised directly in equity. This is deducted in arriving at earnings per share (see note 17).
Accountsintugroup.co.uk 135

Notes to the accounts continued
34 Operating leases The Group earns rental income by leasing its investment properties to tenants under operating leases.
In the UK the standard shopping centre lease is for a term of 10 to 15 years. Standard lease provisions include service charge
payments, recovery of other direct costs and review every five years to market rent. Standard turnover based leases have a turnover
percentage agreed with each lessee which is applied to a retail unit’s annual sales and any excess between the resulting turnover
rent and the minimum rent is receivable by the Group.
The future minimum lease amounts receivable under non-cancellable operating leases for continuing operations are as follows:
2015
£m 2014
£m
Not later than one year 408.3 416.9
Later than one year and not later than five years 1,210.0 1,263.3
Later than five years 1,287.7 1,423.2
2,906.0 3,103.4
The income statement includes £1.1 million (2014: £3.6 million) recognised in respect of expected increased rent resulting from
outstanding reviews where the actual rent will only be determined on settlement of the rent review.
The income statement includes £11.7 million (2014: £12.0 million) recognised in respect of contingent rents calculated by reference
to tenants’ turnover.
35 Financial risk management The Group is exposed to a variety of financial risks arising from the Group’s operations being principally market risk (including
interest rate risk and foreign exchange risk), liquidity risk and credit risk.
The majority of the Group’s financial risk management is carried out by the Group’s treasury department. The policies for managing
each of these risks and their impact on the results for the year are summarised below.
Market risk
a) Interest rate risk
Interest rate risk comprises both cash flow and fair value risks. Cash flow interest rate risk is the risk that the future cash flows of a
financial instrument will fluctuate due to changes in market interest rates. Fair value interest rate risk is the risk that the fair value of
financial instruments will fluctuate as a result of changes in market interest rates.
The Group’s interest rate risk arises from borrowings issued at variable rates that expose the Group to cash flow interest rate risk,
whereas borrowings issued at fixed interest rates expose the Group to fair value interest rate risk. Bank debt is typically issued at
floating rates linked to LIBOR. Bond debt and other capital market debt is generally issued at fixed rates.
It is Group policy, and often a requirement of the Group’s lenders, to eliminate substantially all exposure to interest rate fluctuations
by using floating to fixed interest rate swaps in order to establish certainty over cash flows. Such swaps have the economic effect of
converting borrowings from floating to fixed rates.
As a consequence, the Group is exposed to market price risk in respect of the fair value of its fixed rate interest rate swaps, as
discussed in the financial review on pages 46 to 51.
The table below shows the effects of interest rate swaps on the borrowings profile of the Group:
Fixed2015
£m
Floating 2015
£m
Fixed 2014
£m
Floating2014
£m
Borrowings1 2,725.1 1,570.4 2,738.4 1,448.6
Derivative impact (nominal value of interest rate swaps) 978.0 (978.0) 943.9 (943.9)
Net borrowings profile 3,703.1 592.4 3,682.3 504.7
Interest rate protection 86.2% 87.9%
1 Borrowings are stated at nominal value and exclude the Metrocentre compound financial instrument and finance leases. At 31 December 2015 they include the £353.7 million
(2014: £230.0 million) drawn under the revolving credit facility which incurs interest at a variable rate. Excluding the revolving credit facility, interest rate protection is 94.0 per
cent (2014: 93.1 per cent).
Group policy is to target interest rate protection within the range of 75 per cent to 100 per cent.
The weighted average rate for interest rate swaps currently effective is 2.12 per cent (2014: 2.24 per cent).
intu properties plc Annual report 2015136

35 Financial risk management (continued) Unallocated swaps (including certain forward starting swaps) are excluded from the above calculation. The nominal value of these
swaps is £746.7 million (2014: £746.7 million) of which £125.0 million (2014: £125.0 million) are forward starting. Their fair value of
£239.1 million (2014: £242.5 million) is included as a liability in the balance sheet.
The approximate impact of a 50 basis point shift upwards in the level of interest rates would be a positive movement of £74.1 million
(2014: £83.6 million) in the fair value of derivatives. The approximate impact of a 50 basis point shift downwards in the level of
interest rates would be a negative movement of £79.8 million (2014: £90.2 million) in the fair value of derivatives. In practice, a
parallel shift in the yield curve is highly unlikely. However, the above sensitivity analysis is a reasonable illustration of the possible
effect from the changes in slope and shifts in the yield curve that may actually occur. Where the fixed rate derivative financial
instruments are matched by floating rate debt, the overall effect on Group cash flow of such a movement would be very small.
b) Foreign exchange risk
Foreign exchange risk arises when future commercial transactions or recognised assets or liabilities are denominated in a functional
currency other than sterling. The Group’s policy is to ensure the Group’s net exposure to foreign currency is less than 10 per cent of
the Group’s equity attributable to owners of the Company. At 31 December 2015 the Group’s exposure amounted to 7.9 per cent
of equity attributable to owners of the Company (31 December 2014: 6.4 per cent).
The table summarises the Group’s exposure to foreign currency risk:
2015
€m2014
€m2015
INRm2014
INRm 2015
US$m2014
US$m
Net exposure 170.4 87.0 5,421.4 3,819.3 311.1 288.0
The following foreign exchange rates apply to the Group’s foreign exchange risk:
2015
€m2014
€m2015
INRm2014
INRm 2015
US$m2014
US$m
Foreign exchange rate 1.3568 1.2886 97.5080 98.4238 1.4739 1.5593
The approximate impact of a 10 per cent appreciation in foreign exchange rates would be positive movement of £43.6 million
(2014: £32.3 million) to equity attributable to owners of the Company. The approximate impact of a 10 per cent depreciation in
foreign exchange rates would be a negative movement of £35.7 million (2014: £26.5 million) to equity attributable to owners of
the Company.
Liquidity risk
Liquidity risk is managed to ensure that the Group is able to meet future payment obligations when financial liabilities fall due.
Liquidity analysis is conducted to ensure that sufficient headroom is available to meet the Group’s operational requirements and
committed investments. The Group treasury policy aims to meet this objective through maintaining adequate cash, marketable
securities and committed facilities to meet these requirements. Undrawn borrowing facilities are detailed in note 31. The Group’s
policy is to seek to optimise its exposure to liquidity risk by balancing its exposure to interest rate risk and to refinancing risk. In
effect the Group seeks to borrow for as long as possible at the lowest acceptable cost.
Group policy is to maintain a weighted average debt maturity of over five years. As at 31 December 2015, the maturity profile of
Group debt showed an average maturity of eight years (2014: eight years). The Group regularly reviews the maturity profile of its
borrowings and seeks to avoid bunching of maturities through the regular replacement of facilities and by arranging a selection of
maturity dates. Refinancing risk may be reduced by doing so prior to the contracted maturity date, effectively switching liquidity
risk for market risk.
Accountsintugroup.co.uk 137

Notes to the accounts continued
35 Financial risk management (continued) The tables below set out the maturity analysis of the Group’s financial liabilities based on the undiscounted contractual obligations
to make payments of interest and to repay principal. Where interest payment obligations are based on a floating rate the rates used
are those implied by the par yield curve for the relevant currency. Where payment obligations are in foreign currencies, the spot
exchange rate at the balance sheet date is used.
2015
Group Within 1 year
£m1–2 years
£m2–5 years
£m Over 5 years
£m Total
£m
Borrowings (including interest) (285.9) (561.9) (1,611.6) (3,456.9) (5,916.3)
Finance lease obligations (4.3) (4.3) (12.8) (63.2) (84.6)
Other financial liabilities (17.3) (2.8) – – (20.1)
Derivative payments (54.4) (50.0) (132.6) (448.3) (685.3)
Derivative receipts 14.1 15.4 49.9 217.5 296.9
(347.8) (603.6) (1,707.1) (3,750.9) (6,409.4)
2014
Group Within 1 year
£m1–2 years
£m2–5 years
£m Over 5 years
£m Total
£m
Borrowings (including interest) (180.2) (514.6) (1,574.9) (3,607.3) (5,877.0)
Finance lease obligations (4.2) (4.2) (12.7) (64.4) (85.5)
Other financial liabilities (17.0) (2.5) – – (19.5)
Derivative payments (121.6) (61.7) (143.5) (198.7) (525.5)
Derivative receipts 17.0 15.7 34.0 90.1 156.8
(306.0) (567.3) (1,697.1) (3,780.3) (6,350.7)
2015
Company Within 1 year
£m1–2 years
£m2–5 years
£m Over 5 years
£m Total
£m
Borrowings (including interest) (0.9) (24.4) (396.1) – (421.4)
Other financial liabilities (0.3) – – – (0.3)
Amounts owed to subsidiary undertakings (326.8) – – – (326.8)
(328.0) (24.4) (396.1) – (748.5)
2014
Company Within 1 year
£m1–2 years
£m2–5 years
£m Over 5 years
£m Total
£m
Borrowings (including interest) (7.9) (7.5) (545.0) – (560.4)
Other financial liabilities (0.2) – – – (0.2)
Amounts owed to subsidiary undertakings (376.8) – – – (376.8)
(384.9) (7.5) (545.0) – (937.4)
Credit risk
Credit risk is the risk of financial loss if a tenant or counterparty fails to meet an obligation under a contract. Credit risk arises
primarily from trade receivables but also from the Group’s holdings of assets with counterparties such as cash deposits and
derivative instruments.
Credit risk associated with trade receivables is actively managed; tenants are managed individually by asset managers, who
continuously monitor and work with tenants, aiming wherever possible to identify and address risks prior to default.
Prospective tenants are assessed via a review process, including obtaining credit ratings and reviewing financial information,
which is conducted internally. As a result deposits or guarantees may be obtained. The amount of deposits held as collateral
at 31 December 2015 is £3.7 million (2014: £3.4 million).
It is Group policy to calculate any impairment of receivables specifically on each contract.
intu properties plc Annual report 2015138

35 Financial risk management (continued) The ageing analysis of trade receivables is as follows:
Group2015
£m
Group2014
£m
Up to three months 20.9 22.5
Three to six months 2.6 2.1
Trade receivables 23.5 24.6
At 31 December 2015 trade receivables are shown net of provisions totalling £3.8 million (2014: £7.1 million).
The credit risk relating to cash deposits and derivative financial instruments is actively managed by the Group’s treasury
department. Relationships are maintained with a number of tier one institutional counterparties, ensuring compliance with
Group policy relating to limits on the credit ratings of counterparties (between BBB+ and AAA).
Excessive credit risk concentration is avoided through adhering to authorised limits for all counterparties.
Counterparty Credit rating Authorised limit
£m
Group Exposure31 December 2015
£m
Counterparty #1 AA– 125.0 86.8
Counterparty #2 AAA 150.0 68.7
Counterparty #3 A 100.0 49.6
Counterparty #4 BBB+ 75.0 49.3
Counterparty #5 A– 100.0 11.5
Sum of five largest exposures 265.9
Sum of cash deposits and derivative financial instrument assets 279.0
Five largest exposures as a percentage of risk 95%
Classification of financial assets and liabilities
The tables below set out the Group’s accounting classification of each class of financial assets and liabilities and their fair values
at 31 December 2015 and 31 December 2014.
The fair values of derivative financial instruments are determined from observable market prices or estimated using appropriate
yield curves at 31 December each year by discounting the future contractual cash flows to the net present values. The
determination of the fair values of borrowings is defined in note 31.
2015
Carryingvalue
£m
Fair value
£m
Profit/(loss) to income
statement£m
Profit toother
comprehensive income
£m
Derivative financial instrument assets 3.2 3.2 (6.2) –
Total held for trading assets 3.2 3.2 (6.2) –
Trade and other receivables 49.6 49.6 – –
Cash and cash equivalents 275.8 275.8 – –
Total cash and receivables 325.4 325.4 – –
Other investments 210.3 210.3 – 12.8
Total available-for-sale investments 210.3 210.3 – 12.8
Derivative financial instrument liabilities (341.7) (341.7) 13.0 –
Total held for trading liabilities (341.7) (341.7) 13.0 –
Trade and other payables (20.1) (20.1) – –
Borrowings (4,471.6) (4,666.0) (0.8) –
Total loans and payables (4,491.7) (4,686.1) (0.8) –
Accountsintugroup.co.uk 139

Notes to the accounts continued
35 Financial risk management (continued) 2014
Carryingvalue
£m
Fair value
£m
Profit/(loss) to income
statement £m
Profit toother
comprehensive income
£m
Derivative financial instrument assets 9.7 9.7 (15.9) –
Total held for trading assets 9.7 9.7 (15.9) –
Trade and other receivables 70.9 70.9 – –
Cash and cash equivalents 230.0 230.0 – –
Total cash and receivables 300.9 300.9 – –
Other investments 189.7 189.7 – 21.1
Total available-for-sale investments 189.7 189.7 – 21.1
Derivative financial instrument liabilities (356.5) (356.5) (128.9) –
Total held for trading liabilities (356.5) (356.5) (128.9) –
Trade and other payables (19.5) (19.5) – –
Borrowings (4,354.0) (4,664.2) (12.8) –
Total loans and payables (4,373.5) (4,683.7) (12.8) –
The table below presents the Group’s financial assets and liabilities recognised at fair value.
2015
Level 1£m
Level 2 £m
Level 3 £m
Total £m
Assets
Derivative financial instruments:
— Fair value through profit or loss – 3.2 – 3.2
Available-for-sale investments 0.9 209.4 – 210.3
Total assets 0.9 212.6 – 213.5
Liabilities
Convertible bonds:
— Designated as at fair value through profit or loss (326.4) – – (326.4)
Derivative financial instruments:
— Fair value through profit or loss – (341.7) – (341.7)
Total liabilities (326.4) (341.7) – (668.1)
2014
Level 1£m
Level 2 £m
Level 3 £m
Total £m
Assets
Derivative financial instruments:
— Fair value through profit or loss – 9.7 – 9.7
Available-for-sale investments 5.0 184.7 – 189.7
Total assets 5.0 194.4 – 199.4
Liabilities
Convertible bonds:
— Designated as at fair value through profit or loss (325.6) – – (325.6)
Derivative financial instruments:
— Fair value through profit or loss – (356.5) – (356.5)
Total liabilities (325.6) (356.5) – (682.1)
intu properties plc Annual report 2015140

35 Financial risk management (continued) Fair value hierarchy
Level 1: Valuation based on quoted market prices traded in active markets.
Level 2: Valuation techniques are used, maximising the use of observable market data, either directly from market prices or derived
from market prices.
Level 3: Where one or more significant inputs to valuation are unobservable. Valuations at this level are more subjective and
therefore more closely managed, including sensitivity analysis of inputs to valuation models. Such testing has not indicated that any
material difference would arise due to a change in input variables.
Transfers into and transfers out of the fair value hierarchy levels are recognised on the date of the event or change in circumstances
that caused the transfer. There were no transfers in or out for the above financial assets and liabilities during the year.
Valuation techniques for level 2 hierarchy financial assets and liabilities are presented in the accounting policies.
Capital structure
The Group seeks to enhance shareholder value both by investing in the business so as to improve the return on investment and by
managing the capital structure. The capital of the Group consists of equity, debt and compound financial instruments. The Group
aims to access both debt and equity capital markets with maximum efficiency and flexibility.
The key ratios used to monitor the capital structure of the Group are the debt to assets ratio and interest cover. The Group’s stated
medium to long-term preference is for the debt to assets ratio to be within the 40–50 per cent range and interest cover to be
greater than 1.60x. At 31 December 2015 the debt to asset ratio remains within the preferred range and the interest cover ratio
continues to be above the preferred level.
As the Group’s debt is sometimes secured on its interests in joint ventures, these ratios are monitored for the Group including share
of joint ventures. A reconciliation from the relevant amounts as presented to those including the Group’s share of joint ventures is
presented in the other information section.
Debt to assets ratio
Group2015
£m
Group2014
£m
Market value of investment and development property 9,602.4 8,963.4
Net external debt (4,139.1) (3,963.4)
Debt to assets ratio 43.1% 44.2%
Interest cover
Group2015
£m
Group2014
£m
Finance costs (208.9) (201.2)
Finance income 1.6 1.2
Interest on convertible bonds recognised directly in equity – (2.9)
(207.3) (202.9)
Underlying operating profit 395.6 370.3
Remove trading property related items – (0.6)
395.6 369.7
Interest cover 1.91x 1.82x
Accountsintugroup.co.uk 141

Notes to the accounts continued
36 Deferred tax Under IAS 12 Income Taxes, provision is made for the deferred tax assets and liabilities associated with the revaluation of assets
and liabilities at the corporate tax rate expected to apply to the Group at the time the temporary differences are expected to
reverse. For those UK assets and liabilities benefitting from REIT exemption, the relevant tax rate will be 0 per cent (2014: 0 per
cent), for other UK assets and liabilities the relevant rate will be 20 per cent if the temporary difference is expected to be realised
before 1 April 2017, 19 per cent if it is expected to be realised on or after 1 April 2017 but before 1 April 2020 and 18 per cent if it is
expected to be realised on or after 1 April 2020 (2014: 20 per cent). For other assets and liabilities the tax rate will be the relevant
expected corporate tax rate in the relevant country.
Movements in the provision for deferred tax:
Group
Investment and development
property£m
Otherinvestments
£m
Derivative financial
instruments £m
Other temporary
differences £m
Total£m
Provided deferred tax provision/(asset):
At 1 January 2014 12.0 8.4 (8.0) (0.4) 12.0
Recognised in the income statement – (0.9) (5.6) (0.1) (6.6)
Recognised in other comprehensive income – 6.6 – – 6.6
Disposal of subsidiaries (note 41) (12.0) – – – (12.0)
At 31 December 2014 – 14.1 (13.6) (0.5) –
Acquisition of Puerto Venecia, Zaragoza 6.1 – – (6.1) –
Recognised in the income statement (0.8) (0.2) (2.8) (1.2) (5.0)
Recognised in other comprehensive income – 5.0 – – 5.0
Foreign exchange movements (0.2) – – 0.2 –
Disposal of subsidiaries (5.1) – – 5.1 –
At 31 December 2015 – 18.9 (16.4) (2.5) –
At 31 December 2015, the Group had unrecognised deferred tax assets calculated at a tax rate of 18 per cent (2014: 20 per cent)
of £54.2 million (2014: £55.7 million) for surplus UK revenue tax losses carried forward, £31.3 million (2014: £40.0 million) for
temporary differences on derivative financial instruments and £0.6 million (2014: £0.5 million) for temporary differences on
capital allowances.
In accordance with the requirements of IAS 12 Income Taxes, the deferred tax asset has not been recognised in the Group financial
statements due to uncertainty over the level of profits that will be available in the non-REIT elements of the Group in future periods.
The Company recognises a deferred tax asset of £1.1 million (2014: £0.4 million), which resulted from carried forward losses.
In 2014, this also resulted from the difference between the timing of certain deductions for tax and accounting purposes.
37 Share capital and share premium
Share capital
£m
Share premium
£m
Issued and fully paid:
At 1 January 2014: 973,845,701 ordinary shares of 50p each 486.9 695.6
Ordinary shares issued on conversion of bonds (note 33) 21.2 122.5
Other ordinary shares issued 150.3 403.9
At 31 December 2014: 1,316,838,051 ordinary shares of 50p each 658.4 1,222.0
Ordinary shares issued 13.9 81.1
At 31 December 2015: 1,344,661,827 ordinary shares of 50p each 672.3 1,303.1
During the year the Company issued a total of 75,777 ordinary shares in connection with the exercise of options by employees and
former employees under the intu properties plc approved share option scheme and the intu properties plc unapproved share option
scheme. As a result the Company’s share capital increased by 0.1 million and share premium by £0.2 million.
On 20 May 2015 the Company issued 6,256,075 new ordinary shares of 50p each to entities in the Peel Group at £3.4635 per share
in connection with the purchase of the two parcels of land in the province of Málaga, Spain. As a result share capital increased by
£3.1 million and share premium by £18.6 million. See note 46.
intu properties plc Annual report 2015142

37 Share capital and share premium (continued) On 28 May 2015 and 24 November 2015, the Company issued 16,071,625 and 5,420,299 new ordinary shares of 50p each
respectively to shareholders who elected to receive their 2014 final and 2015 interim dividends in shares under the Scrip Dividend
Scheme. The value of the Scrip Shares was calculated in accordance with the terms of the Scrip Dividend Scheme, being the average
middle market quotations for each day between 24 March to 30 March 2015 inclusive and between 2 October to 8 October 2015
respectively less the gross amount of dividend payable. As a result the Company’s share capital increased by £10.7 million and
share premium by £62.3 million.
Full details of the rights and obligations attaching to the ordinary shares are contained in the Company’s Articles of Association.
These rights include an entitlement to receive the Company’s report and financial statements, to attend and speak at General
Meetings of the Company, to appoint proxies and to exercise voting rights. Holders of ordinary shares may also receive dividends
and may receive a share of the Company’s assets on the Company’s liquidation. There are no restrictions on the transfer of the
ordinary shares.
At 26 February 2016 the Company had an unexpired authority to repurchase shares up to a maximum of 131,683,805 shares with
a nominal value of £65.8 million, and the Directors have an unexpired authority to allot up to a maximum of 438,946,017 shares
with a nominal value of £219.5 million.
Included within the issued share capital as at 31 December 2015 are 12,712,516 ordinary shares (2014: 13,131,185) held by the
Trustee of the ESOP which is operated by the Company (note 38). The nominal value of these shares at 31 December 2015 is
£6.4 million (2014: £6.6 million).
38 Employee Share Ownership Plan (‘ESOP’) The cost of shares in intu properties plc held by the Trustee of the Employee Share Ownership Plan operated by the Company
is accounted for as a deduction from equity.
The purpose of the ESOP is to acquire and hold shares which will be transferred to employees in the future under the Group’s
employee incentive arrangements as described in note 47 and the Director’s remuneration report on pages 78 to 91, including
joint ownership of shares in its role as Trustee of the Joint Share Ownership Plan. Dividends of £1.6 million (2014: £1.4 million)
in respect of these shares have been waived by agreement.
Group and Company
2015Sharesmillion
2015 £m
2014Sharesmillion
2014£m
At 1 January 13.1 45.1 12.6 48.2
Adjustment for rights issue – – 1.3 –
Acquisitions 0.5 1.6 0.3 1.0
Disposals (0.9) (3.4) (1.1) (4.1)
At 31 December 12.7 43.3 13.1 45.1
Accountsintugroup.co.uk 143

Notes to the accounts continued
39 Other reserves
Group
Capitalredemption
£m
Translation reserve
£m Other
£m Total
£m
At 1 January 2014 61.4 (7.3) 446.4 500.5
Revaluation of other investments (note 25) – – 21.1 21.1
Exchange differences – 7.4 – 7.4
Tax relating to components of other comprehensive income (note 14) – – (6.6) (6.6)
Realisation of merger reserve – – (164.4) (164.4)
At 31 December 2014 61.4 0.1 296.5 358.0
Revaluation of other investments (note 25) – – 12.8 12.8
Exchange differences – 7.6 – 7.6
Tax relating to components of other comprehensive income (note 14) – – (5.0) (5.0)
Reclassified to income statement on sale of other investments – – (0.6) (0.6)
At 31 December 2015 61.4 7.7 303.7 372.8
Company
Capital redemption
£m
Merger reserve
£m Total
£m
At 1 January 2014 61.4 164.4 225.8
Realisation of merger reserve – (164.4) (164.4)
At 31 December 2014 and 31 December 2015 61.4 – 61.4
In 2014, the merger reserve created as part of the March 2013 capital raise was realised and transferred to retained earnings
following redemption of preference shares held by the Company.
40 Business combinations Acquisition during 2015
On 19 January 2015 the Group acquired 100 per cent of the share capital of Puerto Venecia Investments SOCIMI S.A. for total cash
consideration of €273.5 million (£208.8 million). The cash flow statement outflow of £203.1 million reflects the £208.8 million less
the unrestricted cash acquired of £5.7 million. Acquisition related costs of £1.1 million were incurred and recognised in the income
statement in exceptional administration expenses during 2014 and 2015.
The company acquired owns Puerto Venecia, a shopping resort in Zaragoza, Spain.
The fair value of assets and liabilities acquired is set out in the table below:
Fair value
£m
Assets
Investment and development property (€450.8 million) 344.2
Cash and cash equivalents (including restricted cash of £2.4 million) 8.1
Derivative financial instruments 0.1
Trade and other receivables 2.6
Total assets 355.0
Liabilities
Trade and other payables (7.2)
Borrowings (138.2)
Total liabilities (145.4)
Net assets 209.6
Fair value of consideration received 208.8
Gain on acquisition of business 0.8
The fair value of the assets and liabilities acquired exceeds the fair value of the consideration and as a result a gain of £0.8 million is
recognised in the income statement on acquisition.
intu properties plc Annual report 2015144

40 Business combinations (continued) During the year the acquired business contributed £16.5 million to the revenue of the Group and £2.6 million to the profit of
the Group.
Had the acquired business been consolidated from 1 January 2015, the 2015 consolidated income statement would show revenue
of £572.3 million. The Group’s reported profit would be unchanged.
Acquisition during 2014
On 1 May 2014 the Group acquired interests in a number of entities for a consideration of £854.9 million. These entities together
hold a 100 per cent interest in intu Derby, a 50 per cent joint venture interest in intu Merry Hill and a 100 per cent interest in
Sprucefield retail park in Northern Ireland. The transaction is accounted for as a single business combination as this was announced
as one deal, from one ultimate vendor and completed on the same day. Consideration was in cash and totalled £854.9 million,
consisting of a payment on completion of £867.8 million less £12.9 million received following final agreement of the completion
balance sheet. The cash flow statement reflects the £854.9 million less the cash acquired of £3.6 million. Acquisition related costs
of £11.8 million were incurred in 2014 and recognised in the income statement in exceptional administration expenses.
The fair value of assets and liabilities acquired is set out in the table below:
Fair value
£m
Assets
Investment and development property 458.4
Investment in joint venture – intu Merry Hill 403.8
Cash and cash equivalents 3.6
Trade and other receivables 2.8
Total assets 868.6
Liabilities
Trade and other payables (12.1)
Total liabilities (12.1)
Net assets 856.5
Fair value of consideration paid 854.9
Gain on acquisition of businesses 1.6
The fair value of the assets, investment in joint venture and liabilities acquired exceeds the fair value of the consideration and as
a result a gain of £1.6 million is recognised in the income statement on acquisition.
The acquired companies contributed £28.7 million to the revenue of the Group and £76.9 million to the profit of the Group for
2014. Had the acquired companies been consolidated from 1 January 2014, the 2014 consolidated income statement would
show revenue of £551.4 million and profit of £623.7 million.
41 Disposal of subsidiaries Disposals during 2015
On 30 September 2015, the Group sold 50 per cent of its interest in Intu Zaragoza S.à r.l., a wholly owned subsidiary, to CPPIB
for consideration of €122.3 million (£90.1 million). Intu Zaragoza S.à r.l. owns, through its subsidiaries, Puerto Venecia, Zaragoza.
Following this transaction Puerto Venecia has ceased to be accounted for as a subsidiary and is now a joint venture. Therefore the
assets and liabilities of Puerto Venecia are no longer recorded at 100 per cent in the Group’s balance sheet but the remaining
50 per cent interest is included in the investment in joint ventures at an initial value of £86.1 million. As a result of this transaction
the Group has recorded a gain on disposal of £2.2 million in the income statement. The cash flow statement records a net inflow
of £81.0 million being cash received of £90.1 million net of cash in the business of £9.1 million.
Accountsintugroup.co.uk 145

Notes to the accounts continued
41 Disposal of subsidiaries (continued) The assets and liabilities of the subsidiary disposed of, at 100 per cent, are set out below:
£m
Assets
Investment and development property (€450.8 million) 331.7
Cash and cash equivalents (including restricted cash of £2.4 million) 11.5
Trade and other receivables 2.5
Total assets 345.7
Liabilities
Trade and other payables (6.3)
Derivative financial instruments (1.8)
Borrowings (161.8)
Total liabilities (169.9)
Net assets 175.8
Net assets (at 50 per cent) 87.9
Fair value of consideration received 90.1
Gain on disposal of subsidiaries 2.2
Disposals during 2014
On 20 June 2014, the Group sold 80 per cent of its interest in Intu Uxbridge Limited (renamed Metropolitan Uxbridge Limited),
a wholly owned subsidiary, for consideration of £174.6 million, before expenses of £1.3 million. The Group retains a 20 per cent
interest in the company and as a result of the terms governing the management of the business, this interest has been accounted
for as a joint venture from 20 June 2014. As a result of this transaction the Group has recorded a gain on disposal of £0.6 million in
the income statement. The cash flow statement records a net inflow of £173.3 million being cash received of £173.8 million net of
cash in the business of £0.5 million.
During 2014 CPPIB, who held a 49 per cent non-controlling interest in Parque Principado S.à r.l., exercised an option allowing them
to acquire an additional one per cent holding and certain rights relating to the management of the business. This has resulted in intu
Asturias (renamed from Parque Principado), previously accounted for as a subsidiary, being accounted for as a joint venture from
that date. No gain or loss arose on exercise of the option. As a result the assets and liabilities of intu Asturias, previously recorded
in the balance sheet at 100 per cent, have been reclassified, along with the relevant non-controlling interest in reserves of £68.7
million, to investments in joint ventures. The cash flow statement shows an outflow of £11.6 million representing consideration
received of £1.3 million on exercise of the option, net of cash in the business of £12.9 million which is reclassified as part of the
investment in joint ventures.
The assets and liabilities of the subsidiaries disposed of, at 100 per cent, are set out below:
intu Asturias
£mintu Uxbridge
£m Total
£m
Assets
Investment and development property 142.2 208.2 350.4
Goodwill 4.2 – 4.2
Restricted cash 4.1 – 4.1
Other cash and cash equivalents 12.9 0.5 13.4
Trade and other receivables 1.9 11.1 13.0
Total assets 165.3 219.8 385.1
Liabilities
Deferred tax (12.0) – (12.0)
Trade and other payables (13.3) (4.9) (18.2)
Total liabilities (25.3) (4.9) (30.2)
Net assets 140.0 214.9 354.9
intu properties plc Annual report 2015146

42 Capital commitments At 31 December 2015 the Board had approved £59.9 million (2014: £80.1 million) of future expenditure for the purchase,
construction, development and enhancement of investment property. Of this, £21.2 million (2014: £30.7 million) is contractually
committed. The majority of this is expected to be spent in 2016.
43 Contingent liabilities At 31 December 2015 the Group has no contingent liabilities requiring disclosure under IAS 37 Provisions, Contingent Liabilities and
Contingent Assets.
44 Cash generated from operations
Notes
Group2015
£m
Group 2014
£m
Company2015
£m
Company2014
£m
Profit before tax, joint ventures and associates 398.4 493.2 145.7 158.6
Remove:
Revaluation of investment and development property 19 (264.9) (567.8) – –
Loss/(gain) on acquisition of businesses 5 0.8 (1.6) – –
Gain on disposal of subsidiaries 41 (2.2) (0.6) – –
Gain on sale of other investments (0.9) – – –
Depreciation 20 2.6 2.1 2.0 1.7
Share-based payments 4.8 2.5 4.8 2.5
Lease incentives and letting costs (5.8) (8.3) – –
Reversal of impairment of investment in group companies 21 – – (161.9) (208.1)
Finance costs 10 206.6 197.1 9.1 26.4
Finance income 11 (18.7) (11.9) (17.0) (13.0)
Other finance costs 12 37.3 56.8 2.7 7.5
Change in fair value of financial instruments 13 (6.0) 157.6 1.1 12.7
Changes in working capital:
Change in trade and other receivables 14.4 (29.6) 33.6 (144.8)
Change in trade and other payables 0.1 3.2 (43.4) (193.0)
Cash generated from operations 366.5 292.7 (23.3) (349.5)
Accountsintugroup.co.uk 147

Notes to the accounts continued
45 Subsidiaries, joint ventures and associates The table below lists all of the Company’s subsidiaries, joint ventures and associates. The country of incorporation and registration is
England and Wales except as indicated. The Company’s interest in each subsidiary is 100 per cent except as indicated. The Company’s
interest in each joint venture is 50 per cent except as indicated.
Name of entity Class of capital Name of entity Class of capital
Subsidiaries
Barton Square Holdco Limited (holding company) Ordinary shares Derby Business Management Limited (dormant) Ordinary shares
Barton Square Limited (property) Ordinary shares ‘A’ shares
Belside Limited (property) (Jersey) Ordinary shares Derby Investments General Partner Limited
(general partner)
Ordinary shares
Braehead Glasgow Limited (property) ‘A’ Ordinary shares
‘B’ Ordinary shares
Derby Investments Limited Partnership
(limited partner)
n/a
Braehead Leisure Partnership (property) n/a Derby Investments Trustee Limited (dormant) Ordinary shares
Braehead Park Estates Limited (property) Ordinary shares Fortheath (No.3) Limited (dormant) Ordinary shares
Braehead Park Investments Limited (property) Ordinary shares ICS Holding S.à r.l. (holding company)
(Luxembourg)
Ordinary shares
Broadmarsh Retail (Nominee No.1) Limited
(dormant)
Ordinary shares ICS InvestCo S.à r.l. (holding company)
(Luxembourg)
Ordinary shares
Broadmarsh Retail (Nominee No.2) Limited
(dormant)
Ordinary shares ICS JV S.à r.l. (holding company) (Luxembourg) Ordinary shares
Broadmarsh Retail (Nominee No.3) Limited
(dormant)
Ordinary shares Intu (Jersey) Limited (finance) (Jersey)3 Ordinary shares
Broadmarsh Retail (Nominee No.4) Limited
(dormant)
Ordinary shares Intu (SGS) Finco Limited (finance) Ordinary shares
Broadmarsh Retail General Partner Limited
(general partner)
Ordinary ‘A’ shares Intu (SGS) Holdco Limited (holding company) Ordinary shares
Broadway Construction & Development Limited
(dormant)
Ordinary shares Intu (SGS) Limited (holding company) Ordinary shares
Broadway Retail Leisure Limited (management
of leisure facilities)
Ordinary shares Intu (SGS) Topco Limited (holding company)3 Ordinary shares
Cable Plaza Limited (limited partner) Ordinary shares Intu 2027 Limited (dormant) Ordinary shares
Capital Shopping Centres Limited (dormant)3 Ordinary shares Intu Braehead Leisure Limited (holding company) Ordinary shares
Castle & Pedmore Houses Limited
(holding company)
Ordinary shares Intu Braehead Limited (holding company) Ordinary shares
Chapelfield GP Limited (general partner) Ordinary shares Intu Braehead Property Management Limited
(property management)
Ordinary shares
Intu Broadmarsh Limited (dormant)3 Ordinary shares
Chapelfield LP Limited (limited partner) Ordinary shares Intu Bromley Limited (property) Ordinary shares
Chapelfield Nominee Limited (dormant) Ordinary shares Intu Capital (Jersey) Limited (dormant) (Jersey)3 Ordinary shares
Redeemable
preference shares
Chapelfield Property Management Limited
(property management)
Ordinary shares Intu Cardiff Holdco Limited (holding company) Ordinary shares
Conduit Insurance Holdings Limited
(holding company)3
Ordinary shares Intu Cardiff Limited (dormant) Ordinary shares
Cribbs Mall Nominee (2) Limited (dormant) Ordinary shares Intu Centaurus Retail Limited (holding company) Ordinary shares
Crossmane Limited (limited partner) Ordinary shares Intu Chapelfield Limited (dormant)3 Ordinary shares
CSC Capital (Jersey) Limited (dormant) (Jersey)3 Ordinary shares Intu Chapelfield Residential Limited (property) Ordinary shares
CSC Uxbridge Limited (dormant) Ordinary shares Intu Costa del Sol Resort Holdco S.A.
(holding company) (Spain)
Ordinary shares
Curley Limited (property) (Jersey) Ordinary shares Intu Costa del Sol Resort S.L. (property) (Spain) Ordinary shares
intu properties plc Annual report 2015148

45 Subsidiaries, joint ventures and associates (continued) Name of entity Class of capital Name of entity Class of capital
Intu Debenture plc (finance, holding company) 3 Ordinary shares Intu MH (No.5) Jersey Unit Trust (limited partner)
(Jersey)
Units
Intu Derby Limited (holding company) (Jersey) Ordinary shares Intu MH (No.6) Jersey Unit Trust (limited partner)
(Jersey)
Units
Intu Derby 2 Limited (holding company) (Jersey) Ordinary shares Intu MH (No.7) Jersey Unit Trust (limited partner)
(Jersey)
Units
Intu Derby Jersey Unit Trust (limited partner)
(Jersey)
Units Intu MH (No.8) Jersey Unit Trust (limited partner)
(Jersey)
Units
Intu Eldon Square Limited (property) Ordinary shares Intu MH Acquisitions Limited (limited partner) Ordinary shares
Intu Experiences Limited (mall commercialisation) Ordinary shares Intu MH Group Limited (holding company) Ordinary shares
Intu Finance MH Limited (finance) Ordinary shares Intu MH Holdings Limited (holding company) Ordinary shares
Intu FM Limited (dormant) Ordinary shares Intu MH Investments Limited (limited partner) Ordinary shares
Intu Holding S.à r.l. (holding company)
(Luxembourg)
Ordinary shares Intu MH Leaseholds Limited (holding company) Ordinary shares
Intu Investments Limited (property) Preference shares Intu MH Participations Limited (holding company) Ordinary shares
Ordinary shares Intu MH Phase 1 Limited (limited partner) Ordinary shares
Intu IP Limited (intellectual property) Ordinary shares Intu MH Properties Limited (holding company) Ordinary shares
Intu Lakeside Hotel Limited (dormant) Ordinary shares Intu MH Waterfront Limited (limited partner) Ordinary shares
Intu Lakeside Limited (property) Ordinary shares Intu MHDS Holdco Limited (holding company)3 Ordinary shares
Intu Lakeside Property Management Limited
(property management)
Ordinary shares Intu Milton Keynes Limited (property) Ordinary shares
Intu London plc (dormant)3 Ordinary shares Intu Nottingham Investments Limited
(limited partner)
Ordinary shares
Intu Management Services Limited
(management services)3
Ordinary shares Intu Payments Limited (Group payment services) Ordinary shares
Intu Management Spain Holding S.à r.l. (holding
company) (Luxembourg)
Ordinary shares Intu Potteries Limited (limited partner) Ordinary shares
Intu Management Spain S.L. (property
management and management services) (Spain)
Ordinary shares Intu Properties Investments Limited
(limited partner)
Ordinary shares
Intu Merry Hill Limited (holding company) (Jersey) Ordinary shares Intu Property Management Limited
(property management)
Ordinary shares
Intu Merry Hill 2 Limited (holding company)
(Jersey)
Ordinary shares Intu Property Services Limited (dormant) Ordinary shares
Intu Metrocentre Limited (limited partner) Ordinary shares Intu Retail Services Limited
(facilities management)5
‘A’ Ordinary shares
Ordinary shares
Intu Metrocentre Parent Company Limited
(holding company)
Ordinary shares Intu RS Limited (facilities management)5 Ordinary shares
Intu Metrocentre Property Management Limited
(property management)
Ordinary shares Intu Shelfco 1 Limited (dormant)3 Ordinary shares
Intu Metrocentre Topco Limited
(holding company) 3
Ordinary shares Intu Shelfco 2 Limited (dormant)3 Ordinary shares
Intu MH (No.1) Jersey Unit Trust (limited partner)
(Jersey)
Units Intu Shopping Centres plc (holding company)3 Ordinary shares
Intu MH (No.2) Jersey Unit Trust (limited partner)
(Jersey)
Units Intu Spain Limited (holding company) Ordinary shares
Intu MH (No.3) Jersey Unit Trust (limited partner)
(Jersey)
Units Intu Sprucefield Limited (holding company)
(Jersey)
Ordinary shares
Intu MH (No.4) Jersey Unit Trust (limited partner)
(Jersey)
Units Intu Sprucefield 2 Limited (holding company)
(Jersey)
Ordinary shares
Accountsintugroup.co.uk 149

Notes to the accounts continued
45 Subsidiaries, joint ventures and associates (continued) Name of entity Class of capital Name of entity Class of capital
Intu The Hayes Limited (limited partner) Ordinary shares
Intu Trafford Centre Group Limited
(holding company) (Isle of Man)3
Ordinary shares Merry Hill Trading Limited (dormant) Ordinary shares
Intu Trafford Centre Group (UK) Limited
(holding company)
Ordinary shares Metrocentre (GP) Limited (general partner) Ordinary shares
Intu Trafford Centre Limited
(development management)
Ordinary shares Metrocentre (Holdco) Limited (holding company) Ordinary shares
Intu Uxbridge Holdco Limited (holding company)
(Jersey)
Ordinary shares Metrocentre (Nominee No.1) Limited (dormant) Ordinary shares
Intu Ventures Limited (dormant) Ordinary shares Metrocentre (Nominee No.2) Limited (dormant) Ordinary shares
Intu Victoria Centre Limited (dormant)3 Ordinary shares Metrocentre (Subco) Limited (holding company) Ordinary shares
Intu Watford Limited (property) Ordinary shares Metrocentre Lancaster LLP (property)4 n/a
Intu Watford Property Management Limited
(property management)
Ordinary shares Metrocentre Lancaster No.1 Limited
(holding company)
Ordinary shares
IntuDigital Holdco Limited (holding company) ‘A’ Ordinary shares
‘B’ Ordinary shares
Metrocentre Lancaster No.2 Limited
(holding company)
Ordinary shares
IntuDigital Limited (digital services) Ordinary shares Middleford Property Investments Limited
(dormant)
Ordinary shares
Kindmotive Limited (dormant) Cumulative
redeemable
preference shares
Midlands Shopping Centre Jersey Unit Trust (No.1)
(limited partner) (Jersey)
Units
Ordinary shares Nailsfield Limited (holding company) (Mauritius)3 Ordinary shares
Lakeside 1988 Limited (dormant) ‘A’ Ordinary shares Potteries (GP) Limited (general partner) Ordinary shares
‘B’ Redeemable
preference shares
Potteries (Nominee No.1) Limited (dormant) Ordinary shares
‘C’ Preference
shares
Potteries (Nominee No.2) Limited (dormant) Ordinary shares
Liberty Capital PLC (dormant)3 Ordinary shares Rosholt Invest S.L. (property) (Spain) Ordinary shares
Liberty International Construction and
Development Limited (dormant)3
Ordinary shares Runic Nominees Limited (dormant) Ordinary shares
Liberty International Financial Services Limited
(holding company)
Ordinary shares Sandal Investments Limited (dormant) Ordinary shares
Liberty International Group Treasury Limited
(treasury management)
Ordinary shares Sprucefield No.1 Nominee Limited (dormant)
(Jersey)
Ordinary shares
Liberty International Holdings Limited
(holding company)1
Ordinary shares Sprucefield No.2 General Partner Limited (general
partner)
Ordinary shares
Libint (Proprietary) Limited (local administration
services) (South Africa)3
Ordinary shares Sprucefield No.2 Limited Partnership (property)
(Jersey)
n/a
Libtai Holdings (Jersey) Limited (holding company)
(Jersey)3
Ordinary shares Sprucefield No.2 Nominee Limited (dormant)
(Jersey)
Ordinary shares
Manchester Nominee (2) Limited (dormant) Ordinary shares Sprucefield Unit Trust (limited partner) (Jersey) Units
Merry Hill Finance Limited (finance)
(Republic of Ireland)
‘A’ Ordinary shares
‘B’ Ordinary shares
Staffordshire Property Management Limited
(property)
Ordinary shares
Merry Hill Management Services Limited
(dormant)
Ordinary shares Steventon Limited (property) (Jersey) Ordinary shares
Merry Hill Services Limited (dormant) Ordinary shares TAI Investments Limited (holding company)2 ‘B’ Deferred shares
Ordinary shares
intu properties plc Annual report 2015150

45 Subsidiaries, joint ventures and associates (continued) Name of entity Class of capital Name of entity Class of capital
TAI Nominees Limited (dormant) Ordinary shares TransAtlantic Holdings Limited (holding company) Ordinary shares
The Broadmarsh Retail Limited Partnership
(property)
n/a Transol Investments Limited (dormant) Ordinary shares
The Bullfinch Company Limited (dormant) Ordinary shares VCP (GP) Limited (general partner) Ordinary shares
The Chapelfield Partnership (property) n/a VCP Nominees No.1 Limited (dormant) Ordinary shares
The Metrocentre Partnership (property)4 n/a VCP Nominees No.2 Limited (dormant) Ordinary shares
The Potteries Shopping Centre Limited Partnership
(property)
n/a W (No.3) GP (Nominee A) Limited (dormant)
(Jersey)
Ordinary shares
The Trafford Centre Limited (property) ‘A’ Preference
shares
W (No.3) GP (Nominee B) Limited (dormant)
(Jersey)
Ordinary shares
‘B’ Preference
shares
Ordinary shares
Wattenberg Invest S.L. (property) (Spain) Ordinary shares
The Trafford Centre Finance Limited (finance)
(Cayman Islands)
Ordinary shares Westgate Oxford Investments Limited (dormant) Ordinary shares
The Trafford Centre Holdings Limited
(holding company)
Ordinary shares Wilmslow (No.3) (Nominee A) Limited (dormant) Ordinary shares
The Trafford Centre Investments Limited
(holding company)
Ordinary shares Wilmslow (No.3) (Nominee B) Limited (dormant) Ordinary shares
The Victoria Centre Partnership (property) n/a Wilmslow (No.3) General Partner Limited
(general partner)
‘A’ Shares
‘B’ Shares
The Wilmslow (No.3) Limited Partnership
(property)
n/a Whitesun Limited (property) Ordinary shares
WRP Management Limited (property) Ordinary shares
Joint ventures
Asturias Propco Numero Dos S.L. (property) (Spain) Ordinary shares Intu Eurofund Investments Valencia, B.V.
(holding company) (Netherlands)
Ordinary shares
Asturias Propco Numero Uno S.L. (property)
(Spain)
Ordinary shares Intu Eurofund Investments Vigo B.V. (holding
company) (Netherlands)
Ordinary shares
Asturias Retail and Leisure SOCIMI S.A.
(holding company) (Spain)
Ordinary shares Intu Eurofund Mallorca S.L. (property
development) (Spain)
Ordinary shares
Centaurus Retail LLP (property) n/a Intu Eurofund Valencia S.L.
(property development) (Spain)
Ordinary shares
Cribbs Causeway JV Limited (property
management)
‘A’ Ordinary shares
‘B’ Ordinary shares
Intu Eurofund Vigo S.L (property development)
(Spain)
Ordinary shares
Intu Eurofund Developments S.à r.l.
(holding company) (Luxembourg)
‘A’ shares
‘B’ shares
Intu Zaragoza S.à r.l. (holding company)
(Luxembourg)
Ordinary shares
Intu Eurofund Investments Mallorca B.V
(holding company) (Netherlands)
Ordinary shares
Accountsintugroup.co.uk 151

Notes to the accounts continued
45 Subsidiaries, joint ventures and associates (continued) Name of entity Class of capital Name of entity Class of capital
Intu Zaragoza Holding S.à r.l. (holding company)
(Luxembourg)
Ordinary shares MH (No.5) Nominee B Limited (dormant) Ordinary shares
Manchester JV Limited (property management) ‘A’ Ordinary shares
‘B’ Ordinary shares
MH (No.6) General Partner Limited
(general partner)
Ordinary shares
Metropolitan Retail JV (Jersey) Unit Trust
(property) (Jersey)8
‘A’ units
‘B’ units
MH (No.6) Limited Partnership (property) n/a
MH (No.1) General Partner Limited
(general partner)
Ordinary shares MH (No.6) Nominee A Limited (dormant) Ordinary shares
MH (No.1) Limited Partnership (property) n/a MH (No.6) Nominee B Limited (dormant) Ordinary shares
MH (No.1) Nominee A Limited (dormant) Ordinary shares MH (No.7) General Partner Limited
(general partner)
Ordinary shares
MH (No.1) Nominee B Limited (dormant) Ordinary shares MH (No.7) Limited Partnership (property) n/a
MH (No.2) General Partner Limited
(general partner)
Ordinary shares MH (No.7) Nominee A Limited (dormant) Ordinary shares
MH (No.2) Limited Partnership (property) n/a MH (No.7) Nominee B Limited (dormant) Ordinary shares
MH (No.2) Nominee A Limited (dormant) Ordinary shares MH (No.8) General Partner Limited
(general partner)
Ordinary shares
MH (No.2) Nominee B Limited (dormant) Ordinary shares MH (No.8) Limited Partnership (property) n/a
MH (No.3) General Partner Limited
(general partner)
Ordinary shares MH (No.8) Nominee A Limited (dormant) Ordinary shares
MH (No.3) Limited Partnership (property) n/a MH (No.8) Nominee B Limited (dormant) Ordinary shares
MH (No.3) Nominee A Limited (dormant) Ordinary shares Parque Principado S.à r.l. (holding company)
(Luxembourg)
‘A’ shares
‘B’ shares
MH (No.3) Nominee B Limited (dormant) Ordinary shares Puerto Venecia Investments SOCIMI S.A.
(property) (Spain)
Ordinary shares
MH (No.4) General Partner Limited
(general partner)
Ordinary shares St. David’s (Cardiff Residential) Limited (property) Ordinary shares
MH (No.4) Limited Partnership (property) n/a St. David’s (General Partner) Limited
(general partner)
‘A’ shares
‘B’ shares
MH (No.4) Nominee A Limited (dormant) Ordinary shares St. David’s (No.1) Limited (dormant) Ordinary shares
MH (No.4) Nominee B Limited (dormant) Ordinary shares St. David’s (No.2) Limited (dormant) Ordinary shares
MH (No.5) General Partner Limited
(general partner)
Ordinary shares St. David’s Limited Partnership (property) n/a
MH (No.5) Limited Partnership (property) n/a St. David’s Unit Trust (limited partner) (Jersey) Units
MH (No.5) Nominee A Limited (dormant) Ordinary shares Zaragoza Properties SOCIMI S.A.
(holding company) (Spain)
Ordinary shares
Associates
Empire Mall Private Limited (property) (India)6 Ordinary shares Prozone Intu Properties Limited (property) (India)7 Ordinary shares
1 40.2 per cent is held by intu properties plc, 31.1 per cent is held by Conduit Insurance Holdings Limited and 28.7 per cent is held by TAI Investments Limited.
2 95.4 per cent is held by Libtai Holdings (Jersey) Limited and 4.6 per cent is held by intu properties plc.
3 Related undertaking held directly by intu properties plc.
4 Group’s interest is 60 per cent.
5 Group’s interest is 51 per cent.
6 Group’s interest is 38 per cent.
7 Group’s interest is 32.4 per cent.
8 Group’s interest is 20 per cent.
intu properties plc Annual report 2015152

45 Subsidiaries, joint ventures and associates (continued) Intu (SGS) Finance plc and Intu Metrocentre Finance plc are consolidated as subsidiaries in these financial statements but are not
listed in the table above as the Group does not own the shares in these companies. These companies are vehicles set up on behalf
of the Group for the sole purpose of issuing some of the Group’s listed debt. The Group’s obligations in respect of this debt via a
back-to-back intercompany loan agreement between these companies and other Group companies, and security over investment
property via a deed of charge between the security trustees and other Group companies, mean that the Group is deemed to have
control of these entities.
By virtue of their 40 per cent interest in The Metrocentre Partnership, GIC Real Estate is entitled to appoint 40 per cent of the
directors of Metrocentre (GP) Limited. £78.4 million of the non-controlling interest shown in the balance sheet as at 31 December
2015 (2014: £72.8 million) and £0.8 million of the non-controlling interest share of loss for the year shown in the income statement
for the year ended 31 December 2015 (2014: share of profit £12.5 million) relates to GIC Real Estate’s interest. Set out below is the
summarised financial information of The Metrocentre Partnership at 100 per cent, as consolidated:
2015
£m2014
£m
Summarised income statement
Revenue 65.5 66.0
(Loss)/profit for the year (2.1) 28.5
Summarised balance sheet
Investment and development property 934.0 909.5
Borrowings (906.9) (891.0)
Other net liabilities (8.0) (13.2)
Net assets 19.1 5.3
Bilfinger Europa Facilities Management Limited holds a 49 per cent interest in Intu Retail Services Limited. At 31 December 2015 an
amount of £nil (2014: £nil) is included within the non-controlling interest balance in the balance sheet of £nil (2014: £nil) and £nil of
the non-controlling interest share of profit for the year shown in the income statement for the year ended 31 December 2015
(2014: £nil) relating to their interest.
46 Related party transactions Key management1 compensation is analysed below:
2015
£m2014
£m
Salaries and short-term employee benefits 5.7 5.4
Pensions and other post-employment benefits 0.3 0.4
Share-based payments 3.8 1.6
Compensation for loss of office 0.2 –
10.0 7.4
1 Key management comprises the Directors of intu properties plc and employees who have been designated as persons discharging managerial responsibility.
As John Whittaker, Deputy Chairman and Non-Executive Director of intu properties plc, is the Chairman of the Peel Group,
members of the Peel Group are considered to be related parties. Total transactions between the Group and members of the Peel
Group are shown below:
2015
£m2014
£m
Income 1.1 1.6
Expenditure (0.5) (0.9)
Income predominantly relates to leases of office space and a contract to provide advertising services. Expenditure predominantly
relates to costs incurred under a management services agreement and the supply of utilities. All contracts are on an arm’s length
basis at commercial rates. Following shareholder approval in December 2015, the Group agreed terms on a 5 year, £550,000 per
annum lease on a 30.96 acre site known as King George V Docks (West) to Clydeport Operations Limited (a member of the Peel
Group) with effect from 30 December 2015.
Accountsintugroup.co.uk 153

Notes to the accounts continued
46 Related party transactions (continued) Balances outstanding between the Group and members of the Peel Group as at 31 December 2015 and 31 December 2014 are
shown below:
2015
£m 2014
£m
Amounts owed by members of the Peel Group 0.1 0.2
Amounts owed to members of the Peel Group (0.2) –
Under the terms of the Group’s acquisition of intu Trafford Centre from the Peel Group, the Peel Group have provided a guarantee
in respect of Section 106 planning obligation liabilities at Barton Square which as at 31 December 2015 totalled £11.7 million (2014:
£11.6 million).
In 2012, the Group acquired for €2.5 million, alongside a refundable deposit of €7.5 million, a three year option to purchase two
parcels of land in the province of Málaga, Spain from Peel Holdings Limited.
Following shareholder approval at a general meeting on 15 April 2015 the Group exercised the option in May 2015 for consideration
of €48.7 million which included the €7.5 million deposit paid in 2012.
Under the terms of the agreement, the Peel Group subscribed to €30.0 million of ordinary shares in the Company. As a result, the
Company issued 6,256,075 new ordinary shares of 50 pence each. The shares were issued and paid for in cash at £3.4635 per share
being the 30-day average of the volume weighted average price of the Company’s shares.
Transactions between the Company and its subsidiaries, which are related parties, have been eliminated on consolidation in the
Group’s financial information.
Significant transactions between the Company and its subsidiaries are shown below:
2015
£m 2014
£m
Interest expense (7.5) (20.6)
Interest income 17.0 13.0
Dividend received – 9.1
Investment in subsidiaries – 182.8
Redemption of preference shares – (197.2)
The Company has provided Intu (Jersey) Limited a guarantee over obligations in relation to the 2.5 per cent convertible bonds
(see note 33).
Significant balances outstanding between the Company and its subsidiaries are shown below:
2015
£m 2014
£m
Amounts owed by subsidiary undertakings 1,262.0 1,284.4
Amounts owed to subsidiary undertakings (326.8) (376.8)
intu properties plc Annual report 2015154

47 Share-based payment The Group operates a number of share-based payment arrangements providing employee benefits and incentives. All schemes are
equity settled, and as such the expense recognised in the income statement is based on the fair value of the equity instruments
awarded as determined at their grant date. The expense is recognised on a straight-line basis over the vesting period based on
Group estimates of the number of shares that are expected to vest.
Share Option Schemes
Options to subscribe for ordinary shares may be awarded under the intu properties plc approved share option scheme and the intu
properties plc unapproved share option scheme.
Certain grants are subject to an earnings per share (‘EPS’) performance condition. Options granted to members of the Executive
Committee in 2012 are subject to a sliding scale performance condition based on EPS growth of between 4 to 6 per cent per annum
over a three-year period. Options granted to staff who are not members of the Executive Committee 2012 are not subject to a
performance condition.
Except in the case of a ‘good’ leaver, options may not be exercised within three years of grant and before satisfaction or waiver of
any applicable performance condition, and are forfeited if the employee leaves the Group before the options become capable of
exercise. The options automatically lapse if not exercised within 10 years of the date of grant.
Movements in the number of share options outstanding and their related weighted average exercise prices are as follows:
2015 2014
Number of optionsWeighted average
exercise price (pence) Number of options Weighted average
exercise price (pence)
Outstanding at 1 January 6,173,103 275 5,867,697 320
Forfeited prior to rights issue – – (10,000) 335
Lapsed prior to rights issue – – (536,628) 430
Exercised prior to rights issue – – (11,041) 272
Adjustment for rights issue – n/a 897,337 n/a
Awarded after rights issue 2,233,000 349 1,834,800 292
Forfeited after rights issue (257,788) 293 (100,759) 287
Exercised after rights issue (75,777) 286 (1,768,303) 255
Outstanding at 31 December 8,072,538 295 6,173,103 275
Exercisable at 31 December 2,578,544 256 2,406,626 253
The weighted average share price at the date of exercise during the year was 348p (2014: 307p).
The number of options outstanding at 31 December 2015 includes a total of 170,181 (2014: 2,150,541) which are subject to a
capped gain price of £2.8563 per share. If the market price of shares at the date of exercise exceeds the capped price, the maximum
gain the holder of such options can realise is the difference between exercise price and the capped price per share.
Share options outstanding at 31 December 2015 had exercise prices between 232p and 349p (2014: between 232p and 292p)
and a weighted average remaining contractual life of approximately seven years (2014: seven years). More detail by exercise price
range is shown below:
2015
Exercise price (pence) Number of options Weighted average remaining
contractual life
232 to 292 5,854,538 6
349 2,218,000 9
2014
Exercise price (pence) Number of options Weighted average remaining
contractual life
232 to 292 6,173,103 7
Accountsintugroup.co.uk 155

Notes to the accounts continued
47 Share-based payment (continued) The fair value of options granted during the year, determined using the Black-Scholes option pricing model, was £0.28 per option
(2014: £0.26). The significant inputs to the model for the majority of options granted during the year were as follows:
2015 2014
Share price and exercise price at grant date £3.49 £2.92
Expected option life in years 4 years 4 years
Risk free rate 1.4% 1.8%
Expected volatility 17% 19%
Expected dividend yield 3.9% 4.7%
Expected dividend yield is based on public pronouncements about future dividend levels. All other measures are based on
historical data.
Performance Share Plan
The Company operates a Performance Share Plan (‘PSP’) for eligible employees at the discretion of the Remuneration Committee.
The PSP was approved by shareholders at the 2013 annual general meeting.
Awards may be made in the form of nil cost options, a conditional share award or a joint share ownership award and fixed value
zero cost option, and eligible employees may be granted any combination of such awards subject to any individual limits.
Vesting of PSP awards made in 2015, 2014 and 2013 is based on Total Shareholder Return (TSR) and Absolute Total Return (TR)
with performance measured one third over three years, one third over four years and one third over five years. Half of the awards
vest by reference to TR (25 per cent vesting for 6 per cent per annum return; full vesting for 10 per cent per annum; straight line
vesting in between). The remaining half of the awards vest by reference to TSR relative to the top five UK-listed REITs (25 per cent
return vesting for TSR in line with the third rated Company; full vesting for TSR in line with the top rated Company; straight line
vesting in between) subject to a Remuneration Committee operated discretionary assessment of underlying financial performance.
Movements in the number of PSP options outstanding are as follows:
2015 Number of
options
2014Number of
options
Outstanding at 1 January 3,548,076 1,913,145
Adjustment for rights issue – 205,416
Awarded during the year 1,410,003 1,559,340
Forfeited in the year (343,701) (129,825)
Outstanding at 31 December 4,614,378 3,548,076
The fair value of TSR options granted during the year was determined using the Monte Carlo option pricing model. The fair value
of the TR options granted during the year was determined using the Black-Scholes option pricing model. The fair values per option
granted in the year were as follows:
2015 2014
Performance period TSR TR TSR TR
3 years £0.87 £0.87 £0.74 £0.73
4 years £0.90 £0.87 £0.79 £0.73
5 years £0.93 £0.87 £0.84 £0.73
The significant inputs to the valuation model for the TSR options granted during the year were as follows:
2015 2014
Performance period TSR 3 years TSR 4 years TSR 5 years TSR 3 years TSR 4 years TSR 5 years
Share price at grant date 3.38 3.38 3.38 £2.92 £2.92 £2.92
Expected option life in years 2.8 years 3.8 years 4.8 years 2.7 years 3.7 years 4.7 years
Risk free rate 1.0% 1.2% 1.4% 1.1% 1.5% 1.8%
Expected volatility 17% 21% 22% 20% 23% 26%
Expected competitor volatility 9%-15% 9%-15% 9%-15% 11%-17% 11%-17% 11%-17%
Average correlation 61% 72% 72% 68% 71% 72%
intu properties plc Annual report 2015156

47 Share-based payment (continued) The fair value of the TR options, before taking account of the performance condition, is equal to the share price at the date of grant
of £3.38 (2014: £2.92) as these awards accumulate dividends over the performance period. At the date of grant a 25 per cent
vesting has been assumed resulting in a fair value per share of £0.87 (2014: £0.73) as above.
Joint Share Ownership Plan
Eligible employees may be invited to participate in the Joint Share Ownership Plan (‘JSOP’) which forms part of the intu properties
plc unapproved share option scheme and the PSP. Under the JSOP shares are held jointly by the employee and the employee share
ownership plan trustee with any increases in the share price and dividends paid on those shares being allocated between
the joint owners in accordance with the terms of the scheme.
Conditions for exercise (including satisfaction of the same performance condition), forfeiture and lapsing are as set out above for
options or PSP generally.
In 2012, individuals who received awards of unapproved options in 2011 and 2012 were given the option to exchange their awards
for jointly owned shares under the JSOP. In 2013, participants in the PSP were given the option to take their awards in the form of
jointly owned shares under the JSOP and fixed value zero cost options. No option was given in 2014 or 2015.
Bonus Share Scheme
Under the Company’s Bonus Scheme (the ‘Bonus Scheme’), deferred shares may be awarded as part of any bonus.
Such awards comprise ‘Restricted’ shares and ‘Additional’ shares. Where awarded, Additional shares would be equal to 50 per cent
of the Restricted shares and SIP shares (see below) combined. No Additional shares were outstanding at 1 January 2014 and no
awards have been made in 2014 or 2015. The vesting of deferred share awards is not dependent on the achievement of any further
performance conditions other than that participants remain employed by the Group for a specified time from the date of the award,
typically two to three years in the case of Restricted shares and four years in the case of Additional shares. The fair value of
Restricted shares granted with the condition for participants to remain employed by the Group for two years during the year,
determined using the Black-Scholes option pricing model, was £3.23 per share (2014: £2.66 per share). The fair value of Restricted
shares with the condition for participants to remain employed by the Group for three years, determined using the Black-Scholes
options pricing model, was £3.10 per share (2014: £2.54 per share). The significant inputs to the model were as follows:
2015
3 years
2015
2 years
2014
3 years
2014
2 years
Share price at grant date £3.49 £3.49 £2.92 £2.92
Expected option life in years 3 years 2 years 3 years 2 years
Risk free rate 1.3% 1.0% 1.5% 1.1%
Expected dividend yield 3.9% 3.9% 4.7% 4.7%
Movements in shares awarded under the Bonus Share Scheme are as follows:
2015 2014
Restricted Restricted
Outstanding at 1 January 1,013,807 1,085,286
Awarded during the year 425,117 428,424
Adjustment for rights issue – 183,348
Forfeited during the year (13,725) (35,751)
Vested during the year (711,376) (647,500)
Outstanding at 31 December 713,823 1,013,807
Share incentive plan (‘SIP’)
The Company operates a SIP for all eligible employees, who may receive up to £3,600 worth of shares as part of their annual bonus
arrangements. The SIP arrangements offer worthwhile tax advantages to employees and to the Company.
The SIP Bonus shares can be released three years after the date of the award, provided the individual employee has remained in
employment, but the shares must then be held in trust for a further two years in order to qualify for tax advantages. The fair value
of shares granted during the year, determined using the Black-Scholes option pricing model, was £3.49 per share (2014: £2.92 per
share). As these awards accumulate dividends, the fair value of each share awarded is equal to the share price at the date of grant
of £3.49.
Accountsintugroup.co.uk 157

Notes to the accounts continued
47 Share-based payment (continued) As part of the SIP arrangements, the Company also offers eligible employees the opportunity to participate in a ‘Partnership’ share
scheme, under which employees can save up to £150 a month. The Group offers one free Matching share for every two Partnership
shares purchased by the employee at the end of a 12-month saving period. Matching shares are forfeited if the employee leaves the
Group within three years of the date of award, and qualify for tax advantages if they are held in the SIP for five years. The fair value
of Matching shares is determined by the market price at the grant date.
The dividend payable in respect of the shares held in the SIP is used to purchase additional shares, known as Dividend Shares, which
are also held in trust and allocated to individuals and are subject to the same conditions of release.
Movements in SIP bonus shares granted are as follows:
2015 2014
Outstanding at 1 January 260,271 224,743
Awarded during the year 120,431 114,319
Adjustment for rights issue – 7,158
Forfeited during the year (19,919) (20,171)
Vested during the year1 (78,016) (65,778)
Outstanding at 31 December2 282,767 260,271
1 May still be held in trust.
2 Shares that remain within their three-year holding period.
48 Pensions The Group operates defined contribution group pension plans for its staff. Additionally the Group makes contributions to self-
invested personal pension arrangements (‘SIPPs’) on behalf of an Executive Director. All contributions are invested in funds
administered outside of the Group.
The pension charge for the Group’s contributions to these arrangements is the amount paid which totalled £3.1 million for the
year ended 31 December 2015 (2014: £2.7 million).
49 Events after the reporting period On 19 January 2016 the Group disposed of its interest in Equity One. See note 25 for details.
50 Directors’ interests and emoluments
(a) Shares in the Company
The number of ordinary shares of the Company in which the Directors were beneficially interested were:
2015 2014
Chairman:
Patrick Burgess 37,627 37,627
Deputy Chairman:
John Whittaker* 336,492,751 296,155,452
Executive:
David Fischel 993,534 965,646
Matthew Roberts 213,133 154,506
Non-Executive:
Adèle Anderson 32,504 18,124
Richard Gordon 7,005,211 7,004,818
Andrew Huntley 7,714 7,714
Rakhi (Parekh) Goss-Custard – –
Louise Patten 12,857 12,857
Neil Sachdev – –
John Strachan – –
Andrew Strang – –
* Total beneficial interest includes shares held by subsidiaries of the Peel Group of which John Whittaker is the Chairman.
intu properties plc Annual report 2015158

50 Directors’ interests and emoluments (continued) Conditional awards of shares have previously been made to Executive Directors under the Company’s annual bonus scheme.
The awards comprise ‘Restricted’ shares and ‘Additional’ shares, the latter equal to 50 per cent of the Restricted and share incentive
plan shares combined. Executive Directors were required to retain the shares, net of shares sold to meet tax and PAYE deductions,
which vested ahead of the normal vesting date.
Awards to Executive Directors under the scheme since January 2013 are as follows:
Award date
Market price at
award (pence)
Originalvesting
date
Market price at vesting (pence)
Number of shares at
31 December 2014
Number of shares
awarded during 2015
Number of shares vested
during 2015
Number of shares at
31 December 2015
David Fischel 07/03/2013 335 07/03/2015 343 144,117 – (144,117) –
29/04/2014 292 29/04/2016 – 30,655 – – 30,655
29/04/2014 292 29/04/2017 – 29,627 – – 29,627
11/03/2015 349 11/03/2017 – – 30,478 – 30,478
11/03/2015 349 11/03/2018 – – 29,446 – 29,446
Matthew Roberts 07/03/2013 335 07/03/2015 343 110,617 – (110,617) –
29/04/2014 292 29/04/2016 – 24,558 – – 24,558
29/04/2014 292 29/04/2017 – 23,530 – – 23,530
11/03/2015 349 11/03/2017 – – 24,154 – 24,154
11/03/2015 349 11/03/2018 – – 23,122 – 23,122
Details of Restricted and Additional shares awarded in respect of the year ended 31 December 2015 are given in the Directors’
remuneration report on pages 78 to 91.
Awards may also be made under the Company’s share incentive plan (‘SIP’). The SIP shares can be released three years after the
date of the award provided the individual Director has remained in employment but the shares must be held in trust for a further
two years in order to qualify for tax advantages. The dividend payable in respect of the shares held in trust is used to purchase
additional shares, known as Dividend Shares, which are also held in trust.
At31 December
2014Removed from
trust Lapsed Awarded1
Partnership, matching and
dividend shares
At31 December
2015
Current Directors:
David Fischel 13,853 – – 1,031 1,454 16,338
Matthew Roberts 6,210 – – 1,031 1,198 8,439
1 SIP shares in respect of the year ended 31 December 2014 awarded in March 2015. Details of SIP shares awarded in respect of the year ended 31 December 2015 are given in
the Directors’ remuneration report on pages 78 to 91.
(b) Share options in the Company
Executive Directors interests in share options and the PSP are given in the Directors’ remuneration report on pages 78 to 91.
(c) Other disclosures
No Director had any dealings in the shares of any Group company between 31 December 2015 and 26 February 2016, being a date
less than one month prior to the date of the notice convening the annual general meeting.
Other than as disclosed in these accounts, no Director of the Company had a material interest in any contract (other than service
contracts), transaction or arrangement with any Group company during the year ended 31 December 2015.
(d) Emoluments
The details of individual Directors’ remuneration and pension benefits, as set out in the tables contained in the Directors’
remuneration report on pages 78 to 91, form part of these financial statements.
Accountsintugroup.co.uk 159

Investment and development property (unaudited)
1 Property data
Market value
£mRevaluation
surplus/deficit Net initial
yield (EPRA)‘Topped-up’ NIY
(EPRA) Nominal
equivalent yield Occupancy
As at 31 December 2015
Subsidiaries
intu Trafford Centre 2,305.0 +5% 3.7% 3.9% 4.3% 96%
intu Lakeside 1,334.0 +6% 4.2% 4.3% 4.7% 95%
intu Metrocentre 952.3 +1% 4.7% 4.9% 5.4% 94%
intu Braehead 585.5 –3% 3.9% 4.3% 6.0% 94%
intu Derby 447.0 +5% 5.9% 6.5% 6.0% 99%
Manchester Arndale 445.0 +3% 4.6% 4.7% 5.1% 99%
intu Victoria Centre 356.0 +10% 4.3% 4.6% 6.0% 93%
intu Watford 336.0 – 4.7% 4.9% 6.3% 94%
intu Eldon Square 299.7 +8% 4.1% 4.9% 5.9% 99%
intu Milton Keynes 280.0 – 4.1% 4.4% 4.8% 97%
intu Chapelfield 272.5 +4% 5.3% 5.5% 5.8% 100%
Cribbs Causeway 245.1 – 4.4% 4.6% 5.4% 96%
intu Potteries 175.1 – 4.7% 5.4% 7.5% 95%
intu Bromley 174.1 – 5.5% 5.7% 7.1% 94%
OtherC 263.4
Investment and development property
excluding Group’s share of joint ventures 8,470.7
Joint ventures
intu Merry Hill 448.4 +3% 4.5% 4.7% 4.9% 96%
St David’s, Cardiff 368.6 +21% 4.0% 4.2% 4.7% 94%
Puerto Venecia, Zaragoza 166.1 –A/B 5.0% 5.0% 6.3% 95%
intu Asturias 89.1 +13%B 5.1% 5.5% 5.3% 100%
OtherD 59.5
Investment and development property
including Group’s share of joint ventures 9,602.4 4.29% 4.52% 5.14% 96%
As at 31 December 2014
including Group’s share of joint ventures 8,963.4 4.36% 4.60% 5.32% 95%
Notes
A Revaluation surplus assessed from date of acquisition.
B Calculated in local currency.
C Includes the Group’s interest in intu Broadmarsh, Soar at intu Braehead, development land in Spain and Sprucefield, Northern Ireland.
D Includes the Group’s interest in intu Uxbridge.
31 December 2015
£m
31 December2014
£m
Passing rent 411.7 401.4
Annual property income 448.5 436.2
ERV 531.2 515.3
Weighted average unexpired lease term 7.9 years 7.4 years
Please refer to the glossary for definitions.
Other information intu properties plc Annual report 2015160

2 Analysis of capital return in the year Market value Revaluation surplus/(deficit)
2015
£m2014
£m £m2015
%
Like-for-like property 9,291.9 8,887.8 355.0 4.0
Puerto Venecia, Zaragoza 166.1 – (1.5) n/a
Developments 144.4 75.6 (2.8) n/a
Total investment and development property 9,602.4 8,963.4 350.7 n/a
3 Additional property information
Ownership NoteForm of
OwnershipE
Gross area million sq ftF
Yearopened
AcquisitionDateG
As at 31 December 2015
intu Trafford Centre 100% FH 2.0 1998 2011
intu Lakeside 100% FH 1.4 1990 –
intu Metrocentre 90% A LH 2.1 1986 1995
intu Braehead 100% FH 1.1 1999 –
intu Derby 100% FH/LH 1.3 2007 2014
Manchester Arndale 48% B LH 1.6 1976 2005
intu Victoria Centre 100% FH 1.0 1972 2002H
intu Watford 93% LH 0.7 1992 –
intu Eldon Square 60% FH/LH 1.4 1976 –
intu Milton Keynes 100% FH 0.4 2000 2013
intu Chapelfield 100% FH 0.5 2005 –
Cribbs Causeway 33% C FH/LH 1.1 1998 2005
intu Potteries 100% FH 0.6 1998 –
intu Bromley 64% LH 0.5 1991 –
intu Merry Hill 50% FH 1.7 1985 2014
St David’s, Cardiff 50% FH/LH 1.4 2009 2006
Puerto Venecia, Zaragoza 50% FH 1.3 2012 2015
intu Asturias 50% FH 0.8 2001 2013
Other D 1.5
Investment and development property
including Group’s share of joint ventures 22.4
As at 31 December 2014 21.4
Notes
A Interest shown is that of The Metrocentre Partnership in intu Metrocentre (90 per cent) and the Metro Retail Park (100 per cent). The Group has a 60 per cent interest in
The Metrocentre Partnership which is consolidated as a subsidiary of the Group.
B The Group’s interest is through a joint operation ownership of a 95 per cent interest in Manchester Arndale, and a 90 per cent interest in New Cathedral Street, Manchester.
C The Group’s interest is through a joint operation ownership of a 66 per cent interest in The Mall at Cribbs Causeway and a 100 per cent interest in The Retail Park,
Cribbs Causeway.
D Includes intu Uxbridge, intu Broadmarsh, Soar at intu Braehead and Sprucefield, Northern Ireland.
E Form of ownership is shown as either freehold (‘FH’), leasehold (‘LH’) or freehold and leasehold (‘FH/LH’).
F Area shown is not adjusted for the proportion of ownership.
G The acquisition date is presented only where the centre was not built by the Group.
H intu held a 20 per cent stake in intu Victoria Centre, Nottingham prior to 2002 when it acquired the remaining 80 per cent to take its holding to 100 per cent.
Other informationintugroup.co.uk 161

Financial covenants (unaudited)
Intu (SGS) Finance plc and Intu (SGS) Finco Limited (‘Secured Group Structure’)
Loan
£m MaturityLTV
covenantLTV
actual
Interest cover
covenant
Interestcover
actual
Term loan 351.8 2020
3.875 per cent bonds 450.0 2023
4.625 per cent bonds 350.0 2028
4.250 per cent bonds 350.0 2030
1,501.8 80% 45% 125% 242%
Covenants are tested on the Security Group, the principal assets of which are intu Lakeside, intu Braehead, intu Watford, intu
Victoria Centre, intu Chapelfield and intu Derby.
The structure has a tiered operating covenant regime giving the Group a significant degree of flexibility when the covenants are
below certain levels. In higher tiers the level of flexibility is reduced. The Group retains operating control below loan to value of
72.5 per cent and interest cover above 1.4x. No financial covenant default occurs unless the loan to value exceeds 80 per cent
or the interest cover falls below 1.25x.
The Trafford Centre Finance Limited There are no financial covenants on the intu Trafford Centre debt of £796.7 million at 31 December 2015. However a debt service
cover ratio is assessed quarterly and where this falls below specified levels restrictions come into force. The loan to 31 December
2015 market value ratio is 36 per cent. No restrictions are in place at present.
Intu Metrocentre Finance plc
Loan
£m MaturityLTV
covenantLTV
actual
Interest cover
covenant
Interestcover
actual
4.125 per cent bonds 485.0 2023 100% 51% 125% 207%
The structure’s covenant regime gives the Group a significant degree of flexibility when the covenants are below certain levels. The
Group retains operating control below loan to value of 70 per cent and interest cover above 1.4x. No financial covenant default
occurs unless loan to value exceeds 100 per cent or interest cover falls below 1.25x.
Other asset-specific debt
Loan outstandingat 31 December
20151
£m MaturityLTV
covenant
Loan to 31 December
2015 market value2
Interest cover
covenant
Interestcover
actual3
intu Bromley4 112.6 2016 80% 64% 120% 371%
intu Merry Hill 191.3 2017 65% 43% 150% 268%
intu Milton Keynes 125.2 2017 65% 45% 150% 251%
Barton Square 42.5 2017 65% 47% 175% 233%
Sprucefield 33.2 2020 65% 49% 150% 353%
intu Uxbridge5 26.0 2020 70% 56% 125% 175%
St David’s, Cardiff 122.5 2021 65% 33% 150% 298%
intu Asturias5 €47.4 2019 65% 39% 150% 288%
Puerto Venecia, Zaragoza5 €112.5 2019 65% 50% 150% 305%
1 The loan values are the actual principal balances outstanding at 31 December 2015.
2 The loan to 31 December 2015 market value provides an indication of the impact the 31 December 2015 property valuations could have on the LTV covenants. The actual
timing and manner of testing LTV covenants varies and is loan specific.
3 Based on latest certified figures, calculated in accordance with loan agreements, which have been submitted between 31 December 2015 and 31 January 2016. The calculations
are loan specific and include a variety of historical, forecast and in certain instances a combined historical and forecast basis.
4 In January 2016, the loan secured on intu Bromley was settled and replaced by a new £95.8 million loan.
5 Debt shown consistent with the Group’s economic interest.
intu properties plc Annual report 2015162

Intu Debenture plc
Loan
£m MaturityCapital cover
covenantCapital cover
actual Interest cover
covenantInterest cover
actual
231.4 2027 150% 248% 100% 119%
The debenture is currently secured on a number of the Group’s properties including intu Potteries, intu Eldon Square, intu
Broadmarsh and Soar at intu Braehead.
Should the capital cover or interest cover test be breached, Intu Debenture plc (the ‘Issuer’) has three months from the date of
delivery of the valuation or the latest certificate to the Trustees to make good any deficiencies. The Issuer may withdraw property
secured on the debenture by paying a sum of money or through the substitution of alternative property provided that the capital
cover and interest cover tests are satisfied immediately following the substitution.
Financial covenants on corporate facilities
Net worth covenant
Net worthactual
Interest covercovenant
Interest cover actual
Borrowings/net worth covenant
Borrowings/net worth actual
£600m facility, maturing in 2020* £1,200.0m £2,340.2m 120% 205% 125% 69%
£300m due in 2018 2.5 per cent
convertible bonds** n/a n/a n/a n/a 175% 13%
* Tested on the Borrower Group which excludes, at the Group’s election, certain subsidiaries with asset-specific finance. The facility is secured on the Group’s investments in
Manchester Arndale and Cribbs Causeway.
** Tested on the Group excluding, at the Group’s election, the borrowings on certain subsidiaries with asset-specific finance.
Interest rate swaps The table below sets out the nominal amount and average rate of hedging, excluding lenders’ margins, in place under current
and forward starting swap contracts.
Nominal amount
£mAverage rate
%
In effect on or after:
1 year 1,458.2 3.35
2 years 1,389.2 3.46
5 years 801.7 4.48
10 years 674.1 4.90
15 years 663.2 4.91
20 years 116.7 4.70
Other informationintugroup.co.uk 163

Financial information including share of joint ventures (unaudited) for the year ended 31 December 2015
The information in this section is presented to show the Group including its share of joint ventures. A reconciliation from the
amounts shown in the Group’s income statement and balance sheet is provided.
Underlying earnings 2015 2014
Group underlying profit
£m
Share of joint ventures
£m
Group including share of joint
ventures£m
Group underlying profit
£m
Share of joint
ventures £m
Group including share of joint
ventures£m
Rent receivable 461.0 53.0 514.0 441.1 39.3 480.4
Service charge income 96.9 10.6 107.5 88.2 9.5 97.7
Facilities management income from joint
ventures 13.7 (5.8) 7.9 7.1 (3.0) 4.1
Revenue 571.6 57.8 629.4 536.4 45.8 582.2
Net rental income 381.8 46.0 427.8 362.6 34.0 396.6
Net other income 6.9 (1.1) 5.8 4.8 – 4.8
Administration expenses (37.3) (0.7) (38.0) (30.8) (0.3) (31.1)
Underlying operating profit 351.4 44.2 395.6 336.6 33.7 370.3
Finance costs (206.6) (2.3) (208.9) (197.1) (4.1) (201.2)
Finance income 18.7 (17.1) 1.6 11.9 (10.7) 1.2
Other finance costs (5.9) – (5.9) (6.1) – (6.1)
Underlying net finance costs (193.8) (19.4) (213.2) (191.3) (14.8) (206.1)
Underlying profit before tax, joint ventures
and associates 157.6 24.8 182.4 145.3 18.9 164.2
Tax on underlying profit (0.5) (0.1) (0.6) (0.6) (0.3) (0.9)
Share of underlying profit of joint ventures 24.7 (24.7) – 18.6 (18.6) –
Share of underlying profit of associates 0.2 – 0.2 – – –
Remove amounts attributable to non-controlling
interests 4.6 – 4.6 1.3 – 1.3
Interest on convertible bonds deducted
directly in equity – – – (2.9) – (2.9)
Underlying earnings 186.6 – 186.6 161.7 – 161.7
intu properties plc Annual report 2015164

Consolidated income statements 2015 2014
Group income statement
£m
Share of joint ventures
£m
Group including share of joint
ventures£m
Group income statement
£m
Share of joint ventures
£m
Group including share of joint
ventures£m
Revenue 571.6 57.8 629.4 536.4 45.8 582.2
Net rental income 381.8 46.0 427.8 362.6 34.0 396.6
Net other income 6.9 (1.1) 5.8 4.8 – 4.8
Revaluation of investment and development
property 264.9 85.8 350.7 567.8 80.4 648.2
(Loss)/gain on acquisition of subsidiaries (0.8) – (0.8) 1.6 – 1.6
Gain on disposal of subsidiaries 2.2 – 2.2 0.6 – 0.6
Gain on sale of other investments 0.9 – 0.9 – – –
Administration expenses – ongoing (37.3) (0.7) (38.0) (30.8) (0.3) (31.1)
Administration expenses – exceptional (1.0) (0.5) (1.5) (13.8) (0.1) (13.9)
Operating profit 617.6 129.5 747.1 892.8 114.0 1,006.8
Finance costs (206.6) (2.3) (208.9) (197.1) (4.1) (201.2)
Finance income 18.7 (17.1) 1.6 11.9 (10.7) 1.2
Other finance costs (37.3) – (37.3) (56.8) – (56.8)
Change in fair value of financial instruments 6.0 (0.7) 5.3 (157.6) 0.6 (157.0)
Net finance costs (219.2) (20.1) (239.3) (399.6) (14.2) (413.8)
Profit before tax, joint ventures
and associates 398.4 109.4 507.8 493.2 99.8 593.0
Share of post-tax profit of joint ventures 108.6 (108.6) – 99.7 (99.7) –
Share of post-tax profit of associates 6.0 – 6.0 0.8 – 0.8
Profit before tax 513.0 0.8 513.8 593.7 0.1 593.8
Current tax (0.4) (0.1) (0.5) (0.5) (0.1) (0.6)
Deferred tax 5.0 (0.7) 4.3 6.6 – 6.6
Taxation 4.6 (0.8) 3.8 6.1 (0.1) 6.0
Profit for the year 517.6 – 517.6 599.8 – 599.8
Balance sheets 2015 2014
Group balance sheet
£m
Share of joint ventures
£m
Group including share of joint
ventures£m
Group balance sheet
£m
Share of joint ventures
£m
Group including share of joint
ventures£m
Assets
Investment and development property 8,403.9 1,119.8 9,523.7 8,019.6 869.2 8,888.8
Investment in joint ventures 991.9 (991.9) – 851.5 (851.5) –
Derivative financial instruments 3.2 – 3.2 9.7 – 9.7
Cash and cash equivalents 275.8 25.6 301.4 230.0 30.1 260.1
Other assets 472.1 20.9 493.0 451.2 29.5 480.7
Total assets 10,146.9 174.4 10,321.3 9,562.0 77.3 9,639.3
Liabilities
Borrowings (4,471.6) (140.9) (4,612.5) (4,354.0) (35.6) (4,389.6)
Derivative financial instruments (341.7) (2.0) (343.7) (356.5) (0.4) (356.9)
Other liabilities (278.7) (31.5) (310.2) (254.7) (41.3) (296.0)
Total liabilities (5,092.0) (174.4) (5,266.4) (4,965.2) (77.3) (5,042.5)
Net assets 5,054.9 – 5,054.9 4,596.8 – 4,596.8
Other informationintugroup.co.uk 165

Financial information including share of joint ventures (unaudited) continued for the year ended 31 December 2015
Net external debt The table below provides a reconciliation between the components of net debt included on the Group’s balance sheet and net
external debt including the Group’s share of joint ventures’ debt and cash.
2015
£m 2014
£m
Total borrowings 4,471.6 4,354.0
Cash and cash equivalents (275.8) (230.0)
Net debt 4,195.8 4,124.0
Metrocentre compound financial instrument (172.0) (166.1)
Net external debt – before Group’s share of joint ventures 4,023.8 3,957.9
Add share of borrowings of joint ventures 140.9 35.6
Less share of cash of joint ventures (25.6) (30.1)
Net external debt – including Group’s share of joint ventures 4,139.1 3,963.4
Analysed as:
Debt including Group’s share of joint ventures 4,440.5 4,223.5
Cash including Group’s share of joint ventures (301.4) (260.1)
Net external debt – including Group’s share of joint ventures 4,139.1 3,963.4
Debt to assets ratio
2015
£m 2014
£m
Market value of investment and development property 9,602.4 8,963.4
Net external debt (4,139.1) (3,963.4)
Debt to assets ratio 43.1% 44.2%
Pro forma for the £201.9 million received on disposal of the Group’s interest in Equity One on 19 January 2016, the debt to assets
ratio would be 41.0 per cent at 31 December 2015.
Interest cover
2015
£m 2014
£m
Finance costs (208.9) (201.2)
Finance income 1.6 1.2
Interest on convertible bonds recognised directly in equity – (2.9)
(207.3) (202.9)
Underlying operating profit 395.6 370.3
Less trading property related items – (0.6)
395.6 369.7
Interest cover 1.91x 1.82x
intu properties plc Annual report 2015166

Underlying profit statement (unaudited) for the six months ended 31 December 2015
The underlying profit information in the table below shows the Group including its share of joint ventures on a line-by-line basis.
Year ended 31 December
2015£m
Year ended 31 December
2014£m
Six months ended
31 December 2015
£m
Six months ended
31 December 2014
£m
Six months ended
30 June 2015
£m
Six months ended
30 June 2014
£m
Net rental income 427.8 396.6 220.2 207.4 207.6 189.2
Net other income 5.8 4.8 3.2 2.8 2.6 2.0
Administration expenses (38.0) (31.1) (21.7) (16.2) (16.3) (14.9)
Underlying operating profit 395.6 370.3 201.7 194.0 193.9 176.3
Finance costs (208.9) (201.2) (103.8) (103.5) (105.1) (97.7)
Finance income 1.6 1.2 1.1 0.7 0.5 0.5
Other finance costs (5.9) (6.1) (3.0) (3.0) (2.9) (3.1)
Underlying net finance costs (213.2) (206.1) (105.7) (105.8) (107.5) (100.3)
Underlying profit before tax and associates 182.4 164.2 96.0 88.2 86.4 76.0
Tax on underlying profit (0.6) (0.9) (0.3) (0.6) (0.3) (0.3)
Share of underlying profit of associates 0.2 – 0.1 – 0.1 –
Remove amounts attributable to non-
controlling interests 4.6 1.3 2.1 2.1 2.5 (0.8)
Interest on convertible bonds deducted directly
in equity – (2.9) – – – (2.9)
Underlying earnings 186.6 161.7 97.9 89.7 88.7 72.0
Underlying earnings per share (pence) 14.2p 13.3p 7.4p 6.9p 6.8p 6.4p
Weighted average number of shares (million) 1,318.1 1,214.6 1,327.6 1,297.9 1,308.3 1,129.5
For the reconciliation from basic earnings per share see note 17.
Other informationintugroup.co.uk 167

EPRA performance measures (unaudited)
1 Summary The EPRA Best Practice Recommendations identify six key performance measures, including the EPRA Cost Ratios. The measures
are deemed to be of importance for investors in property companies and aim to encourage more consistent and widespread
disclosure. The Group is supportive of this initiative but continues to disclose additional measures throughout this report which
it believes are more appropriate to the Group’s current circumstances.
In 2015, the Group retained its EPRA Gold Award for exceptional compliance with the EPRA Best Practice Recommendations.
The EPRA measures, as calculated including the Group’s share of joint ventures, are summarised below and detailed in the
tables following:
Table 2015 2014
EPRA cost ratio (including direct vacancy costs) 2 19.9% 19.4%
EPRA cost ratio (excluding direct vacancy costs) 2 16.0% 15.5%
EPRA earnings 3 £187.7m £154.9m
— per share 3 14.3p 12.8p
EPRA NAV 4(a) £5,188.5m £4,740.0m
— per share 4(a) 387p 361p
EPRA NNNAV 4(b) £4,878.7m £4,322.4m
— per share 4(b) 365p 329p
EPRA net initial yield 5 4.3% 4.4%
EPRA ‘topped-up’ NIY 5 4.5% 4.6%
EPRA vacancy rate 6 2.6% 3.0%
Details of the Group’s performance against the EPRA Best Practice Recommendations on Sustainability Reporting can be found
in full in the 2015 corporate responsibility report. In 2015, the Group retained its Gold EPRA Sustainability Best Practice
Recommendations award.
2 EPRA Cost Ratios
2015
£m 2014
£m
Administration expenses – ongoing 38.0 31.1
Net service charge costs 14.0 11.3
Other non-recoverable costs 49.8 49.1
Remove:
Service charge costs recovered through rents (4.8) (3.3)
EPRA costs – including direct vacancy costs 97.0 88.2
Direct vacancy costs (18.9) (17.9)
EPRA costs – excluding direct vacancy costs 78.1 70.3
Rent receivable 514.0 480.4
Rent payable (22.4) (23.4)
Gross rental income less ground rent payable 491.6 457.0
Remove:
Service charge costs recovered through rents (4.8) (3.3)
Gross rental income 486.8 453.7
EPRA cost ratio (including direct vacancy costs) 19.9% 19.4%
EPRA cost ratio (excluding direct vacancy costs) 16.0% 15.5%
intu properties plc Annual report 2015168

3 EPRA earnings EPRA earnings per share has been presented as recommended by EPRA which seeks to assist comparison between European
property companies. However, we believe that our measure of underlying earnings per share is more appropriate than the EPRA
measure in the context of our business as set out in note 17. The key difference relates to the adjustments in respect of exceptional
items where EPRA is prescriptive about the adjustments that can be made limiting these to acquisition related costs and costs
incurred on termination of derivative financial instruments. A reconciliation of EPRA earnings per share to the Group’s measure
of underlying earnings per share is provided below.
2015 2014
Earnings
£mSharesmillion
Pence pershare
Earnings £m
Sharesmillion
Pence pershare
Basic earnings per share 518.4 1,318.1 39.3p 583.3 1,214.6 48.0p
Remove:
Revaluation of investment and development
property (264.9) (20.1)p (567.8) (46.7)p
Loss/(gain) on acquisition of businesses 0.8 0.1p (1.6) (0.1)p
Gain on disposal of subsidiaries (2.2) (0.2)p (0.6) –
Gain on sale of other investments (0.9) (0.1)p – –
Exceptional administration costs – acquisition
and disposal related 0.4 – 13.1 1.1p
Exceptional finance charges – termination
of derivative financial instruments 26.5 2.1p 44.1 3.6p
Change in fair value of financial instruments (6.0) (0.4)p 157.6 13.0p
Tax on the above (3.6) (0.3)p (5.6) (0.5)p
Share of joint ventures’ adjusting items (84.3) (6.4)p (81.7) (6.7)p
Share of associates’ adjusting items (0.3) – (0.8) (0.1)p
Non-controlling interests in respect
of the above 3.8 0.3p 14.9 1.2p
EPRA earnings per share 187.7 1,318.1 14.3p 154.9 1,214.6 12.8p
Reconciliation to the Group’s measure of underlying earnings per share
Remove:
Other exceptional items 5.5 0.4p 7.3 0.6p
Other exceptional tax (1.5) (0.1)p (1.1) (0.1)p
Add:
Share of associates’ adjusting items (5.5) (0.4)p – –
Share of joint ventures’ adjusting items 0.4 – 0.6 –
Underlying earnings per share 186.6 1,318.1 14.2p 161.7 1,214.6 13.3p
Other informationintugroup.co.uk 169

EPRA performance measures (unaudited) continued
4 EPRA NAV (a) EPRA NAV
EPRA NAV has been presented as recommended by EPRA which seeks to assist comparison between European property
companies. However, we believe that our measure of NAV per share (diluted, adjusted), as presented in note 18a, is more
appropriate than the EPRA measure in the context of our business. The key difference is the swaps not currently used for economic
hedges of debt which are excluded in the Group’s definition of NAV per share (diluted, adjusted). The adjustment in respect of the
non-controlling interest recoverable balance not recognised is due to historical accounting practices and is required, in our view, to
give a more appropriate value of net assets attributable to equity owners of the Group. A reconciliation of EPRA NAV to the Group’s
measure of NAV per share (diluted, adjusted) is provided below.
As for earnings per share, the comparative number of shares have been adjusted to reflect the rights issue. See note 17 for details.
2015 2014
Net assets
£mSharesmillion
NAV per share
penceNet assets
£m Sharesmillion
NAV per share
pence
NAV attributable to owners of intu properties plc 4,976.4 1,331.9 374p 4,524.0 1,303.7 347p
Dilutive convertible bonds, share options and awards 16.2 6.4 22.2 8.6
Diluted NAV per share 4,992.6 1,338.3 373p 4,546.2 1,312.3 347p
Remove:
Fair value of derivative financial instruments (excluding swaps not
currently used for economic hedges of debt and net of tax) 99.4 7p 104.3 8p
Deferred tax on investment and development property and other
investments 18.9 1p 14.1 1p
Share of joint ventures’ adjusting items 6.3 1p 4.1 –
Add:
Non-controlling interest recoverable balance not recognised 71.3 5p 71.3 5p
EPRA NAV per share 5,188.5 1,338.3 387p 4,740.0 1,312.3 361p
Reconciliation to the Group’s measure of underlying earnings per share
Remove:
Swaps not currently used for economic hedges of debt (net of tax) 222.7 17p 228.9 18p
NAV per share (diluted, adjusted) 5,411.2 1,338.3 404p 4,968.9 1,312.3 379p
(b) EPRA NNNAV
The Group’s measure of NNNAV per share (diluted, adjusted) disclosed in note 18 is equal to the EPRA NNNAV measure
presented below:
2015 2014
Net assets
£mSharesmillion
NAV per share
penceNet assets
£m Sharesmillion
NAV per share
pence
EPRA NAV 5,188.5 1,338.3 387p 4,740.0 1,312.3 361p
Fair value of derivative financial instruments (net of tax) (99.4) (7)p (104.3) (8)p
Excess of fair value of debt over book value (194.4) (14)p (310.2) (24)p
Deferred tax on investment and development property and other
investments (18.9) (1)p (14.1) (1)p
Share of joint ventures’ adjusting items (8.1) (1)p (6.0) –
Non-controlling interests in respect of the above 11.0 1p 17.0 1p
EPRA NNNAV 4,878.7 1,338.3 365p 4,322.4 1,312.3 329p
intu properties plc Annual report 2015170

5 EPRA net initial yield and ‘topped-up’ NIY
2015
£m2014
£m
Investment and development property 9,602 8,963
Less developments (144) (74)
Completed property portfolio 9,458 8,889
Allowance for estimated purchasers costs 525 457
Gross up completed property portfolio valuation 9,983 9,346
Annualised cash passing rental income 449 436
Property outgoings (20) (21)
Annualised net rents 429 415
Notional rent on expiration of rent free periods or other lease incentives 21 19
Topped-up net annualised rent 450 434
EPRA net initial yield 4.3% 4.4%
EPRA ‘topped-up’ NIY 4.5% 4.6%
EPRA net initial yield and ‘topped-up’ NIY by property is given in the investment and development property section.
6 EPRA vacancy rate
2015
%2014
%
intu Trafford Centre 1.7 3.4
intu Lakeside 2.7 2.2
intu Metrocentre 4.3 2.7
intu Braehead 3.6 3.8
intu Derby 1.2 0.1
Manchester Arndale 0.7 2.6
intu Victoria Centre 2.6 3.3
intu Watford 4.6 2.6
intu Eldon Square 0.9 3.1
intu Milton Keynes 2.8 0.8
intu Chapelfield – 1.2
Cribbs Causeway 4.2 8.2
intu Potteries 2.7 3.0
intu Bromley 2.4 4.8
intu Merry Hill 3.2 3.0
St David’s, Cardiff 3.8 5.0
Puerto Venecia, Zaragoza 5.0 n/a
intu Asturias 0.4 0.7
2.6 3.0
EPRA vacancy rate is the ERV of vacant space divided by total ERV. This differs from the Group’s measure of occupancy which
treats units in administration and no longer trading as un-let, units under offer as let, and assesses occupied units using passing
rent not ERV.
Other informationintugroup.co.uk 171

Financial record 2011-2015
2011 2012 2013 2014 2015
Net rental income £364m £363m £370m £397m £428m
Underlying earnings £139m £138m £140m £162m £187m
Underlying earnings per share1 15.0p 14.7p 13.7p 13.3p 14.2p
Dividend per share1 13.7p 13.7p 13.7p 13.7p 13.7p
Property revaluation surplus £63m £41m £126m £648m £351m
NAV per share (diluted, adjusted)1 356p 357p 346p 379p 404p
Market value of investment and development property £6,960m £7,073m £7,624m £8,963m £9,602m
Net external debt £3,374m £3,504m £3,698m £3,963m £4,139m
Debt to assets ratio 48.5% 49.5% 48.5% 44.2% 43.1%
Interest cover 1.71x 1.69x 1.71x 1.82x 1.91x
Change in like-for-like net rental income 3.6% (2.7)% (1.9)% (3.2)% 1.8%
Occupancy 97% 96% 95% 95% 96%
Growth in footfall (like-for-like) 2% (1)% (2)% +0% +0%
Amounts presented include the Group’s share of joint ventures.
1 Amounts for 2013 and earlier are as adjusted by the 2014 rights issue bonus factor.
intu properties plc Annual report 2015172

Glossary
ABC1 customers Proportion of customers within UK social groups A, B and C1,
defined as members of households whose chief earner’s
occupation is professional, higher or intermediate management,
or supervisory.
Annual property income The Group’s share of passing rent plus the external valuers’
estimate of annual excess turnover rent and sundry income
such as that from car parks and mall commercialisation.
CACI Provide market research on intu’s customers and UK wide
location analysis.
Debt to assets ratio Net external debt divided by the market value of investment
and development property.
Diluted figures Reported amounts adjusted to include the effects of dilutive
potential shares issuable under convertible bonds and employee
incentive arrangements.
Earnings per share Profit for the period attributable to owners of intu properties plc
divided by the weighted average number of shares in issue
during the period.
EPRA European Public Real Estate Association, the publisher of Best
Practice Recommendations intended to make financial
statements of public real estate companies in Europe clearer,
more transparent and comparable.
ERV (estimated rental value) The external valuers’ estimate of the Group’s share of the
current annual market rent of all lettable space after expiry of
concessionary periods net of any non-recoverable charges but
before bad debt provisions.
Exceptional items Items that in the Directors’ view are required to be separately
disclosed by virtue of their size, nature or incidence to enable a
full understanding of the Group’s financial performance.
Headline rent ITZA Annual contracted rent per square foot after expiry of
concessionary periods in terms of Zone A.
Interest cover Underlying operating profit excluding trading property
related items divided by the net finance cost plus interest on
convertible bonds recognised in equity excluding the change
in fair value of financial instruments, exceptional finance
costs and amortisation of the Metrocentre compound
financial instrument.
Interest rate swap A derivative financial instrument enabling parties to exchange
interest rate obligations for a predetermined period. These are
used by the Group to convert floating rate debt to fixed rates.
IPD Investment Property Databank Limited, producer of an
independent benchmark of property returns.
Like-for-like property Investment property which has been owned throughout both
periods without significant capital expenditure in either period,
so that income can be compared on a like-for-like basis. For the
purposes of comparison of capital values, this will also include
assets owned at the previous reporting period end but not
throughout the prior period.
Long-term lease A lease with a term certain of at least five years.
LTV (loan to value) The ratio of attributable debt to the market value of an
investment property.
NAV per share (diluted, adjusted) NAV per share calculated on a diluted basis and adjusted to
remove the fair value of derivatives (net of tax), goodwill
resulting from the recognition of deferred tax liabilities, and
deferred tax on investment and development property and
other investments.
Net asset value (NAV) per share Net assets attributable to owners of intu properties plc divided
by the number of ordinary shares in issue at the period end.
Net external debt Net debt after removing the Metrocentre compound financial
instrument.
Net initial yield (EPRA) Annualised net rent on investment property (after deduction
of revenue costs such as head rent, running void, service
charge after shortfalls, empty rates and merchant association
contribution) expressed as a percentage of the gross market
value before deduction of theoretical acquisition costs,
consistent with EPRA’s net initial yield, and as provided by
the Group’s independent external valuers.
Net rental income The Group’s share of net rents receivable as shown in
the income statement, having taken due account of
non-recoverable costs, bad debt provisions and adjustments
to comply with IFRS including those regarding tenant
lease incentives.
Other informationintugroup.co.uk 173

Glossary continued
NNNAV per share (diluted, adjusted) NAV per share (diluted, adjusted) adjusted to include
the fair values of derivatives, debt and deferred taxes.
Nominal equivalent yield Effective annual yield to a purchaser from an asset at market
value before taking account of notional acquisition costs
assuming rent is receivable annually in arrears, reflecting
ERV but disregarding potential changes in market rents,
as determined by the Group’s independent external valuers.
Occupancy The passing rent of let and under offer units expressed as
a percentage of the passing rent of let and under offer units
plus ERV of un-let units, excluding development and recently
completed properties. Units let to tenants in administration
and still trading are treated as let and those no longer trading
are treated as un-let.
Passing rent The Group’s share of contracted annual rents receivable at
the balance sheet date. This takes no account of accounting
adjustments made in respect of rent free periods or tenant
incentives, the reclassification of certain lease payments as
finance charges or any irrecoverable costs and expenses, and
does not include excess turnover rent, additional rent in respect
of unsettled rent reviews or sundry income such as from car
parks etc. Contracted annual rents in respect of tenants in
administration are excluded.
PMA Property Market Analysis LLP, a producer of property market
research and forecasting.
Property Income Distribution (PID) A dividend, generally subject to UK withholding tax at the
basic rate of income tax, that a UK REIT is required to pay to its
shareholders from its qualifying rental profits. Certain classes
of shareholder may qualify to receive a PID gross, shareholders
should refer to intugroup.co.uk for further information. The
Group can also pay non-PID dividends which are not subject
to UK withholding tax.
Real Estate Investment Trust (REIT) REITs are internationally recognised property investment
vehicles which have now been introduced in many countries
around the world. Each country has its own rules, but the
broad intention of REITs is to encourage investment in
domestic property by removing tax distortions for investors.
In the UK, REITs must meet certain ongoing rules and
regulations, including the requirement to distribute at
least 90 per cent of qualifying rental profits to shareholders.
Withholding tax of 20 per cent is deducted from these
Property Income Distributions (see above). Profits from a
REIT’s non-property business remain subject to normal
corporation tax. The Group elected for REIT status in the
UK with effect from 1 January 2007.
Scrip Dividend Scheme The Group offers shareholders the opportunity to participate
in the Scrip Dividend Scheme. This enables participating
shareholders to receive shares instead of cash when a Scrip
Alternative is offered for a particular dividend.
Short-term lease A lease with a term certain of less than five years.
SOCIMI The Spanish equivalent of a Real Estate Investment Trust
(see definition).
Tenant (or lease) incentives Any incentives offered to occupiers to enter into a lease.
Typically incentives are in the form of an initial rent free
period and/or a cash contribution to fit out the premises.
Under IFRS the value of incentives granted to tenants is
amortised through the income statement on a straight-line
basis over the lease term.
Topped-up NIY (EPRA) Net initial yield adjusted for the expiration of rent free periods
and other unexpired lease incentives.
Total financial return The change in NAV per share (diluted, adjusted) plus dividends
per share paid in the period expressed as a percentage of
opening NAV per share (diluted, adjusted).
Total property return The change in capital value, less any capital expenditure
incurred, plus net income in the year expressed as a percentage
of the capital employed (opening capital value plus capital
expenditure incurred) in the year as calculated by IPD.
Underlying earnings per share (EPS) Earnings per share adjusted to exclude valuation movements,
exceptional items and related tax.
Underlying figures Amounts described as underlying exclude valuation
movements, exceptional items and related tax.
Vacancy rate (EPRA) The ERV of vacant space divided by total ERV.
Yield shift A movement (usually expressed in basis points) in the yield of
a property asset.
intu properties plc Annual report 2015174

Dividends
The Directors of intu properties plc have proposed a final
dividend per ordinary share (ISIN GB0006834344) of 9.1 pence
(2014: 9.1 pence) to bring the total dividend per ordinary share
for the year to 13.7 pence (2014: 13.7 pence as adjusted by the
rights issue bonus factor). A scrip dividend alternative may
be offered.
The dividend may be partly paid as a Property Income
Distribution (‘PID’) and partly paid as a non-PID. The PID
element will be subject to deduction of a 20 per cent
withholding tax unless exemptions apply (please refer to the
PID special note below). Any non-PID element will be treated
as an ordinary UK company dividend. For South African
shareholders, non-PID cash dividends may be subject to
deduction of South African Dividends Tax at 15 per cent.
The following are the salient dates for the payment of the
proposed final dividend.
Tuesday 29 March 2016 Sterling/Rand exchange rate struck
Wednesday 30 March 2016 Sterling/Rand exchange rate and dividend amount in South
African currency announced
Monday 11 April 2016 Ordinary shares listed ex-dividend on the Johannesburg
Stock Exchange
Thursday 14 April 2016 Ordinary shares listed ex-dividend on the London Stock
Exchange
Friday 15 April 2016 Record date for 2015 final dividend in London
and Johannesburg
Thursday 26 May 2016 Dividend payment date for shareholders
South African shareholders should note that, in accordance with
the requirements of Strate, the last day to trade cum-dividend
will be Friday 8 April 2016 and that no dematerialisation or
rematerialisation of shares will be possible from Monday
11 April 2016 to Friday 15 April 2016 inclusive. No transfers
between the UK and South African registers may take
place from Thursday 24 March 2016 to Monday 18 April
2016 inclusive.
PID SPECIAL NOTE: UK shareholders
For those who are eligible for exemption from the 20 per
cent withholding tax and have not previously registered for
exemption, an HM Revenue & Customs (‘HMRC’) Tax Exemption
Declaration is available for download from the ‘Investors’
section of the intu properties plc website (intugroup.co.uk), or
on request to our UK registrars, Capita Asset Services. Validly
completed forms must be received by Capita Asset Services no
later than the dividend Record Date, as advised; otherwise the
dividend will be paid after deduction of tax.
South African and other non-UK shareholders
South African shareholders may apply to HMRC after payment
of the dividend for a refund of the difference between the
20 per cent withholding tax and the UK/South African double
taxation treaty rate of 15 per cent. Other non-UK shareholders
may be able to make similar claims for a refund of UK
withholding tax deducted. Refund application forms for all non-
UK shareholders are available for download from the ‘Investors’
section of the intu properties plc website (intugroup.co.uk), or
on request to our South African registrars, Trifecta, or HMRC.
UK withholding tax refunds are not claimable from intu
properties plc, the South African Revenue Service (‘SARS’)
or other national authorities, only from the UK’s HMRC.
Additional information on PIDs can be found at
intugroup.co.uk/investors/shareholders-bondholders/real-
estate-investment-trust/.
The above does not constitute advice and shareholders should
seek their own professional guidance. intu properties plc does
not accept liability for any loss suffered arising from reliance
on the above.
SUMMER BUDGET 2015 SPECIAL NOTE: UK shareholders should note that the Summer Budget 2015
announced that the dividend tax credit is to be replaced with a
new personal tax-free dividend allowance of £5,000 a year for
all UK taxpayers from 6 April 2016.
These new rules will only apply to any non-PIDs paid, but there
will be no change to the taxation of PIDs paid by intu properties
plc. The Company’s dividend communications in May will be
updated, as required, to reflect the new taxation arrangements.
Other informationintugroup.co.uk 175

Shareholder information
Registered Office 40 Broadway, London SW1H 0BT
Registered in England & Wales no. 3685527
Websites intugroup.co.uk
intu.co.uk
Registrars All enquiries concerning shares or shareholdings, including
notification of change of address, queries regarding loss of a
share certificate and dividend payments should be addressed to:
For shareholders registered in the UK
Capita Asset Services
The Registry, 34 Beckenham Road, Beckenham, Kent BR3 4TU.
Calls are charged at the standard geographic rate and will vary
by provider; lines are open 9.00am to 5.30pm Monday to Friday
Telephone +44 (0) 371 664 0300
Email: [email protected]
capitashareportal.com
For shareholders registered in South Africa
From 1 February 2016,
Trifecta Capital Services
31 Beacon Road, Florida North, 1709
South Africa
Postal address:
PO Box 61272
Marshalltown 2107, South Africa
Telephone +27 (0) 860 222 213
Email: [email protected]
Payment of dividends Shareholders who wish to have their dividends paid directly into
a bank or building society account should complete a mandate
form available from the appropriate registrars.
Share price information The latest information on the intu properties plc share price is
available on the website intugroup.co.uk.
Web-based enquiry service for shareholders Shareholders registered in the UK can go to
capitashareportal.com to obtain details of their shareholdings
and dividends. The shareholder’s surname, Investor Code
(found on any correspondence from registrars) and postcode
are required to use this service. Shareholders may also use
this service to amend or change their address and dividend
mandate details.
Shareholders registered in South Africa can go to
trifectacapital.net/how-can-we-help-you/ to obtain details
of their shareholdings. Shareholders will need to follow a
registration process in order to access such information.
Unfortunately, due to South African legal requirements,
shareholders may not update records, but will be able to
view their entire holding of shares globally. Please note that
the Trifecta company code for intu properties plc is ITUZ.
Share dealing Existing UK shareholders may trade intu properties plc shares
through Capita Share Dealing Services who provide an easy
to use, real-time online, telephone and postal dealing service.
Contact details are:
capitadeal.com
Telephone (within UK) 0871 664 0364 (calls cost 10p per
minute plus network extras; lines are open 8.00 am to 4.30 pm
Monday to Friday)
(Ireland) Lo-call 1 890 946 375
(outside UK) +44 20 3367 2686
Existing South African shareholders whose shares are held in
electronic format through Trifecta’s CSDP may trade intu
properties plc shares through Trifecta’s low cost telephone
share dealing service on 0869 222 213 (SA calls only).
Sharegift Shareholders with a small number of shares, which may be
uneconomic to sell on a commission basis, may wish to consider
donating them to the charity Sharegift (registered charity no.
1052686). Further information can be found on Sharegift’s
website sharegift.org or by calling them on 020 7930 3737.
Strate Charity Shares South African shareholders for whom the cost of selling their
shares would exceed the market value of such shares may wish
to consider donating them to charity. An independent non-profit
organisation called Strate Charity Shares has been established
to administer this process. The South African Revenue Service
(SARS) has advised Strate Charity Shares that the value of any
shares donated may be deducted from taxable income, as the
scheme is registered under section 18A of the Income Tax Act.
For further details, queries and/or donations contact the
Strate Share Care toll free help line on 0800 202 363 or
+27 11 373 0038 if you are phoning from outside South Africa
or email [email protected]
Electronic communication The Company supplies information such as the annual report
via its website to shareholders who have consented to such
communication. Shareholders will be notified by email or
post when new information is available on the website.
Shareholders can at any time revoke a previous instruction
in order to receive hard copies of shareholder information.
UK shareholders may register to receive email alerts by logging
on to the website of the UK Registrars (capitashareportal.com)
and following the instructions given to register an email
address. SA shareholders may register to receive email alerts
by written instruction to the South African Registrar, Trifecta,
sent either by email ([email protected]) or by facsimile
(+27 860 222 213). Once registered, shareholders are sent a
‘Notice of Availability’ email highlighting that the annual report
or other information is available for viewing on the website.
intu properties plc Annual report 2015176