Embed Size (px)
Citation preview

The Importance of Micro Hydropower for Rural Electrification in Lao PDR
An Evaluation of the Status and Needs of Existing Micro Hydropower
Plants and Suggestions of Possible New Sites
A Minor Field Study
Elin Sundqvist and David Wårlind, 2006
Lund University Department of Physics Sölvegatan 14 C 223 62 Lund Sweden


The Importance of Micro Hydropower for Rural
Electrification in Lao PDR
An Evaluation of the Status and Needs of Existing Micro Hydropower Plants and Suggestions of Possible New Sites
A Minor Field Study ___________________________________________________
Elin Sundqvist and David Wårlind, 2006
Supervisors Lao PDR: Dir. Andy Schroeter Sunlabob Rural Electrification System Co.Ltd.
Dr. Khamphone Nanthavong Faculty of Engineering and Architecture at the National University of Lao PDR and Head of Trainings Unit at Sunlabob Rural Electrification System Co.Ltd.
Lund: Assistant Lecturer Ulrik Mårtensson Department of Physical Geography and Ecosystems
Analysis, Lund University, Sweden. Senior Lecturer Carl-Erik Magnusson Department of Physics, Lund University, Sweden.


i
Acknowledgments This minor field study was an opportunity to gain a better understanding of micro hydropower in a rural society context, which can be quite different from what is written in the textbooks. It also gave a chance to learn more about the culture and traditions of the different ethnic groups living in Lao PDR. We have experienced very much from this field study and would like to thank all of you who made it possible. Firstly we would like to thank our supervisor in Lao PDR, Dir. Andy Schroeter at Sunlabob Rural Electrification Systems, who helped with all the contacts in Lao PDR and without whom we would not have had the chance to perform this field study. Further on we would like to thank our supervisor Assistant lecturer Ulrik Mårtensson at the Department of Physical Geography and Ecosystem Analysis, for helping with the preparations of the field study and with the writing of this report and our supervisor Senior lecturer Carl Erik Magnusson at the Department of Physics for guidance in the report writing. Thanks also to Mr Jean-Nicolas Poussart for helping and giving us inspiration before the departure. A warm thanks to all Sunlabob staff for making us feel welcome and a special thanks to Mr Tongduean Pengnapha and Mr Souvanthong Vorrabout our guides and invaluable company on the field trips, Dr Kamphone Nanthavong for introducing us to our work, Mrs Andrea Schroeter for sharing your experience of the Lao country with us and Mr Lloyd Osborne for your nice company. Thanks also to Dr. Carl Mossberg for taking time with us at NAFRI and Dir. Victor Gillespie at Geomathics for the GIS data. Finally we would like to thank Mr Bouathep Malaykham chief of Rural Electrification Division at MIH, for taking time and explaining about the energy situation in Lao PDR and the plans for rural electrification.

ii

iii
Abstract Many rural areas in Lao PDR have no access to electricity. Even though the government plans are to increase the national electricity grid, there are many districts that will have to wait a long time before the electricity reaches their part of the country. Hydropower is responsible for almost all the electricity generated in Lao PDR and yet only a small part of the rivers potential is used. This Minor Field Study investigates the importance of micro hydropower for rural electrification in the northern part of Lao PDR. One part of the work is to evaluate the micro hydropower plants that already exist and to see the needs of the villagers. The other part of the work is to find new sites in the rivers where the water flow and height differences are large enough so that new micro hydropower plants can be built. The criterions are that the plants must have a capacity of at least 20 kW, a water flow above 0,3 m3/s during the dry season and a height difference off more than 10 metres. The evaluation of existing micro hydropower plants is done in cooperation with our supervisors at the rural electrification company Sunlabob. The results are based on field studies at eight different plants and interviews with energy authorities, plant operators, and families near the plants. To find suitable sites for new micro hydropower plants, a self made algorithm, including a water balance model GR2M, is used. The GR2M model calculates the water flow for a certain position in a river, based on the precipitation and evapotranspiration of that positions catchment area. The height difference for a section in a river is calculated in the algorithm for two positions within 300 metres from each other. The monthly mean of precipitation and temperature for different weather stations in Lao PDR, Thailand, Vietnam and China is used for modelling the water flows. Temperature is used for estimating the potential evapotranspiration since not all weather stations have any data on evapotranspiration. To calculate the elevation differences in the rivers (head) a digital elevation model is used. The climate data is first transformed so that its coordinate system agrees with the digital elevation models and then interpolated over the study area. The information gathered during the field study in Lao PDR shows that the electricity generated by the existing micro hydropower plants did not meet the villagers’ energy demand. Especially during the dry season when the micro hydropower plants full capacity could not be used, there is a shortage of electricity. The electricity is often sufficient only for light at night and for TV at some households. Wood is almost exclusively used for cooking and the electricity from the power plants is only occasionally used for income generating business. Many of the micro hydropower plants are in bad condition or have even stopped working. This is often due to that the load on the generators is too high, the equipment is second hand, no spare parts are available, and there is a shortage of money for regular maintenance. The modelling of water flow and elevation differences in the small rivers gave 1503 new potential sites for micro hydropower plants. The electricity generated at these sites varied from 20 kW to 600 kW. Because only five hydrographs were available for calibration and four for validation the quality of the modelling is hard to judge. An evaluation of the water flow at the sites has to be done to determine its quality.

iv

v
Populärvetenskaplig Sammanfattning Stora delar av landsbygden i Laos saknar elektricitet och trots att det finns planer på att bygga ut det befintliga elnätet är det många distrikt som kommer att få vänta länge på sin tur. Vattenkraft står för nästan all genererad elektricitet i Laos och ändå är bara en liten del av flodernas potential utnyttjad. Detta arbete undersöker vilken betydelse mikrovattenkraftverk har för elektrifieringen av landsbygden i norra Laos. Ena delen av arbetet syftar till att utvärdera de mikrovattenkraftverk som redan finns och undersöka energibehovet på landsbygden medan den andra delen av arbetet syftar till att finna lämpliga platser i mindre floder där vattenflödet och höjdskillnaden är tillräckligt stor för att nya mikrovattenkraftverk ska kunna byggas. Kriterierna var att mikrovattenkraftverken minst ska ge 20 kW, att vattenflödet inte får understiga 0.3 m3/s under torrsäsongen och att höjdskillnaden ska vara minst 10 m. Utvärderingen av befintliga mikrovattenkraftverken har skett i samarbete med våra handledare på företaget Sunlabob i Laos som arbetar med elektrifiering av landsbygden. Fältstudier på åtta olika mikrovattenkraftverk och intervjuer med arbetare på mikrovattenkraftverken, energimyndigheter och familjer på landsbygden har varit grund för resultaten. För att hitta lämpliga platser för nya mikrovattenkraft-verk har vi använt oss av en egenhändigt utvecklad algoritm som inkluderar vattenbalansmodellen GR2M. Vattenbalansmodellen beräknar vattenflödet för en viss punkt i en flod, utifrån givna värden på medelnederbörden och medelevapo-transpirationen i punktens avrinningsområde. Höjdskillnaden beräknades i algoritmen genom at ta fallhöjden mellan två punkter i floden på högst 300 meters avstånd. Månadsmedelvärdet för nederbörd och temperatur från olika väderstationer i Laos, Thailand, Vietnam och Kina har använts som utgångsdata för modelleringen av vattenflöden i floderna. Temperaturen används för att beräkna evapotranspirationen eftersom data för evapotranspirationen inte finns tillgänglig på alla stationer. För att beräkna höjdskillnaderna i floderna har ett raster med höjddata använts. Klimatdata är först transformerad för att koordinatsystemet ska stämma överens med höjddata och därefter interpolerad över hela studieområdet. Fältstudierna i Laos visar att elektriciteten från de befintliga mikrovattenkraftverken inte är tillräcklig för byarnas energibehov, vilket är speciellt påtagligt under torrsäsongen när vattenkraftverkens fulla kapacitet inte kan utnyttjas. Elektriciteten räcker oftast bara till ljus på kvällen och till TV för vissa hushåll. Ved används nästan uteslutande för matlagning och elektriciteten från vattenkraftverken kan bara i enstaka fall användas för inkomstgenererande aktiviteter. Många av vattenkraftverken är i dåligt skick och en stor del har helt slutat att fungera. Detta beror oftast på att det är för stor belastning på generatorerna, att utrustningen som används är begagnad och att det inte finns reservdelar och pengar till reparationer. Beräkningarna av vattenflöde och höjdskillnader i de mindre floderna gav 1503 lämpliga platser för att bygga nya mikrovattenkraftverk. Den möjliga energin för platserna varierade mellan 20 kW och 600 kW. På grund av tillgång till endast nio vattenflödeskurvor att kalibrera och validering modellen med är dess lämplighet svår att bedöma. En utvärdering av de funna platserna med mätningar av vattenflöde på plats är nödvändig för att kunna avgöra hur väl den fungerar.

vi

vii
Abbreviations Organisations DoE Department of Electricity EdL Electricity du Lao EPSG European Petroleum Survey Group GoL Government of Lao PDR JICA Japan International Cooperation Agency Lao PDR Lao People’s Democratic Republic LNCE Lao National Committee for Energy MIH Ministry of Industry and Handicraft NAFRI National Agricultural and Forestry
Research Institute RED Rural Electrification Division SPRE Southern Provinces Rural Electrification
Program GR2M – Model Parameters P Precipitation P1 Surface runoff P2 Percolated water P3 Effective precipitation to the routing part Q Water flow R Soil moisture at end of month R1 Amount of water in the routing part R2 R1 * groundwater exchange outside the
catchment area S Soil moisture at start of month S1 Soil moisture after including the
precipitation S2 Soil moisture after evaporation X1 Field capacity (Calibration parameter) X2 Groundwater exchange coefficient (CP) Economical GNP Gross National Product Euro Currency of the European Union Kip Currency of Lao PDR SEK Swedish Krona USD United States Dollar Currency rate 1 of May 2006 (Oanda 2006) 1 USD = 10 334 Kip 1 Euro = 13 056 Kip 1 SEK = 1 406 Kip Others DEM Digital Elevation Model GIS Geographical Information System GPS Global Positioning System IDW Inverse Distance Weighted UTM Universal Transverse Mercator WGS 84 World Geodetic System from 1984
Units / Prefix k kilo 103
M Mega 106
G Giga 109
W Watt kW kilowatt MW Megawatt GW Gigawatt kWh kilowatt hour PP Potential Power Q Water Flow h Head g Constant of gravity ρ Density of water
ET Evapotranspiration PE Potential Evaporation PET Potential Evapotranspiration Re Extraterrestrial Radiation λ Latent Heat of Vaporization Ta Daily Mean Air Temperature Tmin Daily Minimum Air Temperature Tmax Daily Maximum Air Temperature
dr Inverse Relative Distance Earth
sω Sunset Hour Angle
ϕ Latitude (radian)
d Solar Declination J Julian day λ Longitude
θ Latitude H Height PV Photovoltaic Objective Functions R
2 Efficiency Criterion VE Relative Volume Error RV Standard Criterion
obsQ Observed monthly water flow
mQ Modelled monthly water flow
obsQ Observed mean monthly water flow

viii

ix
Table of Contents
ACKNOWLEDGMENTS........................................................................................I
ABSTRACT...........................................................................................................III
POPULÄRVETENSKAPLIG SAMMANFATTNING..........................................V
ABBREVIATIONS ..............................................................................................VII
1 INTRODUCTION................................................................................................ 1
1.1 OBJECTIVES...................................................................................................... 2
2 BACKGROUND................................................................................................... 3
2.1 COUNTRY INFORMATION - LAO PDR................................................................. 3 2.1.1 People and Ethnic Groups .....................................................................................................3 2.1.2 Politic.....................................................................................................................................4 2.1.3 Economy.................................................................................................................................5
2.2 ENERGY SITUATION IN LAO PDR ...................................................................... 5 2.2.1 Future Energy Sources for Northern Districts in Lao PDR...................................................7 2.2.2 Organisation of Power Sector................................................................................................8
2.3 STUDY AREA .................................................................................................... 8 2.4 MICRO HYDROPOWER....................................................................................... 9
2.4.1 Major Components of the Micro Hydropower Plants.......................................................... 10 2.4.2 Power ................................................................................................................................... 13 2.4.3 Advantages and Disadvantages ........................................................................................... 13 2.4.4 Environmental Aspects......................................................................................................... 14 2.4.5 Profit .................................................................................................................................... 14 2.4.6 Cost ...................................................................................................................................... 15 2.4.7 Social Benefits and Gender Aspects..................................................................................... 15
2.5 MICRO HYDROPOWER IN LAO PDR................................................................. 16 2.6 RENEWABLE ENERGY ALTERNATIVES ............................................................. 17
2.6.1 Solar Energy ........................................................................................................................ 17 2.6.2 Biomass and Biogas ............................................................................................................. 17 2.6.3 Wind ..................................................................................................................................... 18 2.6.4 Pico Plants ........................................................................................................................... 18 2.6.5 Hybrid Grid.......................................................................................................................... 18
3 THEORY ............................................................................................................ 19
3.1 HYDROLOGICAL CYCLE................................................................................... 19 3.2 POTENTIAL EVAPORATION .............................................................................. 20 3.3 HYDROLOGICAL MODELLING.......................................................................... 21
3.3.1 GR2M - Water Balance Model............................................................................................. 21 3.3.2 Model Description ............................................................................................................... 22
3.4 DIGITAL ELEVATION MODEL .......................................................................... 24 3.5 MAP PROJECTIONS AND TRANSFORMATIONS ................................................... 24 3.6 INTERPOLATION.............................................................................................. 28 3.7 FLOW PATH GENERATION ............................................................................... 29
3.7.1 Geographic Information System .......................................................................................... 29 3.7.2 Fill Sinks .............................................................................................................................. 29 3.7.3 Flow Direction ..................................................................................................................... 29 3.7.4 Flow Accumulation and Stream Definition.......................................................................... 30 3.7.5 Agree.................................................................................................................................... 31
3.8 CALIBRATION AND VALIDATION ..................................................................... 32

x
4 METHODOLOGY............................................................................................. 35
4.1 LAO PDR ....................................................................................................... 35 4.1.1 Field Visits ........................................................................................................................... 35 4.1.2 Interviews............................................................................................................................. 36 4.1.3 Archive data collection ........................................................................................................ 36
4.2 DATA PREPARATION ....................................................................................... 38 4.2.1 Transformation .................................................................................................................... 38 4.2.3 Interpolation ........................................................................................................................ 38
4.3 MODELLING ................................................................................................... 40 4.3.1 Calibration and Validation .................................................................................................. 40 4.3.2 Modelling New Sites............................................................................................................. 43
5 RESULT ............................................................................................................. 45
5.1 LAO PDR ....................................................................................................... 45 5.1.1 Condition of Studied Micro Hydropower Plants.................................................................. 45 5.1.2 Energy Situation in the Villages........................................................................................... 48
5.2 MODELLING ................................................................................................... 50 5.2.1 Calibration........................................................................................................................... 50 5.2.2 Validation............................................................................................................................. 52 5.2.3 Possible New Sites ............................................................................................................... 53
6 SOURCES OF ERRORS ................................................................................... 55
6.1 FIELD VISITS AND INTERVIEWS ....................................................................... 55 6.2 CALIBRATION AND VALIDATION ..................................................................... 55 6.3 MODELLING OF NEW SITES .............................................................................. 56
7 DISCUSSION AND CONCLUSION................................................................. 57
7.1 IMPORTANCE OF MICRO HYDROPOWER FOR RURAL ELECTRIFICATION IN LAO
PDR .................................................................................................................... 57 7.2 ANALYSE OF POSSIBLE NEW SITES.................................................................. 58
REFERENCES...................................................................................................... 61
APPENDIX............................................................................................................ 67
A. PRESENTATION OF THE PLANTS VISITED IN LAO PDR ....................................... 67 A.1 Nam Boun 1 ............................................................................................................................ 67 A.2 Nam Et.................................................................................................................................... 69 A.3 Nam Ka 1 and 2...................................................................................................................... 70 A.4 Nam Poun 1 ............................................................................................................................ 73 A.5 Nam San ................................................................................................................................. 73 A.6 Nam Sat .................................................................................................................................. 75 A.7 Nam Soy.................................................................................................................................. 76
B. REPRESENTATIVES AT THE PLANTS ................................................................... 78 C. QUESTIONNAIRES............................................................................................. 79
C.1 Questionnaire for Energy Agencies........................................................................................ 79 C.2 Questionnaire for Operators and Head of Villages ............................................................... 80 C.3 Questionnaire for Villagers.................................................................................................... 81
D. INTERVIEWS .................................................................................................... 82 D.1 Summary of Interview with Bouathep Mataykham, Head of Rural Electrification Division
Lao PDR ....................................................................................................................................... 82 E. HYDROGRAPHS ................................................................................................ 84
E.1 Calibration ............................................................................................................................. 84 E.2 Validation ............................................................................................................................... 85
F. SYNTAX ........................................................................................................... 87 F.1 Calibration ............................................................................................................................. 87

xi
F.1.1 Catchment_data ......................................................................................................................... 87 F.1.2 Catch_slope ............................................................................................................................... 88 F.1.3 Calibration ................................................................................................................................. 90 F.1.4 X1_X2_test ................................................................................................................................ 92
F.2 Modelling New Sites ............................................................................................................... 94 F.2.1 New_mhpp ................................................................................................................................ 94 F.2.2 Check_river ............................................................................................................................... 96 F.2.3 Catch_slope ............................................................................................................................... 97 F.2.4 Get_suitability ......................................................................................................................... 101 F.2.5 Get_river_flow......................................................................................................................... 102
F.3 Both ......................................................................................................................................103 F.3.1 Read......................................................................................................................................... 103 F.3.2 Lati........................................................................................................................................... 106 F.3.3 GR2M...................................................................................................................................... 106 F.3.4 Pot_eva .................................................................................................................................... 107

xii

1
1 Introduction Very few households in rural areas of Lao People’s Democratic Republic (Lao PDR) have access to electricity, which is an obstacle for the socio-economic development. In 2005 the number of households with access to electricity was 47% (Mataykham 2006). Electricity is needed in the homes for light and health care, in schools for studying and getting access to information and for giving companies the opportunity to develop. The mountainous landscape in Lao PDR makes it difficult and expensive to extend the national electricity grid to more remote areas. Therefore alternative energy sources are necessary. The dense network of rivers in the country makes micro hydropower a possible solution. Depending on the capacity of a micro hydropower plant it can provide one or several villages with energy for light and other electrical equipment to facilitate the living. Since 1970, 38 micro hydropower plants have been built in different provinces of Lao PDR. Due to lack of money and knowledge, some of the plants have been broken for a long time and others are working with reduced capacity (MIH 2004). To repair the broken plants and to build new ones the Lao government is dependent on international financial support (Mataykham 2006). In the future the government of Lao is planning to make micro hydropower the main source of electricity for some of the mountainous districts (Araki 2005). This minor field study consists of two parts. The first part of the work is conducted in Lao PDR in cooperation with the rural electrification company Sunlabob. Eight different micro hydropower plants in the northern part of the country were visited and interviews with representatives from the energy sector, plant operators and people in the villages were performed. Since micro hydropower is a potential energy source for rural electrification in the future, it is important to see how the existing plants work and what the response are from people in the villages that get access to the electricity. The second part of the work is performed after returning to Sweden and is related to the difficulty of finding locations for new micro hydropower plants. Before designing a new plant it is necessary to find a location where there is enough water flow and head to run the turbine (Fraenkel et al. 1991). This location also needs to be close to a village so that the cost for building the transmission lines would not be too high (Tait et al. 2004). Seasonal variations of river flow must be measured for at least one year at the site of interest, which is both time consuming and requires an installation of measuring equipment at the site (Fraenkel et al. 1991). In this thesis a Matlab algorithm is developed to find potential locations for new micro hydropower plants. In the algorithm a water balance model GR2M is used to simulate the water flow in smaller streams while the height differences along the streams are calculated from an elevation raster.

2
1.1 Objectives
• Make an inventory of the status of the existing micro hydropower plants in Lao PDR
• Investigate the need of the people in the villages and the effect electricity has
for rural development.
• Find new potential sites for micro hydropower plants in Lao PDR, where the water flow and head gives enough energy.

3
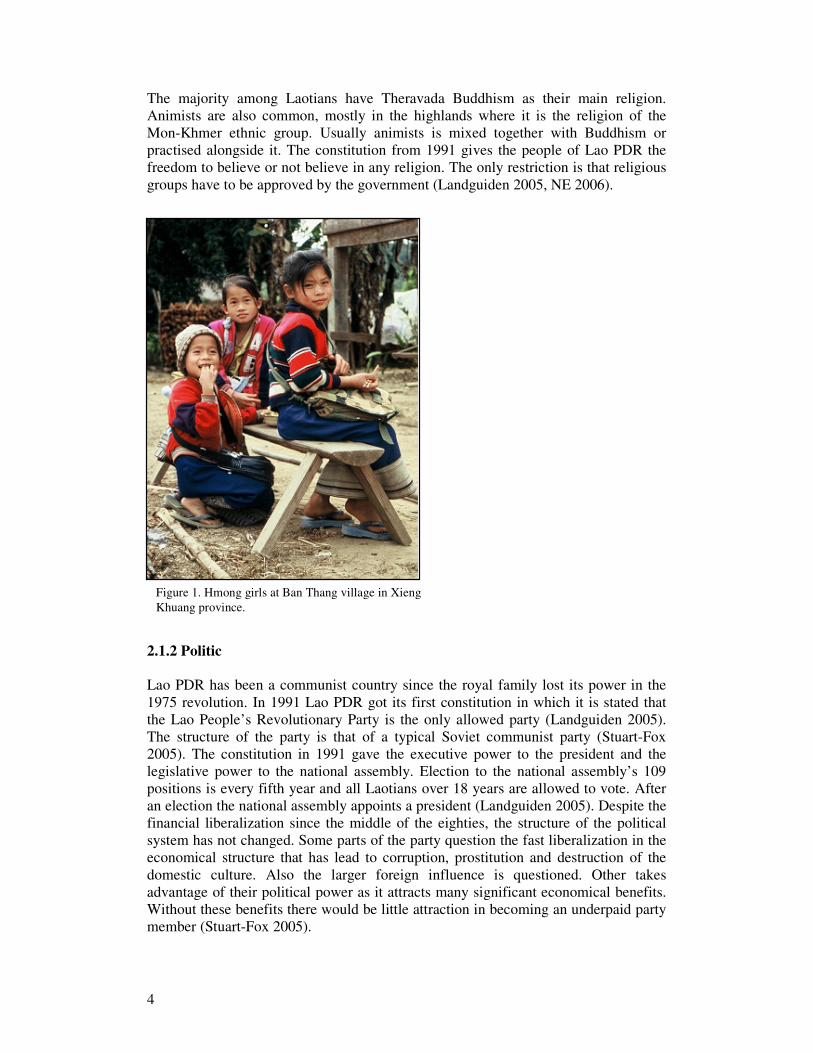
2 Background 2.1 Country information - Lao PDR Lao PDR is a country on the Southeast Asian peninsula with an estimated population of 5.9 million in 2005. The country capital and largest city is Vientiane with a population of 646.500 in 2005 (NE 2006). Lao PDR has a total area of 236.800 km2, which is about half the size of Sweden. It has a population density of around 25 people/km2, which implies that it is one of the least populated countries in Asia (Bounthong et al. 2003, Van Gansberghe 2005). More than half of the population lives along the Mekong River or its tributaries (NE 2006). Lao PDR has five neighbouring countries, China to the north, Vietnam to the east, Cambodia to the south and Thailand and Myanmar to the west. Mekong, the largest river in Lao PDR, forms most of the boundary to Myanmar and Thailand. To the east the Truong Son Mountain Range forms the boarder to Vietnam (Landguiden 2005). Except for the Mekong River lowland and three major plateaus Lao PDR mostly consists of mountainous areas. Half of the country is covered by forest, which is a decline by one third since the 1970s (Bounthong et al. 2003). There are no railroads and the road network is limited. Most of the roads are only accessible during the dry season (NE 2006). Lao PDR has a tropical monsoon climate with a rainy season between May and October that gives 1300 to 2300 mm of rain. In the winter months the temperature varies between 16 and 21 degrees. March and April are the hottest months and the temperature reaches sometimes as high as 40 degrees in the lowlands (NE 2006). 2.1.1 People and Ethnic Groups Lao PDR has a low urbanization rate and 80 percent of the total population lives in rural areas. Half of the population living in the rural areas is estimated to live in poverty (NE 2006, Tropp et al. 2001). The literacy rate in Lao PDR is 68%, higher for male (82%) than for women (55%) (Tropp et al. 2001). Lao PDR has a noticeably young population. In 2005 40% of the population was below 15 years of age and only 7% was older than 59. The life expectancy for male is 53 years and for women it is 56 years (NE 2006). Lao PDR has over 200 ethnic groups. These can be divided into four ethno-linguistic groups (Bounthong et al. 2003, Tropp et al. 2001, Stuart-Fox 2005, Van Gansberghe 2005). The largest group, which accounts for two thirds of the total population, is the Lao-Thai (Tai-Kadai). They live in the lowlands around the Mekong River valley and speak the official language Lao. The other three ethno-linguistic groups are Mon-Khmer (23.5%), Hmong-Mien (7.5%), and Tibeto-Burmese (2.7%) (Bounthong et al. 2003, Landguiden 2005, Tropp et al. 2001, Stuart-Fox 2005). These groups are considered as the minority groups in Lao PDR, and their total number is larger than for any other country in Southeast Asia (see figure 1) (Stuart-Fox 2005). Mon-Khmer lives in the middle highland regions and is considered as the original inhabitants of Lao PDR. The Hmong-Mien and Tibeto-Burmese groups live in extreme locations in the highland regions (NE 2006, Tropp et al. 2001, Van Gansberghe 2005).
4
The majority among Laotians have Theravada Buddhism as their main religion. Animists are also common, mostly in the highlands where it is the religion of the Mon-Khmer ethnic group. Usually animists is mixed together with Buddhism or practised alongside it. The constitution from 1991 gives the people of Lao PDR the freedom to believe or not believe in any religion. The only restriction is that religious groups have to be approved by the government (Landguiden 2005, NE 2006).
2.1.2 Politic Lao PDR has been a communist country since the royal family lost its power in the 1975 revolution. In 1991 Lao PDR got its first constitution in which it is stated that the Lao People’s Revolutionary Party is the only allowed party (Landguiden 2005). The structure of the party is that of a typical Soviet communist party (Stuart-Fox 2005). The constitution in 1991 gave the executive power to the president and the legislative power to the national assembly. Election to the national assembly’s 109 positions is every fifth year and all Laotians over 18 years are allowed to vote. After an election the national assembly appoints a president (Landguiden 2005). Despite the financial liberalization since the middle of the eighties, the structure of the political system has not changed. Some parts of the party question the fast liberalization in the economical structure that has lead to corruption, prostitution and destruction of the domestic culture. Also the larger foreign influence is questioned. Other takes advantage of their political power as it attracts many significant economical benefits. Without these benefits there would be little attraction in becoming an underpaid party member (Stuart-Fox 2005).
Figure 1. Hmong girls at Ban Thang village in Xieng Khuang province.

5
2.1.3 Economy As one of the poorest countries in the world Lao PDR has to depend deeply on foreign aid to finance its development. Lao PDR has a negative balance of trade and large holes in the government budget. The self-generated income usually only cover half of the expenses. In 2001 the foreign debt was 2.5 billion USD (Landguiden 2005, NE 2006). The agriculture employs most of the Laotian workforce and produces more than 50% of the domestic gross production. Rice, which is the base food in most households in Lao PDR, is grown on 82% of the total agriculture land (see figure 2). Approximately 30% of the rice production constitutes of upland rice from slash and burn shifting cultivation. Other important crops are corn, potatoes, and vegetables. Commercially important crops are tobacco, coffee, cotton and sugarcane. Lao PDR is rich in forest and mineral resources, but due to poor infrastructure and lack of capital these industries are largely undeveloped. Since 1988 until 2004 the industry generated GNP has increased from 11 to 28% of the total GNP. Most of the factories are located in the Vientiane area and 80% consist of rice and saw mills (NE 2006).
2.2 Energy Situation in Lao PDR The number of household with access to electricity has increased from 16% in 1995 (World Bank Group 2006) to 47 % in 2005 (Mataykham 2006). The Government of Lao PDR (GoL) aims to electrify 70 % of all households until 2010 and 90% until 2020 (Araki 2005, Mataykham 2006). Since extension of the national grid is very expensive the GoL believes that renewable energy sources are necessary for rural electrification (World Bank Group 2006). Still there is a part of the population in the most remote areas that will be almost impossible to electrify (Mataykham 2006).
Figure 2. Family building resting cottage on a rice paddy outside Ban Nam Chat in Huaphan province.

6
The far most important source of electricity in Lao PDR is hydropower, which account for 97% of the total electricity production (see table 1). There are no gas or oil resources in use for electricity production (World Bank Group 2006), but important resources of lignite (generating capacity 2000 MW) and coal (generating capacity 500 MW) have been discovered. In the future there will be an exploration for oil and gas (Tait et al. 2004). A small portion of the electricity comes from diesel and solar photovoltaic (PV) systems (Mataykham 2004). Table 1: The different sources of electricity in Lao PDR (Mataykham 2004).
Source for electricity production Installed capacity
(MW) Percentage of total electricity production
Major hydropower plants 624 96.29 Small and Micro hydropower plants 6.04 0.93 Diesel 17.29 2.68 PV solar 0.156 0.026 Total 648 100 Lao PDR is estimated to have a hydropower potential of 18 GW, but only a small portion is explored. The total production is 627 MW, of which 624 MW comes from nine major hydropower plants and 3 MW from small hydropower plants (MIH n.d.). The energy produced is divided by domestic use and export to Thailand. In 2003 the domestic use of energy was at most 250 MW and surplus energy was exported to Thailand (World Bank Group 2006). The Nam Theun 2 hydropower project that will be completed in 2008 will increase the export to Thailand with 1 GW and the domestic use with 73 MW (Nam Theun 2 Power Company Ltd. 2006). Lao PDR also imports electricity from Thailand, Vietnam and China to districts close to their border, since this is a cheaper alternative than to extend the national grid to each corner of the country (Tait et al. 2004). The 22kV transmission lines cost between 10 000 USD and 15 000 USD per km, depending on if there is an access road or not (Mataykham 2006).

7
2.2.1 Future Energy Sources for Northern Districts in Lao PDR The plan for future electrification is to extend the national grid to several districts in northern Lao PDR, but diesel, small hydropower and imported electricity will still be a part of the energy system in 2020 (see figure 3)(Araki 2005).
Outside study area
Diesel
EdL Grid
Imported Power
No Major Electrification System
Small Hydropower
Major Electrification System 2004
Electrification Plan 2010
Electrification Plan 2020
�
�
�
Figure 3. The master plan for future electrification of northern Lao PDR until the year 2020 (Araki 2005, modified by authors).

8
2.2.2 Organisation of Power Sector The Department of Electricity (DoE) under the Ministry of Industry and Handicraft (MIH) has the main responsibility of the power sector in Lao PDR (Tait et al. 2004). Their duties are policy formulation, strategic planning, legislation, data collection and to seek funding. DoE is divided in three units; Power Development Division, Electricity Management Division and Rural Electrification Division (RED). The RED is responsible for the off grid electrification with thermal energy, small/micro hydropower and solar photovoltaic. Under the MIH is also a state owned corporation Electricity du Lao (EdL), which owns and operates the generation of energy, transmission and distribution. Lao National Committee for Energy (LNCE) is an agency under the GoL, responsible for marketing of energy and for reporting to the government of possible investments in power projects. 2.3 Study Area Modelling the water flow for all districts in northern Lao PDR would be very time consuming and it is therefore necessary to limit the work to a few districts. The future electrification plan for Lao PDR shows that some of the districts in northern Lao PDR will still have no access to electricity in 2020. There are also some districts that will be electrified by small hydropower. The field study has been carried out in three
Figure 4. A map of the four provinces Houaphanh, Louang Phrabang, Phongsali and Xieng Khouang that the focus will be on in this report.

9
different provinces, Houaphanh, Phongsali and Xieng Khouang. These three provinces together with Louang Phrabang, which is in between these provinces (see figure 4), will be the frame for our study area. The focus will be put on eight districts where the electrification is either planned with small hydropower or where no source of electrification is defined (see figure 5). In Lao PDR, 72 of totally 142 districts are considered poor. Of the poor districts, 42 are in priority according to the national poverty eradication program. Except for Phongsali district, which is not considered a poor district, the other districts chosen are in priority (Tait et al. 2004).
2.4 Micro Hydropower The basic idea with micro hydropower is to convert the energy of falling water from some height to electricity. The micro hydropower plants visited in Lao PDR were of the run of the river type, which is illustrated in figure 6. A weir is blocking the river and some of the water is led through an intake to the canal. The canal brings the water to the forebay from where the penstock starts, which the water falls through to the powerhouse. A turbine in the powerhouse converts the potential energy of the water to mechanical energy that drives the generator, which in turn produces electricity. Afterwards the water is returned to the river. A micro hydropower can produce
Figure 5. A map of the eight districts that this report will put its focus on.

10
mechanical energy for agricultural and industrial use, or produce electricity if the turbine is coupled to a generator (ITDG n.d.). There are different definitions of the capacity range of a micro hydropower plant in different countries and the upper limit can vary between 100 kW and a few MW (Fraenkel et al. 1991, ITDG n.d.). In this study, micro hydropower plants capacity is determined to be less than 300 kW, which is the maximum size suitable for run of the river systems that are not integrated to a grid (Fraenkel et al. 1991).
2.4.1 Major Components of the Micro Hydropower Plants Weir
A weir is a barrier built in the river to regulate the water and make sure that there is always a constant water flow through the intake. The pool created by the weir has a tendency to fill up with silt and debris and needs to be cleaned regularly. Weirs that are built naturally with mud and stones are often transported away by floods. Concrete weirs are more expensive but last longer (Fraenkel et al. 1991). Intake
The intake is placed nearby the weir and should make sure that an optimal amount of water enters the canal and goes to the turbine (CanRen 2004). It is important to get as little sediment as possible through the intake. When constructing the intake it is also important to think of flooding conditions and not under dimensioning the building so that flooding destroys it. Under dimensioning will also lead to much more main-tenance work in the rainy season (Fraenkel et al. 1991).
Figure 6. A schematic picture of a micro hydropower plant. The turbine, generator and controller are all located in the powerhouse. (ITDG 2005, modified by authors).

11
Canal
The purpose of the canal is to transport water from the intake in the river to the forbay. The canal stays almost at a constant elevation so that the plant does not lose any of its head (CanRen 2004). If the canal leans too much it is also a greater risk for erosion. If the water flows too slowly on the other hand there is a risk that the canal is blocked by silt particles or that vegetation starts to grow. One of the main challenges when constructing the canal is therefore to make the water flow at a well adjusted speed. The material for building the canal is either completely natural, sand and clay or it can be strengthened with a concrete or cement lining. The concrete canal is more stable and the water can flow faster without risk of erosion, but the construction is more expensive. The roughness of the canal material is also important because the water loses some energy by the friction against rougher material which brings a head loss since the canal has to be steeper (Fraenkel et al. 1991). Occasionally, small watercourses are crossing the way of the canal. To prevent the water from damaging the canal, an aqueduct can be built to lead the canal across the watercourses. Spillway
Spillways are necessary for emptying the canal and the forebay of water, if part of the plant has broken or needs to be cleaned. They are also useful when excess water needs to be routed back to the river (Fraenkel et al. 1991). Settling Basin
Even if the construction of the intake is carefully designed, it is still likely that some silt particles and debris enters the canal. Therefore a settling basin is very useful. The settling basin makes the water in the canal slow down and the silt has time to sink to the bottom before the water passes on towards the forebay (Fraenkel et al. 1991). Forebay
The forebay is a kind of settling basin placed where the canal ends and the water enters the penstock. The major roll of the forebay is to slow down the water to let the silt sink to the bottom. Turbulence must be avoided in the forebay so that the silt is not rising up from the bottom again. The forebay must be easy to clean, otherwise it fills up very quickly (Fraenkel et al. 1991). Penstock
A closed pipe called a penstock transports the water under pressure from the forebay to the turbine. Due to friction in the penstock some head is always lost on the way to the turbine. The friction depends on the diameter of the penstock. A wider pipe gives less friction than a narrower pipe, but a wider pipe requires more material, which makes it more expensive. As the penstock is one of the most expensive components of the micro plant a head loss of 5-33% can be acceptable. The two most widely used materials for penstocks are mild steel and unplasticized polyvinyl chloride (Fraenkel et al. 1991, CanRen 2004).
Turbine
A turbine converts the kinetic energy of falling water to mechanical energy of a rotating shaft. The water pushes the blades of the turbines, which makes the axes of the turbine rotate. There are different kinds of turbines that work best at different speed, flow and head. The two main categories of turbines are impulse turbines and reaction turbines (see figure 7)(Fraenkel et al. 1991). The blades of an impulse turbine

12
rotate in the air by the force of water, which is directed at them through a nozzle. The nozzle can be adjusted to fit the amount of water coming so that the turbine can be used in seasons with different water flows. A reaction turbine is totally immersed in water. It starts to rotate when it reacts on the pressure change caused by the water passing the blades of the turbine. It works best where the water flow is constant and with low and medium head. The most common turbine in micro hydropower systems is an impulse turbine (Solarguide n.d.). Generator The generator is connected to the rotating shaft of the turbine and converts the mechanical energy into electric energy. This is done according to the principle of induction. Electricity is created when a magnetic field and an electric wire is moving in relation to each other. The shaft of the generator has a magnet that is enclosed in an electric coil. The turbine makes the magnet rotate inside the electric coil and a voltage is induced in the wire (Benson 1996, Fraenkel et al. 1991).
Controller
The controller is designed to regulate the energy output of a micro hydropower system. The speed of the turbine varies depending on the load that is applied. This speed variation will affect the frequency and voltage output from the generator and could damage it by over speeding under low or no load condition or by overloading it under high demand periods. The controller automatically compensates for this variation by varying a resistive load (dump load), in order to keep a constant load for the generator and turbine (Fraenkel et al. 1991). Transmission lines
To transport the electricity from the powerhouse where the turbine and the generator are to the consumers of the electricity, transmission lines are needed. Transmission lines are often quite expensive to build so it is an advantage if the site for the micro hydropower plant is situated near the place where the electricity is going to be used (Tait et al. 2004).
(a) (b)
Figure 7. The two main categories of turbines. (a) impulse turbine (b) reaction turbine (Solarguide n.d.).

13
2.4.2 Power Power, with unit Watt, is the amount of energy per time a system can produce. The potential a river has for producing power depends on the water flow rate and the head for where the water can be made to fall. The water flow rate is the amount of water passing a point at a certain time and is often given in litres or cubic metres per second (ITDG n.d.). The Potential Power (PP) in a river is:
ρQhgPP = , (1) where Q is the water flow rate (l/s or m3/s), h is the head in metres (m), g is the gravitational constant (9.81 m/s2) and ρ is the density of water (1000 kg/m3) (Fraenkel et al. 1991). If either the water flow rate or the head increases the power increases. An advantage with a higher head is that the plant can use less water and more compact equipment, but for environmental reasons it is good with a significant amount of water in the river so that water is left even when part of the river has been diverted to the power plant (Cunningham and Atkinson 1998). The actual power that a micro hydropower plant produces can be calculated in the same way as the potential power above, but one must take into account some energy losses in the turbine, penstock and generator (ITDG n.d.). Normally a small hydro turbine has an efficiency of 70% but some good turbines can have an efficiency of 80% or even better (Fraenkel et al. 1991). There are also energy losses in the penstock, 5-10% and in the generator, 10-25%. Totally the efficiency of a micro hydropower system is around 50% for a small system up to 10 kW and 50-70% for a larger system (Bonhomme et al. 2004). 2.4.3 Advantages and Disadvantages Since water flows continuously in rivers the energy from a micro hydropower plant can be used whenever there is a demand. The amount of energy can be predicted if the water flow and head are known. Another advantage with micro hydropower is that with a sufficient head the hydro scheme can be quite compact and a small amount of water is enough to produce the electricity needed for light and other equipment (Fraenkel et al. 1991). Once the plant is installed the costs for running the plant are very low and if the plant is well maintained it can work for many decades (Klunne 2006). Micro hydropower plants have a simple construction compared to other energy producing systems and can be operated locally in rural communities (AEPC 2001). Finding a good site for installation of a new plant is one of the main obstacles for energy production by micro hydropower. The site where the micro hydropower is installed must have enough water flow rate and head to produce sufficient amount of energy and the site must also be close to the location where the energy is going to be utilized. The climatic condition decides how the water flow will vary in the river. In Lao PDR the monsoon climate brings great seasonality to the water flow, which makes it very difficult to predict if a site will fill all criterions or not. (Fraenkel et al. 1991).

14
2.4.4 Environmental Aspects Of the worlds total energy supply 80% is constituted by fossil fuel (Vattenfall, a 2006). Burning of fossil fuel will not last forever and it is damaging the environment and affecting the climate through the emission of greenhouse-gases. Economic growth and population growth will increase the demand for energy in developing countries and it is necessary to look for renewable energy alternatives. Micro hydropower is a good alternative and since dam building is not needed, as for larger plants, their impact on the environment is very small (Wilkins 2002). Water is the only force running the plant and no fuel like diesel is needed as input. There are though some negative effects worth considering. Some fish species is moving far along the rivers, both upstream and downstream. The micro hydropower plant must have a passage by the weir so there is no hinder for the fish’s migration (Fraenkel et al. 1991). An investigation of fishes biodiversity in Lao PDR shows that a big problem with micro hydropower plants is that they do not have any passages for fishes, which causes the fish stock to decrease (Fidlóczky and Pető 2004). In many rivers the water is used for irrigation of the fields nearby the plant (see figure 8). Before building a plant it is therefore important to make sure that there is enough water available for irrigation also when part of the river is diverted to the plant. Another effect of building the plant can be that the soil gets more sensitive for erosion (Fraenkel et al. 1991). 2.4.5 Profit There are many working micro hydropower plants in different countries in Southeast Asia. Especially in China there are many thousands of operating plants. Many plants are financially profitable, and others are invaluable for the positive effect they have on the living standard for poor people in rural areas. One of the problems with micro hydropower is that there are no clear roles on how to make the plants profitable in a financial way. In very poor and remote areas it is not even possible to get some money in return for the micro hydropower plants. Case studies in Peru, Nepal, Sri Lanka, Zimbabwe and Mozambique show that micro hydropower installations providing mechanical power for milling can be financially profitable, but the major demand from the people in these countries is to use the plants for electric light. When micro hydropower installations are used for light and other household utilities they are totally dependent on donors. Even if the plants were used for milling or planned to be used for other income generating activities, they are not always profitable. There are many difficulties for enterprises in small rural villages and the people in the villages have not always enough knowledge for starting up small enterprises. In many cases the villages have no capital to run a community enterprise and there is no market for it. If on the other hand one individual in the village runs the enterprise it can bring tensions into the society since the individual is getting wealthy by means of the local water (Khennas and Barnett 2000).
Figure 8. Water outlet from canal used for irrigation at Nam Boun 1.

15
2.4.6 Cost The installation cost for a micro hydropower plant used for shaft power, like milling, is about 965 USD per kW and sometimes as low as 200 USD per kW (Khennas and Barnett 2000, Fraenkel et al. 1991) For electricity generation when a generator and transmission lines are necessary, the installation cost is higher. (Khennas and Barnett 2000). Most systems cost between 1000 USD and 4000 USD, but sometimes as much as 10000 USD per kW (Fraenkel et al. 1991). The cost differences between two systems depend on site characteristics, access possibilities to the sites, cost of labour and the size of the plants. The installation and maintenance cost has decreased recently for micro hydropower due to an improved technology bringing load controllers, low cost turbines and plastic materials for penstocks. Compared to photovoltaic, micro hydropower is a good economic choice. But if lighting is the only requirement in remote locations, then photovoltaic may be the main alternative as they give better lighting than kerosene lamps and they can be installed just to meet the demand. Diesel is often less expensive than micro hydropower depending on the prize of the fuel and the distance for transporting, but if the environmental effect counts it is not a good alternative. Unfortunately, the large installation cost for both micro hydropower and solar home system makes it an impossible alternative for poor people without the help of donors (Khennas and Barnett 2000). 2.4.7 Social Benefits and Gender Aspects An investigation of gender and micro hydropower by Khennas and Barnett (2000) show that men and woman have a different view of the benefits from the plant. For men, the biggest advantages were leisure, quality of life and a better education for the children whereas the woman saw the advantages in reduced workload, expenditures and an improved health care. (Khennas and Barnett 2000). Women in developing countries spend much time on domestic duties that are necessary for the family to survive. Often they have to walk long distances to collect wood and water. Indoor cooking is done over open fire in bad light, which are both tiring for their eyes, time-consuming and unhealthy due to all the smoke. The more time women spend cooking and collecting wood and water, the less time they have for children care, education, and income generating activities. The household tasks could be more easily done if they had access to electricity. An electrical water pump could reduce the time and ache of walking far with heavy buckets. Electricity used for light in the household makes cooking and other indoor activities proceed much faster and the light would also give women a chance to study or carry out income generating activities after sunset (see figure 9). Outdoors streetlights are a base for a more secure environment (Wilkins 2002). Information and contacts are gained very quickly through information technologies. If children in developing countries should have a chance to find information and get them selves heard it is very important that they can have access to modern technologies in school. Electricity from a micro hydro plant makes it possible to use overhead projectors, computers, TV, video and radio.

16
2.5 Micro Hydropower in Lao PDR Since 1970, 38 micro hydropower plants have been installed with a capacity of 5-250 kW. In December 2005 only 14 of these micro hydropower plants were still working and some of them were in poor condition (MIH 2005). The reason why many of the plants broke down is that they were constructed with second hand equipment from China that did not fit with the site. Since the equipment was not optimized for the site this also implies that the site capacities are not fully used (Mataykham 2006). With lack of money and insufficient knowledge the maintenance work cannot be carried out in a good way and the plants are damaged. Another reason of failure is underestimates of floods (Tait et al. 2004). The majority of the plants are situated in the northern part of Lao PDR whereas only three plants are situated in the southern part. Surveys have been made on 34 new potential locations for small/micro hydropower plants (capacity: 50-2000 kW), 13 of which are considered more suitable. Reconstruction of broken plants is cheaper than installing new ones, but in some districts new installations are required to meet the target of electrifying 90% of the population until 2020. When the reconstruction and installations of plants will be conducted is difficult to tell since the projects are dependent on donors (Mataykham 2006). Small hydropower plants are less cost effective than large plants since they do not give any direct income from power export. The government is nevertheless positive towards the use of micro hydropower since it gains many advantages for the community, like education, health and security. This is good in theory but since money is needed in many sectors, such as road building, agriculture and forestry, the budget for rural electrification is limited. In Lao PDR, the installation cost for a micro hydropower plant varies from 4000 USD per kW to more than 10 000 USD per kW.
Figure 9. Women weaving at Ban Thang village. In the evening the fluorescent lamp at the top of the picture is useful.

17
According to the Rural Electrification Division a good price is 4000-7000 USD per kW, an acceptable price is 7000-10 000 USD per kW and above 10 000 USD is expensive (Mataykham 2006). Before installing a new micro hydropower plant a socio-economic survey is performed. The government can not give any subsides to poor district for electricity, but in general there are money to save for the villagers when they get access to electricity. Households without electricity needs to buy gasoline, diesel, candles, battery for the torch when they go hunting, battery for the radio etc, which costs around 3 USD per month. Most of the households with electricity pay only 1-1.5 USD per month (Mataykham 2006).
2.6 Renewable Energy Alternatives 2.6.1 Solar Energy The interest in solar energy has grown in Lao PDR as the cost for solar PV system decreases and people are more aware of the many benefits they can gain by electricity. Since the solar cells are dependent on high solar insolation the systems work better in the south and central part of Lao PDR than in the north part where the sky is often covered by clouds (Tait et al. 2004). Solar PV systems have been installed in the country with the help of international donors since 1980. In the beginning the systems were mostly used for telecom stations and for keeping vaccines cold in refrigerators (STEA 2002). Nowadays, solar home systems that provide rural households with electricity for light are the most widespread (Sunlabob, a 2006). In 1999 MIH started to install solar home systems in the southern part of Lao PDR with the financial support from the World Bank and the global environment facility in the Southern Provinces Rural Electrification program (SPRE). The project is running in five provinces but the MIH is hoping to expand this project to all provinces in Lao PDR (IEA 2005). There are also commercial companies that provide solar home systems to remote areas. The rural electrification system company, Sunlabob, has installed over 5600 solar home systems in 450 different villages since their start in 2001 (Sunlabob, a 2006). 2.6.2 Biomass and Biogas Biomass is organic material that can be used as fuel directly, or converted to methane gas, ethanol or bio diesel. Biogas is produced when organic matter decays without oxygen. Biomass and biogas are renewable energy sources since organic matter can be regrown. Biomass does not add any carbon to the atmosphere since the plants take up the same amount of carbon dioxide when they grow as is released when the biomass is burned (Vattenfall, b 2006). If, however the resources are not well maintained it can lead to deforestation as in the case when using too much wood fuel (Wilkins 2002). Of the total energy consumption in Lao PDR, 90% is constituted by wood fuel. Wood fuel is used for cooking in 92% of all households in Lao PDR. Besides wood, agricultural wastes are also used as fuel. Since 1983, 14 biogas plants have been installed in the country, each with a capacity of 12-16 m3 which gives about

18
1-10 kW. There is a large potential to generate biogas and biomass from sawmills and pig farms in Lao PDR (STEA 2002). 2.6.3 Wind Since the wind resources are poor in most of the country there are few instances of wind power. There are though some locations found in central and south central Lao PDR with good to excellent wind resources (STEA 2002). 2.6.4 Pico Plants Many villages without access to electricity use small Pico plants (100-300 W) for light. The pico plants needs to be repaired very often and the lifetime is only about three years (Tait et al. 2004). The transmission lines from the small units rarely have any isolation, which is very dangerous if someone would touch the cable. In the rainy season the pico plants has to be removed from their sites, otherwise they will be carried away by a flood (Mataykham 2006). The reason why the pico plants are so popular, despite all the shortcomings, is the low price. One unit costs less than 30 USD (Tait et al. 2004). 2.6.5 Hybrid Grid As the name implies a hybrid grid is when two or more types of electricity generating systems are working together to feed into a village grid. This type of installation gives a higher level of supply reliability through the different characters of the generating systems. The reliability of the village grid is increased even more if the grid is also integrated with a storage system. The downside to this set up is the low load factor in insulated grids, which makes the set up unattractive for private investors, and the high installation cost which makes it nearly impossible for the local villages to raise the capital needed (Sunlabob, b 2006). Sunlabob (b 2006) proposes a set up where public investors pay for the infrastructures and private investors pay for the movable assets, which then are operated by a private energy provider. This private energy provider trains the village energy committee to operate the village grid, and it also sells the energy into the village grid, which then the village energy committee sells to the households. A pilot project that was started in the fall of 2006 is trying this concept at Nam Ka 1 and 2 micro hydropower plant (Sunlabob, b 2006).

19
3 Theory 3.1 Hydrological cycle Precipitation is the main component of the hydrological cycle (Brusaert 2005). When precipitation falls on the ground, the soil surface moistens and part of the water infiltrates into the ground. If it continues to rain for a longer time the soil will be saturated and the water will start to flow on the surface as surface runoff. If the rainfall is very intense and the rate of the rainfall is higher than the infiltration rate, runoff occurs even if the soil is not saturated. The surface runoff follows the topography and will form small streams that eventually enter bigger streams, lakes or oceans. The infiltrated water either flows under earth near the surface until it comes out in a spring or a stream, or the water percolates through the water table where it becomes part of the groundwater flow. The stream flow is constituted both by the surface runoff and by subsurface water that enters at the stream banks. Evaporation brings the water back to the atmosphere either through direct evaporation or through transpiration if the vegetation emits the water. Since it is difficult to separate evaporation and transpiration they are often combined to evapotranspiration (ET). For evapotranspiration to occur the relative humidity must be less than 100%, which means that the humidity in the atmosphere must be lower than the humidity from the evaporating surface. This process is dependent on the wind speed, which is needed to transport away the humid air above the surface. Evaporation also requires energy and the rate increases with higher solar radiation (Brusaert 2005). A local hydrological cycle is depicted in figure 10.
Figure 10. The figure shows the local hydrological cycle in a watershed (RPDC 2005). .

20
3.2 Potential Evaporation Many different models have been developed for estimating Potential Evaporation (PE). Oudina et al. (2005) compared 27 different PE models over 308 catchments for their stream flow simulation efficiency. They concluded that less complex models, which only were dependent on extraterrestrial radiation and temperature, were as efficient as more complex models such as the Penman model, when it came to rainfall-runoff modelling. This is an advantage when working in developing countries such as Lao PDR where the quality of climate data might not be optimal and it might not even be complete. Another advantage is that less computer power is needed for less complex models. The PE model that Oudina et al. recommended was the McGuinness-Bordne model, which in their study did not lose any efficiency in comparison to the Penman-Monteith model. The McGuinness-Bordne model is defined in the following way
68
5+= ae TR
PEλρ
(2)
where Re is the extraterrestrial radiation, λ is the latent heat of vaporization, ρ is the water density, and Ta is the daily mean air temperature. The extraterrestrial radiation is evaluated in the Handbook of Hydrology by Shuttleworth (1993) as follows
( ))sin()cos()cos()sin()sin(392,15 ssre ddd
Rωϕϕω
λρ+⋅= (3)
where λ and ρ is added because of their almost constant value, dr is the inverse
relative distance Earth - Sun, sω is the sunset hour angle, ϕ is the latitude, and d is
the solar declination. dr is expressed as
+= Jd r 365
2cos033,01
π (4)
where J is the Julian day. sω is given by
( ))tan()tan(arccos ds ϕω −= (5)
where ϕ and d are respectively
Latitude⋅=180
πϕ (6)
−= 39,1
365
2sin409,0 Jd
π (7)

21
The daily mean air temperature is calculated from the daily maximum and minimum air temperature in the following way
2maxmin TT
Ta
+= . (8)
3.3 Hydrological Modelling The use of a water balance model is a very practical example for water resource planning and flood prediction, but it is important to know that hydrological models never describe the reality perfectly. It is always necessary with a careful evaluation of the model afterwards. One of the biggest challenges with the hydrological models is that very little is known about what is happening under the soil and the bedrock. The measurements of the subsurface flow give only information on a small area close to the measuring probe. Before choosing which model to use it is wise to make a list on what input data the different models require and what the expected outputs are from the model. The complexity needed by the model depends on what the results will be used for (Beven 2001). In the case of this thesis the model needs to be able to describe the monthly average water flow in the rivers, which is possible to do with a simpler model than if it should be used for flood prediction. 3.3.1 GR2M - Water Balance Model To simulate seasonal variations in river discharge it is suitable to use a water balance model with a monthly time step. The GR2M model is a water balance model developed by Makhlouf and Michel in 1994 (Niel et al. 2003) and improved to its recent version by Mouelhi in 2003 (Cemagref 2006). The model has been used on over 400 catchments in varying climates from semi-arid to tropical humid, in France and Western Africa (Mouelhi et al. 2006). It can be used on catchment areas from one km2 - a few thousand km2 (Niel et al. 2003). Precipitation and potential evapo-transpiration (PET) are the only input data required and the model has only two free parameters, X1 and X2, which makes the calibration easy (Mouelhi et al. 2006). The model does not consider any individual rainfall events, but only the monthly average of precipitation and PET. Depending on the monthly amount of precipitation and PET in the catchment areas, the model calculates how much water that is infiltrated in the ground and how much of the water that goes to surface flow. The part of the infiltrated water that the soil cannot hold either percolates or becomes subsurface flow. The percolated water, subsurface flow and the surface flow that is not lost in the routing process or exchanged outside the catchment area adds together to become the water flow.

22
3.3.2 Model Description In figure 11 a visualisation of the GR2M model is depicted. The ground has capacity to store a certain amount of water X1. At the start of the modelling the water level in X1 is S. When it rains, part of the rainfall P increases the water level in the ground to the level S1.
1
11
1X
S
XSS
+
+=
ϕ (9)
where,
=
1
tanhX
Pϕ
The excess of the rain that does not infiltrate to the ground becomes surface flow P1.
11 SSPP −+= (10) Due to the potential evapotranspiration PET, the water level in the ground decreases from S1 to S2.
( )
−+
−=
1
1
12
11
1
X
S
SS
ψ
ψ (11)
where,
=
1
tanhX
PETψ
From the S2 level part of the water P2 will percolate through the ground, which gives the resulting ground storage water level S that is used as a start value for the next coming month.
3/13
1
2
2
1
+
=
X
S
SS (12)
SSP −= 22 (13)
The total amount of water that either becomes surface flow or percolates through the ground is P3.
213 PPP += (14)
When P3 is routed towards the rivers it passes the routing store with level R and adds up to become R1.

23
31 PRR += (15)
R1 is affected by the groundwater exchange outside the catchment area, which is represented by the parameter X2
122 RXR = (16)
The capacity of the routing store is fixed at 60 mm and when it is emptied it gives the flow Q.
602
22
+=
R
RQ (17)
QRR −= 2 is passed on to the next month (Cemagref 2006, Mouelhi et al. 2006).
Figure 11. A visualisation of the GR2M model (Mouelhi et al. 2006)

24
3.4 Digital Elevation Model When using a Digital Elevation Model (DEM) to generate hydrological fixtures there are some restrictions to be aware of. Independent of what kind of DEM that is used for the analysis, they are all under the assumption that the flow paths of the water will be totally controlled by the topography of the catchment area. This is not a good assumption if ground water flow paths exist, since these can deviate considerably from the flow paths that are generated from the DEM. However for catchments that have relative shallow soils with underlying impermeable bedrock it could be considered as a good assumption. Also the quality of the DEM is of highest significance. Even under ideal hydrological circumstances the DEM must have a resolution so that the hill slopes shapes can be defined. Analyses have showed that a resolution poorer than 100 m is not sufficient for hydrological modelling (Beven 2001). 3.5 Map Projections and Transformations To position a location on Earth a coordinate system is used. The coordinates can either be spherical to describe a point on the bend surface of the globe, or they can be projected to fit a 2-dimensional map. Map projections can be done in many different ways. All positions in a coordinate system must also be given in relation to a geodetic datum. Well-defined measured points on the ground build up the geodetic datum and new points are adjusted to the measured points. The geodetic datum used in different countries and at different working places varies depending on if the system is needed on local or global scale and depending on how accurate the system has to be. If working with different datasets that are linked to certain positions on the earth, it is very important that the positions in the datasets are given in the same system so that they fit in relation to each other. If they are not given in the same system, the datasets need to be transformed to the same coordinate system and geodetic datum (Arnberg et al. 2003).
Representations of the Earth
Since the Earth is not uniform it is represented by an ellipsoid for measuring locations horizontally and a geoid that represents the mean sea level for measuring the vertical heights. There are different ellipsoid representations that vary in size depending on their values on the major and minor axes (see figure 12). The geoid would be identical to an ellipsoid if it was not for gravity, which makes it differ from an ellipsoid with up to +/- 100 m at some locations (Arnberg et al. 2003, Knippers 2006).
Figure 12. The major and the minor axis of the ellipsoid representation of the Earth (ESRI 2004, modified by authors).

25
Coordinate system and map Projections
Each point on the ellipsoid has geographic coordinates. They describe the position in north south direction (latitude θ ) and east west direction (longitude λ ). If the position of interest is at point P the latitude is the angle between the normal to the ellipsoid surface at P and the equatorial plane (see figure 13). The Longitude is the angle between the normal to the surface at P and the Greenwich meridian plane. Latitude and longitude together with height (h) over the ellipsoid define a position (Arnberg et al. 2003).
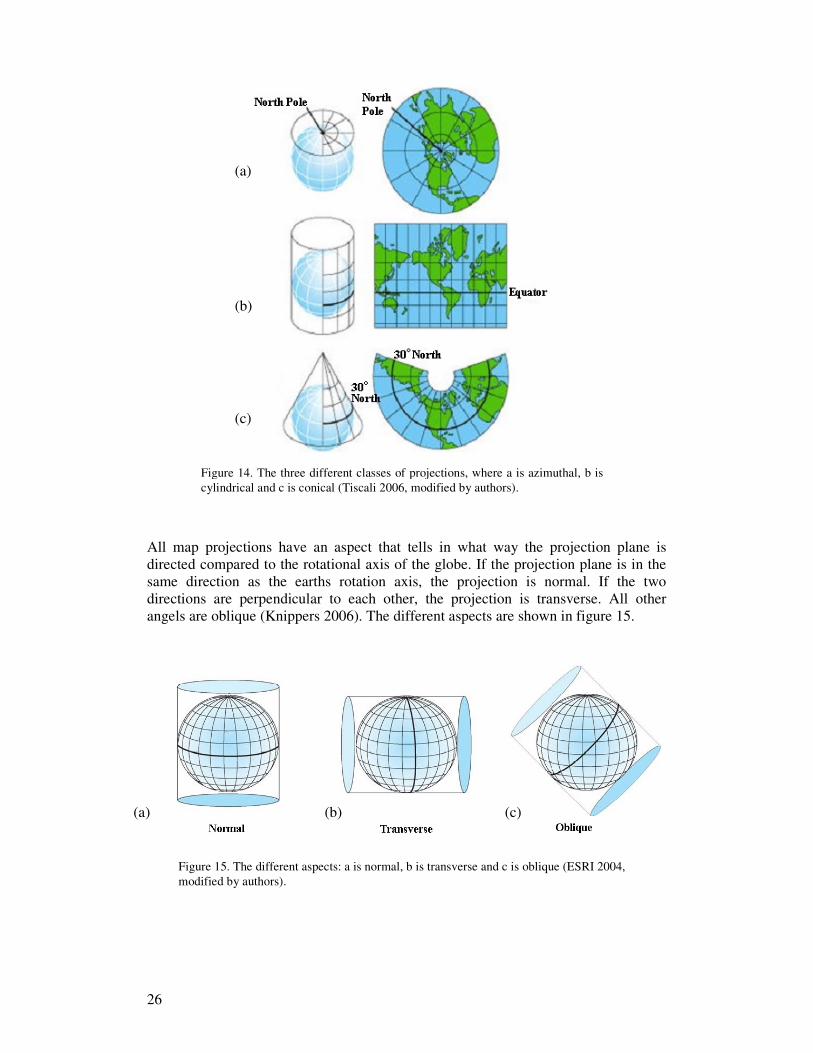
To make a map of the Earth, the geographic coordinates of the ellipsoid has to be projected by mathematical equations to coordinates of a plane. Since a two-dimensional map never gives a perfect description of the three-dimensional Earth information of either area or shape gets lost in the projection. There are different ways of projecting the coordinates depending on what the map will be used for and where on the Earth the map should have the best fit. There are three different classes of projections, azimuthal, cylindrical and conical, which are described by figure 14 (Arnberg et al. 2003).
Figure 13. The latitude and longitude of point P is 60 degrees East and 55 degrees North (ESRI 2004, modified by authors).
26
All map projections have an aspect that tells in what way the projection plane is directed compared to the rotational axis of the globe. If the projection plane is in the same direction as the earths rotation axis, the projection is normal. If the two directions are perpendicular to each other, the projection is transverse. All other angels are oblique (Knippers 2006). The different aspects are shown in figure 15.
Figure 14. The three different classes of projections, where a is azimuthal, b is cylindrical and c is conical (Tiscali 2006, modified by authors).
(c)
(b)
(a)
Figure 15. The different aspects: a is normal, b is transverse and c is oblique (ESRI 2004, modified by authors).
(c) (a) (b)

27
Geodetic datum When the ellipsoids that represent Earth are fit to give the best representation of a region of interest they are called a geodetic datum. Some well-known points on Earth, where latitude and longitude are measured for the specific ellipsoid, fix the geodetic datum (Knippers 2006). There are many different geodetic datums in use all over the world, regional, national and global. Most countries have a national geodetic datum, which works well within the country borders, but many times it is necessary to use a geodetic datum that can be used for the whole world. The World Geodetic System from 1984 (WGS 84) is widely used and is the base for the Global Positioning System GPS (Arnberg et al. 2003). Transformations from the geodetic datum WGS 84 to Indian 1954 Since there are so many different coordinate systems and geodetic datums it is often necessary to transform one system to agree with another system. The digital elevation model used in this report has the geodetic datum Indian 1954, while the layers with climate stations and administrational data have the geodetic datum WGS 84. Since it is more time consuming to transform a DEM than a vector layer, all the vector layers were transformed from the geodetic datum WGS 84 to Indian 1954. The map projection of the layers used in this study is Universal Transverse Mercator (UTM), which is a secant, transverse, cylindrical projection. Transformation method
The method used for transforming the geodetic datum WGS 84 to Indian 1954 is a three-parameter method also called a geocentric method that models the differences in datum between two coordinate systems. The method starts by first converting the geographic coordinates (θ , λ , h) to geocentric coordinates (X, Y, Z). Secondly the transformation is done, and finally the resulting values are converted back to geographic coordinates. During the transformation one of the systems has its centre in the geocentric coordinate system at 0, 0, 0, while the other system has its centre displaced with some distance X∆ , Y∆ , Z∆ as is shown in figure 16 (ESRI 2004). The new locations are then determined by the following formula
originalNewZ
Y
X
Z
Y
X
Z
Y
X
+
∆
∆
∆
=
(18)
Figure 16. Three parameter transformation (ESRI 2004, modified by authors).

28
3.6 Interpolation The GR2M model needs two climatic variables for each grid cell, temperature and precipitaion (three with latitude). These have been interpolated for each grid cell by using the deterministic Inverse Distance Weighted (IDW) method, which is a suitable method for data sets with sparse and irregular distributed data (NOAA 2006). There are many other interpolation methods such as Thiessen polygon, Kriging, Spline, but when the time step is large enough i.e. a month, they all give comparable result (Smith 1993). The IDW method is developed under the assumption that closer points to the interpolated grid cell should influence its value more than more distant points, this can be considered with the inverse weight factor (19) where d is the distance from known point, and p is the distance weight exponent. The distance weight exponent can adjust the influence from considering all points as equal, p = 0, to only considering the closest point, ∞=p . Usually the value of p is in between 1 and 3 (Arnberg et al. 2003). The interpolation formula with IDW is generally written as
(20)
where z is the interpolated z-value, z is the z-value of known point i, n is the number of points to be included in search, and i is the number of the known value point to be taken into account. The reason why the weights are summed in the denominator is to normalize the equation. n can be set to all known points or be determined by either using a fixed radius in which all points should be included or including just a fixed number of the closest points (Arnberg et al. 2003). In our calculations n is set to the six closes points and p to two.
∑
∑
=
==
n
ip
i
n
i
ip
i
d
zd
z
1
1
1
1
ˆ
pddw
1)( =

29
3.7 Flow Path Generation 3.7.1 Geographic Information System A Geographic Information System (GIS) is a system for creating, integrating, storing, analysing, managing, and displaying geographic data and associated attributes. It is a combination of a computer cartography system with a database management system that has tools for analysing spatial information, creating interactive queries, and to edit data (Pidwirny 2006). For generation of the flow paths different hydrological GIS tools have been used, which are described in the following sections. 3.7.2 Fill Sinks
An elevation cell is considered a sink when all surrounding cells have higher elevation, or no flow direction can be assigned to the cell or when two cells flows into each other creating a loop. There are natural sinks in DEMs with cell size larger than 10 metre but they are rare (Tarboton et al. 1991). Most sinks are errors in the DEM that could be caused by the data resolution or by rounding errors when representing the elevation with integer values only. The problem with sinks is that water have nowhere to flow i.e. the stream is cut and the sink cells catchment area will not be represented downstream. Fill Sinks iterates through the DEM and fills all sinks within the pre specified depth range Z to the level of its lowest neighbour (see figure 17). By filling sinks new ones can be created beside the old ones. These are filled in a new iteration and this is continued until all sinks are removed (ESRI 2005). In areas where the elevation is very homogeneous, e.g. plateaus, there might be some problem with large areas with the same elevation after the use of Fill Sink (Dodson 1993).
3.7.3 Flow Direction The flow direction is defined in this function as the direction of the steepest descent to a neighbouring cell. It is calculated in the following way: Change in Z-value/distance * 100 (21) The distance is considered from the cell centres. If the flow direction cannot be decided from the first adjacent cells then the search area is increased until a flow direction can be determined. The flow direction is given eight different values depending on its direction; see figure 18 and 19.
Figure 17. A cross section of a sink with depth Z before and after the use of function Fill Sink.

30
3.7.4 Flow Accumulation and Stream Definition The flow accumulation tool calculates the number of upstream cells that flow into each considered cell (ESRI 2005). In figure 20a a flow direction raster is depicted with its resulting flow accumulation in figure 20b. Then the stream definition is either set to a certain number of accumulated cells or a specific size of the accumulated catchment area (ESRI 2005). Figure 20c depicts a stream (blue cells) where the stream definition has been set to 20 cells.
Figure 20. A schematic picture of a flow direction raster (a), a flow accumulation raster (b) and a stream definition raster (c) where the blue cells is the river. The stream definition is here set to 20 accumulated cells.
(a) (b) (c)
Figure 18. The assigned value for each flow direction.
Figure 19. An illustrative picture of the result where (a) is the DEM, (b) is the flow direction and (c) is the flow value.
(a) (b) (c)

31
3.7.5 Agree Agree uses a river line vector to adjust a DEM in a way so that the river generated by the DEM is similar to the river line vector. The tool starts by raising or dropping the DEM cell that is related to the river line vector a certain amount. Then a buffer is assigned to the river line vector. A straight elevation line is then adjusted between the elevation just outside of the buffer and the elevation of the river cell. At last the river cells height is adjusted (see figure 21)(Hellweger 1997).
The Agree tool has been used only for areas where the elevation is very homogeneous. This is done so that the generated river will follow the real river as good as possible, preventing it from splitting up in several rivers on a plateau. An example is the Nam Boun 2 power plant catchment area in which a plateau exists (see figure 22).
Figure 21. An illustrative picture of how the Agree tool works (Hellweger 1997).

32
3.8 Calibration and Validation Calibration and validation is done with the help of objective functions that examine various responses of different hydrological processes, such as general fit, peak flow, low flow and volume error, with different sets of calibration parameters (Madsen and Kristensen 2002). A popular method for calibration and validation of water balance models is the Nash and Sutcliffe non-dimensional efficiency criterion (R2). It is defined as
∑∑
−
−−= 2
22
)(
)(1
obsobs
mobs
QQR (22)
where Qobs and Qm are the observed and modelled monthly water flow, and obsQ is the
observed mean monthly water flow (Nash and Sutcliffe 1970). The value of R2 ranges from 1 to - ∞ where 1 is a perfect fit (Krause et al. 2005). From eq (22) it is evident that the efficiency criterion considers the difference of the observed and modelled water flow in square, which will result in that larger water flows error will have a higher influence than error from smaller water flows. The result of this is that the model will do the best fit for the larger water flows and not consider the smaller water flows as much (Beven 2001, Krause et al. 2005). In Lao PDR where the monsoon climate is prominent this will result in a miss-fit because of the large differences in water flow levels between the rainy season (May - Sept) and dry season (Oct - April). A way of handling this problem is to take the logarithmic values of the water flows. By doing so the high peaks during the rainy season are flattened out while the lower levels will not be changed significantly. This will give the calibration a more homogeneous sensitivity to high and low flow (Beven 2001, Krause et al. 2005).
Figure 22. Two pictures of the Nam Boun plateau. The solid light blue line is a part of the real river that has been used as the river line vector for the Agree tool, the dark blue line is the DEM generate river. The Agree tool is used in the right picture but not in the left.

33
Another disadvantage with the efficiency criterion is that it only minimizes the error without considering the annual flow volumes (Arheimer 2006). To include this in the calibration the relative volume error (VE) is also studied (Arheimer and Fogelberg 2004). It is given by
∑∑ −
=obs
obsm
Q
QQVE
)( (23)
These two can be combined together to form the standard criterion (RV)
||2 VEwRRV −= (24) where the best results are obtained with a w value of 0.1. By combining these the resulting RV value is almost as good as R
2 but without the flow volume error (Arheimer 2006).

34
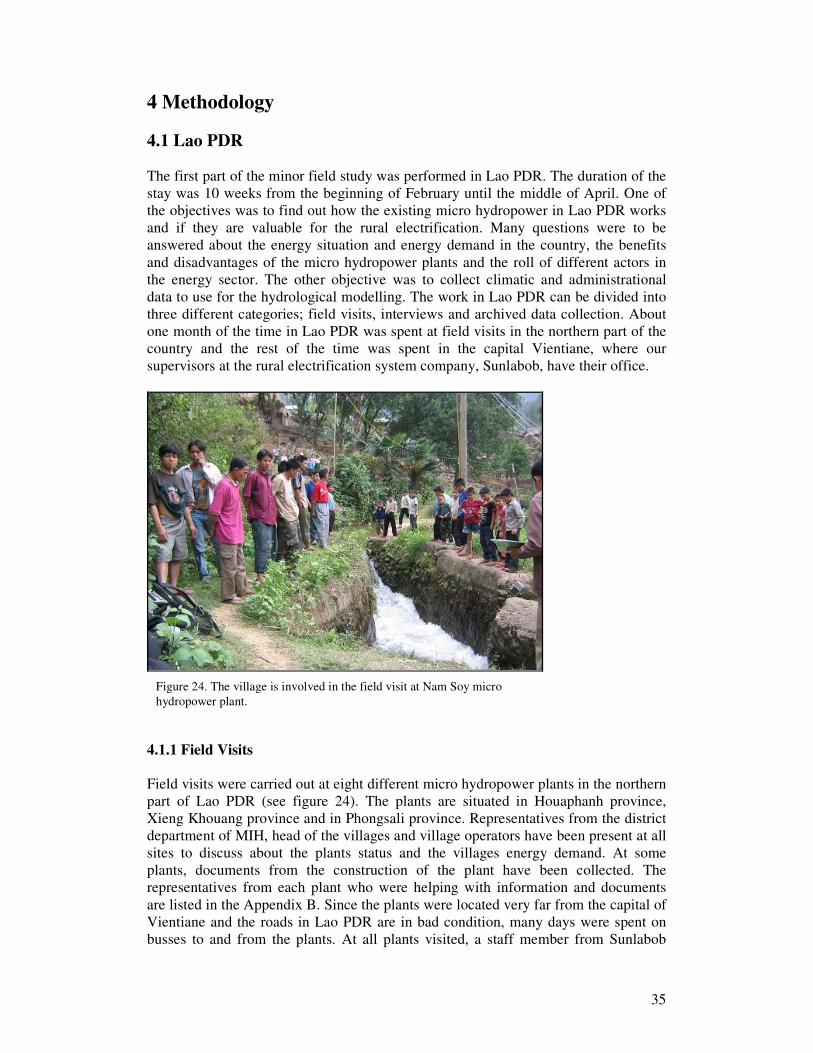
35
4 Methodology 4.1 Lao PDR The first part of the minor field study was performed in Lao PDR. The duration of the stay was 10 weeks from the beginning of February until the middle of April. One of the objectives was to find out how the existing micro hydropower in Lao PDR works and if they are valuable for the rural electrification. Many questions were to be answered about the energy situation and energy demand in the country, the benefits and disadvantages of the micro hydropower plants and the roll of different actors in the energy sector. The other objective was to collect climatic and administrational data to use for the hydrological modelling. The work in Lao PDR can be divided into three different categories; field visits, interviews and archived data collection. About one month of the time in Lao PDR was spent at field visits in the northern part of the country and the rest of the time was spent in the capital Vientiane, where our supervisors at the rural electrification system company, Sunlabob, have their office.
4.1.1 Field Visits Field visits were carried out at eight different micro hydropower plants in the northern part of Lao PDR (see figure 24). The plants are situated in Houaphanh province, Xieng Khouang province and in Phongsali province. Representatives from the district department of MIH, head of the villages and village operators have been present at all sites to discuss about the plants status and the villages energy demand. At some plants, documents from the construction of the plant have been collected. The representatives from each plant who were helping with information and documents are listed in the Appendix B. Since the plants were located very far from the capital of Vientiane and the roads in Lao PDR are in bad condition, many days were spent on busses to and from the plants. At all plants visited, a staff member from Sunlabob
Figure 24. The village is involved in the field visit at Nam Soy micro hydropower plant.
36
accompanied as a guide. Mr Tongduean accompanied us to the plants in Xieng Khouang province and Houaphanh province and Mr Souvanthong to Phongsali province. This was necessary since very few people in rural parts of Lao PDR speak any English at all. When minority groups inhabited villages at the plants, even our guide had problem to understand their language. Besides translations the guide also helped with practical arrangements for meetings with representatives from the local MIH. One representative from the local MIH always had to accompany us to explain to the villagers who we were and that we were allowed to walk around the plant and ask questions to the operators. 4.1.2 Interviews During the field visits, interviews with members from 16 households were performed to get an understanding of the energy situation and the demand of the individuals. The distribution of interviews was ten in Phongsali province, five in Houaphanh province and one in XiengKhoung province. Of the representatives from the households that were interviewed, eleven were women, three were men and in two households both a woman and a man participated. The overrepresentation of women was deliberate since all plant operators, head of the villages and representatives from MIH are men. Most of the households got their living from their gardening and farming and some of them also had a small shop, a restaurent or a weaving chair. Other occupations represented were a windows manufacturer, a nurse, a bike mechanic and an owner of a guesthouse. An interview with the head of the RED of MIH in Lao PDR, Mr Bouathep Mataykham, was also performed, which aimed to get knowledge about the rural electrification work that is done in the country, future plans for rural electrification and the governments attitude towards micro hydropower. The interview technique used was semi-structured interviews, which means that the questions are prepared in advance but there are no answering alternatives. It is possible to ask the questions in any order and to ask follow up questions (Holme 1991). The questionnaires used for the interviews can be found in Appendix C. 4.1.3 Archive data collection To find potential new location for micro hydropower plants some archive data is needed to be collected. Most of the data was gathered in Vientiane during the field study but some climate data from countries outside Lao PDR was obtained from the internet. The climatic data and administrational data needed for the modelling work were: For calibration, validation and modelling:
• Elevation data, provided by National Agricultural and Forestry Research Institute (NAFRI) in Vientiane, Lao PDR.
• Temperature and precipitation for Lao PDR, provided by the Department of Hydrology and Meteorology in Vientiane, Lao PDR.
• Temperature and precipitation other countries, obtained from TuTiempo.net internet site.
• Map of river systems provided by Geomatics, Vientiane, Lao PDR.

37
For calibration and validation:
• One set of nine hydrographs to calibrate and validate the model against was obtained from I. Araki (2005).
For modelling:
• Map of villages provided by Geomatics. • Map of roads provided by Geomatics. • District maps provided by Geomatics.
Climate Data
Precipitation and potential evapotranspiration are the climatic variables needed as input for the GR2M model. The temperature is used for calculating the potential evaporation. Since there are very few weather stations in the northern part of Lao PDR, data is also collected from stations in Vietnam, Thailand and China (figure 25). Totally there are data from 21 stations used, eleven of which from Lao PDR, five from Vietnam, three from Thailand and two from China. From the stations in Lao PDR there are data series of monthly mean values of temperature and precipitation for the period 1996-2005. For the stations of neighbouring countries the monthly mean values are calculated from daily values for the period 2003-2005 and for the calibration year (May 1999 - April 2000). Some months have days with no measured value but these have been approximated from the rest of the month.
Figure 25. The weather stations used for the modelling.

38
DEM
The DEM raster with cell size 50 times 50 metre was obtained from NAFRI. The raster covers four provinces in northern Lao PDR, Xieng Khouang, Luang Phrabang, Huaphanh and Phongsali. 4.2 Data Preparation 4.2.1 Transformation Transformation of Indian 1954 into WGS 84 was done using the geocentric method in ArcGIS version 9.1. The parameters needed for the transformation were obtained from the European Petroleum Survey Group (EPSG). To transform WGS 84 into Indian 1954 the same parameters are used but with inversed signs. The representation of earth by the different geographic coordinate systems and the transformation parameters are as follows. Indian 1954
Source Ellipsoid: Everest 1830 (1937 Adjustment) Semi-major axis (a) = 6377276.345 metre Semi-minor axis (b) = 6356075.413 metre WGS 84
Source Ellipsoid: WGS 84 Semi-major axis (a) = 6378137.000 metre Semi-minor axis (b) = 6356752.314 metre Transformation parameters ∆ X: 217 metre ∆ Y: 823 metre ∆ Z: 299 metre 4.2.3 Interpolation The interpolation was very time consuming as 48 different parameters had to be interpolated, temperature and precipitation for 12 months, both for calibration and for the model. For this reason the interpolation was done over the entire study area instead of interpolating each district that was going to be examined by itself. The interpolation was done in such a way that the obtained raster would match the DEM. This gave each elevation cell its individual temperature and precipitation value for each month. By doing this, each interpolation would interpolate a little over 59 million values and would take some two and a half hour with the computer capacity (Intel Pentium 4 CPU 2.60GHz and 1GB RAM) that were used. For the temperature interpolation each weather station value had to be recalculated so that it would represent the temperature at sea level. This was done so that the DEM could be used to adjust the temperature with the approximately constant adiabatic lapse rate of 0,6 degree Celsius per 100 metre (Holton 2004 and Danielson et al. 2003), to represent the temperature at the elevation of each cell. Figure 26 shows a flowchart of how the data preparation was done.

39
Transformation of station coordinates from WGS 84 to Indian 1954
Transformation of Stream layer from WGS 84 to Indian 1954
Cut out regions covering the districts in the study area
Interpolation of station data over four northern provinces covering the study districts
Elevation
Calculation of sea level temperature at each station
Vector layer of all streams in Lao PDR
Eleven stations in Lao PDR, monthly mean ten + one years
Eleven stations in Vietnam, Thailand and China, Monthly mean three + one years
Eleven stations in Lao PDR, monthly mean ten + one years
Ten stations in Vietnam, Thailand and China, Monthly mean three + one years
Streams Temperatur Precipitation
Choice of Water Balance Model GR2M
Transformation of station coordinates from WGS 84 to Indian 1954
Interpolation of station data over four northern provinces covering the study districts
Result: Temperature layers for each month covering all the districts in the study area
Adjustment of temperature to the height in each cell, 0.6 degrees per 100 metre
Cut out regions covering the districts in the study area
Adjustment of plateau regions with stream layer, using Agree tool
DEM 50*50 metre of four northern provinces covering the study area
Calculation of the number of upstream cells that flow into each cell of the DEM, using Flow Accumulation tool
Calculation of flow direction for each cell using Flow Direction tool
Fill sinks in the DEM, using Fill Sink tool
Definition of all the stream cells, using stream definition tool
Result: Elevation, Flow direction, Stream Definition
Result: Precipitation layers for each month covering all the districts in the study area
Flow Chart: Data preparations for modelling in Study Area
Figure 26. A flowchart on how the data preparation was preformed. The three blue boxes are the resulting layers that where use for calibration and modelling new sites.
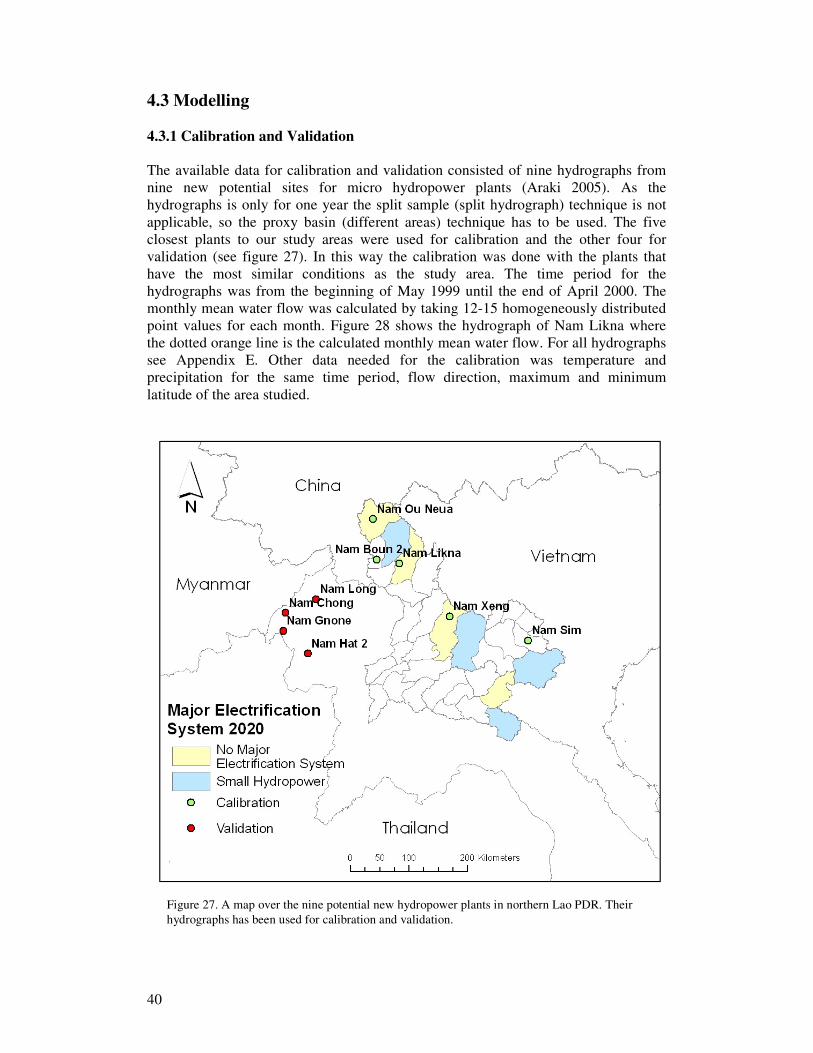
40
4.3 Modelling 4.3.1 Calibration and Validation The available data for calibration and validation consisted of nine hydrographs from nine new potential sites for micro hydropower plants (Araki 2005). As the hydrographs is only for one year the split sample (split hydrograph) technique is not applicable, so the proxy basin (different areas) technique has to be used. The five closest plants to our study areas were used for calibration and the other four for validation (see figure 27). In this way the calibration was done with the plants that have the most similar conditions as the study area. The time period for the hydrographs was from the beginning of May 1999 until the end of April 2000. The monthly mean water flow was calculated by taking 12-15 homogeneously distributed point values for each month. Figure 28 shows the hydrograph of Nam Likna where the dotted orange line is the calculated monthly mean water flow. For all hydrographs see Appendix E. Other data needed for the calibration was temperature and precipitation for the same time period, flow direction, maximum and minimum latitude of the area studied.
Figure 27. A map over the nine potential new hydropower plants in northern Lao PDR. Their hydrographs has been used for calibration and validation.

41
To be able to use these hydrographs, the location of the plants had to be determined. The position of the weir was depicted on a small map in I. Araki’s (2005) and could easily be found on a Lao PDR map in a GIS environment. The position of the weir decided the raster cell that should be considered as the cell from which the catchment areas should be determined. The function “catchment_data” (see Appendix F) used these starting cells to collect and calculate the catchment areas monthly mean temperature and precipitation. It also generated the catchment areas average latitude and total area. Figure 29 depicts a series of steps that shows how the “catchment_data” function works. With the four validation plants the catchment data had to be estimated because unfortunately no DEM was obtained for their areas. The GR2M model could then use this estimated data to calculate the theoretical water flow. The calculation was made over two years. This was done because a warm up year was needed so that proper starting values were obtained for the second year. For the calibration, the two free parameters, X1 and X2, were changed until the best fit was obtained. This was done with the help of function “x1_x2_test” (see Appendix F), which tested 100 X1 values against 100 X2 values. A wide array of X1 and X2 values was first used to determine in what area they should be in, so that it could be narrowed down until a sufficiently good result was obtained. The best fit was determined by the standard criterion in which the ln version of the efficiency criterion was used.
Figure 28. Hydrograph of potential hydropower plant Nam Likna. Blue line is the measured water flow, orange is the calculated mean monthly water flow and red is the peak flow for the designed plants turbine.

42
4. When the function finds a cell where none of the surrounding cells are directed towards it, the cell value of temperature, prec-ipitation, and latitude is saved. The function also counts the cell as the first cell in the catchment area of the weir (d).
6. In this way the function will find and count all the cells that belong to the catchment area of the weir and the sum of temperature, precipitation and latitude for all the cells in the catchment area will be known (e)
7. The number of cells is multiplied by the cell area to find the catchment area of the weir and temperature, precipitation and latitude values are divided by the number of cells to obtain the catchments mean value.
1. From the staring position in the cell where the weir is situated, the function Catch_slope investigates the surrounding 8 cells, starting with the top left cell (a and b)
5. The function then goes back to the cell were it was before it came to the end cell, to see if any other of the surrounding cells are directed towards it. If the function finds a new cell it moves there. Otherwise the temperature, precipitation and latitude of the cell is added to the saved values and one more cell is added to the catchment area.
3. From the new position the surrounding cells are considered again and if the flow direction of one cell is directed towards the middle cell the function moves to that cell and then starts the search again.
2. If the Flow direction of one cell is directed towards the cell of the weir, the function moves to that position (c)
Temperature, precipitation and latitude are saved for the end cell.
(a)
(b)
(c)
(d)
(e)
8. The mean value of temperature is then used together with the mean value of latitude for calculating the mean potential evaporation of the catchment area. The mean potential evapotranspiration and the mean precipitation are then used as input data for the GR2M model.
Figure 29. A series of pictures on how the “catch_slope” function works.

43
4.3.2 Modelling New Sites The task of this model is to find suitable locations for new micro hydropower plants. It searches through a matrix and finds locations where the energy outcome is equal or larger than a predefined level. This level is determined at the start of the investigation as well as the efficiency of the micro hydropower plant. Other input data at the start of the investigation is the canal length, a certain number of months with the lowest flow, the number of rows and columns in the matrixes, the minimum and maximum latitude in degrees and finally the x-minimum and y-maximum in metres. The efficiency is used together with equation 1 to calculate the potential energy outcome of a micro hydropower plant at a certain position. The canal length is the number of cells that will be stepped downstream before determining the head. The number of months with the lowest flow is used to calculate the design flow. When building micro hydropower plants the design flow is determined so that the plants will work for 80% of the time. By taking the mean of the four months with the lowest flow as the design flow, the micro hydropower plant should get sufficient amount of water to be operable 80% of the time. The number of rows and columns are needed to generate matrices. Minimum and maximum latitude is used to generate a matrix with the latitude of every cell and the x-minimum and y-maximum is used to determine the position in the geodetic datum Indian 1954. In this report the canal length is set to four cells, which gives a length of in between 200 metre to 283 metres depending on the direction of the downstream slope. The number of months with the lowest flow is set to four. The number of rows and columns, the minimum and maximum latitude and x-minimum and y-maximum are determined depending on which areas that are studied. This model is similar to the calibration model. Many functions are the same and some have just some small adjustments. The main program “New_mhpp” conducts three major tasks (see figure 30). Firstly, it generates all the data matrices needed. Secondly, it marks all rivers that have inflow from outside the matrix. This is done because in these rivers the water flow will not be accurate since their entire catchment area is not included. Finally, the model investigates all remaining river cells for their suitability of having micro hydropower plants. The catchment data assembling is done in the same way as in the calibration model. The only difference is that in this model every river cell is a potentially new location for a micro hydropower plant. Consequently, the potential energy outcome of every river cells is calculated and if it is equal or larger than the predefined level the location and its energy, river flow, head and catchment area is saved. By doing this model in Matlab there are some limitations on how large catchment areas that can be investigated at a time. As is described in figure 30 the model uses recursion to find cells that are included in the catchment area. Matlab has a recursion limit that prevents programs from crashing. This limit can be changed depending on the capacitive of the computer on which the model is run. The available computer power gave the capacity of putting the recursion limit to 1700. This limit made it possible to investigate matrices with a dimension of around 1000 times 1000 cells depending on how the river system was structured.
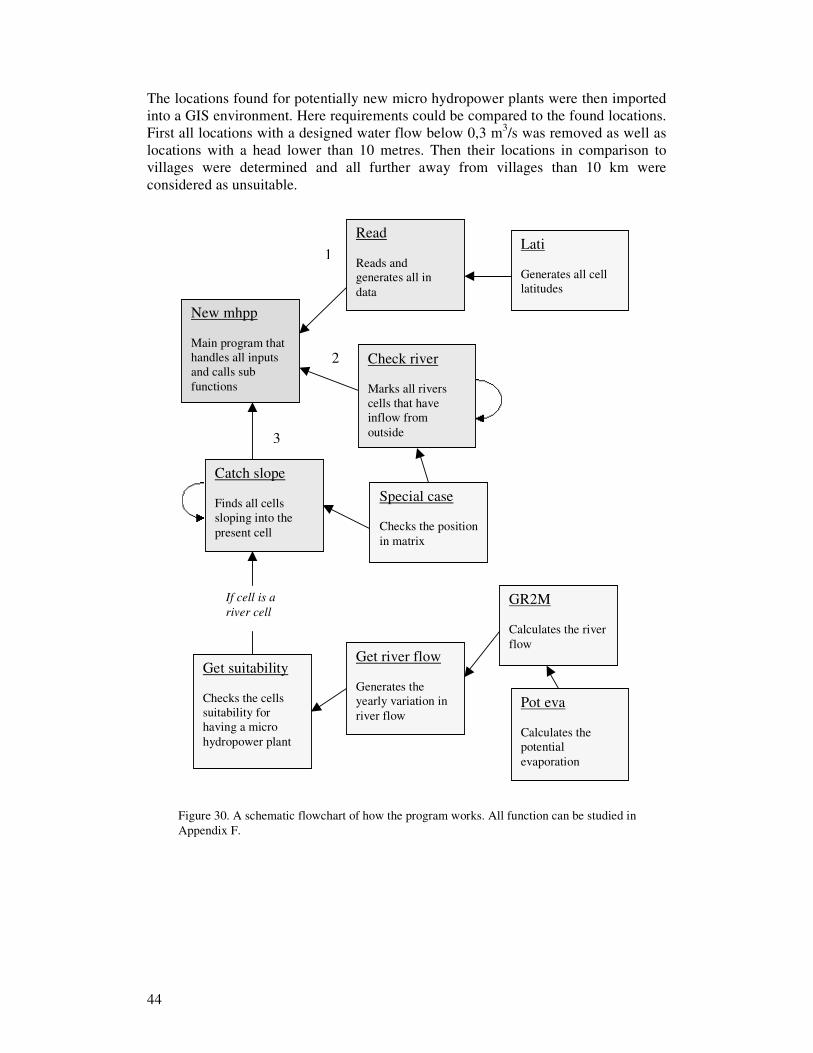
44
The locations found for potentially new micro hydropower plants were then imported into a GIS environment. Here requirements could be compared to the found locations. First all locations with a designed water flow below 0,3 m3/s was removed as well as locations with a head lower than 10 metres. Then their locations in comparison to villages were determined and all further away from villages than 10 km were considered as unsuitable.
Figure 30. A schematic flowchart of how the program works. All function can be studied in Appendix F.
New mhpp Main program that handles all inputs and calls sub functions
Lati Generates all cell latitudes
Catch slope Finds all cells sloping into the present cell
Special case Checks the position in matrix
If cell is a
river cell
Get suitability Checks the cells suitability for having a micro hydropower plant
Get river flow Generates the yearly variation in river flow
GR2M Calculates the river flow
Pot eva Calculates the potential evaporation
3
2
Read Reads and generates all in data
1
Check river Marks all rivers cells that have inflow from outside

45
5 Result 5.1 Lao PDR The results presented below are based on field studies at eight different plants, construction documents and interviews with representatives from MIH, village leaders, plant operators and members of 16 households. A more thorough presentation of each plant visited and the energy use in the villages is found in Appendix A. 5.1.1 Condition of Studied Micro Hydropower Plants General information of the studied micro hydropower plant is shown in table 2.
Table 2. The capacity and condition of the plants in the field study.
Plant Name Province Capacity (kW) Condition at present Nam Soy Houaphanh < 12 Working Nam Ka 1 Xieng Khouang 12 Broken Nam Ka 2
Xieng Khouang
55 of 81
Working but 26kW generator is broken
Nam Poun Houaphanh 60 Broken Nam Et Houaphanh 75 Working Nam San Houaphanh 2*55 Working Nam Boun 1 Phongsali 2*55 Working Nam Sat Houaphanh 2*125 Working
Water flow
The seasonal variation in the water flow is one of the main problems at the plants. The plants are designed to work well for the average water flow, 80 – 90% of the time of a year. This means that in the dry season there is not enough water to run the plant with full capacity. In northern part of Lao PDR, April-May seems to be the period with least water in the rivers. Some of the plants are designed with two units, which is very convenient in the dry season when one of the units can be used all the time (see figure 31). For plants with one unit, the plant can run only randomly when there is enough water in the reservoir. If the dry season coincides with irrigation of fields upstream, the capacity of the plant will be affected. Even in the start of the rainy season (end of
May and June) some sites have problem with water being used for irrigation upstream. Too much water is another problem in the rainy season. Floods are common and have damaged the equipment at many sites.
Figure 31. The Nam San plant can use only one of two units between March and July. Originally the plant hade one penstock from the forebay that was split into two at the powerhouse, but after the reconstruction in 1995 it got two penstocks.

46
Electro-Mechanical equipment When the energy demand is higher than what the plant can generate, the coil in the generator gets to warm and finally burns off. This has happened at many sites were the load is too high. With the financial situation not being the best for some of the plants, this could be enough to stop the plant from generating electricity. The control panel and the automatic speed governor are complex equipment and are often second hand from China. They need regular maintenance and if the operators do not have sufficient education for this work they will eventually break, which is the case at many plants (see figure 32). Stones and branches in the turbine is also a problem at some sites. The problem comes from the layout and condition of the plant. The trash rack that should stop stones and branches from entering the penstock was at some sites either broken, in bad condition or nonexistent.
Weir and Reservoir
Every micro hydropower plant that has been included in our study has a reservoir at the weir. This helps to control the water flow through the intake and makes it possible to store water for the dry season. Many of the sites wanted to raise their weir to be able to store more water in the dry season (see figure 33). At Nam Sat site in Houaphanh province they even wanted to build a second reservoir further upstream. Most sites have had their weir damaged to some degree by floods. If a raise of the weirs should be considered, the con-struction must be made in a way that the weir can resist floods. At the moment most weirs are made of concrete but some are made of stones and mud, usually the ones that the villagers have made by them selves. The dams often need to be cleaned from mud. At some plants this is done regularly but still the dam volume is affected a large part of the year (see figure 34).
Figure 32. The condition off the electromechanical equipment varies between the plants. In the left picture the relative new turbine and generator at Nam Sat plant are working well compare to the second hand control panel at Nam Soy plant that have been broken for a long time.
Figure 33. The weir at Nam Ka plant. The villagers wants to raise the weir, but they are worried that the upstream fields will be flooded.

47
Canal
The canals are usually relative long, around 1000 metres. If the terrain is relatively flat, the canals are mostly made of earth (see figure 35). In the steeper terrain the canals are made out of concrete. During the rainy season a lot of mud will enter the canal with water from the adjacent hillsides. Usually the operators and villagers will help out to clean the canal when it is needed. None of the plants visited during the field trip had a good way of cleaning the canal automatically. There were no settling tanks that could gather most of the stones and sediment. Another problem was erosion alongside the canal on the downside slope, which eventually could make them break. When there was heavy rain the canal could be filled up with water from the upside
slope, perpendicular to the canal, and it would then continue to go over the downside edge and take a lot of soil with it. Closed canals are very difficult or even impossible to clean. Forebay
Sediment that gets caught in the forebay is a problem at some sites. During non-operational periods the water in the forebay is almost still. This gives the particles in the water time to fall down to the bottom of the forebay. Over time the forebay will be filled up with sediment and if it is not cleaned the sediment will enter the penstock and damage the turbine. Most of the forebays had a water outlet, but they were not always so efficient in cleaning the forebays from sediments.
Figure 34. The reservoir at Nam Boun 1 plant is full with mud, which affects the capacity of the plant. The mud is removed from the reservoir every second or third year.
Figure 35. The 1.3 km long earth canal at Nam Soy plant.

48
Maintenance
Most of the maintenance problems arrive from lack of money and lack of spare parts to the equipment. Plants with two units can always shift equipment so at least one unit can be in use. The operators at the plants can handle many of the problems that occur, but for more technical errors expertise is needed. At many sites there were minor damages that could easily be fixed to improve the plant function if money was available. Access roads
Many of the plants are situated very far from the district towns and the dirt roads leading there are accessible only in the dry season. This makes it difficult to get technical support from outside the village if components of the plant need to be exchanged or repaired. 5.1.2 Energy Situation in the Villages Electricity available
Electricity in the villages is used mainly during the dark hours of the day and in some villages the electricity is available daily for 12 hours only or less. The amount of energy available for each household is presented in table 3. Table 3. The amount of energy available for each household. Nam Poun has not been in use for many years
Plant name Connected households
Watt per household Electricity per day (hours)
Nam Soy 97 124 12 Nam Ka 1 95 126 12 (2-3 if dry season) Nam Ka 2 174 316 5 Nam Poun 1 - - - Nam Et 749 100 24 (<24 if dry season) Nam San 889 124 24 Nam Boun 715 154 24 (15 if dry season) Nam Sat 846 296 24 (4-5 if dry season) Energy use
The electricity generated by micro hydropower plants is used mainly for light in the households as shown in table 4. Normally a household uses between one and three lamps. One woman told that her household uses 30 light bulbs since her husband is the district governor and they do not have to pay for the electricity. Both light bulbs and fluorescent lamps are used but the fluorescent lamps have a tendency to break when the current is fluctuating. Before the villages got access to electricity and during periods when the plants are not running, candles and diesel lamps are used instead. Many of the households have a TV and a CD player. Wood is still the main fuel for cooking since the micro hydropower plants do not generate enough electricity for the use of electric pans. The number of times households collect wood varies between three times a week to once every month. Some households buy their wood on the market. Electricity is used for businesses at one out of eight plants. All villages stated that the electricity from the plant is not enough for their demand. If the energy situation is improved many of the villages wants to use electrical equipment to make
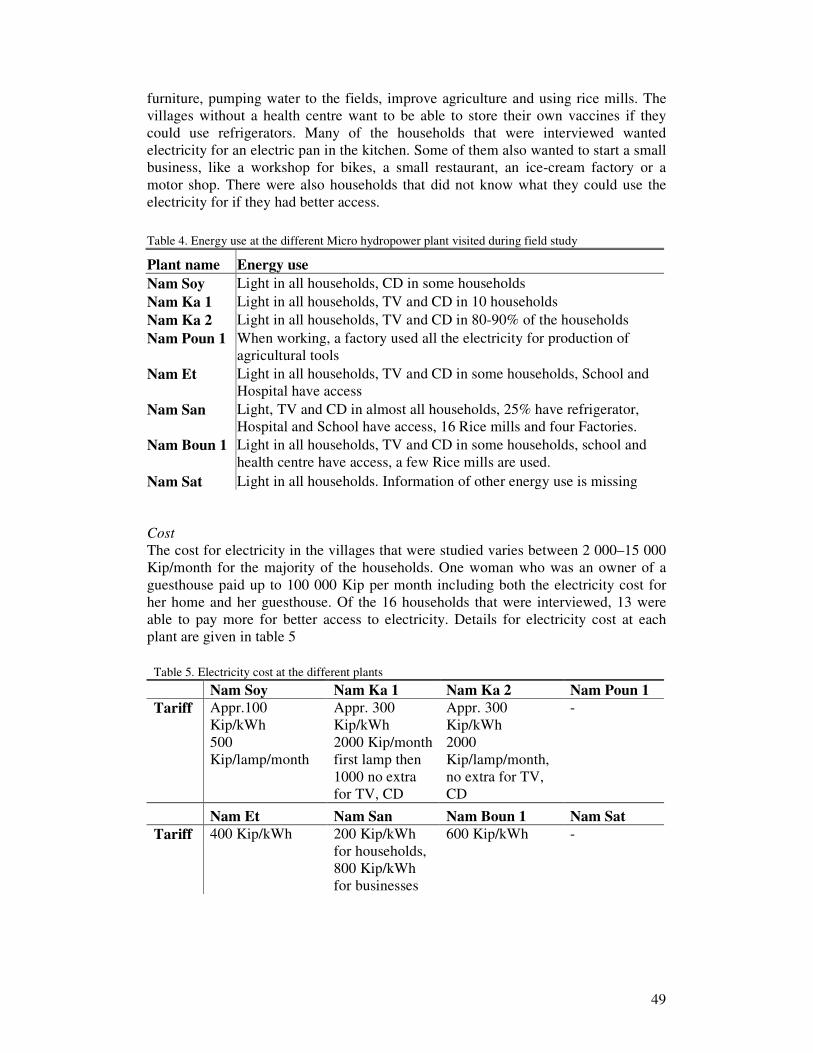
49
furniture, pumping water to the fields, improve agriculture and using rice mills. The villages without a health centre want to be able to store their own vaccines if they could use refrigerators. Many of the households that were interviewed wanted electricity for an electric pan in the kitchen. Some of them also wanted to start a small business, like a workshop for bikes, a small restaurant, an ice-cream factory or a motor shop. There were also households that did not know what they could use the electricity for if they had better access.
Cost
The cost for electricity in the villages that were studied varies between 2 000–15 000 Kip/month for the majority of the households. One woman who was an owner of a guesthouse paid up to 100 000 Kip per month including both the electricity cost for her home and her guesthouse. Of the 16 households that were interviewed, 13 were able to pay more for better access to electricity. Details for electricity cost at each plant are given in table 5
Table 5. Electricity cost at the different plants
Nam Soy Nam Ka 1 Nam Ka 2 Nam Poun 1 Tariff
Appr.100 Kip/kWh
Appr. 300 Kip/kWh
Appr. 300 Kip/kWh
-
500 Kip/lamp/month
2000 Kip/month first lamp then 1000 no extra for TV, CD
2000 Kip/lamp/month, no extra for TV, CD
Nam Et Nam San Nam Boun 1 Nam Sat Tariff 400 Kip/kWh 200 Kip/kWh 600 Kip/kWh -
for households, 800 Kip/kWh for businesses
Table 4. Energy use at the different Micro hydropower plant visited during field study
Plant name Energy use Nam Soy Light in all households, CD in some households Nam Ka 1 Light in all households, TV and CD in 10 households Nam Ka 2 Light in all households, TV and CD in 80-90% of the households Nam Poun 1
When working, a factory used all the electricity for production of agricultural tools
Nam Et
Light in all households, TV and CD in some households, School and Hospital have access
Nam San
Light, TV and CD in almost all households, 25% have refrigerator, Hospital and School have access, 16 Rice mills and four Factories.
Nam Boun 1
Light in all households, TV and CD in some households, school and health centre have access, a few Rice mills are used.
Nam Sat Light in all households. Information of other energy use is missing

50
5.2 Modelling 5.2.1 Calibration The optimal RV result of 0.79 was obtained with the X1 and X2 value of 533 mm and 1.10. In table 6 the different plants optimal results are depicted as well as their combined result when the mean of their X1 and X2 are considered. The best-combined fit is obtained when all plants are calibrated at the same time against each other, which is depicted as the last row in table 6. The best fit had a relative volume error of 23%, which could be seen as considerable. Niel et al. (2003) stated that an acceptable result of VE should be in the range of 30%. Figure 36 has a response surface of the RV result with 100 different X1 and X2 values. The inner circle represents the best fit. The different catchment areas that were generated during the calibration differed only by 2.4% from what was stated by I. Araki (2005). Table 7 depicts how the observed water flows relates to the calibrated water flows. It can be seen that the ln version of R
2 gives a better result for the low flow months.
Figure 36: The All Cali Mean obtained RV result when examining 100 X1 against 100 X2.

51
Table 6. Top five rows is the calibration result for the five potential new sites single-handedly. The Mean (X1 & X2) considers the mean calibration value when every potential new site has used their combined mean value of X1 and X2. All Cali Mean is when the optimal fit for all the sites at the same time is considered.
RV R2 VE X1 X2
Nam Boun 2 0,90 0,91 0,09 368 1,28 Nam Likna 0,89 0,90 0,07 360 1,25 Nam Ou Neua 0,90 0,90 0,00 157 1,41 Nam Sim 0,89 0,89 0,06 1083 0,89 Nam Xeng 0,93 0,95 0,13 854 0,79 Mean (X1 & X2) 0,78 0,80 0,23 567 1,11 All Cali Mean 0,79 0,81 0,23 533 1,10
Table 7. The table shows a comparison between the accuracy of the observed and calibrated water flow with and without the ln version of the efficiency criterion.
Nam Boun 2 May Jun Jul Aug Sep Oct Nov Dec Jan Feb Mar Apr Observed 3,1 7,1 14,8 20,3 20,3 7,1 5,0 2,3 2,5 2,2 1,9 2,6 Calibrated (ln) 4,0 6,8 7,3 21,7 15,3 7,8 4,6 3,0 2,2 2,6 2,9 2,8 Calibrated 4,5 7,4 8,2 20,6 17,6 9,5 5,7 3,9 2,8 3,2 3,5 3,4 Nam Likna Observed 0,3 0,7 1,5 2,1 1,9 0,7 0,5 0,2 0,2 0,2 0,2 0,2 Calibrated (ln) 0,4 0,6 0,6 2,5 1,6 0,8 0,4 0,3 0,2 0,3 0,3 0,3 Calibrated 0,4 0,6 0,7 2,2 1,8 0,9 0,5 0,4 0,3 0,3 0,3 0,3 Nam Ou Neua Observed 6,0 14,4 29,1 42,9 29,0 14,1 9,8 4,4 4,8 3,9 3,6 5,0 Calibrated (ln) 3,8 15,7 20,1 62,4 26,3 14,2 8,2 5,2 4,1 6,2 5,3 5,5 Calibrated 5,3 9,9 16,8 46,2 31,4 18,9 12,4 8,1 6,3 7,6 7,3 7,0 Nam Sim Observed 1,9 4,7 9,3 14,0 12,2 4,6 3,1 1,3 1,5 1,2 1,1 1,5 Calibrated (ln) 2,7 7,3 6,9 10,8 9,9 5,4 3,4 2,3 1,7 1,4 1,0 0,9 Calibrated 3,0 8,0 7,3 11,7 10,4 5,6 3,5 2,4 1,8 1,5 1,1 1,0 Nam Xeng Observed 1,8 7,0 7,9 20,2 27,7 7,1 4,8 2,7 2,1 1,9 1,4 1,1 Calibrated (ln) 3,2 7,6 8,7 16,0 16,3 8,7 4,9 2,9 1,9 1,7 1,4 1,4 Calibrated 4,2 9,5 10,6 19,5 19,0 10,1 5,8 3,5 2,4 2,2 1,9 1,9

52
5.2.2 Validation The validation gave an RV mean result of 0,72 with a VE of 19%. Out of the four validation plants Nam Hat 2 differed considerably from the rest, see table 8. It had an RV result of 0,45 and a VE of 39%. If only the other three were considered they would generate an average RV result of 0,82 and a VE result of 11%. Table 9 shows how the generated monthly water flow relates to the observed and here the unsatisfactory result from Nam Hat 2 is obvious.
Table 8. The standard criterion, efficiency criterion and relative volume error result from the validation plants.
RV R2 VE Nam Chong 0,78 0,81 0,15 Nam Gnone 0,84 0,86 0,06 Nam Hat 2 0,45 0,53 0,39 Nam Long 0,85 0,87 0,12 Mean 0,72 0,76 0,19
Table 9. A comparison of the monthly water flow at the four different plants. Observed is the data that is calculated from the hydrographs and validation is the GR2M generated flow with the calibrated value on X1 and X2.
Nam Chong May Jun Jul Aug Sep Oct Nov Dec Jan Feb Mar Apr Observed 0,03 0,09 0,09 0,25 0,32 0,08 0,06 0,03 0,03 0,02 0,02 0,02 Validation 0,05 0,10 0,14 0,26 0,23 0,14 0,09 0,05 0,04 0,04 0,03 0,03 Nam Gnone Observed 0,6 2,2 2,4 5,8 8,1 2,1 1,4 0,8 0,6 0,6 0,5 0,3 Validation 1,1 2,3 3,2 6,0 5,1 3,1 1,9 1,2 0,8 0,8 0,7 0,7 Nam Hat 2 Observed 0,4 1,7 1,9 5,3 7,3 1,7 1,1 0,6 0,6 0,4 0,1 0,1 Validation 1,3 2,5 3,5 6,4 5,6 3,4 2,1 1,3 0,9 0,9 0,8 0,8 Nam Long Observed 1,1 3,2 3,3 8,1 11,1 3,2 2,2 1,5 1,2 1,1 1,1 0,9 Validation 1,9 3,6 5,0 9,0 7,9 4,9 3,1 1,9 1,4 1,4 1,2 1,2

53
5.2.3 Possible New Sites The modelling of stream flow and head gives 1503 possible new sites for micro/small hydropower plants. The distribution of the plants in the different provinces can be seen in the upper picture in figure 37. In the lower picture it is visible that many of the sites are in adjacent cells.
Figure 37. Upper map is of all 1503 potential new micro hydropower plants locations. Many locations are in adjacent river cells as can be seen in the lower picture.

54
All of the sites have a capacity within the range of 20 kW to 600 kW, a minimum head of 10 metres and a minimum stream flow of 0.3 m3/s. Furthermore the sites are situated within 10 km from the closest village. As shown in figure 38 a majority of the sites have a capacity of up to 100 kW but there are also many sites found with a capacity above 200 kW. The density of new sites is highest in the districts of Houaphanh province where also the sites with the highest capacity have been found (see figure 38). There are many possible sites also in the districts where no major source of electrification is identified for the future.
Figure 38. Pie chart of the new sites capacity distribution in the different district. Xam Tai has the highest number of found sites with 349, while Samphan has the lowest with 79.
* Size of pie chart depends on the number of potential new
sites in the district.
*

55
6 Sources of Errors 6.1 Field Visits and Interviews The use of an interpreter during the interviews in the villages was necessary since the people who were interviewed did not speak any English at all. Unfortunately the full answer from a person could never be taken care of since much of th information got lost between the interviewer, the interpreter and the person who was interviewed. What made it most difficult was that the interpreter did not always understand the local language or dialect that was spoken and had to use a very simple dialogue to communicate. It worked better during the visits to the plants where plant operators had the chance to show the problems at the plant at the same time as they were talking about them. It appeared that it was important to ask the same questions many times since there were often misunderstandings resulting in the wrong answers. The interviews with households are not evenly distributed at the plants visited as would have been preferred. At some sites the villages were far from the plant site and it was difficult to get the extra time to talk to the people. Due to the long travels between the plants the number of plants visited was limited. To get the most information from each plant it was valuable to discuss about the plants with representatives from different backgrounds. The opinions and knowledge of the MIH, operators and villagers helped to give a more complete picture of the energy situation and the status of the existing plants. 6.2 Calibration and Validation The calibration and validation had two major shortcomings, namely
• number and density of weather station • number, length and quality of hydrographs
In Lao PDR there are not as many weather stations as would have been preferred. The data sets collected for Lao PDR was done so thinking of the study area that were going to be examined, e.g. the northeastern part of Lao PDR and not the northwestern part, where all the validation plants where located. This might have led to that the climatically data were not representative for those specific areas. This is also the reason why elevation data was not obtained for this region. The number and lengths of collected hydrographs are insufficiently low. To only have five locations to calibrate against and four to validate with in such a large area is unsatisfactory. The length of one year is also insufficiently short. The available data on measured water flow in Lao PDR is limited, and mainly larger rivers are studied, which are of no interests to our study. The quality of the collected data is also insufficient in some cases. In some hydrographs the resolution is so bad that with a small change in how the calculation point was determined the monthly water flow could change with up to a 100%. The large error in Nam Hat 2:s validation might be because of its poor resolution. As can be seen in its hydrograph (see Appendix E), only the months between June and December could really be determined.

56
6.3 Modelling of new sites The number of possible new sites would have been even higher if the Matlab programme would have been able to handle a higher number of recursions on the available computer. To be able to run the programme the biggest river segments in the districts had to be cut in smaller regions, which lead to a loss of sites with larger water flow. For the purpose of this thesis this is not a big obstacle since most of the sites suitable for micro hydropower will be found anyway. Overlapping of the regions made it possible to save most part of the river systems but there are areas, especially on the border between Lao PDR and Vietnam where part of the river system got lost.

57
7 Discussion and Conclusion 7.1 Importance of Micro Hydropower for Rural Electrification in Lao PDR The electricity from the micro hydropower plants in Lao PDR is often shared between many neighbouring villages and it rarely meets the demand of the individual households. The more electricity the plant generates the more households are connected and use the electricity. In most villages visited during the field study, the electricity is used only for light during the dark hours of the day and all villages stated that the electricity was not enough for their demand. Therefore, the aim of a plant installation must be very clear. One possibility is to let the plant be used by as many villages as possible to generate electricity for light and information technologies, as these are a very important first step for increasing the living standard of people in rural areas and can serve as a trigger for many activities. Another option would be to let only a few villages use the electricity for income generating activities and agriculture tools to help these villages to develop even further. Even if sufficient electricity is available an increase in development is not certain, as many people in rural areas have no knowledge about what they can use electricity for if they had better access. The energy situation in the villages could look better if the micro hydropower plants were working properly, but a majority of the existing plants in Lao PDR are either broken or working with poor capacity. The main shortcomings at the micro hydropower plants are:
• Large variations in water flow • Problem with electro mechanical equipment • Use of second hand equipment from China that do not fit with the site • Insufficient maintenance
Since the water flow in the rivers varies throughout the year, the plants can not run properly in the dry season. Many of the plants in Lao PDR are designed to work well for 80-90% of the year. This means that during the dry season the plants are running only randomly or with the use of one generator instead of two. If micro hydropower is the villages’ only energy source, it needs to be situated at a site where it gives at least enough electricity for light during the evening in the dry season. Before starting the reparation of an existing plant it is important to consider the dry season impact of the plant capacity. If the plant used to be non-functional for a longer period every year, the electromechanical equipment might need to be resized, or solar cells can be used in a hybrid system so that electricity would be available also in the dry season. Damage on the electromechanical equipment is often the reason why many plants finally stop working. One of the main reasons for this is overload of the plant which often leads to that the coil in the generator burns off. This is commonly a result of insufficient maintenance work that has lead to a chain reaction where the condition of some electromechanical equipment has worsened over time and the load on others has increased.

58
The second hand equipment from China, which is used at many plants, is often in poor condition. It breaks easily and it does not make use of the full site capacity. Still it is better with a micro hydropower plant in poor condition than no electricity at all. As for the Nam Soy plant that gives 12 kW, which is enough for light to the whole village, but where the site has a capacity to give a lot more energy if someone would pay for a proper scheme. Insufficient maintenance work is mainly due to the plant operators not having enough training or equipment to handle the problems that occur at the plant and due to the villages not having enough money to pay for major reparations. The household in the villages pay a certain amount of money every month for electricity, but the money is far from enough if any components of the plants need to be exchanged. Many plants are installed with donors from China, but once the plants are installed the villages are left without spare parts or a budget for maintenance work. The GoL is aware of the problems at many plants, but they are dependent on financial support before any reparation can take place. Some problems at the plants also arise because it is unclear who is responsible for the maintenance work. To prevent the plants from breaking because of insufficient maintenance, it is important that the training of the plant operators is improved. It is also necessary that there is a clearer structure for who is responsible for replacing broken parts and that there is a budget for maintenance both in the village and at the responsible ministry. Since the government budget for rural electrification is not that large it might be necessary to try a new approach for the funding of the micro hydropower plants. Rental systems for solar cells have been established with good result in many areas of Lao PDR. The rental system is structured in a way that a company owns the equipment and is responsible for the maintenance work, and they also pay for the installation cost. Then the village pays for the electricity they use to the company (Sunlabob, b 2006). This approach would be interesting to try also on micro hydropower plants. The optimal would be to combine both systems in a hybrid system as they have their prime efficiency in different seasons. 7.2 Analyse of Possible New Sites There are many possible sites for new micro hydropower plants. In all the districts of interest there are many locations that meet the requirements of flow, head and closeness to villages. The relatively high capacity of many plants gives some marginal for the sites to be useful in reality for rural electrification. Many possible new sites are situated in neighbouring cells. Since the head is only calculated for a distance of four adjacent cells this gives a possibility to increase the capacity of the sites if the full head of more than four cells is utilized. The simplicity of the GR2M water balance model can be justified since the aim of the modelling was to estimate the seasonal variation in the water flow. The obtained results from the calibration and validation of the GR2M model are also sufficient for the purpose of the model.

59
The high number of possible new sites, 1503, implies that an initiative of increasing the usage of micro hydropower for rural electrification is not limited by the potential of new sites. Since there are a high number of possible sites in the districts where no major source of electrification is planned for the future, micro hydropower would be very useful also in those districts. The relatively high capacity found at many of the possible sites could be well used since many times several villages are found within a 10 km distance from the plant site. The results from the modelling can be used as guidance for those planning to build new micro hydropower plants in Lao PDR.

60

61
References AEPC - Alternative Energy Promotion Centre. 2001. AEPC Programs - Micro Hydro
Introduction. [internet]. (Updated 30 July 2006) Available from: http://www.aepcnepal.org/pro/mhp.php [cited August 2006]. Arheimer B. 2006. The HBV model. [internet] Available from: http://www.smhi.se/sgn0106/if/hydrologi/hbv.htm [cited July 2006]. Arheimer B. and Fogelberg S. 2004. Rainfall-Runoff Modelling of Daily Water Flow
in Ungauged Basins. SMHI, Paper Presented at the Euro Harp Workshop 2004 Arnberg W., Arnberg S., Eklundh L., Harrie L., Hauska H., Olsson L., Pilesjö P., Rystedt B. and Sandgren U. 2003. Geografisk Informationsbehandling - Metoder och
Tillämpningar, 3rd Edition. Formas Stockholm. ISBN 91-540-5904-6 Araki I. 2005. The Master Plan Study on Small-Hydro in Northern Laos. Final
Report: Volume 1. Japan International Cooperation Agency (JICA) Benson H. 1996. University Physics – Revised Edition. John Wiley & Sons, Ltd. ISBN: 0471006890 Beven K. J. 2001. Rainfall-Runoff Modelling - The Primer. John Wiley & Sons, Ltd. ISBN: 0471985538 Bonhomme J., Clark R., Davis S., and Graham S. 2004. Micro-Hydropower Systems:
A Buyer’s Guide. Natural Resources Canada, Renewable and Electrical Energy Division. ISBN 0-662-35880-5 Bounthong B., Raintree J. and Douangsavanh L. 2003. Upland Agriculture and
Forestry Research for Improving Livelihoods in Lao PDR, in: Saxena K. G., Liang L., Kono Y. and Miyata S (Ed.). Small-Scale Livelihoods and Natural Resources
Management in Marginal Areas: Case Studies in Monsoon Asia. Proceedings of an International Symposium, Tokyo, Japan, 29-30 October 2003, 175-192. Brutsaert W. 2005. Hydrology an Introduction. Cambridge University Press CanRen. 2004. Basic Components of a Micro-Hydropower System. [internet] Available from: http://www.canren.gc.ca/prod_serv/index.asp?CaId=196&PgId=1309 [cited July 2006]. Cemagref. 2006. Modèles Hydrologiques du Génie Rural. [internet] Available from: http://www.cemagref.fr/webgr/Modèlesgb/gr2m/fonctionnement/fonctionnement_gr2mgb.htm [cited June 2006]. Cunningham P. and Atkinson B. 1998. Micro Hydro Power in the Nineties. [internet] Available from: http://www.elements.nb.ca/theme/energy/micro/micro.htm [cited July 2006].

62
Danielson E. W., Levin J. and Abrams E. 2003. Meteorology, 2nd Edition. New York: McGraw-Hill Inc. ISBN: 0072420723 Dodson R. D. 1993. Advances in Hydrologic Computation. In, D. R. Maidment, ed. Handbook of Hydrology. New York: McGraw-Hill Inc. 1993. ISBN: 0-07-039732-5 ESRI - Environmental Systems Research Institute. 2004. Understanding Map
Projection, United State of America ESRI. 2005. ArcGIS 9.0.1 Desktop Help. [internet] Available from: http://webhelp.esri.com/arcgisdesktop/9.1/index.cfm?TopicName=welcome [cited July 2006]. Fidlóczky A. and Pető Á. 2004. Study on the Loss of Biodiversity and its Causes in
Freshwater Habitats in Nam Pa in Phonxai District. Final Report. Ministry of Agriculture and Forestry, National Agriculture and Forestry Research Institute. Fraenkel P., Paish O., Bokalders V., Harvey A., Brown A. and Edwards R. 1991. Micro-Hydro Power – A Guide for Development Workers. London: Intermediate Technology Publications Ltd in associations with Stockholm Environment Institute. ISBN: 1853390291 Hellweger F. 1997. AGREE - DEM Surface Reconditioning System. [internet] Available from: http://www.ce.utexas.edu/prof/maidment/GISHYDRO/ferdi/research/agree/agree.html [cited July 2006]. Holton J. R. 2004. An Introduction to Dynamic Meteorology, 4th Edition. Elsevier Academic Press. ISBN: 0-12-354015-1 IEA - International Energy Agency. 2005. Case study: Off-grid PV in Southern Laos. [internet] Available from: http://www.iea-pvps.org/pvpower/22_09.htm [cited August 2006]. ITDG - Intermediate Technology Development Group. 2005. Micro-Hydro Power:
the Basics. [internet] Available from: http://www.itdg.org/?id=micro_hydro_faq [cited August 2006]. ITDG. n.d. Micro-Hydro Power. [internet] Available from: http://www.itdg.org/docs/technical_information_service/micro_hydro_power.pdf [cited August 2006]. Khennas S. and Barnett A. 2000. Best Practices for Sustainable Development of
Micro Hydropower in Developing Countries - A Final Synthesis Report. Intermediate Technology Development Group Ltd. Klunne W. J. 2006. Micro hydropower basics - Introduction to micro hydro. [internet] Available from: http://www.microhydropower.net/intro.html [cited August 2006].

63
Knippers R. 2006. Geometric Aspects of Mapping. [internet] Available from: http://www.kartografie.nl/geometrics/Introduction/introduction.html [cited August 2006]. Krause P., Boyle D. P., and Bäse F. 2005. Comparison of Different Efficiency Criteria
for Hydrological Model Assessment. Advances in Geosciences, Vol 5, 89–97. Landguiden. 2005. Laos. [internet] Available from: http://www.landguiden.se/pubCountryText.asp?country_id=89&subject_id=0 [cited August 2006]. Madsen H. and Kristensen M. 2002. A multi-objective calibration framework for
parameter estimation in the MIKE SHE integrated hydrological modelling system. ModelCARE 2002. Proc. 4th Int. Conf. Calibration and Reliability in Groundwater Mod., Prague.
Malaykham B. 2004. Business Prospects in Southeast Asia for European Equipment. EC-ASEAN COGEN Programme, Phase 3, Krakow, Polen, 23 - 24 November 2004. Malaykham B. 2006. Chief of Rural Electrification Division, Ministry of Industry and Handicraft, Department of Electricity. Interview by authors, 27 April 2006. Vientiane, Laos. [Interview recording available]. MIH - Ministry of Industry and Handicraft. 2006. Situation of Existing MH in Laos. Ministry of Industry and Handicraft. MIH. n.d. Energy Power in Lao PDR. [internet] Available from: http://www.poweringprogress.org/lao-energy/presentation/index_presentation.htm [cited August 2006]. Mouelhi S., Michel C., Perrin C. and Andreassian V. 2006. Stepwise Development of
a two Parameter Monthly Water Balance Model. Journal of hydrology, Vol 318, 200-214. Nam Theun 2 Power Company Ltd. 2006. Nam Theun 2 Hydroeletric Project. [internet] Available from: http://namtheun2.com/NT2%20Progress%20May%202006.pdf [cited August 2006]. Nash J.E. and Sutcliffe J.V. 1970. River Flow Forecasting through Conceptual
Models. Part I - A Discussion of Principles. Journal of Hydrology, Vol 10(3), 282-290. NE - Nationalencyklopedin. 2006. Laos. [internet] Available from: http://www.ne.se/jsp/search/article.jsp?i_art_id=237706&i_word=Laos [cited August 2006].

64
Niel H., Paturel J-E. and Servat E. 2003. Study of Parameter Stability of a Lumped
Hydrologic Model in a Context of Climatic Variability. Journal of Hydrology, Vol 278, 213-230. NOAA - National Oceanic and Atmospheric Administration, Coastal Service Center. 2006. Analyzing Benthic Data: Spatial Analysis. [internet] Available from: http://www.csc.noaa.gov/benthic/mapping/analyzing/spatial.htm [cited July 2006]. Oanda. 2006. The Currency Site. [internet] Available from: http://oanda.com/convert/classic [cited October 2006]. Oudina L., Hervieua F., Michela C., Perrina C., Andréassiana V., Anctilb F., Loumagnea C. 2005. Which Potential Evapotranspiration Input for a Lumped
Rainfall-Runoff Model? Part 2 - Towards a Simple and Efficient Potential
Evapotranspiration Model for Rainfall-Runoff Modelling. Journal of Hydrology, Vol 303, 290-306 Pidwirny M. 2006. Fundamentals of Physical Geography, 2nd Edition. [e-book] Available from: http://www.physicalgeography.net/fundamentals/contents.html [cited November 2006]. RPDC - Resource Planning and Development Commission. 2005. The Landface of the
Hydrological Cycle. [internet] Available from: http://www.rpdc.tas.gov.au/soer/image/267/index.php [cited November 2006]. Shuttleworth W.J. 1993. Evaporation. In, D. R. Maidment, ed. Handbook of
Hydrology. New York: McGraw-Hill Inc. 1993. ISBN: 0-07-039732-5 STEA - Science, Technology and Environment Agency, 2002. Renewable Energy
Technologies in Asia - A Regional Research and Dissemination Programme
Phase II - A Summary of Activities and Achievements in Lao PDR. Regional Energy Resources Information Centre (RERIC) Smith J. A. 1993. Precipitation. In, D. R. Maidment, ed. Handbook of Hydrology. New York: McGraw-Hill Inc. 1993. ISBN: 0-07-039732-5 Solarguide. n.d. The Micro- Hydro Electric Power Turbine. [internet] Available from: http://www.thesolarguide.com/micro-hydro/turbines.aspx [cited August 2006]. Stuart-Fox M. 2005. Politics and Reform in the Lao People’s Democratic Republic. Political Economy of Development Working Paper 1, Program of Civil Society and Government, The College of William and Mary. ISBN: 86905-961-0 Sunlabob (a) 2006.What is Sunlabob? [internet] Available from: http://www.sunlabob.com/aboutsunlabob.htm [cited August 2006]. Sunlabob (b) 2006. Village electric grids for creating rural income - A solution for
remote villages off the grid in Lao PDR. Sunlabob Co, Ltd.

65
Tait A. J., Holland C. W., Kepple J. S. and Wilson J. W. 2004. Rural Electrification
Frameworks Study. Maunsell ltd. Tarboton D. G., Bras R. L., Rodriguez–Iturbe I. 1991. On the Extraction of Channel
Networks from Digital Elevation Data. Hydrological Processes. Vol 5, 81-100. Tiscali. 2006. Map Projection. [internet] Available from: http://www.tiscali.co.uk/reference/encyclopaedia/hutchinson/m0027308.htmlv [cited August 2006]. Tropp S., Kamaluddeen K., Soer A. and Wagenbuur K. 2001. National Human
Development Report Lao PDR 2001 - Advancing Rural Development. UNDP. Van Gansberghe D. 2005. Diversity in the Uplands of the Lao PDR, in: Glendinning A., Clayton D., Dubois M., Fernandez M. and Nilsson S. 2005. Improving Livelihood
in The Uplands of the Lao PDR - Volume 1: Initiatives and Approaches. Nafri, Nafes and Nuol. Vattenfall (a) 2006. Fossila bränslen. [internet] Available from: http://www.vattenfall.se/om_vattenfall/var_verksamhet/forskning_och_utveckling/fossila/ [cited August 2006]. Vattenfall (b) 2006. Från vedeldning till bioenergi. [internet] Available from: http://www.vattenfall.se/om_vattenfall/energikunskap/biobransle/ [cited August 2006]. Wilkins G. 2002. Technology Transfer for Renewable Energy. London: The Royal Institute of International Affairs, and Earthscan Publications Ltd. ISBN: 1853837539 World Bank Group. 2006. Lao PDR and Energy. [internet] Available from: http://web.worldbank.org/WBSITE/EXTERNAL/COUNTRIES/EASTASIAPACIFICEXT/EXTEAPREGTOPENERGY/0,,contentMDK:20507043~pagePK:34004173~piPK:34003707~theSitePK:574015,00.html [cited August 2006].

66

67
Appendix A. Presentation of the Plants Visited in Lao PDR
A.1 Nam Boun 1 Date of field-study: 2006-03-16 Place: Nam Boun 1 site, Bounneau district, Phongsali province Introduction The energy generated from Nam Boun 1 micro hydropower plant is shared between 13 villages. The hydropower plant was installed in 1996 and has provided electricity to the villages since 1997. The hydropower plant is of a low head type with the installed capacity of 2*55 kW, but with a current capacity of 50 kW + 45 kW in the rainy season. Micro hydropower plant Operating hours: Rainy season (June to December): 24 hours per day Dry season (January to May): 15 hours per day, 6pm to 10am
Figure 39. All visited micro hydropower plants during field study.

68
Water flow
Due to lack of water in the dry season, January to May, only one of the two generators can be running at a time. The lowest water flow is in April and May when the upstream water is also used for irrigation. In the rainy season the water flow is enough for both the generators and for irrigation. One pipe that leads from the hydro plant is used for watering the fields. At the time when the plant was designed the water flow varied from 1 – 5 sm /3 , with an average water flow of 3.5 sm /3 .
Overall status of the plant
There is a big problem with mud in the dam, which decreases its volume and affects the plant capacity. The dam has to be cleaned once every 2-3 years. There are also some problems with the control panels, which imply that the load has to be controlled manually. The coil in the 50 kW generator broke last year and was replaced with a new one. Maintenance
The micro hydropower plant is working well in most aspects. It is operated and maintained by seven operators paid by the government. Of the total income generated by the plant, 80% goes to maintenance work and 20% goes the government. General Information Table 10. Some general information about Nam Boun 1.
Number of villages 13 Total number of households 891 Connected households at time of installation (1997) 300 Connected households at present 715 Energy use and demand in the villages The energy from Nam Boun 1 is not enough for the villages’ energy demand. In the dry season the villages must take turn in the use of electricity. There are households willing to pay for electricity, but unable to connect to the grid due to the insufficient capacity of the micro hydropower plant. The energy from Nam Boun 1 was not even enough in 1997 when only 300 households were connected. The energy from Nam Boun 1 is mostly used for light sources in the households, but some households also use it for TV and CD. A few households use electricity for milling. There are no businesses in the village with access to electricity since the energy is not enough. If the energy access is improved there is an interest in making furniture, starting a tobacco factory and increasing the agriculture activity. Some households want to open restaurants. A health centre in the district has access to the electricity and some schools in the village’s uses electricity for lamps when it is needed. The number of lamps and electrical equipment in use varies for different households. Diesel engines are used for electricity at the airport, at some hotels and in some households. One village has a Pico hydropower plant. Cost The cost for electricity is 600 Kip per kWh. Since there are no subsides from the government or other organizations all families pay with their own money. The households that were interviewed paid between 4000 and 15000 Kip every month for

69
electricity. Some of the households could afford to pay more money for getting better access to electricity. A.2 Nam Et Date of field study: 6th of April 2006 Place of field study: Nam Et site, Houaphanh province, Viengthong district Introduction Nam Et micro hydropower plant is situated inside Nam Et national park at the end of a dirt road about 60 kilometres from Viengthong centre village. The plant was constructed in 1995 and has a capacity of 75 kW. The electricity from the plant is shared between nine villages located within 10 km from the plant site. Micro hydropower plant Operating hours July-May: 24 hours, full capacity between 6pm-10pm June: varying, but less than 24 hours
Water flow
The water flow is sufficient most part of the year. Only in June when lots of water is needed for irrigation the plant cannot always run for 24 hours.
Overall status of the plant
The main problem at the plant is that lots of sand fills up the dam and the forebay. The first part of the canal after the intake is a closed pipe that cannot be cleaned so the sand enters the canal and fills up the forebay. The forebay is cleaned once every month from sand and every day from wood and garbage not to cause any damage to the turbine. The dam has never been cleaned and is almost completely full of sand. The result of all the sand in the dam is that sometimes there is not enough water entering the canal. The operators want to increase the dam by raising the weir two metres. They also want to change the penstock at the intake to an open canal to make cleaning possible. The penstock from the forebay to the turbine loses some head because it goes first down and then up again on a hill. This is because the villages use the water from the river also for irrigation and need the penstock to continue up on the hill to water the fields at the top. The penstock was rebuilt in 2000 after the flood carried the old penstock away. The hydraulic control has been broken since construction and the control panel misses many functions. Maintenance
2 operators are working at the plant General Information Table 11. Some general information about Nam Et Villages connected to the grid 9 Number of households in the village 749

70
Energy use and demand in the villages The villages use the electricity mainly for light. Some households also use the electricity for CD and TV. The hospital and the schools also get electricity from the plant. The electricity is not enough for any businesses or for using the mill. Cost The cost for electricity is 400 Kip/kWh. Most of the households pay 3000-4000 Kip every month for using electricity. Totally the villages pay 600 000 Kip per month. 50% of the money is divided between the operators, 150 000 Kip/month/person, the villages 10% and maintenance of the plant 40%. A.3 Nam Ka 1 and 2 Date of field-study: 2006-02-21 to 2006-02-23 Place of field study: Nam Ka micro hydropower site, Phaxay district, Xieng Khuang Province Introduction The energy generated from Nam Ka micro hydropower plant is shared between five villages. The micro hydropower plant will be part of a pilot project performed by the rural electrification system company Sunlabob, where hydropower, solar cells and bio fuel will be integrated in a hybrid grid to provide energy for the villages. The micro hydropower plant consists of three powerhouses connected with canals which all get their water from the same dam and intake. The waterway first leads to Nam Ka 1 micro hydropower installation with a capacity of 12 kW. After passing the turbine the water continues to Nam Ka 2, with a capacity of 55 kW/26 kW. The 26 kW turbine is used only in the dry season when there is not enough water in the river. At the time of the field study only the 55 kW turbine at Nam Ka 2 was working. Nam Ka 1 broke down one year ago, the 26 kW turbine at Nam Ka 2 broke down two years ago and Nam Ka 3 has not been used in ten years. Nam Ka 1 provides one village, Ban Nam Ka, with electricity, while the other four villages Ban Na Phia, Ban Xoua, Ban Thang, and Ban Xieng Nua get their electricity from Nam Ka 2. Micro hydropower plant Operating hours: Nam Ka 1: 12 hours, 6pm-6am, June-Mars 2-3 hours, April-May Nam Ka 2: 55 kW: 5 hours, 6pm-10pm, June-Mars 26 kW: 5 hours, 6pm-10pm, April-May Water flow
The water flow is sufficient for running the micro hydropower plant, except for the dry season April-May. Since the 26 kW generator at Nam Ka 2 does not work, the 55 kW turbine is running also in the dry season, but only for 3 hours at a time when the dam is full.

71
Overall status of the plants
The dam:
The dam is emptied every day when the micro hydropower plant is running. It also fills up very quickly. The villages would like to have a bigger dam so they could run the micro hydropower plant for a longer time. The problem is that they can not have a higher weir because this would make the fields flooded and might damage some of the houses. Intake
The barrier separating the intake to Nam Ka 1 consists of mud and stones. This construction would not resist the rainy season and it will be difficult to control the water flow through the intake. There will also be a problem with sediment being carried into the canal. Settling basin:
There are no settling basins in the hydropower scheme, which results in a thick layer of sediment at the bottom of the forebay. A settling basin just before the forebay would reduce the amount of stones and sediment that reaches the turbine and it would be more easily cleaned than the forebay. The trash racks protecting the penstock intake also needs to be exchanged. Nam Ka 1:
Nam Ka 1 has not been working for one year. The AC output has been a problem for a long time. It was giving away sparks when it was running and some parts had to be changed regularly. Finally a year ago it broke totally when it was burned off. Another problem was that the control panel had broken down already after two years (1997), and now they just bypass it. This leads to fluctuations in the current, which makes it impossible to use the fluorescent lamps. The bearing broke after five years and since then they have had to change it every year. The penstock is leaking in the junction with the turbine, which fills the powerhouse floor with water. There is a problem sometimes with stones in the turbine. The trash rack protecting the penstock intake from stones is broken. Nam Ka 2:
At Nam Ka 2, the coil in the 26 kW generator has been completely broken for two years. There are some problems with water leaking from the penstock into the powerhouse. Every month the villages have about six days without electricity due to stones in the turbine. Transmission lines:
The transmission lines at Nam Ka 2 are working, but at some places the distances between the poles are to long, resulting in very low hanging wires. The transmission lines for Ban Nam Ka are not working. Some of the wood poles are broken and some of them can break very easily.

72
General Information Table 12. Number of households and persons that get electricity from Nam Ka 1
Village Number of households Number of persons Ban Nam Ka 95 585 Table 13. Number of households and persons that get electricity from Nam Ka 2 Village Number of households Number of persons Ban Na Phia 44 242 Ban Xoua 26 147 Ban Thang 46 274 Ban Xieng Nua 58 350 Total 174 1030 Energy use Ban Nam Ka
Ban Nam Ka has no access to electricity since the micro hydropower plant broke a little more than one year ago. The households get light from candles and kerosene lamps. Nine households use a diesel engine for milling. When the electricity was working, all households used 2-3 light bulbs. About ten households also used the electricity for TV and CD, which sometimes resulted in a shortage of electricity if they all used it at the same time. Ban Na Phia, Ban Xoua, Ban Thang and Ban Xieng Nua
All the households in the villages use the electricity for light. Fluorescent lamps are more common than light bulbs, but the fluorescent lamps sometimes break. 80-90% of the villages have TV and CD. Cost Ban Nam Ka
Every household pays 2000 Kip/month for their first lamp and 1000 Kip/month for every additional lamp. There is no extra cost for TV and CD. Ban Na Phia, Ban Xoua, Ban Thang and Ban Xieng Nua The households pay 2000 Kip/lamp/month but no extra money for TV and CD. Villages’ energy demand In the villages, the only income generating business is weaving. The weaving production would increase if the women had light enough to work in the evening. All the villages stated that they wanted to make furniture if they could use electrical equipment. Some villages mentioned that they wanted to pump water to the fields in the dry season so they can grow crop and papaya. In Ban Thang there was an interest in ice-cream production, which they would need freezers for. There is a primary school in all villages, but for secondary school the children goes to Phaxay district, 7 km away. The schools in the villages have no access to electricity, but in the future, if there is enough electricity, they are planning to have the school open a couple of hours in the evening. The villages want electricity for a common health centre, where a refrigerator would keep their medicines and vaccines cold. At present, a nurse comes every month with vaccines and injections. Other demands from the villages are
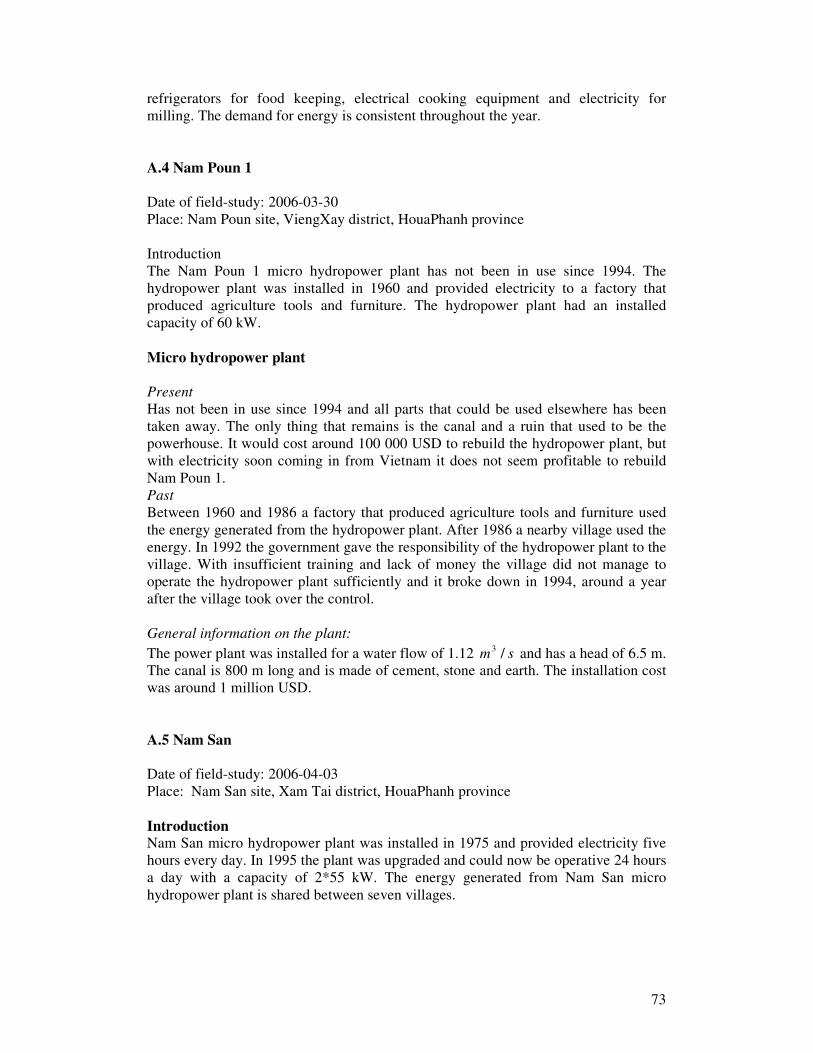
73
refrigerators for food keeping, electrical cooking equipment and electricity for milling. The demand for energy is consistent throughout the year. A.4 Nam Poun 1 Date of field-study: 2006-03-30 Place: Nam Poun site, ViengXay district, HouaPhanh province Introduction The Nam Poun 1 micro hydropower plant has not been in use since 1994. The hydropower plant was installed in 1960 and provided electricity to a factory that produced agriculture tools and furniture. The hydropower plant had an installed capacity of 60 kW. Micro hydropower plant Present
Has not been in use since 1994 and all parts that could be used elsewhere has been taken away. The only thing that remains is the canal and a ruin that used to be the powerhouse. It would cost around 100 000 USD to rebuild the hydropower plant, but with electricity soon coming in from Vietnam it does not seem profitable to rebuild Nam Poun 1. Past
Between 1960 and 1986 a factory that produced agriculture tools and furniture used the energy generated from the hydropower plant. After 1986 a nearby village used the energy. In 1992 the government gave the responsibility of the hydropower plant to the village. With insufficient training and lack of money the village did not manage to operate the hydropower plant sufficiently and it broke down in 1994, around a year after the village took over the control. General information on the plant:
The power plant was installed for a water flow of 1.12 sm /3 and has a head of 6.5 m. The canal is 800 m long and is made of cement, stone and earth. The installation cost was around 1 million USD. A.5 Nam San Date of field-study: 2006-04-03 Place: Nam San site, Xam Tai district, HouaPhanh province Introduction Nam San micro hydropower plant was installed in 1975 and provided electricity five hours every day. In 1995 the plant was upgraded and could now be operative 24 hours a day with a capacity of 2*55 kW. The energy generated from Nam San micro hydropower plant is shared between seven villages.

74
Micro hydropower plant Operating hours: It is operative 24 hours all year around, with some problem in April and May. Between Mars and August only one turbine is used. Water flow:
In June and July there would be enough water in the river to use both the turbines but the upstream villages use too much water for irrigation. The rainy season supplies enough water for both turbines and sometimes there is even too much water.
Overall status of the plant:
The micro hydropower plant is working well in most aspects. It is operated and maintained by three operators paid by the government, each one working 24 hours at a time. The power plant has a head of 42 metres and the penstock is 111 metres long. There is a big problem with mud in the dam; the government pays for it to be cleaned every year just before the rainy season. The canal, which is made of concrete and earth, has to be cleaned regularly to prevent stones and mud to enter the turbine. This is done very well and there is no problem with stones in the turbine. There is a problem with the relay, when the demand is very high the coil sometimes burns. The automatic speed governor is broken so the operators have to regulate the speed of the turbines manually. Another problem is that the electricity fluctuates sometimes. Fishes can jump up the spillway at the weir.
The upgrade in 1995:
In 1995 there was some reconstruction of the hydropower plant. One extra penstock was added, before they hade one that divided itself up to two at the end. This did not give enough water for two turbines so one extra had to be added. This implied that a new forebay had to be built. An extra intake canal was also constructed and the generators were changed. Table 14. Number of households that get electricity from Nam San Villages Number of households Ban Phansavanh 500 Ban Thinh 75 Ban Khor 102 Ban Xam Tai 75 Ban Xam Thong 57 Ban Xom San 33 Ban Nam Linh 47 Total Number of Households 889 Energy use and demand in the villages The energy from the micro hydropower plant is not enough to meet the village’s energy demand. In Ban Phansavanh there are many businesses wanting to expand but can not because of insufficient amount of electricity. Every household is connected to the grid, either directly or together with a neighbour and all can afford to pay for electricity. Fluorescent lamps are mainly used and almost every household has a TV and CD. Every household has a fan and 25% use a refrigerator. There are 16 rice mills and four factories that are connected to the grid. A new hospital in the district has access to the electricity from the plant. When an operation is performed the hospital

75
gets all the electricity it needs. One problem due to the shortage of electricity is that people in the villages cut down many trees since they do not want the trees to absorb the water they need for irrigation. If they could use electricity for pumping up water instead they would not need to cut down the trees. Cost Households pay 200 Kip/kWh, Businesses pays 800 Kip/kWh. Households pay in between 5 – 50 000 Kip/month and businesses pays 50-100 000 Kip/month. A.6 Nam Sat Date of field study: 5:th of April 2006 Place of field study: Nam Sat site, Viengthong district, Houaphanh province Introduction Nam Sat micro hydropower plant was constructed in 1999 and provides 13 villages and two army camps with electricity. The capacity of the plant is 2*125 kW. The electricity from the plant is not enough for all villages, especially in the dry season when they can only use one turbine at a time. Micro hydropower plant Location of powerhouse
N186.0420° , E857.20103°
Operating hours
June-Mars, 24 hours Dry season: April- May, 4-5 hours
Water flow
Most of the year, the water in the river is sufficient for the plant and sometimes there is even too much water. In 2004 the dam was flooded and the canal/penstock was destroyed. In April and May the water is too low and one turbine is used at a time. When only one turbine is used the villages takes turn to make use of the electricity. Some village can use electricity 4-5 hours for three days and after that they change. The river is sometimes used for irrigation, which is another obstacle in the dry season.
Overall status of the plant
The plant has been working well since the time of construction. There are no problems with the turbines and generators but there are some problems with the control panels. The dam needs to be cleaned once every year and one person from each household helps with the cleaning. The operators want to increase the height of the weir to be able to store more water in the dam during the dry season. They have also located a possible site for building a second reservoir upstream the river. Maintenance
There are five operators working at the plant.

76
General Information Table 14. Some general information about Nam Sat
Number of villages 13 (and two Army camps) Total Number of households 846 Village energy demand The main request from the villages is to have better access to electricity in April and May. In the dry season only the hospital, the state office and the police station have electricity for 24 hours. The main village in Viengthong district has electricity for 12 hours every day, also in the dry season. A.7 Nam Soy Date of field-study: 2006-03-30 Place: Nam Soy site, Viengxay district, Houaphanh province Introduction Nam Soy is the only micro hydropower plant in Viengxay district that is still running. It is situated some kilometres off the main road and provides energy to Nam Chat village. The plant was constructed in 1990 with a capacity of 12 kW. The village is urgent to find out if there is any possibility to increase the capacity of the plant since it is not likely that the village will be connected to the grid from Vietnam in many years. Micro hydropower plant Location of the powerhouse
N693.1420° , E582.28104°
Operating hours: January to December: 12 hours per day, 6 pm – 6 am Water flow
The water flow is sufficient all year round. Even when the water is used for irrigation of the rice fields there is no shortage of water to the micro hydropower plant. The river has potential for an increased power capacity if the plant construction is improved. Overall status of the plant
The generator broke down in 1997 and the coil and bearing were repaired. After the reparation the plant capacity decreased to 60% of its capacity at construction. The penstock is not constructed for the site so the full potential of the head is not used. The 1.3 km earth canal also loses some head on its way from the intake to the forbay. The plant has no transformer. There are sometimes problems with wood in the turbine.

77
General Information Table 15. Some general information about Nam Soy
Number of households 97 Total population in the village 640 Energy use and demand in the village All households in Nam Chat village get light from the power plant and some households also use the electricity for CD. There are no businesses in the village with access to electricity since the energy is not enough. If the energy situation is improved the village wants to make furniture and use the rice mill. There is no health centre in the village but some households are responsible for stocking medicines. The primary school and the secondary school in the village have no access to electricity. Diesel engines are used for milling and for building houses. Cost The cost for electricity is 500 Kip/bulb/month. If money is needed for maintenance or any reparation at the plant, the people in the village share the cost.

78
B. Representatives at the plants The persons listed below gave information about the villages energy situation and the status of the micro hydropower plant in past and present. They also provided data of the plants different aspects, which were collected during its construction. Unfortunately the names of the representatives from the different departments and the names of the plant operators are sometimes missing. The members from different households that were interviewed are anonymous. Nam Boun 1
• Mr Khamleu, head operator of the plant • Mr Ounneua, vice director of MIH in Phongsali province
Nam Et
• Representatives from the MIH, Houaphanh province department • Representatives from the MIH Viengthong district department • Plant operators
Nam Ka 1 and 2
• Leaders of the four villages Ban Thang, Ban Xoua, Ban Na Phia, Ban Xieng Nua: Mr Bonn yang, Mr Baru Lai and Mr Ountha, represents from Ban Na Phia, Mr Han La, Mr Bounthong and Mr Chanti Souk, represents from Ban Xieng Nua, Mr Boun Hong, Mr Nao Kong and Mr Bounlieng, represents from Ban Thang, Mr Bounthat, Mr Sy vonh and Mr Bhomma, represents from Ban Xoua
• The leader of the village in Ban Nam Ka • Mr Bounthong, operator of Nam Ka 2 • Mr Song Yang and Mr Van Lor Yang, operators of Nam Ka 1
Nam Poun
• Head of MIH in ViengXay district Nam San
• Mr Maykeo Soukhamvong deputy chief of MIH in Phongsali province • Mr Maynoy representative from MIH • Mr Ponekham Seang Ahkhom, Mr Mone Sung and Mr Mone Chang, operators
of the micro hydropower plant Nam Sat
• Representatives from the MIH Houaphanh province department • Representatives from the MIH Viengthong district department • Plant operators
Nam Soy
• Representative from MIH in Huaphanh province • Representative from MIH in Viengxay district • Plant operators • Head of Nam Chat village

79
C. Questionnaires C.1 Questionnaire for Energy Agencies Energy situation in General - How many percent have access to electricity in Lao PDR (rural, urban, and total)? - Which areas have access to electricity? - Which areas have least access to electricity? - Before the first hydro plant 1970, where did Lao PDR get its electricity from? - What actors are involved in the energy sector in Lao PDR and what are their
functions? How is the power sector in Lao PDR organized? (Government, private sector, inter-national investors, Aid organizations, NGOs)
- Does Lao PDR have any other power sources than hydropower? - Is there an active search for energy sources like oil, coal, gas, uranium? The national grid - How is Lao PDR National grid constructed? (Four separate parts, different types of
transmission lines 115, 35, 22kV) - What is the plan for extension of the national grid? - What is the cost for extending the grid? (Cost/km) - How is the priority set for the different areas to be electrified? Major Hydropower projects - Are there any major hydropower plants to be built in the near future? - What is the hydro potential in Lao PDR? (18 MW) - How much of the hydro potential is used? - What are the main disadvantages with hydropower production? Rural electrification far from the grid - What are the power options for remote areas far away from the national grid? - Does the government give subsides to rural villages for the use of alternative energy
sources? - Are Lao PDR positive towards the use of renewable energy source in rural areas?
Even if there are more cost efficient solutions? - Who is responsible for maintenance of renewable energy sources? - How are the rural villagers able to pay for electricity? - Are there subsides for grid connection? - Does the government provide information about energy use to the newly connected
villages? Micro Hydropower - How many micro hydropower plants have been built in Lao PDR (37), and how
many does still work? - What is the plan in the future for micro hydro plants? Install more plants? Fix the
ones that are broken? - How are new sites for micro hydropower plants chosen? - What is the cost for installing a micro hydropower plant in Lao PDR? - What are the main disadvantages with micro hydropower? - What is the plan for electrifying villages that are to far away from the national grid
and does not have a suitable location for a micro hydropower plant?

80
Electricity cost/information - What is the cost for electricity in Lao PDR (Cost/kWh)? - What is the cost per household to be connected to the national grid? Import/Export - Does Lao PDR import electricity? - Does Lao PDR export electricity to any other country than Thailand? Is it the same
amount all year around? - Does Lao PDR have the possibility to export more electricity? C.2 Questionnaire for Operators and Head of Villages General information - How many households in the village? - How many persons in the village? - How many households have access to electricity? - Who has electricity and why? - Is there a school in the village? - Are there any income generating businessesw in the village? - How far is it to the nearest health centre? - Are the roads passable in the rainy season? Households without electricity - How do the households get light after dark? - What kind of activities is performed after dark? - How much money is spent on kerosene candles etcetera every month? - What fuel is used for cooking? - How much time do the families spend on collecting wood? - Are you willing to pay for electricity? Households with electricity - What is the electricity used for (Light bulbs, fluorescent tubes, cooking, fan, radio,
TV)? - Does the demand for energy vary during the year? - Any disadvantage that came with electricity? - Are you able to pay for the electricity? - Are there subsides for households that are not able to pay? School - Does the school have access to electricity? - Is there a need for electricity in the school? - Would electricity for lightning make it possible to study in the evening? Businesses - Do any businesses have access to electricity? - Have the electricity increased the productivity of the businesses? - Does the demand for energy vary during the year?

81
Micro hydropower - For how many years did the micro hydropower work completely? - For how many years have the micro hydropower been working partly? - For how many years have the micro hydropower been broken? - Did the micro hydropower often need reparation when it was working? - What was the biggest problem? - Did you have a problem with flooding? - Was there enough energy from the micro hydropower to provide all the households
in the villages with light? - Is the river used for irrigation? - Are there lots of fishes in the river? - Is the river sometimes smaller than what it is now? - Are there any disadvantages with the micro hydropower plant? Transmission lines - Are there any problems with the transmission lines? C.3 Questionnaire for Villagers - How many persons are there in this household? (Adults, children) - What is your occupation? - Do the children go to school? - Is the household connected to the electricity grid? - Between what hours does this household get electricity? - What is the electricity used for? - How many and what kinds of lamps does this household have? - How much does electricity cost each month? - Is there sufficient electricity to meet the household demand? - If there were sufficient electricity, what would your household like to use it for? - Would this household be able to pay for more electricity? - What energy source is used for cooking? - How often does this household collect wood? - What was used as light source before this household have access to electricity?
82
D. Interviews D.1 Summary of Interview with Bouathep Mataykham, Head of Rural Electrification Division Lao PDR The Rural Electrification Division belongs to the Department of Electricity under the MIH. The RED is responsible for the off grid electrification in Lao PDR. In 2005, 47% of the population in Lao PDR had access to electricity. The energy sector in Lao PDR has the target to electrify 70% of the population until 2010 and 90% until 2020. The remaining 10% of the population is almost impossible to electrify since they live in very rural areas with no access roads. Extension of the main grid is expensive. The 22kV transmission lines cost between 10 000 and 15 000 USD per km, depending on if there is a road or not. Off grid solutions for rural mountainous areas are necessary. The northern part of the country will take longer time to electrify than the south, since there are more mountains and a lower density of people. Hydropower is the major energy source in Lao PDR. It serves the main grid with electricity and constitutes more than 90% of the total energy in the country. The many rivers have a huge potential for increased hydropower production. The construction of Nam Theun 2 (1070 MW) started in January 2005 and the construction of Xe Kaman 3 (260 MW) started in April 2006. Lao PDR export a lot of electricity to Thailand, but the country also imports electricity to some districts that borders Vietnam, China and Thailand since this is more cost efficient than extending the own grid. For off grid electrification small - and micro hydropower plants play a major roll. Biomass is likely to contribute to the energy supply in the future since Lao have lots of empty land, which is not utilized in a good way. The RED started a survey for biomass one year ago and is trying to find donors for a demonstration project that could implement the ideas to the local people. Like many other countries Lao have potential for using solar cell systems. The disadvantages with solar cells are the installation cost and that it gives DC power instead of AC power. The power from the solar systems is good for light and for information technologies, radio and TV, but it is not functional for any income generating businesses. Biomass gives AC power which the people in the villages can use for businesses. In 1999 the MIH made a survey funded by the Japanese International Cooperation Agency (JICA) on all existing micro hydropower plants in Lao PDR. There are 38 existing plants (5-300 kW), of which 25 are broken. The reason why so many plants have broken down is that in the past the villages made the construction by themselves with second hand equipment from China. Many times the equipment did not fit for the site and after construction there was no money left for maintenance. The plants that are working are all in different conditions. The plants are designed to work well 80-90% of the time during a year. Since most of the plants are constructed with two units it is still possible to run the plant on half capacity in the dry season. Most of the plants have problem with the automatic speed governor and the operators have to regulate the speed of the turbine manually. Nam Mong micro hydropower plant in Luang-Phrabang province is the best working micro hydropower plant in Lao PDR and was built as a demonstration project with Australian donors.

83
Surveys have been made on 34 potential locations for small/micro hydropower plants (capacity: 50-2000 kW), of which 13 are more suitable and 21 less suitable, depending on the access possibilities. Reconstruction of broken plants is cheaper than installing new ones, but in districts where no plant already exist some new installations are required to meet the target of electrifying 90% of the population until 2020. When the reconstruction and installations of plants will be performed is difficult to tell since the projects are dependent on donors. Small hydropower plants are less cost effective than large plants since they do not give any direct income from power export. The government is nevertheless positive towards the use of micro hydropower since it gains many advantages in the community (education, health and security). But the budget for rural electrification is not so big because money is needed in other sectors as well, like for building roads, agriculture and forestry. The installation cost for a micro hydropower plant varies from 4000 USD per kW to more than 10 000 USD per kW. A good price is 4000-7000 USD per kW, an acceptable price is 7000-10 000 USD per kW and above 10 000 USD is expensive Before installing a new micro hydropower plant a socio- economic survey is performed. In Lao PDR, 47 districts of totally 141 districts are considered poor. The government can not give any subsides to poor district for electricity, but in general there are money to save for the villagers when they get access to electricity. Households without electricity needs to buy gasoline, diesel, candles, battery for the torch when they go hunting, battery for the radio etc which costs around 3 USD per month. Most of the households with electricity pay only 1-1.5 USD per month. The meter is free of charge for households connected to the EdL grid, but for off grid electricity the households need to pay for the meter themselves. The main disadvantage with micro hydropower is that it requires lots of work to maintenance the plant. The operators need experience to run the plant and micro hydropower are often situated in rural areas where people have very little or none education. It is also difficult to convince people in the villages to pay for the electricity when the water in the river is free of charge. Sometimes the household needs to help out with the maintenance work, for example cleaning the canal or the dam and afterward they do not want to pay for the electricity since they have already been working for it. It is important to have a clear organization so all parts know their responsibility. The consumers are responsible for paying on time, the operators are responsible for the maintenance of the plant and the district department of MIH should provide information and education to the operators. When a new plant has been designed, the villagers are tested on their knowledge of electricity. The villagers who are suitable as operators are invited to EdL training centre for a period of 1-2 months to learn the basic on electricity and mechanics. When the installation starts the operators take part in the construction work to learn about the equipment on site. The operators can in general handle small problems that occur at the plant, while in case of larger errors assistance might be needed from EdL. Many villages without access to electricity use small Pico plants (100-200W) for light. The transmission lines from the small units rarely have any isolation, which is very dangerous if someone would touch the cable. In the rainy season the Pico plants has to be removed from their sites, otherwise they will be carried away by a flood.

84
E. Hydrographs All hydrographs obtained from I. Araki (2005) and modified by authors. E.1 Calibration

85
E.2 Validation

86

87
F. Syntax F.1 Calibration F.1.1 Catchment_data Function [Rainfall,Temperature,Latitude,Catchment_area]= ...
catchment_data(w_row,w_column,row,column,ymin,ymax)
%[Rainfall,Temperature,Latitude,Catchment_area]=catchment_data(w_row,
%w_column,row,column,ymin,ymax)
%Function CATCHMENT_DATA calculates the mean rainfall, temperature
%and latitude and also the area of a certain catchment.
%The function takes in the position of the weir in the raster (w_row
%and w_column), the size of the raster (row, column) and the minimum
%and maximum latitude value of the raster (ymin and ymax).
%The function returns the catchments mean rainfall, temperature,
%latitude and also the total area of the catchment.
%Function was last updated by David Wårlind 2006-08-08 Lund Sweden.
%--------------------------------------------------------------------
%------- Start value for the different calibration locations --------
%--------------------------------------------------------------------
%[Rainfall,Temperature,Latitude,Catchment_area]=catchment_data(425,30
%4,499,454,21.53,21.76) Nam Boun 2
%[Rainfall,Temperature,Latitude,Catchment_area]=catchment_data(97,219
%,235,367,21.45,21.55) Nam Likna
%[Rainfall,Temperature,Latitude,Catchment_area]=catchment_data(718,34
%7,764,596,22.16,22.50) Nam Ou Neua
%[Rainfall,Temperature,Latitude,Catchment_area]=catchment_data(201,50
%0,328,641,20.29,22.40) Nam Sim
%[Rainfall,Temperature,Latitude,Catchment_area]=catchment_data(78,67,
%614,584,20.47,20.74) Nam Xeng
%--------------------------------------------------------------------
set(0,'RecursionLimit',1700)
time_start=clock;
prev_i=0;
prev_j=0;
[topo,climate]=read(row,column,ymin,ymax);
%--------------------------------------------------------------------
%------- Starts the recursion to find the catchment area ------------
%--------------------------------------------------------------------
[c_climate,c_lati,c_cell]=catch_slope(topo,climate,w_row, ...
w_column,row,column,prev_i,prev_j);
%--------------------------------------------------------------------
%--------------------------------------------------------------------
%------- Calculated the mean value of rainfall and temperature ------
%------- for the catchment area -------------------------------------
%--------------------------------------------------------------------
88
R=c_climate(1:12)/c_cell;
T=c_climate(13:24)/c_cell;
%--------------------------------------------------------------------
%--------------------------------------------------------------------
%------- Put the calculated data into new variables -----------------
%--------------------------------------------------------------------
for i=1:1:12
Rainfall(i)=R(1,1,i);
Temperature(i)=T(1,1,i);
end
%--------------------------------------------------------------------
Latitude=c_lati/c_cell;
Catchment_area = c_cell*50*50;
time=etime(clock, time_start)
end
F.1.2 Catch_slope function [c_climate,c_lati,c_cell]=catch_slope(topo,climate,i,j, ...
row,column,prev_i,prev_j)
%[c_climate,c_lati,c_cell]=catch_slope(topo,climate,i,j,row,column,pr
%ev_i,prev_j)
%Function CATCH_SLOPE examines which of the neighbouring cells that
%are sloping towards the present one.
%The function has topographic (topo) and climate (climate) data,
%present cell (i,j), the raster size (row and column) and the
%previous visited cell (prev_i and prev_j) as in data. topo should
%consists of slope direction (topo(:,:,1)), stream definition
%(topo(:,:,2)) and latitude (topo(:,:,3). climate should consist of
%rainfall for the 12 months in the first 12 layers (climate(:,:,1:12)
%and temperature in the next 12 layers (climate(:,:,13:24)).
%The function returns the present cells total catchment areas
%climate data as c_climate, latitude as c_lati and number of cells as
%c_cell.
%Function was last updated by David Wårlind 2006-08-08 Lund Sweden.
[s_c]=special_case(i,j,row,column);
cell=0;
lati=0;
clima=0;
%--------------------------------------------------------------------
%------- Find which neighbouring cells that are sloping towards -----
%------- the present one --------------------------------------------
%--------------------------------------------------------------------
for k=-1:1:1

89
for l=-1:1:1
if ((i+k~=prev_i & j+l~=prev_j))
if (k~=0 | l~=0)
c_cell=0;
if (k==-1 & l==-1 & (s_c==0 | s_c==4 | s_c==5 ...
| s_c==6))
if (topo(i+k,j+l,1)==2)
[c_climate,c_lati,c_cell]=catch_slope( ...
topo,climate,i+k,j+l,row,column,prev_i, ...
prev_j);
end
elseif (k==-1 & l==0 & (s_c~=1 & s_c~=2 & s_c~=3))
if (topo(i+k,j+l,1)==4)
[c_climate,c_lati,c_cell]=catch_slope( ...
topo,climate,i+k,j+l,row,column,prev_i, ...
prev_j);
end
elseif (k==-1 & l==1 & (s_c==0 | s_c==6 | s_c==7 ...
| s_c==8))
if (topo(i+k,j+l,1)==8)
[c_climate,c_lati,c_cell]=catch_slope( ...
topo,climate,i+k,j+l,row,column,prev_i, ...
prev_j);
end
elseif (k==0 & l==1 & (s_c~=3 & s_c~=4 & s_c~=5))
if (topo(i+k,j+l,1)==16)
[c_climate,c_lati,c_cell]=catch_slope( ...
topo,climate,i+k,j+l,row,column,prev_i, ...
prev_j);
end
elseif (k==1 & l==1 & (s_c==0 | s_c==1 | s_c==2 ...
| s_c==8))
if (topo(i+k,j+l,1)==32)
[c_climate,c_lati,c_cell]=catch_slope( ...
topo,climate,i+k,j+l,row,column,prev_i, ...
prev_j);
end
elseif (k==1 & l==0 & (s_c~=5 & s_c~=6 & s_c~=7))
if (topo(i+k,j+l,1)==64)
[c_climate,c_lati,c_cell]=catch_slope( ...

90
topo,climate,i+k,j+l,row,column,prev_i, ...
prev_j);
end
elseif (k==1 & l==-1 & (s_c==0 | s_c==2 | s_c==3 ...
| s_c==4))
if (topo(i+k,j+l,1)==128)
[c_climate,c_lati,c_cell]=catch_slope( ...
topo,climate,i+k,j+l,row,column,prev_i, ...
prev_j);
end
elseif (k==0 & l==-1 & (s_c~=1 & s_c~=7 & s_c~=8))
if (topo(i+k,j+l,1)==1)
[c_climate,c_lati,c_cell]=catch_slope( ...
topo,climate,i+k,j+l,row,column,prev_i, ...
prev_j);
end
end
if (c_cell~=0)
cell=cell+c_cell;
clima=clima+c_climate;
lati=lati+c_lati;
end
end
end
end
end
%--------------------------------------------------------------------
%--------------------------------------------------------------------
%------- Adds the present cells values ------------------------------
%--------------------------------------------------------------------
c_cell=cell+1;
c_lati=lati+topo(i,j,3);
c_climate=clima+climate(i,j,:);
%--------------------------------------------------------------------
end
F.1.3 Calibration Function [RV,R2,VE]=calibration(Rainfall,Temperature,Latitude, ...
Catchment_area,x1,x2)
%[RV,R2,VE]=calibration(Rainfall,Temperature,Latitude,Catchment_area,
%x1,x2)
%Function CALIBRATION calculates different standard evaluation
%variables for a given situation.

91
%The function has rainfall, temperature, latitude and catchment area
%of a certain number of catchments and the GR2M variables x1 and x2
%as in data. Rainfall and Temperature should be arrays with 12
%columns, one for each months mean value. Latitude should have the
%mean value for each catchment area. x1 and x2 should have one value
%each.
%The function returns the RV (Standard Criterion), R2 (Nashs
%Efficiency Criterion) and VE (Relative Volume Error).
%Function was last updated by David Wårlind 2006-08-11 Lund Sweden.
%--------------------------------------------------------------------
%--------------- Observed water flow --- Calibration ----------------
%--------------------------------------------------------------------
%Q_obs(1,:)=[3.14,7.10,14.8,20.26,20.32,7.09,5.01,2.32,2.51,2.17, ...
%1.92,2.59]; Nam Boun 2
%Q_obs(2,:)=[0.29,0.68,1.45,2.11,1.88,0.68,0.49,0.23,0.23,0.19, ...
%0.20,0.22]; Nam Likna
%Q_obs(3,:)=[6.03,14.39,29.09,42.92,39.02,14.12,9.8,4.41,4.77, ...
%3.94,3.64,4.99]; Nam Ou Neua
%Q_obs(4,:)=[1.86,4.66,9.3,14,12.18,4.55,3.13,1.31,1.45,1.16, ...
%1.09,1.53]; Nam Sim
%Q_obs(5,:)=[1.8,6.96,7.93,20.18,27.7,7.09,4.8,2.67,2.14,1.85, ...
%1.41,1.14]; Nam Xeng
%--------------------------------------------------------------------
%--------------------------------------------------------------------
%---------------- Observed water flow --- Verification --------------
%--------------------------------------------------------------------
Q_obs(1,:)=[0.025,0.093,0.096,0.249,0.319,0.084,0.060,0.033,0.027 ...
,0.024,0.019,0.015]; %Nam Chong
Q_obs(2,:)=[0.6,2.24,2.35,5.79,8.06,2.09,1.39,0.79,0.63,0.56,0.45 ...
,0.34]; %Nam Gnone
Q_obs(3,:)=[0.35,1.74,1.89,5.27,7.29,1.71,1.09,0.63,0.57,0.38,0.1 ...
,0.13]; %Nam Hat 2
Q_obs(4,:)=[1.05,3.22,3.3,8.08,11.08,3.16,2.16,1.51,1.24,1.11, ...
1.05,0.92]; %Nam Long
%--------------------------------------------------------------------
Days_of_month=[31,30,31,31,30,31,30,31,31,28.25,31,30];
%--------------------------------------------------------------------
%-------------- Calculates the monthly water flow -------------------
%--------------------------------------------------------------------
%for h=1:1:5
for h=1:1:4
s=0;
r=0;
for i=1:1:2
for j=1:1:12
[Q(j),s,r]=GR2M(Rainfall(h,:),Temperature(h,:), ...
Latitude(h),s,r,x1,x2,j);
end

92
end
Q_cali(h,:)=Q*Catchment_area(h)./(86400*Days_of_month*1000);
end
%--------------------------------------------------------------------
%--------------------------------------------------------------------
%------------- Calculates the objective functions -------------------
%--------------------------------------------------------------------
%for h=1:1:5
for h=1:1:4
a=0;
b=0;
c=0;
d=0;
for k=1:1:12
a=a+(log(Q_obs(h,k))-log(Q_cali(h,k)))^2;
b=b+(log(Q_obs(h,k))-log(mean(Q_obs(h,:))))^2;
c=c+Q_cali(h,k)-Q_obs(h,k);
d=d+Q_obs(h,k);
end
r2(h)=1-a/b;
ve(h)=c/d;
rv(h)=r2(h)-0.2*abs(ve(h));
end
%--------------------------------------------------------------------
%--------------------------------------------------------------------
%------- Takes the mean of all sites value of the objective ---------
%------- functions --------------------------------------------------
%--------------------------------------------------------------------
R2=mean(r2);
VE=mean(abs(ve));
RV=mean(rv);
%--------------------------------------------------------------------
End
F.1.4 X1_X2_test function [result]=x1_x2_test(Rainfall,Temperature,Latitude, ...
Catchment_area,x1_min,x1_max,x2_min,x2_max) %[result]=x1_x2_test(Rainfall,Temperature,Latitude,Catchment_area,x1_
%min,x1_max,x2_min,x2_max) %Function X1_X2_TEST tests which value of x1 and x2 that gives the
%best calibration fit. %The function has rainfall, temperature, latitude and catchment area

93
%of a certain number of catchments depending on the settings of
%function CALIBRATION as in data. Rainfall and Temperature should be %arrays with 12 columns, one for each months mean value, and a %certain number of rows depending on the settings of CALIBRATION. %Latitude and Catchment_area should have the mean value for each %catchment area. x1 and x2 min/max are the GR2M values that should %represent the range that should be investigated by the this
%function. %The function returns the result, which contains the RV (Standard %Criterion), R2 (Nashs Efficiency Criterion), VE (Relative Volume
%Error) for the specific x1 and x2 value. result is sorted so that %the last row has the highest value of RV. %Function was last updated by David Wårlind 2006-08-08 Lund Sweden.
%-------------------------------------------------------------------- %------- Determines the increment of X1 and X2 --------------------- %--------------------------------------------------------------------
step_x1=(x1_max-x1_min)/99; step_x2=(x2_max-x2_min)/99;
%--------------------------------------------------------------------
%-------------------------------------------------------------------- %------- Calculates the objective functions for all -----------------
%------- combinations of X1 and X2 --------------------------------- %--------------------------------------------------------------------
n=0;
for x1 = x1_min:step_x1:x1_max
for x2 = x2_min:step_x2:x2_max
[rv,r2,ve]=calibration(Rainfall,Temperature,Latitude, ...
Catchment_area,x1,x2);
n=n+1; result(n,1)=rv; result(n,2)=r2; result(n,3)=ve; result(n,4)=x1/1000; result(n,5)=x2; end end
%-------------------------------------------------------------------- result=sortrows(result);
end

94
F.2 Modelling New Sites F.2.1 New_mhpp function
[position,result]=new_mhpp(energy,efficiency,length,months,rows, ...
columns,ymin,ymax,lati_max,long_min)
%function [position,result]=new_mhpp(energy,efficiency,length,months,
%rows,columns,ymin,ymax,lati_max,long_min)
%Main function that models new micro hydro power positions.
%As in data it takes the minimum energy a site should give,
%efficiency of a plant, length of the canal, number of months
%included in the design flow calculation, rows and columns, minimum
%and maximum latitude in degrees and finally latitude maximum and
%longitude minimum in metres.
%As out data it returns two lists, the first one with the found
%locations and the second one with their attributes.
%Function was last updated by David Wårlind 2006-08-08 Lund Sweden.
%--------------------------------------------------------------------
%------- Initiate starting values -----------------------------------
%--------------------------------------------------------------------
set(0,'RecursionLimit',1700)
time=clock;
data(1)=0; %previous i
data(2)=0; %previous j
data(3)=rows;
data(4)=columns;
data(5)=energy;
data(6)=efficiency/100;
data(7)=length;
data(8)=months;
result=[];
%--------------------------------------------------------------------
[topo,climate]=read(data(3),data(4),ymin,ymax);
%--------------------------------------------------------------------
%------- Mark rivers with inflow from outside the examined area -----
%--------------------------------------------------------------------
for i=1:1:data(4)
if (topo(1,i,2)==1 & (topo(1,i,1)==1 | topo(1,i,1)==2 | ...
topo(1,i,1)==4 | topo(1,i,1)==8 | topo(1,i,1)==16))
[topo]=check_river(topo,1,i,data);
end
if (topo(data(3),i,2)==1 & (topo(1,i,1)==16 | topo(1,i,1)==32 ...
| topo(1,i,1)==64))
[topo]=check_river(topo,data(3),i,data);
end
end

95
for i=2:1:data(3)-1
if (topo(i,1,2)==1 & (topo(i,1,1)==1 | topo(i,1,1)==2 | ...
topo(i,1,1)==128))
[topo]=check_river(topo,i,1,data);
end
if (topo(i,data(4),2)==1 & (topo(1,i,1)==4 | topo(i,data(4), ...
1)==8 | topo(i,data(4),1)==16 | topo(1,i,1)==32 | ...
topo(1,i,1)==64))
[topo]=check_river(topo,i,data(4),data);
end
end
%--------------------------------------------------------------------
first_finished=etime(clock, time)
%--------------------------------------------------------------------
%------- Finds new positions for small micro hydro plants -----------
%--------------------------------------------------------------------
for i=1:1:data(4)
if (topo(1,i,2)==1 & (topo(1,i,1)==32 | topo(i,data(4),1)==64 ...
| topo(1,i,1)==128))
[result,topo,condition,c_climate,c_lati,c_cell]= ...
catch_slope(result,topo,climate,1,i,data);
end
if (topo(data(3),i,2)==1 & (topo(data(3),i,1)==2 | ...
topo(i,data(4),1)==4 | topo(1,i,1)==8))
[result,topo,condition,c_climate,c_lati,c_cell]= ...
catch_slope(result,topo,climate,data(3),i,data);
end
end
second_half=etime(clock, time)
for i=2:1:data(3)-1
if (topo(i,1,2)==1 & (topo(i,1,1)==8 | topo(i,data(4),1)==16 ...
| topo(1,i,1)==32))
[result,topo,condition,c_climate,c_lati,c_cell]= ...
catch_slope(result,topo,climate,i,1,data);
end
if (topo(i,data(4),2)==1 & (topo(i,data(4),1)==1 | ...
topo(i,data(4),1)==2 | topo(1,i,1)==128))
[result,topo,condition,c_climate,c_lati,c_cell]= ...
catch_slope(result,topo,climate,i,data(4),data);
end
end
%--------------------------------------------------------------------

96
%--------------------------------------------------------------------
%------- Fix the output data and exports it to excel ----------------
%--------------------------------------------------------------------
result=sortrows(result);
dim=size(result);
for i=1:1:dim(1)
position(i,1)=lati_max-result(i,5)*50+25;
position(i,2)=long_min+result(i,6)*50-25;
end
time_all=etime(clock, time)
xlswrite('new_mhpp', result, 1)
xlswrite('new_mhpp', position, 2)
%--------------------------------------------------------------------
end
F.2.2 Check_river function [topo]=check_river(topo,i,j,data)
%[topo]=check_river(topo,i,j,data)
%Marks rivers with inflow from outside the examined area.
%Takes Topo, current position and data as input.
%Returns an updated topo as output data.
%Function was last updated by David Wårlind 2006-08-08 Lund Sweden.
[s_c] = special_case(i,j,data(3),data(4));
%--------------------------------------------------------------------
%------- Find which neighbouring cells that are sloping towards -----
%------- the present one and is a river cell ------------------------
%--------------------------------------------------------------------
slope_dir=topo(i,j,1);
if (slope_dir==1 & (s_c~=3 & s_c~=4 & s_c~=5))
if (topo(i,j+1,5)~=1)
[topo]=check_river(topo,i,j+1,data);
end
elseif (slope_dir==2 & (s_c==0 | s_c==1 | s_c==2 | s_c==8))
if (topo(i+1,j+1,5)~=1)
[topo]=check_river(topo,i+1,j+1,data);
end
elseif (slope_dir==4 & (s_c~=5 & s_c~=6 & s_c~=7))
if (topo(i+1,j,5)~=1)

97
[topo]=check_river(topo,i+1,j,data);
end
elseif (slope_dir==8 & (s_c==0 | s_c==2 | s_c==3 | s_c==4))
if (topo(i+1,j-1,5)~=1)
[topo]=check_river(topo,i+1,j-1,data);
end
elseif (slope_dir==16 & (s_c~=1 & s_c~=7 & s_c~=8))
if (topo(i,j-1,5)~=1)
[topo]=check_river(topo,i,j-1,data);
end
elseif (slope_dir==32 & (s_c==0 | s_c==4 | s_c==5 | s_c==6))
if (topo(i-1,j-1,5)~=1)
[topo]=check_river(topo,i-1,j-1,data);
end
elseif (slope_dir==64 & (s_c~=1 & s_c~=2 & s_c~=3))
if (topo(i-1,j,5)~=1)
[topo]=check_river(topo,i-1,j,data);
end
elseif (slope_dir==128 & (s_c==0 | s_c==6 | s_c==7 | s_c==8))
if (topo(i-1,j+1,5)~=1)
[topo]=check_river(topo,i-1,j+1,data);
end
end
topo(i,j,5)=1;
%--------------------------------------------------------------------
end
F.2.3 Catch_slope function [result,topo,condition,c_climate,c_lati,c_cell]= ...
catch_slope(result,topo,climate,i,j,data)
%[result,topo,condition,c_climate,c_lati,c_cell]=catch_slope(result,t
%opo,climate,i,j,data)
%Function CATCH_SLOPE examines which of the neighboring cells that
%are sloping towards the present one.
%The function has topographic (topo) and climate (climate) data,
%present cell (i,j) and data, which contains the previous cell
%visited, the matrix dimensions, limiting energy level, efficiency,
%canal length, and design flow months, as in data. topo should
%consists of slope direction (topo(:,:,1)), stream definition
%(topo(:,:,2)), latitude (topo(:,:,3), elevation (topo(:,:,4)) and

98
%excluded streams (topo(:,:,5)). climate should consist of rainfall
%for the 12 months in the first 12 layers (climate(:,:,1:12) and
%temperature in the next 12 layers (climate(:,:,13:24)).
%The function returns the present cells total catchments areas
%climate data as c_climate, latitude as c_lati and number of cells as
%c_cell.
%Function was last updated by David Wårlind 2006-08-08 Lund Sweden.
%--------------------------------------------------------------------
%------- Initiate starting values -----------------------------------
%--------------------------------------------------------------------
condition=[];
[s_c] = special_case(i,j,data(3),data(4));
cell = 0;
clima = 0;
lati = 0;
prev_i = data(1);
prev_j = data(2);
data(1) = i;
data(2) = j;
%--------------------------------------------------------------------
%--------------------------------------------------------------------
%------- Find which neighbouring cells that are sloping towards -----
%------- the present one --------------------------------------------
%--------------------------------------------------------------------
for k=-1:1:1
for l=-1:1:1
if ((i+k~=prev_i | j+l~=prev_j))
if (k~=0 | l~=0)
c_cell = 0;
if (k==-1 & l==-1 & (s_c==0 | s_c==4 | s_c==5 | ...
s_c==6))
if (topo(i+k,j+l,1)==2)
if (topo(i,j,5)~=1 | topo(i+k,j+l,2)==1)
[result,topo,c_condition,c_climate, ...
c_lati,c_cell]=catch_slope(result, ...
topo,climate,i+k,j+l,data);
end
end
elseif (k==-1 & l==0 & (s_c~=1 & s_c~=2 & s_c~=3))
if (topo(i+k,j+l,1)==4)
if (topo(i,j,5)~=1 | topo(i+k,j+l,2)==1)

99
[result,topo,c_condition,c_climate, ...
c_lati,c_cell]=catch_slope(result, ...
topo,climate,i+k,j+l,data);
end
end
elseif (k==-1 & l==1 & (s_c==0 | s_c==6 | s_c==7 ...
| s_c==8))
if (topo(i+k,j+l,1)==8)
if (topo(i,j,5)~=1 | topo(i+k,j+l,2)==1)
[result,topo,c_condition,c_climate, ...
c_lati,c_cell]=catch_slope(result, ...
topo,climate,i+k,j+l,data);
end
end
elseif (k==0 & l==1 & (s_c~=3 & s_c~=4 & s_c~=5))
if (topo(i+k,j+l,1)==16)
if (topo(i,j,5)~=1 | topo(i+k,j+l,2)==1)
[result,topo,c_condition,c_climate, ...
c_lati,c_cell]=catch_slope(result, ...
topo,climate,i+k,j+l,data);
end
end
elseif (k==1 & l==1 & (s_c==0 | s_c==1 | s_c==2 ...
| s_c==8))
if (topo(i+k,j+l,1)==32)
if (topo(i,j,5)~=1 | topo(i+k,j+l,2)==1)
[result,topo,c_condition,c_climate, ...
c_lati,c_cell]=catch_slope(result, ...
topo,climate,i+k,j+l,data);
end
end
elseif (k==1 & l==0 & (s_c~=5 & s_c~=6 & s_c~=7))
if (topo(i+k,j+l,1)==64)
if (topo(i,j,5)~=1 | topo(i+k,j+l,2)==1)
[result,topo,c_condition,c_climate, ...
c_lati,c_cell]=catch_slope(result, ...
topo,climate,i+k,j+l,data);
end
end
elseif (k==1 & l==-1 & (s_c==0 | s_c==2 | s_c==3 ...
| s_c==4))
if (topo(i+k,j+l,1)==128)

100
if (topo(i,j,5)~=1 | topo(i+k,j+l,2)==1)
[result,topo,c_condition,c_climate, ...
c_lati,c_cell]=catch_slope(result, ...
topo,climate,i+k,j+l,data);
end
end
elseif (k==0 & l==-1 & (s_c~=1 & s_c~=7 & s_c~=8))
if (topo(i+k,j+l,1)==1)
if (topo(i,j,5)~=1 | topo(i+k,j+l,2)==1)
[result,topo,c_condition,c_climate, ...
c_lati,c_cell]=catch_slope(result, ...
topo,climate,i+k,j+l,data);
end
end
end
if (c_cell~=0 & topo(i,j,5)~=1)
cell=cell+c_cell;
clima=clima+c_climate;
lati=lati+c_lati;
n=size(c_condition);
if (n(1)>0)
m=size(condition);
condition(m(1)+1:m(1)+n(1),:,:)=c_condition;
end
end
end
end
end
end
%--------------------------------------------------------------------
%--------------------------------------------------------------------
%------- Adds the present cell value --------------------------------
%--------------------------------------------------------------------
c_cell=cell+1;
c_lati=lati+topo(i,j,3);
c_climate=clima+climate(i,j,:);
%--------------------------------------------------------------------
%--------------------------------------------------------------------
%------- If a river cell, calculate its suitability of having ------
%------- a micro hydropower plant -----------------------------------
%--------------------------------------------------------------------

101
if (topo(i,j,2)==1 & topo(i,j,5)~=1)
[result,condition]=get_suitability(result,condition,data,topo ...
,c_cell,c_lati,c_climate);
topo(i,j,2)=0;
end
%--------------------------------------------------------------------
end
F.2.4 Get_suitability
function [result,condition]=get_suitability(result,condition, ...
data,topo,c_cell,c_lati,c_climate,i,j)
%[result,condition]=get_suitability(result,condition,data,topo,c_cell
%,c_lati,c_climate,i,j)
%Function GET_SUITABILITY gets the suitability of having a powerhouse
%in the present cell and a weir some cells (data(7)) upstreams.
%The function has the result table (result), condition of upstream
%cells (condition), topography (topo), number of cells in the present
%cells catchment (c_cell), total latitude of catchment (c_lati),
%total temperature and precipitation of catchment (c_climate), and
%the location of the present cell (i,j) as in data.
%As out data the new result and condition tables are returned.
%Function was last updated by David Wårlind 2006-08-08 Lund Sweden.
r_dim=size(result);
c_dim=size(condition);
%--------------------------------------------------------------------
%------- Calculates the head and generated power of sites -----------
%------- with canals ending at this position -----------------------
%--------------------------------------------------------------------
if (c_dim(1)>0)
for i=1:1:c_dim(1)
if(condition(i,1,1) > 0)
head=condition(i,1,2)-topo(data(1),data(2),4);
power=9.81*data(6)*condition(i,1,1)*head; %power in kW
if (power >= data(5))
result(r_dim(1)+1,:)=[power,condition(i,1,1), ...
head,condition(i,1,3),condition(i,1,4), ...
condition(i,1,5)];
end
end
end
for i=1:1:data(7)-1
condition(:,i,:)=condition(:,i+1,:);

102
end
end
%--------------------------------------------------------------------
%------- Calculates this sites characteristic ----------------------
%--------------------------------------------------------------------
Q=get_river_flow(c_cell,c_lati,c_climate); Q=sort(Q); Design_flow=mean(Q(1:data(8))); catchment_area=c_cell*0.0025;
condition(1,data(7),:)=[Design_flow,topo(data(1),data(2),4), ...
catchment_area,data(1),data(2)];
if (c_dim(1) > 1)
condition(2:c_dim(1),data(7),:)=0;
for i=c_dim(1):-1:2
if (condition(i,:,1)==0)
condition(i,:,:)=[]; end end end
%--------------------------------------------------------------------
end
F.2.5 Get_river_flow
function [Q]=get_river_flow(cell,lati,climate)
%[Q]=get_river_flow(cell,lati,climate)
%Funtion Get_river_flow generates the present river cells monthly
%mean water flow.
%The function has number of cells in the present cells catchment
%(cell), total latitude of catchment (lati), and all the climate data
%(climate) as in data.
%Returns the river flow as output data.
%Function was last updated by David Wårlind 2006-08-08 Lund Sweden.
Days_of_month=[31,28.25,31,30,31,30,31,31,30,31,30,31];
s=0;
r=0;
lati=lati/cell;
climate=climate./cell;
%--------------------------------------------------------------------
%------- Calculates the river flow [mm at a point for whole month ---
%--------------------------------------------------------------------
for i=1:1:2
for j=1:1:12

103
[Q(j),s,r] = GR2M(climate(1:12),climate(13:24),lati,s,r,j);
end
end
%--------------------------------------------------------------------
%--------------------------------------------------------------------
%------- Calculates the real river flow [m3/s] ----------------------
%--------------------------------------------------------------------
Q=Q*cell*2500./(86400*Days_of_month*1000);
%--------------------------------------------------------------------
end
F.3 Both F.3.1 Read function [topo,climate]=read(row,column,ymin,ymax)
%[topo,climate]=read(row,column,ymin,ymax)
%Function READ reads all data that is needed.
%The function has the raster dimension (row and column) and the
%minimum and maximum latitude of the raster (ymin and ymax) as indata
%The function returns the topographic data as topo and the climate
%data as climate.
%Function was last updated by David Wårlind 2006-08-08 Lund Sweden.
%--------------------------------------------------------------------
%------------- Topography -------------------------------------------
%--------------------------------------------------------------------
fin=fopen( 'slope.flt','r');
slope = fread(fin,[column row],'float32');
fclose(fin);
topo(:,:,1) = slope';
fin=fopen( 'stream.flt','r');
stream = fread(fin,[column row],'float32');
fclose(fin);
topo(:,:,2) = stream';
topo(:,:,3)=lati(row,column,ymin,ymax);
fin=fopen( 'elevation.flt','r');
elev = fread(fin,[column row],'float32');
fclose(fin);
topo(:,:,4) = elev';
topo(:,:,5) = zeros(row,column);
%--------------------------------------------------------------------
%------------- Rainfall ---------------------------------------------
%--------------------------------------------------------------------
fin=fopen( 'rain_1.flt','r');
rain = fread(fin,[column row],'float32');

104
fclose(fin);
climate(:,:,1) = rain';
fin=fopen( 'rain_2.flt','r');
rain = fread(fin,[column row],'float32');
fclose(fin);
climate(:,:,2) = rain';
fin=fopen( 'rain_3.flt','r');
rain = fread(fin,[column row],'float32');
fclose(fin);
climate(:,:,3) = rain';
fin=fopen( 'rain_4.flt','r');
rain = fread(fin,[column row],'float32');
fclose(fin);
climate(:,:,4) = rain';
fin=fopen( 'rain_5.flt','r');
rain = fread(fin,[column row],'float32');
fclose(fin);
climate(:,:,5) = rain';
fin=fopen( 'rain_6.flt','r');
rain = fread(fin,[column row],'float32');
fclose(fin);
climate(:,:,6) = rain';
fin=fopen( 'rain_7.flt','r');
rain = fread(fin,[column row],'float32');
fclose(fin);
climate(:,:,7) = rain';
fin=fopen( 'rain_8.flt','r');
rain = fread(fin,[column row],'float32');
fclose(fin);
climate(:,:,8) = rain';
fin=fopen( 'rain_9.flt','r');
rain = fread(fin,[column row],'float32');
fclose(fin);
climate(:,:,9) = rain';
fin=fopen( 'rain_10.flt','r');
rain = fread(fin,[column row],'float32');
fclose(fin);
climate(:,:,10) = rain';
fin=fopen( 'rain_11.flt','r');
rain = fread(fin,[column row],'float32');
fclose(fin);
climate(:,:,11) = rain';
fin=fopen( 'rain_12.flt','r');
rain = fread(fin,[column row],'float32');
fclose(fin);
climate(:,:,12) = rain';
%--------------------------------------------------------------------
%------------- Temperature ------------------------------------------
%--------------------------------------------------------------------

105
fin=fopen( 'temp_1.flt','r');
temp = fread(fin,[column row],'float32');
fclose(fin);
climate(:,:,13) = temp';
fin=fopen( 'temp_2.flt','r');
temp = fread(fin,[column row],'float32');
fclose(fin);
climate(:,:,14) = temp';
fin=fopen( 'temp_3.flt','r');
temp = fread(fin,[column row],'float32');
fclose(fin);
climate(:,:,15) = temp';
fin=fopen( 'temp_4.flt','r');
temp = fread(fin,[column row],'float32');
fclose(fin);
climate(:,:,16) = temp';
fin=fopen( 'temp_5.flt','r');
temp = fread(fin,[column row],'float32');
fclose(fin);
climate(:,:,17) = temp';
fin=fopen( 'temp_6.flt','r');
temp = fread(fin,[column row],'float32');
fclose(fin);
climate(:,:,18) = temp';
fin=fopen( 'temp_7.flt','r');
temp = fread(fin,[column row],'float32');
fclose(fin);
climate(:,:,19) = temp';
fin=fopen( 'temp_8.flt','r');
temp = fread(fin,[column row],'float32');
fclose(fin);
climate(:,:,20) = temp';
fin=fopen( 'temp_9.flt','r');
temp = fread(fin,[column row],'float32');
fclose(fin);
climate(:,:,21) = temp';
fin=fopen( 'temp_10.flt','r');
temp = fread(fin,[column row],'float32');
fclose(fin);
climate(:,:,22) = temp';
fin=fopen( 'temp_11.flt','r');
temp = fread(fin,[column row],'float32');
fclose(fin);
climate(:,:,23) = temp';
fin=fopen( 'temp_12.flt','r');
temp = fread(fin,[column row],'float32');
fclose(fin);
climate(:,:,24) = temp';
end

106
F.3.2 Lati function [c_lati]=lati(row,column,ymin,ymax)
%[c_lati]=lati(row,column,ymin,ymax)
%Function LATI calculates the latitude for every cell in the topo and
%climate raster that is considered.
%The function has the dimensions of the raster (row and column) and
%the latitude maximum and minimum of the raster (ymax and ymin) as in
%data.
%The function returns the latitude raster c_lati.
%Function was last updated by David Wårlind 2006-08-08 Lund Sweden.
c_lati = zeros(row,column);
c_lati(1,:) = ymax;
temp_lati = ymax;
step = (ymax-ymin)/(row-1);
for i=2:1:row
temp_lati = temp_lati - step;
c_lati(i,:) = temp_lati;
end
end
F.3.3 GR2M function [Q,S,R]=GR2M(Rainfall,Temperature,Latitude,S,R,X1,X2,month)
%[Q,S,R] = GR2M(Rainfall,Temperature,Latitude,S,R,X1,X2,month)
%Function GR2M calculates with the help of rainfall, temperature and
%latitude the monthly water flow at a certain position in a river.
%The function has rainfall and temperature of twelve months, the mean
%latitude of the catchment area, the S and R values in the beginning
%of the month, the X1 and X2 values and which month it is as in data.
%The function returns Q (water flow), S and R.
%Function was last updated by David Wårlind 2006-08-08 Lund Sweden.
%--------------------------------------------------------------------
% This is the Calibration version. In the Program version x1 and x2
%are defined as their calibrated values. ----------------------------
%--------------------------------------------------------------------
Fi=tanh(Rainfall(month)/X1);
S1=(S+X1*Fi)/(1+S/X1);
P1=Rainfall(month)+S-S1;
E=pot_eva(Temperature,Latitude,month);
Psi=tanh(E/X1);
S2=S1*(1-Psi)/(1+Psi*(1-S1/X1));
S=S2/(1+(S2/X1)^3)^(1/3);
P2=S2-S;
107
P3=P1+P2;
R1=R+P3;
R2=X2*R1;
Q=(R2^2)/(R2+60);
R=R2-Q;
end
F.3.4 Pot_eva function [PE]=pot_eva(Temperature,Latitude,month)
%[PE]=pot_eva(Temperature,Latitude,month)
%Function POT_EVA calculates the potential evaporation with the help
%of the McGuinness-Bordne method. This method uses temperature and
%latitude to generate PE.
%The function has Temperature which is the temperature for all %12
months, latitude and which month it is as in data.
%The function returns the potential evaporation PE.
%Function was last updated by David Wårlind 2006-08-08 Lund Sweden.
%--------------------------------------------------------------------
%------- Month specific parameters (Set for calibration) ------------
%--------------------------------------------------------------------
Julian_day=[136,167,197,228,259,289,320,350,15,46,75,106];
Days_of_month=[31,30,31,31,30,31,30,31,31,28.25,31,30];
%Julian_day=[15,46,75,106,136,167,197,228,259,289,320,350];
%Days_of_month=[31,28.25,31,30,31,30,31,31,30,31,30,31];
%--------------------------------------------------------------------
%------- Calculation of Potential Evaporation -----------------------
%--------------------------------------------------------------------
Fi=pi/180*Latitude;
d=0.409*sin((2*pi/365)*Julian_day(month)-1.39);
dr=1+0.033*cos((2*pi/365)*Julian_day(month));
ws=acos(-tan(Fi)*tan(d));
S0=15.392*dr*(ws*sin(Fi)*sin(d)+cos(Fi)*cos(d)*sin(ws));
PE=(S0*(Temperature(month)+5)/68)*Days_of_month(month);
%--------------------------------------------------------------------
end