Embed Size (px)
Citation preview

Pico and Micro Hydropower in Remote Areas of Mozambique An Assessment of the Potential for Rural Electrification
Master of Science Thesis in the Master Degree Programmes:
Electric Power Engineering
Industrial Ecology – for a sustainable society
KAJSA GREGER
SARA MAGNUSSON
Department of Energy and Environment
Division of Environmental System Analysis
CHALMERS UNIVERSITY OF TECHNOLOGY
Göteborg, Sweden, 2012
Report No. 2012:20
ISSN No. 1404-8167


Pico and Micro Hydropower in Remote Areas of Mozambique
An Assessment of the Potential for Rural Electrification
KAJSA GREGER
SARA MAGNUSSON
Department of Energy and Environment
Division of Environmental System Analysis
CHALMERS UNIVERSITY OF TECHNOLOGY
Göteborg, Sweden, 2012

Pico and Micro Hydropower in Remote Areas of Mozambique
An Assessment of the Potential for Rural Electrification
KAJSA GREGER & SARA MAGNUSSON
© KAJSA GREGER & SARA MAGNUSSON, 2012.
Report No. 2012:20
ISSN No. 1404-8167
Department of Energy and Environment
Chalmers University of Technology
SE-412 96 Göteborg
Sweden
Telephone + 46 (0)31-772 1000
Cover:
A micro hydro turbine manufactured in Chimoio, Manica province.
Göteborg, Sweden 2012

AbstractMozambique is a developing country situated on the south-eastern coast of Africa. The poverty level ishigh, although the last years have shown a high economic growth rate. The country has low populationdensity with 60% of the population living in rural areas. Only 6.3% of the rural population have access toelectricity, a service considered crucial for poverty reduction by the World Bank. Extending the nationalmain grid is a time-consuming process, which suggests studies of o�-grid electri�cation possibilities. Theuse of pico and micro hydropower for rural electri�cation in other countries has shown it is the o�-gridalternative with the lowest cost, although the site speci�c design might pose a barrier. This reportinvestigates the potential for pico and micro hydropower to be used for rural electri�cation in remoteareas of Mozambique.The potential of the technology is evaluated in two di�erent aspects. A mapping of barriers to picoand micro hydro is done by conducting interviews with stakeholders in Mozambique. The interviews aresemi-structured and designed to �nd the opinions on barriers and ways to overcome barriers. As a secondaspect, the potential of available technology, estimated topography and water resources is evaluatedfor two turbines of di�erent functionality and size in four Mozambican provinces, using a model withprecipitation data and turbine ratings. The turbines are Pelton 50 kW and Cross�ow 3 kW, both locallymanufactured in Chimoio, Mozambique.The interview results show that stakeholders in Mozambique �nd three barriers especially important.These are Lack of access to �nance, Lack of proper maintenance and Poor knowledge management. Waysof overcoming these barriers are to increase the investors interest by enabling future connection to themain grid and by displaying and promoting functional cases, to increase local involvement and capacitatelocal companies, and to involve universities, improve documentation of projects and do study visits tofunctioning schemes. The model results show a high dependance of the water �ow in the rivers, and alimited capacity to cover large loads throughout the year. The smaller Cross�ow turbine, which in thiscase is also suitable for low heads, shows potential to be a good complement to the larger Pelton turbine.

AcknowledgmentsTo work with this thesis has been an amazing experience. We are deeply grateful to the people andorganizations that have made it possible. For �nancing the �eld trip to Mozambique we would like togive thanks to the Swedish International Development Cooperation Agency, SIDA, Stiftelsen Chalmerstekniska högskola, and Sveriges Ingenjörer. For a warm welcome to Maputo and valuable help in arrang-ing meetings with stakeholders, we thank Prof. Boaventura Chongo Cuamba at Universidade EduardoMondlane. We direct many thanks to Mr. Jan Cloin for several lunch meetings, friendly advise and help-ful discussions. We also thank Andreas Røsberg for good company and cooperation during the interviewsin Maputo. For helping us with practical issues and being very good friends in Maputo we send love andgratitude to Maud, Joan, Léa, Thibaud and Arsénio. To all respondents we send deep thanks for givingus their time and e�ort, and a special thanks to the helpful people at GIZ, FUNAE and AKSM whotook us out to their sites, showed us schemes and introduced us to community members. For inspiringdiscussions and sharing his experience of similar projects we would like to send a great thank you to CarlKarheiding.Our three supervisors have been very helpful and supportive during the whole project. Thanks toOla Carlson for answering questions and providing expertise in electric power engineering. Thanks toHelene Ahlborg for facilitating the interview process by providing invaluable method knowledge, and proofreading with great feed back. And many thanks to Linus Hammar for support, ideas and inspiration onall levels, both in Sweden and Mozambique.Also thanks to Jimmy Ehnberg who gave feed back and good ideas on the model and thanks to ourexaminer Sverker Molander.
iv

Abbreviations and acronymsAKSM Associaçao Kwaedza Simukai ManicaDPREME Provincial Directorates of Mineral and Energy ResourcesEDENR Strategy for New and Renewable Energy Development (Mozambican strategy document)EdM Electricidade de Moçambique (National electricity utility)ELC Electric Load ControllerFAO Food and Agriculture Organization of the United NationsFUNAE Fundo de Energia (National energy fund)GIS Geographical Information SystemGIZ Deutsche Gesellschaft für Internationale ZusammenarbeitHCB Hidroelectrica de Cahora Bassa (Cahora Bassa Hydroelectricity Plant)INAM Instituto Nacional de MeteorologiaIRENA International Renewable Energy AgencyIRES Integrated Renewable Energy SystemsJFM January, February and MarchkW kilowattLCREP Low Cost Rural Electri�cation PlanMoE Ministry of EnergyMW megawattNGO Non Governmental OrganizationOND October, November and DecemberSIDA Swedish International Development Cooperation AgencyUNDP United Nations Development ProgrammeWB World Bank
v

Contents1 Introduction 11.1 Aim . . . . . . . . . . . . . . . . . . . . . . . . . . . . . . . . . . . . . . . . . . . . . . . . 21.1.1 Stakeholders' opinions . . . . . . . . . . . . . . . . . . . . . . . . . . . . . . . . . . 21.1.2 Technological and resource potential . . . . . . . . . . . . . . . . . . . . . . . . . . 21.1.3 Scope . . . . . . . . . . . . . . . . . . . . . . . . . . . . . . . . . . . . . . . . . . . 22 Background 42.1 Bene�ts of rural electri�cation . . . . . . . . . . . . . . . . . . . . . . . . . . . . . . . . . . 42.2 Pico and micro hydropower development in Asia and Africa . . . . . . . . . . . . . . . . 42.3 Mozambique - History and power sector development . . . . . . . . . . . . . . . . . . . . . 52.3.1 History . . . . . . . . . . . . . . . . . . . . . . . . . . . . . . . . . . . . . . . . . . 52.3.2 Power sector development . . . . . . . . . . . . . . . . . . . . . . . . . . . . . . . . 62.3.3 Rural electri�cation in Mozambique . . . . . . . . . . . . . . . . . . . . . . . . . . 62.3.4 Pico and micro hydropower in Mozambique . . . . . . . . . . . . . . . . . . . . . . 63 Theory 83.1 Pico and micro hydropower . . . . . . . . . . . . . . . . . . . . . . . . . . . . . . . . . . . 83.1.1 Hydropower equipment . . . . . . . . . . . . . . . . . . . . . . . . . . . . . . . . . 93.2 Electro-mechanical equipment . . . . . . . . . . . . . . . . . . . . . . . . . . . . . . . . . . 93.2.1 Turbines . . . . . . . . . . . . . . . . . . . . . . . . . . . . . . . . . . . . . . . . . 93.2.2 Generators . . . . . . . . . . . . . . . . . . . . . . . . . . . . . . . . . . . . . . . . 123.3 Barriers to pico and micro hydropower from literature . . . . . . . . . . . . . . . . . . . . 123.4 Ownership models . . . . . . . . . . . . . . . . . . . . . . . . . . . . . . . . . . . . . . . . 143.5 Payment models . . . . . . . . . . . . . . . . . . . . . . . . . . . . . . . . . . . . . . . . . 143.6 Demography . . . . . . . . . . . . . . . . . . . . . . . . . . . . . . . . . . . . . . . . . . . 154 Method 174.1 Method for analysis of stakeholders' opinions . . . . . . . . . . . . . . . . . . . . . . . . . 174.1.1 Selection of interview topics . . . . . . . . . . . . . . . . . . . . . . . . . . . . . . . 174.1.2 Selection of respondents . . . . . . . . . . . . . . . . . . . . . . . . . . . . . . . . . 184.1.3 Conducting the interviews . . . . . . . . . . . . . . . . . . . . . . . . . . . . . . . . 184.1.4 Data condensation and analysis . . . . . . . . . . . . . . . . . . . . . . . . . . . . . 194.2 Method for analysis of technological and resource potential . . . . . . . . . . . . . . . . . 224.2.1 Data used in model . . . . . . . . . . . . . . . . . . . . . . . . . . . . . . . . . . . 224.2.2 Selection of designs . . . . . . . . . . . . . . . . . . . . . . . . . . . . . . . . . . . . 234.2.3 Field surveys . . . . . . . . . . . . . . . . . . . . . . . . . . . . . . . . . . . . . . . 234.2.4 Modeling . . . . . . . . . . . . . . . . . . . . . . . . . . . . . . . . . . . . . . . . . 254.2.5 Load pro�les . . . . . . . . . . . . . . . . . . . . . . . . . . . . . . . . . . . . . . . 274.2.6 Cost estimation . . . . . . . . . . . . . . . . . . . . . . . . . . . . . . . . . . . . . . 284.2.7 Extrapolation of data . . . . . . . . . . . . . . . . . . . . . . . . . . . . . . . . . . 304.2.8 Assumptions and limitations . . . . . . . . . . . . . . . . . . . . . . . . . . . . . . 304.2.9 Analysis . . . . . . . . . . . . . . . . . . . . . . . . . . . . . . . . . . . . . . . . . . 31
vi

5 Results 325.1 Barriers to pico and micro hydropower from interviews . . . . . . . . . . . . . . . . . . . . 325.1.1 Availability of equipment . . . . . . . . . . . . . . . . . . . . . . . . . . . . . . . . 325.1.2 Community relations . . . . . . . . . . . . . . . . . . . . . . . . . . . . . . . . . . 335.1.3 Data and measurements . . . . . . . . . . . . . . . . . . . . . . . . . . . . . . . . 345.1.4 Demand . . . . . . . . . . . . . . . . . . . . . . . . . . . . . . . . . . . . . . . . . . 355.1.5 Design . . . . . . . . . . . . . . . . . . . . . . . . . . . . . . . . . . . . . . . . . . 365.1.6 Finance . . . . . . . . . . . . . . . . . . . . . . . . . . . . . . . . . . . . . . . . . . 385.1.7 Knowledge and education . . . . . . . . . . . . . . . . . . . . . . . . . . . . . . . . 395.1.8 Legislation . . . . . . . . . . . . . . . . . . . . . . . . . . . . . . . . . . . . . . . . 415.1.9 Payment . . . . . . . . . . . . . . . . . . . . . . . . . . . . . . . . . . . . . . . . . 425.1.10 Project administration . . . . . . . . . . . . . . . . . . . . . . . . . . . . . . . . . 435.1.11 Resources . . . . . . . . . . . . . . . . . . . . . . . . . . . . . . . . . . . . . . . . . 445.1.12 Main challenges . . . . . . . . . . . . . . . . . . . . . . . . . . . . . . . . . . . . . 455.2 Technological and resource potential model . . . . . . . . . . . . . . . . . . . . . . . . . . 465.2.1 Province characteristics . . . . . . . . . . . . . . . . . . . . . . . . . . . . . . . . . 465.2.2 Reliability of water resources . . . . . . . . . . . . . . . . . . . . . . . . . . . . . . 475.2.3 Installation cost . . . . . . . . . . . . . . . . . . . . . . . . . . . . . . . . . . . . . 495.2.4 Validation of system power output . . . . . . . . . . . . . . . . . . . . . . . . . . . 525.2.5 Sensitivity analysis . . . . . . . . . . . . . . . . . . . . . . . . . . . . . . . . . . . . 526 Analysis 546.1 Barriers to pico and micro hydropower . . . . . . . . . . . . . . . . . . . . . . . . . . . . . 546.1.1 Main barriers and most mentioned barriers . . . . . . . . . . . . . . . . . . . . . . 546.1.2 Less mentioned barriers . . . . . . . . . . . . . . . . . . . . . . . . . . . . . . . . . 586.2 Technological and resource potential model . . . . . . . . . . . . . . . . . . . . . . . . . . 596.2.1 Pelton turbine . . . . . . . . . . . . . . . . . . . . . . . . . . . . . . . . . . . . . . 596.2.2 Cross�ow turbine . . . . . . . . . . . . . . . . . . . . . . . . . . . . . . . . . . . . . 596.2.3 Comparison of the two turbines . . . . . . . . . . . . . . . . . . . . . . . . . . . . . 596.2.4 Installation cost . . . . . . . . . . . . . . . . . . . . . . . . . . . . . . . . . . . . . 597 Discussion 618 Conclusion 63A Interview guide - FUNAE B 68B Interview coding 72C Applications for all load pro�les 73D Site characteristics and �ow variation curves 74E Barriers - all respondents 76
vii

Chapter 1IntroductionA life without access to electricity is the reality of more than 1.5 billion people in the world (WB, 2008).Access to modern energy is crucial for economic development and world poverty reduction (WB, 2009).Among the countries with the most alarming rates of rural electri�cation is Mozambique, situated inSoutheast Africa (Gaul et al., 2010).To improve access to electricity in a country like Mozambique is far from easy. The country is vastwith a low population density where a large share of the population resides in isolated communitiesfar from the national electricity network. This makes it costly to extend the national grid, the mainapproach to increase access to electricity today (SIDA, 2011). Recently, the Mozambican government hasbecome aware of the importance of introducing o�-grid electri�cation as a complement to extension ofthe national grid (MoE, 2011).O�-grid electri�cation is de�ned as electricity generated in separate systems for each household orin a power station connected to a local stand-alone grid, isolated from the national grid (Kaundinyaet al., 2009). Most common technology options available for o�-grid electri�cation are diesel generatorschemes, solar photo-voltaic systems (solar PVs) and pico and micro hydropower stations (WB, 2008).Previous Mozambican rural electri�cation programmes have included installation of solar PVs and dieselgenerator schemes for o�-grid use. Even though pico and micro hydropower has been used historicallyin the country, both to run grinding mills and to support tea plantation areas in Zambézia province(Chambal, 2010), today it remains a relatively untapped resource. Reports state that Mozambique hassigni�cant hydro resources both for large scale on-grid application and small scale o�-grid application(IRENA, 2012a; Gaul et al., 2010; Chambal, 2010; MoE, 2011) and new governmental strategies forrenewable energy are set up to support use of pico and micro hydro (MoE, 2011).Pico and micro hydropower technologies have di�erent ranges of power output. The de�nition ofthe limits vary in literature, but the most common de�nition is that power stations with power outputsbetween 10 - 100 kW are called micro hydro (WB, 2008) and power outputs below 10 kW are called picohydro (Maher et al, 2003). In this study these de�nitions will be used.There are many advantages with pico and micro hydropower. Out of the possible alternatives for o�grid electri�cation, the World Bank Energy Unit states that pico hydropower technology is likely to havethe lowest cost (WB, 2008). The environmental impact is low, especially in the schemes where thereis no dam. The high capacity of pico and micro hydropower, in comparison with the capacity of solarpower systems, is an advantage since it facilitates productive use1. For electri�cation of rural areas toresult in productive use, it is a great advantage that the power has no fuel costs. In comparison, dieselgenerator schemes, with high cost of fuel, often run for only short times during the evenings which limitsthe potential of the electricity to contribute to productive use (Williams, 2009).Apart from barriers for rural electri�cation in general, like the lack of access to spare parts, pico andmicro hydropower have distinctive barriers to face. The technology is very site speci�c. The water �owand fall, the topography and soil around the scheme, and other altering parameters a�ect the design(Penche 1998/2004). This is less so for pico turbines, which are often made in standard sizes (Williams,2007). The use of an electricity grid often requires community cooperation, which is not the case withfor instance keeping solar panels on each house since there is no need for a grid at all. Nevertheless,there are other drawbacks with solar home systems. In Kenya, expensive solar panel systems have ledconsumers to buy non matching components piece by piece, which reduces the quality and capacity of1The concept productive use is described as the application of electricity to create goods and services directly or indirectlyfor the production of income or value, for example milling, water pumping or cotton production (EdM, 2007).1

systems (Williams, 2009).The urgent need of electricity in larger parts of Mozambique, in combination with problems withcurrently used power systems, encourage studies of alternative solutions like pico and micro hydropower.The need for community cooperation and site speci�c design may turn out to be crucial disadvantages forthe technology. But the apparent availability of hydro resources indicates a high potential, as well as thelow cost, the simplicity of the system, the absence of fuel cost, the high capacity and the low environmentalimpact. Understanding the potential for pico and micro hydropower in Mozambique would be of greatimportance for rural electri�cation, and by extension also for the economic development of the country.1.1 AimThe aim of the study presented in this report is to investigate the potential for utilizing pico and microhydropower to boost electri�cation in remote areas in Mozambique.The potential will be investigated in terms of stakeholders' opinions on the barriers to, and possiblesolutions for pico and micro hydropower development, and also the potential for di�erent provinces, basedon geographical, technological and demographical factors. The site speci�c design of hydropower requiresmapping of potential sites and yearly measurements of river �ow to conclude exact numbers of totalavailable capacity. Since very little data exists, the potential will be investigated through a model basedon available data and estimations. The three research questions presented below, will be answered inorder to reach the aim.1.1.1 Stakeholders' opinionsStakeholders' perception of a technology and its barriers is a good measurement of the potential of thetechnology (Mikkelsen, 2005). Stakeholders are the actors expected to implement, promote and investin the technology and to show what barriers they recognize and which of them they consider crucial canbe of good help to understand future development of the technology. A comparison of barriers can bemade with earlier hydropower projects as well as with barriers for other technologies. Mapping of barriersand the possibilities to overcome them can give an indication on what the future possibilities are for thetechnology. Based on this the �rst two research questions are de�ned as:� What are the stakeholders' opinions on existing barriers for utilizing pico and micro hydropower inrural Mozambique?� What are the stakeholders' opinions on the possibility to overcome these barriers?1.1.2 Technological and resource potentialA third research question was de�ned to evaluate the potential of pico and micro hydropower from aresource perspective. The design of a hydropower scheme is in�uenced by several factors. There needsto be a river with enough capacity to support the demand. There needs to be technology suitable togenerate electricity as e�ciently as possible. And the electri�ed community needs to be structured in away that makes electricity distribution feasible. The third research question is de�ned as:� What is the potential of pico and micro hydropower in Mozambique, based on geographical, tech-nological and demographical factors?Here, �geographical factors� are de�ned as hydrological and topographical characteristics of Mozambique(meaning head and �ow of di�erent sites within the country). In focus for investigating the technologicalfactors is choice of turbine, which in�uences constraints for capacity, cost and head/�ow. Demographicalfactors are estimations of di�erent village sizes and load curves, which in�uences constraints for capacityand cost. What relevance the answers to the questions above hold in a long term perspective will bediscussed.1.1.3 ScopeThis subsection presents the decided delimitations for this report. Concerning the research questionsrelated to the stakeholders' opinions, the spatial delimitations are set to Mozambique. The respondentsare asked to answer only for opinions regarding pico and micro hydro in Mozambique. For the thirdquestion the report is spatially limited to provinces regarded by the respondents as likely to have a high2

potential for pico and micro hydro. These are Niassa, Zambézia, Tete and Manica provinces. Spatialdelimitations are also set to areas with no plans of getting connected to the main grid within at least 5years.Two di�erent capacity ranges are de�ned, one to answer the research questions related to stakeholders'opinions and one for evaluation of system design factors. Due to varying level of knowledge of pico andmicro hydro the interviews cover opinions of systems up to 1 MW. It should be kept in mind that systemswith a capacity this high di�ers signi�cantly from pico systems, but since many respondents do not havepersonal knowledge of smaller systems, their opinions on larger sizes are still considered relevant. Thesecond range is de�ned as 3 kW/50 kW based on the capacity of turbines currently manufactured inMozambique.The environmental aspects will not be in focus in this report. No conclusions will be based onenvironmental issues related to pico and micro hydro, since they are considered small (Penche, 1998/2004).Entities considered to be stakeholders are FUNAE, EdM, Ministry of Energy, donors, NGOs, privatesector actors and consumers of electricity.The report is divided into eight chapters. The background chapter gives an overview of known bene�tsof rural electri�cation from a hydro energy perspective. It presents examples of how pico and microhydropower have been used as a means for rural electri�cation in other developing countries. Given thisthe power sector of Mozambique is described. The Theory chapter gives a thorough description on thepico and micro hydropower technology. It also gives a summary and de�nition of themes of barriers todevelopment of pico and micro hydro.The method chapter of this report is explained in Chapter 4. The method used to answer the �rsttwo research questions is a qualitative analysis based on semi-structured open ended interviews withstakeholders in the pico and micro hydro sector and visits to hydropower stations in Manica province,Mozambique.The third research question is answered by designing a mathematical model based on input datacollected during the literature analysis and the �eld trip. The topographical and hydrological data consistsof 17 sites in Manica province, with measurements of head and �ow, and precipitation curves from themeteorological institute of Mozambique. The modeling of the technological and resource potential focuseson turbine designs. Additional electromechanical equipment and civil works are not in focus in this report.The technological data are collected from a turbine manufacturer in Manica province, and from literatureexamples of head ranges and e�ciency curves for the turbine designs. The two turbine alternatives inthe model di�er in both size and function. The demographical data is modeled using examples fromliterature.The interview analysis has provided an understanding of what type of data can be expected to �nd,and what estimations normally have to be made, concerning for example hydrology data. One of the �eldsurveys has set an example of a hydropowered community, to compare with �ndings from the simulations.The results section presents the results of the method, followed by an analysis. Then follows adiscussion part. Finally, conclusions are made in Chapter 8.
3

Chapter 2BackgroundThis section gives an overview of known bene�ts of rural electri�cation from a hydro energy perspective.It presents examples of how pico and micro hydropower have been used as a means for rural electri�cationin other developing countries and what experience can be gained from these examples. Given this, thepower sector of Mozambique is described; how the history of Mozambique has in�uenced the power sector,the development of today's power sector and the micro hydropower scene in Mozambique.2.1 Bene�ts of rural electri�cationAccess to modern energy is considered crucial for economic development and world poverty reduction(WB, 2009) and in 2011, approximately 1.4 billion people lack access to electricity, mainly in rural areasin the least developed countries (WB, 2008). In Sub-Saharan Africa the situation is critical with lessthan 10 % of the rural population having access to electricity. It has been proved that social bene�tsare generated by access to electricity (Gustavsson 2007; WB 2008) even though access in itself is notnecessarily said to generate economic growth and social development. More likely it is an important stepstone to improve social services such as health care and education by improving opportunities for lighting,water treatment, storage, refrigeration and communication (UNDP, 2011). For rural electri�cation togenerate economic growth it has been argued that productive use of electricity and complementary ruraldevelopment investments are necessary (Barnes and Floor 1996; Holland et al. 2001). All this indicatesthe need for a certain level of development in an area for rural electri�cation to lead to developmentbene�ts. If other demands like access to fresh water, infrastructure and sanitation are more urgentelectri�cation is likely to get down prioritized.2.2 Pico and micro hydropower development in Asia and AfricaPico and micro hydropower have been used as a means to electrify remote areas in di�erent parts of theworld. Today, the largest market for pico hydropower systems is found in Vietnam and China (Meierand Fischer, 2011) where the most common designs are low-head pico hydropower systems in the range100-1000Watts. They are typically family owned providing domestic lighting and battery charging (Paishand Green, 2001). The market is characterized by use of low quality equipment manufactured in Chinawith low up-front cost making it easier for private owners to a�ord, but reducing the life time of thesystem (Meier and Fischer, 2011). Other countries manufacturing and having installed low head picohydropower systems are Nepal, Bolivia, Colombia, Peru, India, Sri Lanka, Laos and Indonesia.In Nepal, the market has grown in the past few years. Case studies in Nepal and Kenya haveidenti�ed pico hydropower as having good potential because of its relatively low capital cost and �exiblepower production (Williams et al. 2009). Today, the usage in both countries has expanded to includecommercial projects. The studies have shown that pico hydro is usually the lowest cost option for o�-gridrural electri�cation though the site speci�c design remains a major drawback (Williams et al., 2009). InTanzania, mini and small hydropower stations were developed to supply power to missionaries' centersduring the pre-independence era (Mtalo, 2005).A working paper from the agency IRENA (IRENA, 2012b) presents a cost analysis for hydropower.The cost range for small hydropower projects is stated as 1 300 - 8 000 USD/kW, with no clear de�nitionof small hydropower, since this di�ers between countries. Examples from South Africa, Rwanda and4

Ethiopia of hydropower smaller than 1 MW cost between 3 400 and 4 500 USD/kW, with one deviatingvalue of 7 500 USD/kW. The World Bank Energy Unit states that pico hydropower is likely to be thelowest cost alternative out of the possible alternatives for o�-grid electri�cation (WB, 2008). A collectionof data on investment cost for 80 village electri�cation schemes in Indonesia shows a 5 kW system wouldbe expected to cost around US$ 10,000 per kW, whereas a 25 kW system would be budgeted at US$ 4,000per kW (Meier and Fischer, 2011).Most pico and micro hydro projects implemented in developing countries are �nanced by foreignaid or by donor funds. A Rwandan case study has investigated private sector participation in microhydro development and concluded that there exist more cost-e�ective and sustainable ways to implementmicro hydropower projects than only using public funds (Pigaht and Plas, 2009). The case study inKenya stated further capacity building as one of the prerequisites to ensure that the knowledge of microhydropower becomes more widespread (Maher, 2003).2.3 Mozambique - History and power sector developmentMozambique is situated on the south-eastern coast of Africa, sharing borders with South Africa andSwaziland in the south, Zimbabwe and Zambia in the west, Malawi and Tanzania in the north and theIndian Ocean to the east, see Figure 2.1 (Commonwealth of Nations, 2011) . The total land area of the
Figure 2.1: Map of Mozambique (Commonwealth of Nations, 2011).country is 799,380 km2 and it is divided into eleven provinces; Maputo, Maputo City, Gaza, Inhambane,Manica, Sofala, Zambézia, Tete, Nampula, Niassa and Cabo Delgado. The provinces are divided into 129districts which are further divided into �Postos Administrativos� (Administrative Posts). The populationof Mozambique is 23.9 millions with a population growth of 2% (WB, 2012).2.3.1 HistoryMozambique was colonized by Portugal in the sixteenth century. In 1975 the liberation movement suc-ceeded and it gained its independence after a decade of �ghting for independence. Connected to this, 90% of the Portuguese left the country leaving gaps in skills and a decreased number of people with highereducation (Commonwealth Yearbook, 2012). The following years the country was ruled with strong so-cialist ideals and soon after civil war broke out, ending in 1992. During the civil war much of the socialand economic infrastructure built up during the pre-independency era was destroyed and more than 1million people were killed.Since the end of the civil war Mozambique has experienced a more stable political situation withdemocratic elections, and infrastructure has slowly been re-built (Gaul et al., 2010; EdM, 2007). Despitea high economic growth rate in the past years, the poverty level in Mozambique is high. With 54.7% ofthe population living below the poverty line (World Bank, 2008) and the country being ranked as 1845

out of 187 on the Human Development Index (UNDP, 2011a) it is indicated that the vast majority of theMozambicans remains poor. The economy of Mozambique is mainly dependent on agriculture. Traditionalexports include aluminum, prawns and other marine products, tobacco and cotton. Electricity from theCahora Bassa hydropower station is also exported. Recently found large reserves of natural gas and coal,have driven a strong economic growth (Commonwealth of Nations, 2011).2.3.2 Power sector developmentToday, most of the electricity generated in Mozambique comes from the privately owned hydropowerstation Cahora Bassa situated in Tete province in the north-west. The power station is owned by Hidro-electrica de Cahora Bassa, HCB. Electricidade de Moçambique , EdM, is the national utility responsiblefor transmission, distribution and supply of electricity. Since EdM has low installed power generationcapacity of its own it buys most of the electricity from HCB. EdM has developed an electri�cation masterplan focusing on extending the national grid with a goal of national access to electricity of 20% by 2020(EdM, 2007). Extensive work has been done to connect all district capitals in the country, a goal whichis soon reached (EdM, 2010). The growth rate in electricity demand is estimated to 7% and in 2012 na-tional access to electricity was 16 % of the total population (EdM, 2010). However, despite the progressin extending the national grid, the large rural areas of the country remain out of reach for national gridextension for many years to come.2.3.3 Rural electri�cation in MozambiqueThe low access to electricity is partly due to the geography of Mozambique making it troublesome toreach remote areas. Many periurban and rural areas lie out of reach of the national grid (MoE, 2011) andthe rural electri�cation rate is as low as 6.3 % (Gaul et al., 2010). Even though the national grid will beextended over time, large parts of the country will stay unconnected in a foreseeable future. Consideringthe fact that the population density is low and more than 60 % of the population live in rural areas (WB,2012) transmission and distribution of electricity are major challenges for the country.To address the challenge of giving access to electricity to rural areas FUNAE, Fundo National deEnergia, was established in 1997. FUNAE is an energy fund whose objective is to promote, fund andimplement low-cost energy supply to poorer rural areas and to promote renewable energy technologiesand sustainable management of energy resources (FUNAE, 2012c).The governmental institutions agree that a combination of national grid extension and o�-grid electri-�cation is necessary to increase the access to electricity in remote areas. In 2011, the Ministry of Energydeveloped a Strategy for new and renewable energy development (EDENR) stating that �Supplying powerthrough isolated systems will continue to be of great socioeconomic and political importance in Mozam-bique, particularly in the country's periurban and vast rural areas.� (MoE, 2011,6). In earlier o�-gridrural electri�cation programmes launched by FUNAE focus have mainly been on solar PVs and dieselgenerator sets. Only recently has micro hydropower been included as a means for o�-grid electri�cation.The new strategy emphasizes the use of renewable energy sources and states as one of the assumptionvalid for the period of which the strategy has been de�ned: �Supplying power through isolated systemscombines renewable and nonrenewable energy technologies, including traditional biomass-based energysystems and high-quality renewable energy systems. Whenever possible, these systems give preferenceto renewable over nonrenewable sources.� (MoE, 2011,6). The electricity tari�s for FUNAE's o�-gridsystems in rural communities are set at the same level as tari�s on the main grid, thereby providing asocial service (IRENA, 2012a).2.3.4 Pico and micro hydropower in MozambiqueMozambique is said to have signi�cant hydro resources both for large scale on-grid application and smallscale o�-grid application (IRENA, 2012a; Gaul et al., 2010; Chambal, 2010; MoE, 2011). The countryhas a long tradition of using hydropower, with the Cahora Bassa station being built in the 1970s, thoughthe focus has been mainly on large scale stations (FUNAE, 2012a).Concerning o�-grid use of hydropower, remainders of water mills can be found in the central parts ofthe country telling about historical use of water power mainly to run grinding mills. Water mills are alsosaid to have played a part in providing power to tea plantations in Gurué district in Zambézia provincebefore the civil war (Chambal, 2010). Still, comparing these activities to those of other Sub-Saharancountries like Rwanda and Kenya, the knowledge and experience of pico and micro hydro in Mozambiquehas been built up during a shorter period of time. Rwandan development is also at an early stage but6

the level of experience has increased during the past years (Meier and Fischer, 2011) and commercialprojects already exist in Kenya (Williams, 2009).Today, there are four main actors on the pico and micro hydro scene in Mozambique. These areFUNAE, a local NGO, AKSM (Associaçao Kwaedza Simukai Manica), an international NGO, PracticalAction, and a private actor, GIZ. FUNAE recently shifted some of their focus for rural electri�cationfrom solar PVs towards hydropower. So far, FUNAE does not have any hydropower stations running.They have projects initiated and the upcoming plan is to establish 11 hydropower stations in the range20 kW-200 kW mainly in Niassa province until 2015 (FUNAE, 2012b). The guidelines of FUNAE'sRenewable Energy Program for Rural Development advises a maximum investment cost of 10 ¿ perinstalled watt (FUNAE, 2012b). The aim of the Government of Mozambique is to double their capacityof small hydro (stations with a capacity up to 10 MW) to 125 MW by 2025 (FUNAE, 2012a). One of the�rst pico and micro hydro projects in Mozambique was launched by the Manica provincial governmentand funded by GIZ, in 2006. The 80 kW station was unsuccessful due to insu�cient feasibility studiesand mismanagement and was rebuilt in 2011.Practical Action started a �ve year micro hydro program in 2008 including 15 sites in Mozambique,Malawi and Zimbabwe, where eight of the stations are found in Mozambique. GIZ started a longer projectin the Manica province the same year. Both entities launch systems in cooperation with AKSM and are�nanced by foreign aid and donor money.There is no reliable data on �ow measurements and no database of potential sites for micro andpico hydro, in Mozambique (Gaul et al., 2010). To change this, and to facilitate the development ofhydropower, a FUNAE project has been launched on extensive data collection to assess the hydroelectricpotential and create a hydro atlas for pico, micro and mini scale �nishing in 2014. Meanwhile, potentialsites are identi�ed by all involved actors separately through data collection and yearly �ow measurements(Gaul et al., 2010). Old water mills point out sites with potential, sites which were used as a startingpoint for both GIZ and Practical Action.
Figure 2.2: Typical precipitation during dry season (October to December) and rainy season (January to March) in mm (INAM,2012).Most of the existing pico and micro hydro stations in Mozambique are situated in Manica provinceon the mountainous western border to Zimbabwe. This is due to the favorable topographical conditions.Mountainous terrain and perennial rivers are found in central and northern provinces Manica, Tete andNiassa and to some extent in Zambézia province (Chambal, 2010). The annual average precipitationvaries from over 1000 mm in Northern Mozambique to about 500 mm in the Southern parts, see Figure2.2 (INAM, 2012). There are also variations in rainfall level within the year with 60-80 % of the totalannual precipitation in the period December to March (WB, 2007).7

Chapter 3TheoryThe theoretical chapter deals �rstly with a brief technical overview of pico and micro hydropower, fromthe river to the power lines. The electromechanical equipment is introduced and the two di�erent modeledturbines are described. Second, barriers to pico and micro hydropower found in literature are presented.Country speci�c factors which a�ect the magnitude of certain barriers are described for the Mozambicancase. These are ownership models in use, existing payment systems and demography. The ownershipmodels in use in Mozambique are described. Following this is an explanation of how demography playsa role in selecting sites and its in�uence on investment costs, followed by a section on existing paymentsystems.3.1 Pico and micro hydropowerThe basic principle of pico and micro hydropower is utilizing the power of falling water. When water istransported from one point to another, the kinetic energy is lost against rocks and vegetation or throughturbulence. In a hydropower system the water is directed into a canal, tunnel or pipe with low friction,designed to induce low level of turbulence. With as little loss in energy as possible, the water is led intothe power station and into the turbine, which converts the kinetic energy into rotational energy. Thewater is thereafter returned to the river or used for additional uses e.g. irrigation (Penche, 1998/2004).The power converted between the two points A and B, in Figure 3.1 (British Hydro, 2004) is expressedby Equation 3.1 (Penche 1998/2004; Williamsson, 2012).P = p ·Q · g ·Hg (3.1)
P − Power capacity [kW ]
p− Specific density of water [1000 kg/m3]
Q− Flow [m3/s]
g −Gravity constant [9.82m/s2]
Hg −Gross head [m]The gross head is simply the di�erence in height between the two points. For more precise calculationswhen more is known about the way the water is led from the river, all energy losses from friction incurves, joints or valves in pipes, or unevenness in canals, are subtracted to express the useful �net head�.Designing the system so that the net head is as high as possible is of high importance for the capacity ofthe power station.While the head level is constant, the water �ow can vary substantially over the year. The choiceof turbine has to be considered carefully using a �ow duration curve. Such a curve is produced frommeasurements taken throughout at least a year and describes the percentage of time where the �owexceeds certain values. Since the turbines are designed for a speci�c range of �ows it is very useful toknow if there will be periods where the �ow is too low to produce electricity with the selected turbine.A too high level of �ow may indicate a risk of �ooding.If there are periods when the �ow is too low, this can be helped by adding a dam to preserve theexcess water during high �ow periods. For larger hydropower stations the outlet of this dam is regulated8

Figure 3.1: A run-of-the-river pico hydropower station (British Hydro, 2004).for best performance. In smaller systems the design is often of a �run of the river� type which meansthat there is no regulation of the outlet, if there is a dam at all. (Penche, 1998/2004)3.1.1 Hydropower equipmentThe equipment needed in a pico or micro hydropower station of a run-of-river type, is illustrated in Figure3.1. The intake weir is where the water is directed into the canal. Depending on where the intake weiris situated in relation to the rest of the system, the water could be led horizontally in a canal to theforebay tank. In the forebay tank, the water is slowed down. This allows particles in the water to settleout, not to damage the turbine. There can be a short storage of water in the forebay tank, to regulatethe �ow. There is also usually a rack which protects the turbine from stones, seeds and larger objects(a trash rack). The water transports the water from the forebay tank to the power house, in a pressurepipe called penstock (British Hydro, 2004). The penstock must have valves to regulate the �ow, and toshut the water o� if needed (Penche, 1998/2004). The number of joints in the penstock decreases the nethead and lowers the possible output capacity of the system.The turbine is located in the power house, together with the generator and possible gears and loadcontroller. After passing through the turbine, the water is discharged and led back into the river or tosome other application, like irrigation. (British Hydro, 2004)3.2 Electro-mechanical equipmentDi�erent types of turbines, generators and control equipment that are used in pico and micro hydropowerschemes are presented in this section.3.2.1 TurbinesA water turbine is a device that converts the kinetic energy of falling water into mechanical energy, morespeci�cally rotation of a turbine shaft. The rotational energy can be used for mechanical purposes, likemilling or grinding, or be connected to a electric power generator. Turbines can be classi�ed by theirhead range, as low head, medium head or high head turbines. They are also de�ned by their way ofoperating, then as impulse turbines or reaction turbines.The impulse turbines are driven by one or several jets of water, impacting on the turbine blades. Thereaction turbines are immersed in water, utilizing the pressure di�erence to create a lifting force on therunner blades, causing them to rotate.Two impulse turbine designs will be presented here. These are �Pelton� and �Cross�ow� turbines.One of the advantages of impulse turbines compared to other types, is for example the simplicity of thedesign, which makes it easier to manufacture and maintain and gives better access to spare parts. Theturbines are less sensitive to sand or seeds in the water and if the head is within the e�ciency range, the�ow can vary without loosing too much e�ciency. 9

The torque generation mechanism for impulse turbines occurs when a water jet with a certain velocityexerts a force on the turbine blades or cups, producing a torque. The rotational speed of the turbine isgiven by the velocity of the incoming water. The law for conservation of energy gives that the velocity ofthe water jet can be expressed as v =√2 · g ·H where H is the gross head, not including energy losses infriction or turbulence. If the head is too low, this will slow the rotational speed which lowers the usabilityof the turbine (Williamsson et al, 2012).The low speed of the turbine, due to insu�cient head, can be helped with a gear box. The additionalcost of the gear box has to be balanced with the cost for the system, and the e�ciency of the gear boxwould have to be taken into account (Jonker Klunne, 2012a). A low speed generator is another solutionto be used at low head sites (Williamsson et al, 2012).Pelton turbinePelton turbines are usually selected for high head sites. For large scale systems the head should normallybe above 150 m, but for pico and micro applications the head range can extend as low as 20 m. (JonkerKlunne, 2012b)
Figure 3.2: Pelton wheel (British hydro, 2004).The cups of a Pelton turbine are situated at the periphery of a circular disc with the water jet strikingthem from one or several nozzles at 165 degrees, causing the disc to rotate. It can be �tted horizontally orvertically depending on the application. Figure 3.2 shows a Pelton turbine. The introduction of severaljets to the Pelton design (multi-jet Pelton), in the case of a low head but high �ow sites, increases thespeed and also presents an advantage in the ability to use a reduced number of jets when the �ow is lower(Jonker Klunne, 2012b).Cross�ow turbineA Cross�ow turbine is considered more suitable for low head sites than the Pelton, since it can be run athigher speeds with less �ow. The minimum head required is as low as 3 m (Williamsson et al, 2012).
Figure 3.3: Cross�ow � microhydropower.net10

The blades of a Cross�ow turbine are curved, connecting two circular discs to create a runner in acylinder shape (Figure 3.3). The runner is always used horizontally with the water jet coming from arectangular nozzle as wide as the runner itself. The water jet �ows through the full length of the runner,striking the blades both as it enters and exits (Jonker Klunne, 2012b).Part �ow e�ciencyA turbine is designed for a certain water �ow. This is called the rated �ow. Figure 3.4 shows typicale�ciency curves at di�erent part-�ows for the Pelton and Cross�ow turbine, among other designs. Thee�ciency is a function of the �ow to rated �ow ratio (British hydro, 2004).
Figure 3.4: E�ciency at part �ow, for various turbine designs.When the rated �ow of the turbine is not met, the e�ciency of the turbine decreases. Both the Peltonand the Cross-�ow can be designed to perform better when the �ow is below the rated �ow. For Pelton,the design is called �multi-jet� and is based on adding nozzles to the turbine. When the nozzles cannotbe supported with rated �ow, the turbine can be run on a reduced number of jets. This means that thenozzles still in use still could produce jets at rated �ow.For the Cross�ow, adjusting the water jet through the turbine by separating the nozzle in divisions,increases the e�ciency at lower �ows. By only using a part of the runner, as shown in Figure 3.5, thewater jet can be maintained at rated �ow, instead of loosing rotational speed in the runner.
Figure 3.5: Cross �ow e�ciency � microhydropower.net11

3.2.2 GeneratorsGenerators transform the rotational energy from the turbines, to electrical energy, using electromag-netic circuits. The required magnetization is provided di�erently, depending on the type of generator.Synchronous generators use a magnetizing current provided by an excitation system, while inductiongenerators are designed to obtain this current from the grid they are connected to, by using reactivepower from other power sources in the grid. If there are no other power sources, or if the capacity of theinduction machine is large compared to other power sources, the magnetization will not work (Penche,1998/2004). In a guidebook from the European Small Hydropower Association, the author recommendsto use induction generators for main grid connected schemes below 1 MW, due to the relatively low price.However, for o� grid applications synchronous generators are preferable since they produce their ownreactive power for excitation (Penche, 1998/2004).There have been projects with induction generators in isolated grids, where excitation capacitorsmagnetize the circuit. In those cases, careful sizing of the capacitors is important (Ekanayake, 2002).Frequency controlElectric applications are manufactured for a speci�c frequency. The generator produces this frequency ifconnected to a turbine rotating with the rated speed of the generator, or to gears if the rated speed of theturbine does not �t the generator (Penche, 1998/2004). For larger systems there is generally a hydraulicgovernor designed to regulate the �ow into the turbine, and keep the speed of the turbine constant whenthe load varies (Ramakumar, 2001). However, the frequency can also be controlled by keeping a constant�ow to the turbine and regulate the load of the generator, so that the turbine always experiences fullload and the �ow can be unaltered. Electronic Load Controllers (ELCs) use a dump load to regulate theload power. They have no moving parts and can therefore be a better alternative to hydraulic governors(Practical Action, 2002).3.3 Barriers to pico and micro hydropower from literatureThis section covers barriers to pico and micro hydropower present in scienti�c literature. The selectionand grouping of presented barriers is based on a conducted literature review, and the authors' own com-prehension of implementing technology, from master studies in electric power engineering and industrialecology. The barriers are presented in categories into themes in the same way as they are grouped inthe methodology section, where themes are in italics. The themes are Investment cost, Consumer prices,Availability, Suitability, Education and knowledge, Administration, Legislation, Infrastructure, Demandand Quality. Ahlborg (2012) has identi�ed barriers to rural electri�cation in sub-Saharan Africa fromliterature. This work has been used as a starting point to �nd relevant scienti�c literature. Some barriersare general for all kinds of o�-grid electri�cation and are included since the topics are expected to becovered during interviews.Few studies exist on barriers to pico and micro hydropower development in Africa. The Food andAgriculture Organization of the United Nations, FAO, listed key barriers hindering the development ofsmall hydropower in Africa, as background material to a ministerial conference on water for agricultureand energy in Africa (FAO, 2008). Similarly, barriers to the dissemination of micro hydropower, gatheredfrom interviews and reports, are stated in a report by former GTZ (Gaul et al., 2010). Finally, barriersto small hydropower in southern Africa are identi�ed by Jonker Klunne (2012).Barriers associated with the investment cost of a hydropower station are divided in two. First,the inability to suggest a pico and micro hydropower project due to high investment costs. If othertechnical solutions are less expensive funders are more likely to exclude pico and micro hydro in theirfunding programs (WB, 2008; Jonker Klunne, 2012a). This complication is mentioned for other types ofrenewable energy systems for rural electri�cation as well, like solar home systems and wind power systems(Alzola, 2009). Secondly, lack of motivation among investors. Experience from solar PV pilot projects inZambia tells of di�culties to provide credits through �nancial institutes in rural areas (Ellegård et al.,2004 ). Banks are perceived as uninterested and lack local presence. Earlier studies have showed thatthe availability of �nancing can be low even though there are investors, due to lack of information andmotivation among investors (Meier and Fischer, 2011). One of the main barriers to small hydropoweraccording to FAO (2008) is the lack of incentives and motivation. It also states lack of private sectorparticipation as a main barrier. Hankins (2008) states the introduction of feed-in tari�s1 as a stimulus1Feed-in tari�s regulate the minimum price at which a private operator can sell electricity to the national electricity12

for investors to start o�-grid micro-hydro projects in Kenya. Similar legislation changes has been madein Rwanda only this year (RURA, 2012).Categorized as consumer prices barriers are barriers related to problems with paying for electricity, lowability and willingness to pay and problems with tari�s set too low to meet operational costs. Rural areasgenerally su�er from a higher poverty level than urban areas, where rural a�ordability for electricity willbe limited to replacing amounts currently spent on other sources of energy like kerosene and batteries(EdM, 2007). The risk that the running cost exceeds the consumer's ability to pay can thus pose abarrier. As a way to make more people a�ord electricity, prices can be subsidized. When not donecarefully, unreasonably low tari� levels that does not re�ects the true cost of the service can lead topoor maintenance of the power station (Kirubi et al., 2009; Meier and Fischer, 2011). Furthermore, itis discussed that people living below a certain poverty level often have more urgent needs and thus lackwillingness to get access to electricity and to pay for it. The willingness to pay for electricity competeswith the willingness to pay for household needs like school fees, protein-rich food and fertilizers to improvefarms (Murphy, 2001).There are several aspects of availability as a barrier to technology development: Lack of availableequipment, including both lack of local and international suppliers, and lack of available spare partsneeded for maintenance. Maher (2003) sees improved availability of components as an important factorto create a demand for pico hydropower. Before the Ministerial Conference on Water for Agriculture andEnergy in Africa held in Sirte (FAO, 2008, 10), �Lack of infrastructure in the design and manufacture ofturbines, installation and operation� was stated as one of the main barriers to the development of picoand micro hydro. A barrier speci�cally associated with available suppliers can be high import dutieshindering development by raising investment costs and introducing a di�culty to access equipment (Gaulet al., 2010).Pico and micro hydropower are limited by site speci�c design requirements and seasonality in resources.The technology requires sites to have su�cient head and �ow rates to be considered suitable and lack ofyear-round water supply can be a major barrier for the development of the technology (WB, 2008). TheWorld Bank (2007) discusses the fact that most rivers origin inland in other countries. The water supplydepends on activities up streams out of Mozambican country boundaries which increases the vulnerability.Another barrier concerning the suitability of pico and micro hydropower for a site, is that the technologyrequires building a local grid. Low population density means adding a high cost component for the gridper household, in the form of investment cost. Also, rivers situated far away from the community state abarrier as it requires longer transmission and maybe stepping up of the voltage. The distance to clientsis also crucial to provide maintenance and arrange payments. This can be a problem speci�cally whenthe operator is a centrally situated company or governmental entity (Ellegård, 2004).One barrier concerning education and knowledge dealt with in literature is the lack of local capacityto operate and maintain the hydropower stations (Gaul et al., 2010; FAO, 2008; Jonker Klunne, 2012a).Another barrier is the lack of technical expertise in the design process. Experience from Rwanda tellsof poor plant designs done by informal techniques and improper calculations (Meier and Fischer, 2011).This leads to ine�cient power stations. Lack of technical expertise also hinders during the data collectionphase and �nding suitable sites. The data collection itself and availability of a data base of hydrologicaldata is crucial. Lack of a proper data base or lack of a strategy to create one are considered barriers byboth FAO (2008), Jonker Klunne (2012) and a recent report by former GIZ (Gaul et al., 2010).If knowledge of a technology exists in a country, information dissemination is important for peopleto share this knowledge. There needs to be education, university programs and possibilities to net-work. Experience from Rwanda and Kenya point out the importance of awareness campaigns (Meier andFischer, 2011; Maher, 2003). FAO (2008, 10) states both �Lack of awareness� and �Lack of access toappropriate technologies pico, micro, mini and small hydropower. Networking, sharing of best practicesand information dissemination through forums and conferences.� as barriers.Administration barriers comprise of time consuming administration, poor operation management andlack of cooperation between actors. Lack of joint venture, public and private sector partnership arepresented as main barriers by FAO (2008). The choice of owner and operator of a power station isimportant for the sustainability of an electri�cation project in remote areas. Especially local involvementin the management of the power system is proposed as a critical issue (Alzola, 2009; Maher, 2003; Pigaht,2009; Williams et al., 2009).grid. 13

Concerning legislation, laws supporting other technologies or lack of legislative frameworks can bebarriers since project administration can get more time consuming and even hinder a project start.When regulation of pico and micro hydropower is only part of a broader regulatory framework for ruralelectri�cation in general, important aspects like access to water and water infrastructure are often notincluded (Jonker Klunne, 2012a). Furthermore, policies need to be up to date and there needs to beawareness of the legislative framework (Pigaht and Plas, 2009; Gaul et al., 2010).Since pico and micro hydropower sites can be situated in remote areas the infrastructure and conditionsof the roads are of great importance. If it is impossible to reach remote sites the site potential becomesunimportant. Reaching such locations can be extremely di�cult for project sta� and suppliers (WB,2008). Accessing sites pose a barrier for several kinds of rural electri�cation (Kirubi et al., 2009).A potential barrier is the risk of oversizing or undersizing the hydro station in relation to the demandand the capacity of the river. The system needs to be designed to meet the demand at the lowest resourceavailability from seasonal and daily resource variations which adds an extra cost to the project. Thiswould mean excess power is generated during the other months for no use if no complementary load isfound (WB, 2008). Pico and micro hydro are considered by the World Bank as good energy alternativesto supply productive use of electricity, but this requires activities of productive use in areas suitable forhydropower (WB, 2008). Over optimistic evaluations of the potential of local productive activities canlead to unsuccessful projects. The cost of a micro hydro system can, according to the World Bank, bejusti�ed if productive loads are large enough and can complement community electricity needs (WB,2008).Low quality of equipment is considered a barrier since low quality equipment is more likely to breakdown and have a shorter life time. Import of equipment is not always a guarantee to high quality(Ellegård et al., 2004). Low quality of equipment can make lack of infrastructure a more severe barriersince low quality equipment demands more frequent maintenance. Barriers connected to maintenance arealso categorized as quality barriers in this report. Proper maintenance is important for sustainability ofo�-grid rural electri�cation projects (Maher, 2003). Case studies on renewable energy systems in Kenyahave shown that training of local technicians is an important component (Alzola, 2009). Murphy (2001)states the need for technical skills and experience to maintain as a constraint for grid expansion as wellas for solar home systems and bio gas systems for rural electri�cation.This section has described barriers to pico and micro hydropower development. Some of the barriersdepend highly on country speci�c factors like what ownership models are traditionally used in communityprojects, existing payment systems and the population density of a country. Di�erent ownership models,payment models and the demography of Mozambique are described in the following sections to give betterunderstanding of the speci�c conditions for Mozambique.3.4 Ownership modelsThe barriers to pico and micro hydropower found during interviews show that the choice of ownership isimportant (Section 5.1.2). Three di�erent ownership models exist for pico and micro hydropower projects;private shareholder model, institutional owner model and private owner model. In the shareholder modelthe power station is community owned through a committee. The more labor provided to the projectby each community individual, the more shares in the power station is gained, and the pro�t is sharedaccordingly. What signi�es the institutional owner model is that a school or a hospital includes thepower station in their responsibilities. A private owner model is where there is an entrepreneur personallyresponsible for the power station, including the canal and the electromechanical equipment. In some casesthe grid is donated to the community and not owned by the entrepreneur. In the private owner modelthe owner is responsible for maintenance, operation and collecting revenue from users. The private ownermodel is the most commonly used ownership used model in Mozambique for pico and micro hydropowerprojects.3.5 Payment modelsThis section explains di�erent ways of collecting revenue from customers using electricity. There are todaythree di�erent payment systems available for a hydropower station in Mozambique: Flat rate system ,monthly payment system and pre-payment system. In a �at rate system, the customer pays a �xed14

amount at the end of the month regardless of the amount of electricity used. The tari� is di�erentiatedwith social tari�s, household tari�s, farming tari�s and general tari�s. The �at rate system is the commonsystem for o�-grid pico and micro hydropower systems where the rate for domestic use is normally setto 200 MTS per month (approx. 7 USD). Some areas use monthly payment systems where electricity ispaid for at the end of the month according to electricity usage. The prepaid system in Mozambique iscalled CREDELEC and was introduced in 1995 (EdM, 2012). The principle is to pay for electricity beforeusing it by buying credits, similar to buying credits to a cellphone. It is today used for grid-connectedcustomers in many parts of Mozambique though it is not implemented in any o�-grid rural pico or microhydropower projects.3.6 DemographyThe investment cost for electri�cation of a community depends partly on the remoteness of the community,the density of the households and the spatial pattern of the settlement design. Remoteness, in the senseof having few roads and towns in the vicinity, increases the cost for transportation of equipment. In areaswhere the population density is low, that often means long distances between households, which resultsin an increased cost for distribution cables. Figure 3.6 (MoE, 2009) shows how the population densitydi�ers geographically in Mozambique.
Figure 3.6: Population density (MoE, 2009).The numbers presented in this �gure are based on rural as well as urban areas in Mozambique,therefore it shows a comparison of di�erent provinces and does not represent �gures for rural populationdensity (EdM, 2007).The spatial pattern of the settlement design can cause increased cable length due to di�culties in thestructure of the grid. An urban structure is preferred since cables can be used more e�ciently. Figure3.7 (EdM, 2007) shows four typical rural settlement patterns in Mozambique.15

Figure 3.7: Typical rural settlement patterns (EdM, 2007).Results in this report shows that low density structures in communities is one of the barriers toelectri�cation. A higher density pattern is favourable according to interviews about o�-grid electri�cation,and it is also what main grid extension projects favour, according to EdM (EdM, 2007). If the pattern issimilar to the lower density examples the layout is considered ine�cient for electri�cation or may requireinvoluntary resettlement and loss of mashambas (personal farming land) (MoE, 2009).
16

Chapter 4MethodThis section describes the methods used for the study. It is divided into two parts; Method for analysisof stakeholders' opinions (Section 4.1) and method for analysis of technological and resource potential(Section 4.2). This is done in order to cover several aspects of the potential of pico and micro hydropower.In the following Results chapter the �rst part maps what barriers to pico and micro hydropower devel-opment stakeholders see based on conducted interviews. These results are then used to de�ne how theevaluation of the potential based on geographical, technical and demographical factors is done. Importantconstraints brought up during the interviews have been selected and modeled to investigate how theyin�uence the technological and resource potential in di�erent areas of Mozambique.4.1 Method for analysis of stakeholders' opinionsIn development studies, interviews and documents are key sources (Mikkelsen, 1995/2005). The sourceof information for the research questions regarding stakeholders' opinions in this report is in the form ofqualitative interviews. Semi-structured interviews with open ended questions were conducted to answerthe question on what are the stakeholders' opinions on existing barriers to utilizing pico and microhydropower in rural Mozambique and how to overcome them.A qualitative semi-structured interview with open ended questions means a set of questions is prede-termined, but is used as a �exible checklist and the respondent is allowed to talk around these questions.New questions can emerge during the interview. Also, the predetermined questions are adapted to therespondent's professional experience and his or her role. Strengths with this method are the possibilityto keep the interview fairly conversational and that apparent gaps in the interview guide can be �lled induring the interviews. However, it is important to remember that it may lead to topics not being coveredby some respondents, reducing the comparability of the interviews (Mikkelsen, 2005).4.1.1 Selection of interview topicsThe selection of interview topics was based on the barriers found in current literature on pico andmicro hydro. The topics were categorized into themes according to barrier themes found in literature;Investment cost, Consumer prices, Availability, Suitability, Education and knowledge, Administration,Legislation, Infrastructure, Demand and Quality. Safety was added as a theme even though no barriersfound in literature were connected to the topic. If a technology is considered complicated or associatedwith safety risks, it could be less likely to be developed. A perception of the technology as high risktechnology can be considered as a barrier. Another barrier concerning safety which was considered is therisk of �ooding in areas suitable for pico and micro hydro. A small hydropower station is more sensitiveto �ooding and can more easily be �ushed away.Interview guideAn interview guide was created before the �eld trip based on the ten themes to facilitate conductingthe interviews. Each theme was associated with �ve to ten questions to ensure the topics were covered.These questions were somewhat revised during the process. An example of a theme and its questions canbe seen in Table 4.1. 17

Theme QuestionEducation and knowledge How widespread throughout the country is knowledge of small scalehydropower? (FUNAE, investors, contractors, consumers, EdM)Table 4.1: Example of theme and questions.In total the interview guide comprised of about 50 questions. The interview guide used for respondentFUNAE B can be found in Appendix A.4.1.2 Selection of respondentsThe respondents were selected as to cover as many stakeholder groups as possible associated with picoand hydropower development. The exact selection of respondents was made in Mozambique. ProfessorBoaventura Chongo Cuamba at the Eduardo Mondlane University in Maputo assisted in getting incontact with people working with pico and micro hydropower. Each interviewed respondent was asked forexamples of people with in�uence on the development of the technology in order to �nd new respondents.Stakeholders were identi�ed as governmental policy makers, the national electricity utility, the nationalenergy fund, foreign aid representatives, NGOs, private sector actors and consumers of electricity.1The list of respondents is presented in Table 4.2, sorted according to the location of respondents'work/activity. The experience of pico and micro hydropower of the individual respondent is presented,since this varies. The respondents experience of di�erent power ranges for hydropower is stated for betterunderstanding the analysis.All interviews but �ve were recorded, with the permission of the respondents, and held in a semi-structured fashion with a prepared interview guide. The interview with Gov. ent. employee A was notrecorded, as requested by the respondent. The interviews with the committee member and the powersystem owner were not conducted based on the interview guide, and the interviews with Gov. ent.employee C, and the manufacturer were not recorded and not conducted based on the interview guide.This was due to the circumstances at which the interviews were held. Some of the interviews were heldwhile walking to sites, some were time limited, and some were only held to collect data for the modelingand did not require questions to the extent of the interview guide.4.1.3 Conducting the interviewsThe interviews were conducted during ten weeks (March to May) in 2012, in Mozambique. They werecarried out at the respondent's place of work, at a nearby cafe, or during �eld trips.18 interviews were conducted in total, where 15 were full length interviews and three of the interviewswere shorter. Eight interviews were conducted in Maputo, eight in Manica province, in the central westernparts of Mozambique, and two in Zimbabwe. A nonprofessional interpreter was used at four occasions andall interviews but three were recorded and transcribed afterward. All interviews were carried out withboth authors present, with one asking question and one taking notes. The tasks were alternated betweenthe authors. A presentation of �ndings so far was held before leaving Mozambique. All respondents wereinvited and encouraged to give input and correct possible misunderstandings.1It would have been preferable to interview micro �nance institutes as well as posto administrativos, but these wereexcluded due to lack of time.
18

Table 4.2: List of respondents. Location is where the respondent is situated, Respondent explains the respondent's role. Therespondents will be named by their Abbreviation. Experience covers the respondent's experience of hydropower and Power rangethe range the respondent is supposed to have experience from.
4.1.4 Data condensation and analysisThe collected material was coded to facilitate analysis and interpretation of the data collected duringinterviews. The raw data was categorized into conceptual categories by coding it. Basically, a code is oneor a few words that captures the content of a longer sentence or paragraph. A code should capture themeaning of what is said or the topic that is discussed. The codes were based on the prede�ned themesbut extended by new codes when new topics came up during the interviews (Mikkelsen, 2005). First, thedata was coded with a broader aim of providing an overview of the respondents' general opinions on picoand micro hydro. An example of a piece of data with its code can be found in Appendix B. Based onthe coding a matrix was constructed with the respondents as the headings and codes as rows with whateach respondent said as the input.
19

Second, all coded data was searched for data relating to barriers. Third, the codes were grouped intothemes for better comprehension. These themes di�ered slightly from the initial themes used to createthe interview guide since new topics had emerge during the interviews and some topics had shown tobe out of importance. The change from interview themes to new code based themes and the associatedbarriers can be seen in Table 4.3, 4.4 and 4.5.Table 4.3: Technical aspects. The transition from interview themes to code based themes and their associated barriers.Technical aspectsInterview theme Barriers associatedwith interview theme New theme basedon codes Barriers associatedwith new themeAvailability (suppliers,low power equipment) Lack of access to spareparts Availability ofequipment Low quality of localproductsHigh import duties High import dutiesLimited ruralinfrastructureLack of access to sparepartsQuality (need formaintenance) Lack of propermaintenance Design Poor designSafety (electrocution,�ooding, equipmentprotection) - Lack of propermaintenanceScattered populationin communitiesSuitability(topography andweather, villagestructure) Lack of adequate dataand measurements Data andmeasurements Lack of adequate dataand measurementsLack of water resources Resources Lack of waterresourcesScattered population incommunities Competing resourceusePoor design Long distancetransmissionCompeting resource useTable 4.4: Economic aspects. The transition from interview themes to code based themes and their associated barriers.Economic aspectsInterview theme Barriers associatedwith interview theme New theme basedon codes Barriers associatedwith new themeInvestments (investors'interest, district funds) Lack of access to �nance Finance Lack of access to�nanceHigh investment cost High investment costLack of investor interest Lack of investorinterestConsumer prices(willingness to pay,local �nancing) Low willingness andability to pay Payment Low willingness andability to payLack of localcontribution Poor paymentmanagement20

Table 4.5: Social aspects. The transition from interview themes to code based themes and their associated barriers.Social aspectsInterview theme Barriers associatedwith interview theme New theme basedon codes Barriers associatedwith new themeEducation (technicalschools, technicalexpertise, localcapacity, information,motivation) Poor knowledgemanagement Knowledge andeducation Lack of awareness oftechnologyLack of technicalexpertise Lack of technicalexpertiseLow quality of localproducts Poor knowledgemanagementLack of local involvementLack of awareness oftechnologyAdministration(project structure,operationmanagement) Poor projectadministration Project administration Poor projectadministrationPoor paymentmanagement Time consumingprocessTime consumingprocesses Community relations Lack of localinvolvementCommunity relationshinder power stationmanagement Community relationshinder power stationmanagementLegislation (landpermits, by-laws) Too low electricity price Legislation Too low electricitypriceLack of supportinglegislation Lack of supportinglegislationLack of grid code andfeed-in tari�s Lack of grid code andfeed-in tari�sInfrastructure(transport, distanceoperation) Limited ruralinfrastructureLong distancetransmissionDemand (productiveuse) Low demand and lowlevel of productive use Demand Low demand and lowlevel of productive useDi�culties sizingsystems Di�culties sizingsystemsA revised matrix was constructed with the �nal barriers as rows, grouped according to the newthemes, and respondents as columns. The same procedure was repeated to construct a matrix to answerthe research question: �What are the stakeholders' opinions on the possibility to overcome these barriers?�A matrix including both barriers and ways to overcome them can be found in Appendix E.Further analysis was based on the matrices and the input data. When needed a review of raw datawas made as to con�rm a correct coding and to avoid information loss during the data condensation.
21

4.2 Method for analysis of technological and resource potentialA methodology which investigates how technological and resource potential varies with choice of systemdesign and geographical conditions is necessary to answer research question three. As a �rst step, aliterature study was performed to understand the basic functions of pico and micro hydropower systems.All parameters that could in�uence the suitability of a system design for a certain site were mappedand discussed. From literature and conducted interviews areas of importance for decision making wherefound to be: reliability of water resources to ensure continuous electricity supply throughout the year; theintroduction of a locally manufactured Cross�ow turbine to complement a Pelton turbine already beingproduced locally; the installation cost and the sizing of the hydropower system to meet the present andfuture demand. The third research question is answered based on how two factors, reliability of waterresources and installation cost, in�uence the areas of importance, in four provinces in Mozambique.Figure 4.1 illustrates the choice of areas of importance and their origin in barrier themes.
Figure 4.1: Areas of importance from barriers.4.2.1 Data used in modelA selection of hydrological data, topographical data, precipitation data and other relevant data likeequipment price information has been collected. The modeling of technological and resource potentialis based on data from the NGO Associaçao Kwaedza Simukai Manica. Their database of possible sitesin Manica in western Mozambique (AKSM, 2012), contains some measurements of head and average�ow. For 17 of the sites there are measurements of both the head and average �ow which can be found inAppendix D. These are used as examples for the model. Variations in �ow are modeled using precipitationdata in dekads2 from meteorological measuring points in Manica, Niassa, Tete and Zambézia during theperiod 2007-2011 (INAM, 2012). The data used is the dekad average of the �ve year period. The loadcurves for di�erent demand pro�les are estimated from empirically collected data of power demand in ruralcommunities in Tanzania (Blennow, 2004). Price of turbines used in cost calculations were retrieved fromthe local turbine manufacturer Metalúrgica in Manica, Manica province. Additional price informationwas collected during interviews and from pico and micro hydro projects carried out by Practical Actionin Zimbabwe.Data restrictionsThe model structure was modi�ed and adapted to the limited extent of data acquired. One method toanalyze how variations of geographical conditions in�uence technological potential is to use a GeographicalInformation System, GIS. To do so, maps of essential data is crucial. If maps of population density,rivers, measurements of �ow and head were available it would be possible to map and point out whatareas are most suitable for di�erent system designs. Measurements of yearly �ow are required for at least2A dekad is a ten-day period, where each calender month consists of three dekads. The �rst ten days constitutes the �rstdekad of the month. The second ten days of the month constitutes the second dekad, and the remaining days constitutesthe third dekad. 22

a year as a part of each feasibility study for a possible site, and there is no general database to collectinformation of �ows from, except the limited databases of NGOs and organizations, documenting theirown measurements. In lack of detailed geographical data the geographical conditions would be modeledbased on an extrapolation of site data from 17 sites in Manica province and no GIS has been used toprocess data.4.2.2 Selection of designsThe two turbine designs compared in the model are selected because they are the only types that aremanufactured locally in Manica province, Mozambique. One is the more common Pelton turbine, 50 kW,used in several schemes, and the other is the Cross�ow turbine, 3 kW. The Cross�ow has just recentlybeen included in manufacturing. It is considered a complement to the Pelton due to its lower head range,suitable for terrains with limited head. The di�erences between the two designs are mainly the size, theprice, the head range and the e�ciency for di�erent �ows. It should be noted that Pelton turbines aremanufactured in pico size as well. However, this design is not included in the study.For larger hydropower systems, turbines are designed uniquely for each site. When implementing apico or micro system, the cost of designing the turbine would be unreasonably high compared to the sizeof the system. Therefore, a lower e�ciency must be tolerated. The turbine manufacturer in Chimoio hasa limited amount of di�erent turbine designs. To illustrate this the Pelton design and Cross�ow design areestimated to have one single rated �ow respectively, independent of site characteristics. The rated �owwas calculated using Equation 3.1 with di�erent levels of head, within the head interval of the 17 sites,to �nd a suitable value. The head level and corresponding rated �ow resulting in high number of siteswithin head range of the turbines in combination with good system capacity were selected. The selectedvalue for rated �ow determines the lower boundary for the acceptable �ow levels of the sites, since ita�ects the e�ciency of the turbines. Turbines also have requirements on maximum and minimum headlevel to function. These intervals are selected based on speci�cations of a selection of available turbines(Chiaradia, 2008; Williamsson et al., 2012). Properties of the two turbines can be found in Table 4.6.So far only synchronous generators are used in Mozambique. Since the generators are consideredthe same, the focus of this report is on the di�erent turbines and therefore no generator properties aremodeled.Table 4.6: Turbine properties for the two turbine designs. Figures on price and capacity are taken from the local turbinemanufacturer in Chimoio, Mozambique. Head range and rated �ow �gures are estimates based on literature and modeling.Cross�ow PeltonCapacity [kW ] 3 50Maximum head[m] 40 80Minimum head [m] 6 30Rated �ow [l/s] 30 200Price[USD] 2000 41404.2.3 Field surveysThe �eld surveys comprised of visits to four hydropower schemes in Manica province in the western partsof Mozambique, bordering Zimbabwe. Experience and data collected during the visits have been used tojustify estimates made in the model by setting examples of electricity use to base demand pro�les on.The visits also helped in the selection of which turbines to model, and gave information on what safetyequipment is used, what the di�culties can be, and how they are handled. Figure 4.2 shows picturesfrom the four visits.The �rst visit made was to a potential site in Macate where measurement data of head and �ow werecollected. The community had a school, some smaller shops, but no healthcare center. Twelve houseswere gathered around the school and the rest of the houses were very scattered.The second site was situated in Chimukono, in Sussundenga district. The Chimukono site was nearlycompleted, where a 15 kW hydropower plant was planned. The construction was delayed because of�nancial problems and some design problems. The penstock was being relocated to assure the watercould run through it properly. The intake was situated 700 m to 1 km from the powerhouse. Theowner of the station explained the electricity would supply four shops, one school, a healthcare center, arestaurant and an administration o�ce. It would also supply �ve street lights placed along the road.23
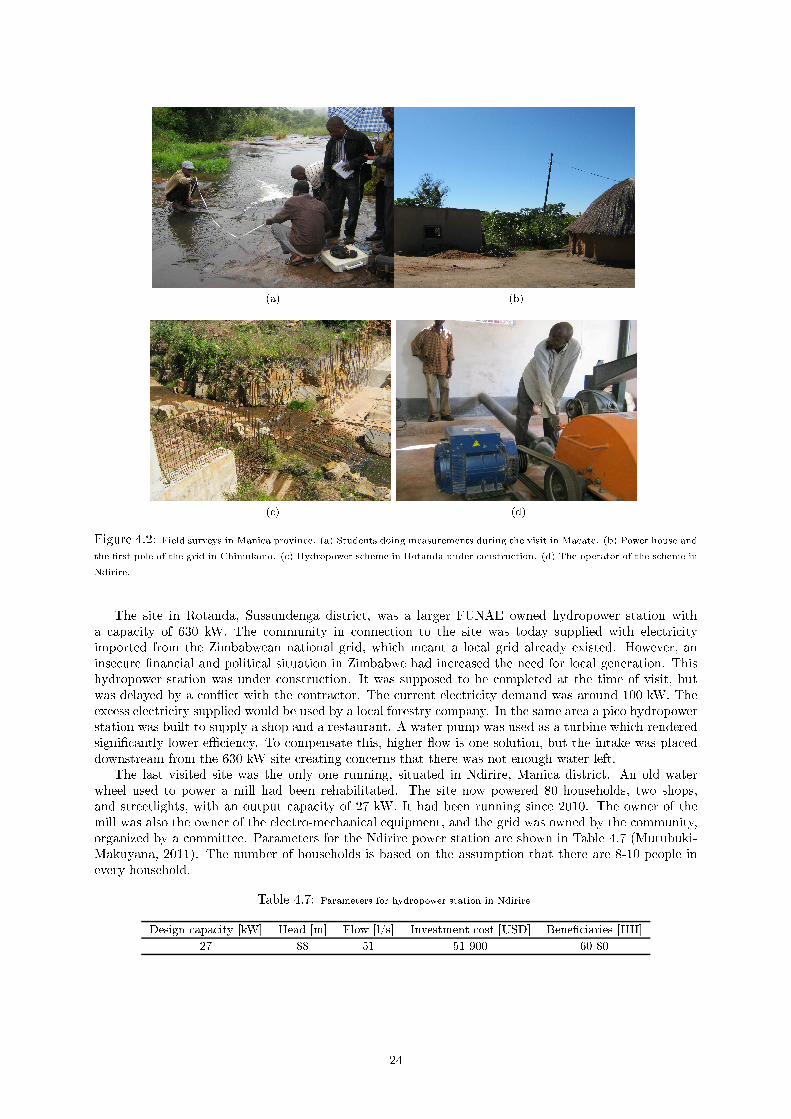
(a) (b)
(c) (d)Figure 4.2: Field surveys in Manica province. (a) Students doing measurements during the visit in Macate. (b) Power house andthe �rst pole of the grid in Chimukono. (c) Hydropower scheme in Rotanda under construction. (d) The operator of the scheme inNdirire.The site in Rotanda, Sussundenga district, was a larger FUNAE owned hydropower station witha capacity of 630 kW. The community in connection to the site was today supplied with electricityimported from the Zimbabwean national grid, which meant a local grid already existed. However, aninsecure �nancial and political situation in Zimbabwe had increased the need for local generation. Thishydropower station was under construction. It was supposed to be completed at the time of visit, butwas delayed by a con�ict with the contractor. The current electricity demand was around 100 kW. Theexcess electricity supplied would be used by a local forestry company. In the same area a pico hydropowerstation was built to supply a shop and a restaurant. A water pump was used as a turbine which renderedsigni�cantly lower e�ciency. To compensate this, higher �ow is one solution, but the intake was placeddownstream from the 630 kW site creating concerns that there was not enough water left.The last visited site was the only one running, situated in Ndirire, Manica district. An old waterwheel used to power a mill had been rehabilitated. The site now powered 80 households, two shops,and streetlights, with an output capacity of 27 kW. It had been running since 2010. The owner of themill was also the owner of the electro-mechanical equipment, and the grid was owned by the community,organized by a committee. Parameters for the Ndirire power station are shown in Table 4.7 (Mutubuki-Makuyana, 2011). The number of households is based on the assumption that there are 8-10 people inevery household. Table 4.7: Parameters for hydropower station in NdirireDesign capacity [kW] Head [m] Flow [l/s] Investment cost [USD] Bene�ciaries [HH]27 88 51 51 900 60-8024

4.2.4 ModelingThe modeling is described from inputs to outputs, as straight forward as possible. Deeper explanationsof some parts are described further on. The model was designed in MATLAB by MathWorks �. Thestructure behind the model is presented in the �ow chart in Figure 4.3.
Figure 4.3: Flow chart of technological and resource potential modelThe �rst inputs are head and average �ow data from 17 sites in Manica province, yearly �ow variationsof Manica, Tete, Niassa and Zambézia province, and head range for the Pelton and the Cross�ow turbinedesigns.The head data of the 17 sites are checked against the stated head range from the turbine manufacturers.The sites where the head does not fall within the limits are de�ned as unsuitable during the rest of thesimulation. 25

The yearly �ow variations are based on precipitation data. Data from each province is normalizedwith the average precipitation to show only the variations in precipitation. When the precipitation iszero, this also sets the �ow to zero, which does not well represent realistic situations in rivers. Therefore,all dekads with precipitation 0 mm were set to 1 mm. These variations are leveled with the average �owdata from the 17 sites to form an estimated �ow variation curve for each site. The �ow variation curvesfor the 17 sites in Manica are presented in Appendix D.The river capacity is calculated for the sites that are within the head range of at least one of theturbines. Inputs to this calculation are the head data from the 17 sites, de�ned as gross head, and the�ow level for each dekad on the sites. The power capacity of the river is expressed by Equation 4.1(Williamsson et al., 2011), an extended version of Equation 3.1.Priver = p ·Q · g · L ·Hg (4.1)
L = Net head factor [0.90]A net head factor of 90 % was added to take into account the kinetic energy lost due to friction in thecanal and penstock (Ajith Kumara et al., 2002, Renewables First, 2012).The system power output is simply the river capacity , but where the turbine e�ciency, η, has beenconsidered, Equation 4.2.Psystem = ηPriver (4.2)The turbine e�ciency is a function of the ratio between �ow and rated �ow of the turbine (British hydro,2004). E�ciency curves are shown in Figure 4.4 for the two turbine models used and for a Cross�owwith divided nozzle. No studies have been carried out on the e�ciency of the locally produced designs,so typical e�ciency curves from literature are used. Taking into account complaints on the quality of thelocally produced turbines it is likely that the real e�ciency is lower than modeled.
Figure 4.4: Turbine e�ciency. The red curve shows the e�ciency of a Pelton turbine, the blue curve shows the e�ciency of aCross�ow turbine and the black curve shows the e�ciency of a variable Cross�ow.In those cases where the calculated system power output exceeds the turbine capacity, the systempower output is set to the maximum turbine output at the current e�ciency level:Psystem = ηPmax,turbine (4.3)Nine demand scenarios are compared against the calculated system power output to determine if thesystem power output is enough to suit a certain type of community. The nine demand scenarios arebased on three load pro�les with a selected number of households. Since the power demand in the loadpro�les describes the worst case demand at all times during the day, two variables control the acceptabledemand coverage of the simulation. The �rst variable is acceptable coverage level of demand. It setsthe percentage of maximum daily power demand covered to render an approved site. The maximumdaily power demand is either during day or evening time depending on the number of households in26

the simulation. The second variable is acceptable yearly coverage of demand. It opens the possibility ofaccepting a site even though the demand is not completely covered during the dry season.As a �nal step are installation costs calculated, after all sites have been evaluated as suitable orunsuitable to �t turbine designs and load pro�les.4.2.5 Load pro�lesThe load pro�les created in the model are based on typical electrical applications, with correspondingpower demand, that are used in communities in Tanzania. The applications are sorted as domestic useapplications, such as light bulbs, radios and charging of cell phones; productive use applications as shops,grinding mills or welding devices; and public use applications, like schools, clinics, water pumps andstreet lights. Domestic use applications are aggregated into four levels of power demands: low, medium,middle and high (Blennow, 2004).Three di�erent community pro�les are created, assumed as small, medium and large consumers ofelectricity. Applications from all usage groups are selected to the pro�les. To facilitate analysis arenine demand scenarios created from the community pro�les for 5, 20 and 80 households. The maximumdemand level of the scenarios can be found in Table 4.8. A full presentation of the applications for allload pro�les is in Appendix C.Table 4.8: Maximum demand for a small, medium and large community pro�le for 5, 20 and 80 households.No of households [HH] Small [kW] Medium [kW] Large [kW]5 2.1 4.1 5.720 5.1 7.1 9.180 17 19 29The load demand is divided into day time, evening time and night time, to represent varying elec-tricity use during the hours of the day. The electrical applications are sorted into these regions. Someapplications, like households, are considered switched on during the evening, while most productive usewas considered switched o�.The number of selected households does not in�uence the productive use or the public use applications,and therefore neither daytime or night time power demand. Figure 4.5 shows the three load pro�les fora community of 5, 20 and 80 households.
27

(a) 5 households (b) 20 households
(c) 80 householdsFigure 4.5: Demand pro�les for 5, 20 and 80 households. The blue, red and green curves represent small, medium and highdemand pro�les respectively.4.2.6 Cost estimationThe installation cost of a hydropower station is estimated as a step in the evaluation of the technologicaland resource potential. The system includes civil works, penstock, electromechanical equipment, powergrid and cost for household connections. Civil works comprises of building a canal, a power house andforebay tank. The calculations are based on two scenarios, one where the total cost for civil worksis included and one where 50% of the cost is contributed by the community or the local operator.Local manpower is considered used in the community contribution case and does therefore not adda cost. Case studies in Zimbabwe show community contribution lowers costs of civil works with atleast 25% (Mutubuki-Makuyana, 2011) and the operator of the Ndirire station had by himself built thecanal and forebay tank, indicating this is a realistic assumption. Electromechanical equipment comprisesthe turbine, generator and controlling equipment. Gathered cost estimates are presented in Table 4.9.The �gures are gathered from Mozambique as well as similar projects in Zimbabwe, Kenya, Nepal andIndonesia.The cost for the power grid depends on the location of the river in relation to the community, andhow scattered the people live. Mentioned in many interviews is the fact that people live very scattered.According to the local NGO a radius of 1 km from the power station is a normal limit for houses to beconnected to the grid. The grid has been calculated in two ways.A grid cost model, depending on number of households, is created with the purpose of giving a morelikely scenario for the case of 1-10 connected households. It is not likely that the same amount of grid is28

Table 4.9: Cost estimates. 1Figures are from similar projects in Indonesia (Meier and Fischer, 2011). 2Figures are from similarprojects in Zimbabwe (Mutubuki-Makuyana, 2011) and Kenya (Maher, 2002). 3Figures are from similar project in Nepal (Smithand Ranjitkar, 2000).4Electromechanical equipment comprises the turbine, generator and controlling equipment. All other �guresare collected during the stay in Mozambique. Pelton [50 kW] Cross�ow [3 kW]Price Unit Price UnitCivil works 945001 USD 56701 USDCivil works 50% local contribution 472501 USD 28401 USDPenstock PVC 272 USD/m 72 USD/mElectrical equipment4 Total cost 11070 USD - USDGenerator - USD 11341 USDELC - USD 6603 USDTurbine - USD 2000 USDPower grid Complete grid [4 km] 19680 USD 19680 USDLocally produced 4920 USD/km 4920 USD/kmHousehold connection per household 228-320 USD/HH 228-320 USD/HHused for 5 as for 80 households. Therefore, the grid length is modeled divided into three intervals, basedon number of households. The distance from river to powerhouse is set to 1 km. The cost for 1 to 5households is estimated as the cost of an initial cable length of 1 km and an additional 250 meters ofgrid per household. For 6 to 10 household, the initial length of grid is set to 1500 meters, adding 150meters per household. Finally, for 11 to 100 households the total grid length, including river power housedistance, is set to 4 km, corresponding to the standard cost of a grid stated by one of the respondents. Atthis point an increase of households is considered equivalent to an increase in house density and thereforeno extra distribution cable is expected for each household.Table 4.10 shows typical installation costs stated by a FUNAE employee, working closely with theinternational governmental entity GIZ. These costs are used as a comparison to the calculated installationcost. The cost of a FUNAE project is higher for a 50 kW system due to the obligation to tenderingconsultants and additional administrative costs.Table 4.10: Data on investment costs from FUNAE employee.GIZ cost [USD] FUNAE cost [USD]Cross�ow, 3 kW-system 8 800 -Pelton, 50 kW-system 50 000 2 500 000
29

4.2.7 Extrapolation of dataDi�erences in precipitation in the provinces show Zambézia province have the highest amount of pre-cipitation. Figure 4.6 shows precipitation normalized to the yearly variation in Manica province whereZambézia has a precipitation level above one, ten out of twelve months of the year. As an exampleZambézia has a lowest monthly precipitation of 9 mm compared to Niassa where the lowest level is 3mm.2 4 6 8 10 12
0
0.5
1
1.5
2
Manica [months]
norm
aliz
ed p
reci
pita
tion
2 4 6 8 10 120
0.5
1
1.5
Niassa [months]
norm
aliz
ed p
reci
pita
tion
2 4 6 8 10 120
0.5
1
1.5
Tete [months]
norm
aliz
ed p
reci
pita
tion
2 4 6 8 10 120
2
4
6
Zambézia [months]
norm
aliz
ed p
reci
pita
tion
Figure 4.6: Yearly precipitation levels in Niassa, Tete and Zambézia provinces, normalized to the precipitation levels in Manicaprovince.Based on this, Tete and Niassa provinces are modeled with lower levels of �ow, and Zambézia withhigher levels, relative to the average �ow in Manica province.The head data for provinces other than Manica were estimated simply by adding a factor to theManica head data, based on a topographical map. The estimation was also based on comments fromrespondents during the interviews, that Niassa and Zambézia have lower head levels than Manica. Chosenfactors are presented in Table 4.11.Table 4.11: Head factors used for extrapolation to Tete, Zambézia and Niassa provinces.Province Manica Tete Zambézia NiassaHead factor 1 1 0.7 0.54.2.8 Assumptions and limitationsThe following is assumed in the modeling of the technical and resource potential of pico and microhydropower in Mozambique:� The 17 sites in Manica province can, in this thesis, represent the potential of Manica province.� Head levels in Tete, Niassa and Zambézia provinces can be described by a factor of head levels inManica province.� Flow levels in Manica, Tete, Niassa and Zambézia provinces are directly linked to the levels ofprecipitation in the provinces.� The turbines available are the Pelton turbine (50 kW) and the Cross�ow turbine (3 kW).� There is one single rated �ow available for the Pelton turbine, and one for the Cross�ow.� All schemes at sites with head levels higher than the head range of a turbine, can be constructedto �t the rated head. 30

� All sites with head levels lower than the rated head for a turbine are considered unsuitable forschemes with that turbine.� All schemes at sites with �ow levels higher than the rated �ow for a turbine, can be constructed to�t the rated �ow.� The electrical applications used in rural communities in Mozambique have a similar power demandas applications in rural communities in Tanzania.� The installation costs of equipment from projects in countries other than Mozambique can representMozambican prices.� Community labor can be voluntary or render shares in the schemes, therefore salaries are notincluded in the installation cost estimation.4.2.9 AnalysisThe results from the model calculations are shown in bar-diagrams to easily compare the power outputfrom the di�erent sites. The maximum power output guaranteed for 100%, 80% and 50% of the year iscompared with the demand pro�les to get an overview of the potential. This way of analyzing the resultsre�ects the respondents interest in a continuous electricity supply.The cost of the hydro schemes was evaluated as cost per household and cost per power output of thesystem in kW for sites with 5, 20 and 80 households. Since no estimate of the run time for electricalequipment was done, cost per kWh was excluded.A sensitivity analysis was made to investigate how di�erent input parameters in�uence the outcomefrom the model. The sensitivity analysis included analysis with a change of ±10% of head values, average�ow values and spread of seasonal change in �ow. The spread is altered by changing the �ow data sothat all data either approaches or recedes from the mean value, decreasing or increasing the spread.
31

Chapter 5ResultsAll results from interviews and modeling are presented in this chapter. In the �rst section the identi�edbarriers from interviews with stakeholders are presented in groups, together with the possible ways ofovercoming barriers. This is followed by a presentation of the results from modeling the 17 sites inManica.5.1 Barriers to pico and micro hydropower from interviewsBarriers to pico and micro hydropower development have been mapped based on stakeholders' opinions.They are presented grouped in themes. A detailed description of the origin of the barriers in initial themescan be found in the methodology section. For each theme, the barriers are followed by possible ways toovercome them, suggested by stakeholders. The groups of barriers are illustrated with tables for eachtheme, where the respondents from Maputo are presented �rst from the left (1-8), and the respondentsfrom outside of Maputo are presented to the right (9-13). Excluded from these tables are the respondentswhere the state of the interview was not semi-structured. A matrix showing all barriers and respondentsis included in Appendix E.5.1.1 Availability of equipmentBarriers connected to availability of equipment are divided into four areas. Low quality of local prod-ucts concerns barriers originating in use of locally produced equipment while High import duties dealswith those connected to importing equipment. Limited rural infrastructure concerns barriers caused byremoteness and poor road conditions and Lack of access to spare parts regards lack of lack of access tospare parts as a barrier. Table 5.1 shows which of the respondents that see di�erent aspects of availabilityof equipment as a barrier to pico and micro hydropower development.Table 5.1: Respondents addressing the matter of availability of equipment. The letter B indicates the respondent considersthe matter as a barrier. The letter O indicates a suggestion to overcome barriers, and a vertical line means the subject is simplyaddressed. 1 - NDRE, 2 - FUNAE A, 3 - EdM A, 4 - Donor A, 5 - Donor B, 6 - Gov. ent. employee A, 7 - Consultants A&B, 8-Consultant C, 9 - FUNAE B, 10 - EdM B, 11 - Gov. ent. employee B, 12 - NGO A, 13 - NGO B employees.1 2 3 4 5 6 7 8 9 10 11 12 13Low quality of local products B | | B B BHigh import duties B O | | | B B |Limited rural infrastructure | B B O B | |Lack of access to spare parts O B B O B OLow quality of local productsMost of the equipment used for pico and micro hydro projects not initialized by the government are locallyproduced (NGO A, FUNAE A and B). Gov. ent. employee A and B and both NGOs, all working closelywith the present pico and hydro projects in Manica province, say the locally produced equipment in somecases have poor quality. The local respondents FUNAE B and EdM B have not mentioned this. They32

think it would be better to produce more locally because it is cheaper and creates work opportunities.Consultant C agrees that locally produced equipment has low quality. However, he does not point itout as a barrier, but argues that it is not always necessary to produce everything in Mozambique. Gov.ent. employee B says that a barrier to more locally produced equipment is lack of entrepreneurshipamong potential manufacturers. Few manufacturers have picked up the business after visiting workshopsteaching local companies how to build turbines.High import dutiesMost equipment for larger hydropower stations is imported (Consultants A and B, Donor A, EdM Aand B). The high import duty increases the cost of the equipment, which makes import disadvantageous(NDRE, EdM B). The quality of the imported equipment is questioned by Consultants A and B. Althoughthey do not have experience of pico and micro hydro, they both agree that too much low quality equipmentused in other on or o� grid systems is imported from China and India. If the equipment is not locallyproduced, EdM A stresses the importance of training to ensure maintenance skills.Some countries lower the import duties for renewable energy equipment. Gov. ent. employee Bexplains the di�culty of doing this, since it will also lower the income used for civil servants' salaries.NDRE considers local production a good alternative to overcome the economic barrier cause by the highprice of imported equipment.Limited rural infrastructureMost stakeholders agree that the conditions of the roads are poor (FUNAE A and B, EdM A and B,NDRE, Gov. ent. employee A, Consultants A and B). FUNAE A and EdM A see the limited ruralinfrastructure as a barrier, and Consultant A and B see it as a main challenge to ensure sites areaccessible. To get to a new site, a road must be built, so the consequence is an increased investment costfor the project (FUNAE A and B). EdM B �nds there are problems, but there is always a way to solvethem and Gov. ent. employee A claims it is a matter of planning construction during the dry periodof the year. NDRE explains that accessing sites is not a problem since the government is interested ininfrastructure projects.Lack of access to spare partsBoth EdM A and Donor A say that the availability of spare parts can be a constraint. Gov. ent. employeeA says that lack of spare parts is a �nancial risk for the operator since there is no revenue during stop.Some respondents do not see lack of spare parts as a barrier to pico and micro hydro development.NGO B employees report that managing spare parts has worked well in their projects. Donor A, whosees it as a barrier, suggests a stack of spares should always be included in a project as a way to ensureavailability of spares. FUNAE A agrees. NGO B employees' solution is to keep operators informed ofwhere to �nd suppliers, and ensure there is a willingness to pay.5.1.2 Community relationsBarriers associated with community relations are divided into three areas. Lack of local involvement coversproblems where there is not enough involvement from the community. Community relations hinder powerstation management consists of barriers where ownership models and con�ict management are central.Lack of local contribution deals with a lack of labor and material contributed by communities. Table 5.2shows which of the respondents that see the di�erent community relations areas as a barrier to pico andmicro hydropower development.Lack of local involvementNGO B employees, Donor A and Gov. ent. employee B all see lack of local involvement as a barrierto pico and micro hydropower development. The NGO B employees learned that when a project failedit was often because they didn't include the operators in the construction process, and so there was nofeeling of ownership. If the local leaders of the community have not been su�ciently involved, the NGOwill not have good enough communication with the community to solve problems that might arise. Gov.ent. employee B feels that the local people should act as the promoters, to make the project sustainable.The community interventions done so far by the governmental agency and NGO A and B has broughtgood examples, which marks them as a possible way of overcoming Lack of local involvement. Gov. ent.33

Table 5.2: Respondents addressing the matter of community relations. The letter B indicates the respondent considers thematter as a barrier. The letter O indicates a suggestion to overcome barriers, and a vertical line means the subject is simplyaddressed. 1 - NDRE, 2 - FUNAE A, 3 - EdM A, 4 - Donor A, 5 - Donor B, 6 - Gov. ent. employee A, 7 - Consultants A&B, 8-Consultant C, 9 - FUNAE B, 10 - EdM B, 11 - Gov. ent. employee B, 12 - NGO A, 13 - NGO B employees.1 2 3 4 5 6 7 8 9 10 11 12 13Lack of local involvement B B B O O B OCommunity relations hinder B B | B Opower station managementLack of local contribution B O Bemployee B and NGO A discuss how to work together with the operators, for example in the sense thatthe entrepreneurs, who build their own turbines out of old cog wheels, are to be treated with respectfor what they have accomplished. To involve the operators, Gov. ent. employee B describes how thesystems are changed from within, improving only the things the operators want improved and inspiringthem with examples of better turbines in other communities. This is a better alternative to what is oftenthe case, when the systems are changed or replaced entirely without the entrepreneurs' consent. NGO Bdoes community gatherings to try to involve the local leaderships and the rural district council.Community relations hinder power station managementGov. ent. employee C and NGO B explain that the ownership model to use depends on how thecommunity works socially. There are di�erences that need to be considered. A bad communication withthe community can lead to di�culties in mobilizing the community. Community con�icts can get in theway and cause complications and delays (NGO B). EdM B thinks community based projects are moredi�cult to maintain due to community con�icts. The RDCO has experienced problems where people didnot want to confront their neighbors, for example when some users breached their meters. ConsultantC concludes that there are examples of community based projects that work, but that it often results inproblems with payment, mismanagement of funds, people not having proper technical background, andthat people trained by the project move away from the community. NGO B employees �nd the privateowner model more sustainable when in use, but it is very di�cult in the construction phase. With thismodel the owner is responsible for mobilizing labor from the community, which is complicated.NGO B employees want to do projects to prove there are cases where independent power projects canbe done by communities. �Communities can manage decentralized energy systems. They can do that!�they claim. To overcome the di�culties, the ownership model needs to be chosen by the community andclearly communicated. Gov. ent. employee B wants to promote the private owner model for Mozambique,along with almost all other respondents. For a system smaller than 100 kW Consultant C thinks thereshould be a private owner. Above that, they need to work with communities.Lack of local contributionIn Mozambique, Gov. ent. employee B observes that voluntary work is slowly dying, which leads todi�culties for the operator to mobilize communities. He believes it is because donations from the westernworld has an incapacitating e�ect. NGO B employees �nd that people sometimes don't really anticipatehow much work they have agreed on participating in. When they discover that they are less motivated.Examples of ways to overcome barriers associated with community contribution, are for instanceprojects outside of Mozambique, where a shareholder model has been used. The RDCO describes howpeople living outside of the grid range, who would not bene�t directly from the project, still came and didwork to get shares in the station. NGO B employees tell of a project outside of Mozambique, where theproject does not pay for community labor like carrying equipment, building structure and connections,and where material like pit sand and stones for the canals are provided as an investment from thecommunity. They claim it had a good e�ect on the sustainability of the project.5.1.3 Data and measurementsData and measurements covers barriers associated with collecting and handling measurement data. Table5.3 shows which of the respondents that see Lack of adequate data and measurements as a barrier forpico and micro hydro. 34

Table 5.3: Respondents addressing the matter of data collection. The letter B indicates the respondent considers the matter asa barrier. The letter O indicates a suggestion to overcome barriers, and a vertical line means the subject is simply addressed. 1 -NDRE, 2 - FUNAE A, 3 - EdM A, 4 - Donor A, 5 - Donor B, 6 - Gov. ent. employee A, 7 - Consultants A&B, 8- Consultant C, 9- FUNAE B, 10 - EdM B, 11 - Gov. ent. employee B, 12 - NGO A, 13 - NGO B employees.1 2 3 4 5 6 7 8 9 10 11 12 13Lack of adequate data B O B O | B O B Oand measurementsConsultants A and B think the main data problem is accessing hydrological data. EdM A con�rms this,saying that �ow characterization of the rivers is something they lack. FUNAE uses precipitation data as abase for �ow estimation, but FUNAE A feels that the precipitation data from the meteorological instituteis not always accurate. Consultant C has experience of consultants who worked with listing potentialsites, but lacked the competence of doing this properly. Consultant C also brings up the problem withine�ciency in government or company structures. The request for measurements have to go throughthe hierarchies, which can be very time consuming. Gov. ent. employee B's entity has collected datathemselves during some time, but expresses the lack of continuously collected measurements.Since FUNAE started using the program Google Earth as a tool in selecting sites for pico and microhydro, there has been less time wasted on going to sites where there is clearly not any potential atall (Consultant A, B and C). EdM A thinks restoration of the old measurement stations from the pre-independency era would be helpful. FUNAE is already working on a hydro atlas for parts of Mozambique.FUNAE A thinks it could be possible to make an agreement with other organizations to work togetherwith data collection. Gov. ent. employee B has ideas to use commercial companies or students to domeasurements. This could be easily done since no engineering skills are required to do these simple tasks.The analysis of the measurement data could be done at a university with hydropower students.5.1.4 DemandDemand barriers are divided into two areas. Low demand and low level of productive use covers allopinions that the electricity today is not well used in the communities. Di�culties sizing systems containsbarriers connected to di�culties in choosing the right size the of system. Table 5.4 shows which of therespondents that see the di�erent demand areas as a barrier to pico and micro hydropower development.Table 5.4: Respondents addressing the matter of demand. The letter B indicates the respondent considers the matter as abarrier. The letter O indicates a suggestion to overcome barriers, and a vertical line means the subject is simply addressed. 1 -NDRE, 2 - FUNAE A, 3 - EdM A, 4 - Donor A, 5 - Donor B, 6 - Gov. ent. employee A, 7 - Consultants A&B, 8- Consultant C, 9- FUNAE B, 10 - EdM B, 11 - Gov. ent. employee B, 12 - NGO A, 13 - NGO B employees.1 2 3 4 5 6 7 8 9 10 11 12 13Low demand and low level of productive use B O B | B | B O BDi�culties sizing systems | | B B | BLow demand and low level of productive useNGO A's impression is that the NGO partners in electri�cation projects evaluate the bene�t for thecommunity only by counting lights. �You have to look at power as part of community development, notonly lights� he claims. Donor B and NGO B employees agree. There is a low demand in rural Mozam-bique. Sustainability is di�cult with only household connections and to get more activities is a greatchallenge. FUNAE A is struggling to promote productive use. Consultant A and B believe industrializingagriculture could make electri�cation viable in general and not only considering hydropower. However,today agriculture is done by hand and at a small scale.NGO A has many ideas of how communities could use electricity for productive purposes. He believesagro-processing is a good area to promote for economic growth, and that there should be a micro �nancestrategy to support businesses. Today crops are only available during their respective season, and then themarket is �ooded with them. If the fruit would be processed the prices could be higher and the incomewould be more stable. He also holds the opinion that EdM ought to promote electricity for cooking,although this is something not agreed on by the employees from NGO B. Their experience is that pico35

and micro hydropower cannot support the power for cooking, a very power consuming activity. Gov.ent. employee A has witnessed several examples where electricity access from hydro power systems hashelped to create new business activities. �Many entrepreneurs will start developing or trying to upgradetheir business undertakings as soon as they have access to electricity� he says. Consultant C does notbelieve electricity automatically means economic growth, but that there is a need for support to startproductive activities. EdM A thinks the government should give �scal bene�ts to make small industriesmove to o� grid systems. Gov. ent. employee A and Consultant C point out hydropower as speci�callysuitable for productive use since it can use mechanical power and support high power loads.Di�culties sizing systemsConsultants A and B say that people often consume less than expected from a baseline study. Gov. ent.employee A explains the problems that it might bring when the operator is �nancing the station. With alarge station with few connected users the operator might not get enough revenue, and the loan cannotbe paid back. The same problem is expressed by Gov. ent. employee B who would have liked to do somesystems smaller. �We should have started with pico. Now everyone wants large stations even thoughpico would be enough. The systems we have now are working on 10-15%�. A certain over sizing is forfuture population growth. NGO A does not think it makes economic sense to build large systems for justa few people. Consultant C agrees. Sometimes the households can only a�ord one or two light bulbs.�You are just going to end up heating a lot of air with your stabilization system.� And if the systemis too large there will be a lot of investment that cannot be used for anything else, he continues. Theopportunity cost can be really high. The problem of under sizing the systems is also mentioned. EdM Astresses the need to plan for the future growth in the demand. �We have to think: If we introduce theegg today, how many chickens will we have in three years?� Still he is aware of the need for somethingto accommodate the gap between ability to pay and estimated installed capacity. Gov. ent. employee Asays that productive use can be hard to predict, since companies might start unexpectedly. This increasein demand is di�cult to take into account when sizing a system.The method of starting with a small system and expanding it when needed, to overcome barriersoriginating from oversizing, is thought of di�erently. NGO B employees add that it increases the levelof experience needed to operate and maintain the station. Consultant C has, along with respondentswho do not consider di�culties sizing systems a barrier, not experienced any problems with upgradingsystems so far, but he cautiously reminds that they are only in the beginning of pico and micro hydrodevelopment. Gov. ent. employee B is positive towards upgrading systems, but agrees that it is also acostly process. Also, the sizing of the systems is handled with a population growth in mind according toGov. ent. employee B. They do not take any other growth factor into account since the present demandis only a fraction of the available capacity at the sites.5.1.5 DesignBarriers associated with design issues are divided into three areas. Poor design describes general problemswith designing pico and micro hydro. Lack of proper maintenance covers opinions where problems withmaintenance are a barrier and Scattered population in communities describes the barrier of dispersedhouses within villages. Figure 5.5 shows which of the respondents that see the di�erent design areas asa barrier to pico and micro hydropower development.Table 5.5: Respondents addressing the matter of design. The letter B indicates the respondent considers the matter as a barrier.The letter O indicates a suggestion to overcome barriers, and a vertical line means the subject is simply addressed. 1 - NDRE, 2 -FUNAE A, 3 - EdM A, 4 - Donor A, 5 - Donor B, 6 - Gov. ent. employee A, 7 - Consultants A&B, 8- Consultant C, 9 - FUNAEB, 10 - EdM B, 11 - Gov. ent. employee B, 12 - NGO A, 13 - NGO B employees.1 2 3 4 5 6 7 8 9 10 11 12 13Poor design B B B | BLack of proper maintenance B O O B O B B B O B O B B O B O OScattered population in B B O B O Bcommunities36

Poor designDonor A and NGO B believes it is a barrier if systems are too complicated, since it will cause problemswith maintenance and spare parts. The Power system owner has had problems with the system due topoor design that hindered water from �owing in the pipes. EdM B tells of a project where insu�cientpre-studies led to bad design and failure in the system.NGO B employees say that few bearings, and few gears and other mechanically advanced componentsin a design, is favorable to limit the need for maintenance. NGO A has been criticized for not designingthe systems well enough. He agrees it would be better to make everything function perfectly, but theNGO has a limited budget and he thinks it is better to reach many bene�ciaries.Lack of proper maintenanceLack of proper maintenance has been brought up as a barrier to pico and micro hydropower developmentby several stakeholders (NDRE, EdM B, Consultants A,B and C, Gov. ent. employee A and B, NGOA, FUNAE B). FUNAE B says it is important to have a functional system which delivers electricitycontinuously. If not, the customers get disappointed. NDRE and Consultant C have experience of dam-aged equipment and system breakdowns. Gov. ent. employee B says there is no culture of maintenancein Mozambique. In some local languages there is not a translation for the word. Consultants A and Bhave the same experience. NGO A explains how the problem sometimes is that there is no money to�x leakages or do reparations. FUNAE B adds that even if there is money, the administration can belacking. In one project the money needed for maintenance was paid, but had disappeared too far up inthe administrative hierarchy to be reached when needed.NGO A thinks hydropower is technically reliable, as long as the maintenance is handled. Both Consul-tant C and FUNAE A think hydro is much easier to maintain than solar. NGO B employees and FUNAEB think the systems need to be designed as basic as possible. This will make the maintenance easier.The RDCO believes the hydropowered community in his district has been able to handle maintenanceand other issues so well because of their feeling of ownership. NGO A and NGO B employees have madesure the operators know who to contact if there is a problem they can't handle. EdM A describes this asthe way to overcome the lack of proper maintenance. �If you just train someone to do the maintenance,there will be no problem. If there is someone in the area who is trained, they can talk on the phone andget instructions.� Consultant A and B stress the need to return to communities and follow up on thetraining. To include the operators and the rest of the community in the construction process will makethem more con�dent and able to maintain and repair the system (Consultant A, B and C, EdM A andNGO B employees). Donor A believes it is important to have a maintenance policy from the beginningof a project. Gov. ent. employee B wants to capacitate a local turbine manufacturer so that they couldbe responsible for maintenance for the turbines they sell. �My dream is to have them on a motorbike.They would sell, deliver, install together with the Ministry of Energy, and then handle the maintenance.�FUNAE A describes the plans to let local companies handle the maintenance and monitoring of theirstations, to hold FUNAE's operational costs down. NGO A presents a solution to the lack of money formaintenance as to use money from revolving funds as a source for funds. This is soon to be put in useby the NGO. However it is criticized by Gov. ent. employee B, who has experience of projects dyingbecause of this.Scattered population in communitiesEdM A describes what many agree is a barrier to rural electri�cation. �The problem is that in rural areasthe network is so dispersed. To get a system for the people is quite di�cult.� NGO A explains that thebudget allows for 1500 m length of line to cover for a scheme. And sometimes the houses are 200-300mapart. FUNAE B has a limit radius of 1000 m. Within that they are connected. Outside this it doesn'twork due to the voltage drop. NDRE underlines this di�culty since the houses sometimes are even 1000m apart. Consultant A and B believe there are very few places where there are as much as 500 people inthe same village.A solution to the problem of scattered houses is to o�er people to move closer to the village center(FUNAE B). Young people will want to move. For those who don't want to, due to family or traditionalreasons, there could be a battery charging station. EdM A and Gov. ent. employee B thinks there shouldbe urban planning.37

5.1.6 FinanceFinancial barriers are divided into three areas. Barriers regarding the lack of �nancial resources in someway are coded as Lack of access to �nance. When the problem seems to be that the technology isexpensive, the coding is High investment cost. Lack of investor interest expresses the lack of interestfrom possible investors. Table 5.6 shows which of the respondents that see the di�erent �nancial areasas a barrier to pico and micro hydro.Table 5.6: Respondents addressing the matter of �nance. The letter B indicates the respondent considers the matter as a barrier.The letter O indicates a suggestion to overcome barriers, and a vertical line means the subject is simply addressed. 1 - NDRE, 2 -FUNAE A, 3 - EdM A, 4 - Donor A, 5 - Donor B, 6 - Gov. ent. employee A, 7 - Consultants A&B, 8- Consultant C, 9 - FUNAEB, 10 - EdM B, 11 - Gov. ent. employee B, 12 - NGO A, 13 - NGO B employees.1 2 3 4 5 6 7 8 9 10 11 12 13Lack of access to �nance B B B O B B B O B BHigh investment cost | B O B B O | O O OLack of investor interest O B O | | O B | B O B OLack of access to �nanceThe barrier of there being a de�cit in �nancial resources is addressed by many respondents (NDRE,FUNAE A, EdM A and B, Donor A and B, Gov. ent. employee A, Consultant C, NGO A and theCommittee member). NGO A has applied for funding to start projects in other provinces, but says thatthe Ministry of Energy has replied they don't have funds to give. FUNAE A informs of budget cuts, fromthe Ministry of Energy, which have hindered projects from being realized. NDRE �nds it is a challengeto get investments, and the Committee member states that the community station needs more �nanceto improve the leaking canal.When it comes to ideas of who should do the �nancing, EdM A suggests there could be a grantavailable directly through the banks, or that FUNAE could work as a bank to provide means for otherplayers to build and manage. Consultant C is not sure FUNAE should give loans at all. They areconsidered a give-away-organization, and the loans will not be paid back. He also claims that FUNAE'scapacity to ensure that people pay back is insu�cient. A bank or local administrative unit could workas an intermediate point to increase the capacity. To just give money away in projects is not always thebest to do, claims EdM A. �The best is to combine grant and loans to make people responsible�. Theidea of private investors for smaller schemes is mentioned by Consultant C.High investment costThe perception that pico and micro hydro is an expensive technology from an investment perspective isshared by FUNAE A, Consultants A, B and C and the Committee member. Consultant C has heardpeople say FUNAE's systems are too expensive. If they would do cheaper systems they could do more.All three consultants agree that some costs are easily overlooked, like the administration costs andthe development costs. Consultants A and B describe how the systems can get more expensive than itseems if there for example turns out to be a need of a dam. The grid and meters are other examples ofequipment that increases the investment cost. FUNAE B says it is the civil work that is most costly inthe construction, and Consultant C describes how the distance to the river adds a huge component tothe price. The committee member would like to line the canal of the community system with concrete,but that is much too expensive (the canal is 5-6 km long). FUNAE A's opinion is in line with the others.To decrease the investment costs is one of their focus issues.A way of lowering the investment cost is if community members can be motivated to contribute inthe construction and provide material for the scheme. EdM A, Consultant C, EdM B, NGO B employeesand RDCO believe there is capacity and willingness in the communities to do construction work. In aproject in RDCO's district, 20% of the investment cost comes from communities in the shape of laborand locally available materials.Consultant C stresses the opinion that hydropower is not the best choice for every site. A solution canbe to simply choose some other source of power, if hydro is not suitable. �If you choose hydro for someof these places where it doesn't make economic sense, it will be just to prove that you can do hydro.�He says the accusation of FUNAE doing expensive systems is true, but that the problem is complex.38

FUNAE is a government organization; they need to do systems that have a certain quality. NGO A, whohas the opposite experience of being criticized because the costs are held down too much, thinks for theirown conditions that it is better to do more systems even though they are not perfect.Lack of investor interestTo give loans to private operators of hydro stations, banks request guarantees with a 100% cash deposit.This is a matter discussed by Gov. ent. employee B and NGO A. Gov. ent. employee B thinks the banksare blocking the process. He has started discussions with FUNAE, who could give loans for communityprojects. Recently, Gov. ent. employee B claims, FUNAE has started to ask for guarantees as well.�We assumed the �nancing institutes would take the electromechanical equipment as guarantee, but theydon't. They would only put 10 or 25 percent of the investment into the equipment, it's nothing!� NGO Aexplains that the banks are unwilling to act at a community level and Gov. ent. employee B speculateson why. �The organizations come to the banks and give them guarantees, so they have all the projectsthey want. The mentality is spoiled; they are not looking for clients. They don't need your money.�Consultants A and B do not believe international donor agencies will fund pico or micro hydro projects,because of administration barriers. Donor A and B agrees that there is low interest in funding at themoment. FUNAE A's opinion is that the government needs to give more space to private investors,which contradicts Consultant C who has a feeling FUNAE is a bit reluctant in promoting private sectorparticipation.To gain the investors' interest, the feed-in tari�s are considered an important step, in NDRE's andFUNAE A's opinion. Gov. ent. employee B agrees that selling electricity to EdM is the easiest businessfor the operator, and is determined to keep close contact with EdM. The new plans of the organization,is that their small sites must �t within the regulation of grid connection. Gov. ent. employee A is surethe that interest of �nancial institutions in �nancing pico or micro hydro power systems will increase ifit can be demonstrated that private operator models work out and loans are paid back. NGO A plans todo some lobbying so that they can be heard at decision level and promote pico and micro hydropower.5.1.7 Knowledge and educationKnowledge and capacity building issues are divided into three areas. Lack of awareness of technologyconcerns insu�cient common knowledge of pico and micro hydropower in Mozambique. Lack of tech-nical expertise regards barriers connected to lack of technical expertise in the country. Poor knowledgemanagement deals with barriers connected to the present education system, spread of existing knowledgeand di�culties regarding training people to operate power stations. Table 5.7 shows which of the respon-dents that see the di�erent knowledge and education areas as a barrier to pico and micro hydropowerdevelopment.Table 5.7: Respondents addressing the matter of knowledge. The letter B indicates the respondent considers the matter as abarrier. The letter O indicates a suggestion to overcome barriers, and a vertical line means the subject is simply addressed. 1 -NDRE, 2 - FUNAE A, 3 - EdM A, 4 - Donor A, 5 - Donor B, 6 - Gov. ent. employee A, 7 - Consultants A&B, 8 - Consultant C, 9- FUNAE B, 10 - EdM B, 11 - Gov. ent. employee B, 12 - NGO A, 13 - NGO B employees.1 2 3 4 5 6 7 8 9 10 11 12 13Lack of awareness of B O B B B BtechnologyLack of technical expertise O B B B BPoor knowledge management B B O B O O B O B O O B O B O OLack of awareness of technologyMany stakeholders agree that there is very little common knowledge of pico and micro hydropower inMozambique (NDRE, Donor A, FUNAE A, Consultant A and B, NGO A) and that capacity buildingis needed. According to FUNAE A and the Power system owner, lack of awareness leads to lowerinvolvement on several sector levels. FUNAE A claims that many companies are not yet involved dueto a lack of awareness. The power system owner says users are less motivated when they don't trust anunknown technology. 39

To increase the awareness, NDRE will do a road show, spreading the awareness of pico and microhydropower. Gov. ent. employee C describes how much the awareness has grown just over the pastyears. �Before, people only knew about electricity from the main grid�, he says. �Now, even though wedon't advertise our systems, people hear of them because they know someone in another village who hasone.� Several respondents mention capacity building. RDCO believes study visits have played a largerole in convincing communities to try hydropower. And once they have seen it work, almost everybodywants training. This perception is shared by FUNAE A who thinks this might even present a problem.�Everybody wants to run the power plant, but there has to be someone quali�ed doing that� he says.Lack of technical expertiseEdM A mentions lack of skill to do maintenance, and the Committee member mentions lack of technicalexpertise locally as a barrier. Consultant A and B �nd that the lack of practical experience amongengineers is a potential barrier and Consultant C speaks of lack of competence among engineers when itcomes to data collection and site analysis. He �nds that more people need to be educated on the designpart of the process. NGO A describes a lack of technical expertise within the organization, but they arebeing capacitated.FUNAE A claims people will have the capacity to run small systems. People to do simple civil workslike digging canals already exist on a local level, according to EdM A.Poor knowledge managementNGO A says �the most critical and weak part of everything we are doing is documentation� which makesit di�cult to share information and knowledge within the hydro sector. EdM A points out that there isa lack of a body to discuss and share experiences today. Gov. ent. employee B says more focus needs tobe put on universities to make sure earlier experiences can be shared continuously. NDRE says there isonly one university teaching the technology today. A problem brought up by Consultants A, B and C isthat the few educated engineers who graduate move to other countries to get higher salaries. ConsultantA and B explain the issue of knowledge valued as power leading to unwillingness to spread knowledgeamong people. They also mention that the mentality of not questioning the education system results inpoor learning. FUNAE A tells of older stations not working due to poor training of the operators. AndConsultants A and B �nd there is a lack of continuation in training. There needs to be follow-ups on thetraining after a station is �nished.Sharing knowledge with operators and training them has, according to many respondents, workedwell (Gov. ent. employee B, AKSM, EdM A, RDCO, FUNAE B, NGO B employees). Involved actorshave training models including training in maintenance, leadership and economics. EdM A claims thatgood training is manageable, although quite di�cult. EdM B �nds that people in general accept andunderstand the instructions given. In those cases they do not, the problems are solved together with thecommunity.A common way to spread knowledge among communities, brought up during the interviews, is visitsto other power station projects to see positive examples of stations that function well (Gov. ent. employeeB, NGO B employees). Some of the respondents have themselves visited projects in adjacent countriesto learn more (Gov. ent. employee B, NGO A). FUNAE A explains the energy fund has strategies tostrengthen the capacity within the organization, con�rmed by EdM B, and some stakeholders say thereis communication and cooperation among them (Consultant C, Gov. ent. employee A, NGO A) leadingto continuous capacity building.Consultant C thinks it might work to start a specialization course or a master's degree on hydropower.Consultant A and B think the mentality problem they mentioned will disappear with a few generations,making education easier. Gov. ent. employee B explains the plans of a �Centre of excellence�, a jointproject between NGOs, companies and �ve universities, which is planned in Chimoio.NGO B employees want to capacitate other organizations in how to do community interventions. TheWorld Bank has requested increased cooperation between FUNAE and EdM. Gov. ent. employee A �ndsit a good development that several entities share an o�ce building in Chimoio. EdM A, who expressesa lack of a body for meetings, noticed that the National Directorate for New and Renewable Energywere at the IRENA conference last year, and hopes the directorate became aware of this and acts on it.Gov. ent. employee B tells of an operator who built his own hydropower station and now works with theMinistry of Energy, lecturing about hydropower for rural communities.Gov. ent. employee B was glad to �nd that operators they trained have a high initiative. Whensomething needs �xing, they don't wait for the NGO to visit, but instead they present what they have40

done to solve the problems. One way to overcome the problem of educated people moving to othercountries is to o�er them higher salaries. Consultant C explains salaries at FUNAE are higher than othergovernmental departments, in order to keep the employees.5.1.8 LegislationBarriers associated with legislation are divided into three areas. Too low electricity price regards thepricing of electricity. Lack of supporting legislation expresses the lack of support from the government.Lack of grid code and feed-in tari�s considers feed-in tari�s and common standards. Table 5.8 showswhich of the respondents that see the di�erent legislation areas as a barrier to pico and micro hydropowerdevelopment.Table 5.8: Respondents addressing the matter of legislation. The letter B indicates the respondent considers the matter as abarrier. The letter O indicates a suggestion to overcome barriers, and a vertical line means the subject is simply addressed. 1 -NDRE, 2 - FUNAE A, 3 - EdM A, 4 - Donor A, 5 - Donor B, 6 - Gov. ent. employee A, 7 - Consultants A&B, 8 - Consultant C, 9- FUNAE B, 10 - EdM B, 11 - Gov. ent. employee B, 12 - NGO A, 13 - NGO B employees.1 2 3 4 5 6 7 8 9 10 11 12 13Too low electricity price B | B |Lack of supporting legislation B | B BLack of grid code and feed-in tari�s B O B B B B B B |Too low electricity priceSome communities �nd the tari�s too low in terms of what they must spend for keeping the systemrunning (NGO A). Consultant A and B have experience from diesel generators where the electricity pricewas set too low even to buy the fuel, and so it couldn't keep running. Consultant C agrees the real costsof running a hydropower plant are much higher than 8-9 cents/kWh, the tari� used for EdM customers.In Mozambique o� grid tari�s are generally set at the same level as those of EdM.NGO B employees tell of a community in Zimbabwe where the electricity price is set by the communitythemselves. They pay 16 cents/kWh instead of the national price of 9 cents/kWh.Lack of supporting legislationNGO A does not feel enough government support. �You do not see them pushing us or applaudingus, and not �nancing either. What do we do when the international organizations leave?� One of theproblems Gov. ent. employee B has met is that the ministries have di�erent policies which do not meetwhen several are to be used simultaneously.Many respondents �nd the legislation supportive of pico and micro hydropower, without more com-ments. Gov. ent. employee A cannot say the laws are supporting, but they are not hindering either. Gov.ent. employee B says the government is supporting, but that they do not yet have enough experience.And the problem is that there is not yet an awareness of what laws there are. Gov. ent. employee Bis hopeful. �The director of NDRE is looking for projects that can demonstrate the application of theenergy policy. That is like an open invitation to come and do wonders!� Concerning the problems with thedi�erent policies, Gov. ent. employee B has spent time together with representatives from the ministriesand together with them developed a way of working through the policies.Lack of grid code and feed-in tari�sEdM A thinks the lack of a grid code is a problem. Consultant A and B say the cooperation betweenFUNAE and EdM has been poor, the standards of the equipment are not the same. FUNAE B claimsthat the FUNAE systems are constructed to be connected to the main grid, but Consultant C's viewis that this is not done yet. Consultant A and B have seen problems with aging diesel systems, wornby tough weather conditions, that would be di�cult to connect to the main grid without rehabilitation.They see a potential risk that similar complications can occur when connecting hydropower stations.FUNAE A sees a commercial risk once EdM reaches the area of an o�-grid system. EdM will have thecheapest prices and the o�-grid system would probably have to shut down. The lack of feed-in tari�s thatoblige EdM to buy electricity at a minimum price, is considered important by EdM A, NDRE, FUNAE41

A, Gov. ent. employee A and Donor B. Consultant C says it is important not to build o�-grid systemswhere it is not �nancially viable. �There is no use building a 250 kW plant in a place where the main gridis only three years away.� RDCO thinks it would be better for the community if they were not connectedto the grid at all.The NDRE is in a process with an American consultant company to develop feed-in tari�s for renew-able energy in Mozambique, obliging EdM to purchase electricity from renewable energy sources, at a setprice. EdM B does not see any problems with connecting o�-grid systems.5.1.9 PaymentBarriers associated with payment of electricity are divided into two areas. Low willingness and ability topay regards insu�cient willingness or ability to pay for electricity. Poor payment management includebarriers caused by general di�culties with getting customers to pay for electricity. Table 5.9 showswhich of the respondents that see the di�erent payment areas as a barrier to pico and micro hydropowerdevelopment.Table 5.9: Respondents addressing the matter of payment. The letter B indicates the respondent considers the matter as abarrier. The letter O indicates a suggestion to overcome barriers, and a vertical line means the subject is simply addressed. 1 -NDRE, 2 - FUNAE A, 3 - EdM A, 4 - Donor A, 5 - Donor B, 6 - Gov. ent. employee A, 7 - Consultants A&B, 8 - Consultant C, 9- FUNAE B, 10 - EdM B, 11 - Gov. ent. employee B, 12 - NGO A, 13 - NGO B employees.1 2 3 4 5 6 7 8 9 10 11 12 13Low willingness and ability to pay | B B B | B O OPoor payment management | B | B B B | O B BLow willingness and ability to payDonor B expresses what many others discuss. �It is a big challenge for people in rural areas to pay forelectricity. There is almost no willingness or ability to pay�. FUNAE B tells of an early project he visitedand discovered was not very successful. �There were only a few lights visible. The customers didn't pay,and then they were cut o��. FUNAE A describe the subsidized electricity prices and explains that therenever is capacity to pay the whole price for electricity.Others argue that the willingness to pay is there. Donor A says that those who have the ability arewilling to pay for electricity since it raises their quality of life. Consultant C is fascinated by how muchsocial impact electri�cation can have. �People wait to be electri�ed, they save money and then they buya new house�. Gov. ent. employee C suggests this could be the result of a change in identity broughtby electri�cation. NGO A and B are not worried about the willingness to pay. The NGOs do a baselinestudy and analyze how much people spend on energy. The committee does a selection to make sure onlythe ones that can a�ord to pay will be connected. �That way we are 90% sure the operators will havetheir revenues� (NGO A). NGO B explains how the willingness to pay changes as soon as people see thebene�ts of electricity.Poor payment managementConsultants A and B explain what happens when there is someone in a community who cannot pay theelectricity fee. For diesel systems this means the community has too little money to buy diesel. Thisresults in shorter electricity hours for the community, which leads to discontent and more people refuseto pay. Consultant C stresses the need for a mechanism to generate funds for maintenance, but alsostates that there are often problems with payment and mismanagement of funds. According to Gov. ent.employee C and NGO B employees, these problems often emerge because people in small communities arerelatives. Problematic situations can occur when there are people who don't pay. Gov. ent. employee Calso �nds that large customers take advantage of their in�uence in the community and neglect payment.This can be compared with the statements from Donor A and EdM B that have experience of the maingrid. There have been, or are still, problems with governmental organizations that get away with notpaying for electricity.FUNAE A has plans to let a private company collect monthly revenues. RDCO has good experienceof how the community handled problems with payment. When there were people breaching meters, itwas solved after they had a meeting. 42

Di�culties associated with the prepaid system are for example the extra investment cost they addto the project. NGO A explains how the system makes people use less electricity, which might result intoo low income for the operator, who will not be able to pay back the loan for the system. This is alsodiscussed by Gov. ent. employee C and can be compared with EdM B's report that the income of EdMwas less when they introduced the prepaid system on the main grid. People will just spend what theyneed, no more. The RDCO has recently been involved in solving problems with people who breach theirmeters after being trained in maintaining them. Gov. ent. employee C considers the di�culty of �ndingspare parts for the meters when needed.Although there are problems with the prepaid system, many prefer it to the postpaid system. If theycould a�ord it both NGO A and B would like to use the prepaid system. NGO B employees do not likethe postpaid system because there is not any switch o� structure. EdM A has experienced problems withpeople stealing electricity when using the postpaid system. FUNAE A tells of people trying to pay withother means than cash, since it is di�cult to have access to cash in the end of every month.Both FUNAE B and NGO B employees agree that the �at rate system is very unsatisfying. �Itdoesn't make sense that everybody pays the same� say NGO B employees. Gov. ent. employee B wantto improve the �at rate system by introducing user groups with di�erent prices, so the payment is fair.5.1.10 Project administrationBarriers associated with project administration are divided into two areas. Poor project administrationcontains barriers about how projects are managed from the organizations and companies side, separatedfrom administration barriers on community level. Time consuming processes describes expressions onproblems with long project processes. Table 5.10 shows which of the respondents that see the di�erentproject administration areas as a barrier to pico and micro hydropower development.Table 5.10: Respondents addressing the matter of project administration. The letter B indicates the respondent considers thematter as a barrier. The letter O indicates a suggestion to overcome barriers, and a vertical line means the subject is simplyaddressed. 1 - NDRE, 2 - FUNAE A, 3 - EdM A, 4 - Donor A, 5 - Donor B, 6 - Gov. ent. employee A, 7 - Consultants A&B, 8 -Consultant C, 9 - FUNAE B, 10 - EdM B, 11 - Gov. ent. employee B, 12 - NGO A, 13 - NGO B employees.1 2 3 4 5 6 7 8 9 10 11 12 13Poor project administration B O O O O O B OTime consuming processes B O B B B B | OPoor project administrationOne of the challenges the FUNAE hydro team deals with is to reduce the time and cost of the imple-mentations (FUNAE A). FUNAE B, Gov. ent. employee C and Power system owner tell of projects thathave stopped because of administrative problems.Donors A and B are hesitant to whether more money is really the way of supporting FUNAE. Theirimpression is that FUNAE has a limited capacity to take on more projects. Donor B expresses theopinion that the activities FUNAE starts need to multiply without FUNAE having to control everydetail. FUNAE A has an idea of making a call for proposals to the private sector. FUNAE could screenproject proposals and give credits or grants. Consultant C thinks the pico and micro hydro sector needsto be more developed, so each entity could take on fewer roles in the processes and increase e�ciency. Hethinks FUNAE should focus on �nancing, and the GIZ on capacity building, to make local NGOs able tohandle the projects on their own. When the private sector is more involved, FUNAE can take a step back,he says. Gov. ent. employee B describes the capacity building they do today. �We work together withpeople until they do it on their own. Soon they start taking own initiatives.� Donor A and Consultants Aand B mention the alternative to bundle projects together to minimize the administrative costs for eachsystem. Or FUNAE could receive a sort of sector-budget support and select projects themselves.Time consuming processesRespondents agree that the time consumption can be an important barrier for hydropower (FUNAE A,Donor A, Consultants A, B and C, EdM B). From identi�cation to implementation FUNAE A claims itis a four year process. Donor A and Consultant A and B describe the complicated process which theysay usually takes six years, and Consultant C says it could take up to eight years if the initiator and43

proponent is also the �nancier. Donor A thinks there could be a slightly shorter process with smallerprojects because there are fewer people involved, but when going through international �nancing agenciessome administration rules must be followed, and it will still take a lot of time. Consultant A and B thinkthat the technical training takes too long time, due to a bad learning mentality.NGO B employees would like to share their experience with FUNAE, since they believe they couldhelp to save time. FUNAE A wants to shorten the time consumption in the project process. Until nowexternal consultants have done pre-feasibility studies, but if FUNAE does that themselves they couldsave time, not having to waste time on tendering consultants.5.1.11 ResourcesBarriers connected to resources are divided into three areas. Lack of water resources concerns lack ofwater supply needed for hydropower. Competing resource use regards barriers emerged from irrigation andother competing uses of water, and Long distance transmission concerns the cases where the geographicaland hydrological conditions are met, but do not coincide with where there is demand. Table 5.11 showswhich of the respondents that see resources as a barrier to pico and micro hydropower development.Table 5.11: Respondents addressing the matter of resources. The letter B indicates the respondent considers the matter as abarrier. The letter O indicates a suggestion to overcome barriers, and a vertical line means the subject is simply addressed. 1 -NDRE, 2 - FUNAE A, 3 - EdM A, 4 - Donor A, 5 - Donor B, 6 - Gov. ent. employee A, 7 - Consultants A&B, 8 - Consultant C, 9- FUNAE B, 10 - EdM B, 11 - Gov. ent. employee B, 12 - NGO A, 13 - NGO B employees.1 2 3 4 5 6 7 8 9 10 11 12 13Lack of water resources B O B B B | BCompeting resource use B BLong distance transmission B B BLack of water resourcesRespondents have a unanimous awareness that the reliability of water resources varies within the country.EdM B, Gov. ent. employee A, Donor A and Consultants A and B all say that it is a challenge to havecontinuous water supply throughout the year in some areas of Mozambique. Consultants A and B don'tbelieve there is enough rain to �ll up the small rivers during the dry season, but they agree that the hilledparts in western Mozambique could be more reliable. However, during the interview with the committeemember in the western region, he mentions the problem with poor electricity distribution when the waterreaches a critical level in October. NGO B employees mention the problem of climate change. �Youcannot predict the river �ow in 10-20 years. It becomes really di�cult.�Donor A thinks it could be reasonable to balance pico and micro hydropower with a diesel generatorto ensure continuous electricity. It is not environmentally preferable, but economically.Competing resource useUse of water for other purposes than generating electricity can be a barrier for the development of picoand micro hydropower. NGO B employees explain that if a hydropower project is going to a�ect irrigationthere is no point of doing it. FUNAE B describes examples where people lead away the water to use atthe farms so there is no water left for the station.Long distance transmissionConsultants A and B say it is an important challenge to �nd sites where the hydropower station can belocated near enough to people. Consultant C agrees that if the distance is long it does not make sense tochoose hydropower. FUNAE A mentions the political in�uence in selecting potential sites as a possiblebarrier.Consultant C explains that when hydropower sites are located too far away it might be favorable tostep back and use solar PVs instead. He describes the long distance between rivers and communities asspeci�c for Mozambique. Since there is an annual �ooding of the rivers, communities must always havea safety distance to the water. 44

5.1.12 Main challengesAll respondents have been asked the question of what they believe are the main challenges for pico andmicro hydropower as a means of rural electri�cation in Mozambique. This is presented in Figure 5.12.Table 5.12: Main challenges.NDRE FUNAEA EdMA DonorA DonorB Gov.ent.employ
eeAConsultantsA&B FUNAEB EdMB NGOA NGOBemployeeAvailability of equipment Limited rural infrastructure BLack of access to spare parts BCommunity relations Project - community relations B B BDesign Poor design B B BLack of proper maintenance B B BScattered population in communities BFinance Lack of access to �nance B B B BLack of investor interest B BLegislation Lack of supporting legislation B BLack of grid code and feed-in tari�s BPayment Poor payment management BResources Lack of water resources BLong distance transmission BNDRE chooses the �nancial barrier of lack of investments to implement the technology as a mainchallenge. FUNAE A feels the government needs to be committed and give more space to privateinvestors to boost the �eld. He also thinks there is a need for more initiatives from entrepreneurs, fromthe private sector. FUNAE B states that the stations need to be close to perfect for the energy to bedelivered continuously. The contract for tari�s needs to be good, as well as the system of �at rate fees,which is often unfair.EdM A selects the investment issues as a main challenge as well, and speci�es that the loans needto be �cheap�. EdM B thinks the main challenge is lack of access to �nance. He has also experienceof failed projects, and mentions the importance of collecting detailed data during the feasibility studies.Donor A discusses four di�erent areas where the main challenges are. The maintenance and general longperspective, having local people with you in the process, that spare parts are available and that thedesign is not too technically complicated. Donor B stresses the need for establishing hydropower as anactivity people can engage in. Investors need to be connected to the demand side, which means that thechallenge lies in seeing the economy in selling energy. This is linked to the current lack of feed-in tari�s.Gov. ent. employee A sees the challenge of ensuring the quality of installation and maintenance as themost important, to have a continuous and stable supply of electricity. He also mentions the availabilityto credit facilities like banks as one of the main challenges. Gov. ent. employee B argues that the mainchallenge is having the projects in the hands of local people instead of using an outside drive. Today allthe resources come from the top, he reasons. You rarely �nd someone who starts at the bottom, going up.Nobody takes people who want to promote the technology seriously. Another issue is the sustainabilitywhen project money runs out and NGOs or organizations leave.NGO A feels that the main challenge is for the government to give more support and encouragement.NGO B employees stress the mobilizing of communities as most important. Consultants A and B describethe availability as an important problem for rural electri�cation in general, and the fact that people liveso scattered today, and maybe far from the river. Consultant C was mistakenly never asked the questionof main challenges so his opinion is not represented.
45

5.2 Technological and resource potential modelThe modeling of the 17 sites in Manica province, with all other data provided, shows di�erent aspectsof the suitability for the two turbine designs. As earlier described, the data from the Manica model areextrapolated to estimate the characteristics of the provinces Niassa, Tete and Zambézia. The results ofthe modeling are presented here, to provide a combined description of how geographical, technologicaland demographical factors in�uence the potential of pico and micro hydro in the four provinces.The province characteristics are described, as well as the result of the extrapolations of head range,followed by a presentation of the annual system power output. The costs per kilowatt and per householdare presented for the sites where at least one of the turbines showed some potential. Finally, a sensitivityanalysis is performed.5.2.1 Province characteristicsThe base for the extrapolation of the data to the three provinces Tete, Niassa and Zambézia, is the 17sites in Manica. The distribution of head and �ow levels for the sites is presented in Figure 5.1 togetherwith head ranges for both turbines. The province Tete is not presented, since the head levels are similarto those of Manica.
(a) Manica (b) Niassa
(c) ZambéziaFigure 5.1: Distribution of sites. Red lines, lowest head for Cross�ow/Pelton.A comparison is made in Table 5.13 to show how the extrapolation a�ects what sites are consideredsuitable for the two turbines, according to head range.46

Table 5.13: Number of sites with head within turbine head range.No of sites within head rangeProvince Cross�ow PeltonManica/Tete 17 11Zambézia 17 9Niassa 16 3Zambézia was modeled with head levels 30% lower than Manica, which has caused two of the sites tofall beneath the lowest head limit for Pelton turbines.The Niassa model, where the head levels have been modeled as 50% lower than in Manica, showslarger di�erences. All sites but the three with highest head levels have now dropped below the Peltonlowest head limit, and one is even below the head limit of the Cross�ow.5.2.2 Reliability of water resourcesA very important aspect to model is reliability of water resources throughout the year, for the di�erentsites. If the �ow level is low this a�ects the power output directly. In addition, if the �ow level is far fromthe rated �ow of the turbine, the turbine will be less e�cient. An example of the system power outputthroughout the year for six of the sites is presented in Figure 5.2. The selected sites have a head levelsuitable for both turbines and an average �ow level near 200 l/s (sites 1,2) and near 100 l/s (sites 3-6).10 20 30
0
10
20
30
40
50
dekads
outp
ut [k
W],
site
1
10 20 300
10
20
30
40
50
dekads
outp
ut [k
W],
site
2
10 20 300
10
20
30
40
50
dekads
outp
ut [k
W],
site
3
10 20 300
10
20
30
40
50
dekads
outp
ut [k
W],
site
4
10 20 300
10
20
30
40
50
dekads
outp
ut [k
W],
site
5
10 20 300
10
20
30
40
50
dekads
outp
ut [k
W],
site
6
System power output. Manica
(a) Pelton10 20 30
0
1
2
3
dekads
outp
ut [k
W],
site
1
10 20 300
1
2
3
dekads
outp
ut [k
W],
site
2
10 20 300
1
2
3
dekads
outp
ut [k
W],
site
3
10 20 300
1
2
3
dekads
outp
ut [k
W],
site
4
10 20 300
1
2
3
dekads
outp
ut [k
W],
site
5
10 20 300
1
2
3
dekads
outp
ut [k
W],
site
6
System power output. Manica
(b) Cross�owFigure 5.2: The system capacity of six high head/high �ow sites in Manica.The power output when using the Pelton turbine (Figure 5.2a) di�ers from close to maximum poweroutput during the rainy season, to near zero kilowatts during the dry season. The sites with a loweraverage �ow level are more a�ected by the dry period. The Cross�ow turbine on the other hand (Figure5.2b) does not require as high �ow levels due to its lower rating for �ow. The output from the sites withhigh �ow never drop near zero kilowatts and are close to the maximum output for a longer part of theyear than the Pelton.The maximum demand for di�erent load pro�les is calculated in the model (Table 4.8). Since themodel selects maximum load demand for all 24 hours of a day, and in that sense is not adjusted to realisticload situations, it is not expected that the system supports 100% of the load demand at all times. If thepower output available is 50% of the maximum demand, this might be enough for most part of the day.Figure 5.3 shows the minimum guaranteed system power output for 100% of the year, using the Peltonturbine for all the sites. It also shows the minimum output level guaranteed for 80% and 50% of the year.The reached levels can be compared with maximum demand of the three community load pro�les with5, 20 or 80 households respectively. The results for Niassa are similar to those of Tete, but only threesites (1, 2, 11) fall within the head range of the Pelton turbine. Therefore are the results for Niassa notpresented. 47

0 2 4 6 8 10 12 14 16 180
2
4
6
8
10
12
14
16
18
Sites
Out
put [
kW]
Annual system power output. Manica. Pelton turbine.
100%80%50%Demand profile 1Demand profile 2Demand profile 3
(a) Manica 0 2 4 6 8 10 12 14 16 180
2
4
6
8
10
12
14
16
18
Sites
Out
put [
kW]
Annual system power output. Zambezia. Pelton turbine.
100%80%50%Demand profile 1Demand profile 2Demand profile 3
(b) Zambézia
0 2 4 6 8 10 12 14 16 180
2
4
6
8
10
12
14
16
18
Sites
Out
put [
kW]
Annual system power output. Tete. Pelton turbine.
100%80%50%Demand profile 1Demand profile 2Demand profile 3
(c) TeteFigure 5.3: Demand coverage of Manica, Zambézia and Tete sites for the Pelton turbine. The bars represent the lowest demandcovered for 100% of the year (red), 80% of the year (blue) and 50% of the year (magenta). Also shown are demand levels of thedi�erent community load pro�les. The solid lines show load pro�le 1, the dashed lines show load pro�le 2, and the dash dottedlines show load pro�le 3. All pro�les show 5, 20 and 80 households respectively where 5 households have the lowest demand.Just studying the Manica sites in Figure 5.3a, the �rst two sites di�er much from the rest. These twosites are the ones with average �ow around 200 l/s and head above 80 m (shown in Figure 5.3a). The100% and 80% bars are not very high, but 50% of the year the sites can provide more than 30 kW (this isoutside of the graph to focus on the rest of the sites). Sites 3-7 have a lower �ow and head (�ow around100 l/s and head above 40 m), which renders a lower power output. Sites 11-13 have so low average �owlevels that the variation in precipitation makes the �ow level very small during a part of the year. Thiskeeps the power capacity from reaching the 80% coverage. The rest of the sites have head levels belowthe rated head of the Pelton turbine.Comparing the Manica results with the other three provinces, Tete shows a worse result. Not even for50% of the year can the two most favorable sites reach higher than 4 and 7 kW. For the rest, the result iszero or below 0.5 kW for 50% of the year. Niassa is similar, but with only site 1, 2 and 11 possible for thePelton head range. In Zambézia the lowest output for 100% and 80% of the year is generally increased,while the lowest output for 50% is decreased for some sites.In Figure 5.4 the provinces are compared in the same way as in Figure 5.3, but using the Cross�owturbine. Here, the system power output is of course lower than for the Pelton, and only the lowest loadpro�le is included for comparison. Since a larger part of the maximum power output is covered for 100%and 80% of the year, the 50% bars are not included. The Niassa results are very similar to the Tete48

results, although somewhat lower and with site 16 excluded because it is out of Cross�ow head range.
0 2 4 6 8 10 12 14 16 180
0.5
1
1.5
2
2.5
3
3.5 Annual system power output. Manica. Crossflow turbine.
Sites
Out
put [
kW]
100%80%Demand profile 1, 5 HH
(a) Manica 0 2 4 6 8 10 12 14 16 180
0.5
1
1.5
2
2.5
3
3.5 Annual system power output. Zambezia. Crossflow turbine.
Sites
Out
put [
kW]
100%80%Demand profile 1, 5 HH
(b) Zambézia
0 2 4 6 8 10 12 14 16 180
0.5
1
1.5
2
2.5
3
3.5 Annual system power output. Tete. Crossflow turbine.
Sites
Out
put [
kW]
100%80%Demand profile 1, 5 HH
(c) TeteFigure 5.4: Demand coverage of Manica, Zambézia and Tete sites for the Cross�ow turbine. The bars represent the lowestdemand covered for 100% of the year (blue) and 80% of the year (red). Also shown is demand level of load pro�le 1, for 5households.Using the Cross�ow turbine in Manica (Figure 5.4a) it is only the sites with the lowest average �ow(sites 11-15) that show zero or a very low result for 100% and 80% of the year. The high �ow sites 16 and17 are within the Cross�ow head range and can therefore provide close to (or more than) maximum powerdemand for these two sites. The �ve sites with the highest �ow (1,2, 9, 16, 17) all provide maximum orclose to maximum power output for 80% of the year. For the rest of the sites there is a large di�erencebetween the complete yearly coverage and the output level for 80% of the year, which indicates a shortperiod of low �ow every year.The Tete results (and Niassa), are very similar to Manica for 100% of the year. But where Manicashows a higher power output for 80% of the year than what can be provided 100% of the year, in Tetethe power output for 80% follows that for 100%. In Zambézia, the results are higher for all sites exceptsite 9.5.2.3 Installation costInstallation costs are calculated for Manica province starting with total installation costs, cost per house-hold and �nally cost per kilowatt. 49

Total installation costTotal installation cost is calculated for two scenarios, the scenario with no community contribution tothe civil works, and the scenario where community contribution corresponds to 50% of the civil workscost. Table 5.14 shows the total installation costs for Cross�ow and Pelton turbines, rounded to thenearest 100 USD, based on the cost estimates in Table 4.9. The cost for a Cross�ow turbine supporting80 households is disregarded since the small turbine cannot support even 50% of the demand from an 80household community. The cost for electromechanical equipment for the Cross�ow is based on individualcosts for generator, turbine and Electric load controller, (ELC). In the Pelton case the cost is based ona total cost for electromechanical equipment, see Table 4.9. The length of the penstock is set to 300 m.All costs are presented rounded to the nearest 100 USD.Table 5.14: Total installation costs for a system with a Cross�ow (3kW) or a Pelton turbine (50kW), for 5, 20 or 80 HH. Thecosts are presented for the case with no community contribution to the civil works, and community contribution corresponding to50% of the civil works cost. Installation cost [USD]Cross�ow [3kW] Pelton [50kW]Households no contribution 50% contribution no contribution 50% contribution5 35 500 29 800 93 000 64 70020 42 600 37 000 100 200 71 80080 - - 114 000 85 600The distribution of costs is shown in Figure 5.5. The two factors contributing most to the cost arethe grid cost and cost for the civil works. The civil works is the major contribution for the larger Peltonscheme, while the grid is the most costly considering the smaller Cross�ow scheme.
(a) 3kW scheme. No community contribution. (b) 3kW scheme. 50 % community contribution.
(c) 50kW scheme. No community contribution. (d) 50kW scheme. 50 % community contribution.Figure 5.5: Cost components of the installation cost for the 3 kW Cross�ow scheme and the 50 kW Pelton scheme with nocommunity contribution to the civil works and community contribution corresponding to 50 % of the cost of the civil works.50

Costs per householdThe costs per household is not dependent on the system capacity. Table 5.15 shows the cost per householdfor the two turbines.. The cost of the Cross�ow turbine for 80 households has not been included, sincethere is no case where the system can meet even 50 % of the maximum load demand.Table 5.15: Cost per household in USD.Households [HH] Cross�ow, 3 kW [USD/HH] Pelton, 50 kW [USD/HH]no local contribution 50% local contribution no local contribution 50% local contribution5 7 100 6 000 18 600 12 90020 2 100 1 900 5 000 3 50080 - - 1 400 1 100Cost per kilowattTwo tables are submitted for installation cost reference. Table 5.16 shows the cost per kilowatt fromthe model. The cost per kilowatt is based on modeled maximum demand (see Table 4.8), not on theinstallation capacity of the two turbines.Cost per kilowatt =
Total installation cost
Maximum demandFor the cases where the Cross�ow turbine cannot support the load demand, the price is disregarded. Thetable show results for a scenario with no community contribution to the civil works, and scenario withcommunity labor covering 50% of the costs for civil works.Table 5.16: Installation costs per kilowatt for ideal systems (Cross�ow 3 kW and Pelton 50kW) based on maximum demand fornine di�erent demand pro�les. The costs are presented in the unit [USD/kW] for a scenario with no community contribution tothe civil works and a scenario with community contribution corresponding to 50 % of the cost of the civil works.(a) Cost per kW. Model outcome. Low consumption scenario.Low consumptionHH Demand Cross�ow Pelton[kW] no contr. 50% contr. no contr. 50% contr.5 2.1 16 900 14 200 44 300 30 80020 5.1 - - 19 700 14 10080 17 - - 6 700 5 000Medium consumptionHH Demand Cross�ow Pelton[kW] - no contr. 50% contr.5 4.1 - 22 700 16 80020 7.1 - 14 100 10 10080 19 - 6 000 4 500(b) Cost per kW. Model outcome. Medium consumptionscenario. High consumptionHH Demand Cross�ow Pelton[kW] - no contr. 50% contr.5 5.7 - 16 300 11 40020 9.1 - 11 000 7 90080 29 - 5 700 4 300(c) Cost per kW. Model outcome. High consumption sce-nario.Table 5.17 shows examples of the approximate installation cost for a GIZ project, based on the samemaximum demand. In the GIZ example, the number of households is estimated to 80 households for the51

large system and �ve for the small. The di�erence between model outcome and GIZ data is most likelyexplained by di�erent ways of including equipment and labour in the calculations. The data for a GIZproject was not speci�ed in terms of included equipment and labour, which makes it less reliable to useas a comparison to the model outcome. However, concerning a comparison of the two di�erent turbines,the GIZ data can be seen as a more reliable source, since all data comes from the same person.Table 5.17: GIZ installation cost per kW.Households Low consumption Medium consumption High consumptionDemand Cross�ow Pelton Demand Cross�ow Pelton Demand Cross�ow Pelton5 2.1 kW 4 200 - 4.1 kW - - 5.7 kW - -80 17 kW - 2 900 19 kW - 2 600 29 kW - 1 7005.2.4 Validation of system power outputFigure 5.6 shows the system power output of the modeled Ndirire station. The system output is set to 26kW, which is shown as the line in the �gure. The committee member interviewed, stated that the problemswith too low power output was mainly in October (dekad 28-30 on the x-axis). If the precipitation datais correct, October is the month directly after a longer period with low precipitation. This indicates thata direct relation with low precipitation and low system capacity, is not entirely accurate. If the problemswith the water �ow is only in the three dekads of October, the �ow modeling shows a lower system poweroutput than the station in fact possesses.
5 10 15 20 25 30 350
5
10
15
20
25
30
35
40
45
50
Dekads
Sys
tem
pow
er o
utpu
t [kW
]
System power output of the Ndirire station
Figure 5.6: System power output with parameters close to the community Ndirire in Manica province.5.2.5 Sensitivity analysisA change of �ow data for three sites in Manica, a�ects the modeled power capacity of the system. Annual�ow data is �rst increased and then decreased by 10% for the three sites to analyze the sensitivity of themodel. The change in power output is observed dekad by dekad. For some parts of the year the changein power output is 10% or less, which would be expected. But for other parts of the year, the poweroutput changes more than 10%. Due to this the model is considered sensitive to changes in the �ow.Table 5.18shows for how large part of the year the power output changes less than 10% due to the changein �ow.52

Table 5.18: Sensitivity analysis of �ow. Part of the year where the system power output changes less than 10% ±10% change in�ow levels. Part of the year with system power output change less than 10% [%]Low �ow site Medium �ow site High �ow siteCross�ow (increased �ow) 81 86 100Cross�ow (decreased �ow) 78 86 100Pelton (increased �ow) 42 53 64Pelton, (decreased �ow) 39 53 64Table 5.19 shows how the system capacity is a�ected if the spread in �ow level is increased or decreased.The method of measuring sensitivity is the same as when varying the �ow level.Table 5.19: Sensitivity analysis of spread of �ow. The table shows part of the year where the system power output changes lessthan 10 % ±10% change in spread of �ow. Part of the year with system power output change less than 10% [%]Low �ow site Medium �ow site High �ow siteCross�ow (increased �ow spread) 58 78 81Cross�ow (decreased �ow spread) 78 86 100Pelton (increased �ow spread) 52 53 47Pelton, (decreased �ow spread) 52 53 47Increasing or decreasing the head data shows the sensitivity of the set head range in the model. Table5.20 shows how many sites that fall within the head range when head level of all sites is raised or loweredby a certain percentage.Table 5.20: Head sensitivity analysis - sites within the head range in the model.Head Cross�ow Pelton0 17 11+10% 17 12+20% 17 14+30% 17 15+40% 17 15+50% 17 15-10% 17 10-20% 17 10-30% 17 9-40% 17 7-50% 16 3-60% 15 3
53

Chapter 6AnalysisThe results from interviews and modeling are analyzed, in relation to the research questions, in theanalysis chapter. First the barriers are analyzed in order of relevance. This is followed by an analysis ofthe results of the technological and resource potential evaluation.6.1 Barriers to pico and micro hydropowerMain barriers and most mentioned barriers are described and analyzed together with mentioned ways ofovercoming barriers in this section. Comparisons with barriers from literature are done when relevant.6.1.1 Main barriers and most mentioned barriersThe four barriers most respondents have mentioned are Lack of access to �nance, Lack of grid code andfeed-in tari�s, Lack of proper maintenance and Poor knowledge management. Lack of access to �nance,Lack of proper maintenance and Lack of grid code and feed-in tari�s are also selected as main barriersby some respondents. Other main barriers are Limited rural infrastructure, Lack of access to spare parts,Lack of local involvement, Poor design, Scattered population in communities, Lack of investor interest,Lack of supporting legislation, Poor payment management, Lack of water resources and Long distancetransmission. Results concerning these barriers are analyzed below. It is important to keep in mind thatmany of the barriers are connected, impacting each other.The opinions concerning funding are the most unanimous; half of the respondents have described thelack of access to �nance or lack of interest from investors as one of the main challenges for pico and microhydropower. Finding �nance is a major problem for all instances.The hope lies in FUNAE or banks to provide loans and grants to private operators. But both thebanks and FUNAE are perceived as unwilling to provide funding by requiring guarantees. The NationalDirectorate for New and Renewable Energy tries to attract investors to gain more �nance for FUNAE.If the idea of FUNAE as a credit agency gains support, that function could be facilitated by using forexample a local micro �nance institute or a bank as an intermediate point.A future connection to the main grid is a potential way of increasing investors' interest, in manyrespondents opinion. Therefore, barriers against grid connection are seen as barriers against hydropowerdevelopment even for o�-grid application. A feed-in tari� program for renewable energy will be introducedin a foreseeable future which obliges EdM to buy electricity at a set price. The interest from privateoperators is believed to increase with this in place. Similar programs are already in place in other countrieslike Rwanda and Kenya. In Rwanda, the change in legislation was made this year (RURA, 2012) and thee�ects are yet to be shown, however in Kenya it has resulted in stimulation of new hydropower stations(Hankins, 2008). However, the lack of feed-in tari�s, hindering private sector participation is an issueaddressed only by stakeholders in Maputo. Stakeholders in Manica either express grid connection as aless important issue or have the perception that the problem is already solved with feed-in tari�s on itsway.Consultants and donors discuss ways of lowering the administrative costs to make pico and micro hydroprojects interesting for international funding agencies. The alternative of not providing more funding atall, but instead capacitate FUNAE so that the �nance management is more e�ective, is presented. Thisdiscussion is not brought up by FUNAE itself. 54

One of the reasons for the lack of interest from banks is presented as their unawareness of the bene�tsof pico and micro hydropower. This corresponds well with the stakeholders' general perception of thelevel of common knowledge of pico and micro hydropower in Mozambique today. Most stakeholdersclaim the common knowledge level is low. As mentioned in literature, lack of awareness of a technology isconsidered hindering the development. With low awareness banks are more unwilling to provide fundingand consumers are skeptical to the new technology.To increase the awareness of pico and micro hydropower, knowledge needs to be spread. Not many ofthe barriers to spreading knowledge have been stressed by more than one stakeholder, pointing at a lowerrelevance, or a barrier yet to be discovered. Stakeholders see di�erent weaknesses in the process, butat the same time they present ways to overcome the barrier by suggesting alternative ways of spreadingthe knowledge. The lack of a body for meeting and sharing information is expressed, along with theneed for proper documentation. This is mentioned in earlier studies of barriers to pico and micro hydrodevelopment (FAO, 2008), and considered important for knowledge spread. A problem only brought upby international consultants, and not by Mozambicans, is the risk of educated people advancing andmoving abroad to obtain higher salaries where the presented solution is to o�er higher salaries.The strategies on how to spread the knowledge are many. The NDRE plans to do a road show andinform people about the technology. Many positive experiences have been lifted during interviews, ofstudy visits to other countries or to communities with hydropower stations in operation. Some of theactive organizations share an o�ce in Chimoio, which facilitates knowledge sharing. The plans of a�Centre of excellence�, to educate designers of pico and micro hydropower stations, is welcome. Thelocal NGO intend to improve their documentation routines together with the international governmentalentity, to ensure the knowledge remains. If the universities cooperate around the �Centre of excellence�this will also prevent the valuable experiences from disappearing with the international organizations anddonors. However, most suggestions for spreading knowledge are focused on Manica province. None ofthe respondents have mentioned if it will spread to the rest of the country.Lack of proper training of operators is the last aspect brought up while discussing knowledge di�usion,where poor spread of knowledge leads to failure of power stations. This has only been addressed by twostakeholders. Others say sharing knowledge with operators has worked well. Good training is manageable,although quite di�cult.This could be contradicted by the fact that most stakeholders discuss lack of su�cient maintenanceas a barrier. Three of the stakeholders see lack of proper maintenance as one of the main barriers.Damaged equipment and station break downs due to mismanagement have occurred. However, thereare more factors in�uencing the quality of maintenance than operator training. Some bring up lack ofunderstanding the purpose of maintenance as a cultural problem, lack of �nance to buy spare parts andproblems with administrating funds for maintenance. Lack of access to spare parts is not seen as a mainfactor hindering maintenance, although it is seen as a main barrier by one of the respondents, whichindicates it might be of extra importance. The same respondent explains it can be overcome by holdinga stock of spares though it would add an extra cost component. In addition, privately owned hydropowerstations do not often use additional equipment like meters. A decision to add more advanced electricequipment could make lack of access to spare parts more crucial.If the electricity prices are too low to re�ect the true cost of running a pico or micro hydro station,that could lead to poor maintenance, as experienced in Kenya (Kirubi, 2009). The stakeholders expressproblems with tari�s set too low to cover maintenance and operation costs, indicating a similar situation.No clear solution is brought up to this problem.Many are aware of the fact that mismanagement of the power stations imposes a great risk, andsuggest ways to ensure well functioning maintenance. One suggestion is to do capacity building of localmanufacturers who could support maintenance of the power stations. Another is to keep the design of thesystem at a basic level, which would decrease the level of technical expertise needed to operate the station.It is brought up as an important factor to reduce the number of mechanically advanced components andbearings. To ensure basic design is seen as a major challenge by one stakeholder. However, he has nopersonal experience of pico and micro hydropower and merely speculates what level of technical expertiseis required for such a system.The most important component of successful maintenance brought up by most stakeholders, apartfrom proper training, is that community members and operators should be closely involved in the wholeproject process and see the bene�ts of it. This is supported by literature (Alzola, 2009; Murphy, 2001;Maher, 2003). There is an awareness that community involvement is necessary for the sustainabilityof the projects. The importance of a feeling of ownership and lack thereof is discussed in relation to55

this. Many of the stakeholders have described a change in opinion on the importance of these matters.Stakeholders' personal experiences as well as shared experience from projects, where lack of focus oncommunity involvement to make local people feel like owners leads to project failure, has put the issue onthe agenda. Today stakeholders seem to discuss, to a larger extent, how to increase local participation.Three of the respondents see mobilization of communities, when initializing a pico or micro hydroproject, as a main challenge. These are the two donors and NGO B employees. NGO B employees havemuch experience in the �eld and covered the subject thoroughly since part of the NGO hydro project isto show di�erent ownership models in use. However, identi�ed barriers connected to community relationsmainly originate from using community owned models which are uncommon in Mozambique.The choice of ownership model is seen as essential. Respondents have mentioned earlier experienceswith projects failing or being delayed due to di�culties to manage maintenance or problems with com-munity con�icts. It is in some cases di�cult to say how much of the experience comes from projects inMozambique and other countries respectively. The interviews show most respondents advocate a privateowner model. This might be based on earlier experience of community based projects with sustainabilityproblems. The political changes Mozambique has gone through, since the country's socialistic past, couldalso be a factor of in�uence. A private owner model might be favored due to mistrust in the communityowned models associated with socialism.No barriers speci�cally originating from a private owner model have been brought up during theinterviews in Mozambique. Although when discussing payment barriers, some mention the risk for theoperator to be unable to pay back loans for the equipment. It is unclear if this risk is considered when theequipment is community owned. The employees from the international NGO say the model is preferablefrom a sustainability perspective once the hydro station is in place. However, the construction phase isdi�cult since it is the owner who mobilizes the community. One reason to why no other respondent hasmentioned any barriers connected to community relations within a private owner project can be lack ofexperience.Relations with, and relations within, a community with a private owned model are mentioned inseveral circumstances, like management of maintenance and availability of funds. However it has neverbeen expressed that the owner model in itself is the problem. Stakeholders working with private operatorshave strategies where previous knowledge of the operator is highly valued and used to motivate for furtherdevelopment of the power station. So far, the respondents seem to agree this is a successful concept.To hand over both ownership and management of hydropower stations to small local companiessituated in rural areas on a �fee-for-service� programme, as experienced in Zambia (Ellegård et al., 2004),has been discussed concerning FUNAE's projects. In Zambia it was considered as a way to facilitateaccess to �nance. With a similar �nancial situation in Mozambique, where banks are uninterested, thiscould be an alternative. However, it relies on companies, capable of taking this role, being present inrural areas.It is often mentioned how, if a system fails to deliver continuous electricity, the customers get disap-pointed. In addition, when the word of well functioning systems spreads, many expect this will increaseinvestors' interest. From a system design point of view, two respondents see the poor quality of systemdesign and feasibility studies as main barriers to the development. There are examples where stationshave stopped running, or not even been completed, due to poor studies in early stages of projects.The continuous delivery of electricity also depends on year-round water supply. Two respondents seelack of water resources as a main barrier. None of the respondents have mentioned the problem of riversoriginating from outside of Mozambique, increasing the vulnerability of the water resources. Problemshave however been observed locally when a dam built by FUNAE reduced the water �ow for a pico schemedown streams. The reason for this is unclear, but it might indicate the importance of communicationbetween entities within the country. If pico and micro hydropower spreads, problems with activities outof Mozambican control could pose a barrier. What has been mentioned by a few respondents are otheruses of the water resource competing with hydropower. For example irrigation could be a down streamactivity, which is a�ected by the power station.Using multiple-jet turbines, or other designs to increase the part �ow e�ciency, is not mentioned.To choose a low rated �ow for the turbine limits the output capacity the whole year around. A higherrated �ow with increased part �ow e�ciency could maybe be a better alternative. Using alternativerenewable techniques as a complement, like solar PVs, to secure the yearly electricity supply, has notbeen mentioned either. The only suggestion brought up to have continuous electricity supply was to adda diesel generator to the system, as a back-up during the dry season.The problem with climate change, and how this makes �ow forecasts unsure, is only discussed by theinternational NGO. This could be because there is not much reliable �ow data in Mozambique to start56

with. Improving the availability of high quality data will of course make it easier to select potential sites.To select sites based on political preferences rather than data, as could be the case today, could result inunsuitable schemes and bad examples for future investors.The barrier concerning the location of the river is mentioned in literature, but only considered by afew respondents. There is an awareness that not all parts of the country are suitable for implementinghydropower, so the speci�c barrier of long river - community distance could be included in these discus-sions. It could in any case be important to consider, since a respondent describes how the problems arespeci�c for Mozambique due to seasonal �ooding.The Mozambican geography and demography cause a problem. Opinions accord with those foundin literature on the importance of existence of infrastructure and conditions of roads in remote areas.However, the opinion on the magnitude of the problem varies signi�cantly. Either it is seen as part ofinfrastructure development, where roads need to be built to reach these remote areas nevertheless. Or itis seen as a factor in�uencing the potential of the technology since building a road adds a cost componentto an already high investment cost. All stakeholders agree accessing a site cause di�culties, however onlystakeholders situated in Maputo consider it a barrier to the development.Many of the stakeholders see the low population density in Mozambique as problematic. However,similarly to the issue of improving poor infrastructure, some see urban planning as part of the developmentof a community. For those who don't want to move, an alternative mentioned is a battery charging stationcentrally situated. Two of the stakeholders see scattered communities as a main barrier, however they donot have speci�c experience of micro and pico hydro and it may therefore be considered a more generalbarrier to rural electri�cation.It is apparent that the awareness of the laws and policies relevant for pico and micro hydropower isnot enough, or at least that the perceptions di�er. The local NGO �nds it a main challenge that thegovernment is not visible enough in the work with electrifying Mozambique by initiation of hydro projects.The respondent who tells of supportive policies just waiting to be used for doing wonders, probably hasa closer cooperation with governmental employees than the local NGO. Governmental visibility could beimproved to increase the awareness.The choice of payment system a�ects the sustainability of a hydropower project. On one hand thecustomers should be able to a�ord electricity. The correlation between electricity use and price shouldbe reasonable. The unfairness of the �at rate system is even brought up as a main barrier by FUNAEB. On the other hand the operator needs some sort of guarantee that the revenue will be enough to payo� the loans for the equipment. There, the prepaid system can introduce a di�culty. EdM has had alower income from introducing prepaid meters. The baseline study needs to be done properly to ensureenough demand for the fund generating mechanism to hold.The level of problems with payment probably re�ects the general attitude in the community. NGOB employees have experience of di�erent communities in several countries. They describe how they cansolve all problems in some communities during meetings, while in other communities they are not eventold what the problem is. The example of breached meters was handled by the community itself withhelp from the district council.Barriers mentioned connected to demand correspond well to those discussed in literature. The generallow demand in rural areas and di�culties to �nd and promote productive use in the areas, are bothdiscussed by many respondents. Two reasons for a low level of productive use have been mentioned;directing electricity use to productive use has not been prioritized and a general di�culty of �ndingproductive use activities in the surroundings of the power station.Local stakeholders, who work directly with communities that have pico and micro hydro, say thereare ways to increase productive use, like promoting industrial agriculture. Stakeholders in Maputo thathave mentioned increase of productive use claim it is a di�cult task that needs legislative support fromother ministries than Ministry of Energy.Well corresponding with the perception of a low demand in Mozambique is the fact that no stakeholderssay the power stations have a too low capacity. Consumers use less electricity than expected. NGOsworking with the hydro projects express a concern that over sized systems are common, where the costof the projects is not justi�ed by the low demand.Many stakeholders believe in a future increase of demand for electricity, though the opinion varies onwhether it is di�cult to increase the capacity of a system or not. This could be because stakeholdersdiscuss di�erent sizes of the power systems. Also, experience of expanding systems is low. It is associatedwith a cost and an increased level of technical expertise needed to operate and maintain the system.57
If electricity for cooking would spread in Mozambique, this would lead to an increase in demand.Despite a low demand in rural areas none of the respondents have pointed out lack of demand as a mainbarrier to pico and micro hydro.FUNAE and the local NGO (NGO A) have opposite ways of managing their funds, for which both havebeen criticized. Choosing not to reinforce the canal has lowered the reliability of water resources of thepower station in Ndirire, since water is allowed to leak out. But there are funds left to provide anothercommunity with electricity. Since a way of spreading knowledge about pico and micro hydropower isinviting other communities to see functioning stations, it can be argued that the stations should be madeas reliable as possible. But semi-functional examples with a lower investment cost could perhaps also beinteresting to communities with low investment capacity.6.1.2 Less mentioned barriersThe relatively high investment cost associated with pico and micro hydropower is not brought up byany of the respondents when discussing main barriers, although this is described in literature as a causefor �nanciers to exclude pico and micro hydro in their funding programs (WB, 2008). This could beinterpreted as if the investment problems are rather seen as lack of �nance than too expensive equipment.However, ways to reduce the costs are still discussed. Respondents with experience from Zimbabwe andthe shareholder model consider the communities contribution a way to lower the costs for constructionwork and materials. The same reasoning is found in pico and micro hydropower projects in Kenya (Maher,2003). Those who have experience of the private owner model do not discuss this, but if the operatorcould hire community members as construction workers, maybe this would still have an e�ect on theinvestment cost. In the Ndirire example the operator constructed the canal all by himself, which musthave saved money.The general ability to pay is by some considered very low. However, some respondents perceive thatthe social bene�ts gained by electricity have such a great impact, that the willingness to pay is high.Low quality of locally produced equipment is the most common barrier associated with availabilityof equipment. It is brought up by many of the respondents working closely to the small hydro projects.Despite disadvantages of using low quality equipment, locally produced equipment is considered a goodalternative, since it creates work opportunities, increases the knowledge of the technology on a local leveland is the low cost alternative. Locally situated representatives of both FUNAE and EdM encouragethe use of locally produced equipment, even though it is not used in governmentally initiated projects.No direct solutions on how to increase the quality of locally produced equipment have been brought upduring the interviews. However, the quality is said to have increased with time which suggests that it isa matter of learning in progress.The alternative to import equipment is argued a good solution to ensure a high quality. However,the high import duty is considered a barrier since it adds an extra cost which can be unfavorable wherehigh investment costs are already a problem. The government is aware of this but no solution or plans tolower the duties like in other countries have been mentioned by any of the governmental representativesinterviewed. Still, they mention it as disadvantage, showing it is not a hidden problem.There are some barriers the literature describes as main barriers, which Mozambican stakeholdersmention but do not consider as main barriers. Lack of adequate data on hydro resources and lack ofawareness of the technology are two of them. Concerning lack of awareness, the stakeholders have focusedmore on the barrier of lack of investor interest, where lack of awareness of the technology is mentioned aspart of the problem. In addition, poor knowledge management is indeed in�uencing the level of awarenessin the country today and in the future. Stakeholders express a demand for more awareness, even thoughthey do not see the current level of knowledge as a major problem.Concerning data collection, there is no database for potential hydropower sites in Mozambique. How-ever, not many stakeholders have mentioned this explicitly as a problem. Instead each organizationdescribe how they gather data. FUNAE representatives say there is data, but it is scattered whichmakes it di�cult to retrieve. To overcome the lack of data, FUNAE does measurements for a hydroatlas. Google Earth facilitates the selection of sites. However, on a local level there is no one doingmeasurements continuously. The stakeholders talk about activities in Manica province to improve thedata collection, like involving universities. Since only few have said explicitly that there is a lack of data,the barriers might rather be longer handling times, where the need for one year measurements slowsdown the development and collection of already existing data is time consuming. This is interesting sincehydropower development is highly dependent on the access to measurement data.58

6.2 Technological and resource potential modelIn this section are the results from the model analyzed. The results from the interview section can insome cases be used as a reference to the results. First, the reliability of the water resources when usinga Pelton turbine (50 kW) is analyzed, to see on what level continuous electricity supply can be providedthroughout the year. Next is analyzed the ability of the locally manufactured Cross�ow turbine (3 kW),to complement the Pelton already in use in Manica province.6.2.1 Pelton turbineThe results from modeling the Manica sites using the Pelton turbine show how the annual dry periodsof Mozambique could be a problem for all the sites. The model is over all very sensitive to variations inprecipitation, and renders zero or a very low output when the precipitation is low. In reality the water�ow will be less sensitive to precipitation. Due to periods of very low precipitation, the sites with lowaverage �ow cannot cover any load continuously. Communities with load pro�les 1 and 2 will have theirmaximum demand covered only half of the year for the sites with the highest �ow. The best result isfrom sites 1 and 2, which are the sites with the highest head and �ow combination.The respondents value reliability of water resources. A hydropower station must produce enoughelectricity for the customers to appreciate it. Using this model, the 50 kW Pelton would not be a verygood choice of turbine, not for the low �ow sites, but hardly for the high �ow sites either. This is,assuming that the �ow is directly proportional to the precipitation.Estimating the results for Niassa, Tete and Zambézia, the higher precipitation in Zambézia is visiblefor some sites. But still, to consider the Pelton turbine the communities would have to be satis�ed withelectricity during only half of the year. Tete province is modeled with the same head levels as Manica,but the results still di�er a lot from Manica, due to the di�erence in precipitation levels.6.2.2 Cross�ow turbineThe Cross�ow turbine is di�erent from the Pelton turbine both in function and in size. All Manica sitesare within the head range of the turbine, which allows for all sites with high �ow to produce maximumpower for at least 80% of the year. The rated �ow level is low for this smaller turbine, which means it isnot as sensitive to �ow variations as the Pelton. This results in a longer period of the year with a poweroutput above half of the demand, for some sites. The maximum output of the Cross�ow turbine can onlycover the lowest load pro�le. In Manica, the Cross�ow turbine fully covers this demand for two sites, andpartly covers it (80% of the year) for four sites.6.2.3 Comparison of the two turbinesComparing the two turbines, the Pelton can have a much higher power output, but only for half of theyear. There are no sites where the Pelton covers the lowest demand fully, and only two sites where itcovers the lowest demand 80% of the year. The results for Zambézia, Tete and Niassa show a similarpattern. So installing a small turbine gives a higher power output than a large one, if the �ow is low.For a community with a low demand where the maximum output of a small turbine is enough, it isbetter with a small turbine than a large one. The large turbine has a higher rated �ow which makes itine�cient when the �ow is lower. For sites with low head, it is better with a Cross�ow turbine. The headrange of the Pelton excludes sites that might instead be suitable for a Cross�ow turbine.Using the model to �nd ways to improve the potential for pico and micro hydropower, it is clear thatan important turbine parameter is the rated �ow. If the turbine is designed for a �ow level that is too farfrom the actual �ow in the system, the output power is a�ected considerably. Since the �ow levels varysigni�cantly in all four provinces, using a turbine with a boosted part-�ow e�ciency would improve thee�ciency of the system. To use several Cross�ow turbines could be an alternative to one Pelton, sincethis would increase the capacity during higher �ow and still cover important loads during low �ow.6.2.4 Installation costThe outcome of the cost part of the model can be compared with examples from literature and interviews.The Ndirire case described in Subsection 4.2.3 Field surveys, has a cost of 650 USD/HH, which is lessthan the results obtained with the model for a Pelton turbine in a community of 80 households in ahigh consumption community pro�le. This is true for both a scenario with no community contribution59

to the civil works and when the community contributes with 50% of the cost. However, the civil worksis the major part of the installation cost for the 50 kW Pelton system and both the canal and forebaytank of the Ndirire station was constructed by the operator, which could have corresponded to morethan 50 % of the civil works cost. Stakeholders have suggested larger contribution from the communitiesin the construction phase to lower costs. It would be considered a good strategy according to the costcalculations. To capacitate the community members to do civil works properly reduces the total cost ofthe hydro scheme. The reference data from FUNAE indicates the cost would be 6 300 USD/HH, whichindicates the two cost calculations are based on di�erent cost components.The cost per kilowatt from the Ndirire example is stated as 1 900 USD/kW if the output capacity isassumed to be 26 kW all of the time. This is comparable to the high consumption case of 80 householdsin Table 5.16 with a cost of 4 300 USD/kW or 5 700 USD/kW with or without community contributionrespectively. The cost is calculated based on a demand equal to maximum demand of the high consuming80 household case, 29 kW. Once again, the high cost of the civil works could be a reason for the di�erencein price. Furthermore, the cost per kilowatt is in the range of the examples in the IRENA work paper(IRENA, 2012b) for the Ndirire case. The cost calculations for 3kW system in the low consumption caseof 5 households are fairly high compared to literature. The grid cost is the highest cost, as mentionedby many stakeholders. It indicates it is an important �eld to do further studies. With an optimized griddesign, the costs can be reduced. The grid model also poses an uncertainty to the result since it is asimpli�ed model.According to the results of the installation cost modeling, the least expensive system per householdwould be to share a large system for many households. It encourages to ensure a high demand at a sitewhen selecting it. If the demand is as low as 2 kW, the Cross�ow system with a low output capacity is abetter selection from a installation cost perspective than the Pelton system, both according to the modeland the reference data from FUNAE, (even though the costs are di�erent among themselves). Especiallyif the grid cost can be reduced by selection of a good grid design. However, an important factor notto neglect is that a small system with less customers generates less revenue from the customers to theoperator. A larger system might be favourable even if the installation cost is higher if it guarantees arevenue to the operator to pay for operation and maintenance costs. However, it assumes the hydropowerstation can run during most part of the year. More detailed calculations of cost per kWh, where the timeperspective is included, would be needed to draw any conclusions concerning this.
60

Chapter 7DiscussionIn this section the relevance and credibility of the method and results are discussed, and further studiesare suggested.The �eld trip to Mozambique has been of great value for the modeling of technological, geographicaland demographical factors of the pico and micro hydropower potential in the country, as well as themapping of barriers. An awareness of the work done by involved stakeholders was obtained, concerningthe current technologies preferred and the available equipment. The data provided in interviews andvisits has been a good reference when comparing data from articles of hydro projects.A �rst selection of respondents was done before arrival in Mozambique. The selection was based onknowledge of the power sector structure and what actors could be considered as important stakeholders.However, most respondents were de�ned in the capacity of their roles, for instance private actor, withoutspecifying a company. Instead, the �nal selection was decided upon arrival in the country. The �rst inter-views were facilitated by Prof. Cuamba at the Eduardo Mondlane University, and thereafter respondentswere asked for examples on who to talk to next. The strength in this method is that it lowers the risk ofleaving an important stakeholder out due to lack of previous knowledge.The selection of stakeholders closest involved in the development of the technology, may present apolarization of the results, since respondents convinced of the advantages of the technology might misssome of the barriers. All respondents were from the capital, or areas in Mozambique and Zimbabwe, wherepico and micro hydropower was implemented. Further research could be to compare the perception ofthese respondents with the opinions of stakeholders from other provinces.Using semi structured interviews with open-ended questions opens up for the respondents to directthe discussion. Not all themes are covered to the same extent in the interviews, which may have leadto some barriers being left out by stakeholders. Other sources of uncertainty in the results are misun-derstandings due to miscommunication. In addition, the interpreter used in three of the interviews wasnot professional, increasing the risk of misunderstandings in these interviews. To minimize the numberof misunderstandings, additional questions to clarify were asked as often as possible.The content of the interview guide was updated after each interview, to improve the quality of thequestions and minimize the risk of leaving out subjects where barriers could be brought up. Furthermore,no standard questions addressing ways to overcome barriers were included in the guide to not in�uencewhat barriers where expressed by the stakeholders. Instead, the ways to overcome barriers were askedfor as follow up questions to the extent it was possible. This could have lead to less examples of ways toovercome barriers addressed.The choice of codes used in the analysis has a�ected the results. Some codes address barriers whichcan be part of a larger barrier, for example where lack of access to spare parts can be one reason to poormaintenance. This choice was made to give a more detailed mapping of the barriers. In those cases wherebarriers depend on each other they are analyzed together.The assumptions and limitations of the model used in this thesis, are stated in the method section.However, some areas require further discussion.The �ow is modeled based on the precipitation data of the respective provinces, and it has been statedin the method section that the behavior of water on the ground has not been taken into account. Althoughit is clear that the level of �ow in rivers does not have a linear relation with the level of precipitation inan entire province, the sensitivity of the �ow data can still be studied. The importance of the rated �owof the turbine is clearly shown, and the extrapolations indicate conditions for the provinces, relative toManica province. This comparison should still hold, if there are no other major di�erences between the61

provinces that would have an in�uence on the �ow, for example the presence of water storing cavities.The potential shown can, due to the �ow modeling, be considered a worst case scenario. Since thesystem capacity in real schemes will probably not be as much a�ected by low precipitation levels asindicated in this thesis, the potential should be generally higher.The comparison between turbines of both di�erent functions and sizes limited the conclusions possibleto make, since the qualities were di�cult to separate. Having modeled the smaller Pelton turbine wouldhave given more information. This was not considered in the work process, but can be suggested forfuture studies.The load pro�les were designed with electrical application data from Tanzania, estimating the usageof these applications with reference to the �eld survey to Ndirire. Only using one example of load pro�lecan be considered insu�cient, but the use of electricity can be expected to change in time, so accurateestimations would still have a short life length. The power levels modeled are clearly stated and moreemphasis is put in exemplifying possible applications of the kilowatts obtained, than ensuring there arecommunities with this demand pro�le.The data supporting the modeling of the installation costs are gathered from di�erent examplesof projects. Some costs were more aggregated than others, which introduces an uncertainty in thecalculations. The results deviate from references provided by the FUNAE employee, which indicates thatthere are costs not accounted for in this report, such as transport, salaries and the di�erence in civilworks between the di�erent sizes of schemes. To include transport would add a variable of remoteness tothe model, which could be considered in future work.Even though it is unclear what costs were included in the presentation of the Ndirire scheme, thisinvestment cost is closer to that of the model outcome for the Ndirire site.There are several parameters discussed in this report that could change in a long term perspective.Some respondents hope that the electricity demand will increase in rural areas, and if this happens thelimited power output from the rivers could be too small to meet the demand. The river �ow could bea�ected by climate change, making it di�cult to choose a suitable system.The most important delimitations to keep in mind when studying the conclusions of this report, is�rstly that there is very little data to base calculations on. Secondly, since the model assumes linearitybetween precipitation and river �ow, the real power output is probably higher than the calculated. Thisdemands further studies to come nearer the actual potential for pico and micro hydro, but it can beconcluded that in some cases the calculated output is enough to cover a certain low demand.For future research, the investigation of other types of turbines is interesting. The ability to moree�ciently use the power available in rivers would be interesting for investors and possible operators inMozambique. One way of doing this is maybe by using part-�ow e�ciency raising techniques like multi-jet Peltons or Cross�ows with divided nozzle. An alternative could be to investigate the potential, inMozambique, for Integrated Renewable Energy Systems (IRES)1, where hydropower is complemented byother sources of energy, for example solar.
1Integrated Renewable Energy Systems utilizes di�erent renewable energy resources such as hydro, wind, solar radiationand biomass with di�erent conversion technologies and end-use technologies to met energy needs (Ramakumar, 2012)62

Chapter 8ConclusionThe aim of this report was to investigate the potential for utilizing pico and micro hydropower to boostelectri�cation in remote areas of Mozambique. Three research questions were used to estimate the poten-tial. The �rst two research questions were: �What are the stakeholders' opinions on existing barriers forutilizing pico and micro hydropower in rural Mozambique?� and �What are the stakeholders' opinions onthe possibility to overcome these barriers?�18 stakeholders were interviewed during an eight week visit in Mozambique. When analyzing theresults from the interviews, three barriers were among the most frequently mentioned and were alsoaddressed as main barriers by the respondents. These barriers are Lack of access to �nance, Lack ofproper maintenance and lack of grid code and feed-in tari�s. A complete list of main barriers is found inTable 8.1. Some barriers are interrelated, which is described in Chapter 6. There are cases where newbarriers are presented to the ways to overcome a barrier, as in the case of increasing interest of investorsas a way to facilitate access to �nance. Some barriers are more speci�c to the hydropower technologysuch as lack of water resources and poor design, although most barriers could be addressed as barriers torural electri�cation in general.A comparison with literature on barriers to pico and micro hydropower development shows stake-holders in Mozambique acknowledge all barriers mentioned in earlier studies. However some barriers areconsidered main barriers in literature, but not by Mozambican stakeholders. These barriers are the lackof adequate data on hydro resources and lack of awareness of the technology. Lack of data is mentionedas a problem by some, while instead some stakeholders explain new ways on how to collect data. Con-cerning lack of awareness, the stakeholders have focused more on the barrier of lack of investor interest,where lack of awareness is mentioned as part of the problem. In addition, poor knowledge managementis indeed in�uencing the level of awareness in the country today and in the future. Stakeholders agreethat the awareness needs to get higher even though they do not see the current level of knowledge as amajor problem.Barriers connected to the Mozambican geographical and demographical conditions (lack of water re-sources, scattered houses, lack of infrastructure) are only brought up as main barriers by two stakeholderswithout personal experience of pico and micro hydropower.From the model results, it is shown that there is potential for pico and micro hydropower in Zambézia.Even though the head levels are set lower than in Manica, the measured precipitation is higher for a longerperiod of time, which compensates for the head loss.Lack of water resources is mentioned as a main barrier to pico and micro hydropower development.The results from the model show that annual reliability can be achieved by the pico Cross�ow turbine.The demand can of course not be larger than the maximum output of the turbine. Since respondentsexperience a low demand, speci�c for rural Mozambique due to low interest in using electricity for e.g.cooking, a pico scheme could be su�cient for many communities.The potential for utilizing pico and micro hydropower to boost electri�cation of remote areas ofMozambique depends on many factors. Barriers are recognized by stakeholders, and several ways ofovercoming them are presented. Of the solutions presented to overcome important barriers, some arealready started or at least planned. The Ministry of Energy is negotiating for feed-in tari�s that arebelieved to increase the investors' interest for hydro. A �Centre of excellence� is started by foreign actorstogether with four universities in Mozambique, to increase the technical expertise and awareness of thetechnology. Hopefully, this will also lead to an increased capability of selecting sites for schemes, which willadd to the number of functioning schemes. Local manufacturers get capacity building from organizations,63

Table 8.1: Barriers to pico and micro hydropower development and ways to overcome these barriers. Text in italic shows solutionsonly brought up by one respondent. *Some respondents say the problem does not exist.Barrier Ways to overcome barriersLack of access to �nance increase interest of investorsprovision of loans and grants from FUNAElower administrative costscapacity building of FUNAEPoor knowledge management proper documentationintroduce a body for meetingsmake study visitso�er higher salaries to keep educated personnelincrease university involvementLack of proper maintenance capacity building of local companies or manufacturersensure electricity prices re�ect operational costshold a stack of sparesensure basic designincrease local involvementLack of water resources combine with diesel generator systemLimited rural infrastructure include infrastructure in project proposalScattered population in communities urbanize community structureinclude battery charging systemLack of supporting legislation* no solution mentionedPoor payment management let electricity prices re�ect electricity useLow demand and promote industrial agriculturelow level of productive use* give �scal bene�ts to small industriesLack of investor interest enable future connection to main gridpromote and display functioning casesincrease awareness of the technologyLack of local involvement adequate choice of ownership modelvalue previous knowledge of operatorsensure community participation during the construction phasePoor design (complexity) minimize number of advanced componentsLack of grid code and feed-in tari�s introduction of feed-in tari�sto provide an alternative to expensive imported equipment, and possibly create a continuous access torepair and maintenance resources. NGOs and organizations discuss payment administration and di�erentowner models, and they make study visits to share experiences and knowledge.Barriers not addressed with a solution from the respondents, might pose a threat to the potentialof pico and micro hydropower. Respondents not working closely with the government experience a lowpolitical interest. This must be met with an increased visibility of policies and legislation. Projectsstopping due to administrative con�icts or misunderstandings delay the development of the technology.To increase the investor interest of pico and micro hydropower, functioning schemes must be completedand displayed to stakeholders. Capacitating involved actors in administrating projects, could improvethe conditions.Future studies proposed, based on the results in this report, are for example to compare the perception,expressed by the stakeholders in Manica province, of the potential for pico and micro hydropower, withstakeholders from other provinces. It would also be of interest to do more studies on increasing thereliability of the water resources. An alternative could be to investigate the potential, in Mozambique,for Integrated Renewable Energy Systems (IRES), where hydropower is complemented by other sourcesof energy, for example solar. Another interesting topic would be to evaluate the possibility to improvedesigns of local turbines, by increased part-�ow e�ciency, or by reducing losses in the turbine.64

Bibliography[Ahlborg, 2012] Ahlborg, H. (2012). Electricity for better lives in rural Tanzania and Mozambique -Understanding and addressing the challenges. Licentiate Thesis, Chalmers University ofTechnology, Department of Energy and Environment.[Ajith Kumara et al., 2002] Ajith Kumara, P. G., N. Musafer and T. Kalugalagedera. (2002). Communitybased micro-hydro village electri�cation schemes - Technology and approach. Colombo:Practical Action Publications[AKSM, 2012] Associaçao Kwaedza Simukai Manica (AKSM). (2012). AMES MPHP Sites DatabaseManica Province. Manica: AKSM document.[Alzola et al., 2009] Alzola, J.A. et al. (2009). Microgrids project, Part 2: Design of an electri�cation kitwith high content of renewable energy sources in Senegal. Renewable energy. 34, 2151-2159[Barnes and Floor, 1996] Barnes, D. F. and Floor, W. M. (1996). RURAL ENERGY IN DEVELOPINGCOUNTRIES: A Challenge for Economic Development. Annual Review of Energy and theEnvironment 21, 497-530.[Blennow, 2004] Blennow, H. (2004).Method for rural load estimations - a case study in Tanzania. MasterThesis, Lund Institute of Technology.[British Hydro, 2004] British Hydropower Association. (2004).A Guide to UK Mini Hydro Developments,http://www.british-hydro.org/mini-hydro/index.html, 10th September 2012.[Chambal, 2010] Chambal, H. (2010). Series on Trade and Energy Security � Policy Report 3: Energysecurity in Mozambique, Winnipeg: International Institute for Sustainable DevelopmentPublications.[Chiaradia, 2008] Chiaradia, T. (2008). Consolidation of Pico Component of MHPP,http://energypedia.info/index.php/File:MHPP\'s_Pico_Component_2007-08.pdf,17th September 2012.[Commonwealth of Nations, 2011] Commonwealth of Nations. (2011). 2011 Common-wealth Yearbook. Mozambique Country Pro�le, http://www.commonwealth-of-nations.org/xstandard/mozambique_country_pro�le.pdf, 5th September 2012.[EdM, 2007] Electricidade de Moçambique (EdM). (October 2007).Draft Low Cost Rural Electri�cationPlan Report. Ref: 60018783/109, Maputo: EdM Publications.[EdM, 2010] Electricidade de Moçambique (EdM). (2010). Statistical Summary 2010, Maputo: EdMPublications.[EdM, 2012] Electricidade de Moçambique (EdM). (2012). Homepage, http://www.edm.co.mz/, 4thOctober 2012.[Ekanayake, 2002] J.B. Ekanayake. (2002). Induction generators for small hydro schemes. Power Engi-neering Journal. April, 61-67.[Ellegård et al., 2004] Ellegård, A. et al. (2004). Rural people pay for solar: experience from the ZambiaPV-ESCO project. Renewable Energy. 29, 1251-1263.65

[FAO, 2008] Food and Agriculture Organization of the United Nations (FAO). (2008). Hydropowerresource assessment of Africa. In: Ministerial Conference on water for agriculture andenergy in Africa: The challenges of climate change, Sirte, Libyan Arab Jamahiriya 15-17December, pp.10.[FUNAE, 2012a] FUNAE. (2012). hydropower investment guidelines, Maputo: FUNAE Publications.[FUNAE, 2012b] FUNAE. (2012). Projecto de Desenvolvimento de Centrais Hídricas no âmbito do Pro-grama de Energia Renováveis para o Desenvolvimento Rural (RERD) da BTC, Maputo:FUNAE Publications.[FUNAE, 2012c] FUNAE. (2012). Home page, http://www.funae.co.mz, 6th September 2012.[Gaul et al.,2010] Gaul, M., Kölling, F and Schrödinger, M. (2010). Policy and regulatory frameworkconditions for small hydropower in Sub-Saharan Africa � Discussion paper, Eschborn:EU Energy Initiative Partnership Dialogue Facility/GIZ Publications.[Gustavsson, 2007] M. Gustavsson. (2007). With time comes increased loads - An analysis of solar homesystem use in Lundazi, Zambia. Renewable Energy. 32, 796-813.[Holland et al., 2001] Holland, R., Perera, T., Sanchez, T. and Wilkinson, R. (2001). Decentralised ruralelectri�cation: Critical success factors and experiences of an NGO. Refocus 2, 28-31.[INAM, 2012] Instituto Nacional de Meteorologia. (2012). Interpretação da Previsão Climatica Sazonal,http://www.inam.gov.mz/, 6th September 2012.[IRENA, 2012a] International Renewable Energy Agency. (IRENA). (2012). Country Case study. Re-newables Readiness Assessment. Mozambique. Preliminary �ndings, Abu Dhabi: IRENAPublications.[IRENA, 2012b] International Renewable Energy Agency. (IRENA). (2012). Renewable Energy Technolo-gies: Cost analysis series: Hydropower, Abu Dhabi: IRENA Publications.[Jonker Klunne, 2012a] Jonker Klunne, W.E. (2012). Current status and future developments of smalland micro hydro in southern Africa. In: Hidroenergia 2012 conference, Wrocªaw, Poland23-26 May.[Jonker Klunne, 2012b] Jonker Klunne, W.E. (2012). Microhydropower.net,http://microhydropower.net/basics/turbines.php, 10th September 2012.[1] Kaundinya, D. P., P. Balachandra and N. H. Ravindranath. (2009). Grid-connected versusstand-alone energy systems for decentralized power - A review of literature. Renewable andSustainable Energy Reviews 13, 2041-2050.[Kirubi et al., 2009] Kirubi, C. et al. (2009). Community-Based Electric Micro-Grids Can Contribute toRural Development: Evidence from Kenya. World Development 37 (7), 1208-1221.[Maher, 2002] Maher, P. (2002). Community Pico Hydro in Sub-Saharan Africa: Case Study 2. Site:Thima, Kirinyaga District, Kenya, Micro Hydro Centre, Nottingham Trent University.[Maher et al, 2003] Maher, P., N.P.A. Smith and A.A. Williams. (2003). Assessment of pico hydro as anoption for o�-grid electri�cation in Kenya. Renewable Energy 28, 1357-1369.[Meier and Fischer, 2011] Meier, T and Fischer, G. (2011). Assessment of the pico and micro-hydropowermarket in Rwanda, St. Gallen: GVEP International and Entec Publications.[Mikkelsen, 2005] Mikkelsen, B. (2005). Methods for development work and research. A new guide forpractitioners, 2nd edition, New Delhi/Thousand Oaks/London: Sage Publications.[MoE, 2009] Ministry of Energy (MoE). (2009). Social and Environmental Management Framework,Maputo: MoE Publications.[MoE, 2011] Ministry of Energy (MoE). (2011). Strategy for new and renewable energy development2011-2025 (EDENR), Maputo: MoE Publications.66

[Mtalo, 2005] Mtalo, F. (2005). Small scale hydropower for rural development, Dar Es-Salaam: NileBasin Capacity Building Network NBCBN Research cluster.[Mutubuki-Makuyana, 2011] Mutubuki-Makuyana, C. S. (2011). Catalysing Modern Energy Service De-livery to Marginal communities in Southern Africa, Harare: Practical Action publications.[Penche, 1998/2004] Penche, C. (1998/2004). Små vattenkraftverk � en handbok [Guide on how to developa small hydro site]. Trans. Rundqvist, J., C. Söderberg and B. Bergander, ESHA.[Paish and Green, 2001] Paish, O. and Green, J. (2001). The Pico Hydro Market in Vietnam,http://www.d�d.gov.uk/r4d/PDF/Outputs/Energy/R8150-Vietnam.pdf, 5th September2012.[Pigaht and van der Plas, 2009] Pigaht, M. and R. J. van der Plas. (2009). Innovative private micro-hydropower development in Rwanda. Energy Policy. 37, 4753-4760.[Ramakumar, 2012] Ramakumar, R. (2012). Integrated renewable energy systems - Micro grid (IRES-MG) for sustainable development. In: Expert group Meeting on Potential of renewableenergy options in o�-grid areas of Africa: importance of mini-grid energy systems, TriesteApril 3-5 2012.[Renewables First, 2012] Renewables First. (2012). Introduction to Run-of-River Micro Hydropower andSmall Hydropower, http://www.renewables�rst.co.uk/introduction-to-micro-and_small-scale-hydro-power.html, 17th September 2012.[RURA, 2012] Rwanda Utilities Regulatory Agency (RURA). (2012). RegulationNº001/Energy/RURA/2012 of 09/02/2012 on Rwandan renewable energy feed-intari�, Kigali: RURA Publications.[SIDA, 2011] SIDA. (2011). Faktablad: Elektricitet sätter fart på hjulen på Moçambiqueslandsbygd, http://www.sida.se/Global/M%C3%A4nniskan%20i%20centrum%20-%20pdf/04_Faktablad_Mocambique_vatten_webb.pdf, 5th September 2012.[Smith and Ranjitkar, 2000] Smith, N., and Ranjitkar, G. (2000). Nepal Case Study - Part Two. Powerdistribution, safety and costs. Pico hydro. October, 3-5.[UNDP, 2011a] UNDP. (2011). Human Development Report 2011. Sustainability and Equity: A betterfuture for all, New York: United Nations Development Programme Publications.[UNDP, 2011b] United Nations Development Programme. (July 2011). Fast facts: Universal Energy Ac-cess, http://www.undp.org/energy, 5th March 2012.[WB, 2007] World Bank (WB). (2007). Mozambique Country Water Resources Assistance Strategy:Making Water Work for Sustainable Growth and Poverty Reduction, Maputo: WB Pub-lications.[WB, 2008] World Bank (WB). (November 2008).Designing Sustainable O�-Grid Rural Electri�cationProjects: Principles and Practices, Washington DC: WB Publications.[WB, 2009] World Bank (WB). (September 2009). Energy Strategy Approach Paper,http://www.worldbank.org/, 13th September 2011.[WB, 2012] World Bank (WB). (2012).World Bank Data Catalogue, http://data.worldbank.org/data-catalog, 5th September 2012.[Williams, 2007] Williams, A. (2007). Pico hydro for cost-e�ective lighting. Boiling Point. 53.[Williams and Simpson, 2009] Williams, A.A. and Simpson, R. (2009). Pico hydro � Reducing technicalrisks for rural electri�cation. Renewable Energy 34, 1986-1991.[Williamsson et al., 2012] Williamsson, S.J., Stark, B.H., Booker, J.D. (2012). Low head pico hydroturbine selection using a multi-criteria analysis. Renewable Energy. XX (article in press),1-8. 67

Appendix AInterview guide - FUNAE BIntroduce subjectNamesBackground: We are doing a study on the potential of using small-scale hydropower in rural areasof Mozambique. The study is a part of the larger project STEEP-RES organized by Swedish SIDA.We would like to ask you about your opinions on small-scale hydropower. And by small-scale we meanpico and micro hydropower stations, with a capacity up to 300 kW. The project is in two parts, onethat consists of making interviews and gathering stakeholder opinions, and the other to make a techno-economic model. The questions asked about data are to help us make the model as realistic as possible.We brought a recorder to be able to listen to the interview afterwards. It is only for us and ourproject. Is it okay with you that we record the interview?Introduction questions1. Would you like to tell us your name and what it is you work with?2. What is your experience of small-scale hydropower?3. What is your experience of other types of rural electri�cation?4. What are your current projects in Manica Province? For how long?Economic barriers:Investments(Investments available. What attracts investors. Reasonable loan conditions.)1. Can you get funding for an o�-grid small-scale hydro power project? How?2. What kind of funding? Loans, grant.3. What would be the normal loan percentage?4. What would the interest be? Depreciation time?5. Is there available data on your investment costs for SSH projects? Usual cost? Cost distribution?(civil works, pre-feasibility, design etc)6. From your point of view, what is interesting in an electri�cation project? Local investors? Govern-mental? Foreign?7. Are there ways to increase investors' interest in small scale hydro?8. Is small scale hydro a reliable technique?9. Do you think the decentralization will make a di�erence? District funds.68

Consumer prices(Consumers having problems paying electricity bills. Consumers willingness to pay.)1. How do customers pay for electricity from SSH? How much?2. How have payments worked so far?3. Are there problems with payment?4. Do you see any good solutions to problems with payment?5. Are people in rural areas willing to pay for electricity? Why/Why not?6. Do you see any way to increase the willingness to pay for electricity?Technical barriers:Suitability(Available sites near villages, suitable topography and hydrology. Suitable village structure.)1. How much data is available for selection of SSH sites? (hydrology, topography, remoteness, villagestructure, demand)2. What areas in Mozambique do you think are suitable SSH? What other areas than Manica Province?3. How are the houses distributed in the community in those areas? Near or far apart? Most common?How does the investment cost depend on the distance between houses in the community?4. How much does a 100 m power line cost?5. How close to the community should the power station be situated? Regarding power losses? Max-imum distance? Do you use transformers to reduce power losses?Availability(Available suppliers of all types of equipment: turbines, generators, wiring, transformers, safety equip-ment, low power loads. Importing di�culties.)1. What turbines and generators do you use? Cost?2. Where do you get them from?3. We heard you use synchronous generators. Why not induction generators?4. How much does the price and availability of the equipment in�uence the design?5. Do you include low power loads for the consumers in the projects?6. Are there possible suppliers available for small-scale hydro equipment? Widespread?7. How much (electrical, turbines) equipment is made in Mozambique and how much is imported?8. What are the advantages or disadvantages with importing small scale hydropower equipment com-pared to local manufacturing?Safety(Associated risks: electrocution, �ooding, equipment failure, theft.)1. What risks do you associate with small scale hydro? Examples?2. What should be done to prevent the risks? Safety equipment?3. What safety equipment do you use? How much does it cost?69

Quality(The robustness of equipment. Need for replacement of spare parts.)1. What is the usual quality of equipment? Is there a di�erence in quality in imported and locallymade?2. How often does it need maintenance?3. How much is that compared to other types of systems like diesel generators and Solar PV?4. How does it work to provide that level of maintenance?Social barriers:Education(Knowledge level. People with knowledge in key positions (investors, legislators, FUNAE, contractors,consumers, EdM. Possibility to teach local workers. Motivation of workers. Information dissemination.)1. Who does the designs of your SSH stations?2. What level of technical expertise of SSH is there in Chimoio? Who has it?3. What level of knowledge of small scale hydropower is there in Chimoio? Who has it? More keypositions? (FUNAE, investors, legislators, contractors, consumers, EdM)?4. How widespread throughout the country is knowledge of small scale hydropower? (FUNAE, in-vestors, legislators, contractors, consumers, EdM)5. In what way is the knowledge spread today on all levels? Improvements?6. How has it worked so far with teaching locals how to run a SSH? Examples?7. What kind of education is needed to run your systems? Basic education needed? Are there schoolsand teachers?8. Has there been problems teaching locals how to build and run a small scale hydropower station?9. Do you see any good solutions?10. Is there motivation among locals to participate in the construction of a SSHP station? Quali�edwork like installing and running the system, if they are paid? (If they are not paid?)11. In your case, what are the wages normally?12. Is there motivation among locals to participate in civil works, like building canals and poles for thegrid, if they are paid? If they are not paid?13. In your case, what are the wages normally?Demand(Demand of productive use. Sizing.)1. What is the electricity used for on your SSH sites? Household/Productive use? Examples?2. Is small-scale hydropower suitable for productive use? Why/Why not?3. Is there a demand for productive use of electricity in areas suitable for small scale hydro?4. Is the sizing of o�-grid system usually adjusted for present or future demand? Oversizing from thebeginning? Increasing capacity after some time? O�-grid system in general?5. How is the sizing calculated? Per consumer? How well do the calculations suit reality?6. Do you use load and/or generation meters in the communities? How much do they cost?70

Administration(Complicated project structure. Project ownership. Responsibility for maintenance.)1. With your model using a private owner of the operating the SSH station. How has it worked? Whatare the advantages/disadvantages with this model?2. How does the cooperation with NGOs work? As potential owners, as a business partner like AKSM?Local people's role?3. Are there usually problems with cooperation between di�erent actors in a project? 45. How are theprojects to administrate? 46. What could be done to make it easier to administrate such projects?4. What will happen when the main grid reaches a SSH site? Possible to connect? Coordinationbetween grid extension and o� grid projects?Legislation(Lack of legal framework. Badly adjusted legal framework.) (Specify laws when we know)1. What laws are relevant for SSH?2. In Mozambique today, there is mainly large-scale hydropower. Do the laws and policies that existnow hinder or support small scale hydro projects? Why? How? Since when?3. Do the laws and/or policies need to be improved? How?Infrastructure(Conditions of roads. Bulkiness and sensitivity of equipment. Distance operation.)1. How does the condition of the roads in�uence the use of small scale hydropower? Choice of equip-ment? Choice of area? Maintenance? Examples?2. Are there means of transport for large heavy equipment? How heavy/large? Examples? (3mturbine)3. What is the risk of equipment failure during transport?4. Is there experience of using distance operation of power stations? Would it be an option?Conclusion:1. What are the most important problems to solve for small scale hydropower to be attractive?2. What are your future projects? What will be improved from previous projects?3. Is there anything that you would like to add?4. Is there anything that you would like to ask us?
71

Appendix BInterview codingTable B.1 shows an example of how the data from the interviews is condensed and then sorted into acode.Respondent Data Condensation CodeGov. ent.employee B Here in Africa we have one danger. E�ciency we get in the laband performance in the �eld. Miles apart. E�ciency andperformance are two di�erent things. Especially here. Why?Because we don't have a culture of maintenance. We are playingaround with the word maintenance in the local languages. Itturns out the word doesn't even exist in some languages. Theclosest we can get is repair, and that is a totally di�erent story.Maintenance is cleaning you house, making your bed, puttingeverything in place, that's preventive maintenance. Then youhave routine maintenance. This doesn't exist.They don't have aculture of maintenance. Maintenance
NGO A The most critical and weak part of everything we are doing isdocumentation. We just talk. No one writes or saves anything.We can talk very nicely but if you ask me tomorrow what iswritten, I say I'm sorry... "The most critical andweak part of everythingwe are doing isdocumentation". Knowledgemanage-mentTable B.1: An example of coding procedure.
72

Appendix CApplications for all load pro�lesThe three di�erent community load pro�les have the following applications.Application Load [kW]Shop 0.8Street light 0.3Households 0.2 [kW/HH](a) Small community pro�leApplication Load [kW]Shop 0.8Primary school 2Street light 0.3Households 0.2 [kW/HH](b) Medium community pro�le
Application Load [kW]Shops 1.6O�ce 3.15Street lights 0.9Households 0.2-0-62 [kW/HH](c) Large community pro�leTable C.1: Applications for load pro�les.
73

Appendix DSite characteristics and �ow variationcurvesTable D.1: Site characteristics. Head and �ow for 17 sites in Manica province.site 1 2 3 4 5 6 7 8 9 10 11 12 13 14 15 16 17head [m] 86 82 59 52 50 48 45 28.8 25.3 24.7 150 56 40.5 30 25 10 12�ow [l/s] 200 254 80 100 80 110 100 100 200 100 35 12.5 20 10 28 300 1000
5 10 15 20 25 30 350
100
200
300
400
500
600
700
800
900
1000
time [dekads]
flow
[l/s
]
Flow variation curve, site 1
(a) site 1 5 10 15 20 25 30 350
100
200
300
400
500
600
700
800
900
1000
time [dekads]
flow
[l/s
]
Flow variation curve, site 2
(b) site 2 5 10 15 20 25 30 350
100
200
300
400
500
600
700
800
900
1000
time [dekads]
flow
[l/s
]
Flow variation curve, site 3
(c) site 35 10 15 20 25 30 35
0
100
200
300
400
500
600
700
800
900
1000
time [dekads]
flow
[l/s
]
Flow variation curve, site 4
(d) site 4 5 10 15 20 25 30 350
100
200
300
400
500
600
700
800
900
1000
time [dekads]
flow
[l/s
]
Flow variation curve, site 5
(e) site 5 5 10 15 20 25 30 350
100
200
300
400
500
600
700
800
900
1000
time [dekads]
flow
[l/s
]
Flow variation curve, site 6
(f) site 6Figure D.1: Flow variation curves.74

5 10 15 20 25 30 350
100
200
300
400
500
600
700
800
900
1000
time [dekads]
flow
[l/s
]
Flow variation curve, site 7
(a) site 7 5 10 15 20 25 30 350
100
200
300
400
500
600
700
800
900
1000
time [dekads]
flow
[l/s
]
Flow variation curve, site 8
(b) site 8 5 10 15 20 25 30 350
100
200
300
400
500
600
700
800
900
1000
time [dekads]
flow
[l/s
]
Flow variation curve, site 9
(c) site 95 10 15 20 25 30 35
0
100
200
300
400
500
600
700
800
900
1000
time [dekads]
flow
[l/s
]
Flow variation curve, site 10
(d) site 10 5 10 15 20 25 30 350
100
200
300
400
500
600
700
800
900
1000
time [dekads]
flow
[l/s
]
Flow variation curve, site 11
(e) site 11 5 10 15 20 25 30 350
100
200
300
400
500
600
700
800
900
1000
time [dekads]
flow
[l/s
]
Flow variation curve, site 12
(f) site 125 10 15 20 25 30 35
0
100
200
300
400
500
600
700
800
900
1000
time [dekads]
flow
[l/s
]
Flow variation curve, site 13
(g) site 13 5 10 15 20 25 30 350
100
200
300
400
500
600
700
800
900
1000
time [dekads]
flow
[l/s
]
Flow variation curve, site 14
(h) site 14 5 10 15 20 25 30 350
100
200
300
400
500
600
700
800
900
1000
time [dekads]
flow
[l/s
]
Flow variation curve, site 15
(i) site 155 10 15 20 25 30 35
0
100
200
300
400
500
600
700
800
900
1000
time [dekads]
flow
[l/s
]
Flow variation curve, site 16
(j) site 16 5 10 15 20 25 30 350
500
1000
1500
2000
2500
3000
3500
time [dekads]
flow
[l/s
]
Flow variation curve, site 17
(k) site 17Figure D.2: Flow variation curves.75

Appendix EBarriers - all respondentsTable E.1 and E.1 show how all respondents mentioned in the report adress barriers. It also includesthree respondents that have not been interviewed according to the interview guide. The barriers theymention are simly marked by a vertical line, to show they have been adressed.Table E.1: Barriers mentioned by all respondents. The letter B indicates the respondent considers the matter as a barrier.The letter O indicates a suggestion to overcome barriers, and a vertical line means the subject is simply adressed. 1 - NDRE, 2 -FUNAE A, 3 - EdM A, 4 - Donor A, 5 - Donor B, 6 - Gov. ent. employee A, 7 - Consultants A&B, 8- Consultant C, 9 - FUNAEB, 10 - EdM B, 11 - Gov. ent. employee B, 12 - NGO A, 13 - NGO B employees, 14 - Gov. ent. employee C, 15 - Committeemember, 16 - Power system owner.Barriers 1 2 3 4 5 6 7 8 9 10 11 12 13 14 15 16Low quality oflocal products B | | B B BHigh import duties B O | | | B B |Limited ruralinfrastructure | B B | B | |Lack of access tospare parts O B B O B O |Lack of localinvolvement B B B O O B OCommunityrelations hinderpower stationmanagement B B | B OLack of localcontribution B O B
76
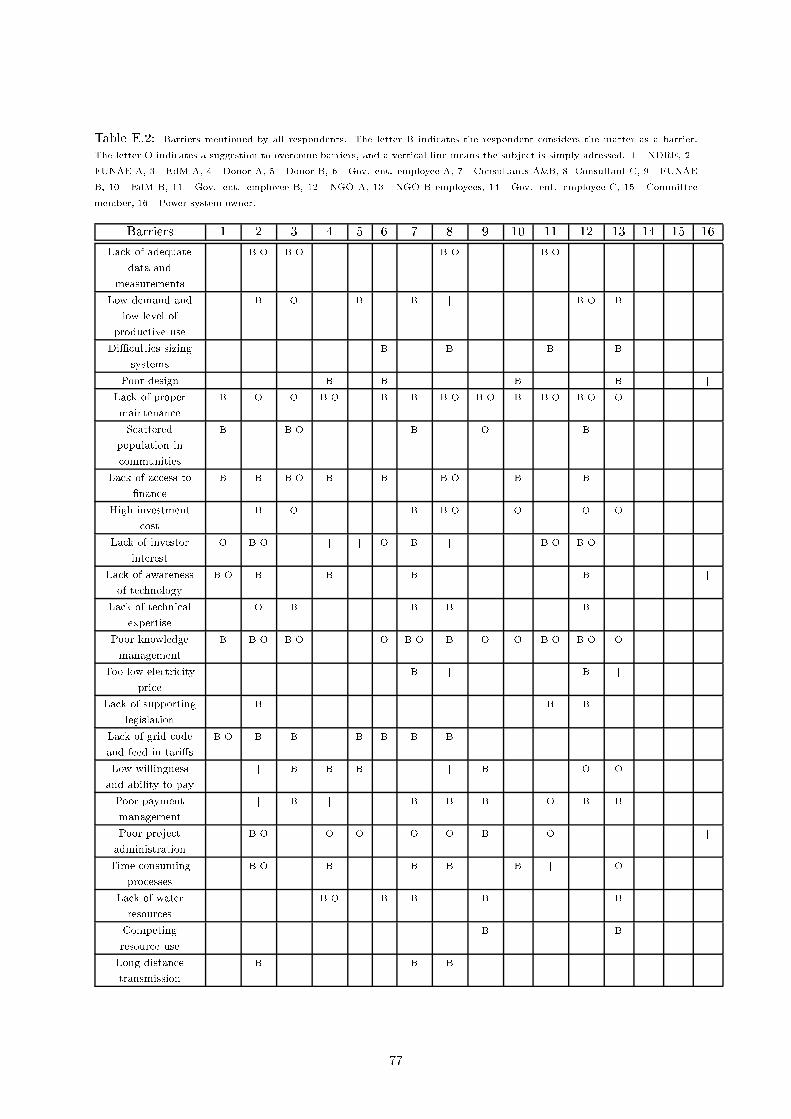
Table E.2: Barriers mentioned by all respondents. The letter B indicates the respondent considers the matter as a barrier.The letter O indicates a suggestion to overcome barriers, and a vertical line means the subject is simply adressed. 1 - NDRE, 2 -FUNAE A, 3 - EdM A, 4 - Donor A, 5 - Donor B, 6 - Gov. ent. employee A, 7 - Consultants A&B, 8- Consultant C, 9 - FUNAEB, 10 - EdM B, 11 - Gov. ent. employee B, 12 - NGO A, 13 - NGO B employees, 14 - Gov. ent. employee C, 15 - Committeemember, 16 - Power system owner.Barriers 1 2 3 4 5 6 7 8 9 10 11 12 13 14 15 16Lack of adequatedata andmeasurements B O B O | B O B OLow demand andlow level ofproductive use B O B | B | B O BDi�culties sizingsystems | B | B B | BPoor design B B B | B |Lack of propermaintenance B O O B O B B B O B O B B O B O O |Scatteredpopulation incommunities B B O B O BLack of access to�nance B B B O B B B O B B |High investmentcost | B O B B O | O O O |Lack of investorinterest O B O | | O B | B O B OLack of awarenessof technology B O B B B B |Lack of technicalexpertise O B B B B |Poor knowledgemanagement B B O B O O B O B O O B O B O OToo low electricityprice B | B |Lack of supportinglegislation B | B BLack of grid codeand feed-in tari�s B O B B B B B B |Low willingnessand ability to pay | B B B | B O OPoor paymentmanagement | B | B B B | O B B | |Poor projectadministration B O O O O O B O | |Time consumingprocesses B O B B B B | OLack of waterresources B O B B B | B |Competingresource use B BLong distancetransmission B B B77