Embed Size (px)
Citation preview

Michael Giddings Page 1 of 277 12/10/2016
The Early Assessment of System Performance in Distributed Real-time Systems
Michael A Giddings BSc(Hons), BA
Thesis submitted in partial fulfilment for the degree of Doctor of Philosophy (PhD)
Computing and Communications
October 2016
Supervisors: Internal External Dr. Michel Wermelinger Dr. Pat Allen
Dr. Yijun Yu Dr. Adrian Jackson Professor Jan Jürjens

Michael Giddings Page 2 of 277 12/10/2016
Thesis Abstract
Michael Giddings Page 3 of 277 12/10/2016
ABSTRACT
Distributed real-time process control systems are notoriously difficult to develop. They frequently
overrun time schedules and break cost constraints. The problems are compounded where there are
multiple development teams and stakeholders. Conventional model-driven development has been
examined to see if it can be extended to resolve some of these problems. It may be possible to use
early system design stages to identify performance issues which would otherwise not be identified
until late in the development of the system. A functional model is proposed, in addition to those
conventionally used for model-driven development, based on loosely coupled functional elements,
to represent the behaviour of each system component. The model complements existing
requirements and design specifications and addresses the combination of individual component
abstractions to produce a complete system specification.
The functional model enables the accurate prediction of system performance prior to the detailed
design of each component. The thesis examines how performance can be calculated and modelled.
An animator tool and associated code generator are used to predict system and component
performance in a distributed aircraft navigation system.
The use of the animator to support the system design prior to the generation of the component
contract specifications and interface control documents provides a means of assessing performance
which is accessible to domain experts and system designers alike. The model also enables the
effects of requirements changes and component design issues on the system design to be
assessed in terms of the system design to provide system wide solutions.
This performance assessment model and animator compliments the existing 'fix-it-later' approach,
reducing the chances of performance failure detected late during the system development process
when they are most expensive to fix.

Thesis Abstract
Michael Giddings Page 4 of 277 12/10/2016
Thesis Contents
Michael Giddings Page 5 of 277 12/10/2016
CONTENTS
Abstract 3
Contents 5
Diagrams 13
Tables 19
Abbreviations 21
Chapter 1 Introduction 23
1.1 Introduction 23
1.2 Research question 24
1.3 Systems considered 24
1.4 Context 25
1.5 Overview of research 31
1.6 Contribution and significance 32
1.7 Thesis road map 34
Chapter 2 Distributed real-time systems 35
2.1 The problem 35
2.1.1 Performance management of real-time systems 35
2.1.2 Types of system under consideration 38
2.1.2.1 Systems of interest 38
2.1.2.2 Real-time systems 38
2.1.3 Design Routes 42
2.1.4 Stakeholders in the process 42
2.1.4.1 The customer 43
2.1.4.2 The System Design Authority 44
2.1.4.3 The Subsystem Design Authorities 46
2.1.4.4 The Component Design Authorities 46
2.1.5 Types of performance problem 47
Thesis Contents
Michael Giddings Page 6 of 277 12/10/2016
2.1.6 Performance Errors 47
2.1.7 System development failures 52
2.2 Modelling real-time systems 52
2.2.1 Modelling opportunities 53
2.2.2 Abstractions in modelling 54
2.2.3 Measurement 56
2.2.4 Calculation 57
2.2.4.1 Manual calculation 57
2.2.4.2 Formal methods 57
2.2.4.3 Petri-nets 59
2.2.4.4 Statistical methods 63
2.2.5 Functional models 64
2.2.6 Functional elements 65
2.3 Approaches to performance management 65
2.3.1 Fix-it-later 65
2.4 Components 66
2.4.1 Types of components 66
2.4.2 Hardware architectures 67
2.4.3 Interconnection between system components 68
2.4.4 Software architectures 68
2.5 Specifying real-time systems 71
2.5.1 Requirements 72
2.5.2 Component contract specifications 73
2.5.3 Interface control Documents 73
2.5.4 Software specification 73
2.6 Universal Modelling Language (UML) and real-time systems 74
2.6.1 UML 74
2.6.2 Modelling and Analysis of Real-time and 76
Embedded Systems (MARTE)
Thesis Contents
Michael Giddings Page 7 of 277 12/10/2016
2.6.3 Systems Modelling Language (SysML) 79
2.6.4 Simulation Modelling Language (SimML) 79
2.7 Model Driven Development and Real-time Systems 79
2.7.1 MDD design route 80
2.7.2 Computation independent model 83
2.7.3 System design model 84
2.7.4 Platform independent model 85
2.7.5 Platform specific model 89
2.8 Conclusions 90
Chapter 3 A functional model for performance analysis 93
3.1 Introduction 93
3.2 Context 94
3.3 A functional model 94
3.3.1 Customer requirements 98
3.3.2 Initial system hardware architecture 99
3.3.3 Individual system component functional models 100
3.3.4 Multi component functional models 108
3.4 Independent functional elements 108
3.5 Transfer of data between functional elements 111
3.5.1 Migration of data across a functional model 111
3.5.2 Flags 113
3.6 Schedulers 114
3.6.1 Scheduler operation 114
3.6.2 Scheduler specification 118
3.6.3 Multiple scheduler tables – dealing with mode changes 120
3.7 Functional chains 120
3.8 Calculation of performance 122
3.8.1 Analysis of functional elements 122
Thesis Contents
Michael Giddings Page 8 of 277 12/10/2016
3.8.2 Inputs 126
3.8.3 Single functional element delays 130
3.8.4 A sequence of functional elements located in 134
different components
3.8.5 Actuators and displays 137
3.9 Animation of the model 137
3.10 Design 140
3.11 Implementation 142
3.12 Test 142
3.13 Management of performance using a functional model 144
3.14 Summary 145
Chapter 4 Investigation of the proposed model 147
4.1 Introduction 147
4.2 Purpose of investigations 147
4.2.1 Overview of investigations 148
4.2.2 Research methodology 150
4.3 First Investigation 151
4.3.1 Introduction 151
4.3.2 Investigation Aims 152
4.3.3 System design without a functional model 153
4.3.3.1 Selection of a system hardware architecture 153
4.3.3.2 Allocation of functional requirements 154
4.3.3.3 Performance calculation 156
4.3.3.3.1 Initial system design 156
4.3.3.3.2 Design changes to overcome performance shortfalls 162
4.3.3.3.3 Summary of the second pass of the system design 164
4.3.3.4 Allocation of other non-functional requirements 164
4.3.3.5 Traceability 165

Thesis Contents
Michael Giddings Page 9 of 277 12/10/2016
4.3.4 System design development process with the functional model 165
4.3.4.1 Generation of the functional model 165
4.3.4.1.1 Adding detail to the functional element specifications 170
4.3.4.1.2 The weather station sensors 171
4.3.4.1.3 The weather station display 172
4.3.4.2 Analysis of performance end events 172
4.3.4.3 Functional chain simplification 173
4.3.4.4 Calculation of performance from functional chains 176
4.3.4.5 Traceability 178
4.3.5 Summary of investigation and lessons learnt 178
4.4 Second Investigation 180
4.4.1 Introduction 180
4.4.2 Investigation aims 181
4.4.3 Development of system design without the functional model 182
4.4.3.1 Outline requirements 182
4.4.3.2 Selection of system hardware architecture 182
4.4.3.3 Allocation of performance requirements to system 183
components
4.4.3.4 Calculation of performance 187
4.4.3.4.1 Static errors 187
4.4.3.4.2 Stochastic errors 188
4.4.3.4.3 Dynamic errors 188
4.4.3.5 Traceability 188
4.4.4 Development of the system design with the functional model 189
4.4.4.1 Generation of the functional model 189
4.4.4.2 Analysis of performance end events 190
4.4.4.3 Calculation of performance from functional chains 190
4.4.4.4 Other non-functional requirements 195
4.4.4.5 Using an animator to simulate errors 195
Thesis Contents
Michael Giddings Page 10 of 277 12/10/2016
4.4.4.6 Comparison between the results from calculation 196
and animator performance assessments
4.4.5 Summary of investigation and lessons learnt 199
4.5 Third Investigation 200
4.5.1 Introduction 200
4.5.2 Investigation aims 201
4.5.3 Top level requirements 201
4.5.4 Development of the system design 203
without the functional model
4.5.4.1 Selection of a system hardware architecture 203
4.5.4.2 Allocation of functional requirements to system components 203
4.5.4.3 Allocation of performance requirements to 205
system components
4.5.4.4 Calculation of performance 206
4.5.4.5 Performance management 206
4.5.5 Development of the system design with the functional model 207
4.5.5.1 Generation of the functional model 207
4.5.5.2 Analysis of performance end events 210
4.5.5.3 Calculation of performance from functional chains 216
4.5.5.4 Automatic generation of animator code 216
4.5.5.5 Traceability 223
4.5.6 Summary of investigation and lessons learnt 224
Chapter 5 Review of Investigations 225
5.1 Introduction 225
5.2 Summary of outcomes 226
5.2.1 Investigation of the new functional model 226
5.2.2 Calculation of dynamic errors 227
5.2.3 Animation/simulation of static stochastic and dynamic errors 228
Thesis Contents
Michael Giddings Page 11 of 277 12/10/2016
5.2.4 Automatic generation of Animator/simulator code 230
5.2.5 Comparison of functional models with the final system 231
Implementation
5.3 How does the result of the investigations answer the research question 232
5.4 The advantages and disadvantages of the proposed method 233
5.5 Untested assumptions 234
5.6 From theory to practice - how may the model be used 234
Chapter 6 Conclusions, Summary and Future Work 237
6.1 Introduction 237
6.2 Summary 237
6.2.1 Overview 237
6.2.2 The functional model 238
6.2.3 The proposed functional model as a part of model driven 240
development
6.2.4 Calculating performance from the proposed functional model 241
6.2.5 A tool for early animation and simulation of performance 241
6.2.6 Comparison between model based performance assessment 243
and system implementation
6.3 Research Contribution 243
6.4 Future Work 246
6.5 Conclusions 248
References 249
Appendices 259

Thesis Contents
Michael Giddings Page 12 of 277 12/10/2016

Thesis Diagrams
Michael Giddings Page 13 of 277 12/10/2016
DIAGRAMS
Figure 1 Translation between CIM, PIM and PSM models 29
Figure 2 Relationship between system requirements and component 30
Specifications
Figure 3 The flow of design information before the 48
component design has started
Figure 4 A RADAR controlled optical telescope 51
Figure 5 Example of a Petri net diagram for a simple ATM system 62
Figure 6 A V diagram showing where time Petri nets are used 63
Figure 7 Collaboration diagram 67
Figure 8 Information required for an initial system level system diagram 68
Figure 9 An UML-MARTE class diagram of the task-set model 69
Figure 10 A subset of MARTE tasks 77
Figure 11 UML diagrams available within SysML 78
Figure 12 The model driven development design route 81
Figure 13 The relationship between a functional model and a MDD PIM 96

Thesis Diagrams
Michael Giddings Page 14 of 277 12/10/2016
Figure 14 The relationship between the system component model, high level 98
requirements and a system architecture
Figure 15 An example top level requirement 99
Figure 16 An example initial system architecture 99
Figure 17 The features of MARTE which are used within the proposed 101
model
Figure 18 A part of a functional model 103
Figure 19 An example of a diagram consisting of a number of independent 104
functional elements contributing towards an end event
Figure 20 A diagram representing the actual order of the functional elements 104
Figure 21 Another diagram based on the sequence shown in figure 19 106
Figure 22 An example of part of a functional model diagram for a single 107
system component
Figure 23 An example of part of a system functional model 110
including TransferGcNb shown in figure 27
Figure 24 A simple functional model consisting of five functional 112
elements
Figure 25 A sequence diagram for the operation of start() 113
Thesis Diagrams
Michael Giddings Page 15 of 277 12/10/2016
Figure 26 Figure 24 with an additional flag 113
Figure 27 Activity diagram showing how process elements are 116
implemented within a scheduler
Figure 28 The detail of AVCTSFwd 123
Figure 29 An example of a functional chain 124
Figure 30 Functional diagram for the functional element GenerateData, 126
a simple sensor or control
Figure 31 Dynamic sensor errors 128
Figure 32 Dynamic sensor error using Taylor’s theorem 129
Figure 33 Errors associated with a single functional element 131
Figure 34 A single functional element with m inputs and n outputs 131
Figure 35 A specific single element calculation example 134
Figure 36 A linear sequence of functional elements 135
Figure 37 A compound connection of functional elements 136
Figure 38 A functional end event element converting end of event data 137
into a real-world effect

Thesis Diagrams
Michael Giddings Page 16 of 277 12/10/2016
Figure 39 Part of a functional chain used to illustrate how functional 138
elements interact
Figure 40 Sequence diagram for the operation of start() within 138
functionalElementA
Figure 41 The relationship between the functional model, the animator 143
and the PIM
Figure 42 Outline system architecture for the weather station 155
Figure 43 The proposed system architecture for assessment 158
using SysML notation
Figure 44 The simplified hardware architecture used to identify 166
system component schedulers
Figure 45 Example of how functional elements can be represented 168
Figure 46 A functional model for a sensor component 171
Figure 47 A functional model for the display component 172
Figure 48 Functional chain relating to the display of wind direction 175
Figure 49 Initial system hardware architecture 185
Figure 50 Gyro compass data moving from the sensor to the display 186
Figure 51 The DisplayAaircraftHeading functional chain 191

Thesis Diagrams
Michael Giddings Page 17 of 277 12/10/2016
Figure 52 Functional model of the navigation functionality within the 192
avionics computer
Figure 53 Scheduler set up screen 197
Figure 54 Animator run screen 197
Figure 55 Graphical representation of the animator output 198
Figure 56 Animator output compared with the real-world 199
Figure 57 Velocity vector diagram 202
Figure 58 Required track 202
Figure 59 System hardware architecture selected for the 204
display of course to steer
Figure 60 The DisplayCourseToSteer functional chain 208
Figure 61 Avionics computer navigation functional model 209
Figure 62 State chart showing transition between the four main course 211
to steer sub chains
Figure 63 System functional chain DispCoursedToSteer (Forward) 212
Figure 64 System functional chain DispCoursedToSteer (Reverse) 213
Figure 65 Part functional chain ChangeWayPoints (AVComp) 214

Thesis Diagrams
Michael Giddings Page 18 of 277 12/10/2016
Figure 66 Part functional chain LoadWayPoints (AVComp) 215
Figure 67 Class diagram for the revised animator 220
Figure 68 Functional chain showing two independent functional 221
elements within the DispBus component
Figure 69 Revised animator scheduler setup screen 222
Figure 70 Revised animator run screen 222
Figure 71 Revised animator output data 223
Figure 72 A comparison between the real-world, the maximum error and the
animator output from the second case study 229
Figure 73 A comparison between the real-world, the maximum error and the 230
animator output from the second case study

Thesis Tables
Michael Giddings Page 19 of 277 12/10/2016
TABLES
Table 1 Example of a single iteration 118
Table 2 Tabular representation of the structure of a scheduler’s 118
major cycle consisting of m iterations
Table 3 A comparison between functional elements and process elements 140
Table 4 Overview of investigations 149
Table 5 List of functional end events for the weather station 154
Table 6 The requirements for each functional end event 155
Table 7 Summary of the initial system design 161
Table 8 Summary of the second system design 164
Table 9 Scheduler names for each system component 167
Table 10 The scheduler iterator table for the processing system component 169
Table 11 The iteration table in a compressed format 170
Table 12 A sensor iteration schedule 171
Table 13 A display iteration schedule 172
Table 14 The individual functional sub chains in the wind 174
direction display functional chain shown in figure 45
Thesis Tables
Michael Giddings Page 20 of 277 12/10/2016
Table 15 The performance requirement for DisplayAircraftHeading 184
Table 16 Functionality allocated to system components 186
Table 17 Functional elements within the DisplayAircraftHeading functional chain 187
Table 18 Data within the DisplayAircraftHeading functional chain 193
Table 19 Animator results 198
Table 20 End event requirements 204
Table 21 Functionality allocated to system components 205
Table 22 Scheduler definition table 217
Table 23 Functional element definition table 217
Table 24 Data dictionary definition table 218
Table 25 InputData definition table 218
Table 26 OutputData definition table 218
Table 27 LocalData definition table 218
Table 28 Table of appendices describing the programs used 219
to generate animator program code

Thesis Abbreviations
Michael Giddings Page 21 of 277 12/10/2016
ABBREVIATIONS
A Analogue
ATM Automated Teller Machine
CIM Computation Independent Model
CoRE Controlled Requirements Expression
COTS Commercial Off the Shelf
D Digital
EAI Enterprise Application Integration
IBM International Business Machines
ICD Interface Control Document
IEEE Institute of Electrical and Electronic Engineers
ISBN International Standard Book Number
LNCS Lecture Notes in Computer Science
MARTE Modelling and Analysis of Real-time and Embedded Systems
MDA Model Driven Architecture
OMG Object Management Group
PIM Platform Independent Model
PSM Platform Specific Model
RDF Resource Description Framework
SOA Service-Oriented Architecture
SysML Systems Modelling Language
TURTLE Terse RDF Triple Language
UML Universal Modelling Language

Thesis Abbreviations
Michael Giddings Page 22 of 277 12/10/2016

Thesis Introduction
Michael Giddings Page 23 of 277 12/10/2016
Chapter 1 Introduction
1.1 Introduction
Large distributed real-time systems are time consuming to develop. They frequently overrun cost
and time schedules. Woodside et al. [1] comment that in a survey of information technology
executives over 50% had encountered performance issues in over 20% of the applications they
deployed. McManus et al. [2] state that a survey in 2002 showed only one in eight information
technology projects can be considered truly successful with huge sums of money having to be
written off. Pop et al. [3] state that real-time software systems are becoming increasingly difficult
to design. One of the major problems with large distributed systems is that it is difficult to identify
mistakes in the system design until they manifest themselves much later in the system
development. Karimpour et al. [4] explain that the assessment of performance early in the
software development process is particularly important to risk management. It has been claimed
that Model Driven Development (MDD) can address some of these issues. Raistrick et al. [5]
comment that the MDD approach can potentially drive down the rapidly inflating cost of software
development and maintenance of very complex systems.
Older real-time system components were highly cohesive with all the features concentrated in a
single component and typically had low coupling with few connections with other components.
With the advent of integrated systems, functionality is spread between components with many
interconnections, making it more likely that performance issues will not be discovered until late in
the system design. Performance issues are also detected later in the system development due to
the increased system complexity.
Design errors detected late in the development of real-time systems are expensive to rectify
because of the need to repeat large amounts of the development process. If performance
shortfalls can be identified early, significant savings should be possible. Making performance
judgments before system design starts in earnest should result in better-specified systems with

Thesis Introduction
Michael Giddings Page 24 of 277 12/10/2016
less need for redesign and redevelopment. Real-time systems, in particular, are affected by their
system hardware architecture.
System performance is particularly difficult to assess prior to the specification and purchase of
system components. Mistakes in the allocation of functional and performance requirements to
individual components require expensive rework after contracts have been placed. Rework which
involves hardware modifications after component manufacture has started is particularly
expensive.
It is therefore worth reviewing the system design phase to identify the likely sources of errors and
to see if the system design process can be improved to detect and rework potential performance
problems prior to component specification.
1.2 Research question
The research question is how can performance issues be detected in real-time periodic systems
prior to specifying system components when they are more expensive to fix. The research aims to
understand what problems exist in this phase and what can be done to overcome them.
An additional functional model representing system hardware architecture and functional
requirements is proposed, based on hardware component abstractions which represent the
hardware components and inter-component communications. A tool which combines and animates
this specification is also proposed.
1.3 Systems considered
Different system hardware architectures influence design techniques employed to develop them.
Enterprise systems and business systems are not normally considered real-time systems although

Thesis Introduction
Michael Giddings Page 25 of 277 12/10/2016
they all have timing constraints. In real-time systems the hardware architecture usually impacts
their performance in such a way that the software and hardware architecture cannot be developed
independently. The research described in this thesis concentrates on real-time systems which
contain components that can be represented by abstractions which operate in a periodic manner.
Examples of this type of system are aircraft flight control systems and process control systems.
Among the practical examples considered are a simple weather station and parts of an aircraft
navigation system.
1.4 Context
Large distributed real-time systems comprise interlinked system components which contain system
specific software, component specific software, sensors, displays and actuators. These systems
typically operate as open and closed loop process control systems which process information in a
periodic manner. Typical examples of such systems are aircraft avionic and flight control systems.
Large distributed real-time systems consist of computing and non-computing components
developed by diverse teams, often operating within several companies and even countries. The
components themselves are either designed specifically for the system or are Commercial Off The
Shelf (COTS) components which must either be used as they stand or modified at significant cost.
Initial customer requirements are transformed into a system design specification by the system
design authority (SDA). The SDA is normally a team containing domain experts who add detail to
the customer requirements and systems designers who generate the systems design and
component requirements specifications. The SDA establishes traceability between the customer
requirements and the component requirements specifications. The SDA is responsible for the
integration and test of the overall system.

Thesis Introduction
Michael Giddings Page 26 of 277 12/10/2016
Each component design authority is responsible for the design, manufacture and test of a single
component of the system being developed. Each component is designed to satisfy the component’s
contract specification and interface control document rather than the system design.
A method called CoRE [6] [7] was sometimes used to define system requirements using
viewpoints, processes and data. CoRE was suitable for domain experts to use but did not translate
easily into component detailed design. CoRE did not use the object oriented paradigm and was not
readily translatable into UML based specifications.
The Unified Modelling Language (UML) [8] was included as a graphical language as part of the
Rational Unified Process (RUP), which offered a means of specifying systems using the object-
oriented paradigm. UML is a graphical modelling language rather than a design method and is used
to communicate design features rather than to specify a full set of requirements.
A major problem exists in the development of systems during their transition between a set of
outline customer requirements, through the emergence of a system hardware architecture, to the
generation of component requirements specifications. The problem consists of making sure the
combination of individual components and component intercommunications will support the overall
system requirements prior to details of the component design being available from the component
design authorities. Smith et al. [9] describe the problems of early validation of software
performance before a system is fully implemented. If any system level issues are discovered,
changes to the component requirement specifications will require renegotiation which may incur
extra costs. If the problem remains unidentified it may only be discovered during system
integration or even deployment when changes to components and component documentation are
most expensive to make.
The existing and new requirements and the design for each stage of the system design can be
traced back to their origin using a database system such as DOORS (Dynamic Object-Oriented
Requirements System) [10]. Non-functional requirements are much more difficult to manage.

Thesis Introduction
Michael Giddings Page 27 of 277 12/10/2016
Performance requirements are needed for each subsystem and system component derived from an
overall system requirement as the subsystems and components are identified. Close inspection of
the current methodologies (Chapter 2) reveals a weakness in this process which allows some
performance shortcomings to remain hidden until system integration occurs.
It is, however, currently not possible to animate or simulate the proposed system prior to
finalisation of the component contract specifications and interface control documents. Actual
component performance outcomes start to become available after the component design
authorities commence their design activities. The components design authority’s target is to satisfy
the contract specifications and interface control documents rather than the overall system
requirements, so problems in the system domain may remain undetected. If the system design
authority discovers an error in the system design after the component contracts have been placed,
the component suppliers will impose financial penalties.
Several development methods are currently used including prototyping and phasing. Prototyping
usually involves rework (sometimes extensive) following implementation testing. Phasing involves
developing systems in a number of increasingly complex versions which involves developing the
system several times. Whilst a ‘fix-it-later’ approach described by Smith [11] can be used, it is not
suitable for systems involving many stakeholders, where system testing occurs using a systems
integration test rig right at the end of the development process. Prototyping is successfully used
for small systems under the control of a single organisation but much more difficult when tried on
larger systems. Ewusi-Mensah [12] examines a number of projects to see why they fail. He claims
that management and organisation are at the core of failed projects and identifies the following
factors which are dominant in abandoned projects; unrealistic project goals and objectives,
inappropriate project team composition, project management and control problems, inadequate
technical know-how, problematic technology base/infrastructure and changing requirements.
Douglas [13] describes the interactive approaches available for developing real-time systems.
Phasing or iterative development enables early system testing but usually means the whole system
is designed several times. For smaller systems where the development is undertaken by a single
Thesis Introduction
Michael Giddings Page 28 of 277 12/10/2016
organisation good communication between departments can overcome these problems. For larger
systems involving different organisations, companies, and even countries where communication is
more formal, coordination problems arise. Whilst existing performance management is generally
adequate, unpredicted system performance issues occasionally emerge during the latter stages of
development. These shortcomings occur even though the component design authorities meet their
individual performance requirements.
Model Driven Development (MDD) provides a methodology to enable, define and communicate a
solution to a set of system requirements. Using models early in the development process enables
analysis and provides communication between development teams so that design errors can be
detected early. Although the Object Management Group definition of MDD [14] is broad, MDD is
mostly used in the development of system software used in business systems where the impact of
the physical architecture of the system on performance is more predictable.
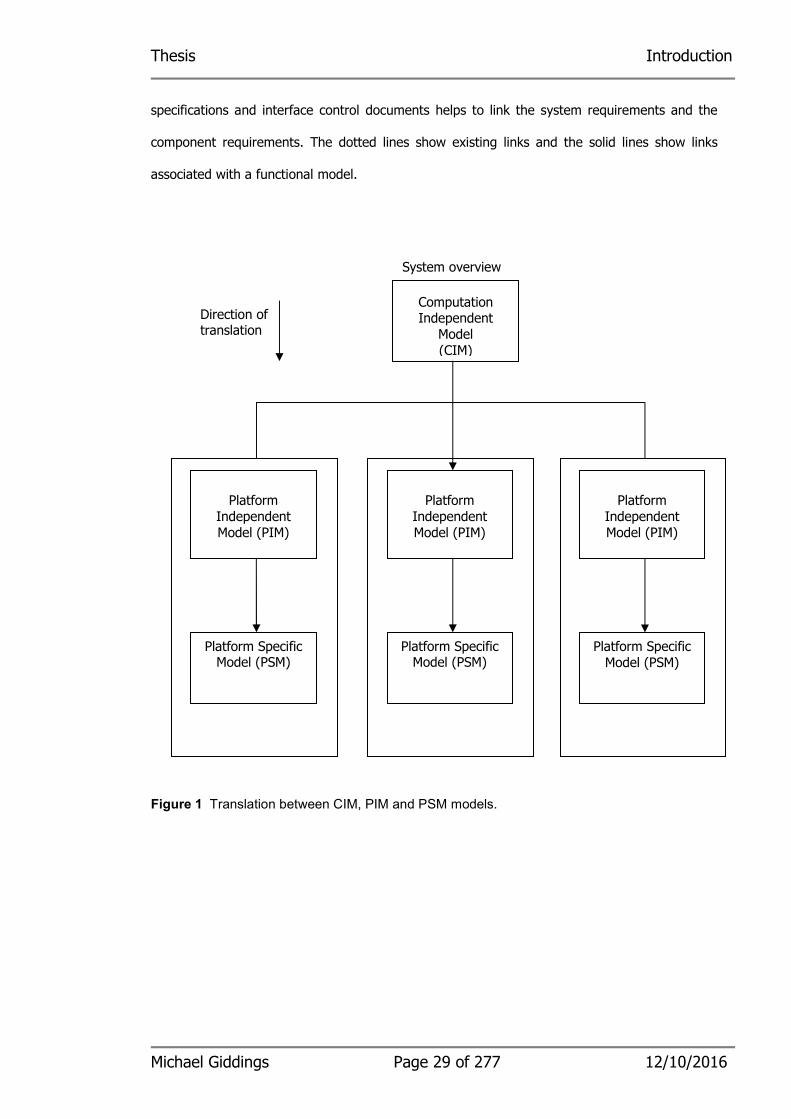
There are three main types of models: Computation Independent Model (CIM), Platform
Independent Model (PIM) and Platform Specific Model (PSM). Automatic translation between
PIMs and PSMs is a key feature of MDD. Figure 1 shows how these models relate to each other.
The CIM provides an overview of the system and the PIMs and PSMs typically describe the
software of individual components.
One of the main themes of Model Driven Design is the translation between individual system
models. The translation between a requirements model based in the user domain and the
components contract specifications and interface control documents should also be included.
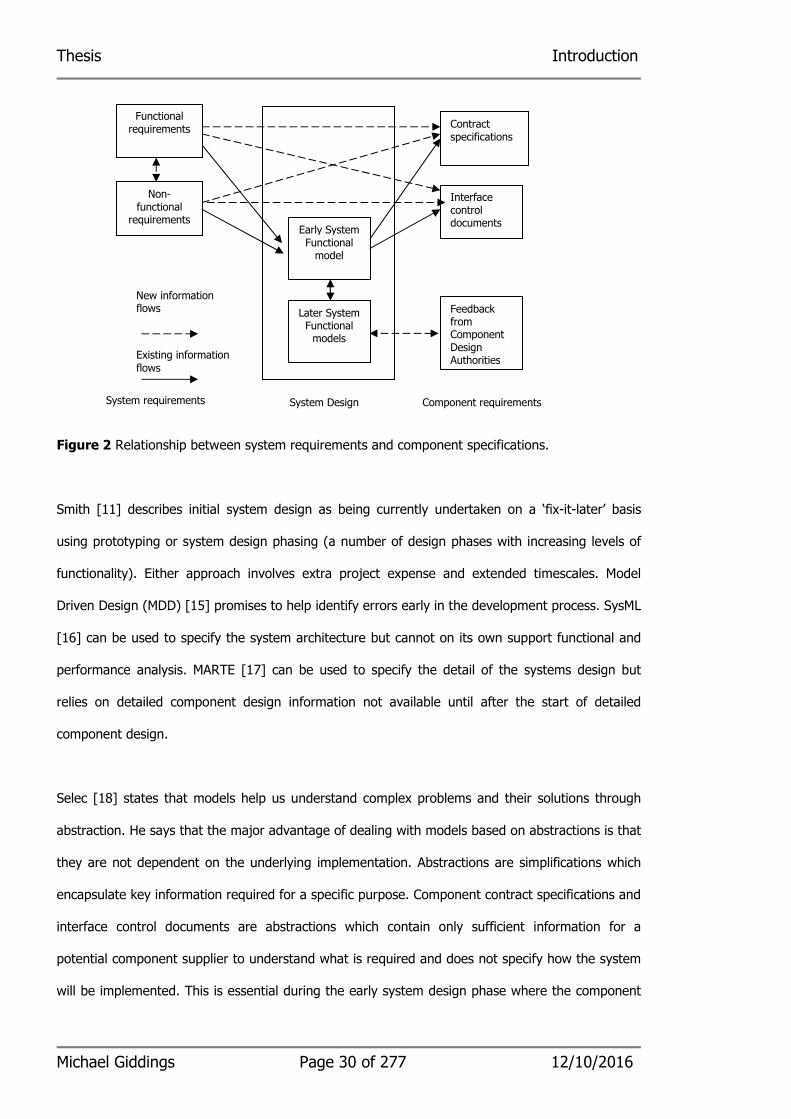
Direct translation between the user domain requirements and component specifications is not
possible as extra detail is required between the system requirements and component
requirements definition stages. Translation is possible, however, between a system level
functional model and the actual contract specifications and interface control documents. Figure
2 shows how a functional model based on the information contained in component contract
Thesis Introduction
Michael Giddings Page 29 of 277 12/10/2016
specifications and interface control documents helps to link the system requirements and the
component requirements. The dotted lines show existing links and the solid lines show links
associated with a functional model.
Figure 1 Translation between CIM, PIM and PSM models.
Direction of translation
Component Software Component Software Component Software
Computation Independent
Model
(CIM)
System overview
Platform
Independent
Model (PIM)
Platform Specific Model (PSM)
Platform
Independent
Model (PIM)
Platform Specific Model (PSM)
Platform
Independent
Model (PIM)
Platform Specific
Model (PSM)
Thesis Introduction
Michael Giddings Page 30 of 277 12/10/2016
Figure 2 Relationship between system requirements and component specifications.
Smith [11] describes initial system design as being currently undertaken on a ‘fix-it-later’ basis
using prototyping or system design phasing (a number of design phases with increasing levels of
functionality). Either approach involves extra project expense and extended timescales. Model
Driven Design (MDD) [15] promises to help identify errors early in the development process. SysML
[16] can be used to specify the system architecture but cannot on its own support functional and
performance analysis. MARTE [17] can be used to specify the detail of the systems design but
relies on detailed component design information not available until after the start of detailed
component design.
Selec [18] states that models help us understand complex problems and their solutions through
abstraction. He says that the major advantage of dealing with models based on abstractions is that
they are not dependent on the underlying implementation. Abstractions are simplifications which
encapsulate key information required for a specific purpose. Component contract specifications and
interface control documents are abstractions which contain only sufficient information for a
potential component supplier to understand what is required and does not specify how the system
will be implemented. This is essential during the early system design phase where the component
Later System Functional models
Feedback from Component Design Authorities
Functional requirements
Non-functional
requirements Early System
Functional model
Contract specifications
Interface control documents
System Design Component requirements System requirements
Existing information
flows
New information flows
Thesis Introduction
Michael Giddings Page 31 of 277 12/10/2016
design has yet to start. Translation between requirements and component contract specifications
and interface control documents requires system design information to be added.
One of the main themes of MDD is the translation between individual system representations.
Translation is needed between system requirements and individual component contract
specifications and interface control documents. Requirements models define requirements in terms
of real-world objects in the user domain. System design models describe what the system is
required do in the system design domain. Both types of requirements models use system 'end
events' associated with system wide requirements which are observable externally, to specify
performance. A typical example of a system 'end event' is the display of aircraft heading in an
aeroplane.
1.5 Overview of research
The research comprises a literature review which identifies what real-time systems are and how
they are currently developed. The review assesses current performance management
techniques used in the development of all types of system.
The research comprises of three phases.
The first investigates how a functional model comprising independent functional elements might
be constructed to specify system components prior to the generation of formal system
component specifications and interface control documents. The proposed functional model
consists of a functional element diagram and an associated functional element scheduler.
Functional element chains are identified which associate functional elements with performance
end events to provide a means of calculating dynamic and stochastic error levels. The first
investigation uses, as an example, a simple weather station consisting of a single processing
component and a number of sensors and a display.
Thesis Introduction
Michael Giddings Page 32 of 277 12/10/2016
The second investigates how component functional models can be combined to generate
system functional models. A simple animator which combines functional element chains and
component functional element schedulers is developed to overcome the difficulties of error
calculation methods. The second investigation, as an example, uses a more complex system of
multiple components to display aircraft heading generated from a gyro compass.
The third investigates an animator which can be automatically generated from a database
representation of a functional model, a more complex example of a multiple component system
which comprises two sensors, a gyro compass and a GPS to generate a course to steer display.
This more complex system provides an example of a closed loop system.
1.6 Contribution and significance
Distributed real-time systems are notoriously difficult to develop frequently overrunning time
schedules and budgeted costs. The development of large distributed systems can involve multiple
stakeholders and teams where the management of mistakes and requirement changes suffer from
poor communication. During the early system design the initial system hardware architecture is
frequently established based on ‘previous experience’ prior to the generation of component
contract specifications and interface control documents. This leads to an initial system design
which will not support all the system requirements. These design shortcomings are subsequently
discovered in later design phases; sometimes as late as system integration where they are the
most expensive to fix.
Conventional model-driven development has been examined to see whether it can be extended to
resolve some of these problems. It may be possible to use early system design stages to identify
performance issues which would otherwise not be identified until late in the development of the
system. A functional model, in addition to those conventionally used for model driven
development, based on loosely coupled functional elements, is proposed to represent the
behaviour of each system.

Thesis Introduction
Michael Giddings Page 33 of 277 12/10/2016
The research establishes the current status of performance management techniques that are used
to bridge the gap between the customer outline requirements and the allocation of system
components requirements to other design responsible teams. Functional and non-functional
requirement specifications and management techniques were examined. The risk of performance
requirements being inappropriately apportioned when the system architecture is also established
and investigated. In order to mitigate the risk a combined functional model suitable for early
performance analysis and modelling is investigated to see if performance shortcomings, which
might not be identified until system integration, may help.
The research identifies a method using abstractions for each processing and non-processing
system hardware component which enables performance analysis prior to the finalisation of system
component contract specifications and interface control documents. The method is centred on an
additional functional model made up of functional elements associated with a scheduler which
represents each component abstraction. The method relies on the extraction of functional chains
from this additional model from which analysis can be undertaken. An animator has been
developed enabling functional chains to be simulated thus avoiding complex calculation. A method
of recording the functional model in a database has been established to enable the animator
software to be automatically generated. The model both establishes an opportunity to undertake
performance analysis prior to choosing components and provides a method for managing late
requirements changes. It also provides a means of resolving component design difficulties by
considering system wide solutions.
The significance of the proposed approach may be that, in certain circumstances, it may reduce
the number of performance problems that are not discovered until late in the design of real time
systems.

Thesis Introduction
Michael Giddings Page 34 of 277 12/10/2016
1.7 Thesis road map
Chapter 1 provides an introduction to the thesis and the research it reports and it summarises the
background and motivation for the activities which have been undertaken.
Chapter 2 reviews the current development of distributed real-time systems focusing on the
management of performance identifying the research problem based on a literature review.
Chapter 3 contains a description of a functional model which enables the initial allocation of
requirements to system components to be assessed.
Chapter 4 consists of a description of three investigations undertaken to investigate the structure
of the proposed functional model, how the model could be used and how performance could be
calculated and animated.
Chapter 5 contains an investigation of the functional model, animator and animator code
generator.
Chapter 6 describes the conclusions from the research undertaken. It provides a summary of the
thesis and identifies further work that may be undertaken.

Thesis Distributed real-time systems
Michael Giddings Page 35 of 277 12/10/2016
Chapter 2 Distributed real-time systems 2.1 The problem
During the early system design phase, after the hardware architecture independent requirements
are generated, requirements are allocated to components. Smith [11] currently describes this as
being undertaken on a 'fix-it-later' basis using ‘previous experience’. Many performance issues
arising from these assumptions are identified in later design phases, causing expensive rework. In
systems where multiple stakeholders from different organisations or even countries are involved,
poor communication may mean that some performance issues are not identified until system
integration or even worse deployment.
This chapter considers how to detect performance related problems early in the development life
cycle using abstractions representing system hardware components.
2.1.1 Performance management of real-time systems
Large distributed real-time systems have common characteristics which make their development
difficult. They have critical performance requirements, and mistakes made at an early stage in their
development may not be detected until the system is finally assembled, when the cost of
correction is at its highest. Karimpour et al. [4] state that most techniques for qualitative
assessment of software are undertaken during the testing phase of system development. They go
note that the early testing of system software is an important feature of risk management, but
performance needs to be assessed using abstractions to represent system components prior to the
software development of individual components. It is important to discover whether the
management of functionality and performance can be improved. This analysis must take into
account the method used, the development route and the stakeholders involved. Becker et al. [19]
have undertaken a survey of performance prediction methodologies for component based systems.
These approaches cover measurement, model-based and combined measurement and model-

Thesis Distributed real-time systems
Michael Giddings Page 36 of 277 12/10/2016
based techniques. A common feature of the approaches described is that they rely on the
availability of detailed component design information. This means they do not help to determine
the suitability of component contract specifications and interface control documents during the
system design phase prior to detailed component design becoming available as they rely on
detailed component design information.
A number of papers summarise performance assessment methods and tools. Smith [20] reviews
the origin of Software Performance Engineering (SPE), lists the software performance models and
describes the SPE process. Koziolek [21] considers component based software systems integrating
classical performance models such as queuing networks, stochastic Petri nets, and stochastic
processing algebras. Woodside et al. [6] state that in a survey of information technology
executives over fifty per cent had encountered performance issues in over twenty per cent of the
applications they deployed. Balsamo et al. [7] have analysed fifteen performance prediction
approaches. These methods apply to a broad range of software systems and performance
requirements, covering shared resources, client/servers and event driven systems but the main
focus is business systems. Each of the performance methods could contribute to the performance
analysis of distributed real-time process control systems but rely on the existence of more detailed
component design information.
Balsamo et al. [22] address fifteen methodologies including queuing network based methodologies,
process-algebra-based approaches, Petri net based approaches, simulation methods and stochastic
processes. They also undertook a review of performance models which characterise the
quantitative behaviour of software systems. However, this review does not fully address the
hardware architecture (which in real-time systems affects performance more) of the system or
components which do not contain software.
Performance shortfalls identified late in the design process require one of two types of remedial
action: hardware changes or software changes. Hardware changes, are often the most expensive

Thesis Distributed real-time systems
Michael Giddings Page 37 of 277 12/10/2016
to fix. Systems often include extra unused capacity to cope with unexpected problems. All changes
require substantive changes to the project documentation.
One of the main purposes of the literature review is to find out whether management of
performance requirements early in the system design process has been already considered. Smith
[11] describes performance assessment during this early development phase as a ‘fix-it-later’
approach. Performance management is typically undertaken after components have been specified
using information arising from the detailed design of system components.
Three main approaches to performance management are assessed in this chapter, formal
methods, UML and MDA.
UML [8] and its extensions are examined to see whether they offer performance management.
UML is found to offer advantages in the specification of real-time systems but, on their own do not
offer performance prediction. Systems can, however, be specified using UML at an early design
stage.
It has been suggested that MDD might aid the development of systems using models. This chapter
reveals that MDE requires an additional model which combines requirements and a system
hardware architecture to be available during the early system design stages.
This chapter also reviews formal methods but these are not usually used to calculate performance
before a design exists. Their use to calculate performance based on the proposed additional
functional model is possible but the difficulty of the calculation methodology involved means
something simpler is needed.

Thesis Distributed real-time systems
Michael Giddings Page 38 of 277 12/10/2016
2.1.2 Types of system under consideration
2.1.2.1 Systems of interest
The design techniques employed to develop systems are influenced by their hardware
architectures. Real-time systems have specific timing requirements, which if not met will lead to
catastrophic consequences. Enterprise systems and business systems are not normally regarded as
real-time systems although they all have timing constraints. In real-time systems the hardware
architecture usually impacts performance in such a way that the software and hardware
architecture cannot be developed independently. The research described in this thesis concentrates
on real-time systems containing components which can be represented by abstractions operating
in a periodic manner. Aircraft flight control systems and process control systems are examples of
this type of system.
2.1.2.2 Real-time systems
Real-time systems are diverse in size, components and function. Their defining feature is their
strict performance requirements. Kavi et al. [9] give a broad overview of real-time systems,
providing a broad appreciation of the range of applications, different types of requirements and the
available software and hardware design tools. They emphasise the need for specialised experience
in their design.
Real-time process control systems may contain sensors, general purpose computers, processing
components, actuators and displays. The examples examined in this thesis contain examples of
these components.
They consist of bespoke and commercial off-the-shelf components (with potentially long
development times). Alenljung et al. [10] describe the difficulties in specifying the requirements of

Thesis Distributed real-time systems
Michael Giddings Page 39 of 277 12/10/2016
complex bespoke components. This represents a challenge for any early system functional model
which goes beyond a personal experience approach. He concludes with a list of sixty eight
comments from IT consultants about the establishment of requirements and the management of
requirement changes. Jilani [11] describes some of the issues of integrating COTS software and
the prediction of behavioural properties prior to purchase. These issues include component
configuration, component certification and component predictability. Although the paper deals with
COTS software, the issues also apply to COTS hardware equipment. Real-time systems may also
have hardware architectures which substantially contribute to the system’s overall performance.
Whilst the systems aim to have high cohesion and low coupling between components, some
functionality may be distributed between components from several suppliers reducing cohesion and
increasing coupling.
Flight control and power plant management systems are examples of large distributed real-time
process control systems consisting of many system components. Failure to operate properly will
have catastrophic results. Aircraft booking systems and stock market management systems are
examples of large distributed real-time systems where failure to operate properly have less
business critical consequences.
Distributed real-time systems contain a wide range of components. Some components typically
contain software but many do not. Each component is connected to at least one other component.
The components may be general purpose computers, processing components, sensors, controls,
actuators, displays and inter-component communications links. The components may be bespoke
components developed for a specific system or commercial off-the-shelf components which already
exist.
Naganathan et al. [12] state that security, reliability, accuracy and trustworthiness are also key
requirements which require early assessment for many real-time systems. It is important that
these features are not overlooked during their development.
Thesis Distributed real-time systems
Michael Giddings Page 40 of 277 12/10/2016
Real-time systems which fail to meet performance requirements may lead to catastrophic shortfalls
in the operation of the system, resulting in loss of equipment or loss of life. Non-real-time systems
have temporal requirements but they are not critical. There are no clear boundaries between these
categories, so even though the use of the terms is common, the allocation of a system to one of
these two groups may not be consistent. This research focuses on the development of real-time
systems which process data on a periodic repeating basis.
Some real-time systems are described as embedded systems. An embedded system is
a computer system with a dedicated function within a larger mechanical or electrical system, often
with real-time computing constraints. They contain computer(s) as part of a larger system which
does not exist primarily to provide standard computing services to a user. The systems interact
with hardware at a low level. Bonjour et al. [13] describe how embedded systems can be defined
in terms of functional elements which can be mapped onto system components – a key feature of
the approach proposed in this thesis. Embedded systems can be associated with a single
processing component such as a weather station or as part of a distributed system such as an
aircraft avionic system. Both contain periodic processing and are used as examples in this thesis.
Kopetz [14] states that as the functionality of embedded systems increase in complexity, the
system level models must remain simple and understandable. He emphasises that abstraction can
be used to reduce the emerging complexity by focusing on the relevant properties leading to a
simpler model representation. Sangiovanni-Vincentelli [15] emphasises that as systems became
more complex the need for a higher level of abstraction has been identified. Abstractions
consisting of functional elements are used to represent system components in the proposed
additional model. The functional elements in the model can also be combined to provide a higher
level of abstraction.
Many real-time systems are process control systems operating as closed or open loop systems
(with and without feedback respectively). Typical examples are used for the display of sensor data
and control of actuators within a flight control autopilot. Sinha [30] provides a simple description of
process control systems which contain a mixture of periodic and event driven processing, with

Thesis Distributed real-time systems
Michael Giddings Page 41 of 277 12/10/2016
events occurring much less frequently than individual periodic processing steps. The functional
model proposed uses this structure to represent system components as abstractions.
Distributed real-time process control systems are real-time systems which tend to have co-located
independent linked system components.
Distributed real-time systems can also be described as cyber-physical systems (a system of
collaborating computational elements controlling physical entities). Lee [17] describes the design
challenges associated with cyber-physical systems as systems containing collaborating computation
elements which control real-world actions. He indicates that it will not be sufficient to improve
design processes, raise the level of abstraction or verify (formally or otherwise) designs based on
current abstractions. He says these abstractions will have to embrace hardware systems and
computation in a unified way. The proposed additional functional model described in Chapter 3
combines software and hardware aspects of the systems considered. Rajkumar et al. [18] describe
cyber physical systems as physical and engineered systems whose operations are monitored,
coordinated, controlled and integrated by a computing and communication core. He states that
they must operate dependably, safely, securely and efficiently in real-time. Lashermanan et al. [19]
state that both the supplier and the integrator need new system science which enables reliable and
cost-effective integration of independently developed system components.
In addition to functional requirements, non-functional requirements are also needed to describe
the desired operation of real-time software systems. Non-functional requirements include
performance requirements. Performance requirements are varied and depend on the particular
system to which they refer. Other non-functional requirements which affect real-time systems
include mission criticality, safety criticality, redundancy and failure. The proposed additional system
model specifies these requirements as they contribute to the complexity of individual system
components.

Thesis Distributed real-time systems
Michael Giddings Page 42 of 277 12/10/2016
2.1.3 Design routes
It is important to take into account the system design route, as it might affect the available
performance assessment opportunities. Design routes include the waterfall method, prototyping,
incremental, spiral and rapid application development. The incremental and spiral methods are a
combination of linear and iterative approaches. In practice all those approached have to deal with
error rectification and change. CMS [34] describe the advantages and disadvantages of each
approach.
All these design routes consist of five major phases to some degree or other:
• Requirements definition
• Design
• Development
• Implementation
• Deployment
Prototyping and phasing approaches are commonly used. Prototyping is normally reserved for
smaller systems or components of larger systems. Larger real-time systems are sometimes
developed in phases consisting of a number of versions of the final system with increasing
complexity.
2.1.4 Stakeholders in the process
The difficulty in developing large real-time systems is compounded by the multiple stakeholders
being involved in their development, potentially located in different teams, companies and
countries. It is important to understand how these stakeholders combine to develop systems. This
Thesis Distributed real-time systems
Michael Giddings Page 43 of 277 12/10/2016
section describes the major development stakeholders involved and highlights how the problems
associated with the stakeholders manifest themselves.
Ramos et al. [35] state that collaborative world teams must speak the same language and work on
the same ‘matter’. The ‘matter’ being the system model and its communication mechanisms in
terms of a model based engineering approach to systems design. In order to understand the
communications needs you must first identify the stakeholder affected.
Large distributed real-time process control systems developed by multiple stakeholders typically
have similar hierarchical development responsibility structures. The key stakeholders typically
include a customer, domain experts, system design authority, component design authorities and
component manufacturers.
If these stakeholders are located in different teams, companies or countries the communication
between stakeholders begins to affect the consistency of the overall system design. McManus [36]
suggests that the successful delivery of software engineering projects is directly related to the way
in which the project manager involves stakeholders in the decision making process within the
various stages of the project.
2.1.4.1 The customer
The customer, supported by users, define top level system requirements. These usually take the
form of a textual list of the main characteristics of the overall system, sometimes called a concept
of operation, and a number of functional end events. It may contain a list of the main components
of the system. The customer may also supplement these top level requirements with another
textual document called an operational requirement describing how the system will be used.
Cellucci [37] describes the process of developing operational requirements. He describes good
requirements as necessary, verifiable, unambiguous, complete, consistent, traceable, concise and
expressed using standard constructs.
Thesis Distributed real-time systems
Michael Giddings Page 44 of 277 12/10/2016
The customer’s main point of contact, in general, is with the system design authority. They
sometimes have links with the component design authorities for large bespoke system components
with long development times.
2.1.4.2 The System Design Authority
The system design authority’s main points of contact are the customer, and the subsystem and
component design authorities. The system design authority fulfils two key functions; performing
the detailed elaboration of requirements and the system level design. The research focuses on the
activities of the system design authority during the early stages of the system development prior to
the generation of component requirement specifications.
The elaboration phase is a requirements definition activity as it extends the outline customer
requirements into a full system requirements specification. The detailed system requirements
specification is then agreed with the customer. Traceability is established between the customer
outline requirements and the detailed requirements specification and recorded in a database. New
requirements included in the detailed requirements specification are identified and added to the
traceability database. A key feature of these detailed requirements is a list of system end events
and associated performance requirements. Domain experts and end users undertake the
requirements elaboration rather than system developers, so an intuitive requirements specification
methodology is required.
The system design authority transforms the detailed system requirements into a system design.
System hardware components and inter-component communication links are identified and the
functionality and system end events are shared between the components. Each component is
given its own component end events and end event performance requirements. Bonjour et al. [27]
describe a method for allocating functions to hardware architectures by considering interconnection
matrices. They identify functional elements and map them to system components. They focus on
the synthesis of subsystems and components from identified functional elements but does not

Thesis Distributed real-time systems
Michael Giddings Page 45 of 277 12/10/2016
consider performance. Lakshmanan et al. [33] suggest that abstractions for system components
can be used in this allocation process. Without a detailed design for each system component,
however, it is difficult to be sure that the system architecture can support all the identified system
end event performance requirements. Bonjour et al. [27] describe how system architects validate
the selection by inspection but an automatic validation may help with some end events which are
distributed across several components.
The system design phase is a design phase rather than a requirements elicitation phase, as it
constrains the system requirements. Traceability ensures that all the system requirements are
satisfied within the system design. As the design process adds extra requirements, (known as
derived requirements) they are added to the design requirements traceability definition.
The system design process incorporates information from the contract specifications and interface
control documents of selected COTS components and generates contract specifications and
interface control documents for non-COTS components. The system design authority appoints
subsystem and component design authorities. The normal interface between subsystem and
component design authorities is based on a component specification which describes the operation
of the component and an interface control document which describes its external interface.
Rahmani et al. [38] discuss the importance of interface control documents.
These contact specifications and interface control documents are used on a commercial basis as a
contract between the system design authority and the component design authority. Changing
these documents after the contract has been agreed usually incurs costs.
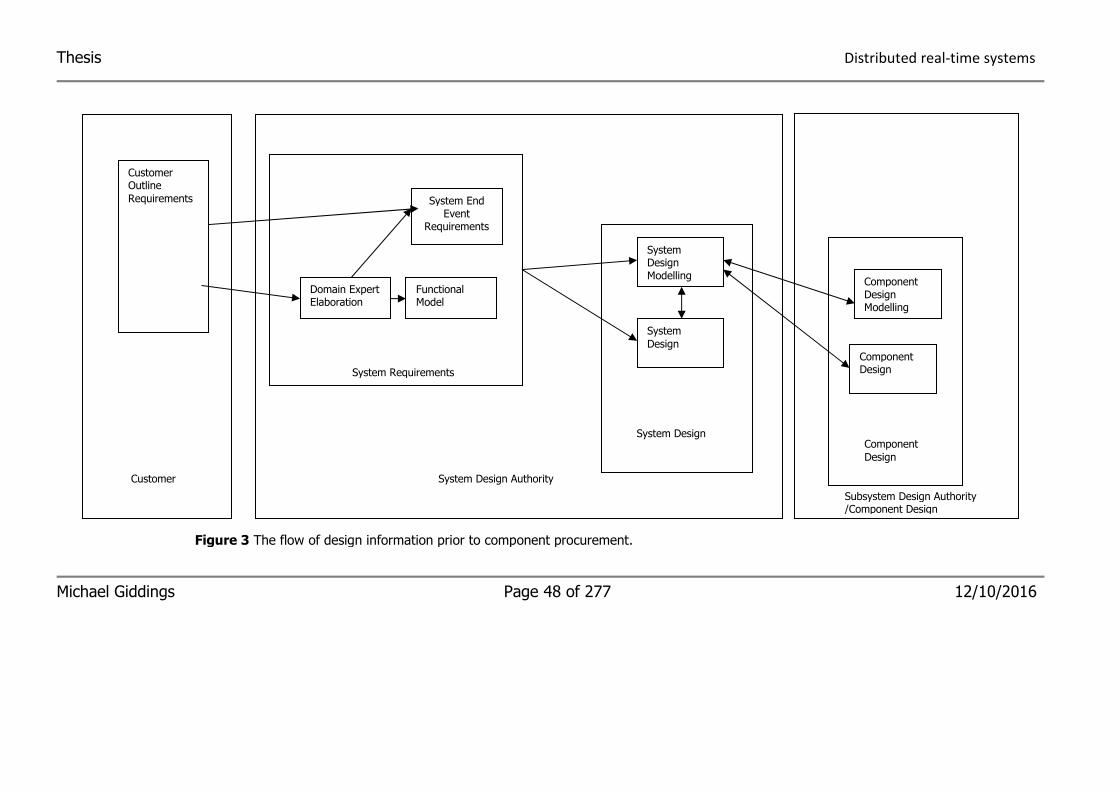
Figure 3 shows the flow of information between the system and component design authorities
after the component design has started and is the context of the research reported in this thesis.
The system design authority receives details of the hardware and software design of system
components from the component design authorities as they progress. It uses this information
either to update early system models and/or to develop a more complex description of the system
Thesis Distributed real-time systems
Michael Giddings Page 46 of 277 12/10/2016
design. Three types of information need to be compared: the elaborated system requirements, the
system design, and the component design.
The system design authority is also responsible for system integration, validation and deployment
of the final system once the component design and implementation are complete. System design
functional and performance shortcomings may be discovered here when it is most expensive to
rectify.
2.1 4.3 The Subsystem Design Authorities
The subsystem design authorities are responsible for the management of the requirements, design
and manufacture of a group of components for a subset of the system under development and act
as intermediaries between the overall system design authority and the system component design
authorities. They take their requirements from the component specifications generated by the
systems design authority.
They may be responsible for the integration testing of a subset of the overall system but they are
not directly responsible for overall system performance. The subsystem design authority may add
extra detail to the system level component specifications. The subsystem design authority
manages the component manufacturing organisations and are not usually the same team as the
system design authority.
2.1.4.4 The Component Design Authorities
The component design authorities are appointed by the system design authority to undertake the
detailed design and manufacture of each component. Each component is specified in a contract
specification and interface control document, and will have no knowledge of, or be concerned with
Thesis Distributed real-time systems
Michael Giddings Page 47 of 277 12/10/2016
the integration of the system being developed. As part of their activities they may need to
generate sub components specification and interface control documents to procure them.
2.1.5 Types of performance problem
The performance of a system can be defined as the way the system meets its requirements. In
real-time systems we need to focus on functional requirements which have some temporal issue.
The most common of these are requirements which require a response within a specific time. This
research focuses on stochastic errors and the effects system delays. Stochastic errors are errors
caused by sensor noise and the effects of data quantisation. System delays are either the time
taken for the system to respond to an event or data transiting the system arriving late.
2.1.6 Performance errors
Bondi [39] claims performance requirements are one of the main drivers for architectural decisions.
He states that poor software performance is a principal cause of software risk and that many
performance problems have their root in architectural decisions. He says that poor computer
system performance has been named the single most frequent cause of the failure of all software
projects.
Thesis Distributed real-time systems
Michael Giddings Page 48 of 277 12/10/2016
Figure 3 The flow of design information prior to component procurement.
System DesignSystem Design
System RequirementsSystem Requirements
Customer Outline
Requirements
Domain Expert Elaboration
Functional Model
System End Event
Requirements
System Design
System Design Modelling
System
Design
Component
Design
Component Design Modelling
Component Design
System Design Authority Customer
Subsystem Design Authority /Component Design
System Requirements

Thesis Distributed real-time systems
Michael Giddings Page 49 of 277 12/10/2016
It is important to understand how the performance errors affect the operation of real-time
systems. There are four main types of error that occur in real-time systems:
• Static errors
Static errors occur as fixed offsets. They are caused by misalignments in sensors and can be
easily removed by mechanical sensor re-alignment or digital bias.
• Stochastic errors
Stochastic errors are caused by noisy sensors and quantisation errors and can only be removed
by changing the design of individual components or how data is recorded in the software
design. Vignes [40] describes an arithmetic method that can be used to calculate
computational stochastic errors. The methods are complex and generally only apply to
implementation code.
• Delays
Delays occur when a system changes from one system mode to another. Typically these
manifest themselves as the time to respond to a system or user command. If a number of
different components are involved these are difficult to calculate, and modelling or
measurement is required.
• Dynamic errors
Dynamic errors cause an end event display to lag in real-time due to the time taken for a
system to process information. These errors occur as information is processed on a periodic
basis. Tipsuwan et al. [41] describe the effects of delays in control systems.
• Other errors
Other errors can occur as a result of design errors, intermittent sensor failures, communication
system and CPU overload and component failures. Such errors are managed by including extra
functionality within the design to manage abnormal operation and failure modes.
Thesis Distributed real-time systems
Michael Giddings Page 50 of 277 12/10/2016
Communication system and CPU overload can occur when a system design incorrectly
estimates the capacity required. For example, in avionic systems the navigation system is
designed to degrade gracefully as sensors become unavailable. A system failure mode analysis
may be undertaken to analyse system failures – this is associated with Mission Criticality
Analysis (MCA). Extra system functions and hardware duplication are added to the system to
provide reversionary operation in the event of a failure.
All the above errors can be illustrated using an example of a radar driven optical telescope as
shown in figure 4. The end event considered is the ability of the RADAR-telescope system to point
the cross wires of the optical telescope in the direction of a target detected by the RADAR. The
performance requirement might be that the target remains visible within the telescope’s field of
view for targets with less than a specific angular crossing rate.
For example the end event functional requirement might be:
“An optical telescope with a two degree field of view shall be pointed at an airborne target
identified by a RADAR”
The performance requirement would be specified by either customer or the system design
authority’s domain experts based on system requirements model for example:
The target has a maximum crossing rate of ten degrees per second and the target must be
kept permanently in view.
Static errors can be caused by a static offset between the observed target and the telescope cross
wires. This error results from equipment misalignment and is fixed by either a mechanical or
software alignment adjustment.

Thesis Distributed real-time systems
Michael Giddings Page 51 of 277 12/10/2016
Stochastic errors can be made up of varying errors caused by sensor noise, calculation,
quantisation errors, scheduling and queues. Ignoring the effects of the telescope mass and
steering mechanical control system of the telescope results in the target appearing to move
randomly with relation to the telescope cross wires.
Delays are caused by the system changing from one mode to another. An example occurs when
the RADAR is reallocated to another target. The system response time is the time taken for the
telescope to align to the new target. This time delay is likely to be further compromised by
mechanical effects in the telescope control system.
Dynamic errors are caused by the time taken to process sensor information and are proportional to
the rate of change of the sensor data. This error causes an offset between the target and the
telescope cross wires. The larger the angular rate of the target the greater the offset. If the target
angular rate is zero, the offset is zero. If the target angular rate is large, then the target will move
outside the field of view of the telescope. Dynamic errors occur in closed and open loop systems.
Target
Optical Telescope
RADAR Software control of optical telescope
Figure 4 A RADAR controlled Optical Telescope
Thesis Distributed real-time systems
Michael Giddings Page 52 of 277 12/10/2016
In closed loop systems, delays in the forward and feedback loops can have a dramatic effect on
the performance of the overall control system. Sinha [30] describes how the behaviour of open
and closed loop digital control systems can be calculated. The calculation becomes much more
difficult if multiple components with independent clocks are involved as the time delays are no
longer consistent. Measurement during integration is the most reliable method for system
characterisation, but is also the most expensive to rectify as it is detected late in the system
development. Modelling early in the design process, component abstractions may identify
performance issues when they are cheaper to rectify.
2.1.7 System development failures
The system development process cannot avoid mistakes and omissions. They all cost money to
rectify. The further into the development and the more development phases that are involved the
more expensive they are to rectify. The cost of these activities are covered by a contingency
budget set at the beginning of the system development. Details of how much the contingency
budget is and how it is spent is rarely revealed. There are some systems where the development
failure issues have been published. Finklestein et al, [42] discuss the London Ambulance Service
and Grettke et al, [43] discuss the Patriot Missile System.
2.2 Modelling real-time systems
Modelling is used in real-time systems in all phases of their development. The purposes of each
model and the results obtained are diverse. Great care must be taken to understand the limitations
of each model and the results obtained. The models are only useful when the correct information
is available to populate them.

Thesis Distributed real-time systems
Michael Giddings Page 53 of 277 12/10/2016
2.2.1 Modelling opportunities
The main modelling opportunities used to describe the function and performance of real-time
systems are:
• Real-world models
Real-world models describe systems in the real-world and are used to characterise the
system requirements. These models say how a system should operate, not how the
implementation of that system will work.
• System functional models
Models the operation of systems against real-world requirements. The models consist
of abstractions representing the hardware and software.
• System performance models
Extends system functional models to examine the performance of a system using real-
world inputs.
• System level component functional models
Models a single component using inputs derived from a system model.
• System level component performance models
Extends component functional models to examine the performance of a component
using inputs derived from a system model.
Thesis Distributed real-time systems
Michael Giddings Page 54 of 277 12/10/2016
• Component abstractions
A model representing a component derived from a components functional
specification and interface control document without specifying how that component
will be implemented.
• Component functional models
Functional models of a hardware component based on the hardware and if present,
component software design.
• Component performance models
Functional models to examine the performance of a component based on the
hardware and if present, component software design.
During the early system design phase component design information does not exist so the only
models available are real-world models, system functional models based on component
abstractions and system performance models based on component abstractions.
2.2.2 Abstraction in modelling
For this research, an abstraction is defined as a representation of a hardware system component of
a distributed real-time system. The abstraction describes the operation of the component in terms
of its external interfaces. The external data interfaces reflect the system implementation.
Perathoner et al [44] emphasise the need for early performance analysis in real-time systems.
They promote the use of abstractions to represent components and their approach deals with the
design of system components rather than the early system designs.
The idea of using abstractions has been extended to represent system components in the
functional model proposed in Chapter 3 where they describe the function and performance of the

Thesis Distributed real-time systems
Michael Giddings Page 55 of 277 12/10/2016
component independently of how that component is designed. The abstraction needs to have the
following characteristics
• Capable of describing all types of system components that contain and do not contain
software.
• Describe the operation of the component in terms of its external interface in sufficient
detail to generate its component requirements specification.
• Identify the component external interfaces in sufficient detail to generate its component
interface control document.
• Capable of being associated with other component's abstracts so that the whole system
can be analysed.
• Simple enough for system design authority domain experts to understand.
• In sufficient detail to assess the performance in terms of its external interfaces.
Animation
Animation of software systems can be used as a means of analysing software. Li et al, [45]
illustrate how formal specifications are used based on the software for a bank ATM system. This
approach can be extended to enable performance assessment of system models that take into
account a mixture of hardware and software performance requirements represented as component
abstractions.
Thesis Distributed real-time systems
Michael Giddings Page 56 of 277 12/10/2016
Currently most system performance management activities occur during the component design
phase after the component design authorities are appointed.
Ammar et al. [46] suggest that performance often does not become an issue until software
implementation and integration. They emphasise the need to undertake performance evaluation to
compare different design alternatives and detect performance short comings. They say that it is
performance that is a key criterion that makes software developers able to select the system that
best fits the requirements and achieve longer design stability.
Babamir et al. [47] discuss architecture, scheduling and application of distributed real-time
systems. They address a wide variety of issues including mode changes, schedulability and time
tags whilst considering client server systems and queues. The systems considered in this research
use periodic processing to satisfy system end events with mode changes. This book stresses
architecture, scheduling, specification and verification in real-world applications of real-time
systems. In particular it includes a cross-fertilization of ideas and concepts between the academic
and industrial worlds. It is for this reason that the context and users of any model must be taken
into account in its development.
2.2.3 Measurement
The aim of the research described in this thesis is to find ways of discovering performance failures
prior to being discovered during system integration and deployment. Measurement is the most
reliable method of determining system and component performance but is only available during
the later phases of development. Sometimes it is not possible to measure performance and
modelling has to be used instead.

Thesis Distributed real-time systems
Michael Giddings Page 57 of 277 12/10/2016
2.2.4 Calculation
The calculation of performance from early system functional and performance models is possible
but becomes much more complex as the size of the system increases.
2.2.4.1 Manual calculation
Performance can be calculated manually for simple systems. For large complex systems manual
performance becomes too complex. Chapter 3 describes how the calculation of dynamic errors can
be undertaken. The results of this calculation are minimum and maximum system delays.
2.2.4.2 Formal methods
Formal methods are a mathematically based set of tools for the specification and analysis in the
development of software and hardware systems. Hinchey et al. [48] state that formal methods are
difficult to apply and require significant mathematical experience. Pfleeger et al. [49] investigate
the use of formal methods to develop an air-traffic control system. They say that the benefits of its
use were not conclusive. Bowen et al. [50] say that the use of formal methods is not as
widespread as expected.
Formal methods define notations, which can be used to express models, just as UML is a modelling
notation. The difference is that the notations of formal methods have mathematically rigorous
semantics.
Clarke et al. [51] describe how mathematically based languages are used to help construct
complex systems. They identify the need for formal methods specialists to be used. Whilst formal
methods may be used to specify system component abstractions, a simpler approach would be
more appropriate. Kreiker et al. [52] describe how formal methods are used to describe modelling

Thesis Distributed real-time systems
Michael Giddings Page 58 of 277 12/10/2016
analysis and verification during the design stages. They identify the difference in expected skills
between researchers and industrial users. They report that whilst formal methods have often been
dismissed by many – a rather abstract research with little chance for industrial adoption – decades
of research, both basic research and tool development have started to bear fruits, attracting an
increasing level of industrial interest. This interest is often accompanied by unrealistic expectations,
but, however, still provides an opportunity and challenge to researchers working in this area, as
more basic research and good engineering tools are needed to solve the challenges.
The formal methods most often proposed for the specification and design of real-time systems
include process algebras. These are mathematically rigorous languages which can represent
concurrent communicating processes in an algebraic form. Examples include Communicating
Sequential Processes developed by Hoare [53], Milner's Calculus of Communicating Systems [54]
and Bergstra's et al’s Algebra of Communicating Processes with Abstraction [55]. They all include a
number of operators which can be applied to processes, for example, '+' represents choice and '.'
represents sequential composition. Process algebras can describe how processes relate to each
other, but their use in the early specification of requirements for complex distributed systems is
limited, since abstractions of system components (processing and non-processing) and inter-
component communications used in the additional model investigated do not contain concurrent
processes.
Domain experts, system designers and system architects support the early stages of system design
operating in a combined team. They are unlikely to have the skills to use formal method based
tools to communicate with each other. They need an easily understandable, graphics based, model
to assess the functionality and performance of the system design.
Thesis Distributed real-time systems
Michael Giddings Page 59 of 277 12/10/2016
2.2.4.3 Petri nets
Petri nets are a specific formal method that have been addressed separately as they offer the
possibility of an alternative to the method proposed in Chapter 3.
Peterson [56] describes the basics of Petri nets. Petri nets have been introduced to show the
transitions between software states within software. Timings between these states can be used to
analyse performance. Petri nets are an abstract formal model of information flow.
Bicchiera et al. [57] use an industrial case study to describe the translation between MARTE and
timed Petri nets in a MIL STD-498 [58] based project. The analysis process is used within the
software design of a specific component. He describes how UML-MARTE is used in conjunction with
timed Petri nets in a V diagram for a real-time system. He concludes that the approach proves
practical feasibility in the industrial applicability of formal methods and practices. The V diagram
described reveals that the proposed approach is not available until after component design has
started.
Petri nets can be used to describe requirements and design for both system and component level
operation. They can be annotated with timing information. They are particularly useful for
describing systems which undertake a complex sequencial or concurrent actions. Typical situations
that can be modelled by Petri nets are synchronization, sequentiality, concurrency and conflict.
Petri nets particularly suited to represent, in natural way, logical interactions among parts or
activities in a system.
A Petri net (place/transition net or P/T net) offers a graphical representation of a mathematical
representation of a group of processes which includes choice, iteration and concurrent operation.
They are similar to state transition diagrams and describe the behaviour of systems. Petri nets

Thesis Distributed real-time systems
Michael Giddings Page 60 of 277 12/10/2016
consist of places (possible states), transitions (events or actions) and arcs (links places and
transitions).
Staines [59] describes formal methods, such as process algebras, stating that they are not
commonly understood and that Petri nets are a good alternative. Petri nets are a graphical
representation of formal methods. Staines writes that good Petri net simulation tools are available
to describe real-time systems in fine detail and analyse them which cannot be easily achieved by
many other techniques. A complete timed Petri net diagram is shown in figure 5 describing an
ATM controller and card authorisation. Even for a relatively simple ATM system the diagram is
difficult to understand for domain experts. He describes animating this Petri net to achieve a
number of runs which indicate likely performance. The timing aspects of the system are based on
either constant time delays or a timing delay somewhere between a minimum and maximum delay.
The Petri net requires a detailed knowledge of the internal working of the components contained in
the system. This information is only available after the design of the system components have
started.
Petri nets describe systems in terms of transitions between states. They are not so good at
describing the links between independent functional elements as they require rework every time
the order that the places and transitions change.
Another problem with Petri nets is that the translation between requirements based Petri nets and
design based Petri nets is not possible. This is because requirements based Petri nets relate to
changes in the user domain and design related Petri nets deal with changes in the system
software.
Performance analysis of timed Petri nets is based on adding up the maximum and minimum delays
within the system giving minimum and maximum errors respectively in a system end event. Overall
maximum and minimum delays are obtained by adding individual transition minimum and
Thesis Distributed real-time systems
Michael Giddings Page 61 of 277 12/10/2016
maximum delays respectively. This approach is similar to critical path analysis which analyses tasks
and identifies the string of tasks (the critical path) which most impact the projects timescales.
Carnevali et al. [60] describe how pre-emptive time Petri nets (pTPNs) can be used within the
software design life cycle. pTPNs support modelling and analysis of concurrent systems running
under fixed priority pre-emptive scheduling. He covers the software design of a specific component
and shows where the Petri nets are used within the development process using a V diagram.
Figure 6 shows these activities (highlighted grey) and is extended to include the use of Petri nets
in the user domain.
Ameedeen et al. [61] compare the ease of use of UML compared with Petri nets and suggest that a
Model Driven Development based automatic translation between UML and Petri nets might
overcome some of the difficulties in their use. They suggest that any new model should consider
automatic translation between UML and Petri nets as a feature.
Bushehrian et al. [62] examine the translation between UML and finite state process model for
early performance analysis. They describe a case study considering a web based electronic bill
payment system breaking down the process into nodes and requests. Average response times are
derived from multiple test runs. The method described deals with queues rather than stochastic
and dynamic errors. The idea of determining performance from multiple simulation runs is,
however, applicable to the use of the animator proposed in this research investigation. Athamena
et al. [63] extends this translation to consider behavioural models and simulation. They use Petri
nets for automatic behavioural testing and review different application requirements to consider
periodic and aperiodic processes, static and dynamic schedulers and methods to calculate code
execution times. The method assumes that the design of system components is available which
makes it inappropriate for the early system design phase before the component design authorities
have been appointed.
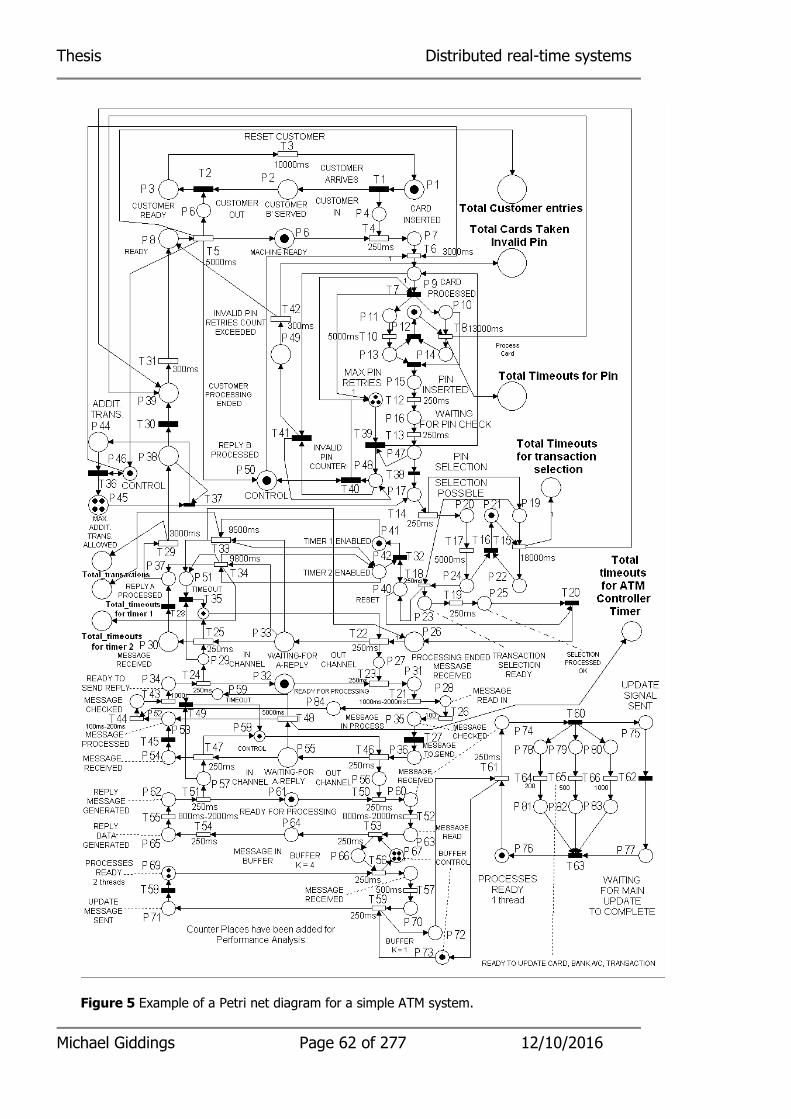
Thesis Distributed real-time systems
Michael Giddings Page 62 of 277 12/10/2016
Figure 5 Example of a Petri net diagram for a simple ATM system.

Thesis Distributed real-time systems
Michael Giddings Page 63 of 277 12/10/2016
Figure 6 V diagram showing where time Petri nets were used (highlighted grey).
2.2.4.4 Statistical methods
Statistical methods can be used to collect, summarize, analyse and interpret numerical data that
cannot use determinist methods. Vignes [40] describes an arithmetic method that can be used to
calculate computational stochastic errors. The use of statistical methods have been assessed as
follows:
System requirements analysis
System Design
SW/HW Requirements analysis
Preliminary Software Design
Detailed Software Design
System Integration
Deployment
Software Integration
System Level
System Level
Unit Level
SW Component Level
SW Module Level
Software
Implementation
Unit testing

Thesis Distributed real-time systems
Michael Giddings Page 64 of 277 12/10/2016
• As an alternative to the maximum and minimum calculation of dynamics errors in functional
chains in linked component abstractions described in Chapter 3 between components with
unsynchronised schedulers.
• As a means of calculating stochastic errors caused by data quantisation in and between
component abstractions.
• Assessing the effects of sensor noise.
• Collection of statistical data from the animator described in Chapter 3.
Chapter 3 concludes that although a mathematical statistical approach is possible for simple
functional chains it becomes too complex for multi-component multi-branch functional chains.
2.2.5 Functional models
Functional models are defined as a structured representation of a system in terms of activities,
actions, processes and operations. There are many types of functional model diagrams including
function block diagrams [64] and function flow block diagrams [65].
The description of software and hardware systems using functional models has been used for
many years. Rumburgh et al. [66] describe the principals involved. They also show how component
functional descriptions can be decomposed to show detailed functional elements. This approach
forms the backbone of the proposed new model described in this thesis. Functional model block
diagrams need to be extended to include software and hardware aspects and interfaces. The
diagrams used need to be precisely defined and supported by process and data definitions stored
within a database. The function model needs to define hardware components as abstractions as
the components design does not exist at this stage of the system development.
Thesis Distributed real-time systems
Michael Giddings Page 65 of 277 12/10/2016
2.2.6 Functional elements
A system functional element can be defined as the overall system functional requirement
decomposed into small independent parts capable of independent operation.
2.3 Approaches to performance management
2.3.1 Fix-it-later
It is necessary to investigate how current systems are developed to understand how any new
approach might benefit the early development stages of system design.
Smith [11] states that systems are developed on a 'fix-it-later' basis. She states that this approach
continues [67]. Whilst one might be initially alarmed by this statement, system development by
human beings has been undertaken on the basis that mistakes of one sort or another will be
made, discovered and corrected. Large contingency sums have been earmarked for this process.
Many errors are soon detected and corrected but some persist until system integration and
deployment.
A 'fix-it-later' approach develops the system with as much care as possible and if it does not work
in the way required then it is reworked until it does. The problem with this approach is that the
rework process becomes prohibitively expensive as the complexity of the system increases.
Balsamo et al. [22] also mention traditional software development based on a 'fix-it-later' basis and
identify a growing interest in early software performance predictive analysis.
Sanchez et al, [68] state that the use of trial and error methods in embedded system development,
however, remains at 25%. If the system under development is similar to a previously developed

Thesis Distributed real-time systems
Michael Giddings Page 66 of 277 12/10/2016
system then the likelihood of a design failure is reduced. As software systems became more
sophisticated, it has become necessary to manage performance issues as early as possible to avoid
the cost impact of late detected performance failures.
The research question does not say that systems cannot be developed in an error based way; it
asks whether there is any way un-satisfied performance requirements can be detected early in the
system development.
2.4 Components
2.4.1 Types of components
For this research, system components are defined as physical pieces of hardware purchased from a
single supplier. Communication links may be included within system components but are
considered as separate components for modelling purposes.
Real-time systems consist of some of the following components:
Sensors
Actuators
Displays
Communication links
General purpose computers
Special purpose processing components
The components of real-time systems comprise two basic types. Commercial off the shelf (COTS)
equipment which already exist and bespoke components which need to be developed specially for
the system.

Thesis Distributed real-time systems
Michael Giddings Page 67 of 277 12/10/2016
2.4.2 Hardware architectures
Prior to the generation of component requirements, collaboration diagrams can be used to identify
links between individual system components. An example of a collaboration diagram being used for
this purpose is shown in figure 7. These diagrams can be extended to show the inter-component
communication. An example of this representation is shown in figure 8. The diagram identifies all
the system components together with all the inter-component interfaces. Inter-component
interface should be accompanied with a detailed specification. All interfaces between the system
and its external environment should be shown. Each system end event should be identified.
Hardware components should be associated with an abstraction representing its functional and
non-functional characteristics.
Figure 7 Collaboration diagram.
Anderson et al. [69] describe the use of UML/SysML at Saab Aerosystems for UAV systems. They
show available diagrams split into structural (physical view) and behavioural diagrams (deployment
view) that differ from the OMG SysML. Model performance assessment was not addressed in any
way or combined functional and hardware architecture model proposed. They do however
recommend that SysML is extended to support representation (and the actual configuration) of a
realised system along with the capability to associate verification results.
Component
Component Component
Component

Thesis Distributed real-time systems
Michael Giddings Page 68 of 277 12/10/2016
Figure 8 Information required for an initial system level system diagram.
2.4.3 Interconnection between system components
During the early system design phase the interconnection arrangements between components
must be selected and specified in the system components contract specifications and Interface
Control Documents. Without some form of capacity analysis there is a risk that communication
links will need to be replaced. If this rework is not identified until integration and deployment then
the costs involved will be large. Interconnection between components use four types of
communication: data buses (for example Mil-std 1553 data bus) [70], Direct Data Links (DDLs) (eg
RS232 and RS485) Analogue links and Discrete IO interfaces (Triggers). Shafy [71] describes the
use of discrete IO interfaces in control systems. Many systems convert discrete interfaces into
system flags for use within software processes. Component interconnections affect system
performance and must be included in any performance assessment undertaken.
Component
Component Component
Component External Interface
External
Interface
Internal Interface
Internal Interface
Internal Interface
Internal
Interface
End
Event
End Event
External Interface
External Interface

Thesis Distributed real-time systems
Michael Giddings Page 69 of 277 12/10/2016
2.4.4 Software architectures
There are three main types of tasks in real-time system components. Biccheirai et al. [57] describe
these as the OMG UML MARTE extension class set model shown in figure 9 and listed below. Whilst
these tasks can be identified after the component design has started, a simpler representation is
required for a component abstraction before the component design exists. MARTE cannot describe
system components which do not contain any software.
Figure 9 A UML-MARTE class diagram of the task-set model. Bicchierai et al. [57].
1. One shot tasks: Event driven software moves from one state to another as a consequence
of an event. A vending machine is a good example of an event driven system.
2. Periodic Tasks: Periodic systems perform iterations of previously determined lists of
actions. These actions are executed in a repetitive way. The frequency and timing of each
repetition or iteration can be based on a fixed schedule or managed to satisfy accuracy
and timeliness requirements criteria. Most control systems are examples of periodic
processing systems.

Thesis Distributed real-time systems
Michael Giddings Page 70 of 277 12/10/2016
3. Aperiodic or sporadic tasks: Aperiodic or sporadic tasks do not have predetermined lists of
actions. They may, however, contain scheduled actions and managed resources.
Eidson et al [72] state that special measures may be incorporated to ensure that tasks are
undertaken at the right time and in the right order. It is too difficult to synchronise component
clocks located in different components. However, timing signals such as data bus time tags, may
be used but not with sufficient accuracy to synchronise component clocks. Wu [73] describes how
time tags can be used to detect system component failures as time tags are not updated if a
component fails.
Special measures are necessary to manage shared resources such as memory. This generally
involves using waits which introduces uncertainty in the performance that is delivered. An
implication of this is the need to avoid waits if at all possible as this introduces temporal
uncertainty. Zaitsev [74] describes special techniques which are included to avoid processing being
suspended waiting for a resource to become available – known as asynchronous operation.
The term Client/Server describes computing system composed of distinct logical parts: servers,
which provides information or services, and clients that request them. The client/server
characteristic describes the relationship of cooperating programs in an application.
Many systems use the client/server architecture if the system is accessed by multiple users at the
same time. The users will be connected to one or more servers, which provide simultaneous
access. These architectures are typical of business or enterprise systems and are generally not
real-time systems even though they do have timing constraints. There are however, some
examples of real-time systems that are client server systems. Franks et al. [75] give an example of
an Air Traffic Control (ATC) system comprising a client/server communication structure.
Thesis Distributed real-time systems
Michael Giddings Page 71 of 277 12/10/2016
Some systems use events to trigger processing as they transit from one mode to another. The
performance of the system as a result of a trigger is characterised by the time taken to make this
transition. For example, there will be a requirement for a vending machine to start serving a drink
within a specific time of completing the payment process. Many real-time systems operate in this
way with timing requirements that focus on reaction time.
The only architectural restriction on components in a distributed real-time system is that each
component must communicate in some way with at least one other component in the system.
2.5 Specifying real-time systems
Natural language was originally used for specifications but was found to be imprecise and
ambiguous. The information contained within these specifications was also difficult to access.
Whilst contract specification and interface control documents remain in textual form, system
specifications made up of abstractions for individual system components may be used to aid
clarity, precision and data hiding. To overcome the inflexibility of textual specifications, formal and
graphical methods are used to specify the functional behaviour of the system.
The format of a requirements or design specification varies enormously from project to project.
The specification contents are described using a language such as English or UML. A tool such as
Statemate [76], [77] or Rational Rose [78] enables the specification to be generated using a
language but does not specify what the specification should contain. Furia et al. [79] survey
various models and modelling languages used in the formal modelling and analysis of the temporal
features of computer based systems. They deal with time within different components, system
internal time and real-world time, and modelling time within abstractions. These are key
ingredients for using abstractions.
In the past many system design authorities used non object oriented graphical methods such as
CoRE [6] to define requirements in terms of processes and data. CoRE also operated as a design
Thesis Distributed real-time systems
Michael Giddings Page 72 of 277 12/10/2016
specification method associating these requirements with a system architecture. Although this is a
graphical method, much of the requirements definition is still textual. CoRE does, however, provide
a structured database representation of the complete design. This made CoRE a method and a
tool. Performance requirements were defined separately. Consistency between individual elements
of CoRE specifications can be automatically checked. Messaoudi [7] describes how the processes
were identified in CoRE specifications using viewpoints. One of the strengths of CoRE is that its
requirements specifications could be extended to form a design specification by adding
annotations, which specified the partitioning of system requirements to hardware architectural
components. It does this by using an up-arrow notation for each process, indicating the
component that supported it. The concept of extending requirements specifications to form a
system design specification rather than replacing the requirements specification with a new system
design specification, reduces translation errors. The introduction of object oriented representation
of requirements based on real-world entities provided other approaches such as state machines.
Their use suffers from the problem that they need component design information before
performance analysis can begin.
2.5.1 Requirements
Components are specified in terms of functional and non-functional requirements. Functional
requirements can be defined as a description of all the things a component will do. Non-functional
requirements describe the operation of a system, rather than specific functional behaviour. Chung
et al, [80] describes what non-functional requirements are.
Leveson et al. [81] use an example of an industrial aircraft anti collision avoidance system (TCAS
II) to discuss the importance of accurate requirements specifications. They describe requirements
specification languages in terms of state charts. The requirements specifications they describe are
hardware architecture independent and so cannot be used to verify the partitioning of functional
and non-functional requirements to individual system components. They can, however, be used to

Thesis Distributed real-time systems
Michael Giddings Page 73 of 277 12/10/2016
model the requirements. The requirements modelling can then be compared with the predicted
performance obtained during the system design process.
2.5.2 Component Contract Specifications
Component design authorities and suppliers are chosen by issuing a component contract
specification and asking potential organisations to bid for the contract. Most component contract
specifications are textual. These specifications are generated on a fix-it–later basis. Function and
performance present the biggest problem. This research examines ways that might be used to
identify errors and omissions during the early design stage prior to completing of the component
contract specifications.
2.5.3 Interface Control Documents
Interface control documents describe all the external component connections of a system.
Rahmani et al. [38] discuss the importance of interface control documents. They discuss the
ontology of interface control documents as an essential part of a component’s specification.
Interface control documents form part of the information pack sent to prospective system
component design authorities to enable them to bid for the role of component design authority.
2.5.4 Software specification
Software may be used in two ways. Firstly the component may be a general purpose computer
which contains software designed by the system design authority and impacts the functional
behaviour of the system beyond the component that contains it. Secondly the component may
contain software which entirely relates to the operation of that component. This software is
developed by the component design authority rather than the system design authority.

Thesis Distributed real-time systems
Michael Giddings Page 74 of 277 12/10/2016
This research proposes that software is represented by an abstraction which specifies its function
and performance.
2.6 Universal Modelling Language (UML) and real-time systems
UML is commonly used as a graphical modelling language for describing systems. Extensions to
UML provide extra capabilities for specific purposes. Three common extensions, MARTE, SySML
and SimML are described below. The additional model proposed in Chapter 3 could be defined as
a new UML extension.
2.6.1 UML
UML was introduced in the 1990s to provide an object oriented graphical design language. UML
was developed in the 1990s by Grady Booch and Jim Rumbaugh at Rational Software [82]. In 1997
it was adopted by the Object Management Group [8] and became accepted by the international
Organisation for Standardisation (ISO) as an industry standard method for system specification.
UML uses the Object Oriented approach to requirements and design specifications for the artefacts
that specify the functional requirements and design of a system.
Björkander et al. [83] describe architecting systems using UML. They do not describe a method for
dealing with the architecture of components that affect the system performance. Selec [84]
describes the semantic foundations of UML. As UML has been universally accepted any new system
design methodology should ideally either use UML or be defined as an extension to UML. The
functional model proposed in this research can be expressed as an extension to UML.
Unlike CoRE, UML is a graphical design language (notation) and does not operate as a design
method. This means that its application will vary from project to project, defined in advance in the
project Engineering/Quality Plan. Various tools such as Statemate [76], [77] and Rational Rose
[78] enable UML to be applied to systems development.

Thesis Distributed real-time systems
Michael Giddings Page 75 of 277 12/10/2016
There are many techniques used to specify the characteristics of the system during its
development. All the specification methods need to consider the following qualities:
• Unambiguity
• Precision
• Data hiding
• Encapsulation
• Without duplication
Berkenkotter [85] considers the benefits of UML 2.0 over previous versions. He said that in spite of
the improvements made, UML is still overloaded with elements and diagrams whose usability is
dubious. He considers that in the real-time domain this is a disadvantage.
Anda et al. [86] report on a case study of a company updating a large safety critical system. They
report on the extent to which UML was used, identifying benefits and difficulties. Three main
problem areas were identified: choosing the right diagram for a specific situation, the interfaces
between models and level of detail required.
There are no definitive rules about how UML may be deployed during the development of a
system. The Project Engineering/Quality Control Plan defines the standards and styles which are
used within a specific project.
Sanchez et al. [68] has shown that the actual adoption of the Unified Modelling Language (UML) in
software systems development remains low at 16% with no expected upturn. This re-enforces the
need to make any additional performance assessment method to be simple and easy to use. Petre
[87] also reviews the use of UML in industry and confirms that its use is not universal.
Thesis Distributed real-time systems
Michael Giddings Page 76 of 277 12/10/2016
UML diagram consistency checks are not part of UML – they may be offered by separate tools that
use UML. There is no expectation that a requirements/design should fully populate a complete set
of all possible diagrams.
UML can be used to encapsulate elaborations to the component requirements specification
generated by the system design authority. These are the same diagrams which are used by the
system design authority to elaborate the customer requirements and define the system design.
This may be undertaken even though the translation between the system requirements and the
component requirements is initially not perfect.
Extensions to UML have been defined for specific purposes. Examples of these are MARTE for real-
time systems [17], SysML [16] for system design and SimML for simulation [88]. Further
extensions can be defined as required. These extensions may introduce extra diagrams. Berenbach
et al. [89] describe extensions to UML that might be used for model driven requirements
elicitation. He identifies problems associated with existing modelling languages in four customer
based examples. He identifies Universal Requirements Modelling Language (URML) as an extension
that addresses some of the concerns identified. There is, however, no mention of performance
assessment made.
2.6.2 Modelling and Analysis of Real-Time and Embedded systems (MARTE)
Modelling and Analysis of Real-Time and Embedded systems (MARTE) is an extension to UML to
specify the real-time aspects of system components. Although MARTE usually applies to the
specification of the actual detailed design of real-time components, it does help in the construction
of the additional model proposed in Chapter 3.
Figure 9 shows the software tasks that MARTE is capable of addressing when modelling software
in components as described by Biccchierai et al. [57]. This level of detail is not available prior to
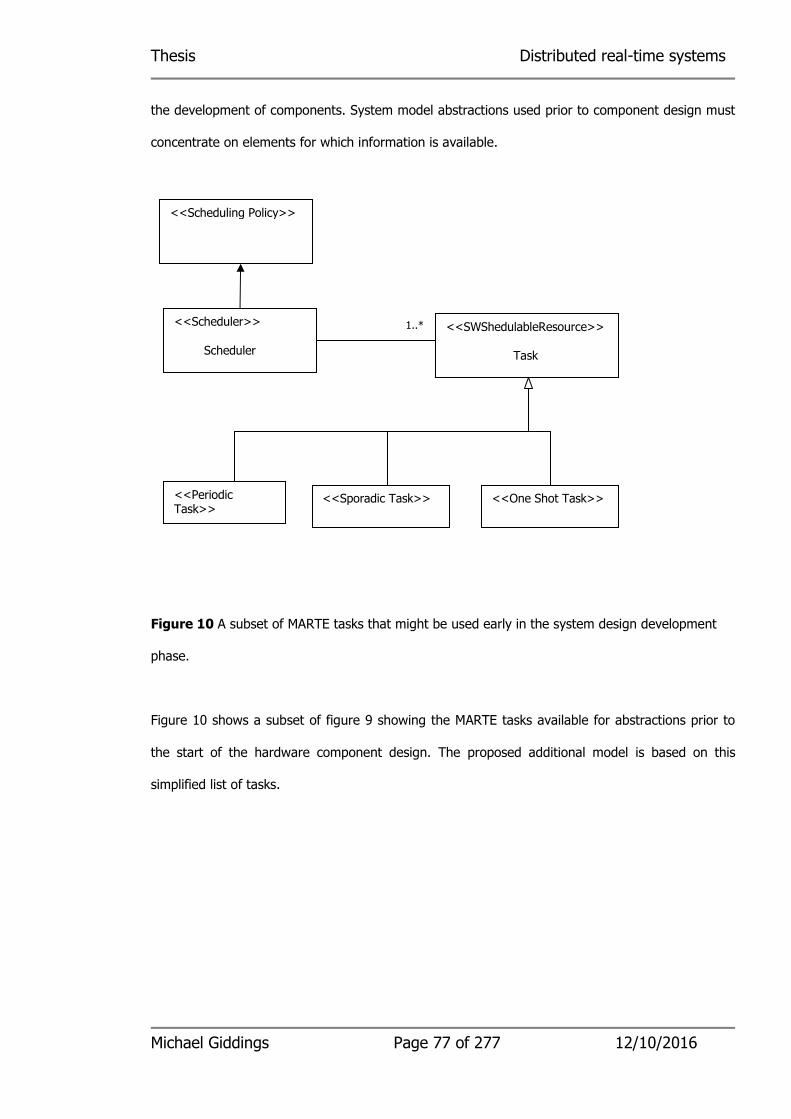
Thesis Distributed real-time systems
Michael Giddings Page 77 of 277 12/10/2016
the development of components. System model abstractions used prior to component design must
concentrate on elements for which information is available.
Figure 10 A subset of MARTE tasks that might be used early in the system design development
phase.
Figure 10 shows a subset of figure 9 showing the MARTE tasks available for abstractions prior to
the start of the hardware component design. The proposed additional model is based on this
simplified list of tasks.
<<Scheduling Policy>>
<<Scheduler>>
Scheduler
<<SWShedulableResource>> Task
<<Periodic Task>>
<<Sporadic Task>> <<One Shot Task>>
1..*
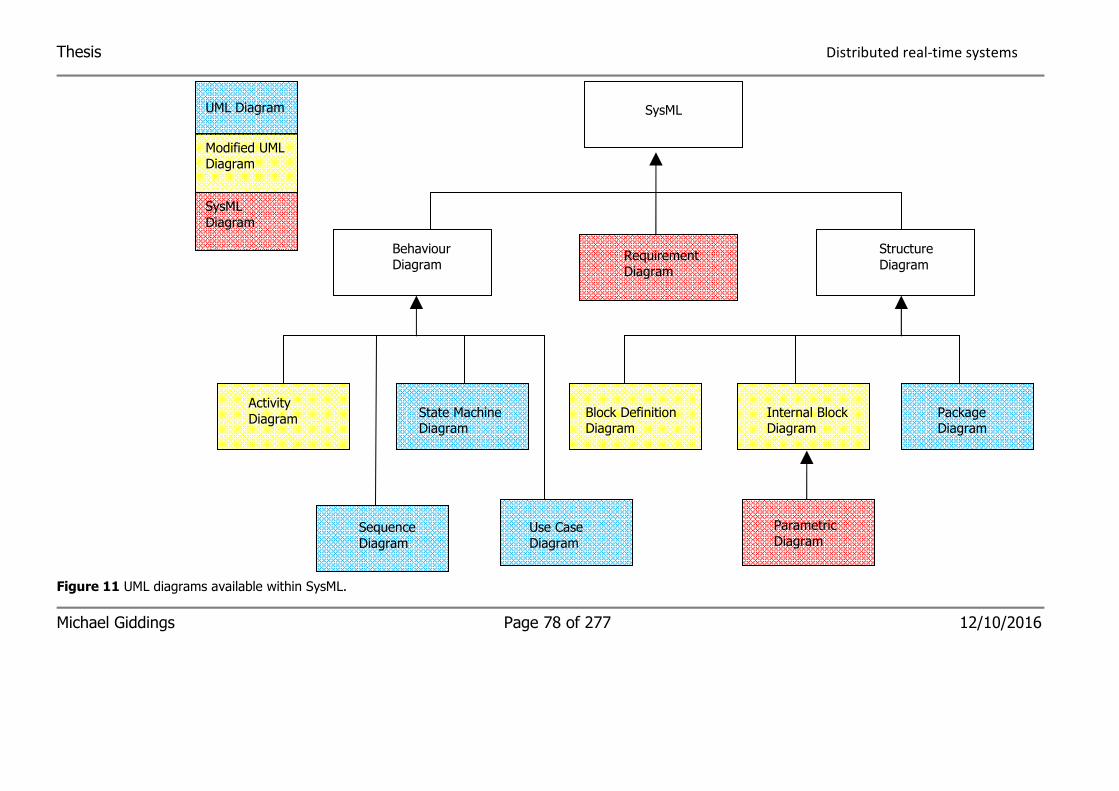
Thesis Distributed real-time systems
Figure 11 UML diagrams available within SysML.
Michael Giddings Page 78 of 277 12/10/2016
Requirement Diagram
Behaviour Diagram
SysML
Structure
Diagram
Activity
Diagram State Machine Diagram
Block Definition Diagram
Internal Block Diagram
Package Diagram
Sequence
Diagram
Use Case Diagram
Parametric Diagram
UML Diagram
Modified UML Diagram
SysML
Diagram

Thesis Distributed real-time systems
Michael Giddings Page 79 of 277 12/10/2016
2.6.3 Systems Modelling Language (SysML)
The most important UML extension for system design is SysML as it provides a consistent graphical
approach to hardware architecture specifications. Whilst SysML can fully specify the hardware
architecture and be annotated with performance requirements, it cannot be used to evaluate the
suitability of the hardware architecture without feedback from the component design authorities.
Figure 11 shows the UML diagrams available within SysML.
2.6.4 Simulation Modelling Language (SimML)
SimML can be used to generate simulation programs from UML. SimML is a textual language and
has been used to investigate software performance. Although it emphasises the need for early
performance analysis it does not apply to analysis of system performance prior to component
design activities. Jinchun et al. [90] describe how SimML simulation might be undertaken using a
method called PSIM to predict system performance and system performance bottlenecks. Arief et
al. [91] describe a tool for the generation of SimML simulation programs from UML specifications of
systems that involve servers and queues. Neither approach uses abstractions that represent
individual system processing and non-processing components.
2.7 Model Driven Development and Real-time Systems
It has been suggested that MDD can help in systems development. The key properties of MDD is
the transformation between models which represent different phases of the system development.
There are, however, shortcomings in MDD when it is used in real-time systems.
Thesis Distributed real-time systems
Michael Giddings Page 80 of 277 12/10/2016
2.7.1 MDD Design Route
The Model Driven Development life cycle (MDD) has been introduced by the Object Management
Group (OMG) [15] to provide models describing systems at different levels of abstraction. Kleppe
et al. [92] describe these models in the context of a development life cycle. Meservy et al. [93]
claim that MDD might revolutionise software development. They concentrate on the development
of software but do not say how MDA can be extended to include hardware architecture necessary
for the development of real-time systems. Staron [94] reports on two cases studies in the use of
MDD in industry, showing what conditions should be fulfilled to increase the chance of success in
its adoption. These were maturity of modelling technology, maturity of modelling related methods,
process compatibility, core language-engineering expertise, and goal driven adoption process.
Cortellessa et al. [95] describe three specific types of model that have been introduced: the
Computation Independent Model (CIM), the Platform Independent Model (PIM) and the Platform
Specific Model (PSM). Figure 12 illustrates the software development lifecycle using these three
models.
It is not clear how MDD can be used in the system design of a distributed real-time system that
needs to combine the system hardware architecture with the architecture independent system
requirements. One key feature of MDD is the concept of automatic translation between MDD
models. Whilst some progress has been made on the translation between PIMs and PSM, no
progress appears to have been made in the automatic translation between the CIM and the PIMs
for the software in each component. Where automatic translation is not possible, manual
traceability techniques can be used.
Woodside et al. [1] have surveyed the current progress and future trends of software performance
engineering. In particular they assess the context of Model Driven Development; saying that
software performance is affected by every aspect of the design, code and execution environment.
Two approaches are identified: a measurement based approach based on testing, diagnosis and
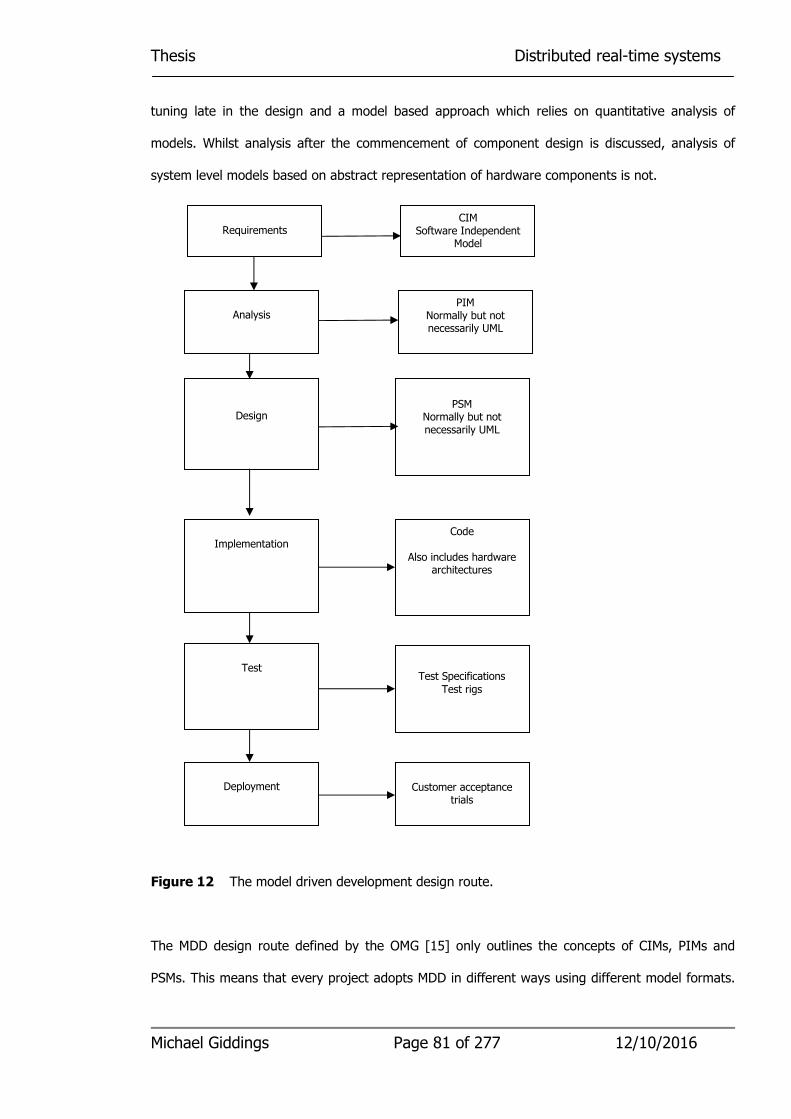
Thesis Distributed real-time systems
Michael Giddings Page 81 of 277 12/10/2016
tuning late in the design and a model based approach which relies on quantitative analysis of
models. Whilst analysis after the commencement of component design is discussed, analysis of
system level models based on abstract representation of hardware components is not.
Figure 12 The model driven development design route.
The MDD design route defined by the OMG [15] only outlines the concepts of CIMs, PIMs and
PSMs. This means that every project adopts MDD in different ways using different model formats.
Requirements
Analysis
Design
Implementation
Test
Deployment
CIM Software Independent
Model
PIM Normally but not necessarily UML
PSM
Normally but not necessarily UML
Code
Also includes hardware architectures
Test Specifications
Test rigs
Customer acceptance
trials
Thesis Distributed real-time systems
Michael Giddings Page 82 of 277 12/10/2016
Typically these models have been applied to the software development of enterprise systems. The
potential of using another type of model to combine system requirements and hardware
architectures as a different use of a CIM has yet to be explored. Each project defines how it is
going to adopt MDD in the projects Engineering/Quality plan. The specific requirements of the
system design of real-time systems with dispersed stakeholders prior to finalisation of component
specifications needs to be addressed.
Hutchinson et al. [96] assess the experiences of Model Driven Engineering (MDE) at three
companies, listing lessons learnt. Whilst quite a few of the lessons learnt deal with organisational
issues and lower level MDD model transformation they also consider problems associated with the
use of abstraction in system models. He concludes that the successful deployment of MDE appears
to require: a progressive and iterative approach, transparent organisational commitment and
motivation, integration with existing organisational approaches and a clear business focus.
The OMG Guide [15] is quite clear that platform independence does not mean hardware
architecture independence. The OMG MDA Guide describes models, platforms and platform
independence as follows:
A model of a system is a description or specification of that system and its environment for
some certain purpose. A model is often presented as a combination of drawings and text.
The text may be in a modelling language or in a natural language.
A platform is a set of subsystems and technologies that provide a coherent set of
functionality through interfaces and specified usage patterns, which any application
supported by that platform can use without concern for the details of how the functionality
provided by the platform is implemented.
Platform independence is a quality, which a model may exhibit. This is the quality that the
model is independent of the features of a platform of any particular type. Like most
Thesis Distributed real-time systems
Michael Giddings Page 83 of 277 12/10/2016
qualities, platform independence is a matter of degree. So, one model might only assume
availability of features of a very general type of platform, such as remote invocation, while
another model might assume the availability a particular set of tools for the CORBA
platform. Likewise, one model might assume the availability of one feature of a particular
type of platform, while another model might be fully committed to that type of platform.
Pires et al. [97] use a subset of UML/SysML to model software in an industrial embedded avionic
systems project. They claim substantial benefit from using model driven engineering in conjunction
with block diagrams, state machine diagrams and activity diagrams.
During the initial system design much of the information required is not available before the
component requirements are identified, so something much simpler must be used.
DeAntoni et al. [98] describe a method of modelling real-time embedded systems. They use a MDA
based method, separating concerns, introducing a communications layer with the outside
environment, an application layer and a connection layer between these two layers. They consider
the role of early simulation and validation in the development of real-time systems.
2.7.2 Computation Independent model (CIM)
The requirements for the system may be modelled in a computation independent model, CIM,
describing the situation in which the system will be used. Such a model is sometimes called a
domain model or a business model. It may hide much or all information about the use of
automated data processing systems. Typically such a model is independent of how the system is
implemented. A CIM is a model of a system that shows the system in the environment in which it
will operate, and thus it helps in presenting exactly what the system is expected to do. It is useful,
not only as an aid to understanding a problem, but also as a source of a shared vocabulary for use
Thesis Distributed real-time systems
Michael Giddings Page 84 of 277 12/10/2016
in other models. In a MDA specification of a system CIM requirements should be traceable to the
PIM and PSM constructs that implement them, and vice versa.
Another possibility not currently used when generating the CIM is the ability to construct a system
design from predefined independent functions located in a library. This approach has been used in
simulation models by Krahl [99] but does not assess the impact of hardware architecture or
performance. The concept of a predefined library of functional elements can be used to specify the
functionality of real-time systems.
If MDD is going to be used effectively within a real-time development process for large distributed
real-time systems, the broad definition of a CIM must be tailored to suit. It must be capable of
being associated with a system hardware architecture to form a system design specification. The
software in the system processing components can then be modelled using platform independent
and platform specific models. It is this early simulation that can be used to help select system
components.
2.7.3 System design model
System design models cover system hardware architectures, functional and non-functional
requirements. They specify the distribution of functionality between components and the
communication links between components. They specify a wide range of non-functional
requirements such as performance, safety, mission criticality, graceful degradation and the extra
functionality to manage them. For example, graceful degradation requirements need a system
wide failure analysis which leads to reversionary moding.
The system design model needs to contain the following information in order to mirror the
information needed in the component specifications and interface control documents for successful
selection of component design authorities:
• A functional model of the whole system
Thesis Distributed real-time systems
Michael Giddings Page 85 of 277 12/10/2016
• An abstraction of each system component
• An abstraction of each communication link
• A list of whole system end events partitioned to individual system components
• A specification for each system component
• An interface control document for each component
• An interface control document for each communications component
MDD does not have a model that represents the CIM of a distributed real-time system that
contains both software and hardware aspects. The MDD system design model should identify the
system components and describe how they are connected together. The model should identify the
functional and non-functional system design for each component. When the software needed for
each component has been specified as an abstraction, the software for each component can be
represented as a Platform Independent Model.
2.7.4 Platform Independent Model (PIM)
Platform independent models are generated from the system design by the system design
authorities for each processing component. Individual platform independent models rely on the
content of the system design specification and cannot be used to check that the system
requirements are met. A mistake in the system requirements or the system design might not be
detected by the component design authorities.
Lu et al. [100] describe the specification of component based software architectures for embedded
systems using PIMs and PSMs identifying benefits such as low cost by fostering re-usability of old
designs (PIM) in new applications (PSM) validating the correctness of models. Hayes [101] claims
that the platform independent approach to real-time systems development enables dependable
and flexible systems to be developed at a lower cost by using a platform independent approach.
Thesis Distributed real-time systems
Michael Giddings Page 86 of 277 12/10/2016
Raistrick et al. [5] have evaluated MDD PIMs within the Avionics industry to assess the possibility
of automatic development process. They cover the introduction of hardware system components
but their approach does not address performance during the system design process prior to
component selection and specification. They focus on the delivery and certification of avionics
software; concluding that the Model Driven Architecture (MDA) approach is how future avionics
systems will be built.
Pastor et al. [102] introduce CIM, PIM, PSM, and Code models and compare them to the
conventional object oriented approach. They describe transition methods from CIM to PIM to PSM
to code model. The CIM is described as a viewpoint focused on the environment and system
requirements, which disregards the computerisation of the system being modelled. They do not
identify the need for the system hardware architecture to be included in the CIM. The PIM is
described as the next level of abstraction and as a model that takes into account which parts of the
system will be computerised, but it still does not determine the architectural platform that will
support the implementation. They conclude that the processes described in their case study
represent one of the possible routes that can be followed when developing a software system with
the Object Oriented (OO) method.
Cortellesa et al. [95], [103] describe non-functional aspects of MDA introducing three parallel
models to describe non-functional requirements: CINFM for CIM, PINFM for PIM and PSNFM for
PSM models. The combination of CIM and CINFM still falls short of a full systems design. PIM
PINFM and PSM PSNFM model pairs relate to components. The term ‘platform’ does not refer to
the hardware architecture of the system.
Neither the CIM nor the PIM can be used as a system design specification. The CIM does not cover
the proposed hardware components of the system and the PIM only relates to the components of
the system that will be computerised.
Thesis Distributed real-time systems
Michael Giddings Page 87 of 277 12/10/2016
Many papers, for example Bohme et al. [104], consider automatic translation between PIM and
PSM models within individual system components. None cover the automatic translation between
the system specification and individual PIMS. The challenge is to generate the system design in a
form where this translation is possible. The problem with generating PIMS automatically from the
system design model is that extra detail needs to be added. The first element is the effects of the
detail internal hardware configuration of the component and the second is the software
architecture that the component.
Cuccuru et al. [105] describe how the gap between the abstract specification level and a
heterogeneous architecture level might be bridged for real-time implementations. They do this by
associating a UML based application design with a hardware architecture using an UML association.
They do address system hardware architecture and show a workflow from system design to
software design to code generation. They do not address performance analysis or large distributed
real-time systems, or offer the possibility of automatic transformation between system and
component requirements.
Elleuch et al. [106] introduce an architecture-centric MDE approach that stresses architecture
based development and validation of real-time systems. They introduce architecture independent
(AIM) and architecture specific (ASM) models where the term architecture refers to the physical
hardware. They describe how a requirements model (CIM) is used to derive an AIM. The AIM is
then used to generate three types of ASM: Software Architecture-Specific Models (SASM),
Hardware Architecture-Specific Models (HASM), and Integration Architecture-Specific models
(IASM). The example used is a simple automotive speed regulator. The methodology does not
offer the capability of analysing performance prior to component design as the information needed
is not available.
Marcos et al. [107] discuss the mapping between CIM, PIM and PSM models but focus on software
architectures of web based systems. The architecture it addsses is the software architecture or

Thesis Distributed real-time systems
Michael Giddings Page 88 of 277 12/10/2016
fundamental organisation of the system not hardware architectures. They report that the
Architecture-Centric Model-Driven Architecture (ACMDA), has several advantages, as it allows
architectural design to benefit from the adaptability and flexibility of an MDD process; and on the
other hand it extends MDA philosophy by integrating true architectural concerns, effectively turning
it into an Architecture-Centric Model-Driven Development (ACMDD) process.
Gilliers et al. [108] introduce a modelling language LFP (language for prototyping) that can be
applied to distributed systems. It emphasizes the use of a model serving as a basis for automatic
code generation; strong connections with formal verification techniques enforce correctness of the
system, however, it does not offer the capability of analysing system performance early in the
system design lifecycle.
Kuzniarz et al. [109] consider quality in MDD models. In particular they say that models may be
purposely incomplete or semantically free. They identify a list of qualities for MDA models. The list
includes correctness, consistency, completeness, conciseness, detailedness, maintainability, clarity,
complexity, navigability, traceability, size, measurable, precision improving and stability. Any new
models defined should take these quality features into account.
Nobre et al. [110] used MDA to develop the software for a real-time embedded prototype
consisting of three main components for an aerospace project. The team involved relied on team
interaction to support component integration. They claimed that this exercise formed a case study
for an embedded avionics real-time system using an MDA approach, yet did not include any
mention of a system design specification. Performance modelling was not considered with a
prototype approach used to manage performance outcome on a 'fix-it-later' basis. Whilst they
concentrated on developing software for three components on an incremental basis, it is difficult to
see how they knew they had satisfied the customer’s requirements.
Thesis Distributed real-time systems
Michael Giddings Page 89 of 277 12/10/2016
Pareto et al. [111] describe the application of MDE in Ericsson from the engineer’s perspective.
They clearly identify system engineers as part of the development team and the need for system
models with multiple levels of abstraction. This hierarchical approach to system models is an
essential feature of any new model proposed. It does not, however, identify any system
performance analysis activities required at the system level design phase.
Sanchez et al. [112] discuss performance evaluation in real-time systems using a model-based
approach to real-time embedded systems development (MARTE). They discuss how this approach
might be used in processing components but do not address the need to generate a system
specification before starting component design.
Siikarla et al. [113] focus on the transformation between PIMs and PSMs. MDA patterns can be
used to make the transformations on an incremental basis. This should be beneficial in the
situation when the transformation between the formal system design and the components PIMs
are refined as feedback is received from the component design authorities. Another important
issue raised, is the openness and the need to document the transformation process. This goes
beyond the traceability of requirements, to record the mechanics of the transformation process as
well.
These papers reveal the need for a system design model structure to support the generation of
PIMs. The automatic generation of PIMs from the system design seems unlikely due to the extra
design detail that needs to be added. A separate component model is required which reflects the
component hardware architecture. SysML can be used to generate this model.
2.7.5 Platform Specific Model
Platform Specific Models are developed from Platform Independent models, and are used to
develop the software logic at a high level of abstraction and enable analysis; for example, model
Thesis Distributed real-time systems
Michael Giddings Page 90 of 277 12/10/2016
checking of critical model properties. Ideally, starting with the Platform Independent Model, the
Platform Specific Model serves only as an intermediate artefact that is derived automatically, and
will finally result in implementations that guarantee the behaviour specified in the Platform
Independent Model. Code can then be either manually or automatically derived from this model.
Burmester et al. [114] describe the automatic code generation process. Alonso et al. [115]
describe the generation of ADA code using the MDE approach and Dawson et al. [116] describe
the process of generating embedded system code in Java.
2.8 Conclusions
The review of real-time systems development reveals that there is a gap in the model driven
development methodology prior to the start of system component design and selection. This
research augments the research literature by clarifying the 'fix-it-later' approach currently used in
the early system development phase and by identifying a novel approach to assess performance
using independent functional elements. Future work identified in section 6.4 is required to
transform the concept of an additional functional model into a workable system for industrial use.
Currently systems hardware is selected on an experience based process relying on the good will of
component design authorities and manufacturers to change their designs as the system and
component design emerges. Changes arise from system requirements errors and omissions,
unsuitable choice of components, poorly specified component requirement specifications and
interface control documents. Difficulties also arise when component developers find they cannot
meet the requirements designed by the system design authority. Whilst this 'fix-it-later' approach
can be accommodated for most changes there are some problems which are not discovered until
system integration and deployment. These problems tend to be system level mistakes and
omissions which spread across a number of components.
Thesis Distributed real-time systems
Michael Giddings Page 91 of 277 12/10/2016
Large low-volume distributed real-time systems that are not suited to 'fix-it-later', prototyping or
phased development approaches have the risk that system performance end events are difficult to
identify prior to the generation of component requirements specifications. The difficulty occurs
when trying to ensure that the system hardware architecture will support the system requirements.
The problem lasts until component design details start to become available from the component
design authorities. The consequences of the problem are that some system performance issues are
not discovered until system integration and deployment.
In this thesis I investigate the question of whether performance shortfalls due to the system
design can be detected early in the development process in order to reduce risks and costs. I
propose an approach based on an additional system design level model based on the system
hardware architecture and functional requirements, and a tool that can animate the specification to
assess the performance of system end events.
The research described in this paper documents the principles of a method that offers early
performance assessment that may be undertaken prior to the selection of component design
authorities. It describes the current system development process and identifies how errors and
omissions can go undetected until system integration and deployment. The research is limited to
large distributed real-time systems that operate in a periodic manner as this is seen as the type of
system that suffers most from this kind of problem. The methodology may apply to other types of
system but this is not assessed. The animator developed within the research is developed for
experimental purposes and requires further development to make it usable commercially.

Thesis Distributed real-time systems
Michael Giddings Page 92 of 277 12/10/2016
Thesis A functional model for performance analysis
Michael Giddings Page 93 of 277 12/10/2016
Chapter 3 A functional model for performance analysis
3.1 Introduction
A functional model is proposed which represents the functional operation of a system in terms of
functional end events obtained from the system requirements. A functional end event is an output
of the system as defined in the requirements. The model consists of a combination of abstractions
representing the functionality of individual system components provisionally identified on an
experience basis during the early system design phase. Each abstraction is defined in terms of
independent functional elements obtained by decomposing the hardware independent system
requirements and is associated with one or more schedulers which defines the order in which the
independent functional elements operate.
Every individual independent functional element is linked to other functional elements which supply
it with the information required for it to operate. Component models can be combined to form a
system functional model which represents the overall system. This model is derived from high-
level, architecture independent customer requirements specifications, extended with further detail
from domain experts, to fully specify the system's functional and performance requirements. The
model is associated with a schedule which describes the order in which the functional elements
defined in the static model for each component are used.
The model is used to investigate and optimise the performance of the system design. The system
design authority establishes the component specification and communications early in the system
life-cycle. These design decisions frequently occur prior to any detailed performance assessment.
Having early performance information would enable the component requirements to be established
with greater confidence. Traceability is used to record the relationship between individual system
requirements, the system design, the contract specifications and interface control documents.
Thesis A functional model for performance analysis
Michael Giddings Page 94 of 277 12/10/2016
3.2 Context
The primary context of this model lies between the system requirements definition and the
selection of system hardware components. This is referred to in the thesis as the early system
design phase.
The systems which would most benefit from this type of model are large distributed real-time
systems which operate in a periodic manner and are developed by diverse teams. Real-time
systems benefit because typically their hardware architecture affects their system performance in a
more unpredictable way than other system architectures. Distributed systems benefit more
because their operation may have more coupling than less integrated older systems and their
components are less cohesive as their functions may be spread between several components. If a
system function is spread between components under the control of different component design
authorities, intercompany communication may adversely affect the system level operation. The
use of the model introduces extra costs during the early system design phase, which can only be
justified if there are likely to be performance shortfalls which may be discovered during integration
and are very expensive to rectify.
This approach may be used on other types of system but might not make the savings required to
justify the extra work involved. This research only addresses the real-time systems described
above.
3.3 A functional model
A functional model can be defined as a structured representation of its activities, actions, processes
and operations of a system. Many different diagrammatic techniques are available; the two key
Thesis A functional model for performance analysis
Michael Giddings Page 95 of 277 12/10/2016
examples are Functional Block Diagrams [114] - which show functional blocks and functional block
links - and Functional Flow Block Diagrams [115], which also show functional flow.
Functional model diagrams used in this research are described in section 3.3.3.
In this research functional model diagrams are an extension of Functional Block Diagrams and are
made up of functions of the system pictured as blocks in a similar way. Functional model diagrams
differ in that the functional blocks used are independent functional elements associated with a
scheduler. Unlike Functional flow diagrams, functional model diagrams show functional elements
connected by shared data made up of messages that occur in both directions as shown in section
3.5.1.
The proposed model can be created directly from the customer’s outline requirements specification
(usually textual) during the requirements elicitation phase, undertaken by the systems design
authority domain experts. Alternatively, the functional requirements model may be generated by
domain experts from a requirements model defined using state diagrams. It may be possible to
translate the state diagram model of the system into a functional model of the system by adding
details of the proposed system hardware architecture. The proposed functional model identifies
functional requirements and system end events. Each end event is associated with a set of
performance requirements. The first version of the model is hardware architecture independent.
At the start of the system design phase, a provisional system hardware architecture is identified
and the functional requirements identified in the initial functional model are partitioned to
hardware components. Inter-component communications are identified and included in the model
as component abstractions, as required by the prospective component design authorities and
manufacturers to bid for their respective contracts.
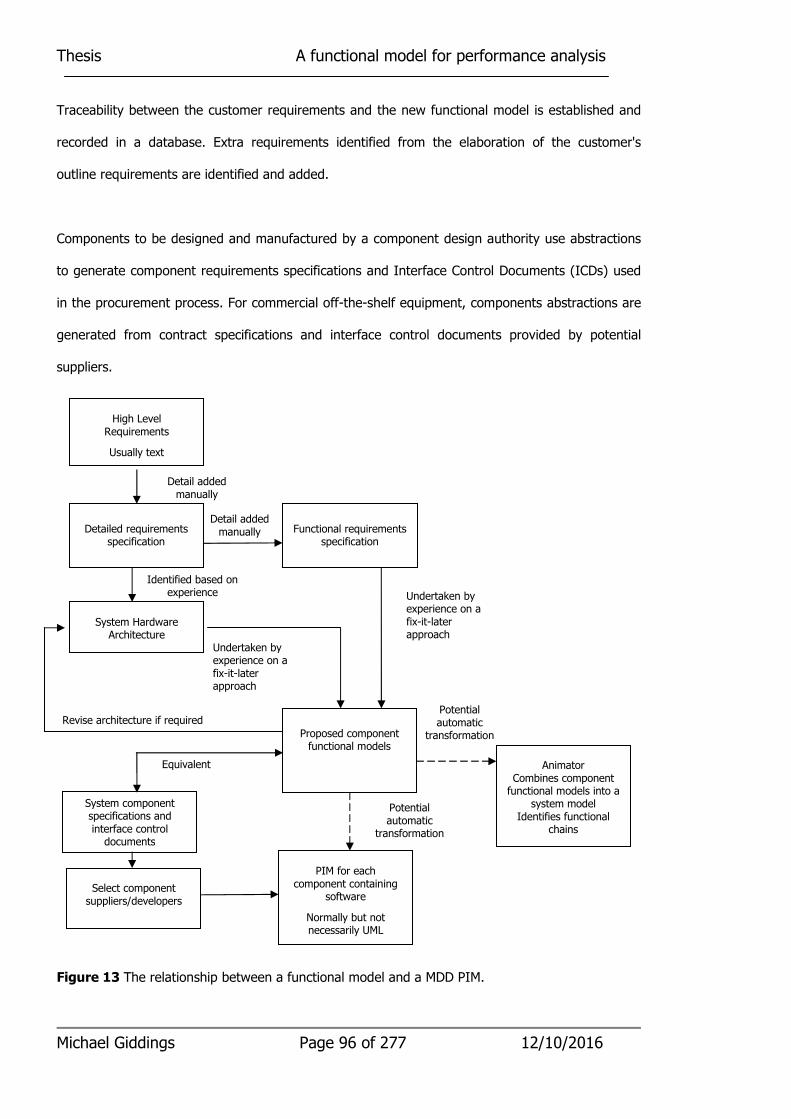
Thesis A functional model for performance analysis
Michael Giddings Page 96 of 277 12/10/2016
Traceability between the customer requirements and the new functional model is established and
recorded in a database. Extra requirements identified from the elaboration of the customer's
outline requirements are identified and added.
Components to be designed and manufactured by a component design authority use abstractions
to generate component requirements specifications and Interface Control Documents (ICDs) used
in the procurement process. For commercial off-the-shelf equipment, components abstractions are
generated from contract specifications and interface control documents provided by potential
suppliers.
Figure 13 The relationship between a functional model and a MDD PIM.
Potential automatic
transformation
Animator Combines component functional models into a
system model Identifies functional
chains
High Level Requirements
Usually text
Proposed component functional models
System Hardware Architecture
System component specifications and interface control
documents
PIM for each component containing
software
Normally but not necessarily UML
Detailed requirements
specification
Functional requirements
specification
Potential automatic
transformation
Detail added manually
Detail added manually
Identified based on experience
Undertaken by experience on a fix-it-later approach
Undertaken by experience on a fix-it-later approach
Revise architecture if required
Equivalent
Select component suppliers/developers

Thesis A functional model for performance analysis
Michael Giddings Page 97 of 277 12/10/2016
In real-time systems, the system hardware architecture contributes towards the overall system
performance to such an extent that it must be specifically included in the model driven design
system design.
The model-driven development design route described in Chapter 2 is extended to include the
hardware design aspects shown in Figure 13. Each rectangle represents a stage in the
development of the system and the arrows indicate the order in which they are undertaken. The
proposed model is used to generate component specifications and interface control documents for
each component used for the component design authority selection process.
The potential for automatic transformation between the proposed functional model and the PIM is
also identified. Figure 14 shows the proposed component functional models, representing a
combined functional and system hardware architecture model. Figure 14 also shows the static
(component functional model) and dynamic (scheduler) parts of the model.
The functional model is used to address the proposed system hardware architecture and allocation
of functionality to system components which will support the required system performance.
The model supports the following system elements:
• Processing components that contain system software
• Specially developed system components that contain processing software
• Commercial of the shelf components
• Sensors
• Controls
• Displays
• Actuators
• Communication links
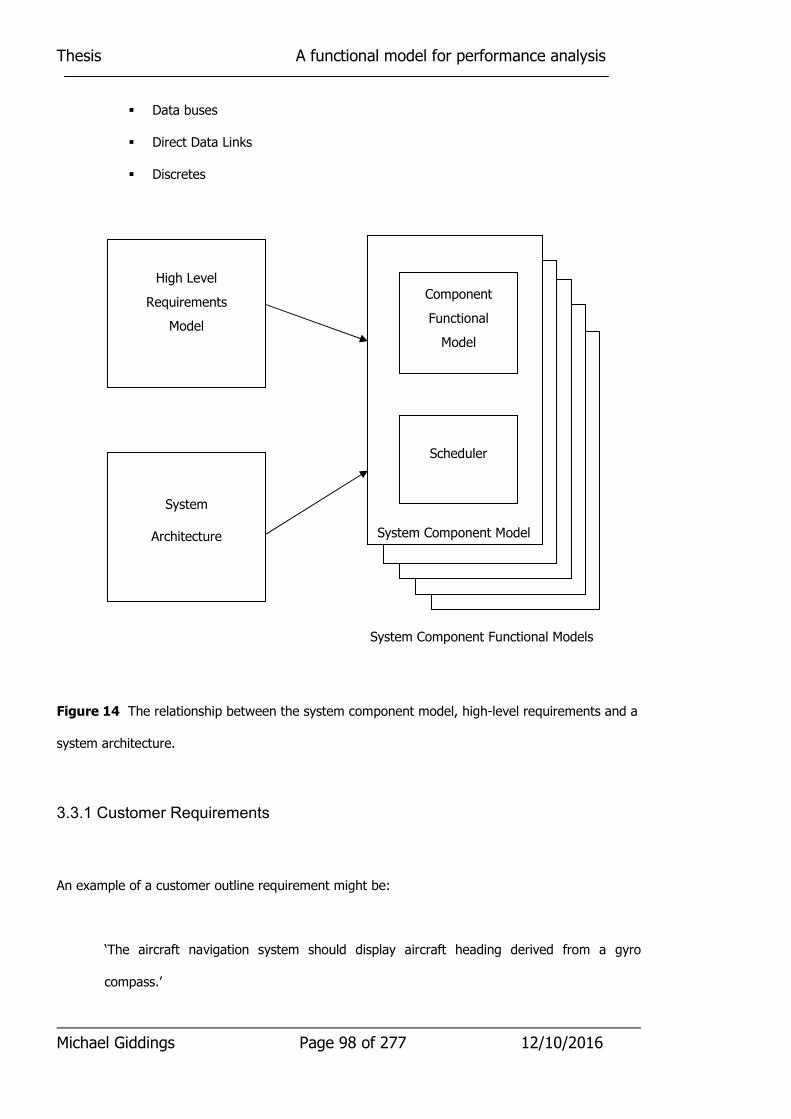
Thesis A functional model for performance analysis
Michael Giddings Page 98 of 277 12/10/2016
� Data buses
� Direct Data Links
� Discretes
Figure 14 The relationship between the system component model, high-level requirements and a
system architecture.
3.3.1 Customer Requirements
An example of a customer outline requirement might be:
‘The aircraft navigation system should display aircraft heading derived from a gyro
compass.’
High Level
Requirements
Model
System
Architecture
Component
Functional
Model
Scheduler
System Component Model
System Component Functional Models

Thesis A functional model for performance analysis
Michael Giddings Page 99 of 277 12/10/2016
Figure 15 shows how this requirement may be shown in diagrammatic form.
An example of a performance requirement for this system end event might be:
‘The aircraft heading display should be accurate to +/- 1 degree with the assumption that
the maximum rate of change of aircraft azimuth is 10 degrees per second’.
Figure 15 Diagram showing an example top level requirement diagram.
3.3.2 Initial system hardware architecture
Figure 16 shows an example of part of the provisional system hardware architecture that might be
proposed at the start of the system design phase. A single end event is considered - the pilot’s
display of aircraft heading. This is a relatively simple example of a system that comprises the
transit of data from a sensor across a multi component system to a display.
Figure 16 An example initial system architecture.
Gyro Compass Navigation
system
Display
Aircraft Heading
GC Sensor
Display Computer
Display
Avionic
Computer NAV Bus
External
Interface
External
Interface
DISP Bus

Thesis A functional model for performance analysis
Michael Giddings Page 100 of 277 12/10/2016
The following system components are identified:
• Gyro compass sensor
• Avionics system computer
• Display computer
• Display
• Navigation bus (NAV Bus)
• Display bus (DispBus)
SysML provides the framework for specifying system architectures but cannot be used to calculate
or animate system performance on its own. It can, however, be annotated with customer
requirements or information from the system design where it is known. The provisional system
architecture diagram can be replaced with a SysML system specification when individual
component design information becomes available from the component design authority.
3.3.3 Individual system component functional models
Each individual system component and communications link will be represented by an abstraction
which describes the hardware and software aspects of that component. Not all system components
contain software but they are still represented by an abstraction. There are two types of
components that contain software: the first contains software that controls the operation of that
component and the second contains software the controls the operation of the system.
MARTE provides a specification language for managing real-time system development. It can be
used to specify abstractions but is typically used to specify the actual implementation of processing
component software. The proposed functional model uses a subset of the MARTE tasks as shown
in figure 17.
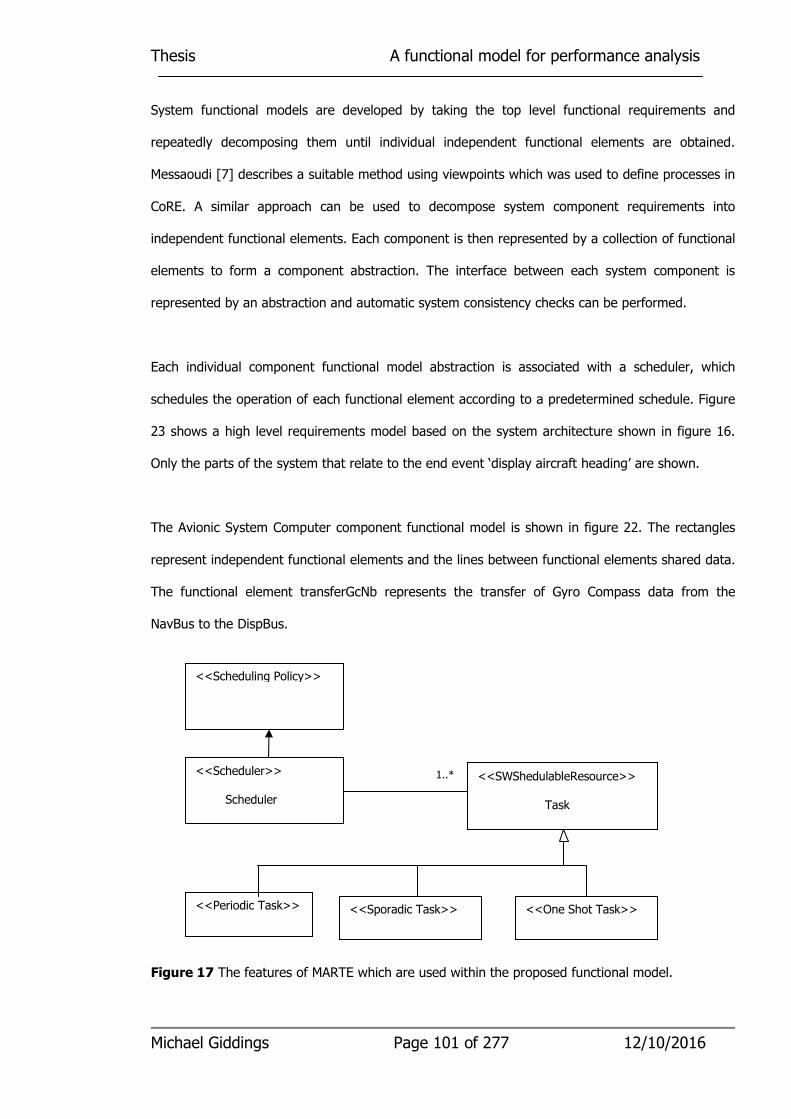
Thesis A functional model for performance analysis
Michael Giddings Page 101 of 277 12/10/2016
System functional models are developed by taking the top level functional requirements and
repeatedly decomposing them until individual independent functional elements are obtained.
Messaoudi [7] describes a suitable method using viewpoints which was used to define processes in
CoRE. A similar approach can be used to decompose system component requirements into
independent functional elements. Each component is then represented by a collection of functional
elements to form a component abstraction. The interface between each system component is
represented by an abstraction and automatic system consistency checks can be performed.
Each individual component functional model abstraction is associated with a scheduler, which
schedules the operation of each functional element according to a predetermined schedule. Figure
23 shows a high level requirements model based on the system architecture shown in figure 16.
Only the parts of the system that relate to the end event ‘display aircraft heading’ are shown.
The Avionic System Computer component functional model is shown in figure 22. The rectangles
represent independent functional elements and the lines between functional elements shared data.
The functional element transferGcNb represents the transfer of Gyro Compass data from the
NavBus to the DispBus.
Figure 17 The features of MARTE which are used within the proposed functional model.
<<Scheduling Policy>>
<<Scheduler>> Scheduler
<<SWShedulableResource>> Task
<<Periodic Task>> <<Sporadic Task>> <<One Shot Task>>
1..*

Thesis A functional model for performance analysis
Michael Giddings Page 102 of 277 12/10/2016
Each component model represents an abstraction of the component hardware, functionality and
external interfaces that the component will eventually contain. As the functional model is
associated with a scheduler, components can be modelled with representations that reflect their
functionality and performance. Functional models can be used to describe processing and non-
processing components, communication systems and buses for which the internal details are not
yet known.
One of the benefits of this functional model, is that it is constructed by domain experts whose skills
lie with the problem domain rather than complex system design notations.
The functional model can also be used to promote abstraction and re-use of model elements.
A functional model diagram consists of the following parts - see figure 18:
� Functional chains – which show part or the whole of a functional model associated with a
functional end event.
� Functional elements – shown as rectangles annotated with their unique names.
� Shared data – shown as lines between the functional elements, which show how data
migrates from one functional element to another. Each shared data message is annotated
with a unique name.
� Up arrow – indicates which scheduler manages the operation of a functional element.
� Source references – a source reference identifies a diagram that contains a functional
element from which information is needed. They are shown on the left of the diagram.
� Destination references – a destination reference identifies a diagram that contains a
functional element from which information is needed for the functional element to operate.
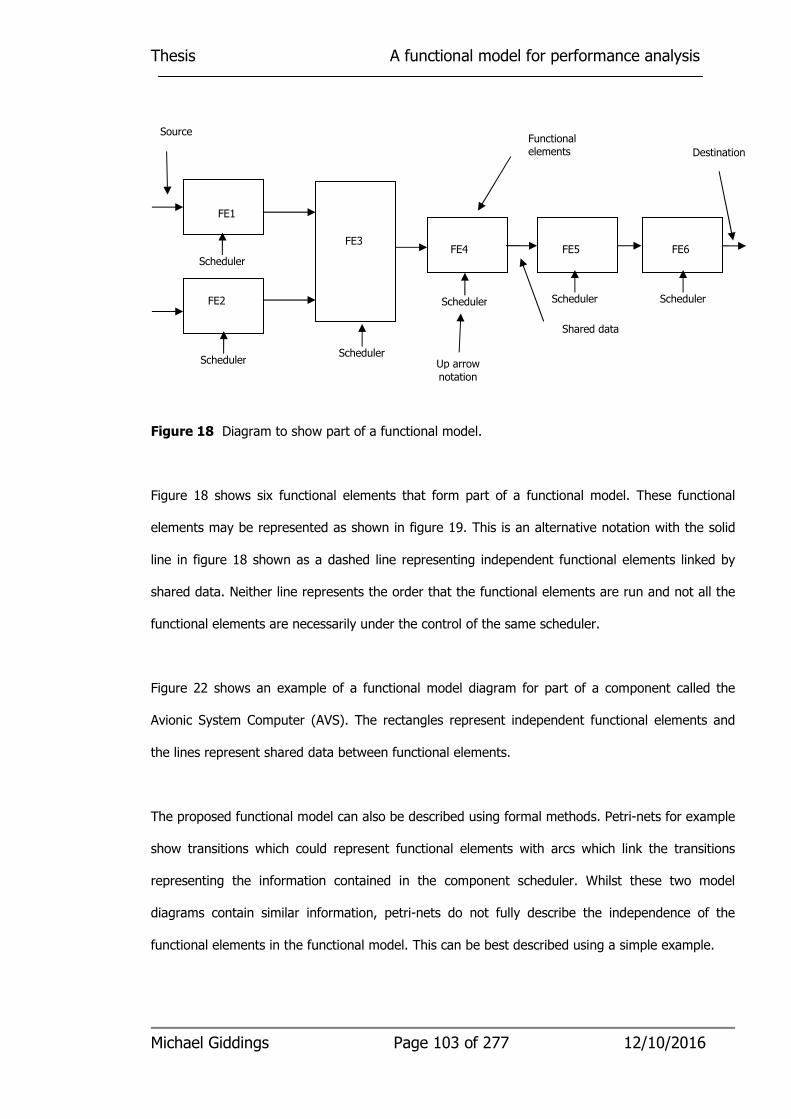
Thesis A functional model for performance analysis
Michael Giddings Page 103 of 277 12/10/2016
Figure 18 Diagram to show part of a functional model.
Figure 18 shows six functional elements that form part of a functional model. These functional
elements may be represented as shown in figure 19. This is an alternative notation with the solid
line in figure 18 shown as a dashed line representing independent functional elements linked by
shared data. Neither line represents the order that the functional elements are run and not all the
functional elements are necessarily under the control of the same scheduler.
Figure 22 shows an example of a functional model diagram for part of a component called the
Avionic System Computer (AVS). The rectangles represent independent functional elements and
the lines represent shared data between functional elements.
The proposed functional model can also be described using formal methods. Petri-nets for example
show transitions which could represent functional elements with arcs which link the transitions
representing the information contained in the component scheduler. Whilst these two model
diagrams contain similar information, petri-nets do not fully describe the independence of the
functional elements in the functional model. This can be best described using a simple example.
FE1
FE2
FE3 FE4 FE5 FE6
Functional elements
Shared data
Scheduler Scheduler
Scheduler
Scheduler
Scheduler
Scheduler Up arrow
notation
Source
Destination

Thesis A functional model for performance analysis
Michael Giddings Page 104 of 277 12/10/2016
Figure 19 An example of a diagram consisting of a number of independent function elements
contributing towards an end event.
Figure 20 A diagram representing the actual order of the functional elements.
Figure 20 shows a possible ordering for the functional elements which can only be derived by
considering both the functional model and its scheduler tables. Sequential functional elements may
be completely unrelated. In periodic systems with independent functional elements the functional
elements themselves need not be updated in the order as shown in figures 19 and 21; for example
functional element f4 may be updated twice as often as functional element f5. Changing the order
or frequency of the transitions may either have no effect, only change the performance, or change
the functionality and performance of the system. If the functional elements are located within
different components, then the functional element order will not be regular as each component will
have its own independent unsynchronised scheduler. The effects of a sequence of functional
elements cannot be determined by the order they are run.
delay
delay
delay delay delay
End event
f1
f2
f3 f4 f5 f6
delay delay delay delay delay delay delay delay delay delay delay
f1 f7 f4 f1 f2 f12 f1 f3 f6 f1 f5 f11

Thesis A functional model for performance analysis
Michael Giddings Page 105 of 277 12/10/2016
Figure 20 can be represented in process algebra as:
……f1;f7;f4;f1;f2;f12;f1;f3;f6;f1;f5;f11….
where fn represents the execution of a functional element and ; is a sequential composition
operator.
As this is a sequence of unrelated independent processes it is difficult to analyse. In itself the
sequence is not concurrent within the animator but the effects of running a sequence of unrelated
functional elements may be considered as concurrent. If the functional elements are under the
control of different schedulers then the sequence is again not concurrent within the animator but
the effects of the sequence may also be considered concurrent. The effect of running a functional
element is totally dependent on the state of the functional elements it requests information from
(i.e. when they were last updated).
Each functional element contains information that does not change until it is run (it is triggered by
the scheduler). Running each functional element extracts data from other functional elements
based on their current state.
Performance may be managed by altering the order or frequency in which functional elements
execute. For example, changing the frequency of a functional element f1 to modify the
performance of an end event, may alter the sequence of events as follows:
……f1;f7;f4;f2;f12;f1;f3;f6;f5;f11….
Whilst this looks a fairly straightforward change, in practice the analysis of performance is complex
using formal methods, and a small change in the order of the execution of the functional elements,
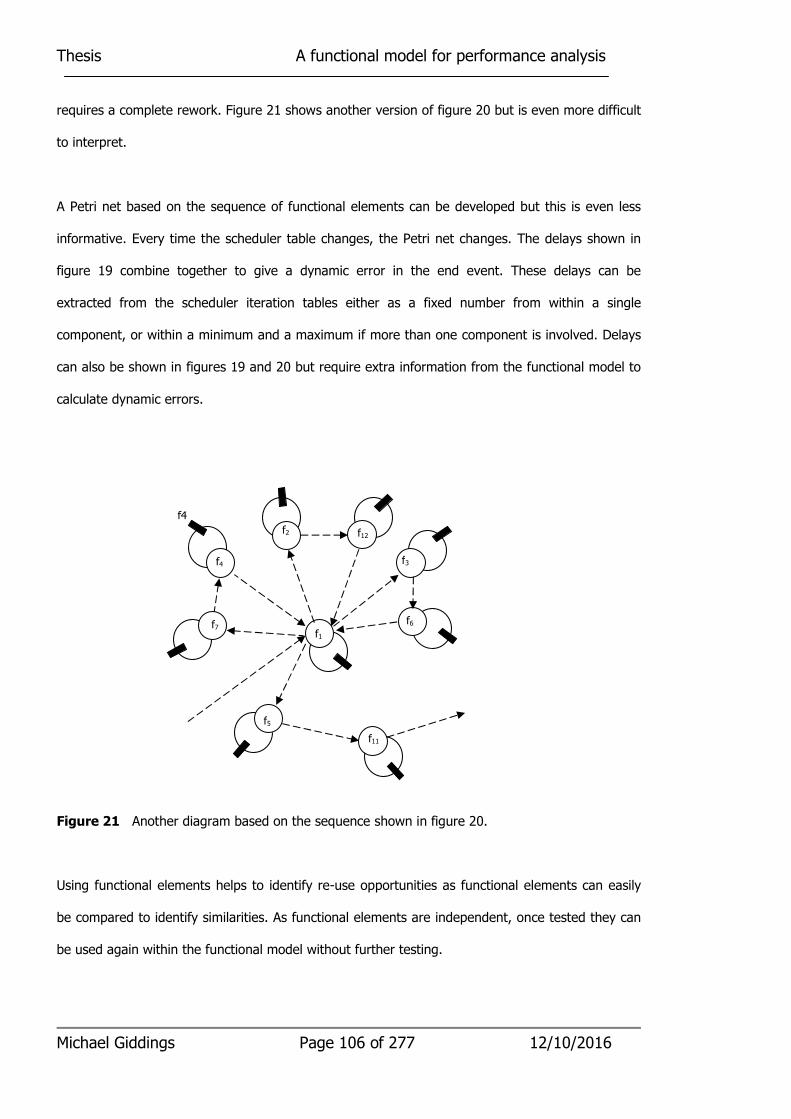
Thesis A functional model for performance analysis
Michael Giddings Page 106 of 277 12/10/2016
requires a complete rework. Figure 21 shows another version of figure 20 but is even more difficult
to interpret.
A Petri net based on the sequence of functional elements can be developed but this is even less
informative. Every time the scheduler table changes, the Petri net changes. The delays shown in
figure 19 combine together to give a dynamic error in the end event. These delays can be
extracted from the scheduler iteration tables either as a fixed number from within a single
component, or within a minimum and a maximum if more than one component is involved. Delays
can also be shown in figures 19 and 20 but require extra information from the functional model to
calculate dynamic errors.
Figure 21 Another diagram based on the sequence shown in figure 20.
Using functional elements helps to identify re-use opportunities as functional elements can easily
be compared to identify similarities. As functional elements are independent, once tested they can
be used again within the functional model without further testing.
f1
f4
f7
f4
f2
f3
f6
f5
f11
f12

Michael Michael Giddings Page 107 of 277 12/10/2016
Thesis A functional model for performance analysis
Figure 22 An example of part of a functional model diagram for a single system component (Avionics computer)
waypoints
transferGcNb
gpsTxr
gcTxr
waypoints
calcCMG
selectWPs
calcWind
SmoothHdg
calcCTSRev
nextWP
NavBus
NavBus
DispBus
DispBus
DispBus
updateWPs
lastWP
nextWP
avCTS
heading
smoothHeading
nextWP
nextWP
lastWP
DataLoader nextWP
lastWP courseMG
wind DispBus
calcMode
wind
calcCTSFwd
AVS AVS
AVS
AVS AVS
DispBus lastWP
AVS
AVS
AVS
DataLoader loadData

Thesis A functional model for performance analysis
Michael Giddings Page 108 of 277 12/10/2016
3.3.4 Multi Component functional models
Multi Component Functional Models are generated by combining individual component functional
models. The overall system functional model (which includes communication links as components)
is then checked to confirm that the individual system component external interfaces match. When
this has been achieved, then the overall system functional model can be assembled. The up arrow
notation is used to identify the scheduler that controls the functional element. Where a system
component contains a single scheduler the up arrow notation can simply refer to the name of the
component. Where the component is represented by more than one scheduler the up arrow
notation should show the name of the component followed by the name of the scheduler.
Functional elements are represented as rectangles in functional model diagrams as shown in figure
22. Figure 23 shows an example of part of a system functional chain combining functional models
for individual components and communication links including the AvComp functional element
transferGcNb as shown in figure 22. This diagram uses the inter component data and component
names from the individual component functional models.
3.4 Independent functional elements
Functional elements are obtained by decomposing high level requirements that have been
partitioned to individual system components. They are obtained when they are decomposed into
simple, cohesive, independent, idempotent (assuming the information retrieved from other
functional elements does not change) functions. They rely on the provision of information from
other functional elements obtained by request. They only provide information to other functional
elements on request. The results of the execution of the functional element are stored internally
within the functional element.
Thesis A functional model for performance analysis
Michael Giddings Page 109 of 277 12/10/2016
Functional elements are independent and can be processed at any rate or order under the control
of a scheduler. The challenge is to schedule functional elements in a way that minimises the
processor loading (processing components) whilst just meeting the end event performance
requirements.
Each functional element object contains information recording the results of its operation, which
are required to be available to other functional elements on request. It may also contain other
information to support its operation as a functional element. It also contains information necessary
to represent the functional element in a graphical model such as the layout of a functional element
diagram.
Functional elements have three types of behaviour:
• The first triggers the operation of the functional element when instructed by its associated
scheduler. This behaviour may be supported by internal behaviour not available outside
the functional element such as the second and third types of behaviour below.
• The second requests information from other functional elements.
• The third responds to requests of information from other functional elements.

Thesis A functional model for performance analysis
Michael Giddings Page 110 of 277 12/10/2016
Figure 23 An example of part of a system functional model including TransferGcNb shown in figure 21
gpsSens
GcSensor NavBus AvComp
DispBus
transferCTSDb
GUICom
Display
gcSens
avCTS
GuiGc dispCTS
Transfer GCSens
transferCTS
GuiComp
transferCTSAc
GenGcData
DispGCData
DispBus
env
env GenGpwsData
GpsSensor
Transfer
GpsSens
NavBus
TransferGcNb
gpsTxr
gcTxr
dBCTS
Thesis A functional model for performance analysis
Michael Giddings Page 111 of 277 12/10/2016
Each functional element can be defined using a textual Functional Element Definition Note. These
notes include a definition of information recorded and a definition of the functional element
behaviour. The behaviour may be expressed in textual form or in Object Constraint Language
(OCL) [117] that can be automatically transformed into code as required. Parameters are also
included to cover performance, safety, mission criticality and traceability references generated
from further analysis of the functional model. Other parameters could also be included such as
'fulfilled as software' and 'fulfilled as hardware' etc, which are populated when each component
design is generated. An example of a functional element design note is included in appendix A.
3.5 Transfer of data between functional elements
3.5.1 Migration of data across a functional model
The lines between functional elements in a functional model diagram represent the notional flow of
data across individual system components. It is called shared data, as the message is really the
response from an information request from a functional element. Shared data covers both
messages that are transiting the functional model and flags. Figure 24 shows a simple functional
model showing four functional elements. The schedulers are shown with different names but in
practice they may be the same scheduler. Note in this example that there is no significance
between the last letter in the name of the shared data, the last letter in the name of the functional
element and the last letter in the name of the scheduler.
The shared data shown in figure 24 contains data that is recorded in the source functional
element.
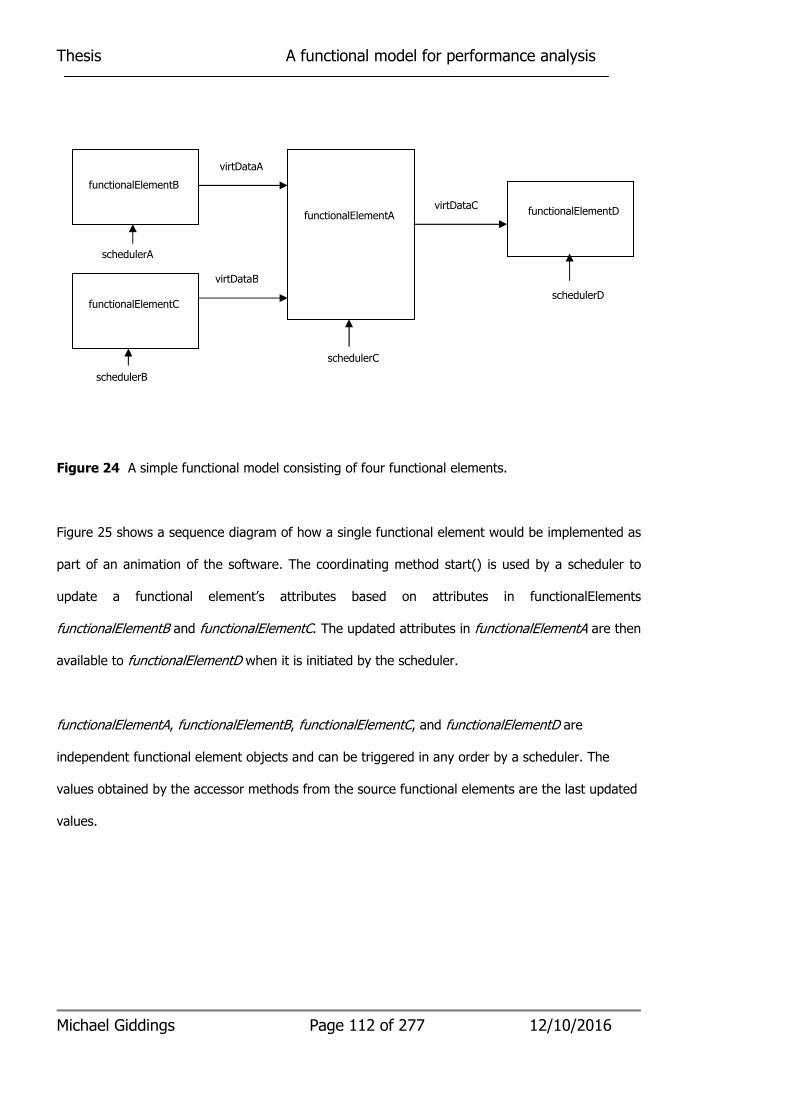
Thesis A functional model for performance analysis
Michael Giddings Page 112 of 277 12/10/2016
Figure 24 A simple functional model consisting of four functional elements.
Figure 25 shows a sequence diagram of how a single functional element would be implemented as
part of an animation of the software. The coordinating method start() is used by a scheduler to
update a functional element’s attributes based on attributes in functionalElements
functionalElementB and functionalElementC. The updated attributes in functionalElementA are then
available to functionalElementD when it is initiated by the scheduler.
functionalElementA, functionalElementB, functionalElementC, and functionalElementD are
independent functional element objects and can be triggered in any order by a scheduler. The
values obtained by the accessor methods from the source functional elements are the last updated
values.
functionalElementB
functionalElementC
functionalElementA functionalElementD
schedulerA
schedulerB
virtDataA
virtDataB
virtDataC
schedulerD
schedulerC

Thesis A functional model for performance analysis
Michael Giddings Page 113 of 277 12/10/2016
Figure 25 A sequence diagram for the operation of start().
3.5.2 Flags
Flags are also passed from functional element to functional element in the same manner as shared
data. They are shown as dashed arrows to emphasize they perform a special function. They are
used to inform a specific functional element to vary its operation and are usually associated with a
specific shared data. Figure 26 shows a version of figure 24, with a flag to indicate that when set
functionalElementA should do something different when it is scheduled to operate.
Figure 26 figure 24 showing an additional flag.
scheduler functionalElementA functionalElementB functionalElementC
Start() getAttributeB
attributeB
getAttributeC
attributeC
Update
Attributes
functionalElementB
functionalElementC
functionalElementA
functionalElementD
schedulerA
schedulerB
virtDataA
virtDataB
virtDataC
schedulerD
schedulerC
Thesis A functional model for performance analysis
Michael Giddings Page 114 of 277 12/10/2016
There are three types of flags used in the functional model.
• Critical flags
• Important flags
• Routine flags
A critical trigger is a flag set by a functional element to notify another element of a critical
condition. The flag is only reset when the receiving element notifies the sender of receipt.
For important flags the source functional element sets a Boolean attribute to true for a number of
iteration cycles. This is long enough to guarantee that the destination functional element detects it.
On completion of these cycles the source functional element sets it Boolean attribute to false.
For routine flags, the source functional element sets a Boolean attribute to true for a number of
iteration cycles less than that guaranteed for the recipient functional element to detect it. This
should be long enough for the destination functional element to detect it. On completion of these
cycles, the source functional element sets its Boolean attribute to false. The consequences of the
destination functional element of missing this flag is not critical.
3.6 Schedulers
3.6.1 Scheduler operation
A scheduler is a mechanism which determines the order in which individual functional elements
operate within a component. The time order can be shown in a table in terms of scheduler
iterations.

Thesis A functional model for performance analysis
Michael Giddings Page 115 of 277 12/10/2016
Each system component is associated with one or more schedulers that schedules groups
functional elements. Each schedulers iteration rate will be different. Even if they are nominally the
same, they will be slightly different as they are not synchronised in any way.
There are many ways that a scheduler table can be constructed. For real-time systems it is
important that the scheduler triggers functional elements in a regular and predicable way. The
scheduler must also allow individual functional elements to be triggered at different rates. An
important benefit is that the behaviour of individual functional elements is not dependent in
changes in the iteration and scheduling patterns.
If a component scheduler transaction table is changed during the system design performance
optimisation, the following effects can occur:
• Nothing
This means that many scheduler transaction table configurations are equivalent.
• Change in performance
This is the most useful change. It means that a system architect can optimise system
component performance without changing its functional elements in any way.
• Change in system behaviour. This is useful for managing system moding
Flags can also command a scheduler table change by sending messages to the scheduler to use a
different scheduler iteration table. This causes different functional elements to be used.
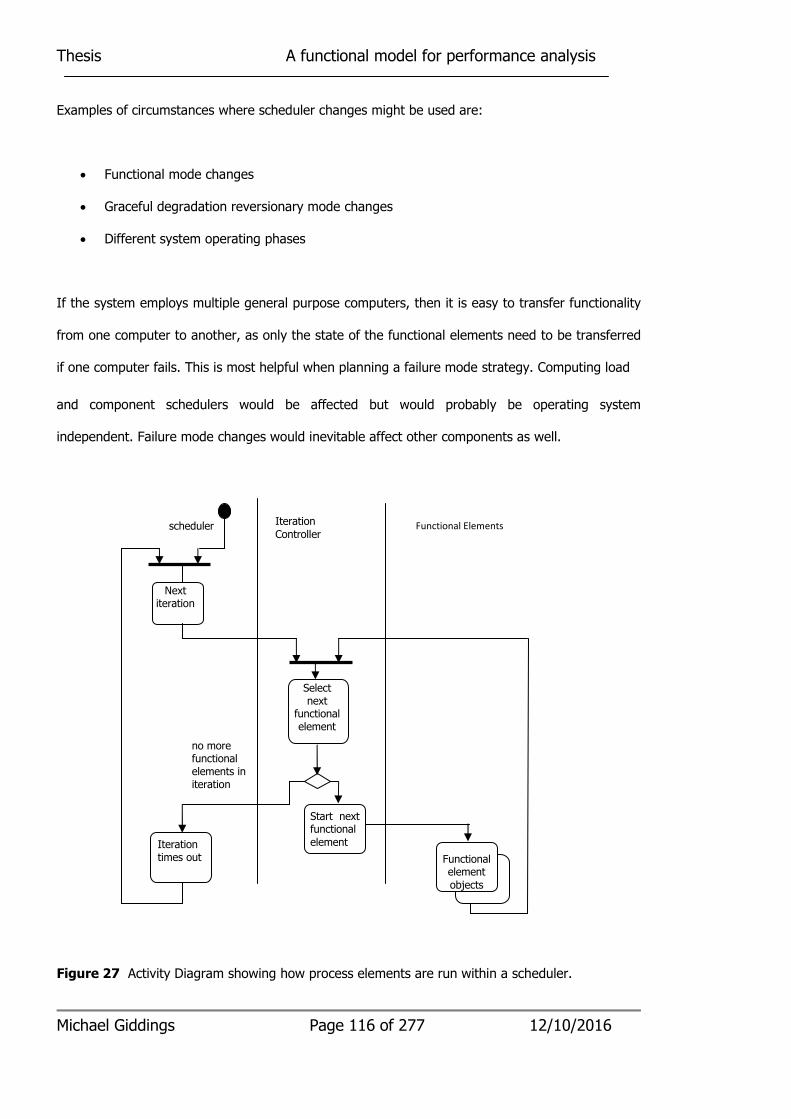
Thesis A functional model for performance analysis
Michael Giddings Page 116 of 277 12/10/2016
Examples of circumstances where scheduler changes might be used are:
• Functional mode changes
• Graceful degradation reversionary mode changes
• Different system operating phases
If the system employs multiple general purpose computers, then it is easy to transfer functionality
from one computer to another, as only the state of the functional elements need to be transferred
if one computer fails. This is most helpful when planning a failure mode strategy. Computing load
and component schedulers would be affected but would probably be operating system
independent. Failure mode changes would inevitable affect other components as well.
Figure 27 Activity Diagram showing how process elements are run within a scheduler.
Iteration
Controller scheduler Functional Elements
Next iteration
Start next functional
element
Select next
functional element
Iteration times out
no more functional elements in iteration
Functional element
objects
Thesis A functional model for performance analysis
Michael Giddings Page 117 of 277 12/10/2016
In an iterating periodic type architecture, implemented functional elements within each system
component are activated in accordance with the activity diagram shown in figure 27. The iteration
controller is used to run the functional elements within each iteration. The scheduler controls each
iteration in turn as defined in the iterator scheduler table. All functional elements are assumed to
exist during operation of the model. In an animated version of the functional model functional
elements would need to be instantiated when first required, run when commanded by the
scheduler and only destroyed when the state of the functional element attributes are no longer
required by other functional elements. The contents of each scheduler transaction table are
determined prior to each scheduler starting. Each scheduler iteration is timed to start on a regular
basis.
When the scheduler starts, each scheduled implemented functional element is extracted and
executed in turn. It is important that all the scheduled functional elements are executed within the
time allocated or an iteration overrun will occur. At the end of the iteration interval the whole
process starts again.
The proposed model is based on a pre-prepared schedule based on the frequency each functional
element needs to run. It is possible to change the pre-prepared iteration table as a response to a
mode change. It is also possible to generate iteration tables on the fly during spare time at the end
part of an iteration.
Typically the contents of each scheduler iteration are determined separately from the operation of
each functional element for a predetermined number of iterations called a major cycle. Major
cycles are repeated on a regular basis. The table is constructed by allocating functional elements to
iterations in accordance with their performance needs and the processor capacity available to each
iteration. The table may then be changed many times before an optimised configuration is
obtained. The structure of the iteration table can be managed independently by a system architect
without detailed knowledge of the implementation of each functional element.

Thesis A functional model for performance analysis
Michael Giddings Page 118 of 277 12/10/2016
3.6.2 Scheduler specification
A scheduler is used to run functional elements in a specific order. The functional elements are
organised into pre-planned scheduler iterations. Iterations invoke a varying number of functional
elements but the total duration of an iteration is fixed. In order to prevent scheduler overruns, the
total time to execute all the functional elements in an iteration must be less that the iteration
interval. If an iteration overflow occurs then some functional elements will not be invoked with
unpredictable results. If the total time to execute the functional elements in an iteration is much
smaller than the iteration interval, then the processor efficiency will be low as there will be no
processing activity during the remainder of the iteration.
A simple iteration together with the expected duration of each functional element is shown below
in table 1. Table 2 shows a number of iterations forming a scheduler major cycle. Each major cycle
is repeated.
Table 1 Example of a single iteration.
Table 2 Tabular representation of the structure of a scheduler’s major cycle consisting of m
iterations.
Functional elements
Estimated duration
Fa Tfa
Fb Tfb
Fc Tfc
.. ..
Fi Tfi
.. ..
Fx Tfx
Total duration TTOT
iteration 1 2 3 4 . . .. m
Duration TTOT1 TTOT2 TTOT3 TTOT4 TTOTm
Thesis A functional model for performance analysis
Michael Giddings Page 119 of 277 12/10/2016
If the iteration table forms a regular pattern during its major cycle, such as that shown in table 9,
the table can be represented by a simple notation based on the rate that the functional elements
are triggered using three parameters for each Functional Element.
The first parameter, R, deals with the frequency of an iteration schedule occurring containing a
particular functional element. The frequency of appearance is defined as the count of iterations
between each appearance. This means that R is 0 for a functional element that appears in every
iteration, or R is 1 if it appears in every other iteration and so on. The term rate number, A, could
also be used as a shorthand representation where
R = 2A-1 - 1
For example, a functional element that appears in every iteration would be a rate 1 functional
element, functional elements that appear in every other iteration would be rate 2 functional
element, functional elements that appear in every fourth iteration would be a rate 3 functional
element and so on.
The second parameter, O, is the number of the iteration in which a functional element first
appears.
The third parameter, S, represents the time between the start of an iteration and the start of the
functional element in that iteration.
If the scheduler does not operate in a regular way then it must be described in full, identifying the
content of each iteration separately.
Thesis A functional model for performance analysis
Michael Giddings Page 120 of 277 12/10/2016
3.6.3 Multiple scheduler tables – dealing with mode changes
Most periodic systems also contain a number of modes where the software behaves in a different
way. For example, if a system could only display one output at a time, then separate scheduler
tables could be used and selected when each display was selected avoiding scheduling functional
elements that do not contribute towards an unused end event.
Scheduler tables can be pre-prepared or constructed during spare scheduler table slots. Scheduler
tables can be swapped in and out, during or at the end of an iteration schedule as appropriate.
3.7 Functional chains
High level requirements are normally expressed in terms of system end events. Each of these end
events is expressly identified within the functional model. Working back from these end events,
using the linked to and linked from information contained in the model specification, all the
independent functional elements associated with that end event can be identified. These functional
elements can be expressed using the same functional model diagram and functional element
specifications. Figure 23 shows an example of a system functional chain. The diagram shows a part
of the functional model for the avionics computer, AVCTS, which can be decomposed into
individual functional elements as shown in figure 22. Analysis of the flags shown in figure 22 can
be used to identify four separate modes. The four modes deal with forward calculation of course to
steer, reverse calculation of course to steer, updating way points and loading way points. The
functional chain for one of these modes, calculation of course to steer in the forward direction
(AVCTSFwd), is shown in figure 28.

Thesis A functional model for performance analysis
Michael Giddings Page 121 of 277 12/10/2016
The functional elements from independent functional chains, can be identified within the scheduler
transaction tables for each system component. This means that the operation of a functional chain
can be examined separately from the rest of the functional model.
Figure 29, a generic function chain linked to an end event vDataK, shows how the functional
elements relate to each other. The accuracy of vDataK may be specified as an end event
requirement. The functional elements and shared data contribute to the accuracy of vDataK.
The up-arrow notation indicates in which system component the functional element resides.
Functional elements that reside in the same system component are usually associated within the
same scheduler. The operation of schedulers in different system components will not be
synchronised.
functionalElementA, functionalElementB, functionalElementC, functionalElementD and
functionalElementE are independent functional elements and can be triggered in any order by a
scheduler.
functionalElementA uses getter methods to obtain vDataA and vDataB from other functional
elements not shown in the diagram, performs some process, and stores the result as attributes.
(functionalElementB, functionalElementC, functionalElementD and functionalElementE operate in a
similar way)
The effects of stochastic and dynamic errors in vDataK are dependent on the order of the
invocation of functional elements functionalElementA, functionalElementB, functionalElementC,
functionalElementD and functionalElementE. Modifications to the scheduler table for component
systemElement can be used to minimise the errors in vDataK.
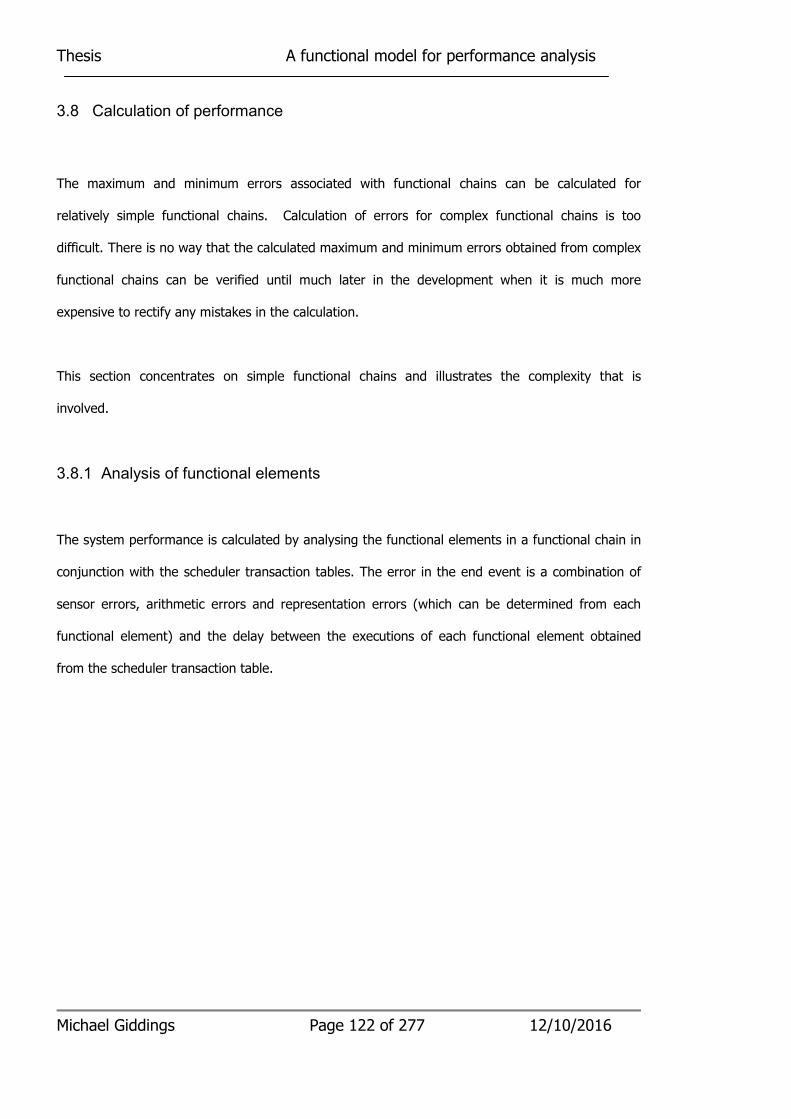
Thesis A functional model for performance analysis
Michael Giddings Page 122 of 277 12/10/2016
3.8 Calculation of performance
The maximum and minimum errors associated with functional chains can be calculated for
relatively simple functional chains. Calculation of errors for complex functional chains is too
difficult. There is no way that the calculated maximum and minimum errors obtained from complex
functional chains can be verified until much later in the development when it is much more
expensive to rectify any mistakes in the calculation.
This section concentrates on simple functional chains and illustrates the complexity that is
involved.
3.8.1 Analysis of functional elements
The system performance is calculated by analysing the functional elements in a functional chain in
conjunction with the scheduler transaction tables. The error in the end event is a combination of
sensor errors, arithmetic errors and representation errors (which can be determined from each
functional element) and the delay between the executions of each functional element obtained
from the scheduler transaction table.
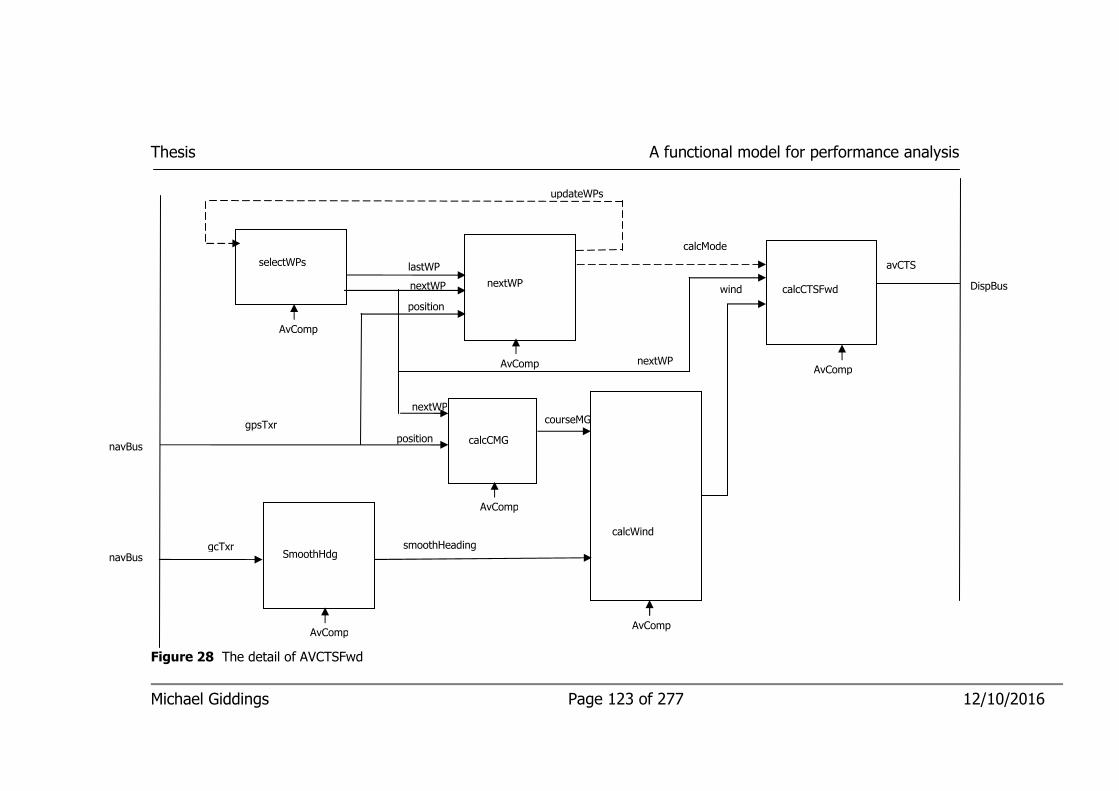
Michael Giddings Page 123 of 277 12/10/2016
Thesis A functional model for performance analysis
Figure 28 The detail of AVCTSFwd
DispBus
position
gcTxr
calcCMG
selectWPs
calcWind
SmoothHdg
nextWP
navBus
navBus
updateWPs
lastWP
nextWP
avCTS
smoothHeading
nextWP
nextWP
position
courseMG
calcCTSFwd
AvComp AvComp
AvComp
AvComp AvComp
AvComp
gpsTxr
wind
calcMode

Thesis A functional model for performance analysis
Figure 29 An example of a functional chain.
Michael Giddings Page 124 of 277 12/10/2016
SystemElement
SystemElement
SystemElement
SystemElement
SystemElement
FunctionalElementA
vDataB
FunctionalElementE
FunctionalElementB
FunctionalElementC
FunctionalElementD
vDataA
vDataD
vDataC
vDataF
vDataE
vDataG
vDataH
vDataI
vDataJ
vDataK

Thesis A functional model for performance analysis
Michael Giddings Page 125 of 277 12/10/2016
The calculation of performance is very complex as the following specific examples illustrate.
Dynamic errors are calculated in three different ways depending on their location within the system
as follows:
• Inputs (Sensors and controls) (Section 3.8.2)
• Internal processing (Sections 3.8.3 and 3.8.4)
• Outputs (Actuators and displays) (Section 3.8.5)
There are three ways that calculated errors can be described:
• Instantaneous output error
This is obtained by manual calculation for single functional and small groups of functional
elements and is described in section 3.8. Manual calculation becomes too difficult for
complex functional chains. The animator described in section 3.9 outputs a sequence of
instantaneous values for the dynamic error. The animator is not limited by the complexity
of the functional chain.
• Statistical description of output errors
The animator also collects statistical data about the sequence of errors generated.
Currently the animator records the minimum, the maximum and the rms dynamic error.
• Maximum and minimum output errors
Minimum and maximum possible dynamic error can be obtained by adding together the
dynamic errors for individual functional elements.
The following analysis focuses on the calculation of instantaneous output errors. It demonstrates
that instantaneous and statistical representation of dynamic errors cannot be easily obtained for
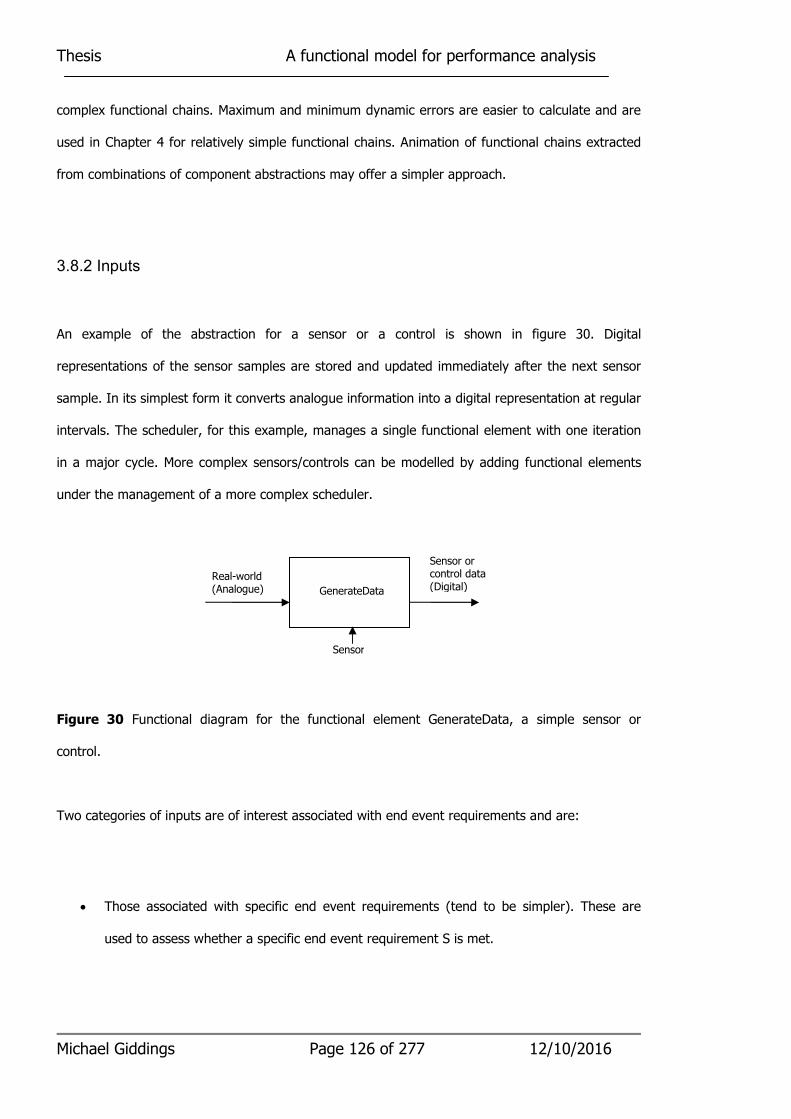
Thesis A functional model for performance analysis
Michael Giddings Page 126 of 277 12/10/2016
complex functional chains. Maximum and minimum dynamic errors are easier to calculate and are
used in Chapter 4 for relatively simple functional chains. Animation of functional chains extracted
from combinations of component abstractions may offer a simpler approach.
3.8.2 Inputs
An example of the abstraction for a sensor or a control is shown in figure 30. Digital
representations of the sensor samples are stored and updated immediately after the next sensor
sample. In its simplest form it converts analogue information into a digital representation at regular
intervals. The scheduler, for this example, manages a single functional element with one iteration
in a major cycle. More complex sensors/controls can be modelled by adding functional elements
under the management of a more complex scheduler.
Figure 30 Functional diagram for the functional element GenerateData, a simple sensor or
control.
Two categories of inputs are of interest associated with end event requirements and are:
• Those associated with specific end event requirements (tend to be simpler). These are
used to assess whether a specific end event requirement S is met.
Real-world (Analogue)
Sensor or control data (Digital) GenerateData
Sensor
Thesis A functional model for performance analysis
Michael Giddings Page 127 of 277 12/10/2016
• Those required to characterise the end event outputs of a functional chain. These are used
to examine the effects of a much wider range of inputs on the end event and are used to
understand the operation of the functional chain in detail.
Samples represent values from the environment at a specific instant. For example, a sensor taking
samples of an environment � every � seconds might be represented as �(�) where � is the
environment’s digital representation and t the time the sample was taken. At time� + ��where
�� < � �(�) remains the same. The digital representation of �(�)is stored and accessed as
required. All information about S between samples is lost.
This is shown diagrammatically in figure 31.
where:
�(�) is a function of time representing the changing value of some quantity in the system's
environment.
� is the time interval between sensor samples
�(�) is the value of � sampled at time �
�� is the difference between the nth and the (n+1) sample i.e. �� − � and is the maximum
error. The minimum error 0 occurs when�� = 0.
� + �� is the time when the value of �(�) is used
� is the difference between (� + ��) and (�) and is the dynamic error at time � + ��
Within the system, only the values stored are known. The function �(�) is only known within the
system for the sampled values. The requirements for end events that rely of this sensor, however,
are usually defined in terms of specific functions of �(�) which, in general, can be analysed using
standard approaches involving simplifications. �(�) can also be expressed as a Taylor series. A
function that is commonly used to express a requirement that relates to dynamic errors may take
the form ��(�)/�� = constant where the value of the constant is known.
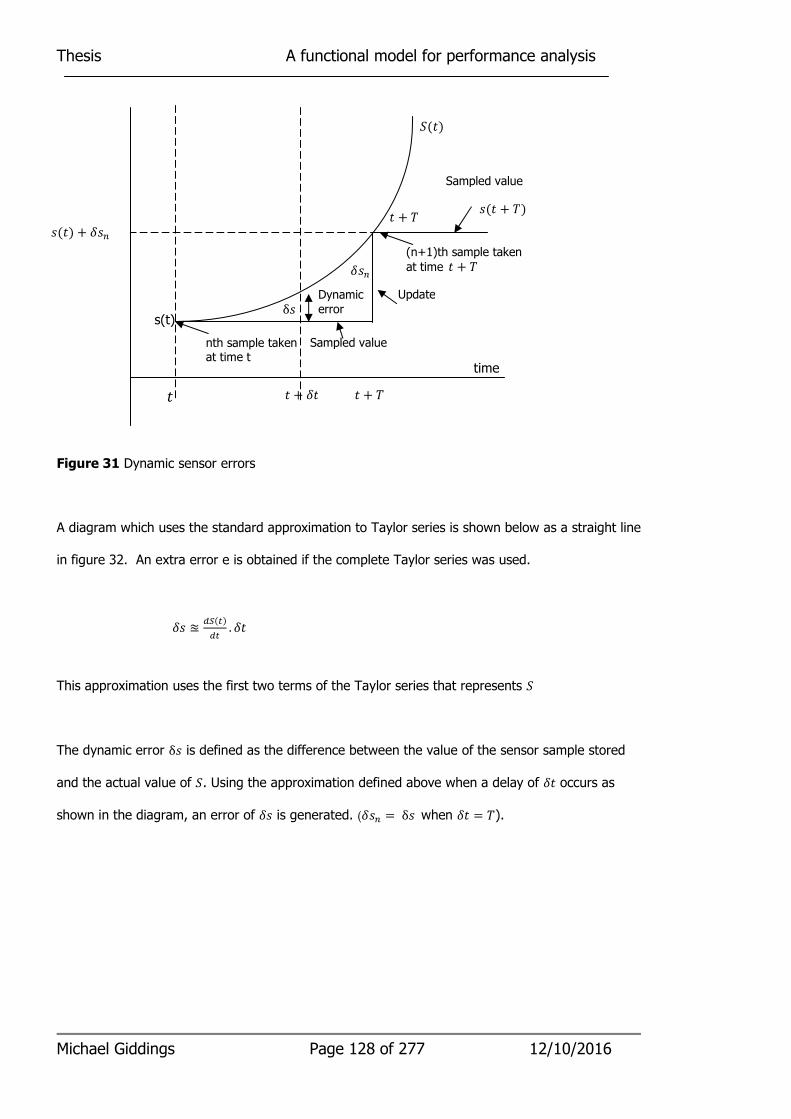
Thesis A functional model for performance analysis
Michael Giddings Page 128 of 277 12/10/2016
Figure 31 Dynamic sensor errors
A diagram which uses the standard approximation to Taylor series is shown below as a straight line
in figure 32. An extra error e is obtained if the complete Taylor series was used.
� ≊ ��(�)
��. ��
This approximation uses the first two terms of the Taylor series that represents �
The dynamic error δ is defined as the difference between the value of the sensor sample stored
and the actual value of �. Using the approximation defined above when a delay of �� occurs as
shown in the diagram, an error of � is generated. (�� = δ when �� = �).
� � + ��
(�) + ��
s(t)
nth sample taken at time t
(n+1)th sample taken
at time � + �
� + �
time
Sampled value
Update
� + �
Sampled value
Dynamic
error
��
δ
(� + �)
�(�)

Thesis A functional model for performance analysis
Michael Giddings Page 129 of 277 12/10/2016
Figure 32 Dynamic sensor error using an approximation
The error can be represented as:
� = (��+��) − (��)
Which can also be expressed as:
� = ��(��)
��. �� + �
where:
error due to further terms in the Taylor series beyond the simplification are
� = ∑ 1
�!∞�=2 #(�)(�)(��)�
� is the dynamic error and �/�� is the slope of the function = #(��)
� has a minimum value of 0 when �� = 0
� has a maximum value of � = ��(��)
��. � + �
+ �
�(�)
Additional error e �
tangent to �(�) at �0 �(�)
�0 �0 + ��
time
��
�(�0)��
. ��

Thesis A functional model for performance analysis
Michael Giddings Page 130 of 277 12/10/2016
As the time that the sensor is accessed is any time between �0 and �0 + � the dynamic error is
usually described as a bounded value.
When �(�) is a linear function � = 0 and
� = ��(��)
��. δt
3.8.3 Single functional element delays Figure 33 shows the operation of a single functional element with a digital input which has been
executed after an interval of �. It also shows another functional element accessing its stored data
�� after it has been executed at time �0 and obtaining the stored value %.
where:
� is the time interval between executing functional elements
�0 + �� is the time when an attribute is accessed
�%� is the change in attribute %� when it is updated at time�0 + �
For functional elements within the same component under the control of the same scheduler, �0 is
fixed and can be derived from the scheduler iteration table, but �0 varies between 0and � for
different components under the control of the different schedulers. This is because the schedulers
of different components are not synchronized.
The dashed line shows the assumption that the value of % varies linearly between the samples at
�0 and �0 + �. This is shown to improve the readability of the diagram but is unlikely to be true.

Thesis A functional model for performance analysis
Michael Giddings Page 131 of 277 12/10/2016
If the assumption is made that the real value of the output changes linearly from % to % + �% with
time, the delay � introduces a dynamic error of �%
�. ��, where a dynamic error is the difference
between the state of an attribute at time �0 + �� and the state of the attribute of the functional
element had just been executed.
Figure 33 Error associated with a single functional element
Figure 34 A single functional element with m inputs and n outputs.
Assumes linear change from
�0 to �0 + �
functional element updates recorded
value of a
�0 + ��
functional element executes and updates attributes
time
Attributes recorded within functional element
Attributes accessed
by other functional elements
Delay δt
Scheduler interval
�0 + �
Dynamic error
%
% + �%
�0
scheduler
a1
a2
a3
s1
am-1
am
s2
s3
sn-1
sn

Thesis A functional model for performance analysis
Michael Giddings Page 132 of 277 12/10/2016
This assumption that the value of % is likely to change linearly between �0 and �0 + � is unlikely to
be true. The functional element in isolation cannot resolve this issue either as it does not have
access to how % varies with time.
Figure 34 shows a functional element with & inputs and � outputs. The effects of the outputs of
this functional element due to a delay of �� can be examined.
The effects on the outputs of a single functional element of data latency on its inputs can be
calculated. The dotted line in figure 33 illustrates the effect of data latency.
As the time that a functional element runs is determined by the scheduler transaction table the
time between when they run is fixed. Hence the errors for & inputs are:
�' = (' . ��' for ' = 1,2, … &
where:
�' is the error in attribute %'
�� is the delay between the source functional element executing and this functional element
accessing its attributes
( is the rate of change of the data source attribute
Effects on the outputs �+ are (for outputs �+ for + = 1,2, . . &)
�+= #+((%1 + �%1), (%2 + �%2), (%3 + �%3) … (%+ + �%+)) − #+(%1, %2, %3 … , %+)
where:
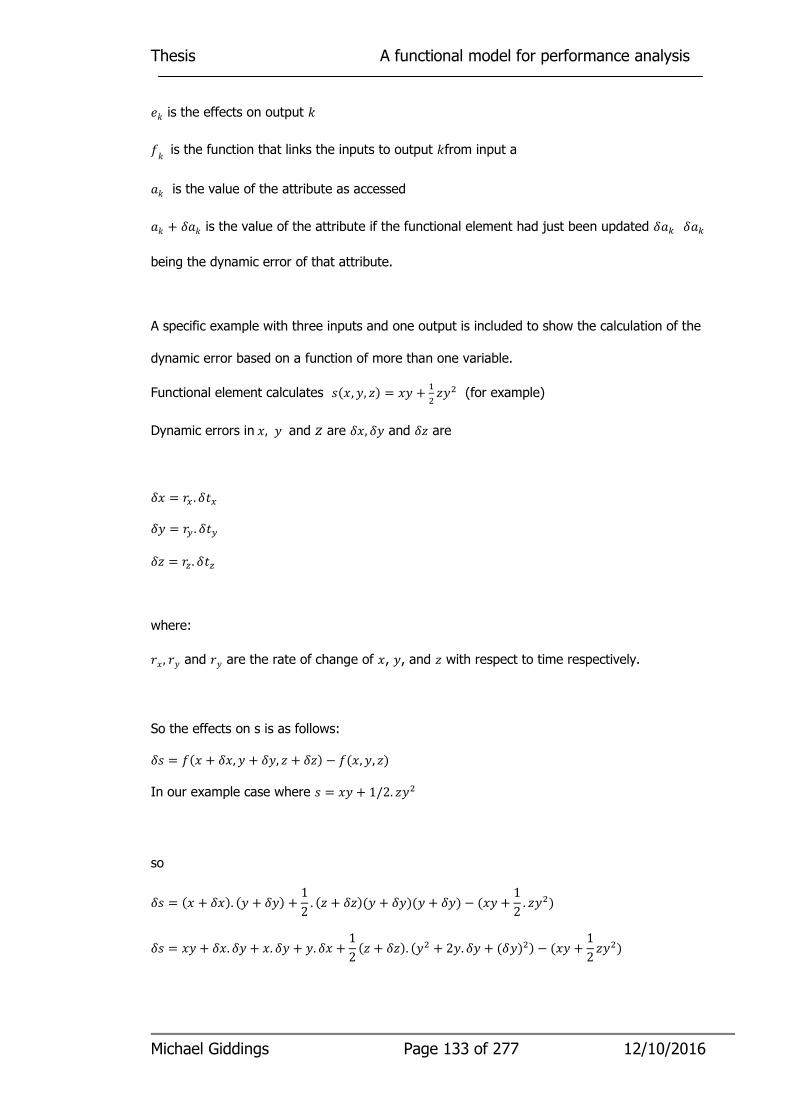
Thesis A functional model for performance analysis
Michael Giddings Page 133 of 277 12/10/2016
�+ is the effects on output +
#+ is the function that links the inputs to output +from input a
%+ is the value of the attribute as accessed
%+ + �%+ is the value of the attribute if the functional element had just been updated �%- �%-
being the dynamic error of that attribute.
A specific example with three inputs and one output is included to show the calculation of the
dynamic error based on a function of more than one variable.
Functional element calculates (., /, 0) = ./ +
10/1 (for example)
Dynamic errors in., / and 0 are �., �/ and �0 are
�. = (2 . ��2
�/ = (3 . ��3
�0 = (4 . ��4
where:
(. , (/ and (/ are the rate of change of ., /, and 0 with respect to time respectively.
So the effects on s is as follows:
� = #(. + �., / + �/, 0 + �0) − #(., /, 0)
In our example case where = ./ + 1/2. 0/1
so
� = (. + �.). (/ + �/) +12
. (0 + �0)(/ + �/)(/ + �/) − (./ +12
. 0/1)
� = ./ + �.. �/ + .. �/ + /. �. +12
(0 + �0). (/1 + 2/. �/ + (�/)1) − (./ +12
0/1)
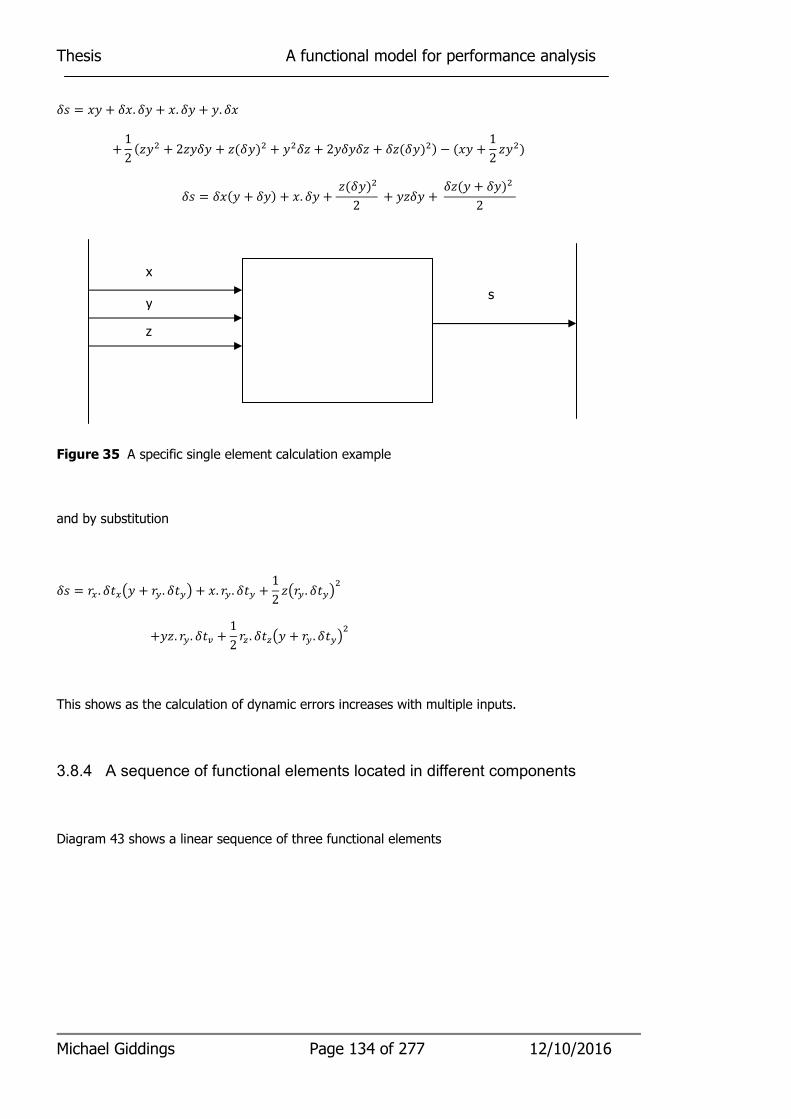
Thesis A functional model for performance analysis
Michael Giddings Page 134 of 277 12/10/2016
� = ./ + �.. �/ + .. �/ + /. �.
+12
(0/1 + 20/�/ + 0(�/)1 + /1�0 + 2/�/�0 + �0(�/)1) − (./ +12
0/1)
� = �.(/ + �/) + .. �/ +0(�/)1
2+ /0�/ +
�0(/ + �/)12
Figure 35 A specific single element calculation example
and by substitution
� = (2 . ��25/ + (3 . ��36 + .. (3 . ��3 +12
05(3 . ��361
+/0. (3 . ��7 +12
(4 . ��45/ + (3 . ��361
This shows as the calculation of dynamic errors increases with multiple inputs.
3.8.4 A sequence of functional elements located in different components
Diagram 43 shows a linear sequence of three functional elements
f(x, y, z)
x
y
z
s
Thesis A functional model for performance analysis
Michael Giddings Page 135 of 277 12/10/2016
Figure 36 A linear sequence of functional elements.
A sequence of three functional elements at some point within a functional chain under the control of
different schedulers can be analysed.
where:
8�represents the nth scheduler
%� represents data input to functional element #�
#� represents the �th functional element’s effect on its input
Errors can be calculated as follows for (� + 1)th sequential functional elements shown in figure 36.
%�+1 = #�(%� + �%�)
�%�� = #�(%� + �%�) − #�(%�)
The output can therefore be related to the input as follows:
%�+3 = #�+2(#�+15#�(%� + �%�) + �%�+16 + �%�+2)
For the more complex functional chains shown in figure 37
91 = #1(%1 + �%1, %2 + �%2, %3 + �%3,,….,%� + �%�)
92 = #2(:1 + �:1, :2 + �:2, :3 + �:3,,….,:� + �:�)
#�
%� %�+1 %�+2
8� 8�+1
#�+1
8�+2
#�+2
%�+3

Thesis A functional model for performance analysis
Michael Giddings Page 136 of 277 12/10/2016
Figure 37 A compound connection of functional elements
= #;(9 + �9 , 91 + �91)
�91 = #1(%1 + �%1, %2 + �%2, %3 + �%3,,….,%� + �%�) - #1(%1, %2, %3 … %�)
�92 = #2(:1 + �:1, :2 + �:2, :3 + �:3,,….,:� + �:�) - #1(:1, :2, :3 … :�)
� = #3(91 + �91, 92 + �92) − #1(91, 92)
Typically functional chains contain many functional elements making calculation prohibitively
complex. If, for example, the functional chain represents a close loop process control system then
the calculation becomes even more complex. In order to make this analysis possible a computer
model that is automatically generated from the functional model database is required. Even if it
was possible to calculate the errors involved, it would not be practical to repeat a calculation every
time a change is introduced.
%1%2
.
%��
:1 :2
:�
91
92
#1(%1, %2, … %�)
#2(:1, :2, … :�)
#3(91, 92)81
82
83

Thesis A functional model for performance analysis
Michael Giddings Page 137 of 277 12/10/2016
3.8.5 Actuators and displays
The effects of data latency on actuators and displays can be represented by a single function end
event abstraction associated with its own scheduler. Unlike other functional elements its output is
an analogue real-world effect. Figure 38 shows part of the end event functional chain.
Figure 38 A functional end event element converting end of event data into a real-world effect.
3.9 Animation of the model
An animation of the model is a computer program which executes functional elements in a
functional chain in accordance with the appropriate schedulers associated with a real-world model
which provides the inputs and some means of recording the output or intermediate data
generated. The data recorded represents actual errors rather than the maximum and minimum
error values obtained from calculation. The output of the animation represents instantaneous
output data and errors for complex functional chains not available using the methods described in
Section 3.8.1.
The behaviour of the system can be animated using a computer program automatically generated
from information contained in the functional model. The animation can be connected to an input
Actuator/Display
Real-world Effects
EndEventData Effect of system end event on
the real-world
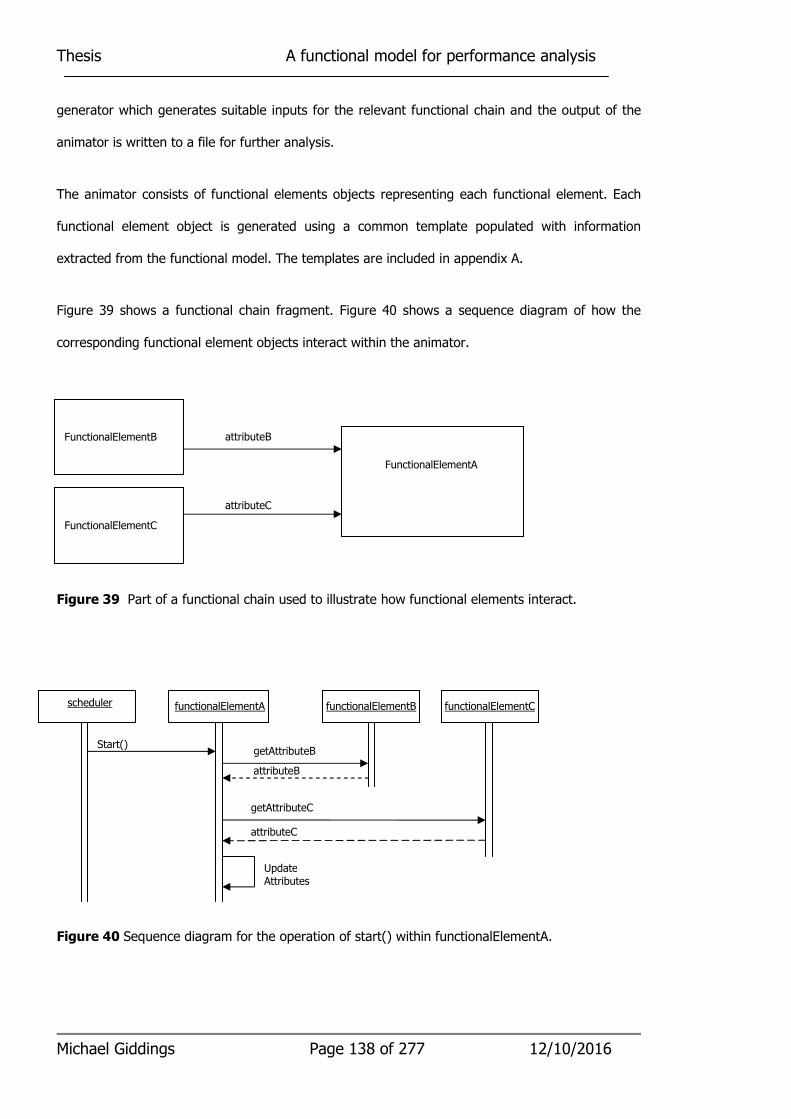
Thesis A functional model for performance analysis
Michael Giddings Page 138 of 277 12/10/2016
generator which generates suitable inputs for the relevant functional chain and the output of the
animator is written to a file for further analysis.
The animator consists of functional elements objects representing each functional element. Each
functional element object is generated using a common template populated with information
extracted from the functional model. The templates are included in appendix A.
Figure 39 shows a functional chain fragment. Figure 40 shows a sequence diagram of how the
corresponding functional element objects interact within the animator.
Figure 39 Part of a functional chain used to illustrate how functional elements interact.
Figure 40 Sequence diagram for the operation of start() within functionalElementA.
FunctionalElementA
FunctionalElementB
FunctionalElementC
attributeB
attributeC
scheduler functionalElementA functionalElementB functionalElementC
Start() getAttributeB
attributeB
getAttributeC
attributeC
Update Attributes

Thesis A functional model for performance analysis
Michael Giddings Page 139 of 277 12/10/2016
The model schedulers also contains information to generate scheduler class definitions for each
scheduler. Scheduler objects are then instantiated from specialised scheduler classes of an abstract
class Scheduler.
A program that animates a functional chain has been developed and described in the second and
third investigations in Sections 4.4 and 4.5, which provides a simulation of the function and
performance of a functional end event. The functional chain can also be split into parts and
animated for each system component. This animation can then be used in addition to the
contractual specification and interface control document as a set of requirements to the component
developer organisation. If the component developer implements the component software using
similar process elements and scheduler transaction table then the animator will accurately predict
the final component performance.
The animator is an implementation of the system functional model, in the same way that individual
component implementations represent the part functional models for each component. Component
software may be implemented using the same software architecture as the animator. In order to
differentiate between a functional element in the functional model and an implemented functional
element in the animation or component implementations, the implemented function elements have
been called process elements. The term ‘process element’ is not related to processing and non-
processing components which are used to describe components.
Table 3 compares the information recorded in the process elements objects within the animator
program with the information contained within the proposed functional model.
Furthermore, the animator defines an input model that generates real-world model inputs and an
output data model to collect end event data that are not present in the functional model. The
results can be stored in an output data file and can be used to simulate the effects of the animator
on a user interface model.
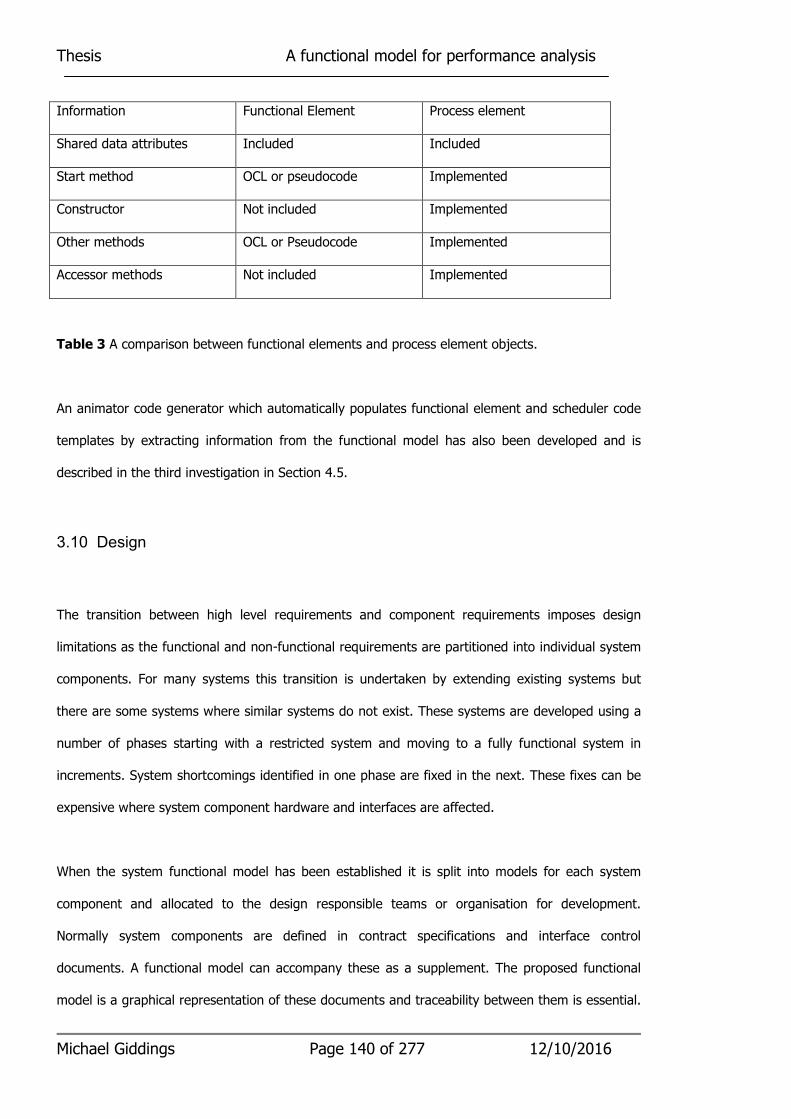
Thesis A functional model for performance analysis
Michael Giddings Page 140 of 277 12/10/2016
Information Functional Element Process element
Shared data attributes Included Included
Start method OCL or pseudocode Implemented
Constructor Not included Implemented
Other methods OCL or Pseudocode Implemented
Accessor methods Not included Implemented
Table 3 A comparison between functional elements and process element objects.
An animator code generator which automatically populates functional element and scheduler code
templates by extracting information from the functional model has also been developed and is
described in the third investigation in Section 4.5.
3.10 Design
The transition between high level requirements and component requirements imposes design
limitations as the functional and non-functional requirements are partitioned into individual system
components. For many systems this transition is undertaken by extending existing systems but
there are some systems where similar systems do not exist. These systems are developed using a
number of phases starting with a restricted system and moving to a fully functional system in
increments. System shortcomings identified in one phase are fixed in the next. These fixes can be
expensive where system component hardware and interfaces are affected.
When the system functional model has been established it is split into models for each system
component and allocated to the design responsible teams or organisation for development.
Normally system components are defined in contract specifications and interface control
documents. A functional model can accompany these as a supplement. The proposed functional
model is a graphical representation of these documents and traceability between them is essential.
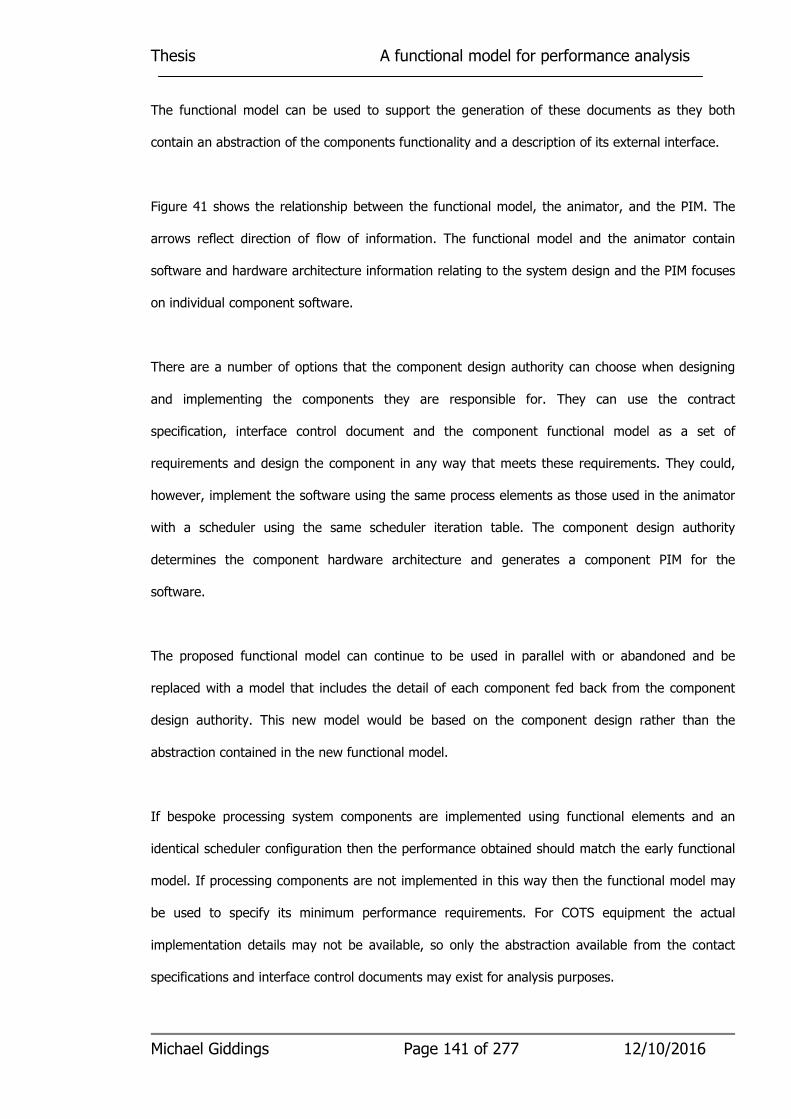
Thesis A functional model for performance analysis
Michael Giddings Page 141 of 277 12/10/2016
The functional model can be used to support the generation of these documents as they both
contain an abstraction of the components functionality and a description of its external interface.
Figure 41 shows the relationship between the functional model, the animator, and the PIM. The
arrows reflect direction of flow of information. The functional model and the animator contain
software and hardware architecture information relating to the system design and the PIM focuses
on individual component software.
There are a number of options that the component design authority can choose when designing
and implementing the components they are responsible for. They can use the contract
specification, interface control document and the component functional model as a set of
requirements and design the component in any way that meets these requirements. They could,
however, implement the software using the same process elements as those used in the animator
with a scheduler using the same scheduler iteration table. The component design authority
determines the component hardware architecture and generates a component PIM for the
software.
The proposed functional model can continue to be used in parallel with or abandoned and be
replaced with a model that includes the detail of each component fed back from the component
design authority. This new model would be based on the component design rather than the
abstraction contained in the new functional model.
If bespoke processing system components are implemented using functional elements and an
identical scheduler configuration then the performance obtained should match the early functional
model. If processing components are not implemented in this way then the functional model may
be used to specify its minimum performance requirements. For COTS equipment the actual
implementation details may not be available, so only the abstraction available from the contact
specifications and interface control documents may exist for analysis purposes.
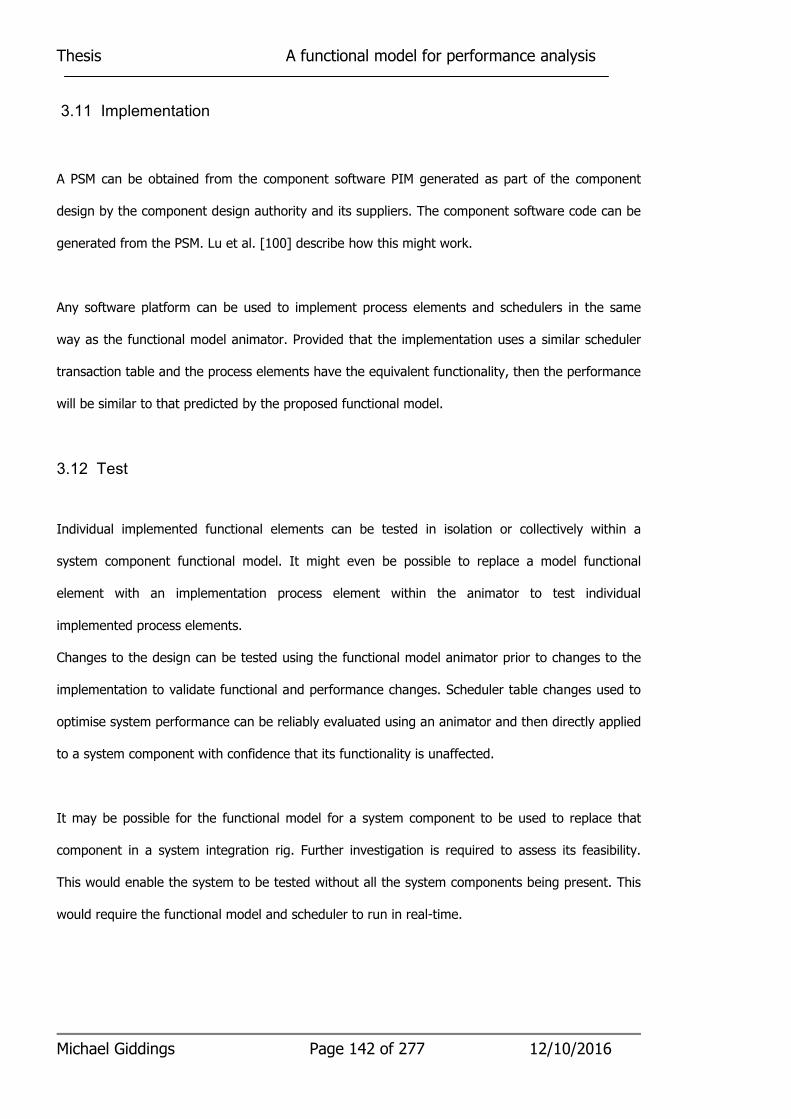
Thesis A functional model for performance analysis
Michael Giddings Page 142 of 277 12/10/2016
3.11 Implementation
A PSM can be obtained from the component software PIM generated as part of the component
design by the component design authority and its suppliers. The component software code can be
generated from the PSM. Lu et al. [100] describe how this might work.
Any software platform can be used to implement process elements and schedulers in the same
way as the functional model animator. Provided that the implementation uses a similar scheduler
transaction table and the process elements have the equivalent functionality, then the performance
will be similar to that predicted by the proposed functional model.
3.12 Test
Individual implemented functional elements can be tested in isolation or collectively within a
system component functional model. It might even be possible to replace a model functional
element with an implementation process element within the animator to test individual
implemented process elements.
Changes to the design can be tested using the functional model animator prior to changes to the
implementation to validate functional and performance changes. Scheduler table changes used to
optimise system performance can be reliably evaluated using an animator and then directly applied
to a system component with confidence that its functionality is unaffected.
It may be possible for the functional model for a system component to be used to replace that
component in a system integration rig. Further investigation is required to assess its feasibility.
This would enable the system to be tested without all the system components being present. This
would require the functional model and scheduler to run in real-time.
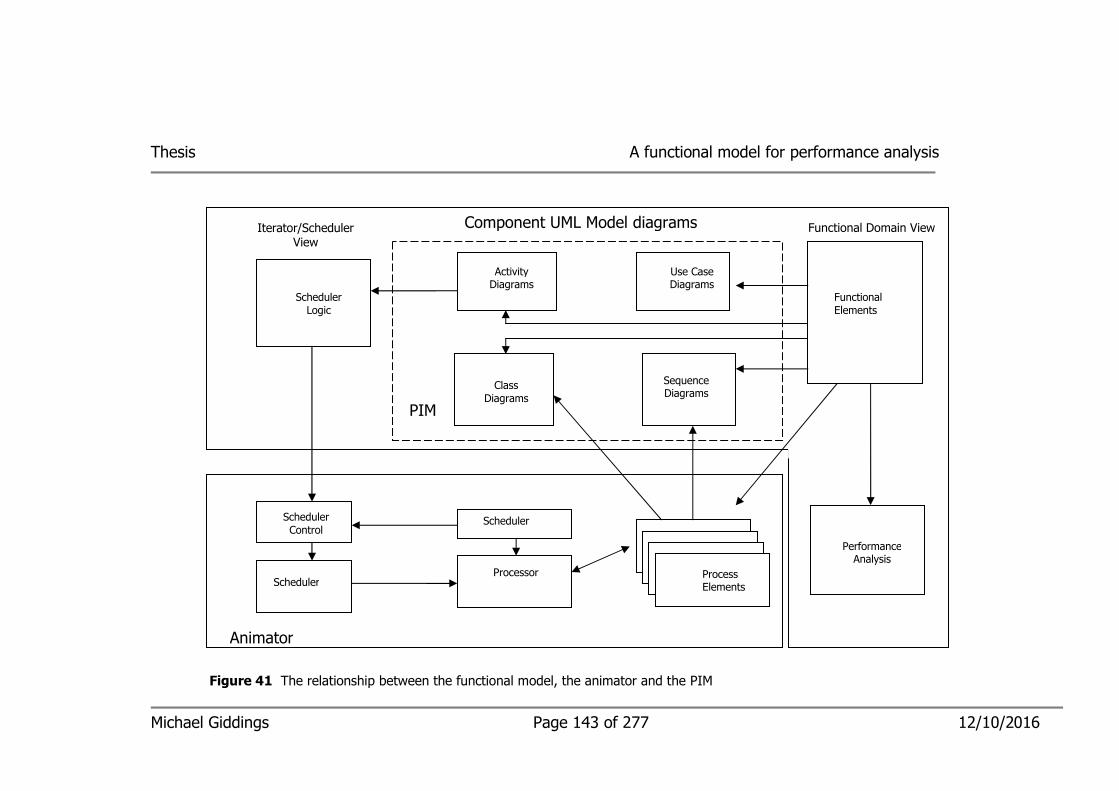
Michael Giddings Page 143 of 277 12/10/2016
Thesis A functional model for performance analysis
Figure 41 The relationship between the functional model, the animator and the PIM
Functional Domain View
Class
Diagrams
Activity Diagrams
Sequence Diagrams
Functional
Elements
Use Case Diagrams
Component UML Model diagrams
Scheduler
Control
Scheduler
Scheduler
Processor Process Elements
Scheduler
Logic
Iterator/Scheduler View
PIM
Performance Analysis
Animator
Thesis A functional model for performance analysis
Michael Giddings Page 144 of 277 12/10/2016
3.13 Management of Performance using a functional model
There are several issues that affect system performance that need to be considered during the
early system design phase when using the functional model:
• Quality of the source data from the sensors
• Resolution of the display or precision of the actuator/control
• Data quantisation
• Computation accuracy
• How often the scheduler schedules a functional element (assuming that the maximum rate
is once per iteration)
• Making sure all the functional elements that are required to run in a single iteration fit into
the iteration interval (taking into account the scheduler overhead).
The performance can be managed by two separate teams: the system architect and the functional
element definer.
The role of the Systems Architect is:
• Establish a model of the overall systems in terms of schedulers.
• Determine which functional elements will be used in each iteration.
• Established a budget for the execution duration for each implemented functional element
to make sure iteration overruns are avoided.
• Determine the accuracy of any calculations used.
• Determine the errors introduced by quantisation.
• Determine the errors introduced by delays within the system either by calculation or by
using the animator.
• Optimise the model to ensure the overall performance requirements are met.
• Modify the system to cope with changing requirements.
Thesis A functional model for performance analysis
Michael Giddings Page 145 of 277 12/10/2016
• Reallocate performance requirements in the event that a component design authority
cannot meet existing contract specification and interface control document requirements.
The role of the functional element definer is to:
• Identify and define each independent functional element.
• Ensure that each process element executes with its time budget.
• Ensure that the implemented scheduler operates within a specific overhead requirement.
The two advantages of this approach, is that firstly, functional element definers do not have to
understand how the whole system is implemented to define a functional element, and secondly,
the systems architects do not have to understand the internal workings of each functional element
to define and refine the scheduler transaction table. The main disadvantage is the extra work
involved.
3.14 Summary
The proposed model provides a simple graphical representation for system components that can
be combined to form a system wide functional representation of the information required by the
system design authority to select component design authorities and suppliers. It can be used early
in the design process before component design is started. It separates each processing and non-
processing component into a number of independent functional elements and a separate schedule
which orders the operation of the functional elements. Adjustments to the schedule can be made
independently from the specification of functional elements. The model includes a functional
representation of the behaviour included in component contract specifications and a definition of
the external interfaces and communications between components.
The model offers the potential for animator code to be automatically generated .

Thesis A functional model for performance analysis
Michael Giddings Page 146 of 277 12/10/2016

Thesis Investigation of the proposed functional model
Michael Giddings Page 147 of 277 12/10/2016
Chapter 4 Investigation of the proposed functional model
4.1 Introduction
Three investigations examine the usefulness and validity of the model described in Chapter 3, to
see whether the proposed functional model could be used to manage the transition between an
outline architecture independent set of requirements and a functional and performance
specification for each system component. An overview of the three investigations is shown in
figure 4.
All three investigations use the proposed functional model and consider static, stochastic and
dynamic errors but concentrate on dynamic errors.
A main theme of the investigations is the comparison between performance assessments both with
and without the functional model proposed in Chapter 3.
Chapter 5 contains a summary of the outcomes of these investigations.
4.2 Purpose of investigations
The purpose of the investigations is to examine in practice whether a functional model as proposed
in Chapter 3 could be used to specify functional and performance requirements, prior to the
detailed design of the design for system components. Each investigation compares the transition
between a top-level set of requirements and an architectural specific system component design
with and without a functional model.
The investigations address a functional representation of real-time systems and various available
ways to assess performance.

Thesis Investigation of the proposed functional model
Michael Giddings Page 148 of 277 12/10/2016
Specifically the investigations are chosen to establish:
• whether the functional model could be used to specify functional requirements prior to the
detailed design of individual system components in a real-time distributed system.
• whether the functional model could be used to calculate system performance prior to the
detailed design of its system components.
• whether there was any way the performance can be modelled using a computer program.
• whether there are any other potential advantages and disadvantages that require further
investigation.
The following issues are related to the research question but were not considered by the
investigations:
• whether there was any financial advantage of a functional model. This was not considered
and is identified as future work in Section 6.4.
• a fully functioning performance animator was not developed.
• whether non functional requirements other than performance can be added to the
functional model data base and allocated to functional elements within specific functional
chains.
4.2.1 Overview of investigations
The first investigation deals with a single processing component and is used to establish how an
abstraction can be represented by a functional model and an associated scheduler. The concept of
a functional element and how functional elements communicate is investigated. The principle of
functional chains and their extraction from functional diagrams is established. The assessment of
suitability of an initial system architectures for a simple weather station is undertaken with and
without the proposed approach to see its potential advantages and disadvantages.

Thesis Investigation of the proposed functional model
Michael Giddings Page 149 of 277 12/10/2016
Table 4 Overview of investigations.
Purpose Investigation/system Feature
Examination of functional
model diagram
1
Weather station
Functional model
Allocation of
requirements to system
components
1
Weather station
Hardware Architecture
Dynamic aspects of
functional model
1
Weather station
Component scheduler
Functional elements that
contribute to an end
event.
1
Weather station
Functional chains
Simplification of
functional chains
1
Weather station
Functional chain analysis
Shared Data 1
Weather station
communication between
functional elements
comparison 1
Weather station
With/without functional
model
Combined component
functional models
2
Flight control system –
display of gyro compass
data
Multiple component functional
chains
Prototyping 2
Flight control system–
display of gyro compass
data
Animator
comparison 2
Flight control system–
display of gyro compass
data
With/without functional
model
Prototyping 3
Flight control system
Automatic generation of
animator code
comparison 3
Flight control system –
course to steer data
With/without functional
model

Thesis Investigation of the proposed functional model
Michael Giddings Page 150 of 277 12/10/2016
The second investigation extends the principles shown in the first investigation to a system
comprising multiple, distributed processing and non-processing elements. It is also used to
demonstrate the propagation and analysis of errors. A basic model animator is developed to
analyse stochastic and dynamic errors.
The third investigation extends the second investigation to include more complex functional models
at the component level. It examines open and closed loop processing and how animation code can
be automatically generated from the model. The basic animator is extended to use functional
element and scheduler objects, collect statistical data about the output and to display the
maximum calculated error. The functional chain from the second investigation is used to enable
comparison of the animators for the third investigation.
4.2.2 Research methodology
The research reported in this thesis was undertaken on an exploratory basis. The literature survey
identified problems associated with performance analysis of real-time systems prior to hardware
component procurement for real-time systems. The problems were caused by the early system
design being designed using previous experience on a ‘fix-it-later’ basis. Analysis of modelling
opportunities suggested the potential usefulness of a model based on the combination of
abstractions which represent individual processing and non-processing system components.
The research consists of three investigations. Each investigation consists of a well specified
research question which identifies a number of aspects of the proposed additional functional model
to be examined. After each investigation, the results were analysed to determine how best the
model should operate. A real-time system was chosen for the context of each investigation on the
basis of previous experience. Each chosen real-time system consisted of an existing simplified
real-time system.

Thesis Investigation of the proposed functional model
Michael Giddings Page 151 of 277 12/10/2016
Only relatively simple systems were used as examples. In practice the systems most likely to
benefit are much larger. Although the model appears to be extensible further work, is required
alongside a real large system development.
The choice of hardware architectures was not unrealistic with the exception of the dual wind
direction hardware architecture change which was introduced so a change to the hardware design
was necessary.
This approach has certain limitations. The systems investigated are typical real-time systems
which operate in a periodic manner and the conclusions that were drawn are limited to this type of
system. The additional model may apply to other types of system but they were not assessed.
The choice of end event requirements was not unrealistic but chosen to fit the analysis. For
example, the initial design of the wind direction functional chain for the weather station in the first
investigation would not support the wind direction requirement and would require a hardware
change. All other end event requirements were chosen so that no rework was required.
Some of the conclusions drawn were predicted from the outset, some were discovered during the
investigative process. No aspects of modelling process were assumed.
No attempt was made to investigate the effects of multiple stakeholders other than to note that
multiple stakeholders were a contributory cause of performance issues.
4.3 First Investigation
4.3.1 Introduction
The first investigation uses a functional model for a simple weather station comprising a single
processing element, some sensors and a display. It compares the transition between a set of top

Thesis Investigation of the proposed functional model
Michael Giddings Page 152 of 277 12/10/2016
level requirements and an architecture specific system component design, with and without a
functional model.
4.3.2 Investigation aims
The aims of the first investigation are as follows:
• To determine how the transition between a set of outline requirements and system
component specification would be undertaken without a functional model
• To investigate how the transition between a set of outline requirements and a system
component specification would be undertaken with a functional model
• To assess whether the weather station could be represented by independent functional
elements
• To determine how a functional model could be represented
• To assess how a scheduler might operate and be represented
• To investigate how combinations of functional elements might be analysed
• To decide how the independent functional elements could be individually implemented
• To decide how the individual functional elements could be combined into a working
functional system
The system investigated has been chosen to illustrate the use of the proposed functional model
within a single processing component. Not all aspects of the research question were investigated -
later investigations examine multi-component systems and functional chain animation. The
requirements for this system are also illustrative. The system was chosen because it contained
several end events and could be designed using as periodic system with a single mode. The
requirements were chosen so that a change to the initial design is required so that performance
requirements could be met. The design decisions that have been adopted are also not meant to be
realistic. Care has been taken not to draw conclusions beyond the scope of the system chosen.

Thesis Investigation of the proposed functional model
Michael Giddings Page 153 of 277 12/10/2016
4.3.3 System design without a functional model
This section considers the performance calculations that might be undertaken prior to the selection
of components.
4.3.3.1 Selection of a system hardware architecture
The system hardware architecture chosen is typical of a simple weather station system and links a
number of sensors to a common display. The main processing component is represented by a
single abstraction. The abstraction consists of a number of functional chains. The revised hardware
architecture introduced in Section 4.3.3.3.2 to overcome the performance shortfall in the display
wind direction functional chain would not be used in practice but was chosen so that a change to
the functional chain was introduced. Other solutions to the problem such as increasing the
resolution of the A to D converter are much more typical. The use of a dual direction sensor is,
however, commonly used in the azimuth direction sensors of naval guns.
The selection of a system hardware architecture without a functional model is undertaken on a
‘previous experience basis’ from the system requirements definition. In this example the system
consists of a single processing component linked to a number of analogue sensors and a display.
This means that the only real issue is the selection of the sensors before the processing
component starts.
The investigation starts with an outline customer requirement for a basic weather station. This
consists of a textual overview of the functional operation and performance requirements associated
with functional end events. These performance requirements would be determined by modelling
the system real-world interfaces independently of how it was going to be implemented. Table 5
shows the list of functional end events that define the performance requirements that will be used
in this investigation. Table 6 shows the performance requirements for each functional end event
defined in table 5. The system can be drawn diagrammatically as shown in figure 42.

Thesis Investigation of the proposed functional model
Michael Giddings Page 154 of 277 12/10/2016
Whilst the end event performance requirements included in table 6 are entirely arbitrary, they have
been chosen so that the system hardware would support all but the DisplayWindDirection end
event requirement.
The following analysis of the development of a design without a functional model is an ad-hoc
calculation for comparison purposes. It does not use any part of the proposed model described in
Chapter 3.
4.3.3.2 Allocation of functional requirements.
The first stage of the development of the system design consists of the allocation of functional
requirements into a number of system components. Figure 43 shows the system architecture that
was proposed specified using SysML.
From inspection of the proposed system architecture, the functionality allocated to each system
component has a special and unique purpose.
Table 5 List of functional end events for the weather station.
Functional end events
Name
Functional requirement
SenseWindDirection Sense wind direction in the horizontal plane
SenseWindSpeed Sense wind speed in the horizontal plane
SenseTemperature Sense air temperature
SensePressure Sense air pressure
CalculateParameters Calculate parameters for display
DisplayParameters Display wind direction, air temperature and speed
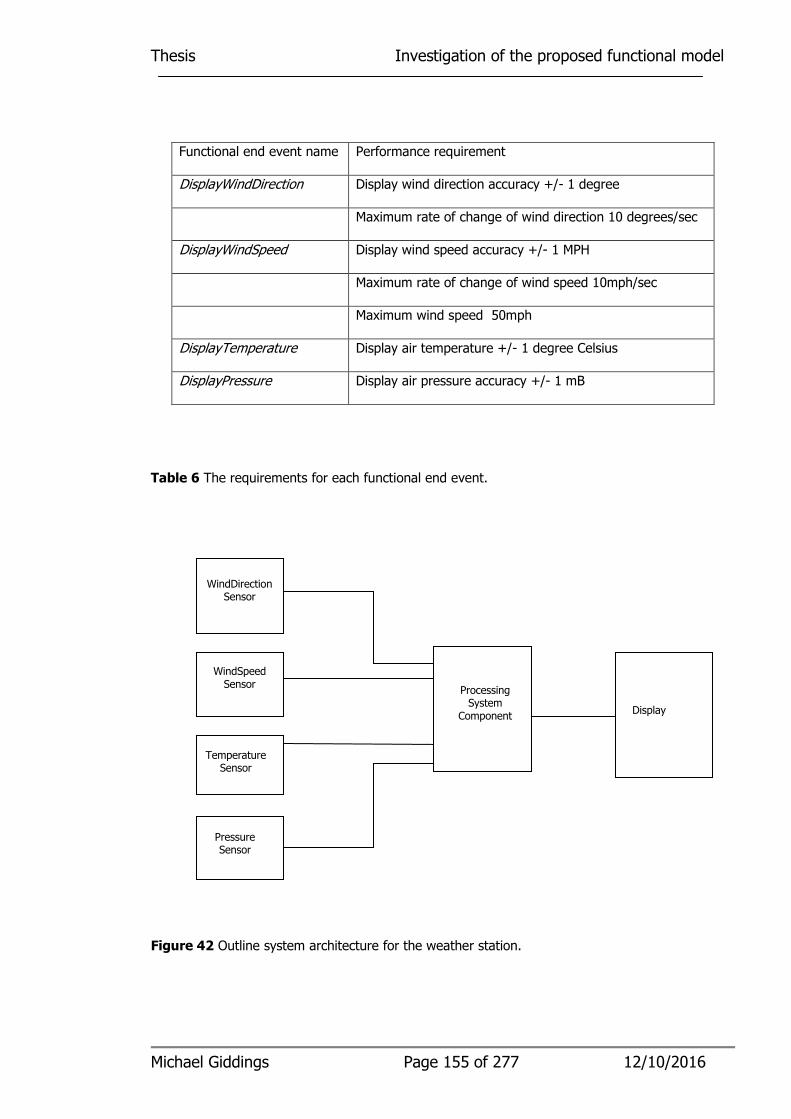
Thesis Investigation of the proposed functional model
Michael Giddings Page 155 of 277 12/10/2016
Table 6 The requirements for each functional end event.
Figure 42 Outline system architecture for the weather station.
Functional end event name Performance requirement
DisplayWindDirection Display wind direction accuracy +/- 1 degree
Maximum rate of change of wind direction 10 degrees/sec
DisplayWindSpeed Display wind speed accuracy +/- 1 MPH
Maximum rate of change of wind speed 10mph/sec
Maximum wind speed 50mph
DisplayTemperature Display air temperature +/- 1 degree Celsius
DisplayPressure Display air pressure accuracy +/- 1 mB
Display
WindDirection Sensor
WindSpeed Sensor
Temperature Sensor
Pressure Sensor
Processing System
Component

Thesis Investigation of the proposed functional model
Michael Giddings Page 156 of 277 12/10/2016
4.3.3.3. Performance Calculation
As the system architecture is simple, the following initial calculations can be made. The initial
system components performance allocation has been chosen so that all dynamic errors are
generated by the weather station computer component.
4.3.3.3.1 Initial system design
Wind direction sensor
End event – DisplayWindDirection
• Wind direction sensor errors assumed to be +/- 0.3 degrees
• Wind direction sensors sometimes gives occasional erroneous outputs so filtering is required
• A to D converters work at 20 Hz and are 8 bit
• Processor executes a simple periodic type software process that iterates every 20ms
• Display updates every 20ms
• Maximum rate of change of wind direction is 10 degrees per second
• Wind direction range 0 degrees – 360 degrees
This means the quantisation error = 360/28 = 1.4 degrees
So an analysis of the three different types of error produces the following results:
• Static error
Assumed to be mechanically or software adjusted to 0.
• Stochastic error
Assumed to be made up of quantisation errors and sensor errors:

Thesis Investigation of the proposed functional model
Michael Giddings Page 157 of 277 12/10/2016
Error range is combination of +/- 0.7 and +/- 0.3 degrees respectively. This makes a total
of +/- 1.0 degrees plus occasional invalid outputs.
• Dynamic errors
Maximum delay = 60ms plus the effects of the filter (unknown at this stage)
Rate of change of input 10 degrees per second.
Maximum instantaneous error = 60* 10/1000 = 0.6 degrees.
This gives a maximum instantaneous error of 1.2 + 0.6 = 1.8 degrees and fails the accuracy
requirement DisplayWindDirection.
Wind speed sensor
End event – DisplayWindSpeed
• Wind speed sensor errors assumed to be +/- 0.1 mph.
• A to D converters work at 20 Hz and are 8 bit.
• Processor executes a simple periodic type software process that iterates every 20ms.
• Display updates every 20ms.
• Maximum rate of change of wind speed is 10 degrees per second.
• Wind speed range 0 mph – 50 mph.
This means the quantisation error = 50/28 = 0.2 mph.
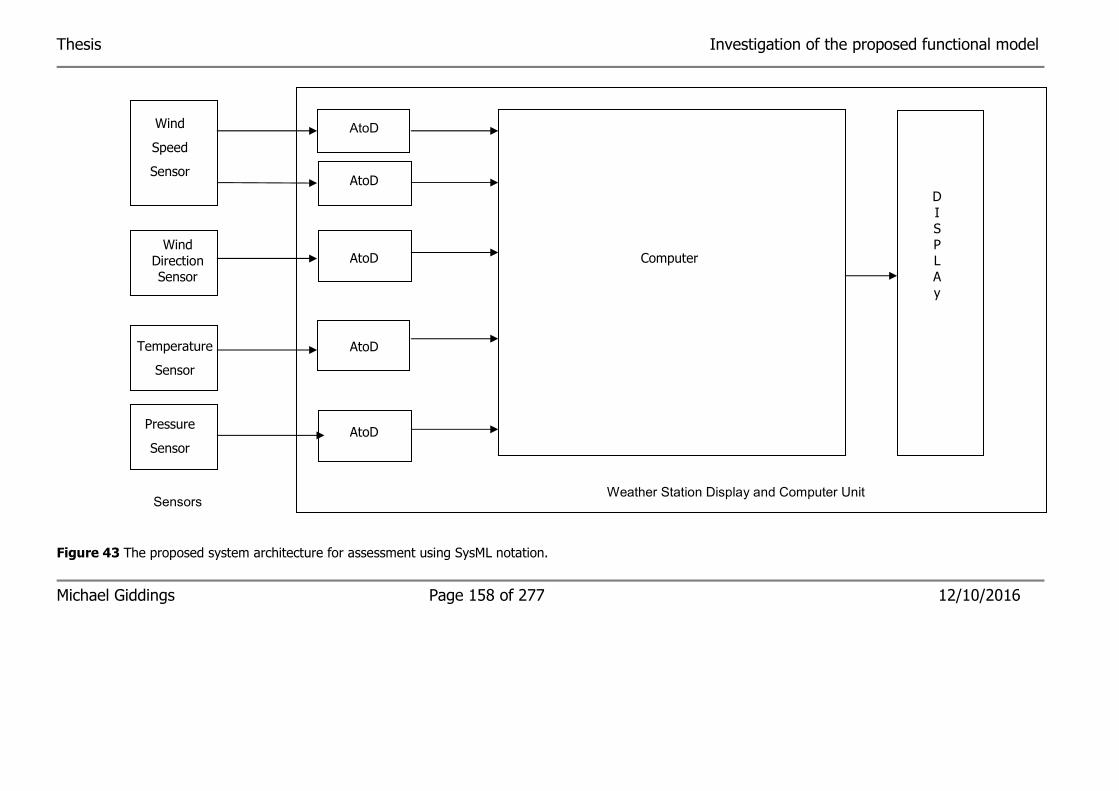
Thesis Investigation of the proposed functional model
Figure 43 The proposed system architecture for assessment using SysML notation.
Michael Giddings Page 158 of 277 12/10/2016
Wind
Speed
Sensor
Wind
Direction Sensor
Temperature
Sensor
Pressure
Sensor
Computer
AtoD
AtoD
AtoD
AtoD
AtoD
D
I S
P L
A
y
Weather Station Display and Computer Unit Sensors

Thesis Investigation of the proposed functional model
Michael Giddings Page 159 of 277 12/10/2016
So an analysis of the three different types of error produce the following results:
• Static error
Assumed to be mechanically or software adjusted to 0.
• Stochastic error
Assumed to be made up of quantisation errors and sensor errors:
Error range is combination of +/- 0.1 mph and +/- 0.1 mph. This makes a total of +/- 0.2
mph.
• Dynamic errors
Maximum delay = 60ms.
Rate of change of input = 10 mph per second.
Maximum instantaneous error = 60* 10/1000 = 0.6 mph.
This gives a maximum instantaneous error of 0.2 mph + 0.6 mph = 0.8 mph and passes the
accuracy requirement DisplayWindSpeed.
Temperature sensor
End event – DisplayTemperature.
• Temperature sensor errors assumed to be +/- 0.1 degrees.
• A to D converters work at 20 Hz and are 8 bit.
• Processor executes a simple periodic type software process that iterates every 20ms.
• Display updates every 20ms.
• Maximum rate of change of temperature is 1 degree per second.
• Temperature range -10 degrees – 40 degrees.
This means the quantisation error = 50/28 = 0.2 degrees.
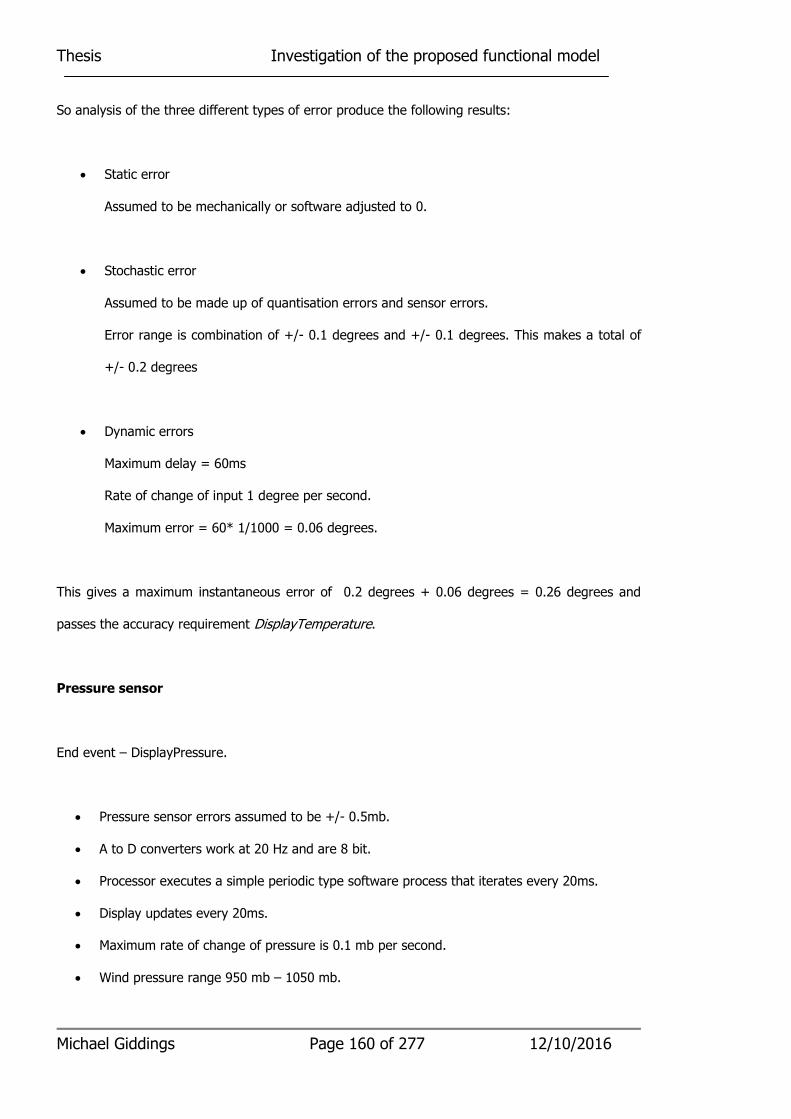
Thesis Investigation of the proposed functional model
Michael Giddings Page 160 of 277 12/10/2016
So analysis of the three different types of error produce the following results:
• Static error
Assumed to be mechanically or software adjusted to 0.
• Stochastic error
Assumed to be made up of quantisation errors and sensor errors.
Error range is combination of +/- 0.1 degrees and +/- 0.1 degrees. This makes a total of
+/- 0.2 degrees
• Dynamic errors
Maximum delay = 60ms
Rate of change of input 1 degree per second.
Maximum error = 60* 1/1000 = 0.06 degrees.
This gives a maximum instantaneous error of 0.2 degrees + 0.06 degrees = 0.26 degrees and
passes the accuracy requirement DisplayTemperature.
Pressure sensor
End event – DisplayPressure.
• Pressure sensor errors assumed to be +/- 0.5mb.
• A to D converters work at 20 Hz and are 8 bit.
• Processor executes a simple periodic type software process that iterates every 20ms.
• Display updates every 20ms.
• Maximum rate of change of pressure is 0.1 mb per second.
• Wind pressure range 950 mb – 1050 mb.

Thesis Investigation of the proposed functional model
Michael Giddings Page 161 of 277 12/10/2016
This means the quantisation error = 100/28 = 0.4 mb.
So analysis of the three different types of error produces:
• Static error
Assumed to be mechanically or software adjusted to 0.
• Stochastic error
Assumed to be made up of quantisation errors and sensor errors.
Error range is combination of +/- 0.5 mb and +/- 0.4 mb. This makes a total of +/- 0.9mb.
• Dynamic errors
Maximum delay = 60ms.
Rate of change of input = 0.1 mb.
Maximum instantaneous error = 60* 0.1/1000 = 0.006 mb.
This gives a maximum instantaneous error of 0.9 mb + 0.006 mb = 0.906 mb and passes the
accuracy requirement DisplayPressure.
Summary of the initial pass of the system design is:
Sensor Max Static
error
Max
Stochastic
error
Max
Dynamic
error
Max Total
error
Max Error
requirement
DispWindDirection 0 degrees +/-1.0 deg +/-0.6deg +/-1.6deg +/- 1 deg
DisplayWindSpeed 0 mph +/-0.2mph +/- 0.6mph +/-0.8mph +/- 1 mph
DisplayTemperature 0 degrees +/- 0.2 deg +/- 0.06 deg +/-0.26 deg +/- 1 deg
Display Pressure 0 mb +/- 0.5 mb +/- 0.006 mb +/-0.506 mb +/- 1.0 mb
Table 7 Summary of the initial system design.

Thesis Investigation of the proposed functional model
Michael Giddings Page 162 of 277 12/10/2016
4.3.3.3.2 Design changes to overcome performance shortfalls
The performance shortfall can be rectified by the introduction of a coarse/fine wind direction
sensor. (There may be other more sensible modifications but this was chosen as it changes the
system design. Course/fine direction systems already exist on naval gun mountings. Changes to
the system design like this are very expensive if not detected early). The iteration rate of the
processor needs to be examined as the processor now includes some arithmetic calculations. The
effects of the sensor filter are estimated to be equivalent to a delay of 0.1ms. Other solutions such
as improving the resolution of the A to D converters have been ignored.
Two wind direction sensors are now used.
Fine sensor performance requirement +/-1 degree over 30 degrees plus ambiguity
Coarse sensor requirement +/- 10 degrees – used to resolve ambiguity
• Fine wind direction sensor errors assumed to be +/- 0.1 degrees
• Fine wind sensor update rate = 50hz
• Fine wind sensor range 0 degrees to 30 degrees
• Coarse wind direction sensor errors assumed to be +/- 0.5 degrees
• Coarse wind sensor update rate = 50hz
• A to D converters work at 20 Hz and are 8 bit
• Processor executes a simple periodic type software process that iterates every 20ms
• Display updates every 20ms
• Maximum rate of change of wind direction is 10 degrees per second
• Fine Wind direction range 0 degrees – 30 degrees
• Coarse Wind direction range 0 degrees – 360 degrees
This means the fine quantisation error = 30/28 = 0.12 degrees
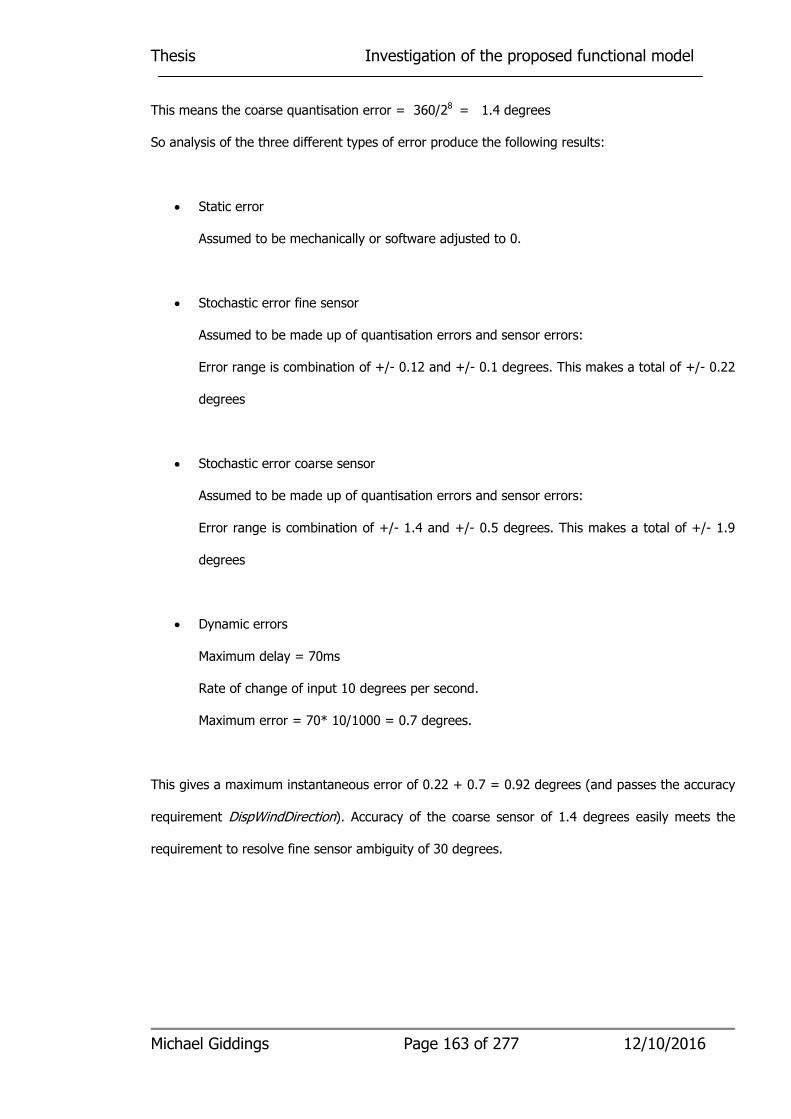
Thesis Investigation of the proposed functional model
Michael Giddings Page 163 of 277 12/10/2016
This means the coarse quantisation error = 360/28 = 1.4 degrees
So analysis of the three different types of error produce the following results:
• Static error
Assumed to be mechanically or software adjusted to 0.
• Stochastic error fine sensor
Assumed to be made up of quantisation errors and sensor errors:
Error range is combination of +/- 0.12 and +/- 0.1 degrees. This makes a total of +/- 0.22
degrees
• Stochastic error coarse sensor
Assumed to be made up of quantisation errors and sensor errors:
Error range is combination of +/- 1.4 and +/- 0.5 degrees. This makes a total of +/- 1.9
degrees
• Dynamic errors
Maximum delay = 70ms
Rate of change of input 10 degrees per second.
Maximum error = 70* 10/1000 = 0.7 degrees.
This gives a maximum instantaneous error of 0.22 + 0.7 = 0.92 degrees (and passes the accuracy
requirement DispWindDirection). Accuracy of the coarse sensor of 1.4 degrees easily meets the
requirement to resolve fine sensor ambiguity of 30 degrees.

Thesis Investigation of the proposed functional model
Michael Giddings Page 164 of 277 12/10/2016
4.3.3.3.3 Summary of the second system design
Summary of the second pass at the system design is:
Sensor Max Static
error
Max
Stochastic
error
Max
Dynamic
error
Max Total
error
Max Error
requirement
DispWindDirection 0 degrees +/-0.22 deg +/-0.7deg +/-0.92 deg +/- 1 deg
DisplayWindSpeed 0 mph +/-0.2mph +/- 0.6mph +/-0.8mph +/- 1 mph
DisplayTemperature 0 degrees +/- 0.2 deg +/- 0.06 deg +/-0.26 deg +/- 1 deg
Display Pressure 0 mb +/- 0.5 mb +/- 0.006 mb +/-0.506 mb +/- 1.0 mb
Table 8 Summary of the second pass at the system design.
The performance of the processor can be re-calculated when the detail design of the processor
software becomes available.
For small embedded systems developed by a single design team, the process of allocation
performance requirements to individual components is typically undertaken by prototyping. If the
prototype does not meet the performance requirements, the prototype is modified until it does
operate as required. Detailed performance analysis is uneconomic in this case.
4.3.3.4 Allocation of other non-functional requirements
There are a number of other standard functional requirements that can be allocated to individual
components and subcomponents of the system. These include:
• Mission criticality
• Safety criticality
• Failure modes
Thesis Investigation of the proposed functional model
Michael Giddings Page 165 of 277 12/10/2016
These requirements are associated with system end events. Without a functional model they can
only be partitioned to system components not to individual functional requirements.
4.3.3.5 Traceability
Traceability between functional requirements identified in the outline functional requirements and
system components in this investigation is straight forward as the contribution of each system
component is separate and unique. Traceability to individual elements of software within the
weather station processor is not possible until the detailed weather station processor software
design is complete.
4.3.4 System design development process with the functional model
This section deals with the establishment and analysis of a functional model for a simple weather
station. It uses the same customer requirements defined in 4.3.3.4. It starts with the generation of
a functional model as described in Chapter 3 then goes on to describe and examine a functional
chain.
4.3.4.1 Generation of the functional model
Using the same functional requirements and system end events defined in 4.3.3.4, the system
hardware architecture shown in figure 42 has been simplified to show the model components that
are associated with different schedulers. This simplified hardware architecture is shown in figure
44. This model cannot be automatically generated from the system requirements as extra detail is
being added.

Thesis Investigation of the proposed functional model
Michael Giddings Page 166 of 277 12/10/2016
Figure 44 The simplified hardware architecture used to identify system component schedulers.
Each system component was decomposed into individual functional elements suitable for
implementation as an independent service. The execution time of each functional element is small
compared with the duration of an iteration and, for the purpose of the model, is an estimate. The
representation of each functional element must describe its function, inputs and outputs. An
example of part of this functional model is shown in figure 44. Only a part of the whole aircraft
model is shown as the whole model is large. The inputs and outputs shown are internal to the
model and do not represent sensor inputs or functional end events.
Each sensor and end event was associated with a single functional element. Communication links
are represented by a simple functional element, which copies input data into output data at a
particular rate.
Three functional elements are shown in figure 45 (assessWindSensors, calculateWindSpeed and
calculateWindDirection) as rectangles. Each functional element is independent and the diagram
contains no information about the order the functional elements are executed. The solid arrows
show how information migrates from object to object – in reality a message answer from a getter
message request sent in the opposite direction. Dotted arrows are used to indicate flags.
It was assumed that the sensor and the sensor AD converter can be considered as a single system
component and that each sensor can be adjusted to remove static errors.
sensorSignals displayData
Sensors Display
Processing component
Data link
Data
link External interface
External
interface
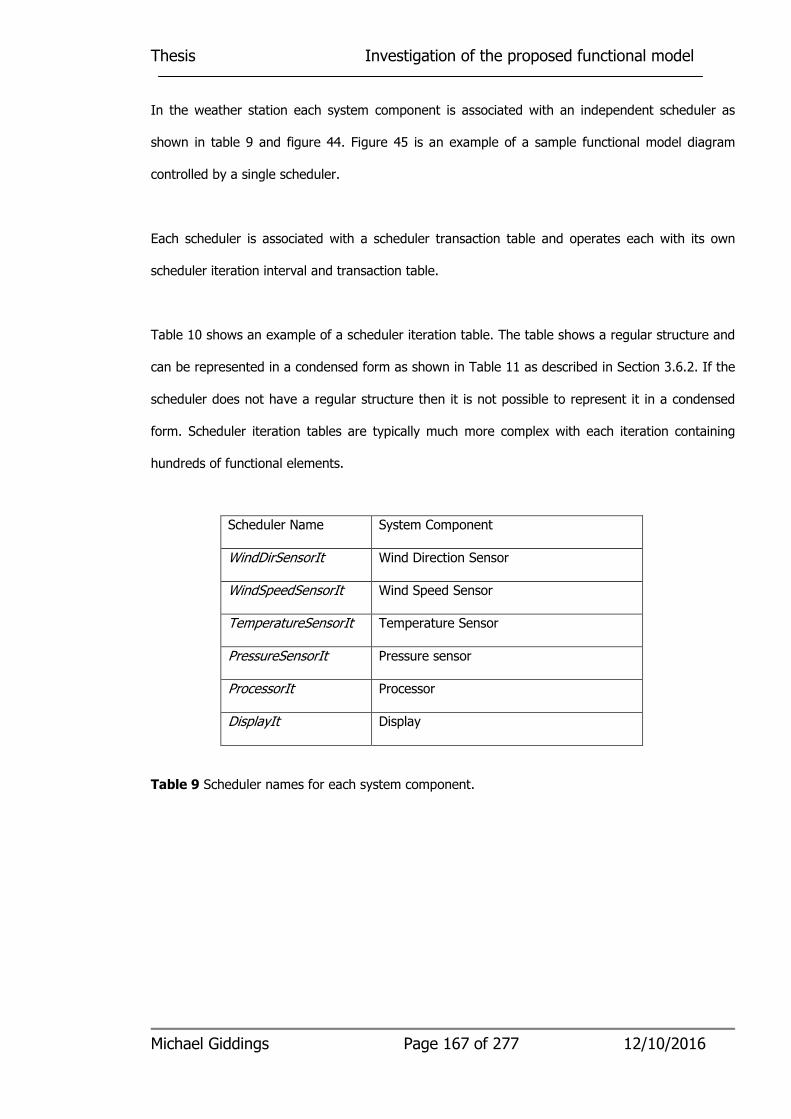
Thesis Investigation of the proposed functional model
Michael Giddings Page 167 of 277 12/10/2016
In the weather station each system component is associated with an independent scheduler as
shown in table 9 and figure 44. Figure 45 is an example of a sample functional model diagram
controlled by a single scheduler.
Each scheduler is associated with a scheduler transaction table and operates each with its own
scheduler iteration interval and transaction table.
Table 10 shows an example of a scheduler iteration table. The table shows a regular structure and
can be represented in a condensed form as shown in Table 11 as described in Section 3.6.2. If the
scheduler does not have a regular structure then it is not possible to represent it in a condensed
form. Scheduler iteration tables are typically much more complex with each iteration containing
hundreds of functional elements.
Table 9 Scheduler names for each system component.
Scheduler Name System Component
WindDirSensorIt Wind Direction Sensor
WindSpeedSensorIt Wind Speed Sensor
TemperatureSensorIt Temperature Sensor
PressureSensorIt Pressure sensor
ProcessorIt Processor
DisplayIt Display
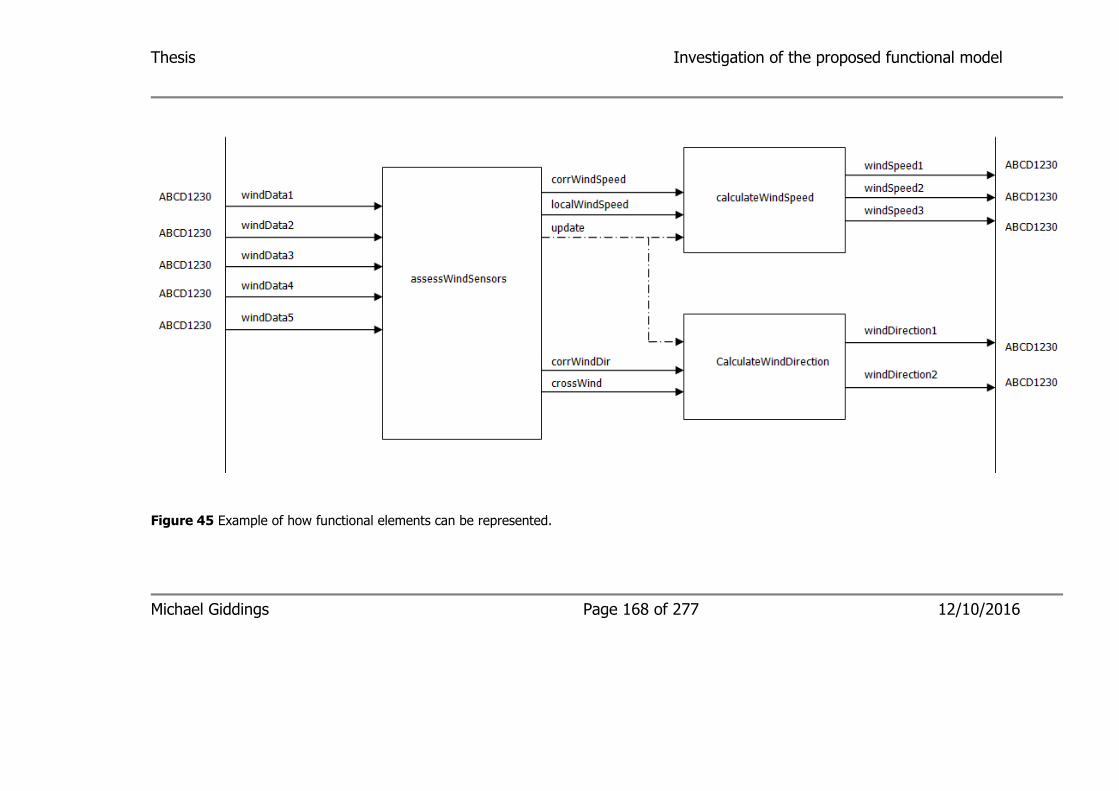
Thesis Investigation of the proposed functional model
Figure 45 Example of how functional elements can be represented.
Michael Giddings Page 168 of 277 12/10/2016

Michael Giddings Page 169 of 277 12/10/2016
Thesis Investigation of the proposed functional model
Table 10 The scheduler iterator table for the processing system component.
Functional Element 0 1 2 3 4 5 6 7 8 9 10 11 12 13 14 15 16 17 18 19 20 21 22 23 24 25 26 27 28 29 30 31 32 33 34 35 36 37 38 39 40 41 42 43 44 45 46 47 48 49 50 51 52 53 54 55 56 57 58 59 60 61 62 63
iterCounter x x x x x x x x x x x x x x x x x x x x x x x x x x x x x x x x x x x x x x x x x x x x x x x x x x x x x x x x x x x x x x x x
readDirCoarse x x x x x x x x
readDirFine x x x x x x x x x x x x x x x x x x x x x x x x x x x x x x x x
readWSpeed x x x x x x x x x x x x x x x x
readTemp x x
readPressure x x
filterDirCoarse x x x x x x x x
filterDirFine x x x x x x x x x x x x x x x x x x x x x x x x x x x x x x x x
filterTemp x x
filterPressure x x
generateWindDir x x x x x x x x
generateWSpeed x x x x
generateTemp x
generatePressure X
processWind x x x x x x x x
processTemp x
processPressure x
3 3 3 2 3 2 4 4 3 4 4 3 3 2 4 4 3 3 3 2 2 2 3 4 3 3 3 3 2 2 3 4 3 3 3 2 3 2 4 4 3 4 4 3 3 2 4 4 3 3 3 2 2 2 3 4 3 3 3 3 2 2 3 4

Thesis Investigation of the proposed functional model
Michael Giddings Page 170 of 277 12/10/2016
Table 11 The iteration table in a compressed format.
4.3.4.1.1 Adding detail to functional element specifications
After the functional elements have been identified in graphical form the model is populated for
each functional element and associated text note. An example of the template used is shown in
appendix A. Extra information about the layout of the diagram and its position within the structure
of the functional element diagram is also recorded. Additional fields are included so that system
related non-functional requirements identified by functional chain analysis can be recorded.
The behaviour of each functional element is defined in the model. There are a number of possible
formats that can be used such as OCL, a pseudo algorithm or even code. It is important that the
information stored in the database is sufficient for the animator generator program described in
the third investigation to populate the animator code templates.
Using functional elements as a component part of a system representation helps identify re-use
opportunities by identifying functional elements that are equivalent.
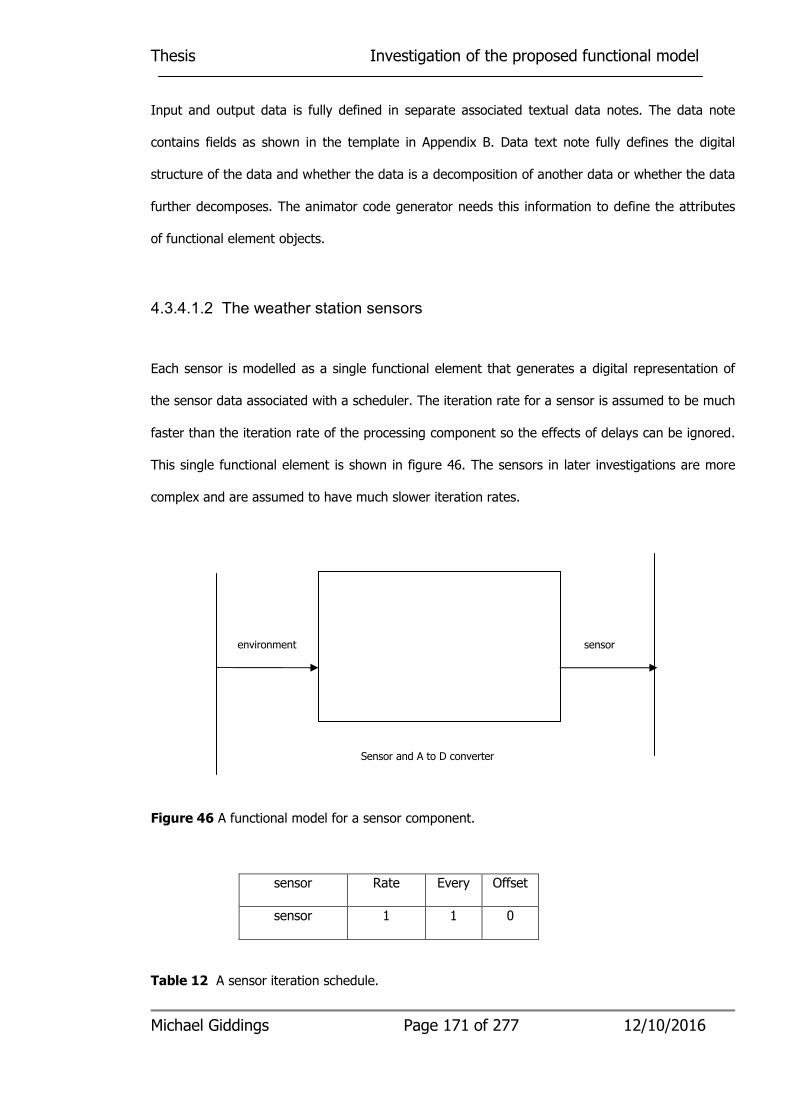
Thesis Investigation of the proposed functional model
Michael Giddings Page 171 of 277 12/10/2016
Input and output data is fully defined in separate associated textual data notes. The data note
contains fields as shown in the template in Appendix B. Data text note fully defines the digital
structure of the data and whether the data is a decomposition of another data or whether the data
further decomposes. The animator code generator needs this information to define the attributes
of functional element objects.
4.3.4.1.2 The weather station sensors
Each sensor is modelled as a single functional element that generates a digital representation of
the sensor data associated with a scheduler. The iteration rate for a sensor is assumed to be much
faster than the iteration rate of the processing component so the effects of delays can be ignored.
This single functional element is shown in figure 46. The sensors in later investigations are more
complex and are assumed to have much slower iteration rates.
Figure 46 A functional model for a sensor component.
sensor Rate Every Offset
sensor 1 1 0
Table 12 A sensor iteration schedule.
Sensor and A to D converter
environment sensor

Thesis Investigation of the proposed functional model
Michael Giddings Page 172 of 277 12/10/2016
4.3.4.1.3 The weather station display
Each display is modelled as a single functional element that generates a representation of the
sensor data. This single functional element is shown in figure 47.
Figure 47 A functional model for the display component.
display Rate Every Offset
display 1 1 0
Table 13 A display iteration schedule.
4.3.4.2 Analysis of performance end events
Functional chains can be identified from end events and tracing all the functional elements that
contribute to its value. The functional chain is then constructed showing each functional element
linked by the data that connects them. When a functional chain has been identified, the diagram
notes associated with each functional element that is involved can be annotated with references to
the traceability, safety and mission criticality requirements of the end event.
display
dataForDisplay environment

Thesis Investigation of the proposed functional model
Michael Giddings Page 173 of 277 12/10/2016
The lines linking the functional elements in a functional chain represent real data flow; they
represent how information migrates across the system as functional element recorded information
are changed.
In the functional chain shown in figure 48, the end event is the indication of wind direction on the
‘DispWindDirection’ and is shown on the right of the diagram. The actual wind direction the
Weather Station wind sensor experiences are shown as ‘env’ (environment). As the wind sensor
has two parts, the coarse and fine wind direction sensors, it appears twice labelled 1. The use of
‘env’ for the real-world environment is required to remind the modeller that these inputs are
interrelated. In this case they both refer to the same wind direction. When these inputs are
generated by a real-world model they must be generated in synchronised way.
4.3.4.3 Functional chain simplification
One of the benefits of depicting functional chains as shown in figure 48 is that they can be split up
into a number of sub chains. These sub chains can be compared to see which of them are critical
to the performance of the final end event. Only those functional sub-chains that contribute towards
the performance of the end event need to be included in the performance calculation or animation.
The sub chains identified by function element reference numbers shown in figure 48 are shown in
table 14.
An analysis can be undertaken to see which sub chains are critical to the functional end event.
Functional chain 2 is the critical sub functional chain, as it links the fine wind sensor to the wind
direction display. Functional chain 1 has to meet the requirements of functional element 8, where
the fine sensor direction ambiguity is resolved. Functional chains 3, 4 and 5 have to supply
iteration counter to meet the requirements of functional element 8.

Thesis Investigation of the proposed functional model
Michael Giddings Page 174 of 277 12/10/2016
Table 14 The individual functional sub chains in the wind direction display functional chain shown
in figure 48.
Sub Chain
Number
Name Functional Elements
1 Coarse wind - Provision of filtered coarse
wind sensor data to generateWDir to
resolve direction ambiguity
8, 4, 3, 2 ,1
2 Fine Wind – provision of wind direction
data to display
13, 12, 10, 9 , 8, 7, 6, 5, 1
3 Counter (Chain 1) 8, 4 , 3, 11
4 Counter (Chain 2) 8, 7, 6, 11
5 Counter (Chain 3) 8, 11
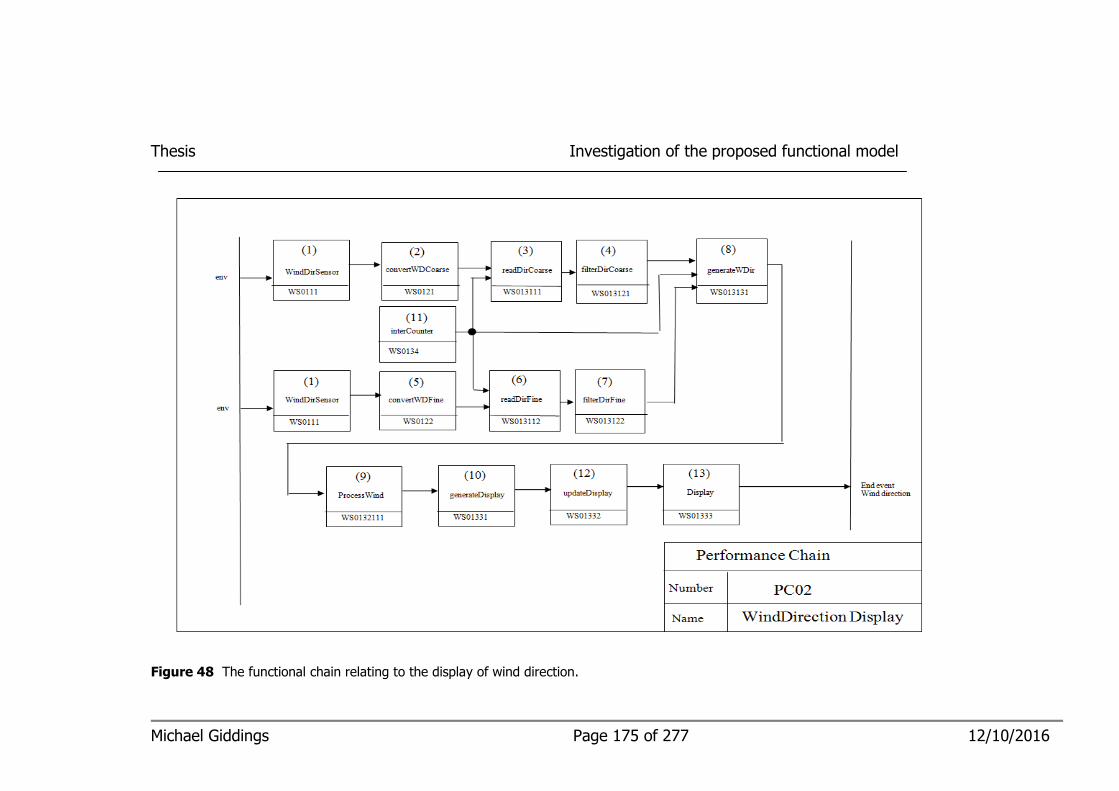
Michael Giddings Page 175 of 277 12/10/2016
Thesis Investigation of the proposed functional model
Figure 48 The functional chain relating to the display of wind direction.

Thesis Investigation of the proposed functional model
Michael Giddings Page 176 of 277 12/10/2016
4.3.4.4 Calculation of performance from functional chains
Software performance can be calculated by analysing the functional elements in a functional chain
in conjunction with the scheduler iterator structure. The error in the end event is a combination of
sensor errors, arithmetic errors and representation errors that can be determined from each
functional element and the delay between the executions of each functional element obtained from
the scheduler iterator. The errors may be calculated as follows:
• Static errors
Static errors cannot be calculated as they are due to the mechanical installation of the sensor.
They can be easily removed by mechanical realignment or a digital offset after the sensor is
aligned to the display.
• Stochastic errors
In this investigation the processing element only passes the wind direction data from the analogue
to digital converters to the display without any arithmetic calculation. This means that in this case
the stochastic errors only relate to the digital resolution of wind direction data and sensor noise.
The contribution of this error can be calculated without a functional model.
• Dynamic errors
The delay across the system can be calculated; providing the processer system component is
implemented using process elements derived from the models functional elements and iterated
using the same iteration structure from the functional model, it should provide an accurate value.
The calculation can be simplified by only considering the functional elements in the critical sub
chain.

Thesis Investigation of the proposed functional model
Michael Giddings Page 177 of 277 12/10/2016
If the functional elements are called in the order 1, 5, 6, 7, 8, 9, 10, 12, 13 within a single
iteration, the delay between input and output is the time between the start of functional element 1
and the end of functional element 13, plus the iteration interval times the rate value for the
elements.
The delay will be different for different iterator schedules but can be calculated in a similar way.
The calculation must also be repeated every time the functional chain or the iteration schedule
changes. Repetitive recalculation of the performance is time consuming and not cost effective.
Each functional chain can be animated in a way that reflects real performance, by executing the
functional elements contained in the functional chain using a scheduler with the same iteration
schedule structure as the full system. The animation uses the algorithm for each functional
element that is embedded in the functional element text note. The format options for the algorithm
could include real code, pseudo-code, to an OCL definition. The possibility of automatically
generating the code for the animator based on this algorithm is examined in later investigations. If
the animator code can be automatically generated from information contained in the functional
model, all the functional elements in the functional chain could be included.
The advantage of animation is that it can be easily repeated and can be used to specify the
performance requirements of individual components. If the final component design uses the same
implementation structure and iteration table, the animation will mirror the performance of the final
system. Performance predicted by calculation can be used to confirm the results obtained from the
animator.
The animator could be extended to include stochastic errors by adding representative sensor errors
in each sensor functional element and by using the data type and range defined in the functional
model data note.

Thesis Investigation of the proposed functional model
Michael Giddings Page 178 of 277 12/10/2016
The animator also identifies functional errors in the functional model and can also be used to
provide an early opportunity for the customer to review the systems proposed functionality.
Further aspects of the use of functional chains are explored in the second and third investigations.
4.3.4.5 Traceability
Functional chains identify those functional elements that are related to a specific end requirement.
Traceability between high level requirements and the model can be achieved by annotating the
functional element’s data notes associated with the relevant functional end event. For example, all
the functional elements shown in figure 48 can be traced to a high level requirement to display
wind direction. Other parameters for mission criticality, safety criticality and failure can also be
added in a similar manner. Traceability references can be added to extra fields in the functional
element data note.
4.3.5 Summary of investigation and lessons learnt
The weather station investigation addressed:
• How the transition between an architecture independent top level set of requirements and
a system component specification might be undertaken without a functional model based
on a simple weather station.
• How the transition between an architecture independent top level set of requirements and
a system component specification might be undertaken with a functional model.
• How individual functional elements might be specified.
• How a scheduler might operate and be defined.
• How functional elements can be combined to represent a complete component abstraction.
• How a functional chain may be generated and analysed.
Thesis Investigation of the proposed functional model
Michael Giddings Page 179 of 277 12/10/2016
The lesson learnt were:
• The weather station, represented by an abstraction, was described using a functional
model diagram and a separate scheduler table. A method of obtaining functional elements
by the repeated decomposition of system requirements was established and a functional
chain for the display of wind direction was extracted from the functional diagram. The
functional chain was assessed and a method similar to critical path analysis was
established to identify those functional elements that had the most effect on the
performance of the wind direction display. As the performance of the display of wind
direction did not meet the system requirements it was possible to examine an alternative
system design. Although the alternative design was a little unrealistic it demonstrated how
this could be done.
• A method for the transfer and storage of system data was established. The dynamic
operation of a single functional element was described using a UML sequence diagram.
When individual functional elements operated in accordance with the scheduler table the
dynamic operation of the model can be specified. This approach offers the potential for the
model to be animated.
• As the functional chains only transferred data between the sensors and the display,
dynamic errors were calculated by adding the delays identified from the scheduler table. It
became clear that the calculation of dynamic errors from functional chains with multiple
branches, and where each functional element consists of multiple inputs, becomes
increasing difficult with increasing system complexity. Some other way of determining
system errors that avoided this type of analysis would be needed to improve the usability
of this modelling approach.
• In practice, for systems with a single processing component the selection of components
can be done without a functional model. The functional model would help to specify the

Thesis Investigation of the proposed functional model
Michael Giddings Page 180 of 277 12/10/2016
functionality within the processing component but would soon be replaced by a more
conventional model representing the processor hardware architecture and the processor
software architecture. As the development would almost certainly be undertaken by a
single team the number of formal team communications interfaces would be few. This
means that the system design authority and the component design authority would be the
same.
• As the system considered only consisted of a single processing component further work is
required to consider systems with multiple processing components.
4.4 Second investigation
4.4.1 Introduction
Investigation 2 examines a simple distributed system to see how a simple functional model can be
used to examine system performance. It considers a simple idealised aircraft navigational system
which, amongst other things, passes directional information obtained from a gyro compass across
the system to a simple aircraft heading display.
The investigation describes a simple functional model that specifies the functional requirements for
the transfer of directional information. It describes how non-functional requirements can be
recorded and investigates how the functional chain can be used to calculate the errors due to
system delays.
The investigation describes how animators can be used to investigate system errors. Two types of
animators are compared: a real-time and a non real-time animator.

Thesis Investigation of the proposed functional model
Michael Giddings Page 181 of 277 12/10/2016
4.4.2 Investigation aims
The aims of the investigation are as follows:
• To compare the assessment of a proposed system hardware architecture with and without
a functional model.
• To assess whether a simplified functional model could represent the transfer of gyro
compass data by independent functional elements.
• To determine how this functional model could be represented.
• To decide how the individual component abstraction functional models could be combined
into a working system design.
• To investigate how the functional model could be used to model system performance.
• To assess whether a simple animator could represent the operation and performance of a
multi-component functional chain.
The system in the investigation has been chosen to illustrate the use of the proposed
functional model within a multi component system. The requirements for this system are
illustrative and was chosen because it contained several component abstract functional models
that could be combined to provide a simple linear functional chain. The design decisions that
have been adopted are not meant to be realistic and care has been taken not to draw
conclusions beyond the scope of the system chosen.
Thesis Investigation of the proposed functional model
Michael Giddings Page 182 of 277 12/10/2016
4.4.3 Development of system design without the functional model.
4.4.3.1 Outline requirements
The system end event considered is ‘display aircraft heading’. The end event performance
requirement is to display aircraft heading to an accuracy of +/- 1 degree for a maximum heading
change rate of 10 degrees per second.
Whilst the end event performance requirement above is entirely arbitrary, it has been chosen so
that the system hardware would support this requirement. In practice the selection of this
requirement would only be decided after the users were involved in an assessment using some
form of simulator; the actual value chosen is not unrealistic. It is interesting to note that the
requirement involves specifying the maximum heading change rate as well – a fact that might go
undiscovered without considering the effects of the system dynamic errors.
4.4.3.2 Selection of a system hardware architecture
The system hardware architecture chosen is typical of a complex navigation system and linked a
gyro compass to an aircraft display. As this investigation deals with a linear functional chain
between the sensor and the display much of rest of the navigation system can be ignored.
The selection of a system hardware architecture without a functional model is undertaken on a
‘previous experience basis’ from the system requirements definition. This is a prime example of a
'fix-it-later' approach. It relies on the good will of component suppliers to renegotiate their contract
specifications as the detailed system design emerges after contracts have been placed and the
component designs emerge. For COTS equipment where modifications might not be possible the
burden of consequential design changes may lie with the bespoke component design authorities.

Thesis Investigation of the proposed functional model
Michael Giddings Page 183 of 277 12/10/2016
Functionality covered by a number of component design authorities are particularly difficult to
manage as they rely on the system design authority to take the responsibility for problems that
emerge.
The proposed overall initial system architecture is shown in figure 49. The system architecture that
applies to the display aircraft heading end event is shown as a simple block diagram in figure 50.
This diagram takes into account how the inter component data uses the avionics and display data
buses.
4.4.3.3 Allocation of functional requirements to system components
The first stage of the development of the system design consists of the allocation of functional
requirements to individual system components.
In this investigation a system architecture consisting of two processing system components, a
number of sensors and a display has been chosen interconnected by two data buses.
This investigation concentrates on the system functional event ‘Display Aircraft Heading’. The
performance requirement for this functional end event is summarised in table 15. This requirement
would be determined by asking the customer and using user domain modelling.
Two computers are proposed, the avionics computer and the display computer. The calculation of
navigation data is located in the avionics computer. The display computer generates the GUI and
assembles data for display.

Thesis Investigation of the proposed functional model
Michael Giddings Page 184 of 277 12/10/2016
Performance end event Performance requirement
DisplayAircraftHeading +/- 1 degree for heading rates less
than 10 degrees per second
Table 15 The performance requirement for DisplayAircraftHeading.
Without a functional model the allocation of functionality to individual system components is
undertaken manually on an experience basis. On this basis the allocation of functionality to system
components is shown in table 16. Figure 50 shows the flow of gyro compass data from the sensor
to the display. Communication links are shown as they are represented as separate components in
the functional model.
The allocation of other requirements that use gyro compass data for other purposes is not
included. The means that assessing the suitability of a sensor from a single end event functional
chain is not possible. The functional chains associated with a sensor can be automatically identified
from the functional model by checking which end events are connected via shared data messages.
The allocation of component iteration rates is summarised in table 17.
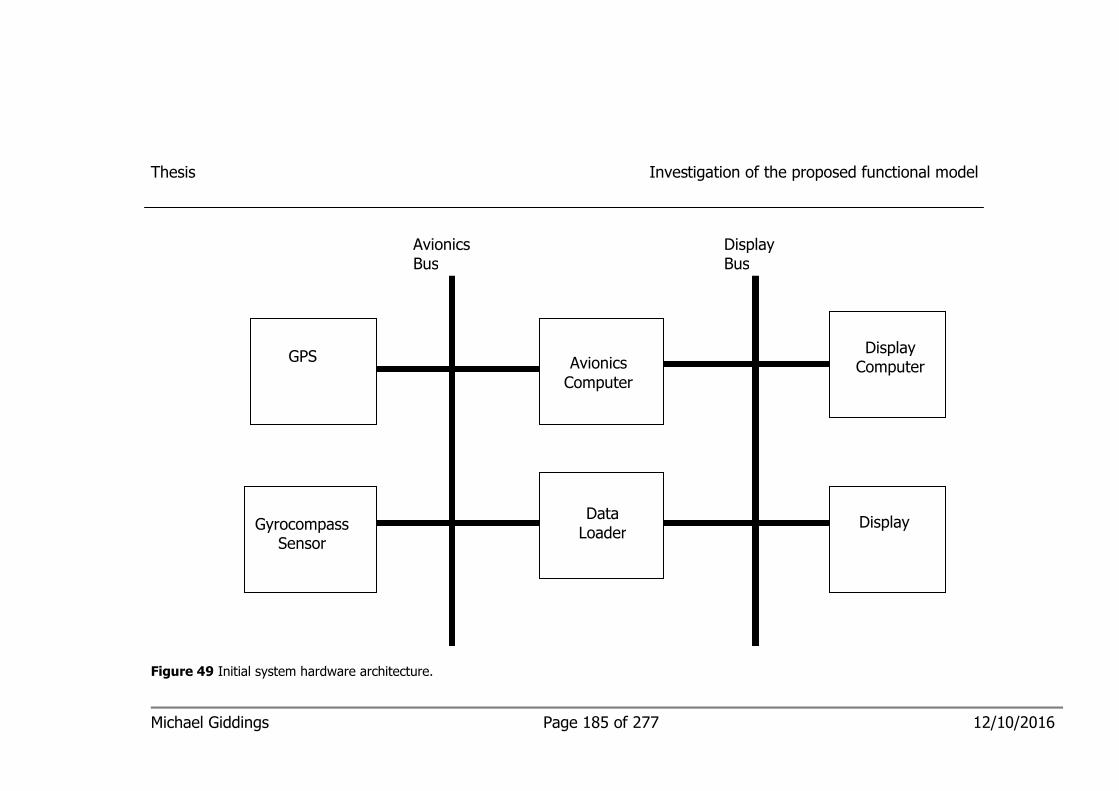
Michael Giddings Page 185 of 277 12/10/2016
Thesis Investigation of the proposed functional model
Figure 49 Initial system hardware architecture.
Avionics
Computer
Gyrocompass Sensor
GPS Display
Computer
Data Loader
Display
Avionics Bus
Display Bus
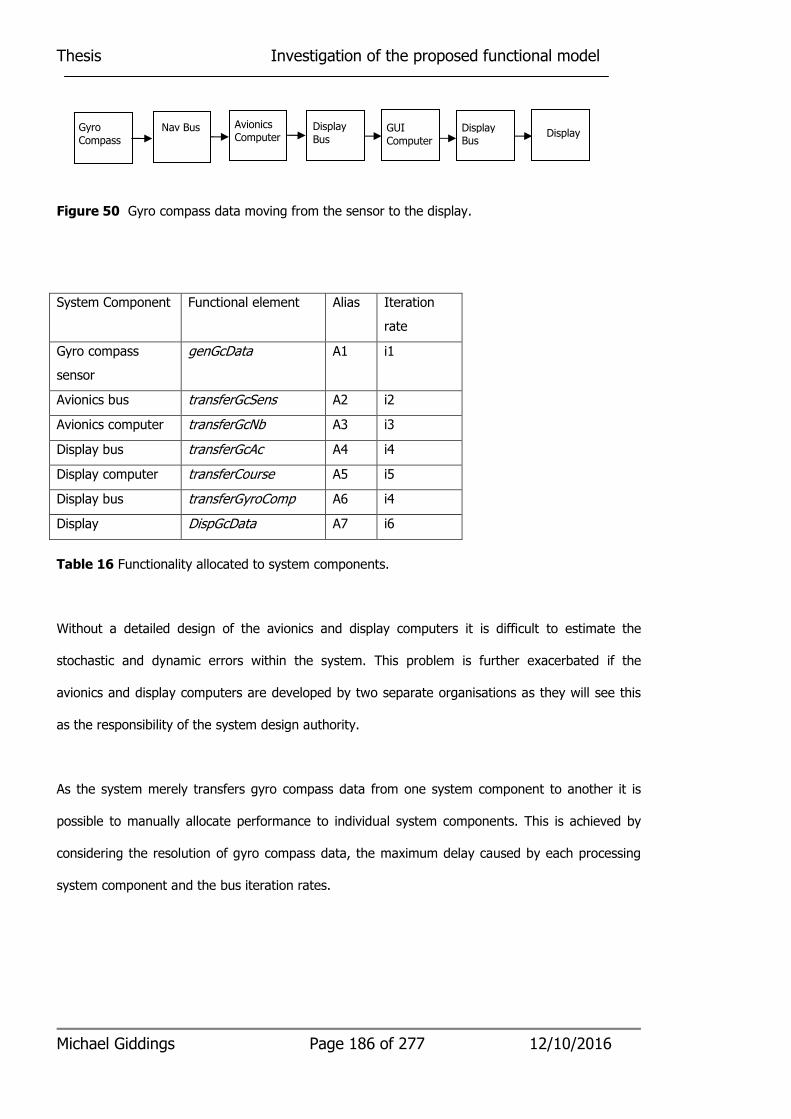
Thesis Investigation of the proposed functional model
Michael Giddings Page 186 of 277 12/10/2016
Figure 50 Gyro compass data moving from the sensor to the display.
Table 16 Functionality allocated to system components.
Without a detailed design of the avionics and display computers it is difficult to estimate the
stochastic and dynamic errors within the system. This problem is further exacerbated if the
avionics and display computers are developed by two separate organisations as they will see this
as the responsibility of the system design authority.
As the system merely transfers gyro compass data from one system component to another it is
possible to manually allocate performance to individual system components. This is achieved by
considering the resolution of gyro compass data, the maximum delay caused by each processing
system component and the bus iteration rates.
System Component Functional element Alias Iteration
rate
Gyro compass
sensor
genGcData A1 i1
Avionics bus transferGcSens A2 i2
Avionics computer transferGcNb A3 i3
Display bus transferGcAc A4 i4
Display computer transferCourse A5 i5
Display bus transferGyroComp A6 i4
Display DispGcData A7 i6
Gyro
Compass Nav Bus Avionics
Computer Display
Bus GUI
Computer
Display Bus
Display
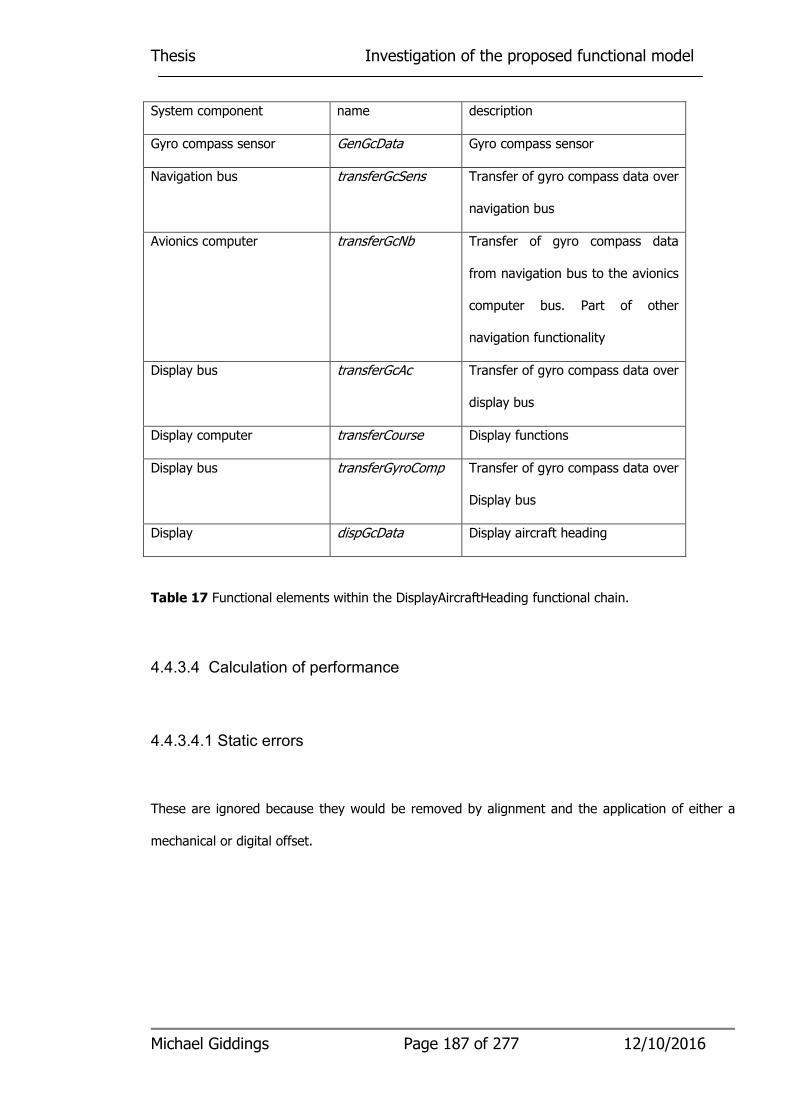
Thesis Investigation of the proposed functional model
Michael Giddings Page 187 of 277 12/10/2016
System component name description
Gyro compass sensor GenGcData Gyro compass sensor
Navigation bus transferGcSens Transfer of gyro compass data over
navigation bus
Avionics computer transferGcNb Transfer of gyro compass data
from navigation bus to the avionics
computer bus. Part of other
navigation functionality
Display bus transferGcAc Transfer of gyro compass data over
display bus
Display computer transferCourse Display functions
Display bus transferGyroComp Transfer of gyro compass data over
Display bus
Display dispGcData Display aircraft heading
Table 17 Functional elements within the DisplayAircraftHeading functional chain.
4.4.3.4 Calculation of performance
4.4.3.4.1 Static errors
These are ignored because they would be removed by alignment and the application of either a
mechanical or digital offset.

Thesis Investigation of the proposed functional model
Michael Giddings Page 188 of 277 12/10/2016
4.4.3.4.2 Stochastic errors
In this sample system the gyro compass data is not modified as it transits the system. The only
source of stochastic error then is the resolution of the gyro compass data and gyro data sensor
noise.
4.4.3.4.3 Dynamic errors
As the gyro compass data is passed unmodified from one system component to another the
maximum permitted dynamic error can be calculated as follows:
Dynamic error = &. ∑ 8��
where:
m is the maximum rate of change of aircraft heading permitted (in this case 10 degrees per
second)
n is the number of system components
i is the delay caused by each system component
In this instance the minimum delay caused by each system component is 0 if each system
component passes the information on as soon as it receives it. The maximum delay in the end
event is the sum of each component delay assuming that the receiving component just misses the
update of the source component.
4.4.3.5 Traceability
Traceability of requirements to individual parts of each component cannot be undertaken until after
a detailed design has been undertaken by the individual component design authority.

Thesis Investigation of the proposed functional model
Michael Giddings Page 189 of 277 12/10/2016
4.4.4 Development of the system design with a functional model
A common approach is to generate a functional description for each component based on its
operation and external interfaces that can be used either to negotiate the procurement of bespoke
components or to assess information available from COTS suppliers. The component external
interfaces are defined based on the proposed system architecture. This analysis is undertaken
based on previous experience using a 'fix-it-later' approach.
4.4.4.1 Generation of the functional model
Techniques using formal methods and tools that use MARTE are normally undertaken when the
detail design of the components emerge. The proposed functional model is based on a subset of
MARTE tasks that apply to abstractions. It combines the system hardware architecture with
abstractions for processing and non-processing components. The abstractions for processing
components combine the hardware architecture, software architecture and the functional content
of the software used. COTS components which are usually only specified in terms of a functional
description and interface definition can be analysed. The communication links can be represented
by abstractions and included in the analysis.
For the purposes of this investigation only the functionality that contributes towards the generation
of aircraft heading will be considered.
A system functional model is generated by combining the system component functional models for
each system component based on the kind of information that would be included in their
procurement specifications and interface control documents. Figure 51 shows the individual system
components based on figure 50. In this investigation all the system components with the exception
of the avionics computer are represented by a single functional element which transfers gyro
compass data from one system component to another. The avionics computer system component
Thesis Investigation of the proposed functional model
Michael Giddings Page 190 of 277 12/10/2016
can be decomposed into a function model as shown in figure 52. Close inspection of this functional
model diagram which shows the operation of some navigation functions within the avionics
computer reveals that this system component, transferGcNb, like the other processing components
just transfers gyro compass data from one bus to another bus. It also shows that the gyro
compass data is used for calculating aircraft course to steer data. The diagram shows that the
generation of course to steer information is not part of the display aircraft heading functional
chain.
4.4.4.2 Analysis of performance end events
The functional chain shows gyro compass sensor data being transferred from the gyro compass
sensor to the avionics computer via the avionics bus. The data is then transferred from the
avionics bus to the display bus by the avionics computer. The display computer then sends the
data back on the display bus to the display. Each of these processes is independent. The bus rates
are controlled by the bus transaction table and the bus clock. The gyro compass and avionics and
GUI computers are controlled by schedulers and an associated scheduler iterator transaction
tables.
4.4.4.3 Calculation of performance from functional chains
This investigation was chosen so that the calculation of the dynamic errors for display aircraft
heading can be simplified so that a comparison between calculation and animation would be easily
undertaken. The functional chain involves six independent components and seven functional
elements.
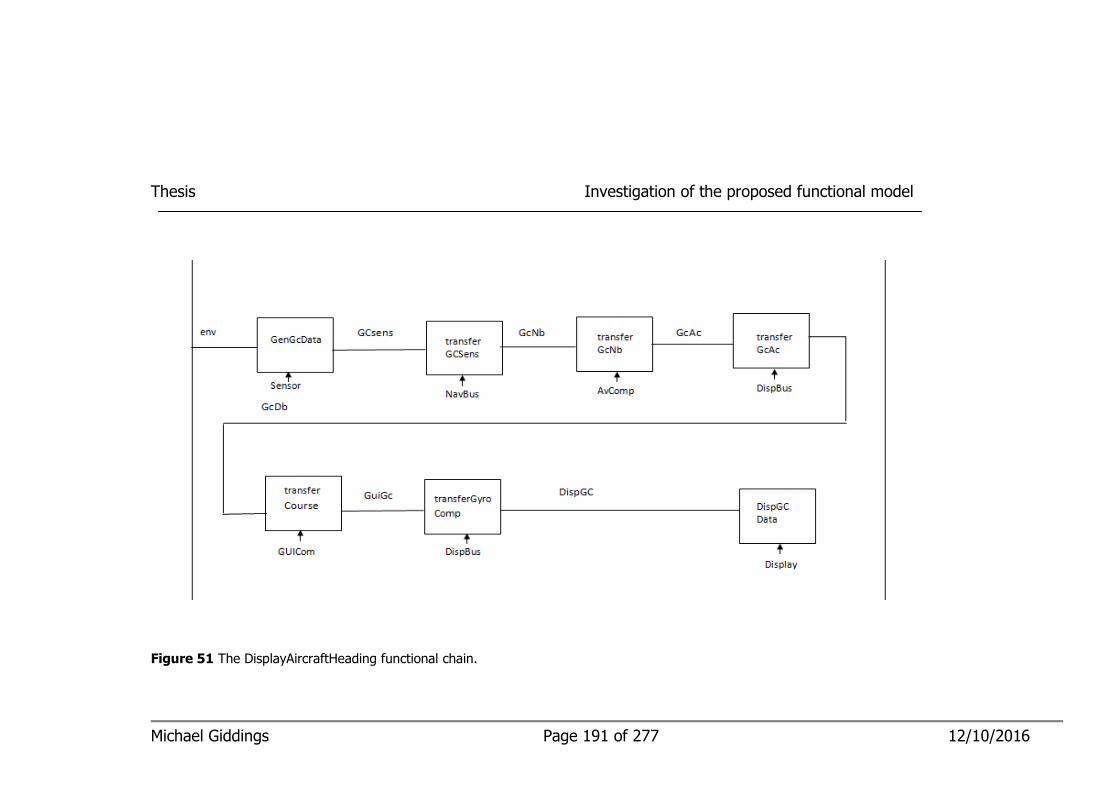
Michael Giddings Page 191 of 277 12/10/2016
Thesis Investigation of the proposed functional model
Figure 51 The DisplayAircraftHeading functional chain.
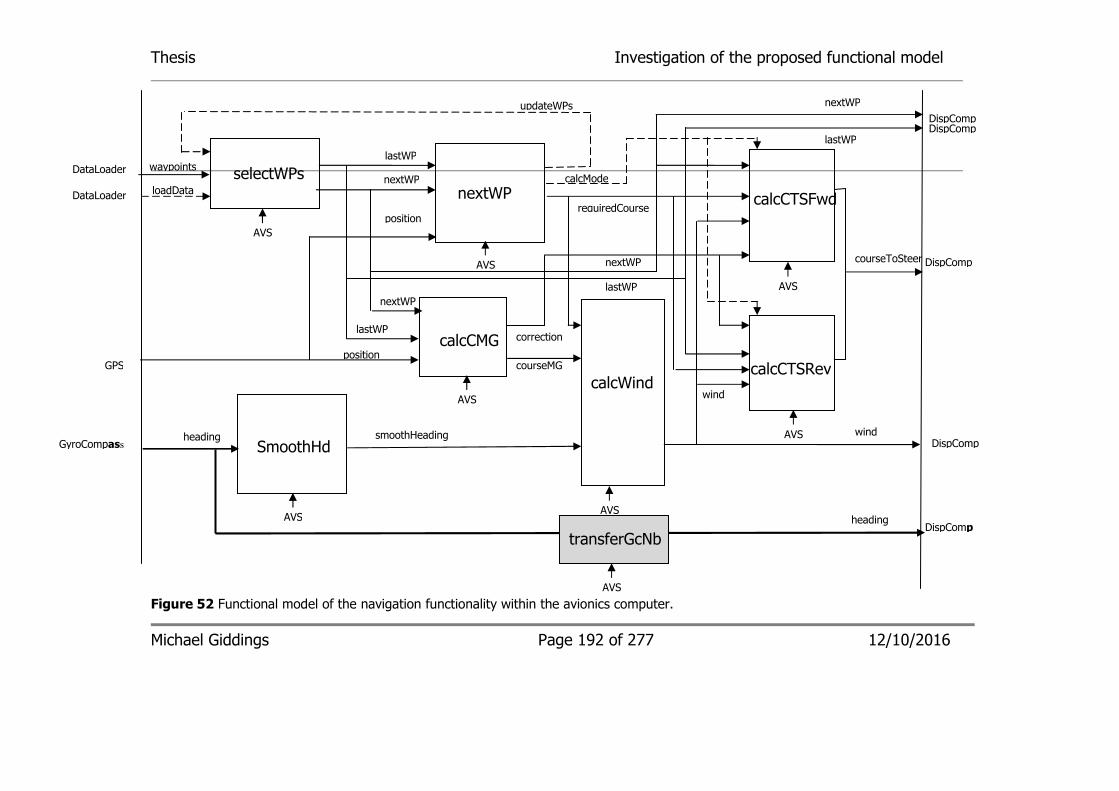
Thesis Investigation of the proposed functional model
Figure 52 Functional model of the navigation functionality within the avionics computer.
Michael Giddings Page 192 of 277 12/10/2016
GPS courseMG
transferGcNb
position
heading
waypoints
calcCMG
selectWPs
calcWind
SmoothHdg
calcCTSRev
nextWP
DispComp
DispComp
DispComp
updateWPs
lastWP
nextWP
courseToSteer
heading
smoothHeading
nextWP
nextWP
lastWP
nextWP
lastWP
position
wind DispComp
calcMode
wind
calcCTSFwd
AVS
AVS
AVS
AVS AVS
DispComp lastWP
AVS
AVS
AVS
loadData
requiredCourse
correction
GyroCompass
DataLoader
DataLoader
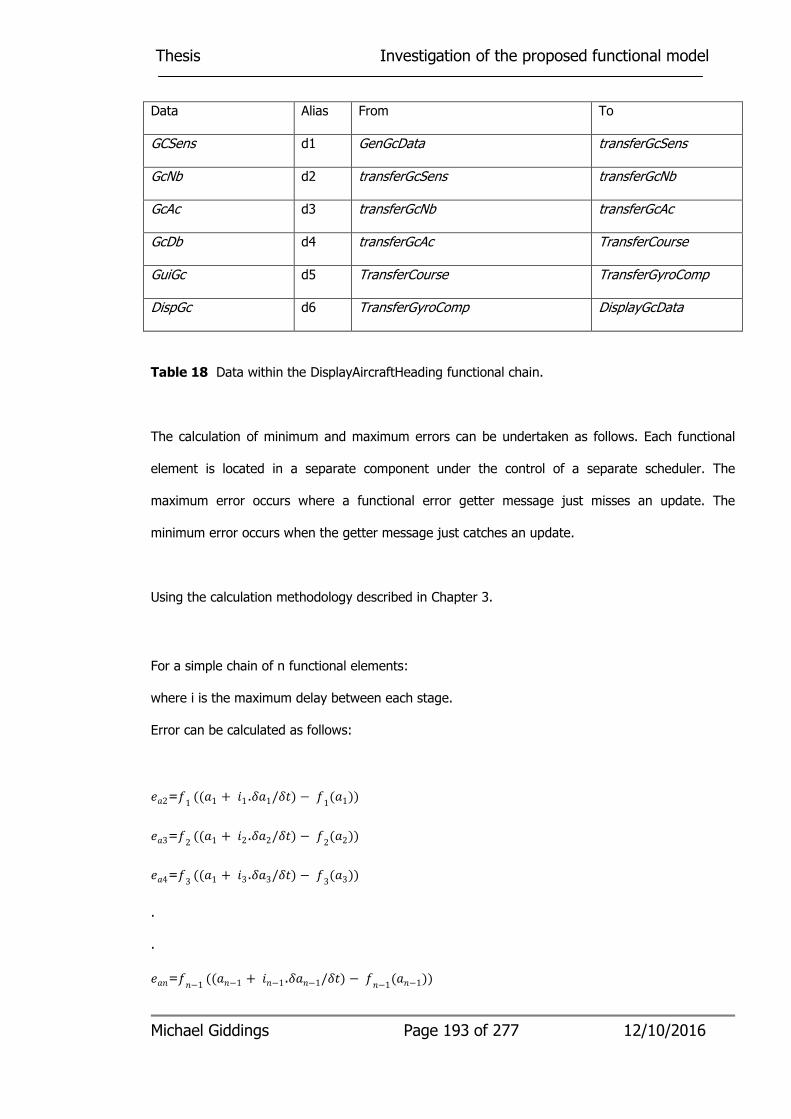
Thesis Investigation of the proposed functional model
Michael Giddings Page 193 of 277 12/10/2016
Data Alias From To
GCSens d1 GenGcData transferGcSens
GcNb d2 transferGcSens transferGcNb
GcAc d3 transferGcNb transferGcAc
GcDb d4 transferGcAc TransferCourse
GuiGc d5 TransferCourse TransferGyroComp
DispGc d6 TransferGyroComp DisplayGcData
Table 18 Data within the DisplayAircraftHeading functional chain.
The calculation of minimum and maximum errors can be undertaken as follows. Each functional
element is located in a separate component under the control of a separate scheduler. The
maximum error occurs where a functional error getter message just misses an update. The
minimum error occurs when the getter message just catches an update.
Using the calculation methodology described in Chapter 3.
For a simple chain of n functional elements:
where i is the maximum delay between each stage.
Error can be calculated as follows:
�%2=#1((%1 + 81.�%1/��) − #1(%1))
�%3=#2((%1 + 82.�%2/��) − #2(%2))
�%4=#3((%1 + 83.�%3/��) − #3(%3))
.
.
�%�=#�−1((%�−1 + 8�−1.�%�−1/��) − #�−1(%�−1))
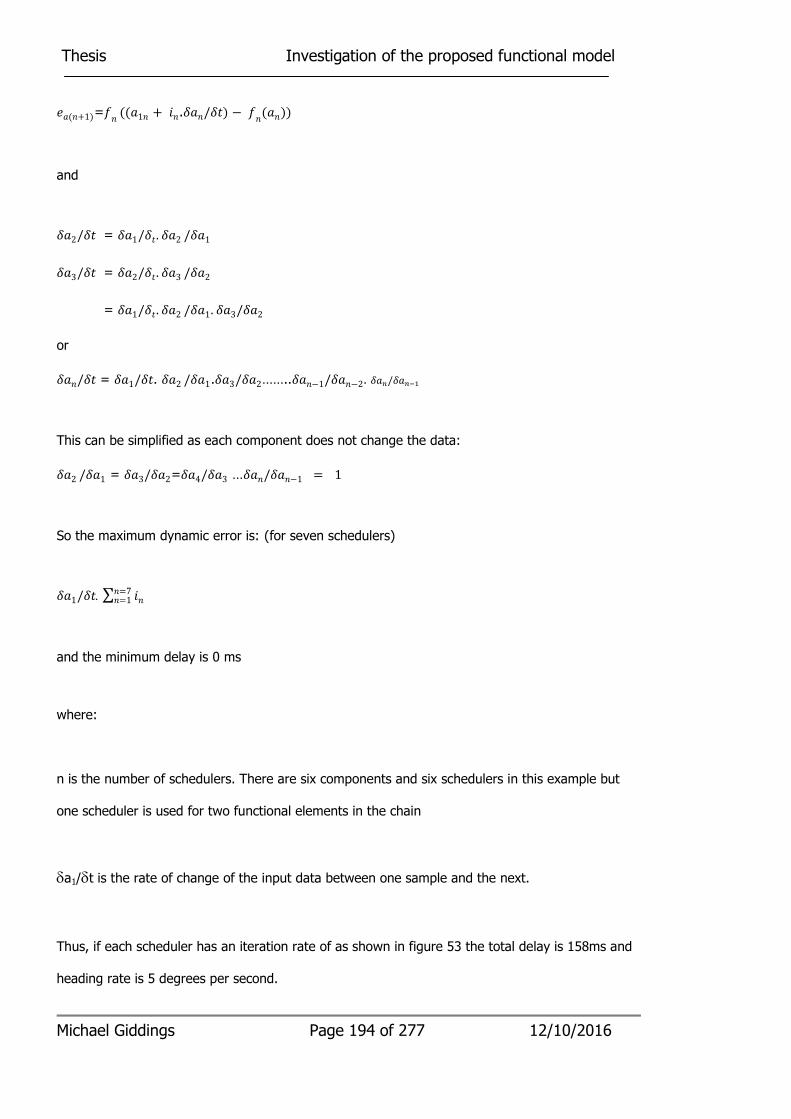
Thesis Investigation of the proposed functional model
Michael Giddings Page 194 of 277 12/10/2016
�%(�+1)=#�((%1� + 8�.�%�/��) − #�(%�))
and
�%2/�� = �%1/��. �%2/�%1
�%3/�� = �%2/��. �%3/�%2
= �%1/��. �%2/�%1. �%3/�%2
or
�%�/�� = �%1/��. �%2/�%1.�%3/�%2……..�%�−1/�%�−2. �%�/�%�=
This can be simplified as each component does not change the data:
�%2/�%1 = �%3/�%2=�%4/�%3 …�%�/�%�−1 = 1
So the maximum dynamic error is: (for seven schedulers)
�%1/��. ∑ 8��=7�=1
and the minimum delay is 0 ms
where:
n is the number of schedulers. There are six components and six schedulers in this example but
one scheduler is used for two functional elements in the chain
δa1/δt is the rate of change of the input data between one sample and the next.
Thus, if each scheduler has an iteration rate of as shown in figure 53 the total delay is 158ms and
heading rate is 5 degrees per second.
Thesis Investigation of the proposed functional model
Michael Giddings Page 195 of 277 12/10/2016
The maximum error is 158 * 5/ 1000 = 0.79 degrees.
The minimum error is 0 degrees.
4.4.4.4 Other non-functional requirements
Having identified the functional chain that contributes to the display of aircraft heading other non-
functional requirements, such as mission and failure criticality that specifically relate to this system
end event can be added to the model functional elements that make up this chain. Failure analysis
can be undertaken as the parts of the component that are associated with a particular end event
can be identified and extra functionality to ensure graceful degradation can be added. This means
that if additional requirements are necessary they can be limited to the parts that are affected.
4.4.4.5 Using an animator to simulate errors
This functional chain was animated using a software program. The program was based on the
functional chain in figures 51 and 52.
A simple real-world scenario data model was used which permitted real aircraft heading rates with
a constant rate of change. More complex real-world models would be required in practice.
Two approaches are assessed. The first approach, animation in real-time, used independent
threads for each scheduler linked to the system clock. The performance of this method proved to
be unpredictable, suffering from unpredictable delays between threads, so was abandoned. The
unpredictability of this approach would limit the size of functional chain that could be animated.
The second method below overcomes these issues.
The second method used a counter which represents time and did not run in real-time. The
counter represented 50 microsecond steps and ran each functional element in accordance with its
Thesis Investigation of the proposed functional model
Michael Giddings Page 196 of 277 12/10/2016
scheduler. The counter is incremented when all the functional elements due to be run within that
50 microsecond interval are complete As each functional element represents a single step in a
multi-step process then when the functional element completes the system is somewhere between
the start and finish of its operation so the operation of the animator is concurrent (but not real-
time). All the results are tagged with the value of the counter so the changes with respect to time
can be recovered.
NetBeans 7.1 was used with Java to implement the animator and the GUI.
The program also allowed stochastic sensor errors to be added by adding sensor errors to the
sensor functional element. The program could have easily been extended to cover quantisation
errors by defining data with the same type and range defined in the model data notes. For
example, the gyro data has a range of 0 – 360 degrees defined as a real number represented in 12
bits resolution 0.088 degrees which is automatically updated when it exceeds its range.
In figure 53 the units for rates and offsets are in ms. The rates and offsets are used in conjunction
with the animator counter which currently counts in 50 microsecond steps. In figure 54 the units
are degrees.
4.4.4.6 Comparison between the results from calculation and animator
performance assessments
Calculation results (See Section 4.4.4.3)
Heading rate is 5 degrees per second.
The maximum error is 158 * 5/ 1000 = 0.79 degrees.
The minimum error is 0 degrees.
Animator results (without stochastic errors added) are shown in table 19.
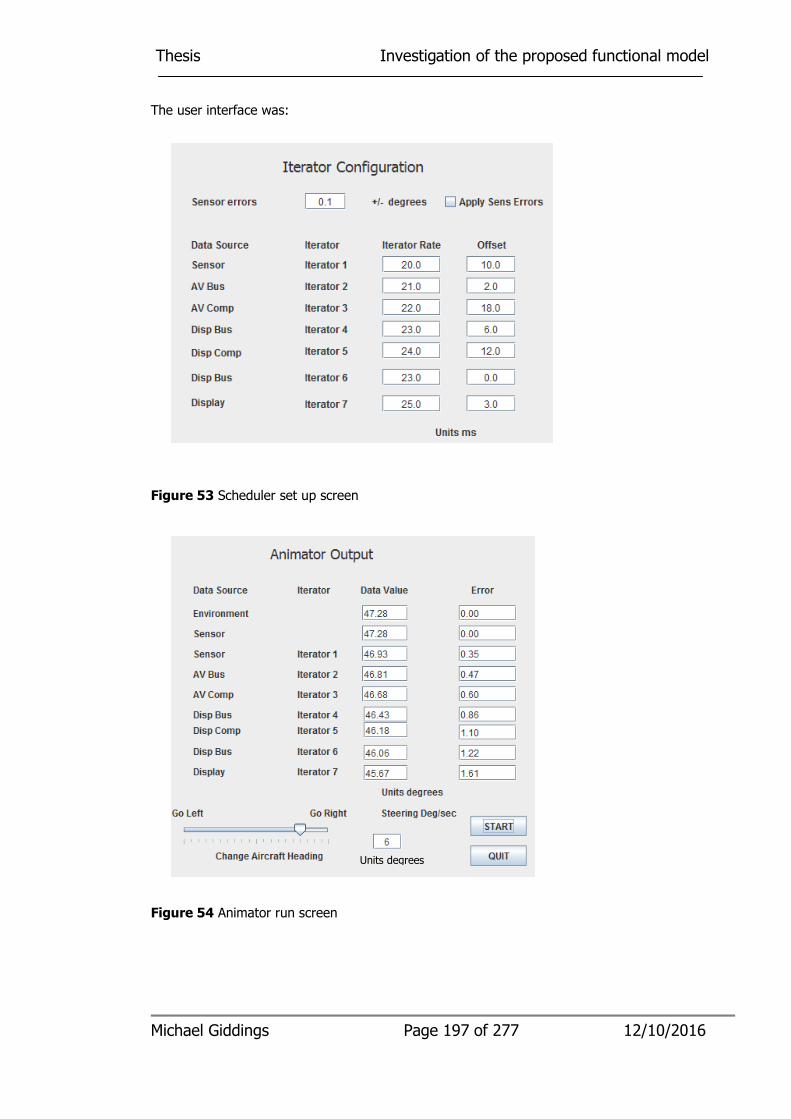
Thesis Investigation of the proposed functional model
Michael Giddings Page 197 of 277 12/10/2016
The user interface was:
Figure 53 Scheduler set up screen
Figure 54 Animator run screen
Units degrees
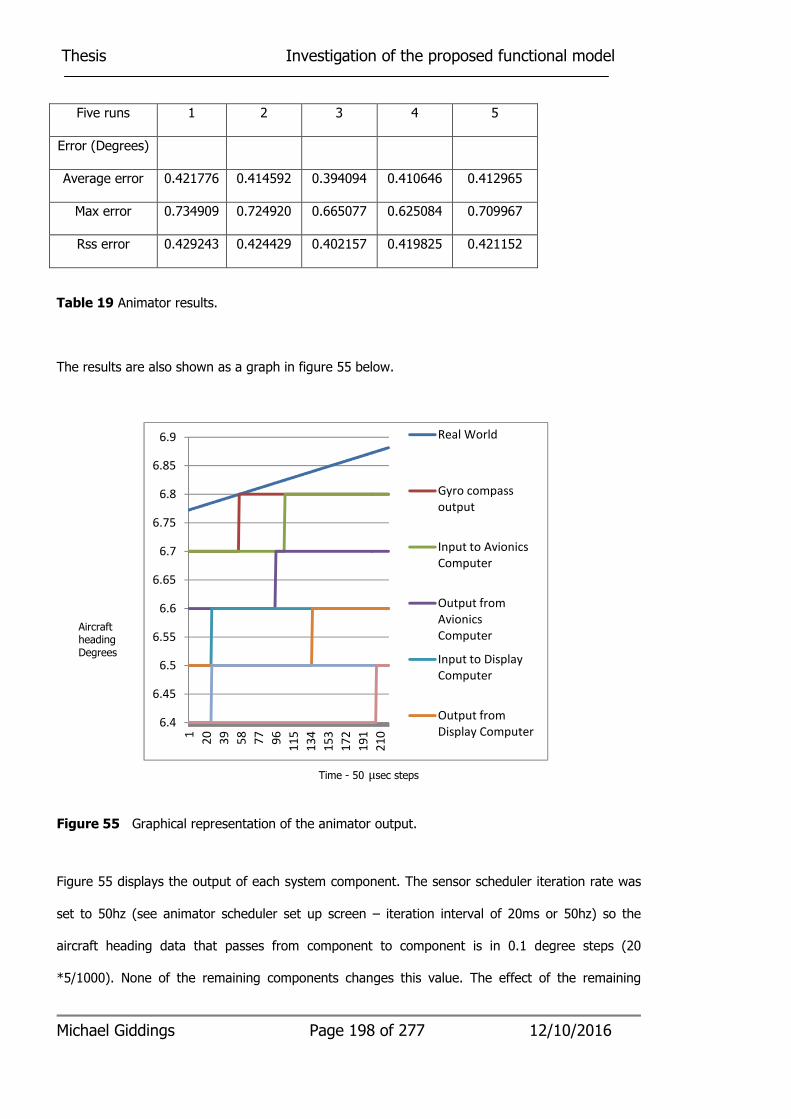
Thesis Investigation of the proposed functional model
Michael Giddings Page 198 of 277 12/10/2016
Table 19 Animator results.
The results are also shown as a graph in figure 55 below.
Figure 55 Graphical representation of the animator output.
Figure 55 displays the output of each system component. The sensor scheduler iteration rate was
set to 50hz (see animator scheduler set up screen – iteration interval of 20ms or 50hz) so the
aircraft heading data that passes from component to component is in 0.1 degree steps (20
*5/1000). None of the remaining components changes this value. The effect of the remaining
6.4
6.45
6.5
6.55
6.6
6.65
6.7
6.75
6.8
6.85
6.9
1
20
39
58
77
96
11
5
13
4
15
3
17
2
19
1
21
0
Real World
Gyro compass
output
Input to Avionics
Computer
Output from
Avionics
Computer
Input to Display
Computer
Output from
Display Computer
Five runs 1 2 3 4 5
Error (Degrees)
Average error 0.421776 0.414592 0.394094 0.410646 0.412965
Max error 0.734909 0.724920 0.665077 0.625084 0.709967
Rss error 0.429243 0.424429 0.402157 0.419825 0.421152
Aircraft heading Degrees
Time - 50 μsec steps
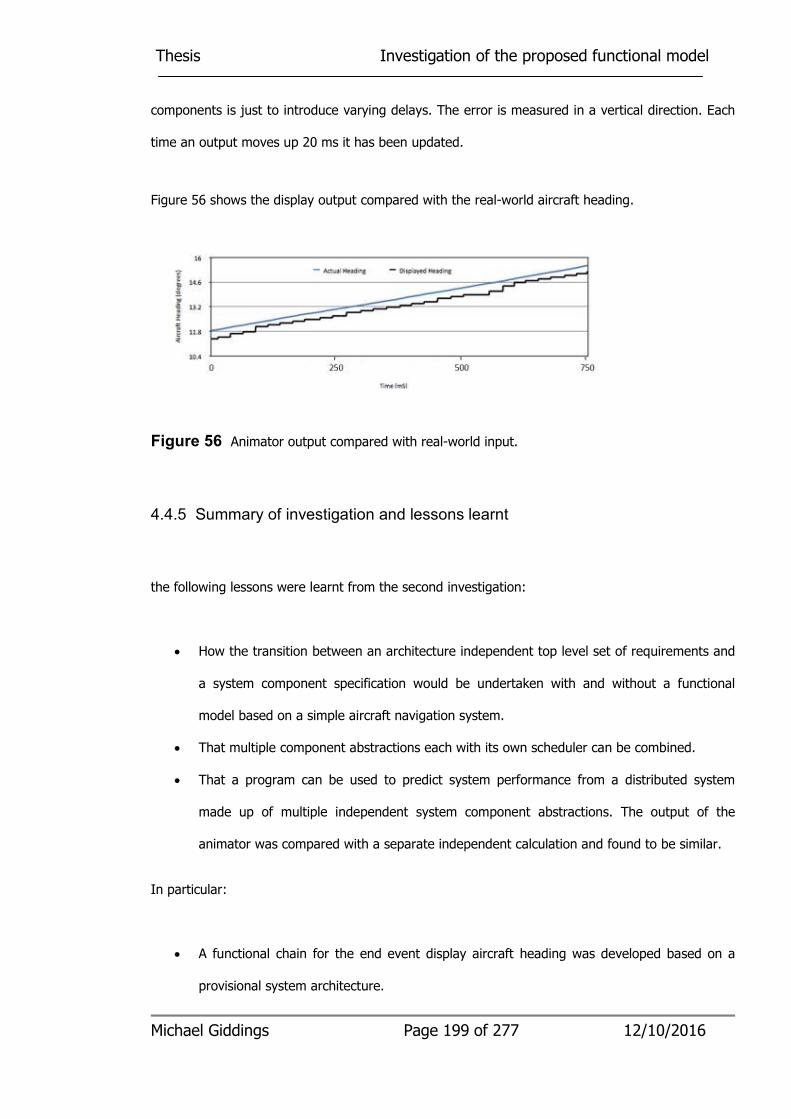
Thesis Investigation of the proposed functional model
Michael Giddings Page 199 of 277 12/10/2016
components is just to introduce varying delays. The error is measured in a vertical direction. Each
time an output moves up 20 ms it has been updated.
Figure 56 shows the display output compared with the real-world aircraft heading.
Figure 56 Animator output compared with real-world input.
4.4.5 Summary of investigation and lessons learnt
the following lessons were learnt from the second investigation:
• How the transition between an architecture independent top level set of requirements and
a system component specification would be undertaken with and without a functional
model based on a simple aircraft navigation system.
• That multiple component abstractions each with its own scheduler can be combined.
• That a program can be used to predict system performance from a distributed system
made up of multiple independent system component abstractions. The output of the
animator was compared with a separate independent calculation and found to be similar.
In particular:
• A functional chain for the end event display aircraft heading was developed based on a
provisional system architecture.

Thesis Investigation of the proposed functional model
Michael Giddings Page 200 of 277 12/10/2016
• Seven individual functional elements were used located in six components. Each
component was represented by an abstraction each with its own scheduler table.
• A system functional end event functional chain based on the display of gyro compass
sensor data was analysed.
• The dynamic error for display aircraft heading was calculated for the display aircraft
heading system end event. It became clear that the calculation of dynamic errors from
functional chains with multiple branches and where each functional element consists of
multiple inputs becomes increasing difficult with increasing system complexity.
• The dynamic error for display aircraft heading was animated by software for the display
aircraft heading system end event. It became clear that this approach could be used for
complex systems made up of multiple processing and non-processing components. A
limitation of the animator developed during the second investigation was that the animator
code would need to be developed for each system and modified each time the system was
modified.
• A comparison was made between the calculated and animated values for dynamic errors in
the end event display aircraft heading. This comparison was limited to a functional chain
where the dynamic errors can be easily calculated. The comparison of the animator output
and measured performance from the finally implemented system was not undertaken and
is identified in Section 6.4 – future work.
4.5 Third investigation
4.5.1 Introduction
This investigation examines a more complicated functional chain from the flight control system
introduced in the second investigation. A functional model was developed that includes the course
to steer functional requirement. A functional chain covering the ‘display course to steer’
requirement was then extracted and assessed for performance. This is a closed loop functional

Thesis Investigation of the proposed functional model
Michael Giddings Page 201 of 277 12/10/2016
chain as the functional chain end event would be used to manually or automatically steer the
aeroplane via a multicomputer flight control system.
A database was generated to record part of the functional model. This database was then used to
automatically generate the code for the animator.
4.5.2 Investigation aims
The aims of the investigation were as follows:
• To assess whether a simplified functional model could represent the calculation of course
to steer using independent functional elements.
• To determine how this functional model could be represented.
• To investigate how the functional model could be used to model system performance.
• To establish that the animator program code could be automatically generated.
4.5.3 Top level requirements
For most of the time, aircraft are navigated from GPS waypoint to GPS waypoint.
This is not so simple, as aircraft are affected by prevailing winds and the pilot’s inability to steer
the aircraft along the line that joins two waypoints.
Aircraft attempt to fly on the shortest route between two points. Unfortunately this means the
course that the aircraft steers changes as it moves between these points. The shortest route is
known as the great circle route. Nastro et al. [118] describe the mathematics of great circle
navigation.

Thesis Investigation of the proposed functional model
Michael Giddings Page 202 of 277 12/10/2016
The following diagrams introduce the terms that are going to be used. All directions relate to true
north – issues relating to magnetic compasses have been ignored.
Key
N True North
Heading Vector representing the direction that the aircraft is pointing and its
air speed.
Track Vector representing the movement of the aircraft relative to the
ground so that the aircraft moves towards the next waypoint.
Wind Vector representing wind speed and direction.
Required track Aircraft track with respect to the ground so that the aircraft moves towards the
next way point. This changes continually when the aircraft navigates a great
circle route.
This means that three types of correction are required as follows:
• Changes of the required course when the aircraft follows a great circle route.
• The effects of wind.
• The aircraft position is not on the line between the last and the next way point.
Figure 57 Velocity vector diagram Figure 58 Required track
Waypoint
Waypoint 1
Waypoint 2
Current position
Required track
Aircraft
Heading
Track
Wind
N
Thesis Investigation of the proposed functional model
Michael Giddings Page 203 of 277 12/10/2016
Two sensors are required to resolve these errors as follows: GPS and Gyro Compass.
The top level system end event is ‘display course to steer’ and the performance requirement is
display course to steer with an accuracy of +/- 1 degree.
4.5.4 Development of the system design without the functional model
4.5.4.1 Selection of a system hardware architecture
The system hardware architecture chosen is typical of a complex navigation system capable of
supporting the generation of a pilots course to steer display. In practice the functionality of the
generation of course to steer display would be much more complex. The selection of the system
hardware architecture would be undertaken during the generation of the component abstractions.
As this investigation deals with a single functional chain between the gyro compass and GPS
sensors and the display, much of the rest of the navigation system can be ignored during the
performance analysis.
The system design starts by allocating the major functions of the system to a system hardware
architecture. The initial selection of the physical hardware architecture is undertaken based on
previous experience. The overall system architecture is shown in figure 49. The system
architecture specifically for the heading display is shown as a simple block diagram in figure 59.
4.5.4.2 Allocation of functional requirements to system components
Having selected an initial hardware architecture a functional model is generated for each system
component.
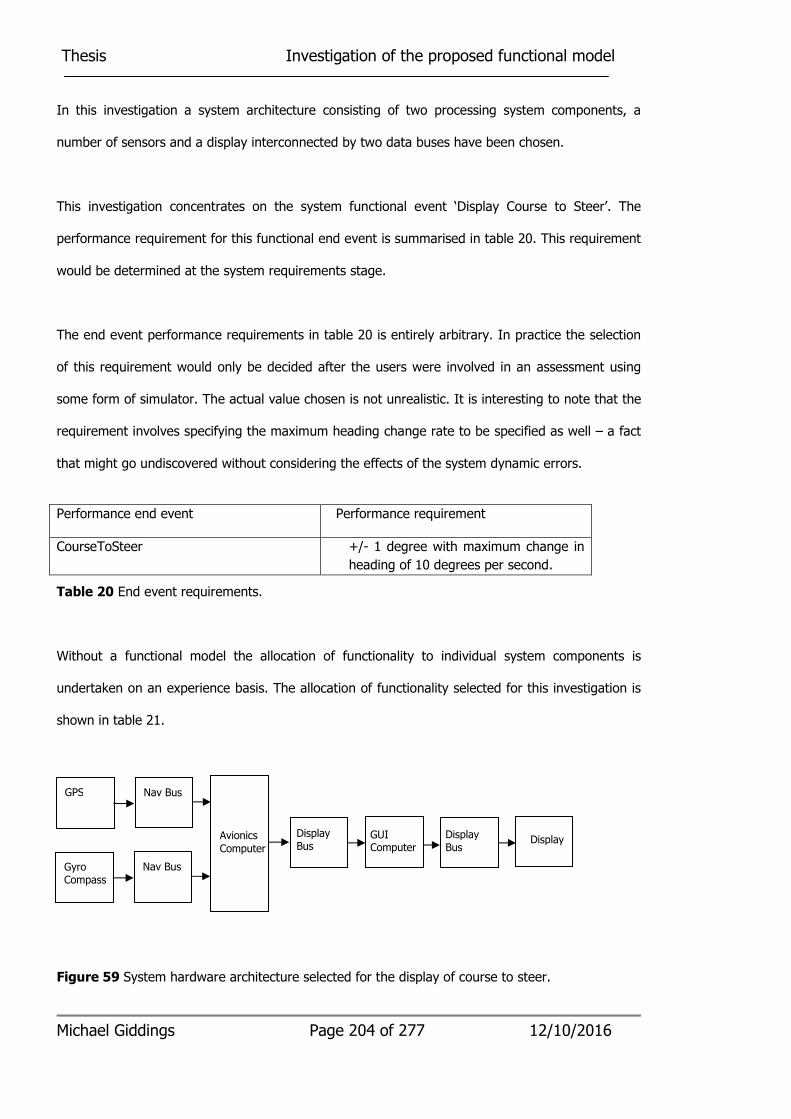
Thesis Investigation of the proposed functional model
Michael Giddings Page 204 of 277 12/10/2016
In this investigation a system architecture consisting of two processing system components, a
number of sensors and a display interconnected by two data buses have been chosen.
This investigation concentrates on the system functional event ‘Display Course to Steer’. The
performance requirement for this functional end event is summarised in table 20. This requirement
would be determined at the system requirements stage.
The end event performance requirements in table 20 is entirely arbitrary. In practice the selection
of this requirement would only be decided after the users were involved in an assessment using
some form of simulator. The actual value chosen is not unrealistic. It is interesting to note that the
requirement involves specifying the maximum heading change rate to be specified as well – a fact
that might go undiscovered without considering the effects of the system dynamic errors.
Table 20 End event requirements.
Without a functional model the allocation of functionality to individual system components is
undertaken on an experience basis. The allocation of functionality selected for this investigation is
shown in table 21.
Figure 59 System hardware architecture selected for the display of course to steer.
Performance end event Performance requirement
CourseToSteer +/- 1 degree with maximum change in
heading of 10 degrees per second.
GPS Nav Bus
Avionics
Computer
Display Bus
GUI Computer
Display Bus
Display
Gyro Compass
Nav Bus
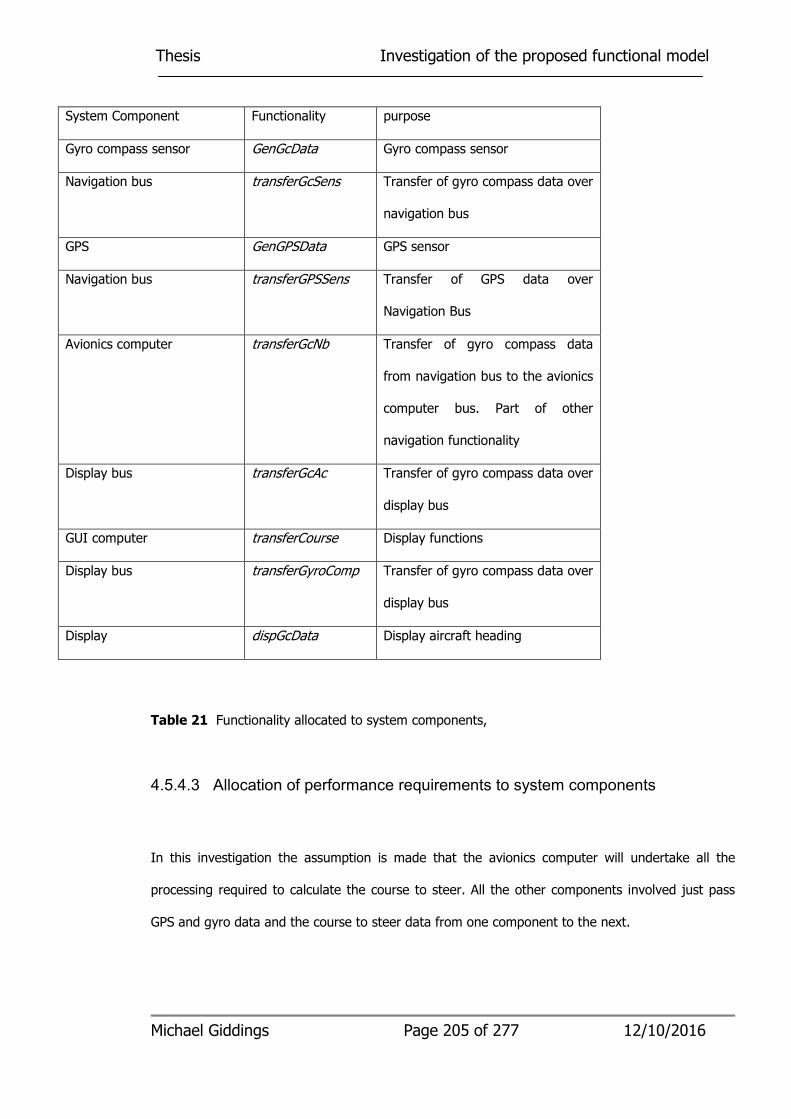
Thesis Investigation of the proposed functional model
Michael Giddings Page 205 of 277 12/10/2016
Table 21 Functionality allocated to system components,
4.5.4.3 Allocation of performance requirements to system components
In this investigation the assumption is made that the avionics computer will undertake all the
processing required to calculate the course to steer. All the other components involved just pass
GPS and gyro data and the course to steer data from one component to the next.
System Component Functionality purpose
Gyro compass sensor GenGcData Gyro compass sensor
Navigation bus transferGcSens Transfer of gyro compass data over
navigation bus
GPS GenGPSData GPS sensor
Navigation bus transferGPSSens Transfer of GPS data over
Navigation Bus
Avionics computer transferGcNb Transfer of gyro compass data
from navigation bus to the avionics
computer bus. Part of other
navigation functionality
Display bus transferGcAc Transfer of gyro compass data over
display bus
GUI computer transferCourse Display functions
Display bus transferGyroComp Transfer of gyro compass data over
display bus
Display dispGcData Display aircraft heading

Thesis Investigation of the proposed functional model
Michael Giddings Page 206 of 277 12/10/2016
4.5.4.4 Calculation of performance
The allocation of functional requirements is straight forward as all the course to steer calculation
will be undertaken in the avionics computer. The other components transfer data across the
system. The following questions remain:
• How can performance end event requirements be partitioned into individual system
components?
• The calculation of a great circle route involves a continually changing course between two
way points. How does this affect performance?
• Can the generation of the course to steer be used as an autopilot?
• What is the fastest aircraft heading change rate that can be undertaken and still satisfy the
course to steer performance requirements? (Dynamic error)
• What is the minimum performance requirements of the two sensors? (static, stochastic and
dynamic errors)
• What are the performance requirements of the two bus systems? (Dynamic errors). Is
there a need for direct data links?
• How fast will the system change from one pair of way points to the next?
• Is sensor filtering required and if so what is the effect on performance?
Further system performance analysis cannot be undertaken until performance information is
available after the start of the individual system components design. Estimates based on previous
experience could be used but lack the fidelity of analysis.
4.5.4.5 Performance management
The management of performance is more difficult here without a functional model. The interaction
between individual system components becomes more difficult to calculate without a detailed

Thesis Investigation of the proposed functional model
Michael Giddings Page 207 of 277 12/10/2016
design being available for each system component. Many systems are much more complex than
the system considered in this investigation and the calculation of system performance and
allocation of performance requirements to individual components becomes much less reliable.
4.5.5 Development of the system design with the functional model
4.5.5.1 Generation of the functional model
For the purposes of this investigation only the functionality that processes GPS and gyro compass
data will be considered.
The first stage of establishing a system functional model is to generate functional models for each
system component identified in the initial system hardware architecture. These functional models
are generated by the system design authority domain experts based on the outline requirements
generated by the customer. Figure 60 shows part of the overall functional model. In this
investigation all the system components with the exception of the avionics computer can be
represented by a single functional element which transfers GPS, gyro compass and courseToSteer
data from one system component to another.
The avionics computer system component needs to be decomposed into a function model as
shown in figure 61.
There are four modes shown in the functional model – these need to be analysed separately.
These are: DispCourseToSteer (forward), DispCourseToSteer (reverse), ChangeWayPoints and
LoadChangeWayPoints. (Figures 63-66)

Thesis Investigation of the proposed functional model
Figure 60 The DisplayCourseToSteer functional chain.
Michael Giddings Page 208 of 277 12/10/2016
gpsSens
GcSensor NavBus AvComp
DispBus
transfer
CTSDb
GUICom
Display
gcSens
avCTS
GuiGc dispCTS
Transfer
GCSens
transferCTSGuiComp
transfer
CTSAc
GenGcData
DispGC
Data
DispBus
env
env GenGpwsData
GpsSensor
Transfer
GpsSens
NavBus
AVCTSFwd
gpsTxr
gcTxr
dBCTS
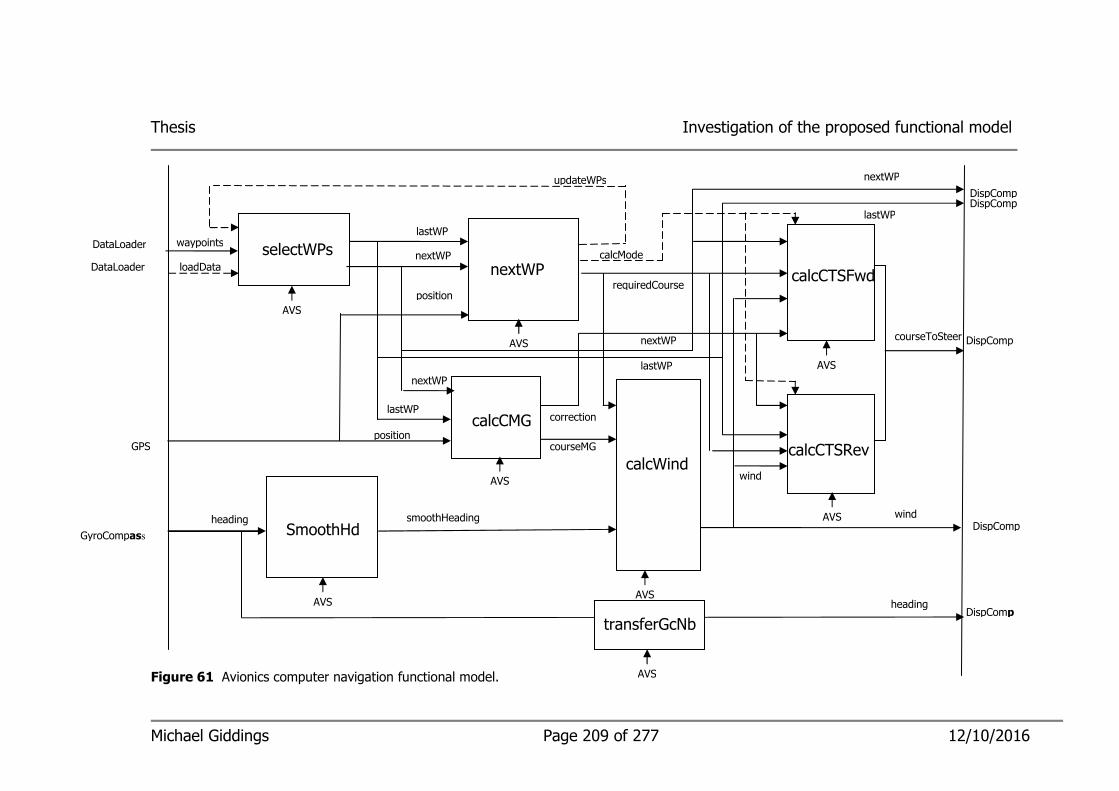
Michael Giddings Page 209 of 277 12/10/2016
Thesis Investigation of the proposed functional model
Figure 61 Avionics computer navigation functional model.
GyroCompass
DataLoader
DataLoader
GPS courseMG
transferGcNb
position
heading
waypoints
calcCMG
selectWPs
calcWind
SmoothHdg
calcCTSRev
nextWP
DispComp
DispComp
DispComp
updateWPs
lastWP
nextWP
courseToSteer
heading
smoothHeading
nextWP
nextWP
lastWP
nextWP
lastWP
position
wind DispComp
calcMode
wind
calcCTSFwd
AVS
AVS
AVS
AVS AVS
DispComp lastWP
AVS
AVS
AVS
loadData
requiredCourse
correction

Thesis Investigation of the proposed functional model
Michael Giddings Page 210 of 277 12/10/2016
4.5.5.2 Analysis of performance end events
Initial domain performance modelling suggests that two calculation methods are required: forward
and reverse calculation. The problem is that as the aircraft nears the next way point, the course to
steer becomes unstable and errors in heading and calculated wind causes instability.
To overcome this problem two modes of calculation are required: forward course to steer based on
the aircrafts current position and the next way point and reverse course to steer based on the
aircrafts current position and the last way point.
A further mode is also required. In this mode, data is loaded into or retrieved from the in system
waypoint library and the second is to update the waypoint pair data from the way point library
when it reaches a waypoint.
The investigation focuses on forward calculation. The modes can be represented by four different
iteration tables and described in a state diagram as shown in figure 62. The functional models for
each separate mode is shown in figures 65, 66, 67 and 68.

Thesis Investigation of the proposed functional model
Michael Giddings Page 211 of 277 12/10/2016
Figure 62 State chart showing transition between the four main course to steer sub chains.
Configuration
Change
waypoints
Steering towards
waypoint
Steering away from waypoint
configComp(self) /chMode(seChWP)
chWPComp(self) /chMode(STTwds)
dist(position.nextWP)<500 /chMode(ChWP)
dist(position,nextWP) <dist(lastWp,nextWP)/2 / chMode(STAway)

Thesis Investigation of the proposed functional model
Michael Giddings Page 212 of 277 12/10/2016
gpsSens
GcSensor NavBus AvComp
DispBus
transferCTSDb
GUICom
Display
gcSens
avCTS
GuiGc dispCTS
Transfer
GCSens
transferCTSGuiComp
transferC
TSAc
GenGcData
DispGCD
ata
DispBus
env
env GenGpwsData
GpsSensor
TransferGpsSens
NavBus
AVCTSFwd
gpsTxr
gcTxr
dBCTS
Figure 63 System Functional Chain DispCourseToSteer (Forward)
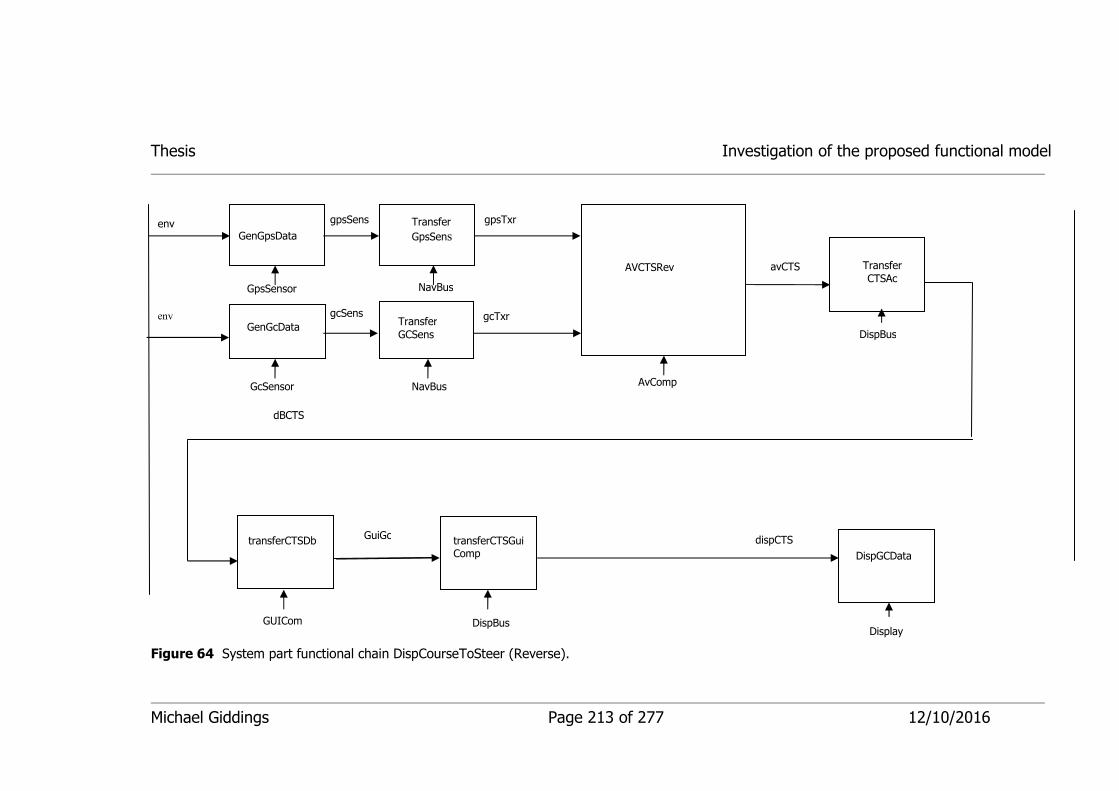
Michael Giddings Page 213 of 277 12/10/2016
Thesis Investigation of the proposed functional model
Figure 64 System part functional chain DispCourseToSteer (Reverse).
gpsSens
GcSensor NavBus AvComp
DispBus
transferCTSDb
GUICom Display
gcSens
avCTS
GuiGc dispCTS
Transfer
GCSens
transferCTSGuiComp
Transfer
CTSAc
GenGcData
DispGCData
DispBus
env
env GenGpsData
GpsSensor
Transfer
GpsSens
NavBus
AVCTSRev
gpsTxr
gcTxr
dBCTS
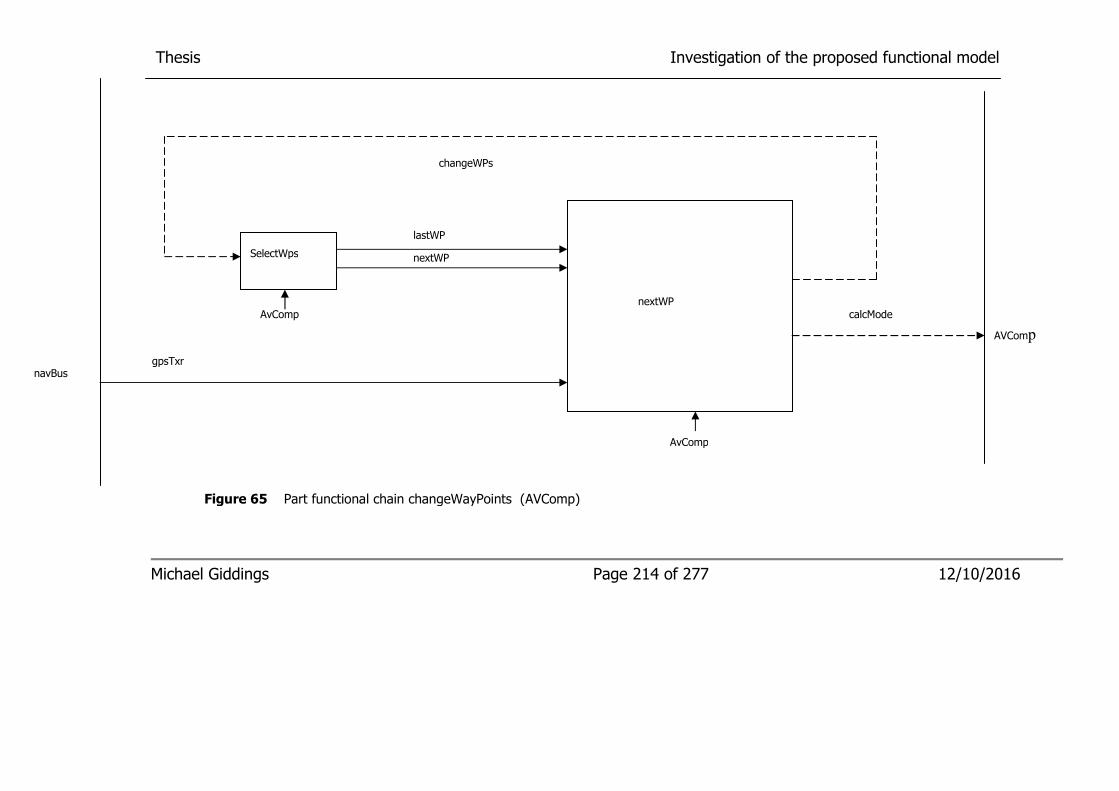
Thesis Investigation of the proposed functional model
Michael Giddings Page 214 of 277 12/10/2016
SelectWps
gpsTxr
AvComp
navBus
lastWP
nextWP
changeWPs
nextWP calcMode
AVComp
AvComp
Figure 65 Part functional chain changeWayPoints (AVComp)
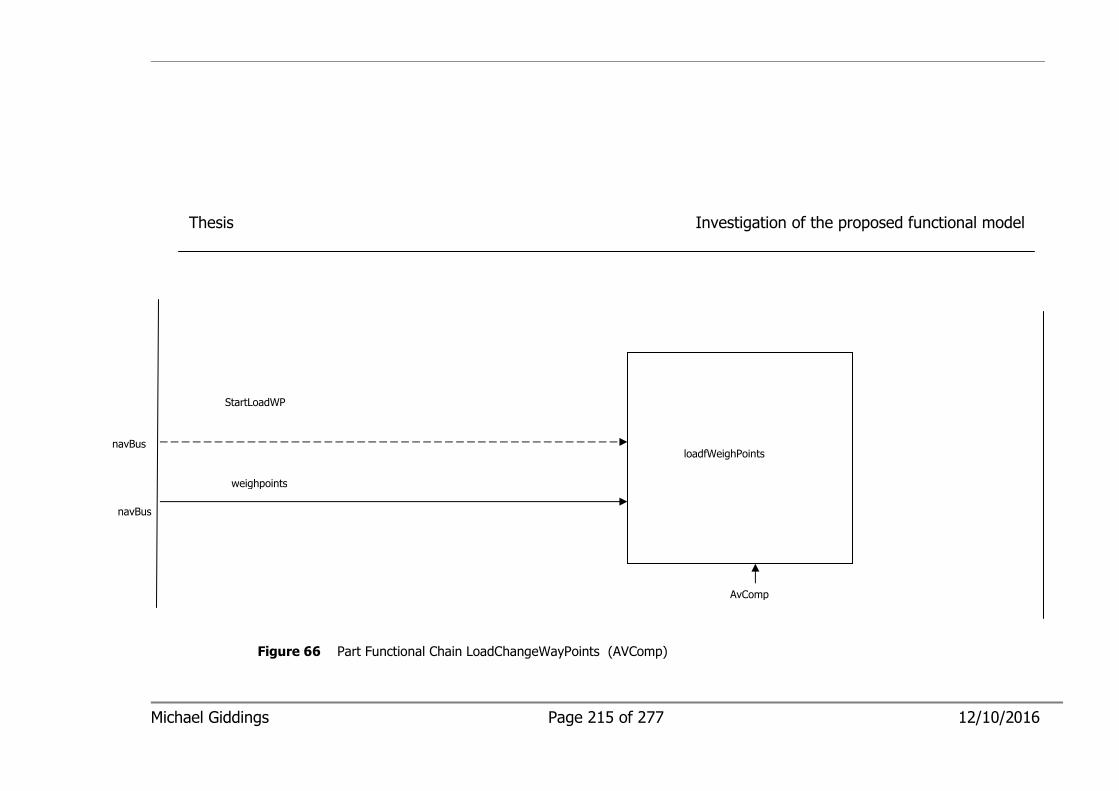
Michael Giddings Page 215 of 277 12/10/2016
Thesis Investigation of the proposed functional model
navBus
weighpoints
loadfWeighPoints
AvComp
StartLoadWP
navBus
Figure 66 Part Functional Chain LoadChangeWayPoints (AVComp)
Thesis Investigation of the proposed functional model
Michael Giddings Page 216 of 277 12/10/2016
4.5.5.3 Calculation of performance from functional chains
As the number and complexity of component functional models increase it becomes more and
more difficult to calculate and animate the expected performance of system end events. The
development of the system design to a point where component requirement specifications can be
generated requires the performance to be re-analysed many times as the requirements
specification emerges. This means the generation of animator code needs to be automated. This
investigation examines how this can be achieved.
Functional chains, once extracted, can be analysed to identify which legs directly contribute
towards the end event performance. Other functional chain legs can be ignored.
An example of this is the decision not to use Gyro compass smoothing provided in the functional
element SmoothHd in figure 61. Introduction of gyro compass smoothing may improve the fidelity
of the gyro compass data but increase the dynamic error delays in that part of the functional chain.
The key elements of the functional model can be recorded in a database as shown in appendix 3.
4.5.5.4 Automatic generation of animator code
The revised animator program structure was written in accordance with the animator class diagram
shown in figure 67. This meant that generic templates for the source code for the functional
elements and schedulers could be used and populated from information stored in the functional
model database.
A Java program was generated which linked information relevant to the functional chain shown in
figure 68 stored in a database in accordance with the ER diagram shown in appendix C which
populated these templates with appropriate data.

Thesis Investigation of the proposed functional model
Michael Giddings Page 217 of 277 12/10/2016
The key fields are for the database are defined in tables 22 – 27.
Scheduler
record type Description
IteratorName Text Unique name for the scheduler
IteratorId Int Unique reference
IMajorSize Int Number of iterations in a major cycle
ItSteps Int Number of iteration steps in the scheduler
ItRate Int The scheduler iteration rate
Table 22 Scheduler definition table.
FunctionalElement
record type Description
FEName Text Unique name for the functional
element
FEiId int Unique reference number
FEFunction MEDIUMTEXT Behaviour of the functional
element
OTFunction MEDIUMTEXT Supporting behaviour
ItOffset Int Iteration offset of first occurrence
in the scheduler iterator table
ItDelay Int Delay of functional element in
relevant iteration
ItFrequency Int Scheduler rate value
Table 23 Functional element definition table.
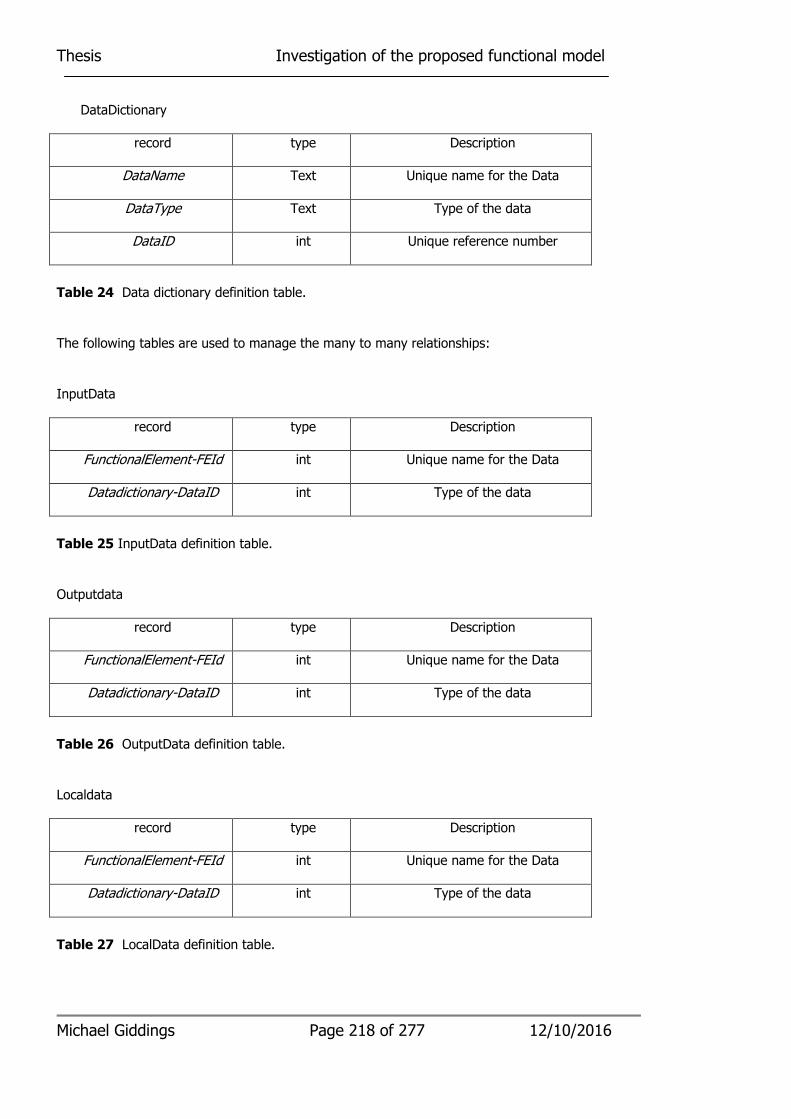
Thesis Investigation of the proposed functional model
Michael Giddings Page 218 of 277 12/10/2016
DataDictionary
record type Description
DataName Text Unique name for the Data
DataType Text Type of the data
DataID int Unique reference number
Table 24 Data dictionary definition table.
The following tables are used to manage the many to many relationships:
InputData
record type Description
FunctionalElement-FEId int Unique name for the Data
Datadictionary-DataID int Type of the data
Table 25 InputData definition table.
Outputdata
record type Description
FunctionalElement-FEId int Unique name for the Data
Datadictionary-DataID int Type of the data
Table 26 OutputData definition table.
Localdata
record type Description
FunctionalElement-FEId int Unique name for the Data
Datadictionary-DataID int Type of the data
Table 27 LocalData definition table.

Thesis Investigation of the proposed functional model
Michael Giddings Page 219 of 277 12/10/2016
The templates for functional element class specifications and scheduler class specifications are
attached as appendices D and F. The items shown in italics are derived from the database
representation of the functional model as shown in Appendix C. The animator code generator was
used to generate the functional element and scheduler class code is included in appendices E and
G.
Table 28 lists the appendices which give details of the programs used to automatically generate
the animator code.
Appendix Description
D Functional element generator
E Functional element class definition template
F Scheduler generator
G Scheduler class definition template
Table 28 Table of Appendices describing the programs used to generate animator program code.
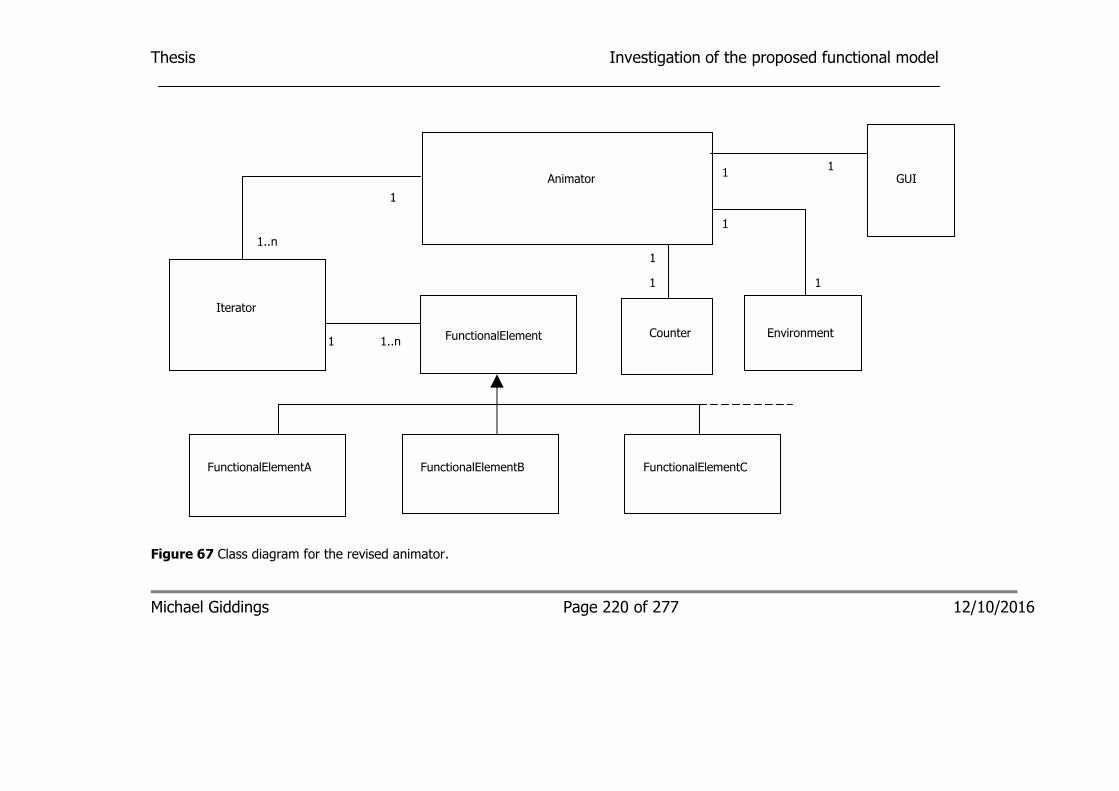
Thesis Investigation of the proposed functional model
Figure 67 Class diagram for the revised animator.
Michael Giddings Page 220 of 277 12/10/2016
FunctionalElement
Animator GUI
Iterator
FunctionalElementA FunctionalElementB FunctionalElementC
1..n
1
1 1
1..n 1 Counter Environment
1
1
1
1

Michael Giddings Page 221 of 277 12/10/2016
Thesis Investigation of the proposed functional model
Figure 68 Functional chain showing two independent functional elements within DispBus component.
GenGCData Transfer
GCSens
Transfer
GcNb
Transfer
GcAc
Display
GCsens GcNb GcAc
DispBus
Sensor NavBus
AvComp
DispGC
GUICom
Transfer
Course
DispGC
Data TransferGyro
Comp
GcDb
GuiGc
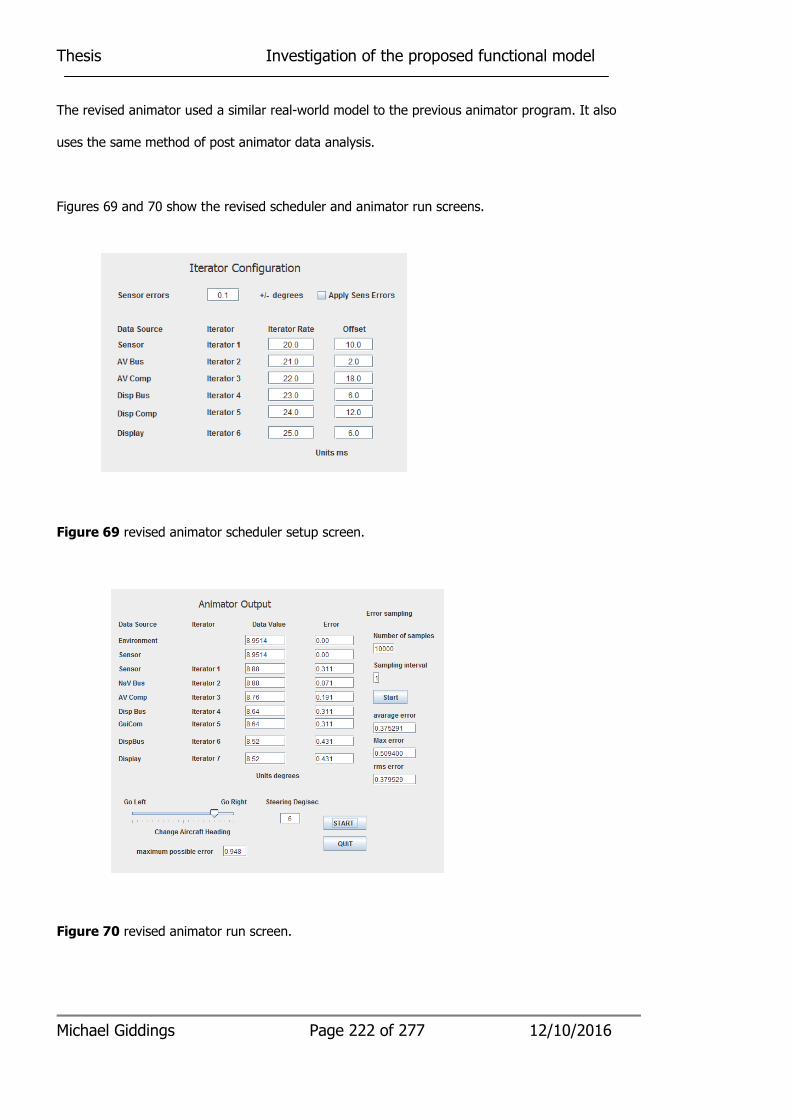
Thesis Investigation of the proposed functional model
Michael Giddings Page 222 of 277 12/10/2016
The revised animator used a similar real-world model to the previous animator program. It also
uses the same method of post animator data analysis.
Figures 69 and 70 show the revised scheduler and animator run screens.
Figure 69 revised animator scheduler setup screen.
Figure 70 revised animator run screen.
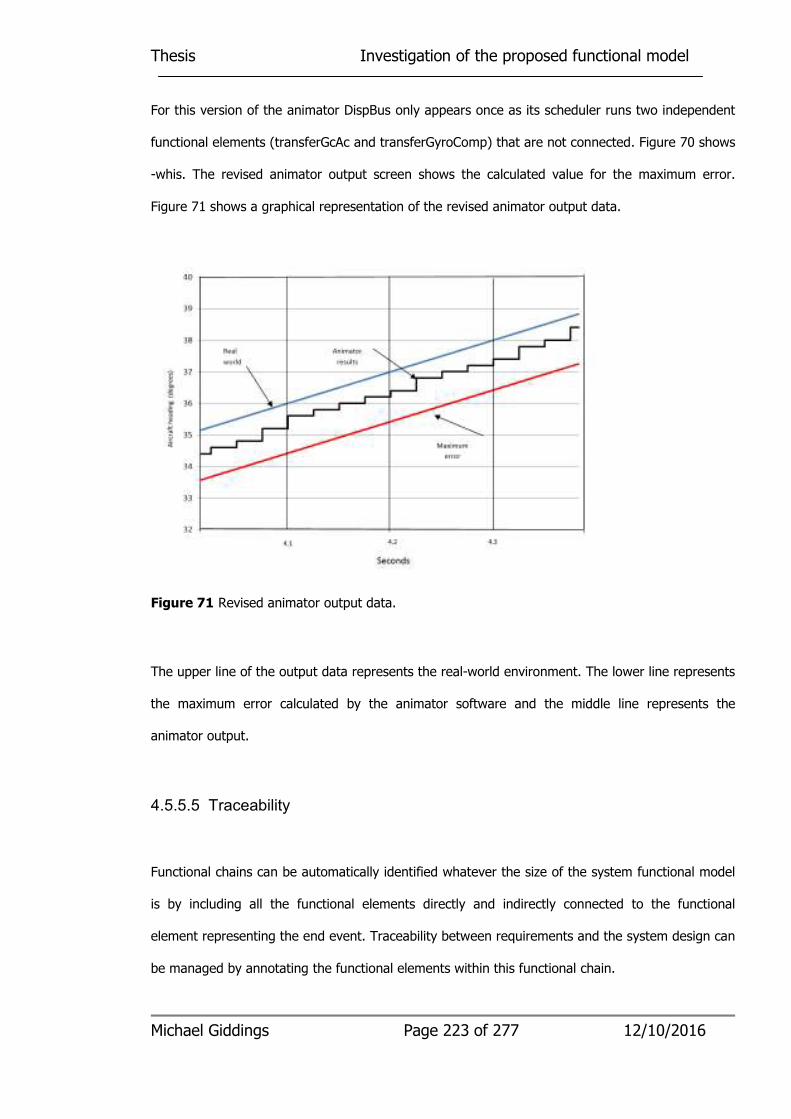
Thesis Investigation of the proposed functional model
Michael Giddings Page 223 of 277 12/10/2016
For this version of the animator DispBus only appears once as its scheduler runs two independent
functional elements (transferGcAc and transferGyroComp) that are not connected. Figure 70 shows
-whis. The revised animator output screen shows the calculated value for the maximum error.
Figure 71 shows a graphical representation of the revised animator output data.
Figure 71 Revised animator output data.
The upper line of the output data represents the real-world environment. The lower line represents
the maximum error calculated by the animator software and the middle line represents the
animator output.
4.5.5.5 Traceability
Functional chains can be automatically identified whatever the size of the system functional model
is by including all the functional elements directly and indirectly connected to the functional
element representing the end event. Traceability between requirements and the system design can
be managed by annotating the functional elements within this functional chain.

Thesis Investigation of the proposed functional model
Michael Giddings Page 224 of 277 12/10/2016
4.5.6 Summary of investigation and lessons learnt
• Functional chains relating to the generation of course to steer were established showing
four separate modes. The complexity of the required design emerges from the functional
model. CourseToSteer is part of a closed loop system made more complex because the
required track uses a great circle route. It is either an external closed loop when the pilot
follows the course to steer display or an internal closed loop with an autopilot. The design
risk is that actual aircraft course may be unstable with respect to the required track and
the change from one way point pair to the next pair irregular. The system design under
development needs to be assessed prior to component selection or inherent dynamic
delays might go undetected until the individual components are assembled during system
integration. The animator provides a tool for assessing the operation of this and similar
functional chains.
• A revised version of the animator was produced which used standard class definitions for
functional elements and schedulers. The functional chain from the second investigation
was used for comparison purposes.
• An animator code generator was developed using a database representation of the
functional model to provide information to populate functional element classes and
schedulers templates.
• The generation of the real-world input model and the system displays remain specific to
the system under development. Having developed these models changes to the system
design can be undertaken using the animator code generator.

Thesis Review of investigations
Michael Giddings Page 225 of 277 12/10/2016
Chapter 5 Review of investigations 5.1 Introduction
The research consisted of the following investigations:
• First investigation: The basic layout of the proposed functional model was investigated
based on a simple one processor weather station. Possible notations for the operation of a
scheduler were investigated. A functional chain was identified and potential simplifications
investigated.
• Second investigation: A system functional chain was defined based on the display of
aircraft heading generated by a gyro compass. A functional chain animator was developed.
The animator was used to assess the performance of the transfer of gyro compass data
using the functional chain identified above.
• Third investigation: A functional chain was defined based on the display course to steer
end event. Four separate modes were identified. A revised animator was generated using
standard templates for functional elements and schedulers. A system functional chain was
simulated using the revised animator. An animator code generator was developed which
populated the functional element and schedulers code templates from a database
representation of the functional model.
None of the investigations considered real systems. They were chosen because they included
examples of the issues experienced in much more complicated systems.
Thesis Review of investigations
Michael Giddings Page 226 of 277 12/10/2016
5.2 Summary of outcomes
5.2.1 Investigation of the new functional model
The first investigation used a simple weather station system to examine the basics of functional
element diagrams and the analysis of functional chains. Their structure has similarities to CoRE [6]
so is fully extensible. Functional elements were easy to generate using decomposition of major
requirements. The diagrams seemed intuitive and easy to use enabling domain experts to
undertake creative design activities. The model would have benefited from a computer based
graphical tool which automatically undertook consistency checks and search. Functional chains
were easy to extract and evaluate.
A specification was established for a scheduler which managed the operation of the functional
elements. The scheduler enabled functional elements to be used at different rates. A number of
component end events were identified and the display wind direction functional chain was
extracted and analysed. A method similar to critical path analysis was used to identify the parts of
the functional chain which are critical to the performance of the component end event. Again a
computer based tool would have made this easier to do.
The second investigation generated a functional model for a multi-component flight control system.
Functional models for a number of components were combined to represent a distributed system.
Each component was associated with a different scheduler which was controlled by its own clock.
An animator program was developed which ran each functional element in accordance with its own
scheduler. Each clock was capable of operating at different rates asynchronously. A real-world
model was included to simulate sensor inputs and a file was generated to collect the effects of the
sensor data on the system end event display gyro compass data. Real-world models were not
examined in detail but are likely to already exist from requirements models.
Thesis Review of investigations
Michael Giddings Page 227 of 277 12/10/2016
The third investigation used the functional model developed during the second investigation,
demonstrating that it is possible to record the functional model in a database. The animator
developed in the second investigation was rewritten so that the code could be automatically
generated from class templates populated with information from the functional model database.
The animator was extended to generate typical and worst case outputs which could be compared
with the real-world generated input. The worst case errors were calculated manually.
5.2.2 Calculation of dynamic errors
During the first investigation dynamic errors were calculated from first principles without using the
proposed functional model. It was possible to determine whether the hardware architecture would
support the system performance requirements prior to its detailed design. A functional model
based on an abstraction of the processor software enabled further detail to be considered. The
need for a coarse and fine wind direction sensor and sensor data filtering was also identified. It
was also possible to examine the dynamic errors due to the effects of the coarse and fine wind
direction sensor data.
It was established that the calculation of performance within a system component could be
simplified by extracting functional chains consisting of all the linked functional elements which
directly and indirectly connect to the functional element which represents a system end event.
Further simplification using a method, not unlike critical path analysis, enables the functional
elements that do not directly affect the performance of the end event to be ignored. Only simple
functional chains can be easily calculated.
The second investigation used a system functional chain derived from a part functional model of an
aircraft avionics system. The functional chain represented the transfer of gyro compass data from
a gyro compass to an aircraft heading display across a distributed multicomputer system. This
simple system functional chain was used as the manual calculation of the dynamic errors was

Thesis Review of investigations
Michael Giddings Page 228 of 277 12/10/2016
possible. The dynamic error associated with the system delays between the sensor and the display
was calculated for comparison with the results obtained from the animator described below.
The third investigation established that for more complex systems the calculation of dynamic errors
was not possible without some form of functional model capable of animation.
5.2.3 Animation/simulation of static, stochastic and dynamic errors
In the second investigation the aircraft heading display error was animated using a Java
animation/simulation program. The animation/simulation program demonstrated that it was
possible to combine component functional models to assess system functional chains. The program
generated a file which recorded the display output over time for various aircraft heading rates and
component iteration characteristics. The results of calculation and simulation were compared and
found to be similar. Stochastic errors due to sensor noise were also added to the sensor functional
element. Stochastic errors due to the digital resolution of data would also be possible by using the
appropriate digital representation of shared data messages in the animator software.
The functional chain used was chosen so that the maximum and minimum dynamic errors could be
calculated using the approach described in Section 3.8. The minimum and maximum calculated
errors were compared to the animator output for validation purposes. This chain used input from a
real-world model representing a linearly changing aircraft heading. A single real-world input was
used to simplify the real-world model. Inter-component output data was output to the NetBeans
output window and copied to a spreadsheet for analysis.
A revised animator program was generated in the third investigation to enable automatically
generated functional element and scheduler class specifications to be used. The program allowed
functional element and scheduler class specifications to be changed by swapping program classes
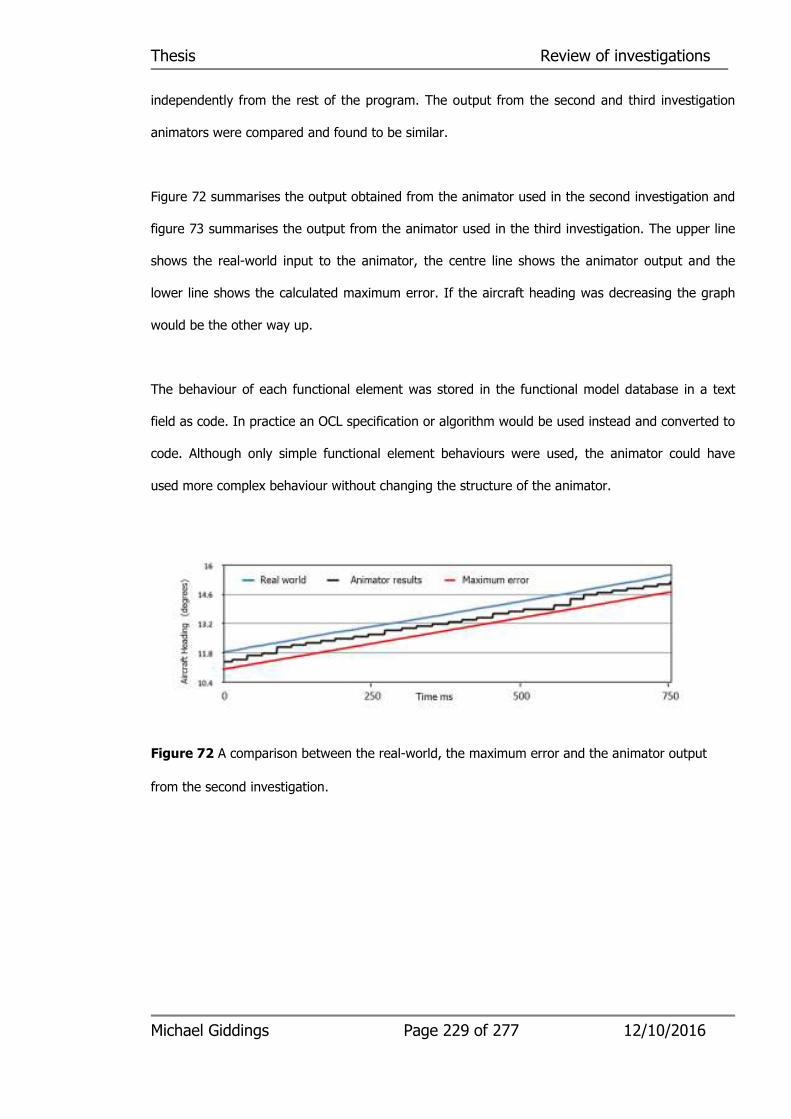
Thesis Review of investigations
Michael Giddings Page 229 of 277 12/10/2016
independently from the rest of the program. The output from the second and third investigation
animators were compared and found to be similar.
Figure 72 summarises the output obtained from the animator used in the second investigation and
figure 73 summarises the output from the animator used in the third investigation. The upper line
shows the real-world input to the animator, the centre line shows the animator output and the
lower line shows the calculated maximum error. If the aircraft heading was decreasing the graph
would be the other way up.
The behaviour of each functional element was stored in the functional model database in a text
field as code. In practice an OCL specification or algorithm would be used instead and converted to
code. Although only simple functional element behaviours were used, the animator could have
used more complex behaviour without changing the structure of the animator.
Figure 72 A comparison between the real-world, the maximum error and the animator output
from the second investigation.

Thesis Review of investigations
Michael Giddings Page 230 of 277 12/10/2016
Figure 73 A comparison between the real-world, the maximum error and the animator output
from the third investigation.
5.2.4 Automatic generation of animator/simulator code
The third investigation used a more complex functional model to investigate whether the animator
program code could be automatically generated. The investigation used a functional model
recorded in a database. The database recorded the functional element attributes, behaviour and
relationship between functional elements and was also used to record the scheduler characteristics
of each independent system component. Java class specifications were successfully generated for
a number of functional elements and schedulers.
Although the real-world model is integral to the operation of the animator it cannot be
automatically generated from the functional model database. Changes to the functional model
structure have a larger impact on the animator than changes to the functional elements and
scheduler. Although it is possible to generate this from the functional model database further work
is required on the animator to make this automatic.
Real-world
Animator
Results
Maximum error

Thesis Review of investigations
Michael Giddings Page 231 of 277 12/10/2016
As each independent functional element is specified in a single class specification and stored in a
functional element library there are no limits to the number which can be used.
The scheduler is specified in a single class and only requires the name of the instantiated
functional element object to operate. Each functional element uses the same method name to run
it. There are no limits to the number of schedulers which can be used. The only limitation is that
all the functional elements within an iteration can be executed in a time less than the iteration
interval. In the animation of the display aircraft heading schedulers are simple – in practice each
iteration may contain hundreds of functional elements. As the functional elements deployed within
an iteration are independent it is only necessary to use a multi-scheduler system with a scheduler
containing two independent functional elements to demonstrate its operation.
5.2.5 Comparison of functional models with the final system implementation
No comparison was undertaken of the accuracy of the functional model with any final system
implementation outcomes. If the functional model and its performance analysis are used to
generate the component performance requirements, the comparison will be dominated by how
well the component design authority meets the component design requirements. The system
functional design will need to be updated when component design details become available. For
COTS equipment the detail of the component design may never be available.
If the component software is implemented with process elements based on the functional elements
included in its functional model using a scheduler based on the same functional models schedule,
the performance of the implemented code will be similar to the results obtained from the animator.
As no component software was developed as part of this research, further investigation would be
needed to confirm this. If component software is not developed using the same structure and the
functional model and its animator, they can use the animator predicted performance as a
requirement to be met.

Thesis Review of investigations
Michael Giddings Page 232 of 277 12/10/2016
5.3 How does the result of the investigation answer the research question?
The research question is how can performance issues be detected in real-time periodic systems
prior to specifying system components when they are more expensive to fix. The research aims to
understand what problems exist in this phase and what can be done to overcome them.
The literature review also revealed that the performance analysis prior to component procurement
relied on previous experience with an attitude of 'fix-it-later' [11] when performance analysis starts
in earnest when the details of individual component design become available. Performance issues
due to errors and changes in requirements occur throughout the system development. The
approach identified in this research aims to identify performance problems that arise from
decisions made during the system development prior to the specification of system components.
Euusi-Mensah [12] claims that management and organisation are at the core of failed projects.
This problem is exacerbated by projects which have multiple teams in multiple companies located
in different countries.
Model driven development uses three models [15]: computation independent models, platform
independent models and platform specific models. For real-time systems a fourth is required which
should encompass the system design and cover system hardware components which contain and
do not contain software. Abstraction offers a means of specifying systems [18] which does not rely
on the actual implementation.
The research has revealed an alternative way of specifying the system design prior to the
specification of system components which provides the necessary information needed for
components contract and interface control documents. The specification of the system consists
of a series of abstractions which represent each system processing and non-processing

Thesis Review of investigations
Michael Giddings Page 233 of 277 12/10/2016
component together with abstractions representing system inter-component communications.
Each abstraction is combined to form a functional model of the system.
The research has identified a method for assessing and optimising system performance using
the functional model described above. This process offers the potential for identifying system
performance issues prior to component procurement.
The research has not shown that this method saves money.
5.4 The advantages and disadvantages of the model
The advantages of the proposed model are that it:
• Provides a graphical method of specifying the system design using abstractions for system
components that does not rely on component implementation details. Even though a full
commercial standard model was not developed the graphical nature of the model makes it
accessible to users and domain experts.
• The proposed additional model can be defined as an extension to UML. This enables it to
be integrated into the UML standards and to use existing UML diagrams.
• The proposed approach can be integrated into Model Driven Design approach by adding a
fourth model which covers functional requirements and hardware architectures for use
with CIMs, PIMs and PSMs.
• Provides a method of assessing performance using an animator which can be automatically
generated from a database representation of the functional model.
Thesis Review of investigations
Michael Giddings Page 234 of 277 12/10/2016
• Can be used in conjunction with model of output devices to get the feel of performance
rather than maximum and minimum error limits which would be obtained by calculation.
• Provides a much simpler way of assessing the performance of complex distributed system
rather than formal methods which require specialist skills.
Disadvantages:
• The development of functional model tool and associated animator is likely to be
expensive.
• The use of the model as requires extra work (and extra cost) to the system development.
5.5 Untested assumptions
The following assumptions were untested as The animator covered in the research was for
investigative purposes only. The development of a fully functioning model and animator has
been identified in the future work section of chapter 6.
• The model is fully extensible for large scale system development.
• A fully operational tool was economically or commercially feasible.
• The effectiveness of the proposed additional model in a real-system development project
was untested.
5.6 From theory to practice – how may the model be used?
For the proposed additional model to be used in practice a commercial tool would need to be
developed. The tool should contain a database and associated graphical interface for functional
Thesis Review of investigations
Michael Giddings Page 235 of 277 12/10/2016
models to be developed. The tool should include model consistency checking. The tool should
enable scheduler iteration tables to be stored and modified. The tool should also enable functional
chains to be extracted, analysed and optimised. Supporting real-world models and end-event
simulators should be developed as part of the model.
The tool should be used in a number of real system development projects to assess its usability
and effectiveness.
The model would be deployed by the system design authority in the following stages:
• Elaboration of the system requirements.
• Selection of a provisional hardware architecture selected on the basis of previous
experience.
• Selection of inter component communication links.
• Decompose requirements into functional elements and allocate to system components.
• Generation of a database representation of the functional model.
• Model consistency checks.
• Generate a scheduler for each component and communication link.
• Development of a real-world model to provide inputs to the functional model (this may
have already been done to assess the real-world requirements).
• Extract functional chains to check whether performance requirements are met, if not,
modify the functional model and scheduler and retest.
• Use the functional model to generate system component specification and interface control
document.
• Use the functional model to solve system level performance issues arising from
requirements changes, errors and component development shortfalls.

Thesis Review of investigations
Michael Giddings Page 236 of 277 12/10/2016

Thesis Conclusions summary and future work
Michael Giddings Page 237 of 277 12/10/2016
Chapter 6 Conclusions, Summary and Future Work
6.1 Introduction
The main aim of this research was to investigate the initial system design phase in the
development of distributed real-time systems to discover how the information content of
component contract specifications and interface control documents were generated from
elaborated system requirements to seek improvements to the process. The proposed functional
model is equivalent to the content of the component contact specifications and the interface
control documents and represents the information required by potential component design
authorities for costing purposes. The research revealed that for some systems, where different
teams were involved, the initial system design, and consequently the component requirements
specifications were not fully assessed for performance. A functional model was proposed to
overcome this problem. Three investigations were undertaken to assess the use of the functional
model.
6.2 Summary
6.2.1 Overview
The literature review in Chapter 2 reveals a gap in the development process which can, in certain
circumstances, lead to performance shortfalls in the system design which might not be discovered
until later in the system development. Section 2.5.3 identifies that system level requirements are
transferred to component requirements on a 'fix-it-later' basis. Unless this feedback of information
from the component design authority was effective, there was a risk that performance failures
might not be detected until system integration when it is most expensive to rectify.

Thesis Conclusions summary and future work
Michael Giddings Page 238 of 277 12/10/2016
The new functional model described in Chapter 3 was proposed to generate a lightweight system
design model using abstractions based on information which might be used for components
specifications and interface control documents. The model was analysed quantitatively using
specific examples and qualitatively as a proof of concept only.
An animator was developed during the second and third investigations as described in Chapter 4.
The model animator can be used to illustrate performance requirements for individual component
end events and can be used in addition to the component contract specifications and interface
control documents when appointing component design authorities. The component design
authority can compare these performance requirements with the results from component design
models. If the component software design uses process elements and a scheduler with the same
schedule table, the implemented software should have similar performance to that obtained using
the animator irrespective of the code language used.
6.2.2 The functional model
Section 1.1 suggests that abstractions of system components may be used to model components.
With this in mind, a graphical functional model is proposed as described in Chapter 3; it is based
on abstractions representing system components and communications. The functional model
describes processing, non-processing components and communication links (described in Section
2.2.1) which were either bespoke components or COTS equipments. Each component is described
individually so they could be combined with other component models to form a system level
functional model. Component functional models consisted of a collection of independent functional
elements linked by data paths and an associated scheduler.
The functional model is intended to be developed between the system requirements
model/definition stage and the selection of components design authorities and suppliers. The
Thesis Conclusions summary and future work
Michael Giddings Page 239 of 277 12/10/2016
model is then available to assess the effects of changes to the requirements, and the management
of the impact of component design issues on the system design.
The model is intended to be simple enough for both domain experts and system designers to
understand. The analysis of performance is undertaken by domain experts without needing to
know how each functional element and scheduler operate. Functional elements can be defined
independently from the scheduler by both domain experts and system designers. System architects
can optimise performance of the system by altering the scheduler tables without needing to know
in detail the behaviour of each functional element.
The first investigation described in Chapter 4 examines the identification and use of functional
chains. The model is capable of analysis using functional chains to extract only those functional
elements which affect specific system and component end events. These functional chains can be
split further into sub-chains which affect the end event to varying degrees. Those which do not
directly affect the performance of the end event can be identified with a process not unlike critical
paths in programme plans.
The performance of system and component functional chains can be calculated and animated to
assess end event performance. As functional chains become more complicated, performance
calculation becomes increasingly complex. Performance calculation typically identifies maximum
and minimum effects of dynamic errors. Animator software can be automatically generated from
database representations of the functional model. The animator and the automatic generation of
the animator code are not limited by the functional chain size. The output of the animator gives a
time based representation of the end event errors together with various statistical measurements
taken over a window of the simulated output. The animator does not, typically, calculate the
absolute maximum and minimum dynamic errors.

Thesis Conclusions summary and future work
Michael Giddings Page 240 of 277 12/10/2016
6.2.3 The proposed functional model as a part of Model-driven Development
Three types of model are identified as part of the model driven development process; CIMs, PIMS
and PSMs. The PIMs and PSMs are predominately component based software models. The CIMs
are system wide descriptions of behaviour. The new functional model contains a functional
description of both the hardware and software of the system. Either the OMG definition of a CIM
needs to be extended or a new model defined.
A key feature of model driven development models is the transformation between models which
are used within the system development process. Two types of transformation exist; the first is a
translation which does not contain extra information and the second is where extra detail is added.
The translation between a system requirements model and the proposed model requires extra
information, so an automatic translation is not possible. The translation between the proposed
extra model and the component contract specification and interface control documents is
potentially possible as no extra information is added. In practice, this translation is not automatic
as contact specification and interface control documents are textual. Comparison between the
system requirements, the functional model and the component contract specifications and
interface control documents is possible using a traceability tool such as DOORS and if necessary
extra requirements/design details can be added as they are identified.
The proposed model is intended to be initially generated from some point during the system
requirements definition phase and the generation of component contract specifications and
interface control documents. The model should be maintained as component design information is
available from the component design authorities. The model can be used to assess the impact of
new requirements or component shortcomings as they emerge.
Thesis Conclusions summary and future work
Michael Giddings Page 241 of 277 12/10/2016
6.2.4 Calculating performance from the functional model
Three types of functional chain can be assessed using functional chains. The first are linear
functional chains which transfer and calculate system information in only one direction. The display
of aircraft heading from the second investigation is an example of a linear functional chain. The
second type is a closed-loop functional chain, the feedback occurring in the real-world domain. An
example of this is where the pilot uses the course to steer display to control the direction the
aircraft flies in. The generation of course to steer information in the third investigation is an
example of this type. The third type e.g. an aircraft autopilot where the feedback is applied within
the system, was not assessed due to its complexity.
Three types of errors were assessed: static, stochastic and dynamic errors.
The performance of relatively simple functional chains can be calculated, but as the functional
chains become more complex this becomes increasingly difficult. Sensors, simple functional
element combinations and simple actuators were examined to confirm this complexity. The
dynamic errors are calculated in terms of maximum and minimum errors and generally do not
describe their statistical distribution.
6.2.5 A tool for early animation and simulation of performance
A tool was generated to animate functional chains. A simple one-input real-world model was used
as an input and the predicted animator output was collected at the end of each run and processed
using a spreadsheet. Two versions were developed to animate the system functional chain
identified in the second investigation (in Section 4.4) for the display of aircraft heading. Both
versions of the animator used a counter which represented time steps much shorter than the
iteration intervals of any of the component schedulers and instigates all the functional elements
which should be run within that interval before the counter incremented. It therefore did not run in

Thesis Conclusions summary and future work
Michael Giddings Page 242 of 277 12/10/2016
real-time but all functional elements were scheduled in the right order. The second version,
generated in the third investigation (see Section 4.5), enabled functional element and scheduler
classes to be generated for a database representation of the display aircraft heading functional
chain.
Both versions of the program instantiated functional element and scheduler objects which existed
for the entire animation in an object pool. The (large) limit to the number of objects which can be
instantiated at the same time could be overcome by saving the contents of each functional element
after it has been executed and destroying the functional element objects. All information requested
by functional elements would then need to be retrieved from the functional element records which
would slow down the animation.
The model includes the capability of selectively adding stochastic errors in the sensor functional
elements. The model did not assess stochastic errors generated by data quantisation due to the
increased complexity, but could have been included by defining the type, range and resolution of
all the functional element data. Stochastic errors from calculations would automatically be included
as the calculations are inherent in the functional element behaviour. It was assumed that static
errors could be removed by hardware or software adjustment.
A software tool was developed to automatically generate animator or simulation software from a
database representation of the functional model in the third investigation (described in Section
4.5.5.4), which can reliably be used to directly assess system performance system components
from within the system design without completely rewriting the animator program. The two
programs only provided proof of concept evidence of suitability.
The results from this program were compared with those obtained by calculation (in Section
4.4.4.6) and found to be similar.
Thesis Conclusions summary and future work
Michael Giddings Page 243 of 277 12/10/2016
6.2.6 Comparison between model-based performance assessment and system
implementation outcome
The final performance of the system may differ from that predicted by the proposed model for a
number of reasons. The final system performance relates to the design of each component. Each
component is designed to meet the requirements of each component. Differences between the
design and requirements for each component will make the model less representative. If the
functional model is updated with component design information as the development progresses,
the model remains consistent. If the functional model is replaced by other models based on the
design of each component and not updated, it is no longer relevant but has still fulfilled its purpose
in establishing component contract specifications and interface control documents. If the
component design uses the same software architecture as the model (functional elements and
schedulers), it also becomes more accurate.
6.3 Research Contribution
The research contribution of this thesis is the identification of a gap in the development of large
real-time distributed systems and the identification of a novel approach to modelling and animating
the system design early in the development process, to evaluate problems which arise during the
whole-system development, which impact the system design.
This thesis documents an investigation into how distributed real-time system requirements are
currently allocated to an initial system hardware architecture prior to generating requirements
specifications for system components. It identifies a difficulty in properly assessing whether an
initial hardware architecture will support the system requirements. It reveals that preliminary
system hardware architectures are proposed on an experienced-based 'fix-it-later' approach. Whilst
the 'fix-it-later' is inevitable, system level issues may be missed if they spread across component

Thesis Conclusions summary and future work
Michael Giddings Page 244 of 277 12/10/2016
boundaries. The structure and use of the functional model approach is suited to the skills available
to the system design team, so that it can be central to a team-based approach.
A graphical functional model associated with an animator can help resolve this problem. A
functional model which can mirror the detailed system requirements, and record how those
requirements are allocated to system components, will help formalise the process of defining
components. A method for system level analysis is demonstrated on two relatively simple systems.
The use of the model requires further investigation on a large distributed system to fully explore its
benefits. The functional model also needs a proper database graphical toolset and a fully functional
animator needs to be developed so that functional models can be reliably generated and
optimised.
Performance calculation is very complex and impracticable to repeat with every system design
change. A method for performance analysis has been investigated which can be automatically
generated from the database which records the functional model. Programs were written to
demonstrate proof of concept. The animation tool requires a scenario generator for its input and
method of recording the animator output.
The accuracy of the animator tool depends on how the system development proceeds from the
generation of component requirement specifications. Its benefits may only last until the
components requirements are established where it is replaced by other models when the
component design information becomes available. As it is possible to automatically generate
animator program code (an implementation of the functional model), it may be possible to
automatically generate implementation code for a software structure which uses process elements
and schedulers. If this structure is used with the same iteration schedules, the animator would be
representative of the final system implementation. This approach has not been investigated as part
of this research.
Thesis Conclusions summary and future work
Michael Giddings Page 245 of 277 12/10/2016
The following describes the functional model which was produced as part of the research.
• The proposed model collects together all the necessary information to investigate the
function and performance of system components in order to generate bespoke component
contract specifications or review COTS contract specifications and interface control
documents.
• It enables the system design to be completely contained in a single system design
repository.
• It is unambiguous, providing functional elements were correctly identified.
• It is comprehensive, covering bespoke and COTS components together with all
communication links.
• It enables data-hiding as specific behaviour and performance can be examined in isolation
using functional chains. It also allows individual functional elements representing a single
aspect of the design to be examined in isolation.
• It is accessible to domain experts as individual functional elements or a functional chain
can be traced to system requirements.
• It is accessible to system designers as the functional model can be traced to component
specifications and interface control documents.
• Performance analysis is possible. A functional chain animator was developed to examine
performance. An animator automatic source code generator was developed so that system
design changes could be examined without major animator program rewrites.
• It enables functional chains to be automatically selected by working back from a functional
end event including all functional elements linked by data.
• It allows simulation of part or whole of a functional chain. An animator was developed to
examine whole or part functional chains.
• Traceability is possible between system requirements, proposed functional model and
component requirements.

Thesis Conclusions summary and future work
Michael Giddings Page 246 of 277 12/10/2016
6.4 Future Work
The functional model needs to be monitored in an actual real-time system project to confirm that it
is simple and effective to use.
Only part-functional models have been developed for specific systems. The proposed model should
examine a greater range of processing and non-processing system components.
The functional model developed as part of this research is a simple prototype. A full-scale model
needs to be developed before it becomes viable for a real project. Such a model should have the
following features:
• A graphical database-based functional model needs to be developed comprising functional
model diagrams, functional chain extraction and scheduler tables. It needs to be graphical
to make it usable for users and domain experts to access.
• Inclusion of a better representation of the functionality associated with individual
functional elements. The current functional element algorithm field was populated with a
java statement as text. The automatic generation of an animator code should address
other representations such as OCL or text based algorithms. This would make the tool
more flexible.
• Development of full-scale animator with automatic code generated from within the
functional model database making the proposed model more usable.
• Functional model consistency checking. The generation of the functional model is
susceptible to human errors so some form of automatic consistency checks are required.

Thesis Conclusions summary and future work
Michael Giddings Page 247 of 277 12/10/2016
• Development of a flexible multi-output real-world model to provide inputs to and accept
outputs from the functional model. The real world model used to investigate the animator
only generated a single linear input. A full scale animator needs to generated multiple
inter-related inputs to represent complex real world scenarios.
• Development of a data recording system to record internal and external data. The
animator that was investigated only had basic output data capabilities.
• Development of a real-time recorded data playback system with graphical representation
to display intermediate data or displays and actuators. This was not assed within this
research.
• The impact of the functional model to the 'fix-it-later' nature of the design process needs
to be examined to see what types of system would benefit from a functional model. Only
periodic systems that operate in a periodic way were investigated.
• The accuracy of the model performance predictions need to be compared with the final
implemented system performance. This can only be done by using the proposed additional
model alongside existing methods for a number of development projects and is outside the
scope of this research.
The three investigations assessed the use of the proposed functional model using selected
examples of real-time systems. This established the operation of the model, functional chains and
the animator as a proof of concept only. The proposed approach needs to be investigated in
conjunction with a real large real-time distributed development project. The development of a full-
scale animator is beyond the scope of this research.
Thesis Conclusions summary and future work
Michael Giddings Page 248 of 277 12/10/2016
A functional model is an extra cost at the start of the development. Investigation is required to
establish whether the potential cost benefits of using a functional model to identify system
performance shortcomings early outweigh this extra cost. Analysis of the use of contingency
budgets is difficult because these are rarely published.
6.5 Conclusions
The use of a functional model may save development costs for large distributed real-time systems
in certain circumstances. The most likely type of system to benefit is large low-volume complex
systems developed by multiple teams and organisations involving multiple customers where
specific functionality is implemented on multiple components. Systems where the hardware
architecture affects its performance, and where its functionality is distributed between its hardware
components, increases its sensitivity to performance shortfalls which may be detected late in the
development process. Large bespoke system components with long development lifecycles magnify
the costs of design changes. The least likely systems to benefit from this approach are smaller,
high-volume systems developed entirely by a single organisation.
Thesis References
Michael Giddings Page 249 of 277 12/10/2016
References
1. Woodside, M., G. Franks, and D.C. Petriu. The Future of Software Performance
Engineering. in Future of Software Engineering, 2007. FOSE '07. 2007. Minneapolis, MN
2. McManus, J. and T. Wood-Harper, Understanding the Sources of Information Systems
Project Failure. Management Services, 2007. 51(3): p. 38-43.
3. Pop, P., et al., Analysis and optimization of distributed real-time embedded systems. ACM
Transactions on Design Automation of Electronic Systems, 2006. 11(3): p. 593.
4. Karimpour, J., A. Isazadeh, and H. Izadkhah, Early performance assessment in component-
based software systems. IET Software, 2012. 7(2): p. 118-128.
5. Raistrick, C. and T. Bloomfield, Model Driven Architecture – An Industry Perspective, in
Architecting Dependable Systems II. 2004. p. 330-350.
6. Mullery, G.P., CORE - a method for controlled requirement specification, in Proceedings of
the 4th international conference on Software engineering. 1979, IEEE Press: Munich,
Germany.
7. Messaoudi, M., Requirements Engineering Through Viewpoints International Journal of
Computing Academic Research (IJCAR), 2013. 2(2): p. 49-59.
8. OMG. Unified Modeling Language 2.3. 2010; Available from: http://www.uml.org.
9. Smith, C.W., Murry Performance Validation at Early Stages of Software Development.
1999.
10. Torkar, R., et al., Requirements traceability: A systematic Review and Industry Case Study.
International Journal of Software Engineering & Knowledge Engineering, 2011. 22(3): p.
385-433.
11. Smith, C., Performance Engineering of software systems. 1990: Addison Wesley.
12. Ewusi-Mensah, K., Software Development Failures. 2003: Publisher: MIT Press 276.
13. Douglass, B.P., ed. Doing Hard Time. 2000, Addison Wesley.
14. OMG. OMG Model Driven Architecture. 2003; Available from: www.uml.org.
Thesis References
Michael Giddings Page 250 of 277 12/10/2016
15. OMG. MDA Guide Version 1.0.1 OMG/2003-06-01. 2003; Available from:
<http://www.omg.org/docs/omg/03-06-01.pdf>.
16. OMG, OMG Systems Modelling Language (SysML) 1.2. 2010.
17. OMG, OMG Profile ‘UML Profile for MARTE’ 1.0. 2009.
18. Selic, B., The pragmatics of model-driven development. Software, IEEE, 2003. 20(5): p.
19-25.
19. Becker, S., et al., Performance Prediction of Component-Based Systems – A Survey from
an Engineering Perspective, in Architecting Systems with Trustworthy Components. 2006.
p. 169-192.
20. Smith, C., Introduction to Software Performance Engineering: Origins and Outstanding
Problems, in Formal Methods for Performance Evaluation. 2007. p. 395-428.
21. Koziolek, H., Performance evaluation of component-based software systems: A survey.
Performance Evaluation, 2010. 67(8): p. 634-658.
22. Balsamo, S., et al., Model-based performance prediction in software development: a
survey. Software Engineering, IEEE Transactions on, 2004. 30(5): p. 295-310.
23. Kavi, K., R. Akl, and A. Hurson, Real-Time Systems: An Introduction and the State-of-the-
Art, in Wiley Encyclopedia of Computer Science and Engineering. 2007, John Wiley & Sons,
Inc.
24. Alenljung, B. and A. Persson, Portraying the practice of decision-making in requirements
engineering: a case of large scale bespoke development. Requirements Engineering, 2008.
13(4): p. 257-279.
25. Jilani, A.K., Using COTS components in software development. AIP Conference
Proceedings, 2008. 1052(1): p. 203-208.
26. Naganathan, E.R. and X.P. Eugene. Software Stability Model (SSM) for Building Reliable
Real Time Computing Systems. in Secure Software Integration and Reliability
Improvement, 2009. SSIRI 2009. Third IEEE International Conference on. 2009.

Thesis References
Michael Giddings Page 251 of 277 12/10/2016
27. Bonjour, E., S. Deniaud, and J.-P. Micaëlli, A method for jointly drawing up the functional
and design architectures of complex systems during the preliminary system-definition
phase. Journal of Engineering Design, 2012. 24(4): p. 305-319.
28. Kopetz, H. The Complexity Challenge in Embedded System Design. in Object Oriented
Real-Time Distributed Computing (ISORC), 2008 11th IEEE International Symposium on.
2008.
29. Sangiovanni-Vincentelli, A., Quo Vadis, SLD? Reasoning About the Trends and Challenges
of System Level Design. Proceedings of the IEEE, 2007. 95(3): p. 467-506.
30. Sinha, N.K., Control Systems. 1994, New Age International.
31. Lee, E.A. Cyber Physical Systems: Design Challenges. in Object Oriented Real-Time
Distributed Computing (ISORC), 2008 11th IEEE International Symposium on. 2008.
32. Rajkumar, R., et al., Cyber-physical systems: the next computing revolution, in
Proceedings of the 47th Design Automation Conference. 2010, ACM: Anaheim, California.
33. Lakshmanan, K., et al. Resource Allocation in Distributed Mixed-Criticality Cyber-Physical
Systems. in Distributed Computing Systems (ICDCS), 2010 IEEE 30th International
Conference on. 2010.
34. CMS Selecting a development approach. 2008.
35. Ramos, A.L., J.V. Ferreira, and J. Barcelo, Model-Based Systems Engineering: An Emerging
Approach for Modern Systems. Systems, Man, and Cybernetics, Part C: Applications and
Reviews, IEEE Transactions on, 2012. 42(1): p. 101-111.
36. McManus, J. A stakeholder perspective within software engineering projects. in
Engineering Management Conference, 2004. Proceedings. 2004 IEEE International. 2004.
37. Cellucci, T. Developing operational requirements. 2008; Available from:
http://www.dhs.gov/xlibrary/assets/Developing_Operational_Requirements_Guides.pdf.
38. Rahmani, K. and V. Thomson, Ontology based interface design and control methodology
for collaborative product development. Computer-Aided Design, 2011. 44(5): p. 432-444.
Thesis References
Michael Giddings Page 252 of 277 12/10/2016
39. Bondi, A.B., Best practices for writing and managing performance requirements: a tutorial,
in Proceedings of the 3rd ACM/SPEC International Conference on Performance
Engineering. 2012, ACM: Boston, Massachusetts, USA.
40. Vignes, J. Discrete Stochastic Arithmetic for Validating Results of Numerical Software.
2004. Kluwer Academic.
41. Tipsuwan, Y. and M.-Y. Chow, Control methodologies in networked control systems.
Control Engineering Practice, 2003. 11(10): p. 1099-1111.
42. Finkelstein, A. and J. Dowell. A comedy of errors: the London Ambulance Service case
study. in Software Specification and Design, 1996., Proceedings of the 8th International
Workshop on. 1996.
43. Grottke, M. and K.S. Trivedi, Fighting bugs: remove, retry, replicate, and rejuvenate.
Computer, 2007. 40(2): p. 107-109.
44. Perathoner, S., et al., Influence of different abstractions on the performance analysis of
distributed hard real-time systems. Design Automation for Embedded Systems, 2009.
13(1): p. 27-49.
45. Li, M. and S. Liu, Integrating Animation-Based Inspection Into Formal Design Specification
Construction for Reliable Software Systems. IEEE Transactions on Reliability, 2016. 65(1):
p. 88-106.
46. Ammar, R., A. Abdel-raouf, and T.A. Fergany. Performance modeling and analysis of object
oriented distributed software systems: A necessary step toward software performance
stability. in Computer Systems and Applications, 2005. The 3rd ACS/IEEE International
Conference on. 2005.
47. Babamir, Real time systems, architecture, scheduling and application. 2012, IntechOpen.
48. Hinchey, M., et al., Software Engineering and Formal Methods. Communications of the
ACM, 2008. 51(9): p. 54-59.
49. Pfleeger, S.L. and L. Hatton, Investigating the influence of formal methods. Computer,
1997. 30(2): p. 33-43.

Thesis References
Michael Giddings Page 253 of 277 12/10/2016
50. Bowen, J.P. and M.G. Hinchey, Ten commandments of formal methods... ten years later.
Computer, 2006. 39(1): p. 40-48.
51. Clarke, E.M. and J.M. Wing, Formal methods: state of the art and future directions. ACM
Comput. Surv., 1996. 28(4): p. 626-643.
52. Kreiker, J., et al., Modeling, Analysis, and Verification - The Formal Methods Manifesto
2010 Dagstuhl Perspectives Workshop 10482. Dagstuhl Manifestos, 2011. 1(1): p. 21-40.
53. Hoare, C.A.R., Communicating Sequential Processes. 2004.
54. Milner, R., A Calculus of Communicating Systems. 1980: Springer.
55. Bergstra, J.A. and J.W. Klop, Algebra of communicating processes with abstraction.
Theoretical Computer Science, 1985. 37(0): p. 77-121.
56. Peterson, J.L., Petri Nets. ACM Comput. Surv., 1977. 9(3): p. 223-252.
57. Bicchierai, I., et al., Combining UML-MARTE and Preemptive Time Petri Nets: An Industrial
Case Study. Industrial Informatics, IEEE Transactions on, 2013. 9(4): p. 1806-1818.
58. UWSDoD, MIL-STD-498. 1994.
59. Staines, T.S. Using a timed Petri net (TPN) to model a bank ATM. in Engineering of
Computer Based Systems, 2006. ECBS 2006. 13th Annual IEEE International Symposium
and Workshop on. 2006.
60. Carnevali, L., L. Ridi, and E. Vicario, Putting Preemptive Time Petri Nets to Work in a V-
Model SW Life Cycle. Software Engineering, IEEE Transactions on, 2011. 37(6): p. 826-
844.
61. Ameedeen, M.A., B. Bordbar, and R. Anane, Model interoperability via Model Driven
Development. Journal of Computer & System Sciences, 2011. 77(2): p. 332-347.
62. Bushehrian, O., H. Ghaedi, and R.G. Baghnavi, Automated Transformation of Distributed
Software Architectural Models to Finite State Process. International Journal on Computer
Science & Engineering, 2010: p. 3120-3125.
63. Athamena, B. and Z. Houhamdi, A Petri Net Based Multi-Agent System Behavioral Testing.
Modern Applied Science, 2012. 6(3): p. 46-57.

Thesis References
Michael Giddings Page 254 of 277 12/10/2016
64. Zoitl, A. and R. Lewis, Modelling Control Systems Using IEC 61499 (2nd Edition).
Institution of Engineering and Technology.
65. McInnes, A.I., B.K. Eames, and R. Grover, Formalizing Functional Flow Block Diagrams
Using Process Algebra and Metamodels. IEEE Transactions on Systems, Man, and
Cybernetics - Part A: Systems and Humans, 2011. 41(1): p. 34-49.
66. Rumbaugh, J., et al., Object-oriented modeling and design. Vol. 199. 1991: Prentice-hall
Englewood Cliffs, NJ.
67. Smith, C.U., Software Performance Engineering Then and Now: A Position Paper, in
Proceedings of the 2015 Workshop on Challenges in Performance Methods for Software
Development. 2015, ACM: Austin, Texas, USA. p. 1-3.
68. Sanchez, J.L.F. and G.M. Acitores. Modelling and evaluating real-time software
architectures. in Reliable Software Technologies - Ada-Europe 2009. 14th Ada-Europe
International Conference on Reliable Software Technologies. 2009. Brest, France: Springer
Verlag.
69. Andersson, H., et al., Experience from introducing Unified Modeling Language/Systems
Modeling Language at Saab Aerosystems. Systems Engineering, 2009. 13(4): p. 369-380.
70. Ames, B., Avionics designers plan for another decade with the 1553 databus. Military &
Aerospace Electronics, 2004. 15(3): p. 22-28.
71. Shafy, A. All descrites are not created equal. Available from: http://mil-
embedded.com/articles/all-discretes-not-created-equal/.
72. Eidson, J.C., et al., Distributed Real-Time Software for Cyber-Physical Systems.
Proceedings of the IEEE, 2013. 100(1): p. 45-59.
73. Wu, J. Stress testing software to determine fault tolerance for hardware failure and
anomalies. in AUTOTESTCON, 2012 IEEE. 2012.
74. Zaitsev, D.A., Paradigm of computations on the Petri nets. Automation and Remote
Control, 2013. 75(8): p. 1369-1383.
75. Franks, G., et al., Enhanced modeling and solution of layered queueing networks. IEEE
Transactions on Software Engineering, 2009. 35(2 SPEC. ISS.): p. 148-161.

Thesis References
Michael Giddings Page 255 of 277 12/10/2016
76. Telelogic, StateMate, P.B. Telelogic AB, Kungsgatan 6, SE-203 12 Malmo, Sweden, Editor.
77. Bode, E., et al., Compositional Dependability Evaluation for STATEMATE. Software
Engineering, IEEE Transactions on, 2009. 35(2): p. 274-292.
78. IBM. Rational Rose product family. 2012; Available from: http://www-
01.ibm.com/software/awdtools/developer/rose/.
79. Furia, C.A., et al., Modeling Time in Computing: A Taxonomy and a Comparative Survey.
ACM Computing Surveys, 2010. 42(2): p. 6-6.59.
80. Chung, L. and J.C.S. do Prado Leite, On Non-Functional Requirements in Software
Engineering, in Conceptual Modeling: Foundations and Applications: Essays in Honor of
John Mylopoulos, A.T. Borgida, et al., Editors. 2009, Springer Berlin Heidelberg: Berlin,
Heidelberg. p. 363-379.
81. Leveson, N.G., Learning from the Past to Face the Risks of Today. Communications of the
ACM, 2013. 56(6): p. 38-42.
82. Mark, H., Software development: a guide to building reliable systems. 1999.
83. Bjerkander, M. and C. Kobryn, Architecting systems with UML 2.0. Software, IEEE, 2003.
20(4): p. 57-61.
84. Selic, B.V. On the semantic foundations of standard UML 2.0. 2004. Berlin, Germany:
Springer-Verlag.
85. Berkenkotter, K. Using UML 2.0 in Real-Time Development: A Critical Review. 2004.
86. Anda, B., et al., Experiences from introducing UML-based development in a large safety-
critical project. Empirical Software Engineering, 2006. 11(4): p. 555-581.
87. Petre, M., UML in practice, in Proceedings of the 2013 International Conference on
Software Engineering. 2013, IEEE Press: San Francisco, CA, USA.
88. Arief Spiers, Using SimML to Bridge the Transformation from UML to Simulation. 1999.
89. Berenbach, B., F. Schneider, and H. Naughton. The use of a requirements modeling
language for industrial applications. in Requirements Engineering Conference (RE), 2012
20th IEEE International. 2012.

Thesis References
Michael Giddings Page 256 of 277 12/10/2016
90. Jinchun, X., G. Yujia, and C.K. Chang. An empirical performance study for validating a
performance analysis approach: PSIM. in Computer Software and Applications Conference,
2005. COMPSAC 2005. 29th Annual International. 2005.
91. Arief, L.B. and Spiers;, Using SimML to Bridge the Transformation from UML to Simulation.
1999.
92. Kleppe, A.W., Jos; Bast, Wim, MDA explained. 1 ed. 2003. 170.
93. Meservy, T.O. and K.D. Fenstermacher, Transforming software development: an MDA road
map.
94. Staron, M., Adopting Model Driven Software Development in Industry – A Case Study at
Two Companies, in Model Driven Engineering Languages and Systems. 2006. p. 57-72.
95. Cortellessa, V., A. Di Marco, and P. Inverardi. Integrating performance and reliability
analysis in a non-functional MDA framework. 2007. Berlin, Germany: Springer-Verlag.
96. Hutchinson, J., M. Rouncefield, and J. Whittle. Model-driven engineering practices in
industry. in Software Engineering (ICSE), 2011 33rd International Conference on. 2011.
97. Pires, A.F.D., S; Faure, T; Besseyre, C;Beringuier, J;Rolland, J, Use of Modelling Methods
and Tools in an Industrial Embedded Systems Project. ERTSD2 12, 2012.
98. DeAntoni, J. and J.P. Babau, A MDA-based approach for real time embedded systems
simulation. 2005. p. 257.
99. Krahl, D. The Extend simulation environment. in Simulation Conference, 2002. Proceedings
of the Winter. 2002.
100. Lu, S., W.A. Halang, and L. Zhang. A component-based UML profile to model embedded
real-time systems designed by the MDA approach. in Embedded and Real-Time Computing
Systems and Applications, 2005. Proceedings. 11th IEEE International Conference on.
2005.
101. Hayes, I.J. Towards platform-independent real-time systems. in Software Engineering
Conference, 2004. Proceedings. 2004 Australian. 2004.
102. Pastor, O., et al., Model-Driven Development. Informatik-Spektrum, 2008. 31(5): p. 394-
407.
Thesis References
Michael Giddings Page 257 of 277 12/10/2016
103. Cortellessa, V., A. Di Marco, and P. Inverardi. Non-Functional Modeling and Validation in
Model-Driven Architecture. in Software Architecture, 2007. WICSA '07. The Working
IEEE/IFIP Conference on. 2007.
104. Bohme, H., G. Schutze, and K. Voigt. Component development: MDA based transformation
from eODL to CIDL. 2005. Grimstad, Norway: Springer Verlag.
105. Cuccuru, A., et al. P2I: an innovative MDA methodology for embedded real-time system. in
Digital System Design, 2005. Proceedings. 8th Euromicro Conference on. 2005.
106. Elleuch, N., A. Khalfallah, and S. Ben Ahmed, ArchMDE Approach for the Development of
Embedded Real Time Systems, in Reliable Software Technologies – Ada Europe 2007.
2007. p. 142-154.
107. Marcos, E., C.J. Acufia, and C.E. Cuesta. Integrating software architecture into a MDA
framework. 2006. Berlin, Germany: Springer.
108. Gilliers, F., F. Kordon, and D. Regep. A model based development approach for distributed
embedded systems. 2004. Berlin, Germany: Springer-Verlag.
109. Kuzniarz, L., et al. Third intenational workshop on quality in modeling. 2008. Nashville, TN,
United states: Springer Verlag.
110. Nobre, J.C.S., D.S. Loubach, and E. Colonese. Developing an Aerospace System Software
Using PBL and MDA. in Information Technology: New Generations, 2008. ITNG 2008. Fifth
International Conference on. 2008.
111. Pareto, L., M. Staron, and P. Eriksson. Ontology guided evolution of complex embedded
systems projects in the direction of MDA. 2008. Toulouse, France: Springer Verlag.
112. Sanchez, P., J. Barreda, and J. Ocon. Integration of domain-specific models into a MDA
framework for time-critical embedded systems. in Intelligent Solutions in Embedded
Systems, 2008 International Workshop on. 2008.
113. Siikarla, M., K. Koskimies, and T. Systa. Open MDA using transformational patterns. 2005.
Linkoping, Sweden: Springer Verlag.

Thesis References
Michael Giddings Page 258 of 277 12/10/2016
114. Burmester, S., H. Giese, and W. Schafer. Model-driven architecture for hard real-time
systems: From platform independent models to code. 2005. Nuremberg, Germany:
Springer Verlag.
115. Alonso, D., et al., Automatic Ada Code Generation Using a Model-Driven Engineering
Approach, in Reliable Software Technologies – Ada Europe 2007. 2007. p. 168-179.
116. Dawson, M., et al. Creating predictable performance java applications in real time. IBM
Technical White Paper, 2007.
117. OMG. OMG Object Constraint Language (OCL) v 2.4. 2014; Available from:
http://www.omg.org/spec/OCL/.
118. Nastro, V. and U. Tancredi, Great Circle Navigation with Vectorial Methods. The Journal of
Navigation, 2010. 63(03): p. 557-563.
Thesis Appendices
Michael Giddings Page 259 of 277 12/10/2016
Appendices
Appendices
Appendix A - Functional Element Definition Template 261
Appendix B - Data Design Note 263
Appendix C - Database ER diagram 265
Appendix D - Functional Element Generator 267
Appendix E - Functional Element Class definition template 269
Appendix F - Scheduler Generator 271
Appendix G - Scheduler Class definition template 275

Thesis Appendices
Michael Giddings Page 260 of 277 12/10/2016
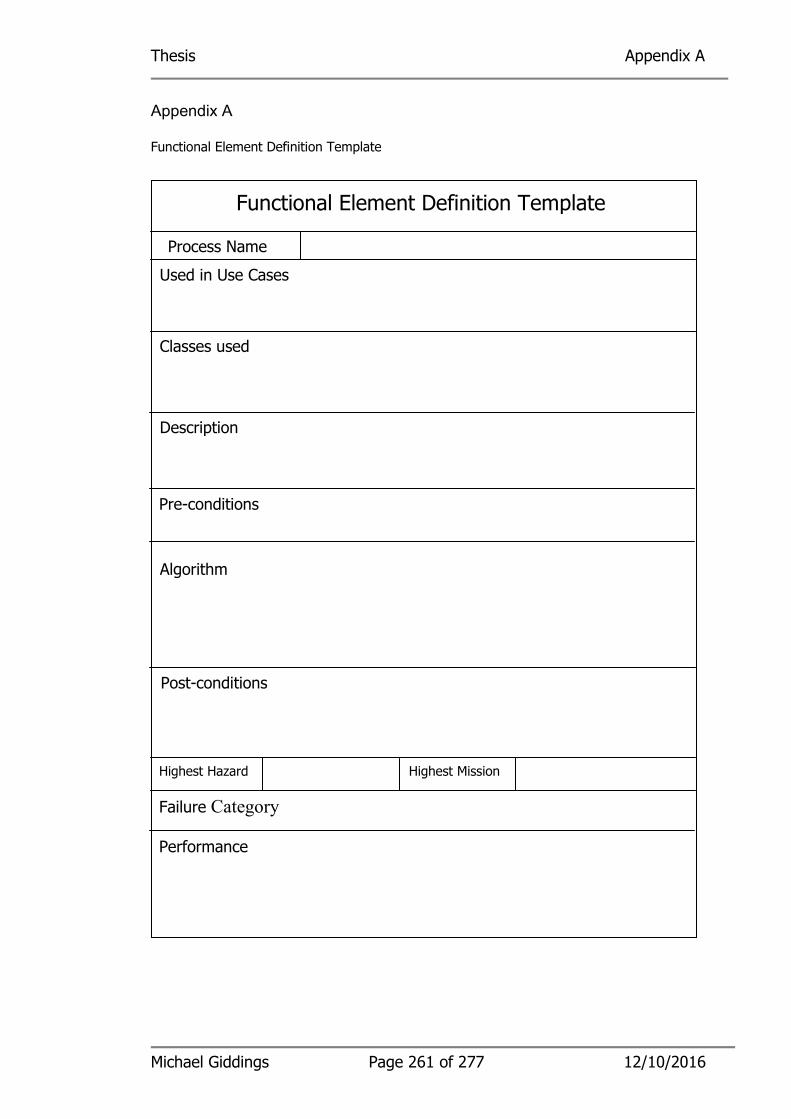
Thesis Appendix A
Michael Giddings Page 261 of 277 12/10/2016
Appendix A
Functional Element Definition Template
Appendix B Data Design Note
Used in Use Cases
Description
Functional Element Definition Template
Process Name
Highest Hazard Highest Mission
Classes used
Failure Category
Algorithm
Performance
Pre-conditions
Post-conditions

Thesis Appendix A
Michael Giddings Page 262 of 277 12/10/2016
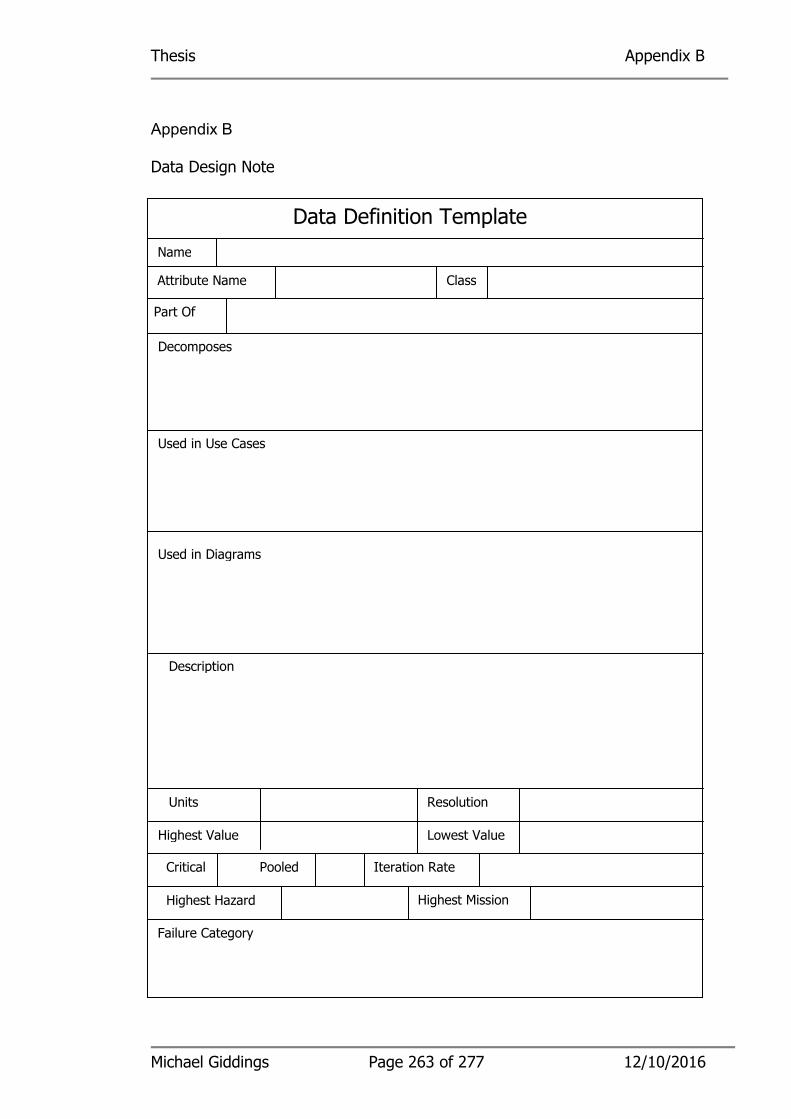
Thesis Appendix B
Michael Giddings Page 263 of 277 12/10/2016
Appendix B
Data Design Note
Name
Used in Use Cases
Class
Description
Data Definition Template
Attribute Name
Units
Lowest Value
Pooled
Resolution
Highest Value
Iteration Rate Critical
Highest Hazard Highest Mission
Used in Diagrams
Failure Category
Part Of
Decomposes

Thesis Appendix B
Michael Giddings Page 264 of 277 12/10/2016
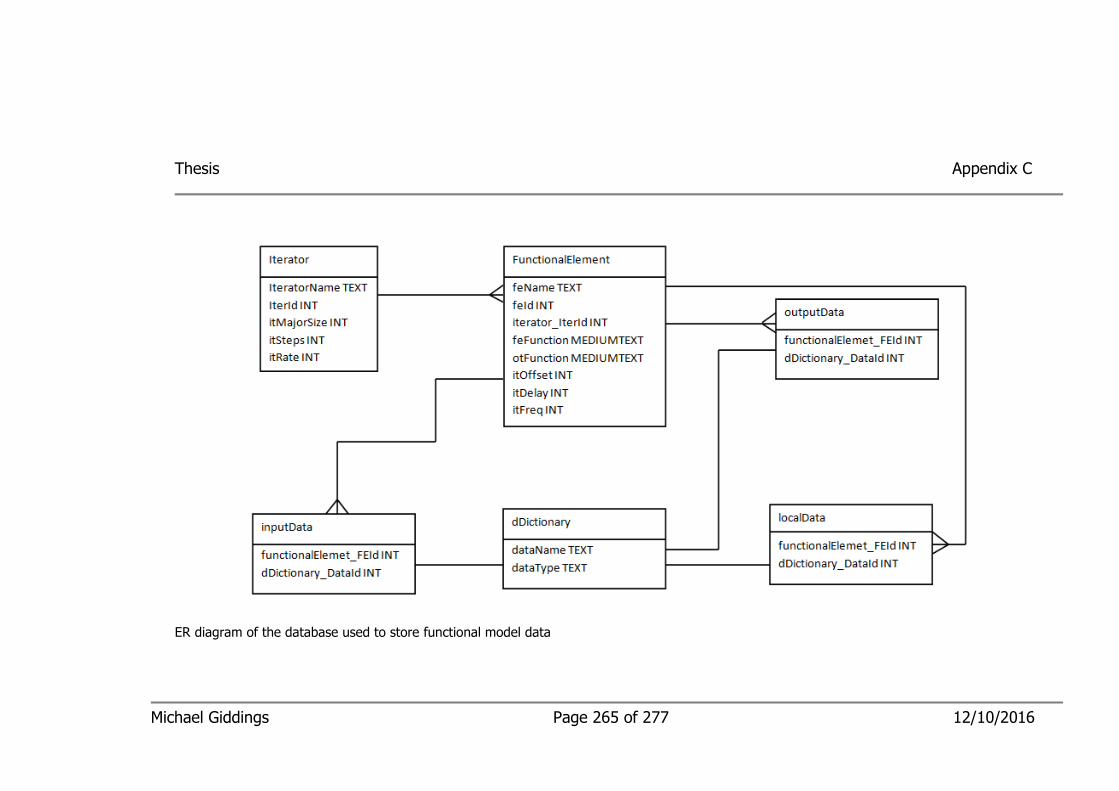
Michael Giddings Page 265 of 277 12/10/2016
Thesis Appendix C
ER diagram of the database used to store functional model data
Thesis Appendix C
Michael Giddings Page 266 of 277 12/10/2016

Thesis Appendix D
Michael Giddings Page 267 of 277 12/10/2016
Appendix D
Structure of program which generates a functional element class definition
// Generator of Functional Element class definitions
// Write a text file containing the following code lines.
// Functional element name FEname
public class FEname
{
// Output data contained as attributes in this functional element
// accessed using accessor methods below
private DataType DataName;
private DataType DataName;
.
.
private DataType DataName;
// Local data contained as attributes in this functional element
// accessed using accessor methods below
private DataType DataName;
private DataType DataName;
.
.
private DataType DataName;
// constructor
public FEname();
{

Thesis Appendix D
Michael Giddings Page 268 of 277 12/10/2016
}
// getter methods – one for each of the attributes defined above
public DataType getDataName()
{
return DataName;
}
.
.
public DataType getDataName()
{
return DataName;
}
// Functional Element methods
public void startFE()
{
// FEfunction
}
// Other methods
// OTfunction
}

Thesis Appendix E
Michael Giddings Page 269 of 277 12/10/2016
Appendix E
Sample functional element class definition
public class TransferGcNb
{
private Double gcNb;
private Double gcAc;
private Double gyroData;
// constructor
public TransferGcNb(Double default);
{
setgcNb(default);
}
// accessor methods
public Double getgcNb()
{
return gcNb;
}
public void setgcNb(Double argument)
{
gcNb = argument;
}

Thesis Appendix E
Michael Giddings Page 270 of 277 12/10/2016
public Double getgcAc()
{
return gcAc;
}
public void setgcAc(Double argument)
{
gcAc = argument;
}
// Functional Element methods
public void startFE()
{
setgyoData(gcNb);
gyroData = gyroData +33.0;
transferCourse(gyroData);
}
// Other methods
public void transferCourse (Double gData)
{
setDispGc(gData);
}
}

Thesis Appendix F
Michael Giddings Page 271 of 277 12/10/2016
Appendix F
Structure of program which generates a scheduler class definition
// Construct iteration table as a string array of FEnames
// Write a text file containing the following code lines.
public class IteratorName
{
// Output data contained as attributes in this functional element
// accessed using accessor methods below
private INT ItMajorSize;
private INT ItSteps;
private INT ItRate;
// constructor
public IteratorName();
{
}
// getter methods – one for each of the attributes defined above
public INT getItMajorSize()
{
return ItMajorSize;
}
public INT getItSteps()
{
return ItSteps;
}
public INT getItRate()

Thesis Appendix F
Michael Giddings Page 272 of 277 12/10/2016
{
return ItMajorRate;
}
// setter methods – one for each of the attributes defined above
public setItMajorSize(INT size)
{
ItMajorSize = size;
}
public setItMajorSize(INT steps)
{
ItSteps = steps;
}
public getItMajorSize(INT rate)
{
ItRate = rate;
}
//
If count = itRate
itRate=0
iteration = iteration +1
if iteration = majorsize
iteration = 0
// for each iteration 1 - majorSize
Case iteration = 0
FEName.startFE()
FEName.startFE()
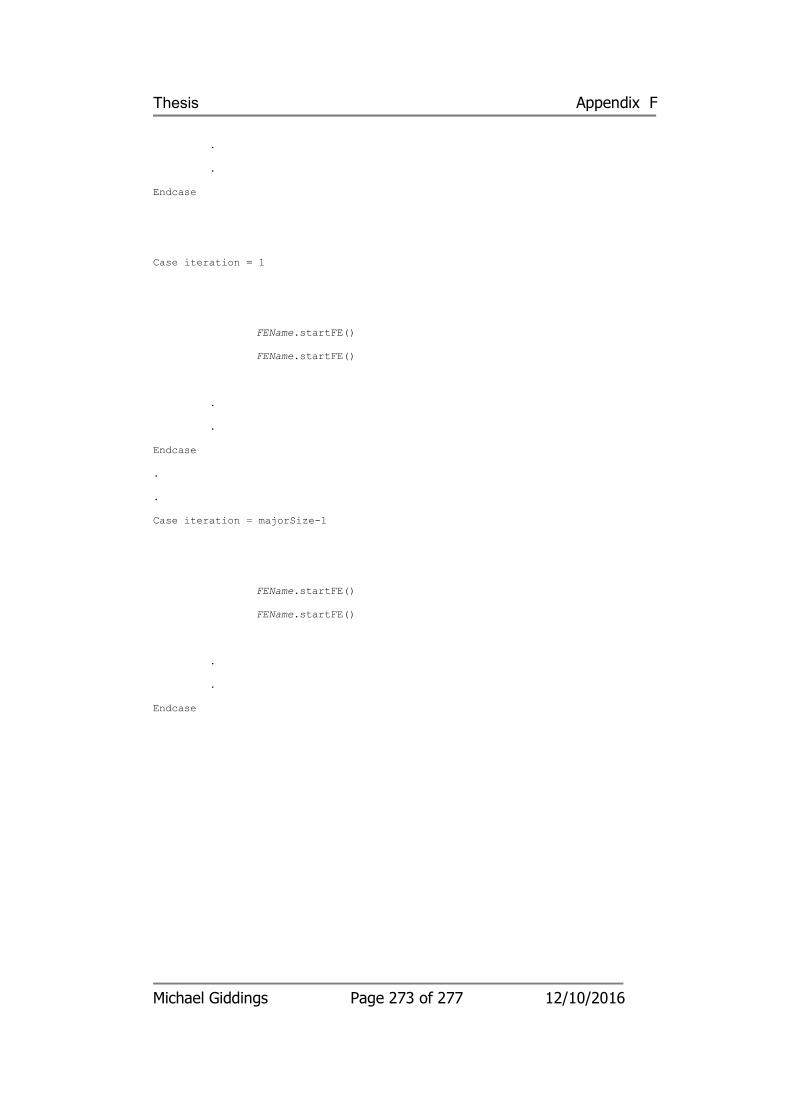
Thesis Appendix F
Michael Giddings Page 273 of 277 12/10/2016
.
.
Endcase
Case iteration = 1
FEName.startFE()
FEName.startFE()
.
.
Endcase
.
.
Case iteration = majorSize-1
FEName.startFE()
FEName.startFE()
.
.
Endcase

Thesis Appendix F
Michael Giddings Page 274 of 277 12/10/2016

Thesis Appendix G
Michael Giddings Page 275 of 277 12/10/2016
Appendix G
Sample scheduler class definition
public class Sensor
{
// Output data contained as attributes in this functional element
// accessed using accessor methods below
private INT ItMajorSize;
private INT ItSteps;
private INT ItRate;
// constructor
public IteratorName();
{
}
// getter methods – one for each of the attributes defined above
public INT getItMajorSize()
{
return ItMajorSize;
}
public INT getItSteps()
{
return ItSteps;
}
public INT getItRate()
{
return ItMajorRate;
}
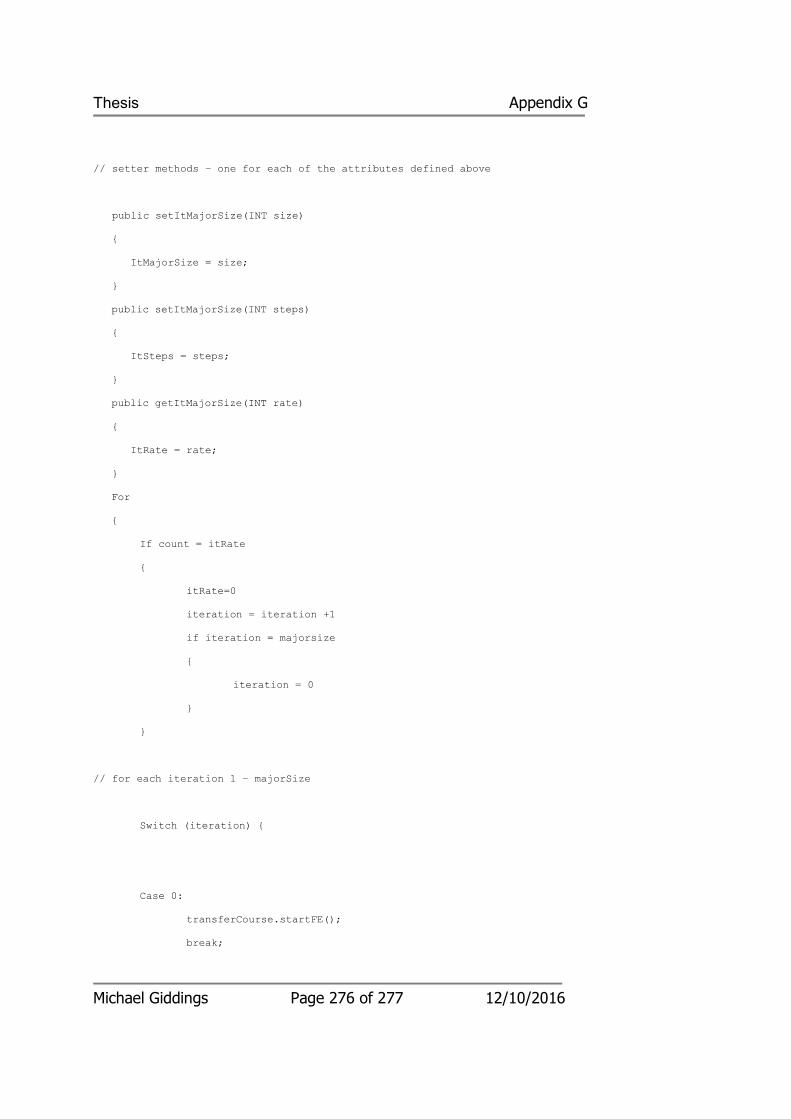
Thesis Appendix G
Michael Giddings Page 276 of 277 12/10/2016
// setter methods – one for each of the attributes defined above
public setItMajorSize(INT size)
{
ItMajorSize = size;
}
public setItMajorSize(INT steps)
{
ItSteps = steps;
}
public getItMajorSize(INT rate)
{
ItRate = rate;
}
For
{
If count = itRate
{
itRate=0
iteration = iteration +1
if iteration = majorsize
{
iteration = 0
}
}
// for each iteration 1 – majorSize
Switch (iteration) {
Case 0:
transferCourse.startFE();
break;
Thesis Appendix G
Michael Giddings Page 277 of 277 12/10/2016
Case 1:
transferCourse.startFE();
break;
Case 2:
transferCourse.startFE();
break;
Case 3:
transferCourse.startFE();
break;
Case 4:
transferCourse.startFE();
break;
Case 5:
transferCourse.startFE();
break;
}