Embed Size (px)
Citation preview

1
TITLE�
Investigating the consistency of woodwind instrument
manufacturing by comparing five nominally identical oboes1
�
RUNNING TITLE
Consistency of oboe manufacturing
AUTHORS
Adrien Mamou-Mani1, David Brian Sharp1, Thibaut Meurisse2, William Ring3
1 Acoustics Research Group, DDEM, MCT Faculty, The Open University, Walton Hall, Milton Keynes,
MK7 6AA, UK
2 Université Pierre et Marie Curie, 4 Place Jussieu, 75005 Paris, France
3 Howarth of London, 19 Buckingham Road, Worthing, BN11 1TH, UK
Email: [email protected]
1 Submitted for the special issue on Musical Acoustics

2
ABSTRACT
For large-scale woodwind instrument makers, producing instruments with exactly the same
playing characteristics is a constant aim. This paper explores manufacturing consistency by
comparing five Howarth S10 student model oboes. Psychophysical testing involving nine
musicians is carried out to investigate perceived differences in the playing properties of the two
Howarth oboes believed to be most dissimilar. Further testing, involving one musician and
combinations of the five oboes, provides information regarding the relative playabilities of the
instruments at specific pitches. Meanwhile, input impedance measurements are made on the five
oboes for fingerings throughout the playing range and their bore profiles are measured. The main
findings are (i) the two instruments used in the preliminary psychophysical testing are perceived
as identical by most of the musicians, although differences are identified by two players when
playing the note F6 and by one player when playing in the lowest register, (ii) a variation in the
playability of F6 across the five oboes is due to differences in the elevation of the C key, and (iii)
variations in the playing properties in the lowest register are related to input impedance
differences which, in turn, appear to be at least partly due to bore profile differences.
Keywords: musical wind instruments, input impedance, manufacturing consistency,
psychophysical testing
PACS: 43.58.Bh, 43.75.Ef, 43.75.Yy

3
I. INTRODUCTION
Most large-scale woodwind instrument makers produce several different models of each type of
instrument (e.g. flute, oboe, clarinet, bassoon) that they manufacture. These different models
tend to be marketed towards particular standards of player. For example, a maker might produce
one model of oboe aimed at student players, another model targeted at intermediate players, and
a further model for professional players.
For student models in particular, the ability to produce instruments in a consistent and
reproducible manner is a priority for woodwind manufacturers. Any physical differences
between instruments will most likely lead to differences in their acoustical properties which, in
turn, may result in perceptible differences in their playing characteristics. For professional
models, such differences – provided they are not too large – are usually less of a concern to the
makers. At this level of playing, musicians tend to have their own personal requirements
regarding an instrument’s playing properties; they welcome a small element of variation when
testing instruments with a view to purchase. However, for student models, makers generally
prefer their products to behave in an essentially identical manner.
In this paper, the issue of woodwind instrument manufacturing consistency is
investigated through measurements designed to highlight any physical, acoustical and perceptual
differences between five nominally-identical Howarth S10 student model oboes (see Figure 1).
The instruments were provided by the manufacturers in a newly-made state, straight from the
workshop. They are made from African Blackwood, have thumbplate fingering system keywork
and are all from the same manufacturing run (serial numbers K619, K853, K855, K856 and
K862). The geometries of the instruments are established through bore profile measurements,
made both directly using a set of high precision measurement discs and non-invasively using the
technique of acoustic pulse reflectometry1,2,3. The strengths and frequencies of the instruments’
resonances are determined through measurements of input impedance4,5,6. In addition,

4
psychophysical testing7 is employed to evaluate the abilities of oboists to perceive differences in
the playing properties of the instruments. This combination of approaches has previously been
used to investigate the effect of the crook profile on the playing properties of the bassoon8,9 and
to compare the characteristics of French horn mouthpieces10. Meanwhile, the suitability of the
methodology for the study of musical wind instrument manufacturing consistency has been
evaluated through measurements on two low-cost trumpets11.
Section II describes playing tests undertaken by nine oboists during the 2009
International Double Reed Society (IDRS) annual conference, which took place in Birmingham,
UK. These tests were carried out in the early stages of the investigation, partly due to the timing
of the IDRS conference and partly so that the findings could inform the direction of the rest of
the research. That is, so that any differences in the playing properties of the instruments
perceived by the oboists could be explored and potentially correlated with physical and
acoustical differences. Indeed, Sections III and IV are dedicated to the explanation of differences
perceived when producing notes in the upper registers of the instruments. Meanwhile, Section V
is concerned with the investigation of differences perceived when producing notes in the lowest
register.
Figure 1 Five Howarth S10 student model oboes

5
II. PRELIMINARY PSYCHOPHYSICAL TESTING
In order to investigate the abilities of players to perceive differences between oboes of the same
model type, a set of playing tests was carried out using the Howarth S10 oboes. To keep the
scope and duration of the playing test manageable, only two of the five oboes were used. These
two instruments (serial numbers K619 and K856) were pre-selected during an initial playing
session by one of the authors (DS), who is an intermediate level oboist. After playing all five
oboes, his perception was that, over the pitch range of the instrument, oboes K619 and K856
exhibited the largest difference between their playing properties.
A. 2-alternative forced choice test with warm-up
Nine oboists of various standards participated in the playing tests. Four were professional
players, four were of intermediate ability and one was a beginner.
The purpose of the playing tests was to evaluate the extent to which the oboists were able
to discriminate the two oboes. In order to do this, each player undertook a 2-alternative forced
choice test with warm-up7,12. The test procedure was as follows. At the start of the test, the
musician was given five minutes to play the two oboes (referred to throughout the tests simply as
oboe A and oboe B) and become familiar with them. Following this, five warm-up trials were
carried out in which the oboes were presented in a random order. By playing them both, the
oboist attempted to determine which instrument was oboe A and which was oboe B. After each
warm-up trial, the player was informed whether they had answered correctly or not. Finally, the
pair of oboes was presented twenty further times in random order and each time the musician
was again asked to judge which instrument was which. Each trial was separated from the next by
a gap of approximately thirty seconds, ensuring that there was no perceptible difference between
the temperatures of either the bodies or the keys of the two instruments whenever they were
presented to the player. At all stages in the test, the oboist was free to play whatever notes and

6
melodies, and at whatever dynamic level, they chose. To ensure the experience was as
comfortable as possible, the participant played the oboes using one of their own reeds.
Even though the instruments were brand new and had no noticeable cosmetic differences,
all the playing tests were carried out in a darkened room to minimise the possibility of visual
identification.
According to the binomial probability distribution, the probability of an individual
achieving 16 or more correct answers by chance over the 20 trials is only 0.59%. It can therefore
be concluded that, at the 1% significance level, a musician was able to consistently tell the two
instruments apart if they exhibited at least 16 successes in the 2-AFC test. Those players who
were considered to be able to consistently distinguish between the oboes were asked to comment
on the playing features that they perceived to be different between the instruments. The players
were free to consider any differences in how the instruments behaved. Such differences might
include variations in the mechanical feel of the instruments during note transitions, in the tonal
quality of the notes produced, in the ease of playing notes etc.
It should be noted that with nine musicians participating in the playing tests, the
likelihood of a chance occurrence of 16 or more correct answers in the test results is increased.
However this likelihood is still small; the probability of at least one of the nine musicians
randomly achieving such a score is 5.2%.
B. Results
The scores achieved by the subjects in the playing tests were 6, 9, 10, 12, 12, 12, 16, 18 and 20.
From these scores, it can be seen that six of the participants were unable to discriminate the two
oboes at the 1% significance level. Indeed, these six players correctly identified the instruments
no more than 12 times out of the 20 trials. This result suggests a high level of manufacturing
consistency in the production of this model of oboe. However, there were three players who did
7
demonstrate the ability to distinguish between the two oboes at the 1% significance (it is worth
noting that the probability of three of the nine musicians achieving 16 or more correct answers
purely by chance is tiny, at only 0.0017%). Two of these musicians correctly identified the
instruments at least 18 times out of the 20 trials while the other correctly identified them 16
times. When questioned about the playing features that they found to be different between the
oboes, the two players who achieved 18 or more correct answers both focussed on a variation in
the playability of the note F6. Meanwhile, the player who achieved 16 correct answers in the test
stated that he had perceived differences in the sounds produced by the instruments when playing
in the lowest register, commenting that one oboe (K856) seemed to have a brighter sound than
the other (K619). None of the players indicated that they had perceived any tactile differences
between the oboes.
It is worth noting that there does not appear to be any correlation between the ability to
discriminate the two oboes and the standard of the player. Of the three musicians who were able
to distinguish the instruments at the 1% significance level, two were intermediate level players
and one was a professional. In other words, three of the professionals, two of the intermediate
players and the beginner were unable to discriminate the instruments.
III. INVESTIGATING PERCEIVED DIFFERENCES IN PLAYABILITY OF F6
The preliminary psychophysical testing carried out during the IDRS conference revealed that two
participants in the playing tests perceived differences between the playing properties of two of
the Howarth S10 oboes when sounding the note F6. In this section, the reasons for differences in
the playability of this note are explored through further psychophysical testing using all five
Howarth S10 oboes, as well as input impedance and bore profile measurements on the
instruments.

8
A. Further psychophysical testing
To gain further insight into the playability of the note F6 across the five Howarth S10 oboes,
additional psychophysical testing was carried out using intermediate standard oboist DS as the
test subject. In a blindfold test, the musician was asked to order the five oboes in terms of the
playability of F6. The oboist was free to play the instruments as many times as he wanted and no
time limit was imposed on the test. Once the player was satisfied with his ranking, the oboes
were mixed up and the whole test was repeated.
The ordering chosen by the musician was the same in each repetition of the test, namely
oboe K619 (perceived to produce the note F6 most cleanly), oboe K853, oboe K862, oboe K856
and oboe K855 (perceived to be the most difficult instrument to produce the note F6 on).
B. Input impedance measurements
The input impedance of a musical wind instrument is a quantitative measure of the strengths and
frequencies of the instrument’s air column resonances. Hence, for a given fingering on the oboe,
a measurement of input impedance provides information regarding the playability and sounding
properties of the note associated with that fingering.
1. Measurements with F6 fingering
To investigate the perceived differences in the playability of the note F6 across the five oboes,
input impedance measurements were carried out on the five instruments when the F6 fingering
used by oboist DS was applied to them.
The measurements were made using the commercially available BIAS system13,14. This
apparatus is primarily designed for measuring the input impedance of brass instruments. To
enable oboe measurements to be made, a bespoke coupler was constructed which connects the
BIAS measurement head to the oboe via a blank oboe staple (a staple with the two pieces of reed
9
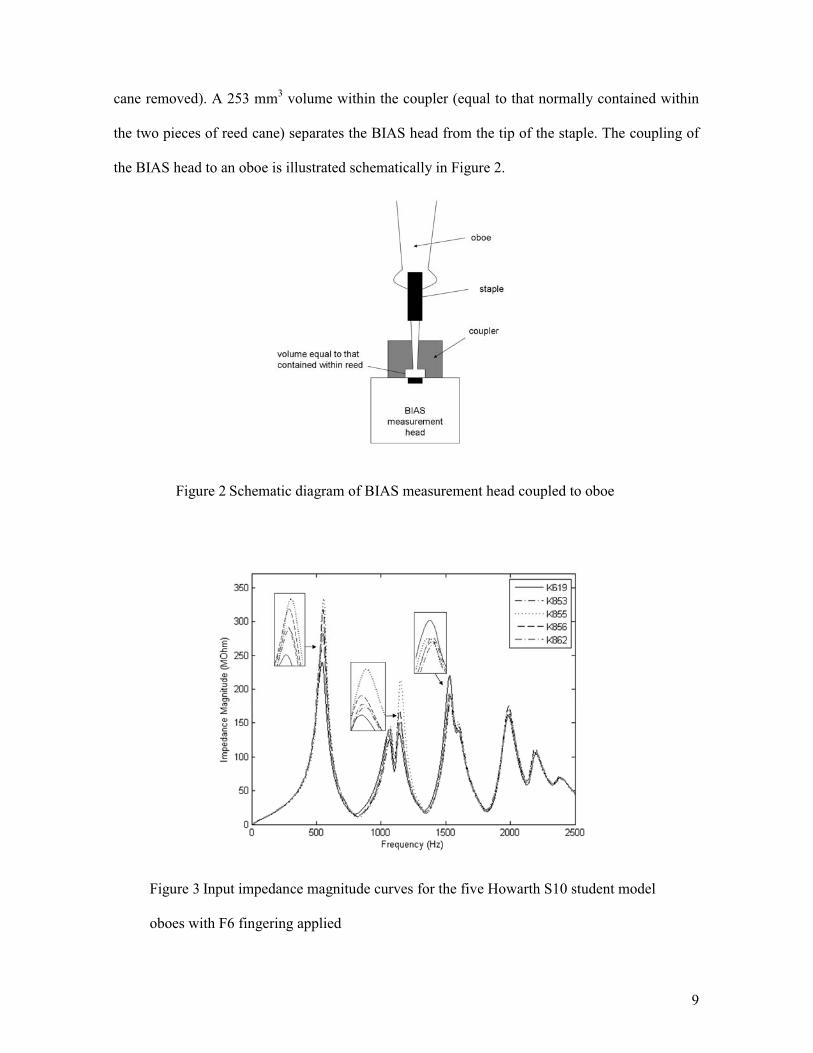
cane removed). A 253 mm3 volume within the coupler (equal to that normally contained within
the two pieces of reed cane) separates the BIAS head from the tip of the staple. The coupling of
the BIAS head to an oboe is illustrated schematically in Figure 2.
Figure 2 Schematic diagram of BIAS measurement head coupled to oboe
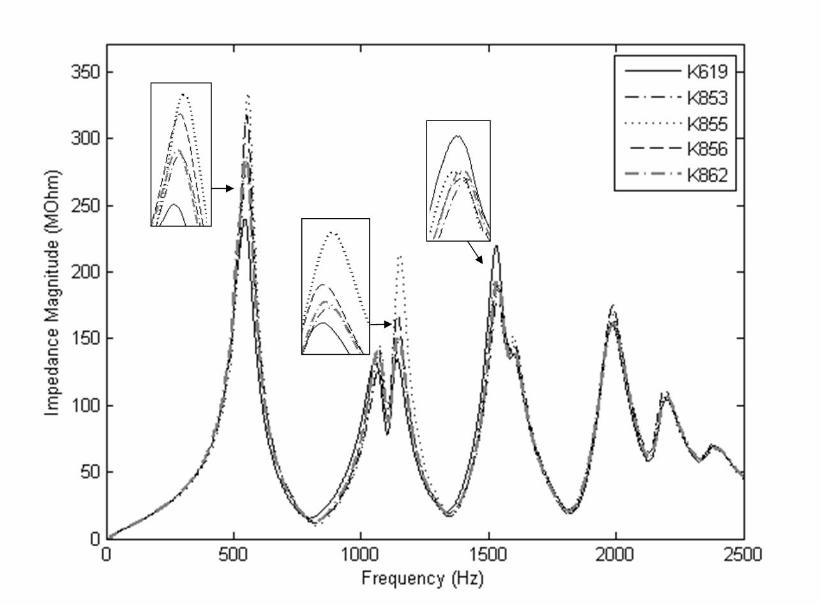
Figure 3 Input impedance magnitude curves for the five Howarth S10 student model
oboes with F6 fingering applied

10
Figure 3 shows input impedance magnitude curves for the five Howarth S10 student
model oboes with the F6 fingering applied. Noticeable differences, in terms of both the
frequencies and the amplitudes of corresponding peaks, can be seen between the five impedance
curves. Most significantly, the amplitude of the first resonance peak varies by nearly 100 M�
across the five curves while the amplitude of the second resonance peak varies by around 80
M�. Furthermore, the third resonance peak in the impedance curve for oboe K619 is around 25
M� higher than in the impedance curves for the four other oboes. Meanwhile, each of the first
three resonance peaks varies in frequency by about 10 Hz across the five curves.
To understand the effect that these variations might have on the playing properties of the
oboes, it is important to consider that the note F6 lies in the third register of the instrument.
Applying the F6 fingering causes the first two resonances of the air column to be reduced in
strength relative to the higher resonances. It also shifts their frequencies, thereby weakening the
harmonic relationship between them and the higher resonances. These effects combine to ensure
that the note pitch produced by the instrument is based on the third resonance frequency; that is,
the note has a fundamental frequency which approximately matches the frequency of the third
resonance. It can reasonably be assumed that, the more effective the perturbation of the first two
resonances relative to the third and higher resonances, the easier it is to produce the F6 note pitch
cleanly.
The perceived differences in the playability of the note F6 across the five oboes revealed
by the psychophysical testing therefore arise as a result of the observed differences between the
amplitudes and frequencies of corresponding peaks in the five impedance curves shown in
Figure 3. In percentage terms, the peak amplitudes vary by as much as 30% across the five
curves while the peak frequencies differ by no more than 2%. It can therefore be hypothesised
that it is the variation in the strengths of the first two resonances relative to the higher resonances
across the curves, rather than the variation in their frequencies (and consequently the variation in
their harmonicity), that is the dominant reason for the differences in the playability of the note F6

11
on the five oboes. Further evidence supporting this hypothesis can be found in Figure 3 where, if
the oboes are ranked in terms of the amplitudes of their first and second resonance peaks, the
following ordering is achieved: K619 (lowest amplitude peaks), K853, K862, K856 and K855
(highest amplitude peaks). This order matches exactly with that chosen by the oboist in Section
III.A when asked to rank the playability of F6 on the five instruments. Moreover, as noted
previously, the amplitude of the third resonance peak in the impedance curve for oboe K619 is
greater than in the impedance curves for the other oboes. This emphasises the fact that, relative
to the higher resonances, oboe K619 exhibits the weakest first and second resonances in the F6
fingering configuration.
2. Measurements over whole pitch range
The variations in the acoustical properties of the five Howarth oboes with F6 fingering that were
observed in the previous section, must arise as a result of physical differences between the
instruments in this fingering configuration (e.g. disparities in bore profile, discrepancies in the
positioning and sealing of side holes). Pinpointing these physical differences is not a trivial task.
However, the task can be simplified if it is considered that the physical differences will most
likely affect a number of notes, not just F6. Identifying all the notes at which the acoustical
properties of the instruments show large variations, and searching for common features in their
fingerings, should provide additional clues as to the nature of the physical differences.
To this end, input impedance measurements were carried out on the five oboes for every
note from B�3 to E�6 (31 notes in total). The measurements were again made using the BIAS
system with the fingerings used by oboist DS applied to the instruments. However, rather than
laboriously plotting 31 more graphs of the type shown in Figure 3 and examining each of them
for differences between the impedance curves of the five oboes, an alternative way of
representing the impedance data was employed.

12
At each note pitch, average values for the amplitude and the frequency of the first
resonance peak were calculated from the five oboe impedance curves. For each of these
impedance curves, the difference in the amplitude and the difference in the frequency of the first
resonance peak from the corresponding average values were then determined. Finally, these
differences were plotted on a scatter diagram, with the difference in frequency plotted in cents on
the x-axis and the relative difference in amplitude plotted on the y-axis.
Figure 4 shows a scatter diagram plotting the amplitude and frequency differences
between the first resonance peaks for the five Howarth S10 oboes at the 32 note pitches
(including F6) investigated. Three distinct groupings can be observed on the diagram. Region I
contains eight notes (C#5, D5, E�5, C#6, D6, E�6, E6 and F6) produced on oboe K619. For all
of these eight notes, the amplitude of the first resonance peak in the oboe K619 impedance curve
is at least 0.15 times lower than the mean value for the five oboe impedance curves. Similarly, its
frequency is at least 15 cents lower than the mean value. Meanwhile, Region II contains the same
eight notes produced on oboe K855. In this case, for all of the eight notes, the amplitude of the
first resonance peak in the oboe K855 impedance curve is at least 0.15 times higher than the
mean value for the five oboe impedance curves. Similarly, its frequency is at least 15 cents
higher than the mean value. Finally, Region III on the diagram contains the remaining 24 notes
produced on oboes K619 and K855, together with all 32 notes produced on oboes K853, K856
and K862. For all of these notes, the amplitude of the first resonance peak in the corresponding
oboe impedance curve is within 15% of the mean value.
It is clear from Figure 4 that the largest acoustical differences between the five Howarth
S10 oboes occur at eight specific notes (C#5, D5, E�5, C#6, D6, E�6, E6 and F6), with the most
extreme variation occurring between oboes K619 and K855. A common feature in all the
fingerings used by oboist DS to produce these notes is that the C key (see Figure 5) is left
unpressed. In this way, the C hole acts as a register hole, weakening either the first resonance or

13
the first and second resonances of the air column and enabling notes in the second register (C#5,
D5, E�5) or the third register (C#6, D6, E�6, E6 and F6) of the instrument to be produced. The
physical differences responsible for the observed acoustical variations between the five oboes
therefore appear to be associated with the C key and its underlying hole.
Figure 4 Scatter diagram plotting deviations in the frequencies and amplitudes of the
first resonance peaks from the corresponding mean values for five Howarth S10 student
model oboes at 32 note pitches.

14
Figure 5 Position of C key on top joint of oboe
C. Bore profile measurements
In order to investigate the hypothesised physical differences between the C keys/holes of the five
Howarth oboes, bore profile measurements of the top joints of the instruments were made using
acoustic pulse reflectometry. The measurements were made with all the holes closed except for
the C hole (where the key was left unpressed).
Figure 6 shows the resulting bore reconstructions of the five oboe top joints, starting at
the wide end of the joint and progressing towards the reed input end. The internal dimensions of
the five joints are initially in close agreement, each showing a gradual decrease in radius with
distance (with small localised increases in radius at the positions of the closed holes). However,
around 0.15m along the joint, the measured bore profiles expand spuriously due to the change in
acoustic impedance presented by the open C hole. The greater the change in the impedance, the
more rapid the rate of expansion. It can be seen that the rates of expansion of the bore
reconstructions at the position of the C hole take the following order: oboe K619 (least rapid),
oboe K853, oboe K862, oboe K856 and oboe K855 (most rapid). These differences in the
measured bore profiles of the five top joints are a result of differences in the elevation of the C
key above the hole. In the K619 top joint, the C key sits a relatively small distance above the
hole, presenting a lower acoustic impedance change. In the K855 top joint, the height of the C
key above the hole is greater, and consequently the change in acoustic impedance presented by
the hole is greater. An attempt was made to determine the absolute elevations of the C keys of

15
the five instruments above their respective holes using measuring calipers. However, accurate
measurements proved impossible due to problems of inaccessibility, caused partly by the
proximity of the surrounding keywork but mainly by the fact that the C hole on the Howarth S10
student model oboe is recessed, with the pad of the unpressed key sitting approximately level
with the surface of the instrument body.
It is worth noting that the rates of expansion in the five bore profile measurements (and
hence the elevations of the C keys in the five top joints) follow the exact same order as (i) that
chosen by oboist DS when ranking the playability of F6 and (ii) the heights of the first resonance
peaks in the impedance curves for the F6 fingering. It therefore appears that, with the fingering
employed by oboist DS, the mechanical adjustment of the height of the C key has a major effect
on how easily and cleanly the instrument will produce the note F6.
Figure 6 Bore reconstructions of the top joints of the five Howarth S10 student model oboes,
with all holes closed except for the C hole.

16
D. Alternative fingering
All the psychoacoustical testing, impedance measurements and bore reconstructions presented so
far in Section III have been carried out with the F6 fingering used by oboist DS applied to the
five Howarth oboes. This fingering involves leaving the C key unpressed. However, there is an
alternative to this fingering in which the C key is pressed down but the small vent hole present in
the centre of the key is left uncovered.
Figure 7 Input impedance magnitude curves for the five Howarth S10 student model oboes with
alternative F6 fingering applied
Figure 7 shows input impedance magnitude curves for the five Howarth S10 student
model oboes with this alternative F6 fingering applied, again made using the BIAS system. In
comparison with Figure 3, the differences between the five impedance curves are much less
significant. Now that there is no variation between the oboes in the elevation of the C key above

17
the hole, the amplitude of the first resonance peak only differs by approximately 25 M� across
the five curves while the amplitude of the second resonance peak only varies by around 15 M�.
However, as might be expected, the variation in the amplitude of the third resonance peak across
the five curves is relatively unchanged. The third resonance peak in the impedance curve for
oboe K619 is still around 25 M� higher than in the impedance curves for three of the other
oboes but is now only about 15 M� higher than in the impedance curve for oboe K855. Again,
each of the first three resonance peaks varies in frequency by about 10 Hz across the five curves.
The fact that there is generally much less variation between the impedance curves
suggests that, with this alternative fingering, the playability of the note F6 across the five oboes
will be much more comparable.
IV. INVESTIGATING PLAYABILITY OF E����5
The input impedance measurements reported in Section III.B.2 revealed significant acoustical
differences between the five Howarth S10 oboes for eight of the note fingerings used by oboist
DS. For the F6 fingering, it has been shown that these acoustical differences have a direct effect
on the playability of the note across the five instruments. In contrast, in this section, it is
demonstrated that for the E�5 fingering the acoustical differences do not result in perceptible
differences in the playing properties of the instruments. The reason for this is explained by
reference to the input impedance measurements for this fingering.
A. Further psychophysical testing
18
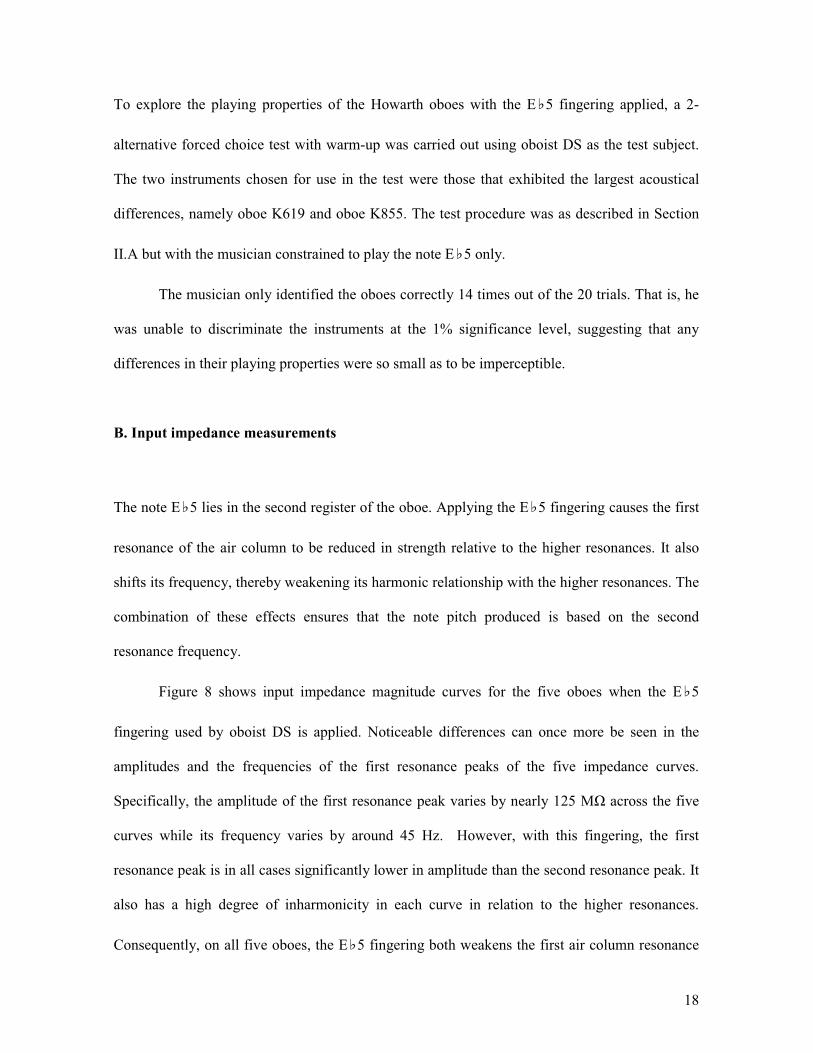
To explore the playing properties of the Howarth oboes with the E�5 fingering applied, a 2-
alternative forced choice test with warm-up was carried out using oboist DS as the test subject.
The two instruments chosen for use in the test were those that exhibited the largest acoustical
differences, namely oboe K619 and oboe K855. The test procedure was as described in Section
II.A but with the musician constrained to play the note E�5 only.
The musician only identified the oboes correctly 14 times out of the 20 trials. That is, he
was unable to discriminate the instruments at the 1% significance level, suggesting that any
differences in their playing properties were so small as to be imperceptible.
B. Input impedance measurements
The note E�5 lies in the second register of the oboe. Applying the E�5 fingering causes the first
resonance of the air column to be reduced in strength relative to the higher resonances. It also
shifts its frequency, thereby weakening its harmonic relationship with the higher resonances. The
combination of these effects ensures that the note pitch produced is based on the second
resonance frequency.
Figure 8 shows input impedance magnitude curves for the five oboes when the E�5
fingering used by oboist DS is applied. Noticeable differences can once more be seen in the
amplitudes and the frequencies of the first resonance peaks of the five impedance curves.
Specifically, the amplitude of the first resonance peak varies by nearly 125 M� across the five
curves while its frequency varies by around 45 Hz. However, with this fingering, the first
resonance peak is in all cases significantly lower in amplitude than the second resonance peak. It
also has a high degree of inharmonicity in each curve in relation to the higher resonances.
Consequently, on all five oboes, the E�5 fingering both weakens the first air column resonance

19
sufficiently and shifts its frequency enough to enable the note to be produced very cleanly and no
difference in playability is perceived between the instruments.
Figure 8 Input impedance magnitude curves for the five Howarth S10 student model
oboes with E�5 fingering applied
V. INVESTIGATING PERCEIVED DIFFERENCES IN LOWEST REGISTER
Most of the outcomes of the preliminary psychophysical testing carried out at the IDRS
conference can be explained in terms of (i) differences between the oboes in the resting height of
the C key and (ii) the fingerings that the participants used to play particular notes. However, one
of the participants in the playing tests proved able to perceive differences between the oboes
when playing in the lowest register, where the C key is always pressed down.

20
In this section, the reasons why the musician was able to discriminate the oboes simply
by playing in the lowest register are investigated. Some insight can be gained from the scatter
diagram in Figure 9, which shows a subset of the points plotted in Figure 4. The diagram again
shows the amplitude and frequency differences between the first resonance peaks for the five
Howarth S10 oboes, but this time only for the 15 notes in the lowest register of the instrument. It
is clear that the amplitude and frequency differences are much smaller than were observed in
Figure 4. However, distinct groupings can again be observed. Region I contains the notes
produced on oboe K619, region II contains the notes produced on oboe K855, region III contains
the notes produced on oboe K853, and region IV contains the notes produced on oboes K856 and
K862 (the amplitudes and frequencies of the first resonance peaks of notes produced on these
two instruments being almost identical).
In order to investigate the physical differences responsible for these small acoustical
differences, further testing of the instruments was undertaken with the B�3 fingering applied. In
this fingering, all the holes are closed, thereby removing any potential variation due to
differences in the heights of keys between the five instruments.

21
A. Further psychophysical testing
To gain further information regarding the ability of a musician to perceive differences in the
playability of B�3 on the Howarth oboes, a 2-alternative forced choice test with warm-up was
carried out using oboist DS as the test subject. Oboes K619 and K856 were chosen for use in the
test, as these were the instruments upon which differences in the lowest register had been
perceived during the preliminary psychophysical testing. The test procedure was as described in
Section II.A but with the musician constrained to play the note B�3 only.
Figure 9 Scatter diagram plotting deviations in the frequencies and amplitudes of the first
resonance peaks from the corresponding mean values for five Howarth S10 student model oboes
at the 15 note pitches in the lowest register of the instrument.

22
For each trial, the oboist rapidly repeated the note on each instrument. By observing very
small differences in the ease with which the note sounded, the player correctly identified the
instruments in all 20 trials and so clearly demonstrated the ability to discriminate the oboes at the
1% significance level. The musician commented that B�3 was slightly harder to produce cleanly
on oboe K856 than on oboe K619.
B. Input impedance measurements
The note B�3 is the lowest note in the first register of the oboe. When the B�3 fingering is
applied to the instrument, the note pitch that is produced is based on the first resonance
frequency of the air column; that is, the note has a fundamental frequency that approximately
matches the frequency of the first resonance.
Figure 10 shows input impedance magnitude curves for the five Howarth S10 oboes with
the B�3 fingering applied. As expected from the scatter diagram of Figure 9, the amplitudes of
the first resonance peaks are very similar across the five impedance curves, with a variation of
less than 15 M�. However, greater differences can be observed in the amplitudes of the second
and third resonance peaks, with variations of approximately 35 M� and 60 M� respectively.
Meanwhile, the first two resonance peaks vary in frequency by about 2 Hz across the five curves
while the third resonance peak varies in frequency by just under 4 Hz.
Focussing on the two oboes used in the psychophysical testing of the playability of B�3,
it can be seen from Figure 10 that the first, second and third resonance peaks are respectively
about 5%, 10% and 15% higher in the impedance curve of oboe K856 than in the impedance
curve of oboe K619. Given that the variation in the peak frequencies across the two curves is less
than 1%, and there is little difference between them in terms of harmonicity, it can be reasonably

23
assumed that the weaker the first resonance is relative to the higher resonances, the more likely
the pitch will become based on the second or third resonance frequency. This may well explain
why the note pitch of B�3 was perceived as slightly harder to produce cleanly on oboe K856
than it was on oboe K619.
C. Bore profile measurements
If it is assumed that there are no leaking pads, the most likely cause of the differences in the
impedance curves for the five oboes with B�3 fingering is a variation in the internal geometries
Figure 10 Input impedance magnitude curves for the five Howarth S10 student model
oboes with B�3 fingering applied
24
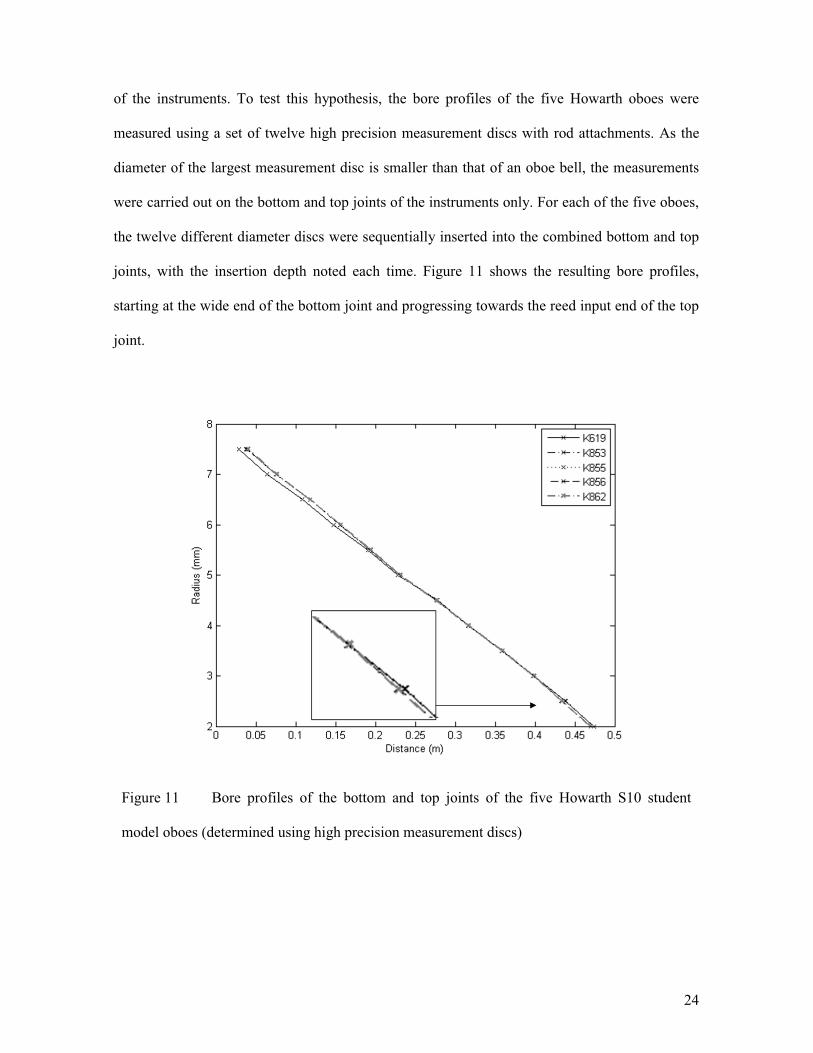
of the instruments. To test this hypothesis, the bore profiles of the five Howarth oboes were
measured using a set of twelve high precision measurement discs with rod attachments. As the
diameter of the largest measurement disc is smaller than that of an oboe bell, the measurements
were carried out on the bottom and top joints of the instruments only. For each of the five oboes,
the twelve different diameter discs were sequentially inserted into the combined bottom and top
joints, with the insertion depth noted each time. Figure 11 shows the resulting bore profiles,
starting at the wide end of the bottom joint and progressing towards the reed input end of the top
joint.
Figure 11 Bore profiles of the bottom and top joints of the five Howarth S10 student
model oboes (determined using high precision measurement discs)

25
It is clear that the bore of the bottom joint of oboe K619 has a slightly slower rate of
expansion than the bores of the other bottom joints. Meanwhile, close examination of the figure
reveals that the top joints of oboes K619 and K855 both have a slightly wider bore towards the
reed input end than the other top joints. It is likely that these small differences in the bore
profiles of the five oboes provide an explanation for many of the differences observed in the
impedance curves of Figure 10. However, modelling the exact effect of localised bore diameter
changes on the resonance properties of a full instrument is not trivial. For example, it requires
knowledge of the exact geometry of the whole instrument (including the bell) and precise details
of the positioning, diameters and heights of all the side holes. As this paper is primarily
concerned with investigating the consistency of musical wind instrument manufacturing,
implementation of such a model is left for future work.
VI. CONCLUSION
The consistency of woodwind instrument manufacturing has been investigated by comparing
five Howarth S10 student model oboes using a combination of psychophysical testing and
acoustical measurement. Preliminary playing tests were carried out using the two instruments
initially believed to be the most dissimilar. For the majority of the musicians that participated in
these playing tests, the two oboes were perceived as having essentially identical playing
properties, suggesting a high level of manufacturing consistency. However, two musicians did
perceive differences in the playing properties of the instruments when producing the note F6.
This finding was corroborated by further psychophysical testing which revealed a variation in the
playability of F6 across all five oboes, caused by small differences in the elevation of the C key.
This does not indicate a major issue in terms of manufacturing consistency as the heights of all
the keys can be easily adjusted (via the simple turn of a screw) by the manufacturer; although the
findings of this paper suggest that special attention should be paid to the adjustment of the C key.

26
Of more interest are the tiny variations that were observed in the bore profiles of the instrument
joints. These variations are the most likely reason that, during the preliminary playing tests, one
musician was able to perceive differences between the two oboes when playing in the lowest
register (a finding which was again backed up by the results of further psychophysical testing).
One possible cause of the differences in the bore profiles of the instruments is a gradual build up
of burr on the reamer used to bore out the joints over the course of the manufacturing run.
Another possible cause is a variation in the amount of relaxation experienced by the wood of the
different joints after the machining has taken place.
In conclusion, the methods reported in this paper have not only successfully identified
perceptual and acoustical variations between a set of nominally identical oboes but they have
also enabled the physical differences responsible for those variations to be determined.
Therefore, even with the high levels of manufacturing consistency already being achieved by
some makers, the integration of these methods into the quality control process could be of
potential benefit to woodwind instrument manufacturers.
ACKNOWLEDGMENTS
This work was jointly funded by the British Academy, the Royal Academy of Engineering and
the Royal Society under the Newton International Fellowship scheme. Thanks are due to
instrument makers Howarth of London for the loan of the five oboes used in the study.
REFERENCES
1D. B. Sharp, “Acoustic pulse reflectometry for the measurement of musical wind instruments,”
PhD thesis, University of Edinburgh (1996).
2J. M. Buick, J. Kemp, D. B. Sharp, M. van Walstijn, D. M. Campbell and R. A. Smith,
"Distinguishing between similar tubular objects using pulse reflectometry: A study of trumpet
and cornet leadpipes," Meas. Sci. Technol., 13, 750-757 (2002).

27
3A. Li, D. B. Sharp and B. J. Forbes, "Increasing the axial resolution of bore profile
measurements made using acoustic pulse reflectometry," Meas. Sci. Technol., 16, 2011-2019
(2005).
4J. Backus, “Input impedance curves for the reed woodwind instruments,” J. Acoust. Soc. Am.,
56(4), 1266-1279 (1974).
5J.- P. Dalmont, “Acoustic impedance measurement, Part 1: A review,” Journal of Sound and
Vibration, 243(3), 427-439 (2001).
6G. R. Plitnik and W. J. Strong, “Numerical method for calculating input impedances of the
oboe,” J. Acoust. Soc. Am., 65(3), 816-825 (1979).
7M. C. Meilgaard, G. V. Civille and B. T. Carr, Sensory Evaluation Techniques (third edition),
CRC (1999).
8D. B. Sharp, H. A. K. Wright and W. Ring, "An acoustical investigation into the effect of the
crook profile on the sound produced by the bassoon," Acustica, 89(1), 137-144 (2003).
9T. J. W. Hill and D. B. Sharp, "Acoustical and psychoacoustical investigations of the effect of
crook bore profile on the playability of bassoons," in Proceedings of the Stockholm Music
Acoustics Conference, Aug 6-9, 2003 (SMAC 2003), Stockholm, Sweden.
10G. Plitnik and B. Lawson, “An investigation of correlations between geometry, acoustical
variables, and psychoacoustic parameters for french horn mouthpieces,” J. Acoust. Soc. Am.,
106(2), 1111-1125 (1999).
11A. Mamou-Mani and D. B. Sharp, “Evaluating the suitability of acoustical measurement
techniques and psychophysical testing for studying the consistency of musical wind instrument
manufacturing,” Applied Acoustics, 71(7), 668-674 (2010).
12R. R. Griffiths, E. M. Vernotica, “Is caffeine a flavoring agent in cola soft drinks?” Arch. Fam.
Med., 9, 727-734 (2000).
13G. Widholm, H. Pichler, T. Ossmann, “BIAS: A Computer-Aided Test System for Brass Wind
Instruments,” An Audio Engineering Society Preprint, 2834 (1989).

28
14G. Widholm, “Brass wind instrument quality measured and evaluated by a new computer
system”, in Proceedings of the 15th International Congress on Acoustics, Trondheim 1995, vol.
III, 517-520, 1995, ASN, ISBN: 8259589958

29
LIST OF FIGURES
Figure 1: Five Howarth S10 student model oboes
Figure 2: Schematic diagram of BIAS measurement head coupled to oboe
Figure 3: Input impedance magnitude curves for the five Howarth S10 student model oboes with
F6 fingering applied
Figure 4: Scatter diagram plotting deviations in the frequencies and amplitudes of the first
resonance peaks from the corresponding mean values for five Howarth S10 student model oboes
at 32 note pitches.
Figure 5: Position of C key on top joint of oboe
Figure 6: Bore reconstructions of the top joints of the five Howarth S10 student model oboes,
with all holes closed except for the C hole.
Figure 7: Input impedance magnitude curves for the five Howarth S10 student model oboes with
alternative F6 fingering applied
Figure 8: Input impedance magnitude curves for the five Howarth S10 student model oboes with
E5 fingering applied
Figure 9: Scatter diagram plotting deviations in the frequencies and amplitudes of the first
resonance peaks from the corresponding mean values for five Howarth S10 student model oboes
at the 15 note pitches in the lowest register of the instrument.
Figure 10: Input impedance magnitude curves for the five Howarth S10 student model oboes
with B3 fingering applied
Figure 11: Bore profiles of the bottom and top joints of the five Howarth S10 student model
oboes (determined using high precision measurement discs)