Embed Size (px)
Citation preview

1
The Current Major Interglacial
L. David Roper
Contents
Contents ...................................................................................................................................................... 1
Figures......................................................................................................................................................... 2
Chapter 1. Introduction ........................................................................................................................... 3
Chapter 2. Antarctica and Greenland Temperatures for the Current Major Interglacial ........................ 5
Chapter 3. Fits to the Antarctica and Greenland Temperatures for the Current Major Interglacial ....... 9
Appendix ................................................................................................................................................... 12
References ................................................................................................................................................. 16
Author ....................................................................................................................................................... 17

2
Figures
Figure 1-1. Vostok Antarctica temperatures relative to 1990 temperature as measured by deuterium
concentration in ice cores (Pettit, 1999). Top: Temperature data from -150 kiloyears before 1990.
Also shown are some major events for Homo sapiens during the last Major Ice Age. Bottom:
Temperatures from -10 kiloyears before 1990 (current Major Interglacial; see Glossary). ............... 3
Figure 1-2. Antarctica temperature data (right scale) for 425,000 ybp to the present (present=0 on
horizontal scale), which shows four Major Ice Ages of about 115,000-years duration and the five
Major Interglacials that bound them. The dashed curve is the precisely calculated solar energy per
area that strikes the Earth’s upper atmosphere (insolation) (left scale) at the North Pole in the
summer. The solid curve is a model fit to the temperature data for four previous Major Ice Ages
(Roper, 2004), which is extrapolated into the next two Major Ice Ages up to 250,000 yap.
(http://www.roperld.com/science/tempsolinsatc.pdf ) ........................................................................ 4
Figure 2-1. Comparison of the last three Major Interglacials with the current Major Interglacial and
about 15 kiloyears before them. Antarctica temperatures are relative to 1990 for the current and last
four Major Interglacials, which are shifted in time to make their peaks at about the same point in
the graph. Top: Comparison. Bottom: Current Major Interglacial and 15 kiloyears before it. .......... 5
Figure 2-2. Greenland temperatures for the last 50 kiloyears before about 1900 as measured in ice cores.
(ftp://ftp.ncdc.noaa.gov/pub/data/paleo/icecore/greenland/summit/gisp2/isotopes/gisp2_temp_accu
m_alley2000.txt) Top: Last 50 kiloyears to 1900. Bottom: Last 10 kiloyears to 1900. ..................... 6
Figure 2-3. Comparison of Antarctica temperatures relative to 1990 and Greenland temperatures relative
to 1900. Also shown is the calculated North Pole summer insolation (right scale) (Berger, 1991).
Top: Last 50 kiloyears. Bottom: Last 10 kiloyears. ............................................................................ 7
Figure 2-4. Lake Agassiz and three possible points of breaches (red arrows) of the ice dam.
(http://pangea.stanford.edu/research/Oceans/GES205/superlakes.pdf) .............................................. 8
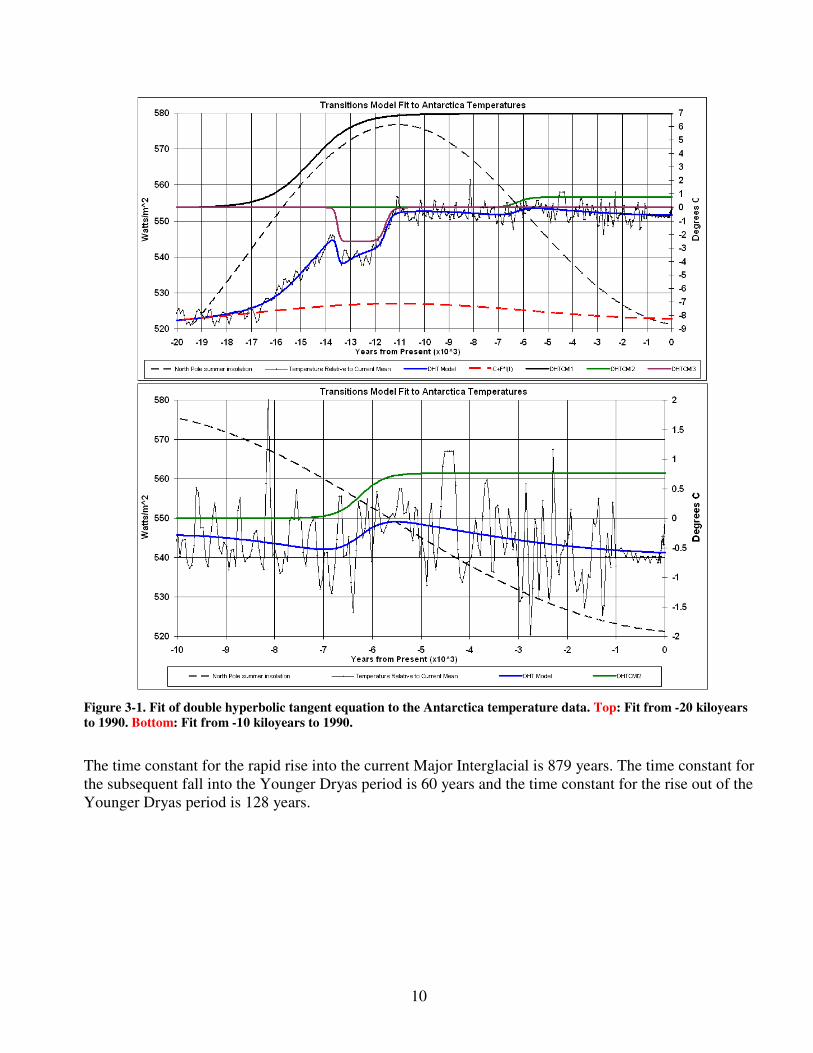
Figure 3-1. Fit of double hyperbolic tangent equation to the Antarctica temperature data. Top: Fit from -
20 kiloyears to 1990. Bottom: Fit from -10 kiloyears to 1990. ........................................................ 10
Figure 3-2. Fit of double hyperbolic tangent equation to the Greenland temperature data. Top: Fit from -
50 kiloyears to 1990. Bottom: Fit from -10 kiloyears to 1990. ........................................................ 11

3
Chapter 1. Introduction
Homo sapiens on the Earth have been blessed with a relatively stable climate for the last 10,000 years or
so, compared to the climate over the rest of the last 115,000 years of the last Major Ice Age (see
Glossary), as shown in Figure 1-1.
Figure 1-1. Vostok Antarctica temperatures relative to 1990 temperature as measured by deuterium concentration in
ice cores (Pettit, 1999). Top: Temperature data from -150 kiloyears before 1990. Also shown are some major events
for Homo sapiens during the last Major Ice Age. Bottom: Temperatures from -10 kiloyears before 1990 (current
Major Interglacial; see Glossary).
From the bottom graph of Figure 1-1 it is seen that, although the temperature was relatively stable
compared to the rest of the last Major Ice Age, there were some periods of rapid variation.
Over the last one million years there have been about eight Major Ice ages of about 115 kiloyears
duration.

4
Figure 1-2 shows Vostok Antarctica temperature data and summer insolation at the North Pole for the
last four Major Ice Ages and predictions for the next two Major Ice Ages. (North-Pole summer
insolation is used because accumulation of ice in the Arctic region is crucial to Major Ice Ages cycles
and summer is when the ice can melt.) The temperature data were “tuned” to the insolation calculation,
since they lagged excessively at earlier times and the temperature measurements are more prone to error
for earlier times (deeper ice cores); thus the calculated lag of temperature to insolation of about 5000
years has been eliminated.
Transitions Model Fit to Antarctica Temperatures
470
480
490
500
510
520
530
540
550
560
570
580
590
600
610
-450 -400 -350 -300 -250 -200 -150 -100 -50 0 50 100 150 200 250Years from Present (x10^3)
Wa
tts
/m^
2
-13
-12
-11
-10
-9
-8
-7
-6
-5
-4
-3
-2
-1
0
1
2
3
4
5
De
gre
es
C
North Pole summer insolation Temperature Relative to Current Mean Constant Double Sigmoid Model
b
Figure 1-2. Antarctica temperature data (right scale) for 425,000 ybp to the present (present=0 on horizontal scale),
which shows four Major Ice Ages of about 115,000-years duration and the five Major Interglacials that bound them.
The dashed curve is the precisely calculated solar energy per area that strikes the Earth’s upper atmosphere
(insolation) (left scale) at the North Pole in the summer. The solid curve is a model fit to the temperature data for four
previous Major Ice Ages (Roper, 2004), which is extrapolated into the next two Major Ice Ages up to 250,000 yap.
(http://www.roperld.com/science/tempsolinsatc.pdf )

5
Chapter 2. Antarctica and Greenland Temperatures for the Current Major Interglacial
Figure 2-1 shows Antarctica temperatures relative to 1990 for the current and the last four Major
Interglacial periods shifted appropriately for comparison. The last four are shifted in time to make their
peaks about the same point in the graph. The last three are much more to be trusted for accuracy than is
the fourth one at the end of the ice core at about 425 kiloyears before 1990.
Figure 2-1. Comparison of the last three Major Interglacials with the current Major Interglacial and about 15
kiloyears before them. Antarctica temperatures are relative to 1990 for the current and last four Major Interglacials,
which are shifted in time to make their peaks at about the same point in the graph. Top: Comparison. Bottom:
Current Major Interglacial and 15 kiloyears before it.

6
It is clear that the current Major Interglacial is anomalously long and flat compared to the other four
Major Interglacials.
The prevailing theory of the rapid rise from a Major Ice Age into a Major Interglacial is that the North
Atlantic thermohaline ocean currents (NAOC) (http://en.wikipedia.org/wiki/Thermohaline_circulation) is
turned on.
Temperatures in ice cores for Greenland have also been measured, as shown in Figure 2-2.
Figure 2-2. Greenland temperatures for the last 50 kiloyears before about 1900 as measured in ice cores.
(ftp://ftp.ncdc.noaa.gov/pub/data/paleo/icecore/greenland/summit/gisp2/isotopes/gisp2_temp_accum_alley2000.txt)
Top: Last 50 kiloyears to 1900. Bottom: Last 10 kiloyears to 1900.

7
Figure 2-3 compares the Antarctica temperatures relative to about 1990 and the Greenland temperatures
relative to about 1900 for the last 50 kiloyears and 10 kiloyears.
Figure 2-3. Comparison of Antarctica temperatures relative to 1990 and Greenland temperatures relative to 1900.
Also shown is the calculated North Pole summer insolation (right scale) (Berger, 1991). Top: Last 50 kiloyears.
Bottom: Last 10 kiloyears.

8
Note that the Greenland temperature differences over the current Major Interglacial are mostly positive
compared to 1900 and larger than the Antarctica temperature changes, which are mostly negative
relative to 1990. The Greenland temperatures and the Antarctica temperatures have the opposite
relationship for the tail end of the last Major Ice Age before the current Major Interglacial. That is, the
change from average temperature in the Arctic is much larger negatively than in Antarctica during a
Major Ice Age, but the change from average temperature in Antarctica is somewhat smaller positively
than the Arctic in a Major Interglacial. A possible theory for this is that the North Atlantic thermohaline
ocean currents (NAOC) (See Glossary.) turning on are what cause the rapid transition into a Major
Interglacial from the Major Ice Age and that similar, but much smaller, South Atlantic thermohaline
ocean currents occur in the Antarctic.
Also, note that the Younger Dryas temperature dip (http://en.wikipedia.org/wiki/Younger_Dryas)
between -15 kiloyears and -10 kiloyears was much stronger in Greenland than it was in Antarctica. The
prevailing theory for the Younger Dryas temperature dip is that part of the North Atlantic thermohaline
ocean currents (NAOC) (See Glossary.) is turned off briefly, probably due to melting ice reducing the
saline content of Arctic water. However, usually when that happens Antarctica warms instead of cools
(Houghton, 2004). Perhaps fresh water was dumped into the Antarctic, also, cutting off a warm current
flowing into that region.
An example of Greenland cooling while Antarctica warms is shown at about -8.2 kiloyears in Figure 2-3
when an ice dam that separated Lake Agassiz from the Atlantic Ocean, by way of Hudson Bay and the
Labrador Sea, was breached (probably by water flowing under it) and a huge amount of fresh water was
dumped into the Atlantic Ocean. See Figure 2-4.
(http://pangea.stanford.edu/research/Oceans/GES205/superlakes.pdf) The theory is that the huge amount
of fresh water turned of part of the North Atlantic Ocean thermohaline current, thus cooling the Arctic
and warming the Antarctic.
Figure 2-4. Lake Agassiz and three possible points of breaches (red arrows) of the ice dam.
(http://pangea.stanford.edu/research/Oceans/GES205/superlakes.pdf)
A close look at the Figure 2-3 hints that a similar event might have occurred between -4.5 kiloyears and -
5 kiloyears.

9
Chapter 3. Fits to the Antarctica and Greenland Temperatures for the Current Major Interglacial
One can fit a series of double hyperbolic tangents, to represent the turning on and off of Earth states, to
the temperature data for the current Major Interglacial and the period leading into it.
The mathematical function is:
(DHTF = double hyperbolic tangent = double sigmoid.) The time constant for a fall or a rise is / 2w .
Table 3-1 gives the parameters for the fit to the Antarctica temperature data and Figure 3-1 shows the fit.
Table 3-1. Parameters for the double-hyperbolic-tangent fit to the Antarctica temperatures.
s c1 w1 c2 w2 Insolation
Factor Constant
6.94527 -14.55343 1.75766 0.02019 -18.8125
0.76238 -6.24129 0.50000
-2.53164 -13.52438 0.11971 -11.57177 0.25589
10
Figure 3-1. Fit of double hyperbolic tangent equation to the Antarctica temperature data. Top: Fit from -20 kiloyears
to 1990. Bottom: Fit from -10 kiloyears to 1990.
The time constant for the rapid rise into the current Major Interglacial is 879 years. The time constant for
the subsequent fall into the Younger Dryas period is 60 years and the time constant for the rise out of the
Younger Dryas period is 128 years.

11
Table 3-2 gives the parameters for the fit to the Greenland temperature data and Figure 3-2 shows the fit.
Table 3-2. Parameters for the double-hyperbolic-tangent fit to the Greenland temperatures.
s c1 w1 c1 wl Insolation
Factor Constant
12.088102 -14.68356813 0.04266 0.103093 -69.351
-328.1825 -12.4025245 1.39812 -12.25316394 1.35775
3.68494 -5.28408 1.96296
Figure 3-2. Fit of double hyperbolic tangent equation to the Greenland temperature data. Top: Fit from -50 kiloyears
to 1990. Bottom: Fit from -10 kiloyears to 1990.
The time constant for the rapid rise into the current Major Interglacial is 21 years. The time constant for
the subsequent fall into the Younger Dryas period is 699 years and the time constant for the rise out of
the Younger Dryas period is 679 years.
One could interpret the green transition curves in Figure 3-1 and Figure 3-2 as Neolithic Global Warming
due to the onset of agriculture dumping carbon dioxide and methane into the upper atmosphere

12
(Ruddiman, 2005) (http://www.roperld.com/science/HumanFuture.pdf). Whatever the cause is, the time
constant for the Greenland rise is 981 years.
Appendix Several researchers (http://en.wikipedia.org/wiki/Orbital_forcing) have stated that the Current Major
Interglacial is exceptionally long because the insolation during it is similar to the very long Third
Penultimate Interglacial about 400 kiloyears ago and not just because of anthropogenic global warming
due to agriculture, destroying vegetation and burning fossil fuels. Figure A-1 is a test of that claim.
Figure A-1. North-Pole summer insolation for the peaks nearest the Major Interglacial peaks. CMI = Current Major
Interglacial; LMI = Last Major Interglacial about 115 kybp; PMI = Penultimate Major Interglacial about 232 kybp;
2PMI = 2nd
Penultimate Major Interglacial about 323 kybp; 3PMI = 3rd
Penultimate Interglacial about 400 kybp. The
earlier four Major Interglacials are shifted to match the CMI at the five peaks.
Note that the 3rd
Penultimate Major Interglacial does not appear to be as similar to the Current Major
Interglacial as does the 2nd
Penultimate Major Interglacial. This can be seen more clearly in Figure A-2.
13
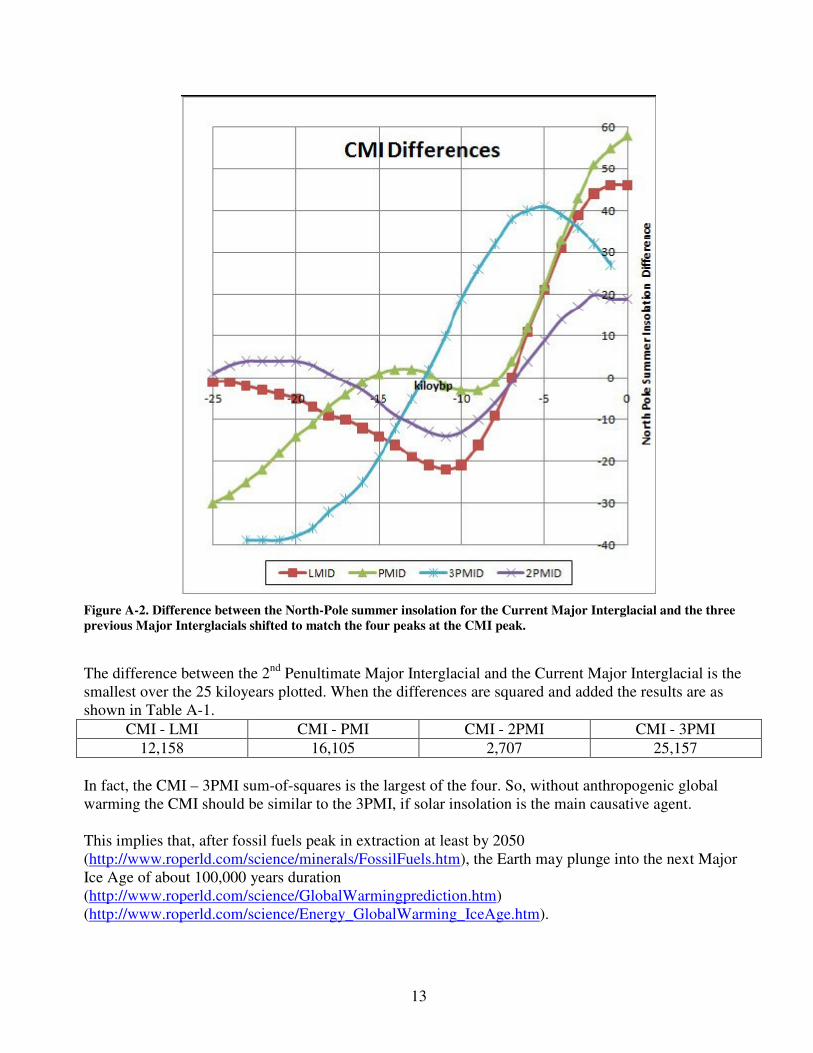
Figure A-2. Difference between the North-Pole summer insolation for the Current Major Interglacial and the three
previous Major Interglacials shifted to match the four peaks at the CMI peak.
The difference between the 2nd
Penultimate Major Interglacial and the Current Major Interglacial is the
smallest over the 25 kiloyears plotted. When the differences are squared and added the results are as
shown in Table A-1.
CMI - LMI CMI - PMI CMI - 2PMI CMI - 3PMI
12,158 16,105 2,707 25,157
In fact, the CMI – 3PMI sum-of-squares is the largest of the four. So, without anthropogenic global
warming the CMI should be similar to the 3PMI, if solar insolation is the main causative agent.
This implies that, after fossil fuels peak in extraction at least by 2050
(http://www.roperld.com/science/minerals/FossilFuels.htm), the Earth may plunge into the next Major
Ice Age of about 100,000 years duration
(http://www.roperld.com/science/GlobalWarmingprediction.htm)
(http://www.roperld.com/science/Energy_GlobalWarming_IceAge.htm).

14
Glossary
I capitalize Earth, World and Sun because they are the names of objects. It is long past time when
humans must regard the Earth as a special place rather than regarding it as a matrix for unfettered human
activity. I capitalize Global Warming, Major Ice Ages and Major Interglacials because they are the
names I give well-established scientific concepts.
If the reader needs a definition and discussion of any topic in this book, I recommend trying to find such
at http://www.wikipedia.org .
Anthropogenic Global Warming: Global Warming caused by the activities of humans.
Civilization: A society in which the basic needs (shelter, sustenance and meaningful contributing work)
of all its members are achieved through cooperation among its members.
Global Warming: The increase of the average temperature of the Earth due to greenhouse gases
(carbon dioxide, methane, etc.) being put into the upper atmosphere by geophysical processes or by the
activity of humans.
Insolation: Solar energy per time per area (Joules/second/m2 =Watts/ m
2) that strikes the upper
atmosphere.
Little Ice Age/Interglacial: Within the Minor Ice Ages and Minor Interglacials are “Little Ice Ages”
and “Little Interglacials” with pseudo-cycles periods of one to two thousand years and amplitudes of
about 1Co in size. The last Little Ice Age temperature minimum occurred at about 1500-1850 BC.
Major Ice Age: A time interval of about 115 kiloyears duration between two higher-temperature Major
Interglacials. The temperature differential between the low point (Glacial Maximum) of a Major Ice Age
and the Major Interglacial that follows it is about 9-12 degrees Celsius.
Major Interglacial: A time interval of about 5-15 kiloyears duration when the Earth’s temperature is at a high
maximum at the edges of Major Ice Ages. The temperature differential between the low point (Glacial
Maximum) of a Major Ice Age and the Major Interglacial that follows it is about 9-12 degrees Celsius. The Last
Major Interglacial is called the Eemian Interglacial.
Minor Ice Age: Within a Major Ice Age are several “Minor Ice Ages”, also called stadials, with pseudo-cycle
periods of 10,000 to 20,000 years, during which the temperature is about 2Co colder than the warm periods
(Minor Interglacials).
Minor Interglacial: Within a Major Ice Age are several “Minor Interglacials”, also called interstadials, with
pseudo-cycle periods of 10,000 to 20,000 years, during which the temperature is about 2Co warmer than the
warm periods (Minor Ice Ages).
Modern Global Warming: Global Warming caused by the activities of humans in the last two hundred
years.

15
Neolithic Global Warming: Global Warming caused by human agriculture putting carbon dioxide (starting
about 8,000 ybp) and methane (starting about 5,000 ybp) into the upper atmosphere.
North Atlantic Ocean Current: North Atlantic thermohaline ocean currents (NAOC) due to cold and salty
water plunging to lower depths in the Arctic. (http://en.wikipedia.org/wiki/Thermohaline_circulation)

16
References
Alley, 2000: The Two-Mile Time Machine: Ice cores, Abrupt Climate Change, and Our Future, Richard
B. Alley, Princeton Univ. Press, 2000.
Berger, 1991: Insolation values for the climate of the last 10 million years, Berger, A. et al., Quaternary
Science Reviews 10, 297-317, 1991.
Colling, 2002: Ocean Circulation, Angela Colling, Butterworth Heinemann & The Open University,
2002.
EPICA, 2004: Eight Glacial Cycles from an Antarctic Ice Core, EPICA Community,
http://www.esf.org/articles/85/nature02599.pdf ; Nature 429, 10 June 2004.
Houghton, 2001: Climate Change 2001: The Scientific Basis, Intergovernmental Panel on Climate
Change (IPCC), Houghton, J. T., et al., Cambridge Univ. Press, 2001.
Houghton, 2004: Global Warming: The Complete Briefing, Third Edition, Cambridge University Press,
2004
Petit, 1999: Climate and atmospheric history of the past 420,000 years from the Vostok ice core,
Antarctica, Petit, J. R. et al., Nature 399, 429-436, 1999. A shorter on-line version is available at
http://cdiac.esd.ornl.gov/trends/tem/vostok/jouz_tem.htm .
Roper, 1976: Depletion Theory, L. David Roper,
http://arts.bev.net/RoperLDavid/minerals/DepletTh.htm . Also L. David Roper, Amer. J. Phys. 47, 467
(1979) and (Bartlett, 2004) p. 151.
Roper, 2004: Models of Major Ice Ages, L. David Roper:
http://www.roperld.com/Science/TransitionsModelMIA.pdf ,
http://www.roperld.com/science/tempsolinsatc.pdf ,
http://www.arts.bev.net/roperldavid/AmeliorateGlobalWarming.pdf and
http://arts.bev.net/roperldavid/MajorIceAges.htm
Roper, 2005: Triple Threats for the Human Future: Will Civilization Arrive?, L. David Roper,
http://www.roperld.com/HumanFuture.pdf .
Ruddiman, 2005: Plows, Plagues & Petroleum: How Humans Took Control of Climate, William F.
Ruddiman, Princeton Univ. Press, 2005. A shorter version is in William F. Ruddiman, Scientific
American Mar 2005, p.34.

17
Author
Leon David Roper was born in Shattuck OK in 1935. He earned a BA with Honors from Oklahoma
Baptist University (physics/mathematics major, chemistry minor) in 1958 and got his PhD in theoretical
physics from Massachusetts Institute of Technology in 1963. The “Roper Resonance” was discovered by
him in his Ph.D. research (http://arts.bev.net/roperldavid/roperres.htm). He was a postdoctoral appointee
at Lawrence Livermore Laboratory, Livermore, California for two years. He taught physics at Kentucky
Southern College in Louisville, Kentucky for two years, and was on the faculty at Virginia Polytechnic
Institute and State University in Blacksburg, Virginia for 31 years, spending several sabbaticals at
universities and research laboratories in several other countries. He lives in Blacksburg and can be
contacted at [email protected] . More information about the author is available at
http://arts.bev.net/roperldavid .
22 August 2009