Embed Size (px)
Citation preview

1
TESTING & DESIGN LIFE MODELING OF POLYUREA LINERS FOR POTABLE
WATER PIPES
Daniel O. Siringi, University of Eldoret
ABSTRACT
Currently, there are various renewal methods available for different applications, among
which coatings and linings are most commonly used for the renewal of water pipes. Polyurea is a
lining material applied to the interior surface of the deteriorated host pipe using spray technique.
It is applied to structurally enhance the pipe and provide barrier coating. This thesis presents the
preliminary results of an ongoing laboratory testing program designed to investigate the renewal
of potable water pipes using polyurea spray lining. This research focuses on predicting the long-
term behavior of polyurea composite. The goal of this test was to establish a relationship
between stress, strain and time. The results obtained from these tests were used in predicting the
life and strength of the polyurea material. In addition to this, based on the 1,000 hours
experimental data, curve fitting and Findley Power Law models were employed to predict long-
term behavior of the material Findley’s power law accurately predicted the non-linear time-
dependent creep deformation of this material with acceptable accuracy. Experimental results
indicated that this material offers a good balance of strength and stiffness and can be utilized in
structural enhancement applications in potable water pipes.
.
1.0 Introduction
Corrosion is considered to be the major reason for structural failures. In many instances,
the most and perhaps the only effective measure that can be taken for corrosion control is to
protect the structure with a coating. Corrosion control by coatings has progressed to a scientific

2
level. An ideal corrosion protection coating or lining system must be environmentally friendly,
worker-safe, durable and able to expose little or no substrate surface to the environment.
Trenchless technology includes various methods for rehabilitation of pipelines and underground
pipelines with minimum disruption of surface and subsurface. There are number of methods
available for rehabilitation of water lines. The effectiveness of the method depends on the
physical properties of lining, pipe material and the geometry. Several factors must be evaluated
before choosing a particular lining method of rehabilitation for an individual project. A lining
material should be capable of providing protection against corrosion and guarantee long-term
gap spanning ability. For deteriorated pipe, lining should provide structural
enhancement in conjunction with the host pipe. Rehabilitation planning should be established
based on the evaluation of deterioration degree of pipes. Polyurea, a breakthrough product
developed in 1980’s is two component elastomeric lining system possessing the characteristics of
regenerating the properties of pipe from its application.
Underground infrastructure is a liquid asset which is often taken for granted, because of
our mindset “out of sight and out of mind” (Najafi & Gokhale, 2005). This unfortunate mindset
is the major factor influencing the deterioration of our underground infrastructure. The effect of
deterioration of water lines could result in great detriment and could be costly.
1.1 Objectives and Scope
The main goal of this research was to determine the long-term strength of three different
polyurea composites based on the tensile and flexural creep properties. This research will
systematically isolate and quantify the influence of stress parameters on short-term and long-
term behavior of the liner material.
This research work is comprised of evaluating the some mechanical properties at room
temperature; Performing trial test with similar setup to determine the appropriate stress value for
long-term test; Performing test on the liner material such as long-term tensile and flexural creep
and formulate results and predicting long-term properties and design life of polyurea composite.
2.0 Literature Review
2.1 Coatings and Linings
Pipeline coatings have undergone dramatic technological changes over the past two
decades. Coatings now must perform at higher in-service operating temperatures, must not be

3
damaged in handling during construction or in operation by soil stress or soil movement, and
must provide exceptional corrosion protection. Coatings also must be user friendly and must be
able to be applied in a mill or in the field. Coatings are the primary means of corrosion protection
for a buried pipeline whether for new construction or for pipeline rehabilitation. Although
cathodic protection is applied, it is considered the second line of defense against corrosion.
Therefore, today’s coatings must provide better protection than their predecessors, continue to
function under severe operating conditions, and be applied under less than ideal conditions. The
primary materials used for coatings and linings can be categorized into cementitious, polymers,
sheet liners and cured-in-place liners (Najafi, & Gokhale, 2005).
2.2 Polymers - Polyurea
Polymers are group of materials made up of long covalently-bonded molecules. Polymers
are commonly classified into three groups: thermoplastics, elastomers and thermosets. Figure 1
provides and outline of the various classification of polymers. Thermoplastics are linear or
branched polymers that can be molded and shaped when it is heated. Elastomers are cross-linked
rubbery polymers which are easily stretchable. Thermosets are those polymers which do not melt
when heated.
Figure 1 – Classification of Polymer (Young & Lovell, 1991)
Currently there are various polymers available in the market, each of them with
distinctive properties and applications. Some of the common polymers used in pipeline industry
are polyurethane, polyurea, epoxies, polyester, and vinyl ester
Polyurea linings are one of the latest technologies in the protective coating industry and
have shown a great deal of versatility and acceptance from the industrial end application
markets. Because of its excellent physical, chemical and mechanical properties, its efficient

4
handling performance and due to environmental reasons polyurea has found an increasing market
interest in the last few years. Polyurea is two-component elastomers, with one component being
an isocyanate material, and the other polyether polyamine. Polyurea linings are usually sprayed
through 1:1 ratio, but might vary depending on the manufacturer’s formulation.
2.3 General Properties
Polyurea have some unique and outstanding properties which makes it demanding in
coating and trenchless industry. Some of the most distinct features of polyurea are:
1. 100% Solids: Refers to lack of solvent, which can carry or reduce any of the coating
resins. This helps in achieving additional thickness and increase physical and chemical
resistance
2. VOC’s: Polyurea does not contain any Volatile Organic Compounds as per EPA Method
8260
3. Humidity: Polyurea is not likely to be affected by moisture and humidity but in reality if
there are excessive water puddles remaining in the pipe, some blistering may be present.
4. Heat and Fire Resistance: Polyurea coatings have excellent resistance to heat distortion
and sagging. Depending on the formulation, some polyureas have a low heat deflection
temperature. When exposed to constant flame for 20-30 seconds, polyurea coatings will
self-extinguish
5. Waterproof: Seamless waterproofing system for concrete, wood, metal, soil, and other
substrates
6. Abrasion Resistance: Polyurea has excellent resistance to withstand mechanical action
such as rubbing, scraping, or erosion, that tends progressively to remove material from its
surface
7. Elasticity: Polymer being an elastomer has a very linear structure with much less cross-
linking which makes it stretchy and elastic.
Table 1.0 presents some of the typical physical properties of polyurea.

5
Table 1 –Typical Physical Properties of Polyurea
Typical Physical Properties Description
Tensile Strength Test Method : ASTM D-638
Range: up to 4,000 psi
100% Modulus 500 – 1800 psi
Flexural Strength Test Method : ASTM D-790
Range: 3200 – 3,500 psi
Flexural Modulus Test Method : ASTM D-790
100,000 to 110,000 psi
Elongation 20 – 1,000 %
Gel Time 2 – 15 seconds
Tear Strength 250 – 600 pounds per linear inch
Application Temperature - 40o F to 122o F
Initial Curing Time 3 – 10 seconds
Autocatalytic
3.0 Installation Procedure of Polyurea Lining
The wide use of polyurea in the current trenchless industry as spray coatings has been
made possible through the development of proper installation procedure and application
equipment. The main factor governing an efficient lining is proper installation technique and also
the sequence of activity followed. The effectiveness of a good lining depends on many other
factors such as transportation, temperature changes, resistance to water absorption etc to achieve
an effective application at lower cost. When installed by trained professionals, polyurea offers
tremendous advantages and durability over older technologies. A properly prepared, primed, and
installed polyurea solution provides decades of trouble free use. Figure 2 illustrates the schematic
process of polyurea lining.
1. Site Preparation – Site preparation includes preparing the pipeline for cutting and cleaning.
There are a number of cleaning methods available for cleaning the water pipes, some of
which are power boring, drag scraping, abrasive pigging, pressure scraping and pressure
jetting.
2. Locating Hydrants & Valves – Installation of the polyurea lining material is usually carried
from valves to valves from upstream to downstream.
3. Drying - Prior to application the main shall be relatively dry and free from standing water.
This is achieved by drying with foam swabs, blown through with compressed air.

6
4. Pre-lining Inspection – After the cleaning is done, a visual inspection or a color CCTV
inspection of the water main is carried out to check the quality of the cleaning and highlight
any potential problems such as: infiltration, dropped joints, structural failures; and standing
water.
Figure 2 – Schematic Process of Polyurea Lining
5. Application of Polyurea Lining – A calibrated static mixer head is used to apply the lining
material to achieve its required thickness. Polyurea is fed to the spray head through a system
of high-pressure hoses and a uniform thickness liner is applied as the head moves through the
existing pipe at a constant speed.
6. Curing - Cure time is effected by environmental conditions. Do not force dry. High humidity
and/or low temperatures can cause haziness and blushing in the coating. The coating shall be
allowed to cure for a minimum period of 10 minutes after completion of lining before next
inspection is done.
7. Post-lining Inspection - Post lining inspection is carried out to ensure that the lining has
been completely and consistently applied, and that the pipe is fully lined, cured and
protected.
8. Close-out - After the lining is applied, the site is cleared with all pipelines reassembled and
waste disposed of.
3.1 Benefits of Polyurea
Polyurea offers a wide range of advantages primarily due to its unique physical, chemical
and mechanical properties. Some of the distinct benefits of polyurea are:

7
Easy to Clean: Polyurea forms an impermeable surface when it cures so it’s impossible
for dirt, grime, and liquids to bond with the floor which makes it very easy to clean
Crack Resistant: Polyurea is able to elongate at a level of 100%. This makes polyurea
able to handle the minute shifting, expanding, and contracting that occurs in all concrete
floors
Maintenance Free: Unlike most of the other linings, polyurea does not require periodic
maintenance or topcoats thus saving time and cost
Fast Reaction Time: 3 – 10 seconds
Attractive: Polyurea linings are visually appealing with many color options
Corrosive Resistant: Polyurea is much more resistant to corrosion caused by chemical
contact. Gasoline, oil and antifreeze are no match for a polyurea coating
No Volatile Organic Compounds (VOCs): All the polyurea linings are VOC free
No Odor or Low Odor: Polyurea linings does not have any odor or during application.
Any odor generated by it is at such a low level that it dissipates within two hours
Environmentally Friendly: Along with no VOCs, polyurea creates an extended life
cycle for the surface it covers. Repairs and replacements happen less often which is
beneficial to the environment
Surface Finishing: Penetrates and seals the surface, leaving a smooth, pinhole and
bubble free coating. Displays excellent flexibility and waterproofing properties for use on
a variety of substrates
Wide Application Temperature Range: Can be applied at temperatures ranging from -
20 to 120°F and in high humidity.
Table 2 gives a detailed comparison between some of the common linings used for renewal
of pipelines.
4.0 ANALYSIS OF EXPERIMENTAL DATA
The data collected through testing as shown in this chapter were used to life prediction of
these composites; and also change in modulus with time was determined using the creep data
which is useful for design purposes. The models were used for carrying out these studies are also
described in this chapter.

8
Table 2 – Comparison of Polyurea with other Linings
Parameters Polyurea Polyurethane
Cement
Mortar and
Reinforced
Shotcrete
Epoxy
Corrosion protection
Effective and
corrosion-
resistant barrier
Effective and
corrosion-
resistant barrier
Passive
permeable
barrier
Di-electric
impermeable
barrier
History Has been in use
for 10 years
Has been in use
for 65 years.
Standard
AWWA – C222
AWWA
Standard since
1955
Introduced in UK
water industry in
the late 1970s.
Standard AWWA
C-166-09
Pipe
Preparation/Cleaning
Drag scraper,
Power boring,
jetting
Drag scraper,
Power boring,
jetting
Scraper method Rack feed bore
Lining Environment Dry pipe
required
Dry pipe
required
Wet or damp
pipe: No
standing water
Dry pipe required
Typical Lining
Thickness
Minimum 1 mm
typical 2 – 5
mm
Minimum 1 mm
typical 2 – 5
mm
4 – 12 mm
diameter pipe
Minimum 1 mm
typical 2 – 4 mm
Curing Time before
Disinfection Minimum 1 hr Minimum 2 hrs
Minimum 24
hrs Minimum 16 hrs
Mixing Ratio* 1/1 1/1 1 cement/3 sand 1/1
VOC (lbs/gal) 0.00 0.00 0.00 0.30
Application Method
Plural
component
spray
Plural
component
spray
Centrifugal,
mechanical,
pneumatic,
hand
application
Plural component
spray
Application
Temperature (oF) -40 to 150 -40 to 150 35 to 100 40 to 100
Curing Procedure Not required Not required
Moist curing or
accelerated
curing
Maintain
Temperature
Color Options Many colors Many colors Not available Many colors
Odor Generation No odor Strong odor
during curing No odor
Strong odor
during curing
Bonding to Concrete Extremely
strong Weak Good Strong
* Ratio might vary depending on the manufacturer’s formulation.
9
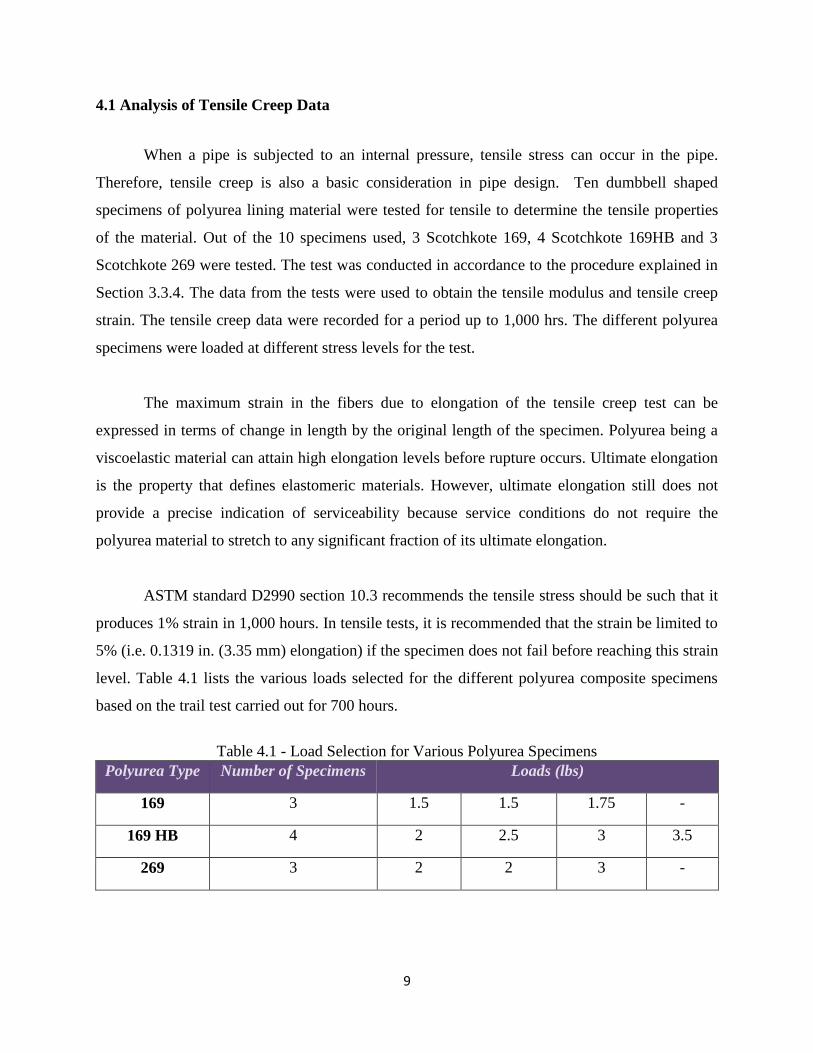
4.1 Analysis of Tensile Creep Data
When a pipe is subjected to an internal pressure, tensile stress can occur in the pipe.
Therefore, tensile creep is also a basic consideration in pipe design. Ten dumbbell shaped
specimens of polyurea lining material were tested for tensile to determine the tensile properties
of the material. Out of the 10 specimens used, 3 Scotchkote 169, 4 Scotchkote 169HB and 3
Scotchkote 269 were tested. The test was conducted in accordance to the procedure explained in
Section 3.3.4. The data from the tests were used to obtain the tensile modulus and tensile creep
strain. The tensile creep data were recorded for a period up to 1,000 hrs. The different polyurea
specimens were loaded at different stress levels for the test.
The maximum strain in the fibers due to elongation of the tensile creep test can be
expressed in terms of change in length by the original length of the specimen. Polyurea being a
viscoelastic material can attain high elongation levels before rupture occurs. Ultimate elongation
is the property that defines elastomeric materials. However, ultimate elongation still does not
provide a precise indication of serviceability because service conditions do not require the
polyurea material to stretch to any significant fraction of its ultimate elongation.
ASTM standard D2990 section 10.3 recommends the tensile stress should be such that it
produces 1% strain in 1,000 hours. In tensile tests, it is recommended that the strain be limited to
5% (i.e. 0.1319 in. (3.35 mm) elongation) if the specimen does not fail before reaching this strain
level. Table 4.1 lists the various loads selected for the different polyurea composite specimens
based on the trail test carried out for 700 hours.
Table 4.1 - Load Selection for Various Polyurea Specimens
Polyurea Type Number of Specimens Loads (lbs)
169 3 1.5 1.5 1.75 -
169 HB 4 2 2.5 3 3.5
269 3 2 2 3 -

10
The following table summarizes the ratio of applied constant stress by corresponding
strain. Table 4.2 presents the stress values of various polyurea specimens along with their
corresponding tensile strain at various time intervals.
The creep test results are presented in Figures 4.1, 4.2 and 4.3 highlighting the effect of
stress on the response characteristic with time. The different graphs for creep strain data (%)
versus time (hours) for 169, 169HB and 269 specimens tested can be obtained using constitutive
relationship. It can be seen clearly that at higher stresses the failure is faster for all specimens.
Table 4.2 - Summary of Measured Tensile Strain at Various Time Intervals
Specimen Stress (psi) Strain ε (%)
100 hrs 300 hrs 500 hrs 1000 hrs
LF-1-169 24.194 0.0611 0.1114 0.1451 0.1717
LF-2-169 24.194 0.0391 0.0993 0.1262 0.2178
LF-3-169 28.226 0.0160 0.0639 0.1258 0.1737
LF-1-169HB 32.258 0.0369 0.0590 0.0944 0.1374
LF-2-169HB 48.387 0.1134 0.1319 0.1431 0.1837
LF-3-169HB 56.452 0.0547 0.0659 0.1017 0.1258
LF-4-169HB 40.323 0.0547 0.1403 0.1439 0.1805
LF-1-269 32.258 0.0752 0.1966 0.2577 0.2904
LF-2-269 32.258 0.0694 0.1664 0.2251 0.2947
LF-3-269 48.387 0.0570 0.1840 0.2570 0.3430
Based on Figures 4.1 & 4.2 all test specimens demonstrated a similar tensile behavior
except for specimen 269 in Figure 4.3. Specimen 269 showed significantly elongation and thus
low creep modulus than the other specimens

11
Figure 4.1 - Tensile Creep Strain ε in 169 Polyurea Specimens
.
Figure 4.2 - Tensile Creep Strain ε in 169HB Polyurea Specimens
The average short-term tensile modulus for the specimens tested is shown in Table 4.3.
The following test results are provided by the manufacturer for the test carried out on same batch
of specimens.
0.00
0.06
0.12
0.18
0.24
0.30
0 200 400 600 800 1,000
Stra
in %
Time,hrs
LT-1-169
LT-2-169
LT-3-169
0
0.06
0.12
0.18
0.24
0 500 1,000
Stra
in %
Time,hrs
LT-1-169HB
LT-2-169HB

12
Figure 4.3 - Tensile Creep Strain ε in 269 Polyurea Specimens
Table 4.3 - Summary of Short-term Tensile Modulus for the Polyurea Composite
Specimen Tensile Modulus ‘E’ (psi)
Scotchkote 169 87,000
Scotchkote 169HB 87,000
Scotchkote 269 73,500
The following table summarizes the ratio of applied constant stress by corresponding
strain. From the long-term testing the tensile modulus (ET) for the specimen are presented in
Table 4.4. Polymer composite specimen experienced large elongation under sustained load due
to its creep characteristics and temperature sensitivity. Figures 4.4, 4.5 and 4.6 show the
graphical variation of the flexural creep modulus data (psi) versus time (hours) for 169, 169HB
and 269 specimens tested.
The creep rate (creep modulus vs. load application time) was found to be linear from the
application of the load to the first 500 hours. Following 500 hours the creep rate was observed to
increase at a constant rate. Thus, in accordance with Figures 4.4, 4.5 and 4.6 secondary creep
(Stage II) occurred up to approximately 150 hours of load application.
0
0.1
0.2
0.3
0.4
0 500 1,000
Str
ain
%
Time,hrs
LT-1-269
LT-2-269
LT-3-269

13
Table 4.4 - Summary of Measured Tensile Modulus ET at Various Time Intervals
Specimen Stress (psi) Tensile Creep Modulus ET (psi)
100 hrs 300 hrs 500 hrs 1000 hrs
LT-1-169 24.194 39,594 21,727 16,671 14,094
LT-2-169 24.194 61,877 24,364 19,167 11,144
LT-3-169 28.226 175,533 44,159 22,432 16,253
LT-1-169HB 32.258 87,222 54,588 34,146 23,463
LT-2-169HB 48.387 42,683 36,697 33,811 26,338
LT-3-169HB 56.452 103,255 85,626 55,505 44,865
LT-4-169HB 40.323 73,754 28,741 28,018 22,339
LT-1-269 32.258 42,896 16,407 12,519 11,114
LT-2-269 32.258 62,372 27,929 14,329 10,947
LT-3-269 48.387 84,889 26,297 18,837 14,107
Figure 4.4 - Tensile Creep Modulus ET versus Time at Various Stress for 169 Specimens
0
100,000
200,000
300,000
0 200 400 600 800 1,000
Ten
sile
Mo
du
lus
E T, p
si
Time, hrs
LT-1-169
LT-2-169
LT-3-169

14
Figure 4.5 - Tensile Creep Modulus ET versus Time at Various Stress for 169HB Specimens
The level of stress had an effect on the change in creep modulus. At lower stress levels,
the tensile elongation was higher for some of the specimen compared to same batch of the
specimens with higher stress levels. The response of polyurea under typical stress levels depends
on the rate of loading.
Figure 4.6 - Tensile Creep Modulus ET versus Time at Various Stress for 269 Specimens
4.2 Tensile Creep Test Results
Pipe subjected to internal pressure, is under the influence of tensile stress. Therefore,
tensile creep is a basic consideration in pipe design. In this study, tensile creep test was
0
50,000
100,000
150,000
200,000
250,000
0 200 400 600 800 1,000
Ten
sile
Mo
du
lus
E T, p
si
Time, hrs
LT-1-169HB
LT-2-169HB
0
100,000
200,000
300,000
400,000
500,000
0 500 1,000
Ten
sile
Mo
du
lus
E T, p
si
Time, hrs
LT-1-269
LT-2-269
LT-3-269

15
conducted as per Section 3.2. Different stress levels were selected for various polyurea
composites. Experimental strain percent versus time were plotted as shown in Figures 4.1, 4.2
and 4.3.
The average tensile strain for Polyurea 169 specimens after 1,000 hrs was found to be
approximately 0.002, for 169HB was 0.0015, whereas for 269 was 0.003. Similarly the tensile
modulus after 1,000 hours for 169 specimens was 13,830 psi, for 169HB was 29,250 psi and for
269 was 12,056 psi. In the linear creep range, the average tensile creep modulus for 169
specimens is about 34% of short-term tensile modulus (87,000 psi), for 169HB is about 14% of
short-term tensile modulus (87,000 psi) and for 269 specimens it is approximately 16 % of short-
term tensile modulus (73,500 psi).
With reference to the above results, the creep strain rates decrease very rapidly at the
initial stage and further deforms slowly after 500 hours of loading during the tests. It can be
concluded that there is very little elongation for all the three composites and load needs to be
increased to get appropriate strain and elongation. Also the elongation needs to be monitored for
more number of hours to study their behavior.
5.0 Conclusions and Recommendations
5.1 Conclusions
Polyurea spray lining system being one of the latest technologies in the coating industry
has shown a good deal of versatility and application usage. Due to its unique physical, chemical
and mechanical properties the use of polyurea linings has been increased all over. The rapid
reaction and curing time characteristics provides for an extremely good cost and time-effective
solution to a variety of coatings and linings applications over conventional technologies.
Polyurea linings come in a variety of chemical properties and combinations that would possess a
range of mechanical characteristics. The features and benefits provided by advanced polymers
cannot be ignored. Polyurea lining has set itself in a different class of lining systems as compared
to other conventional linings, like cement mortar and epoxy.

16
This study developed an understanding of long-term test behavior of polyurea pipe lining
used for renewal of deteriorated potable water pipes. The liner materials used for testing are
commercially available composites of polyurea i.e. Scotchkote 169, 169HB and 269 used in pipe
lining applications.
For this study, it was necessary to adopt an iterative approach to determine the loads that
will best represent the creep response over 10,000 hours of testing. In general, the creep testing
provided valuable information about the durability of the Scotchkote 169, 169HB and 269 lining.
The long-term tests conducted in this thesis, showed that the obtained creep data were in good
agreement with Findley’s Power law and log-fit method. These methods were used to analyze
and extrapolate the creep behavior and strain response of polyurea composite. It was observed
that polyurea samples, loaded for same period under similar loading conditions and stress, did
not perform identical results. There were differences observed both in strain, magnitude of
deflection and elongation. This can be attributed to material composition and stress distribution.
The results of creep behavior under different loading conditions for both tensile and
flexure are presented in the appendices. Based on the experimental results and theoretical
studies, the following conclusions are made:
Flexural Creep
Based on the 1,000 hours on polyurea composite specimens at room temperature, we can
conclude that 169 and 169HB polyurea specimens performed better in bending when compared
to 269 specimens. This is due to more rigidity in case of 169 & 169HB specimen which provided
a better stress distribution. There was a 90% reduction in strength for 269 specimens, unlike the
other two composites. This concludes 269 polyurea to be more flexible material and 169 and
169HB more rigid. The value of elastic modulus of the materials obtained from long-term test
was compared with the values obtained from the short-term tests results.
Tensile Creep
Polyurea composite specimens of dumbbell shape were used for evaluating the tensile
and creep properties. The 169, 169HB and 269 specimens, all performed well in tensile under

17
constant stress and at a constant room temperature. The average tensile modulus ET was very
low compared to the short-term modulus of the specimen.
Log-Curve Fitting
The log curve fitting method was in excellent conformity with the experimental data. Log
curve fitting also proved to be good practice to extrapolate the data up to 10,000 hours. Since the
available experimental data were for short duration, data extrapolation was not done for more
than 10,000 hours.
Findley’s Power Law
The equation of Findley was used to predict the creep strain under tensile and flexure.
The results of the experiments were in agreement with the predicted values by this method.
Using Findley’s method to predict the 50-year data was also useful in determining the specimen
that reached the 5% strain limit. Using Findley’s Power Law model, stress-independent model,
time-dependent strain was predicted with accuracies that were acceptable. An important
restriction to this model is that it cannot describe non-linear tertiary creep; therefore stress levels
must be kept sufficiently low to avoid this stage of creep.
5.2 Recommendations for Future Research
Based on this study, the following recommendations for future research are being made:
1. Investigating the creep response at various temperatures such as below 70oF (21oC) and
above 100oF (37oC). This will be useful in understanding the material behavior at
extreme temperatures and site conditions present in certain regions of the country
2. Investigating the creep behavior of the same specimen for longer duration of time
3. Conducting test by lowering and rising stress levels, than the ones used in this research to
obtain better creep curves
4. Comparing the creep response of polyurea composites under effect of temperature and
moisture
5. Conducting other tests like stress relaxation and hydrostatic these specimens for further
understanding of the material properties
6. Developing standard short-term testing procedures with same samples and predicting the
long-term behavior using the results of the short-term tests.

18
Acknowledgements
I would like to thank 3M/water, for giving me an opportunity to work on this
interesting project and also for providing the required funding. I also thank Dr. Mohammad
Najafi for his guidance and support.
References
American Water Works Association (AWWA), (2006). Infrastructure Reliability: Service Life
Analysis of Water Main Epoxy Lining, Denver
American Water Works Association (AWWA), (2006). Infrastructure Reliability: Service Life
Analysis of Water Main Epoxy Lining, Denver
Amyot, C., Knight, M, A., & Garibaldi, B., Cement Mortar Vs. Epoxy Lining of Water Mains for
Improved Water Quality, City of Waterloo Case Study. Available at
http://www.nastt.org/store/technical_papersPDF/161.pdf <assessed date > September
2009.
Copon Hycote 169HB. Technical Guidance Note: Semi Structural Polymeric Lining System,
E.Wood Company, UK.
Guan, S.W. (2003). 100% Solids Polyurethane and Polyurea Coatings Technology. Coatings
World, pp.49-58
Najafi, M., & Gokhale, S. (2005). Trenchless Technology: Pipeline and Utility Design,
Construction, and Renewal, New York: McGraw-Hill.
Primeaux, D. J. II, Polyurea Spray Coating Systems, Primeaux Associates LLC. Available at
http://www.pda-online.org/pda_resources/casestudies/images/JPCLPolyureaDescVer701
<assessed date> September 2009.
Primeaux, D. J. II, Application of 100% Solids, Plural Component Aliphatic Polyurea Spray
Elastomer Systems, Primeaux Associates LLC. Available at
http://www.primeauxassociates.com/index.php?module=pagesetter&type=file&func=get
&tid=8&fid=URL&pid=19&download=1 <assessed date> September 2009.
Steward, E.J., Allouche, E.N., Baumert, M.E. and Gordon, J. (2009). Testing of Rigid
Polyurethane Spray-on Lining under Internal Pressure, Infrastructure's Hidden Assets,
ASCE Pipeline 2009.
Young, R.J., & Lovell, P.J. (1991). Introduction to Polymer, 2nd Edition. CRC Press, Florida.