Embed Size (px)
Citation preview

Test and Evaluation Report
Testing and Evaluation of the I-235 Pedestrian Bridges January 6, 2006 Prepared For
Iowa Department of Transportation Office of Bridges and Structures 800 Lincoln Way
Ames, IA 50010 Prepared By Bridge Engineering Center 2901 South Loop Dr. Suite 3100 Ames, IA 50010 (515) 294-8103

1. Background In the summer of 2003, the Iowa DOT constructed a 88m span, basket-handle arch pedestrian bridge over Interstate 235 near the Botanical Center in Des Moines, Iowa. The precast, post-tensioned concrete deck system used on this bridge represents perhaps the first application of precast, segmental construction on the Iowa highway system. The concrete deck panels on this bridge are suspended from the steel arch ribs using 1.5 inch diameter high strength steel rods. The precast concrete deck panels were fabricated using a match-casting system in which the first panel was used as the end form during the casting of the second, or adjacent, panel. The second panel was then used as the end form for the third panel, etc. This process was repeated until the all panels for the bridge had been cast. During this process, the final shape of the deck profile was precisely replicated by providing a very slight angle change at the joint between adjacent concrete panels. In order to avoid placing undue stress on the concrete panels, they must then be supported at this exact same relative elevation when erected and post-tensioned together in the field. The support elevations of the concrete panels can be controlled by the precise adjustment of the anchor nut located at the bottom of the hanger rod directly beneath the panel (see Figure 1). During the construction of this bridge, it became evident that, in some cases, the hanger rod anchorage elevation, and therefore the tensile load in that particular hanger, varied considerably from that anticipated by the designers. Some minor cracking of the concrete panels was observed at the panel locations near these more-heavily loaded hanger rods. In order to eliminate this disparity, the contractor performed a series of small adjustments in the final elevation of the panels during additional overnight closures of the highway below (see Figure 2). These overnight closures of the highway required considerable expense to the State for installation of traffic control and law enforcement as well as inconvenience and potential danger to both the traveling public and the onsite workers. The Iowa State University Bridge Engineering Center was contracted to monitor and evaluate the structural performance of the hanger rods on two similar pedestrian bridges which were constructed near 40th and 44th Streets in Des Moines. 2. Instrumentation Systems Used 2.1 Fiber Optic Sensors (FOS) Each hanger rod was instrumented with an Avensys surface-mountable, Fiber Bragg Grating fiber-optic strain sensor (FOS). The sensors were glued to the rod approximately 3 inches below the bottom of the HDPE sheathing (as shown in Figure 1) using a high strength cyanoacrylate adhesive. It was intended that these sensors could be connected in series and thus a simultaneous reading of each sensor on the bridge could be obtained.

Figure 1. Fiber optic sensor attachment to hanger rod The construction process for the concrete deck panels required that the instrumented hanger rods be inserted through trumpet pipes as the panels were lifted into position (see Figure 2). The construction crew responsible for building the bridge was requested to use as much care as possible to protect the sensors during installation, but in a number of cases, the sensors were damaged and became unusable. On the 44th Street Bridge, only 13 of 28 sensors could be read at any time during the construction process. The construction-related damage to the FOS also eliminated the possibility of connecting the sensors in series. Instead, all FOS data was collected by manually reading each sensor individually each time a panel was installed.

Figure 2. Installation of instrumented hanger rod in 44th Street Bridge It was evident that a more effective system of protecting the fiber optic sensors was needed. The research team added an outer covering of PVC pipe and silicone caulk (see Figure 3) to protect the sensors from the abrasion and impact loads applied during normal construction activities. These improved increased the “survival rate” to 31 of a total 36 sensors installed on the 40th Street Bridge.
Figure 3. Improved sensor protection system used at 40th Street Bridge
The functioning fiber optic sensors on both bridges were left in place (see Figure 4) and are protected from weather and UV degradation by a galvanized steel trumpet pipe cover (see Figure 5). Figure 4. Fiber optic sensors left in position on completed bridge Figure 5. Galvanized trumpet pipe cover provides UV protection for FBG sensors leads

6
2.2 Accelerometers In order to supplement the data collected using the fiber optic strain sensors, the research team elected to collect free vibration data for each hanger rod used on the 40th Street Bridge. The researchers used a PCB model 393 U353B33 accelerometer attached to the hanger rod approximately 5 feet above the deck level as shown in Figure 6. The accelerometer was oriented with its primary axis perpendicular to the centerline of the bridge. The acceleration record for each hanger was collected by manually exciting the hanger using a suddenly applied, horizontal force or displacement approximately 4 feet above deck level. The force or displacement was applied perpendicular to the bridge centerline. Natural frequencies from the free vibration record were obtained and used to calculate the hanger force. This method is referred to as the Free Vibration Method (FVM) in this report. Each time a deck panel was installed, the research team collected vibration data from each active hanger rod. Figure 6. Typical section of bridge showing position of accelerometer mounted on hanger rod It is anticipated that the hanger forces may change slightly during the early life of the bridge due to the effect of creep of the precast panel post-tensioning system and the subsequent redistribution of forces. The research team will return to the bridge in approximately one year to collect both FOS and acceleration records to document any changes to the hanger forces.
A cce le ro m e te r
5 ft

7
3. Construction Sequence The 40th Street Bridge contains a total of 22 precast concrete panels, while the 44th Street Bridge contains a total of 20 precast concrete panels. The precast panel layout and numbering system for the two bridges are presented in Figures 7 and 8 respectively. These panels are segmentally erected and longitudinally post-tensioned using a variety of high-strength steel rods. In the segmental erection process, the mating faces of adjacent panels were coated with a specialized epoxy adhesive (Tamms Dural 100) and the panels were then stressed together using a hollow-core jack. The panels are supported by 36 mm (1.42 inch) diameter, high-strength steel bar hangers. The hangers are connected to the arch rib at anchor points located at 4200 mm (13.78 feet) spaces. The precast panel cross section is not symmetrical about the longitudinal centerline of the bridge (see Figure 9). In order to promote bridge deck drainage, the panels were cast such that the eastern side of the panel is considerably heavier than the western side. Due to this unsymmetrical shape, the deck panels, when erected and supported from the hanger rods, and before the deck system was complete, did not hang directly below the longitudinal centerline of the bridge. In fact, these panels were observed to hang as much as 28 inches west of their intended position. The contractor for the 40th Street bridge used a series of sand-filled barrels as ballast on the west side of the deck panels, which caused the panels to hang much closer to their intended position relative to the bridge centerline. The deck construction sequence for each bridge was virtually identical. A brief summary of the sequence is provided:
1. The center pair of panels (1 and 1’) were glued and stressed together on the ground prior to being lifted using two cranes (one on each side of the arch ribs).
2. The four hanger rods for the center pair of panels (1E, 1W, 1’E and 1’W) were installed and anchored in the arch ribs. The bottom of the hanger rods were held out of plumb to match the inclination of the arch ribs.
3. The center pair of panels were lifted and held in position just below the bottom of the hanger rods. The panels were carefully lifted as the hanger rods were inserted through the trumpet pipes located near the corner of each panel.
4. Surveyed elevations at the leading end of each panel were measured prior to final release of the panels from the cranes.
5. Each hanger rod was anchored against the bottom of the panels using a pair of beveled washers and nut.
6. Subsequent panels were installed in an alternating sequence (2, 2’, 3’, 3, 4, 4’, etc.) such that the loading on the arch was never more than one panel out of symmetry.
At a number of times during the panel erection process, the contractor made intermediate adjustments in the panel support elevations to maintain, to the greatest extent possible, the correct match-cast alignment as well as to roughly equalize the hanger loads.

8
1' 2' 3' 4' 5' 6' 7' 8' 9' 10'
1'W 2'W 3'W 4'W 5'W 6'W 7'W
1'E 2'E 3'E 4'E 5'E 6'E 7'E
8'W 9'W
8'E 9'E
11'
7W
10 9
7E
6W 5W 4W 3W 2W 1W
6E 5E 4E 3E 2E 1E
8 7 6 5 4 3 2 1
9W 8W
9E 8E
11
CL
Figure 7. Precast panel layout – 40th Street Bridge
7W
10 9 8 7 6 5 4 3 2 1 1' 2' 3' 4' 5' 6' 7' 8' 9' 10'
7E
6W 5W 4W 3W 2W 1W 1'W 2'W 3'W 4'W 5'W 6'W 7'W
6E 5E 4E 3E 2E 1E 1'E 2'E 3'E 4'E 5'E 6'E 7'E
CL
Figure 8. Precast panel layout – 44th Street Bridge

9
Figure 9. Precast deck panel typical section

10
Figure 10. Sand-filled barrels used as ballast during erection of 40th Street Bridge panels 4. Results 4.1 Fiber Optic Sensors As stated above in Section 2, survival of the fiber optic sensor presented a considerable problem and therefore no data results are presented for the 44th St. Bridge. The improved protection system provided some early success with the fiber optic sensors during the earlier stages of the 40th St. Bridge construction, therefore some data results are presented. 4.1.1 Initial panel construction 40th Street Bridge Figure 11 through Figure 13 shows the calculated hanger forces using the FOS data for deck construction Stages 1, 2 and 3, respectively, for the 40th Street Bridge. A brief discussion of the data is presented below.

11
Stage 1. The estimated dead load of the Stage 1 deck panel (with the added ballast) is 69.9 kips. Based upon the FOS strain data, the sum of the four hanger forces was calculated as 42.5 kips, which is only approximately 60% of the total dead load. Only at hanger 1E is the force obtained reasonably close to the theoretical dead load expected to be carried per hanger (17.5 kip). The calculated force at hanger 1’W is significantly lower than expected and the calculated hanger 1W force is also smaller than expected (Figure 11).
1'W1W
1
1'E1 E
1'
9.2
17.4
2.7
13.2
FOS [kip]
FOS [kip]
= 42.5 kipsFOSTotal Load
Total Weight = 69.9 kips
Figure 11. Stage 1 hanger forces from fiber optic sensors
Stage 2. After placement of the Stage 2 deck panel, the estimated dead load was 126.4 kips. As shown in the figure, the summation of the six hanger forces was 97.8 kips (approximately 77% of the total dead load). Regarding hanger 1E, again the force computed is close to the expected load carried per hanger (21.1 kips). The hanger forces calculated in the two new hangers (2’W and 2’E) associated with the newly placed deck panel seemed very reasonable (28.2 kips and 29.6 kips, respectively) (Figure12).

12
1'W1W
1
1'E1 E
1'
10.9
20.6
-4.0
12.5
= 97.8 kips
2'
2'W
28.2
2'E
29.6
FOS [kip]
FOS [kip]
FOSTotal Load
Total Weight = 126.4 kips
Figure12. Stage 2 hanger forces from fiber optic sensors
Stage 3. The summation of the eight hanger forces for Stage 3 construction was 93.3 kips, compared to an estimated dead load of 183.0 kips. This represented only 51% of the estimated dead load. Several of the FOS away from the added deck panel appeared to give reasonable results (e.g. at hangers 2’W and 2’E), but in general there was concern about the lack of consistency of the results using the FOS (Figure 13).
1'W1W
1
1'E1 E
1'
11.7
10.8
-1.3
10.8 k
= 93.3 kipsFOSTotal Load
2'
2'W
15.9
2'E
35.3
1W
1 E
6.1
4.0
FOS [kip]
FOS [kip]
2
= 183.0 kipsTotal Weight
Figure 13. Stage 3 hanger forces from fiber optic sensors

13
Based on the disappointing results noted above, no additional FOS data for the other construction stages are provided in this report, even though data collection was continued during the construction of the bridge. More discussion of the FOS data relative to the vibration method data is provided in a later section of this report. 4.1.2 Completed bridge The research team continued to collect FOS data from each functioning sensor, however consistent results proved very difficult to achieve. Isolated hanger locations appeared to provide reasonable results in comparison with the vibration method at various times; however, due to a lack of consistent results from the FOS, a complete record for either bridge is not presented. The research team collected strain data from each functioning gauge at the completion of bridge construction (immediately prior to wearing surface construction). Although the absolute magnitude of the load currently recorded in each hanger is not considered reliable, the relative changes in load over time will provide a record of load redistribution due to creep of the post-tensioned concrete deck system. 4.2 Accelerometers (Free Vibration Method) As noted earlier in the report, because of the problems with the survivability of the fiber optic sensors, an independent method of measuring hanger forces was used (Free Vibration Method). This decision was made after the completion of the 44th Street Bridge and prior to construction of the 40th Street Bridge. Therefore there is only completed construction data for the 44th Street Bridge (i.e. no initial panel construction data), while for the 40th Street Bridge there is both initial panel and completed construction data. 4.2.1 Initial panel construction 40th Street Bridge Figures 14 through 16 show the Stage 1, 2 and 3 calculated hanger forces using the free vibration data respectively. The data include forces for two assumptions regarding the support conditions on the hangers at the top of the arch and at the deck slab. These conditions are complete rotational fixity at both ends (fixed-fixed) and no rotational fixity at both ends (pinned-pinned). A brief discussion of the data for each stage is described below. Stage 1. The estimated dead load of the panel (including ballast) was approximately 69.9 kips. The calculated forces for the four hangers was 69.8 kips and 86.4 kips, respectively, for the fixed and the pinned conditions. The four hanger forces were relatively similar and correlation with the estimated theoretical hanger forces (based on equal distribution of dead load to all hangers) of 17.5 kips was relatively good.

14
1'W1W
1
1'E1 E
1'
22.418.2
18.2 22.4
20.7 16.2
20.9 16.2
Fixed FVM [kip]
Fixed FVM [kip]
Pinned FVM [kip]
Pinned FVM [kip]
= 69.8 kips
= 86.4 kips
Fixed FVMTotal Load
Pinned FVMTotal Load
Total Weight = 69.9 kips
Figure 14. Stage 1 hanger forces from free vibration method
Stage 2. The summation of the six hanger forces at the completion of Stage 2 was 126.4 kips and 153.9 kips, respectively, for the fixed and pinned conditions. This compares with the total estimated dead load of the panels of 126.4 kips. Note that the hanger forces in 1’W and 1W were reduced after the second panel was placed, while the other four hanger forces increased in magnitude.
1'W1W
1
1'E1 E
1'
33.7 28.4
26.0 31.0
12.89.6
16.0 12.4
= 126.4 kips
= 153.9 kips
2'
2'W
30.225.0
2'E
25.0 30.2
Fixed FVM Total Load
Pinned FVMTotal Load
Total Weight = 126.4 kips
Fixed FVM [kip]
Fixed FVM [kip]
Pinned FVM [kip]
Pinned FVM [kip]
Figure 15. Stage 2 hanger forces from free vibration method

15
Stage 3. After placement of the Stage 3 deck panel, the estimated dead load was approximately 183.0 kips. In comparison, the calculated forces for the six hangers was 181.4 kips and 217.7 kips, respectively, for the fixed and pinned conditions. It is interesting to note that hanger 1W (one of the newly placed hangers) was very lightly loaded compared to expectations (4.0 kips for the fixed condition). In contrast, hanger 1E carried 36.7 kips for the fixed condition. There was a considerable non-uniform redistribution of hanger forces throughout the three panels at the end of the Stage 3 construction, with significant hanger force unbalances noted at several panel point pairs (e.g. 1W and 1E, and 2’W and 2’E).
1'W1W
1
1'E1 E
1'
64.6 57.1
7.3 10.1
17.9 14.1
8.111.1
Fixed FVMTotal Load = 181.4 kips
= 217.7 kipsPinned FVMTotal Load
2'
2'W
16.4 20.6
2'E
36.7 42.9
1W
1 E
6.44.0
37.7 43.9
2
= 183.0 kipsTotal Weight
Fixed FVM [kip]
Fixed FVM [kip]
Pinned FVM [kip]
Pinned FVM [kip]
Figure 16. Stage 3 hanger forces from free vibration method
4.2.2 Completed bridge (40th and 44th Street Bridges) 44th Street Bridge Table 1 shows the hanger forces using the vibration method after initial completion of the bridge (i.e. prior to any hanger force adjustment). As noted earlier in the report, this bridge has a strut near each abutment that helps support some of the panel dead load in the region along with the abutments. Since the four end hangers (two each at the ends of the bridge) were too stiff to effectively measure force with the vibration method, these hangers were not included in the hanger force data. Also since these hangers are near the strut, the design forces as per the plans were not used to compare with the measured hanger forces. Instead the dead load of all of the panels assumed to be supported by the 24 hangers (12 on each arch) was used for comparison. As shown in Table 1 and based on the above assumption, the estimated deck dead load was approximately 742 kips (this excludes the six end panels, three near each abutment). In

16
comparison, the calculated forces for the hangers (excluding all four end hangers) was 605.1 kips and 780.3 kips, respectively, for the fixed and pinned conditions. Table 1. 44th Street Bridge preliminary hanger forces before adjustment
West Arch East Arch
Hanger Pinned Fixed Pinned Fixed Designation [ kip ] [ kip ] [ kip ] [ kip ]
7 * * * * 6 10.3 4.3 48.6 34.0 5 80.9 66.6 16.2 10.2 4 14.3 9.5 17.0 11.8 3 44.5 36.8 24.3 18.7 2 21.5 16.6 50.0 42.4 1 25.7 20.5 46.3 39.2 1' 46.7 39.6 33.9 27.9 2' 41.7 34.9 28.5 22.8 3' 14.4 10.3 22.9 17.5 4' 28.8 22.0 67.7 57.1 5' 11.5 6.6 24.1 16.8 6' 24.0 14.5 36.5 24.5 7’ * * * * Σ 364.3 282.2 416.0 322.9
NOTE: Forces shown were measured at the completion of panel erection and before final hanger adjustments had been made (*) Data not reliable (Σ) Sum of the design forces as per plans = 1026 kip
Other observations noted from Table 1 include the following.
• There was a relative lack of consistency in hanger force values (e.g. 4W and 5’W were very low and 5W very high). • Note that hanger pairs on the east and west arches tended to be out of balance with each other at many locations. • Note that the total of the hanger forces on the east arch was approximately 14% higher than the forces on the west arch. It was noted in the report that the deck cross section is not symmetrical; it is a deeper section on the east side, which contributes to the unbalanced forces in the hanger noted in the measured hanger forces. It should be noted that the design plans for both the 40th and 44th Street bridges indicate equal loading on both the east and west arch rib hangers. However, the unsymmetrical cross-section of the deck panels makes this condition unlikely.

17
40th Street Bridge Table 2 shows the hanger forces using the vibration method after initial completion of the bridge (i.e. prior to any hanger force adjustment). This bridge did not have a strut near the abutments as did the 44th Street Bridge, so the hangers supported the deck dead load along with the abutment. Since the four end hangers (two each at the ends of the bridge) were too stiff to effectively measure force with the vibration method, these hangers were not included in the hanger force data. The data shown were actually collected prior to the completion of the deck placement, before the last four end panels (two panels near each abutment) were placed. Therefore, the dead load of all of the panels assumed to be supported by the 32 hangers (16 on each arch) was used for comparison. As shown in Table 2 and based on the assumption above, the estimated deck dead load was approximately 966 kips (this excludes the four end panel, two near each abutment). In comparison, the calculated forces for the hangers (excluding all four end hangers) was 862.4 kips and 1081.1 kips, respectively, for the fixed and pinned conditions. Table 2. 40th Street Bridge preliminary hanger forces before adjustment
West Arch East Arch
Hanger Pinned Fixed Pinned Fixed Designation [ kip ] [ kip ] [ kip ] [ kip ]
9 * * * * 8 6.0 1.2 1.3 0.0 7 27.8 18.9 19.8 12.4 6 49.6 39.9 65.5 54.3 5 52.3 43.7 18.3 13.4 4 33.1 27.1 48.0 40.6 3 5.6 3.4 5.6 3.4 2 23.2 18.8 39.3 33.5 1 83.9 75.4 57.0 50.1 1' 5.0 3.1 33.8 28.5 2' 36.3 30.7 36.3 30.7 3' 62.4 54.6 14.0 10.5 4' 7.1 4.4 57.3 49.2 5' 35.9 28.9 4.8 2.4 6’ 32.1 24.4 32.1 24.4 7’ 76.1 60.8 43.8 32.4 8' 23.2 12.1 44.9 28.7 9’ * * * * Σ 559.4 447.4 521.7 414.6
NOTE: Forces shown were measured after placement 17 panels (*) Data not reliable (Σ) Sum of the design forces as per plans = 1361.9 kip
18
Other observations noted from Table 2 include the following.
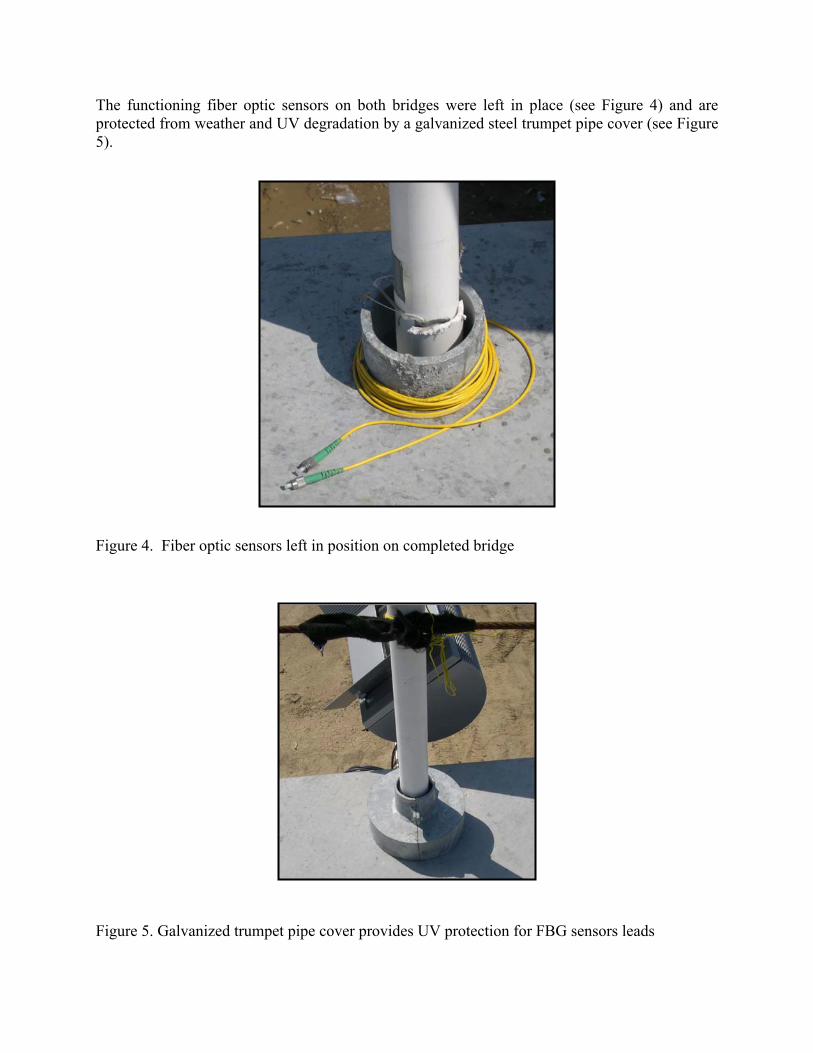
• There was a relative lack of consistency in hanger force values (e.g. 8W, 3W, 1’W, 4’W were extremely low and 1W and 7’W were very high). • Note that hanger pairs on the east and west arches tended to be out of balance with each at many locations (e.g. hangers 5, 1’, 3’, 4’, 5’ 7’ and 8’). • Note that the total of the hanger forces on the east arch was approximately 7% higher than the forces on the west arch. This difference is much smaller than occurred on the 44th Street Bridge and is due at least partially to the placement of ballast on the west side of the deck unit to try to balance the unsymmetrical deck weight. In fact, it is possible that this imbalance may have been caused by a slight error in the actual weight or positioning of the ballast barrels (relative to the contractor’s calculations).
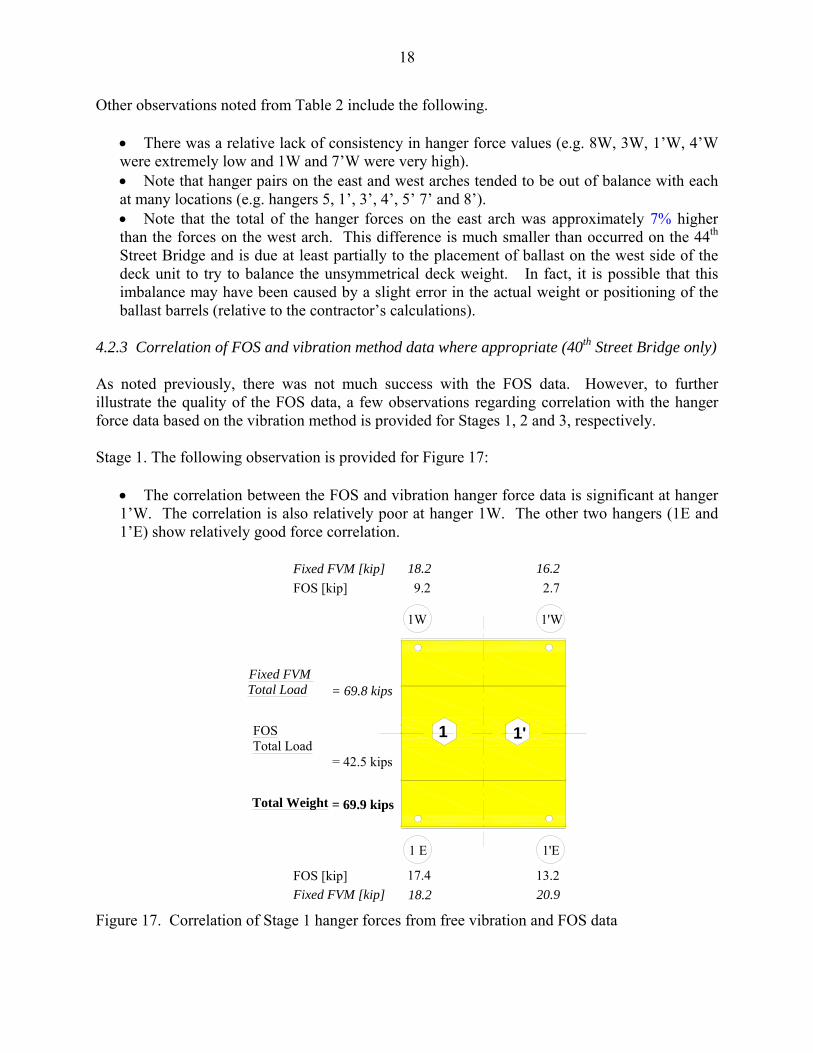
4.2.3 Correlation of FOS and vibration method data where appropriate (40th Street Bridge only) As noted previously, there was not much success with the FOS data. However, to further illustrate the quality of the FOS data, a few observations regarding correlation with the hanger force data based on the vibration method is provided for Stages 1, 2 and 3, respectively. Stage 1. The following observation is provided for Figure 17:
• The correlation between the FOS and vibration hanger force data is significant at hanger 1’W. The correlation is also relatively poor at hanger 1W. The other two hangers (1E and 1’E) show relatively good force correlation.
1'W1W
1
1'E1 E
1'
9.2
17.4
2.7
13.2
FOS [kip]
= 42.5 kips
FOSTotal Load
Total Weight = 69.9 kips
18.2 20.9
18.2 16.2Fixed FVM [kip]
= 69.8 kipsFixed FVM Total Load
Fixed FVM [kip]FOS [kip]
Figure 17. Correlation of Stage 1 hanger forces from free vibration and FOS data

19
Stage 2. The following observations are provided for Figure 18:
• Note for Stage 2 that the hanger forces in 2’W and 2’E (newly added hangers) were very similar. • It’s interesting to note that while the Stage 1 correlation of forces in Hanger 1’W was very poor, the change in force in the hanger (reduction of approximately 6 kips) was very similar during Stage 2 construction.
1'W1W
1
1'E1 E
1'
10.9
20.6
-4.0
12.5
= 97.8 kips
2'
2'W
28.2
2'E
29.6
FOSTotal Load
Total Weight = 126.4 kips
26.0 16.0 25.0
28.4 9.6 25.0
= 126.4 kips
FOS [kip]
FOS [kip]
Fixed FVM [kip]
Fixed FVMTotal Load
Fixed FVM [kip]
Figure 18. Correlation of Stage 2 hanger forces from free vibration and FOS data
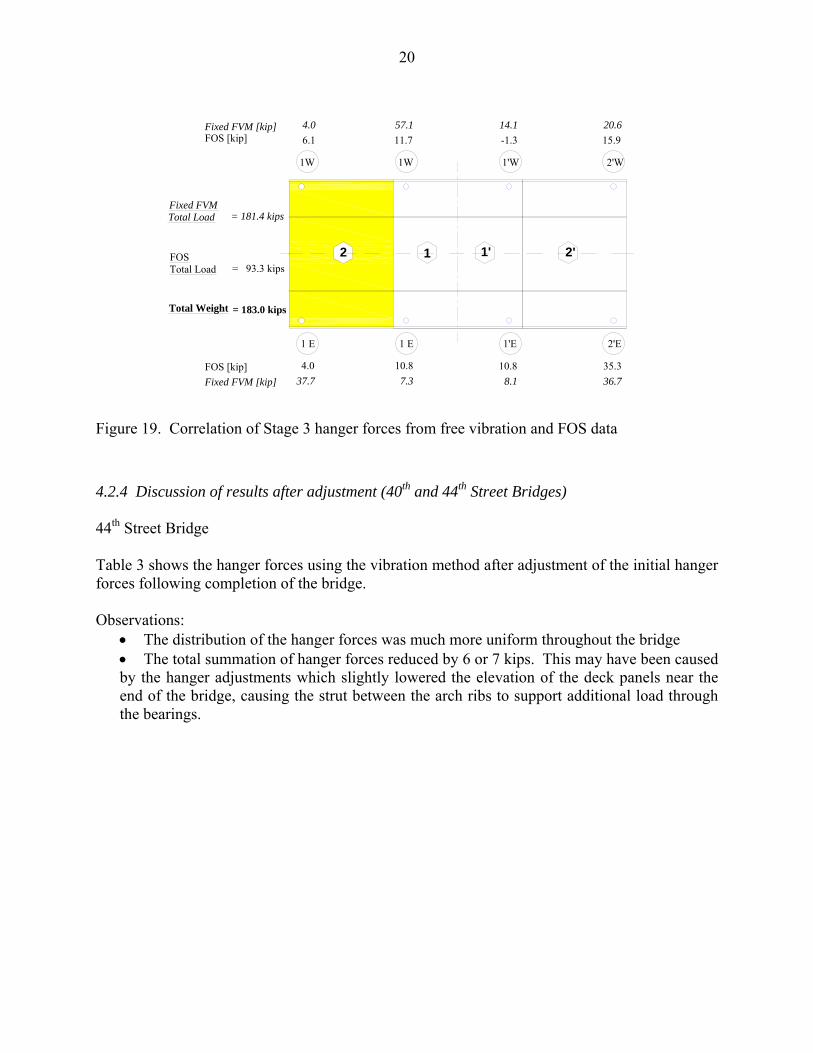
Stage 3. The following observations are provided for Figure 19:
• Note that for Stage 3 construction the correlation in hanger force for 2W was relatively good. • Note that the hanger force correlation at 2’W and 2’E was still quite good as noted above for Stage 2 construction. • Also note how the change in hanger force at 1’W from Stage 2 and 3 were similar (i.e., increased approx. 3 to 5 kips). This was similar to observation at the same hanger noted above for Stage 2 construction
20
1'W1W
1
1'E1 E
1'
11.7
10.8
-1.3
10.8
= 93.3 kipsFOSTotal Load
2'
2'W
15.9
2'E
35.3
1W
1 E
6.1
4.0
2
= 183.0 kipsTotal Weight
7.3 8.1 36.7 37.7
57.1 14.1 20.64.0
Fixed FVMTotal Load = 181.4 kips
FOS [kip]
FOS [kip]
Fixed FVM [kip]
Fixed FVM [kip]
Figure 19. Correlation of Stage 3 hanger forces from free vibration and FOS data
4.2.4 Discussion of results after adjustment (40th and 44th Street Bridges) 44th Street Bridge Table 3 shows the hanger forces using the vibration method after adjustment of the initial hanger forces following completion of the bridge. Observations:
• The distribution of the hanger forces was much more uniform throughout the bridge • The total summation of hanger forces reduced by 6 or 7 kips. This may have been caused by the hanger adjustments which slightly lowered the elevation of the deck panels near the end of the bridge, causing the strut between the arch ribs to support additional load through the bearings.

21
Table 3. 44th Street Bridge hanger forces after adjustment
West Arch East Arch
Hanger Pinned Fixed Pinned Fixed Designation [ kip ] [ kip ] [ kip ] [ kip ]
7 * * * * 6 36.0 23.7 42.1 28.6 5 33.2 24.3 18.6 12.0 4 38.0 30.0 27.6 20.9 3 28.3 22.2 31.1 24.7 2 29.2 23.4 40.7 33.8 1 40.6 34.0 40.6 34.0 1' 35.6 29.4 29.0 23.5 2' 30.0 24.2 31.5 25.6 3' 31.0 24.7 38.8 31.7 4' 21.2 15.5 45.8 37.1 5' 23.9 16.6 31.0 22.6 6' 16.8 9.1 38.2 25.9 7’ * * * * Σ 363.8 277.1 415 320.6
NOTES: Forces shown were measured at completion of panel erection and after final hanger adjustments had been made. (*) Data not reliable (Σ) Sum of the design forces as per plans = 1026 kip
40th Street Bridge Figure 20 shows a plot of the hanger forces for the East Hangers based on the vibration data to illustrate the redistribution of the hanger forces after adjustment. The target design forces for each hanger are also shown for comparison. As noted the adjustments eliminated the outliers relative to the design values and improved the overall distribution of the forces. Table 4 shows the hanger forces using the vibration method after adjustment of the initial hanger forces following completion of the bridge. Observations:
• There was relatively good distribution of hanger forces throughout bridge. • The total summation of hanger forces reduced by approximately 40 kips, significantly more than noted for the 44th Street Bridge. One possible explanation is that the 40th Street Bridge was constructed approximately 40 mm high (at the end) to 70 mm high (near midspan) and this alignment was corrected by lowering the panel elevations prior to the retesting of the hanger forces. This process might have increased the abutment reactions while decreasing the hanger loads.

22
6
5 4
3
21
1'
2'
3'
4'
5'
6'
6
5
43
2 1
1' 2'
3'
4'
5'
6'
6
5
43
2 1
1' 2'
3'
4'
5' 6'
6 5 4 3 2 1 1' 2' 3' 4' 5' 6'
0.0
20.0
40.0
60.0
80.0
100.0
Mea
sure
d H
ange
r Loa
d (K
ips)
Before (Pinned)After PinnedAfter FixedDesign
Figure 20. Hanger forces for east arch of the 44th Street Bridge after adjustment
Table 4. 40th Street Bridge hanger forces after adjustment
West Arch East Arch Hanger Pinned Fixed Pinned Fixed
Designation [ kip ] [ kip ] [ kip ] [ kip ] 9 * * * * 8 30.8 17.7 13.1 5.2 7 31.3 21.9 38.2 27.7 6 35.6 27.5 33.2 25.4 5 32.5 25.8 28.1 21.9 4 33.4 27.4 33.4 27.4 3 27.7 22.5 47.5 40.7 2 25.6 20.9 29.8 24.7 1 36.2 30.7 32.6 27.4 1' 38.7 33 35 29.6 2' 38 32.2 33.2 27.8 3' 30.8 25.4 24.7 19.9 4' 29.5 23.8 30.4 24.6 5' 44.2 36.4 46.4 38.3 6’ 37.2 28.9 39.7 31.1 7’ 33.1 23.4 29.6 20.4 8' 29.6 16.8 14.7 6.2 9’ * * * * Σ 534.2 414.2 509.6 398.4
NOTE: Forces shown were measured at completion of panel erection and after final hanger adjustments had been made. (*) Data not reliable (Σ) Sum of the design forces as per plans = 1361.9 kip

23
5. Conclusions A number of conclusions can be drawn from the instrumentation and monitoring of the I-235 Pedestrian Bridges:
• The monitoring of the two bridges during construction provided a means for ensuring that hanger loads could be adjusted to a uniform level at both intermediate and final stages of construction. Key to this was ongoing communication with the contractor, which should be strongly encouraged for future projects.
• Fiber optic strain sensors are capable of providing accurate and reliable data for both
short- and long-term structural monitoring, but only when properly protected from their environment. The use of these sensors for future projects should carefully consider adequate means of protection including embedment in concrete prior to installation.
The research team will return to the two bridges in late 2006 to document any changes in hanger loads using both the FOS and vibration method. Any significant changes will be presented in a supplemental report.