Embed Size (px)
Citation preview
Iowa DOT PM2 Targets 1 May 20, 2018
Iowa DOT Pavement and Bridge Performance Measures May 20, 2018
Performance measures Through the Moving Ahead for Progress in the 21st Century (MAP-21) Act, Congress required
the establishment of measures to assess performance in several areas, including pavement
condition of the Interstate and non-Interstate National Highway System (NHS), now codified in
23 CFR 490.307, and bridge condition of the NHS, now codified in 23 CFR 490.407. The State
Departments of Transportation (DOTs), as well as metropolitan planning organizations (MPOs)
with applicable roadways within their metropolitan planning areas, will set targets for the
following performance measures, known as “PM2”.
1. Percentage of pavements of the Interstate System in Good condition
2. Percentage of pavements of the Interstate System in Poor condition
3. Percentage of pavements of the non-Interstate NHS in Good condition
4. Percentage of pavements of the non-Interstate NHS in Poor condition
5. Percentage of NHS bridges classified as in Good condition
6. Percentage of NHS bridges classified as in Poor condition
Targets are set for all roadways on the applicable system within a State or MPO, regardless of
ownership. States must set 2- and 4-year targets for these measures by May 20, 2018. While
targets will be set on this date and communicated to MPOs at that time, they will not be officially
reported to FHWA until the submittal of State baseline performance period reports on October 1,
2018.
Pavements Iowa has more than 240,000 lane-miles of roadway across State, county, and municipal
systems. Iowa DOT is responsible for maintaining 22,804 lane-miles of highways, including
highways on the Interstate System, the majority of the NHS, and other State highways. Local
governments maintain the remaining pavements. Table 1 shows the number of lane-miles of
Interstate System highways and non-Interstate NHS highways in Iowa, which are the systems
that targets are being set for.
Table 1: Total lane miles of Interstates and non-Interstate NHS highways in Iowa
Highway system Lane miles
Interstate 3,305
DOT NHS (Non-Interstate) 12,368
Local NHS 288
Non-Interstate NHS (DOT + Local) 12,656
Iowa DOT collects pavement data on all paved roads in the state every two years, and on
Interstates every year. Data from these inspections form the basis for determining condition
levels and help owners determine pavement maintenance needs. More information about NHS
Iowa DOT PM2 Targets 2 May 20, 2018
pavements and how they are managed can be found in Iowa’s Transportation Asset
Management Plan (TAMP)1.
Target setting methodology Targets are to be set based on 0.1 mile sections of the through travel lanes of mainline
highways on the applicable highway systems. The FHWA definitions of good, fair, and poor for
pavement are determined based on the condition of three attributes - the pavement section’s
International Roughness Index (IRI), the pavement’s cracking condition, and the pavement’s
rutting rating (concrete) or faulting rating (asphalt). Per FHWA’s definitions, a pavement section
is considered “poor” if two of these three ratings are poor. A pavement section is considered
“good” if all three ratings are good. Otherwise, it is considered “fair”. As part of the phase-in
requirements for the FHWA rules, the first 4-year performance period will use an alternate
measure for non-Interstate NHS pavement condition, and will base the condition solely on the
IRI measure. Pavement that is part of a bridge deck is excluded from metric calculations.
Missing, invalid, or unresolved data is also excluded from the calculations and is not to exceed
five percent of the system’s mileage. The good and poor measures are determined by summing
the total lane-miles of good or poor highway segments and dividing by the total lane-miles of all
highway segments on the applicable system2.
Iowa DOT has a long history of collecting pavement condition data. However, there is a lack of
historical data to use for forecasting condition per the new FHWA definitions, because past data
collection did not include all elements now required. This has made developing a data-driven
approach to target forecasting a challenge.
1 https://iowadot.gov/systems_planning/planning/federal-performance-management-and-asset-management 2 More detail on the measure calculation can be found in this FHWA presentation: https://www.fhwa.dot.gov/tpm/rule/170531pm2.pdf.
Iowa DOT PM2 Targets 3 May 20, 2018
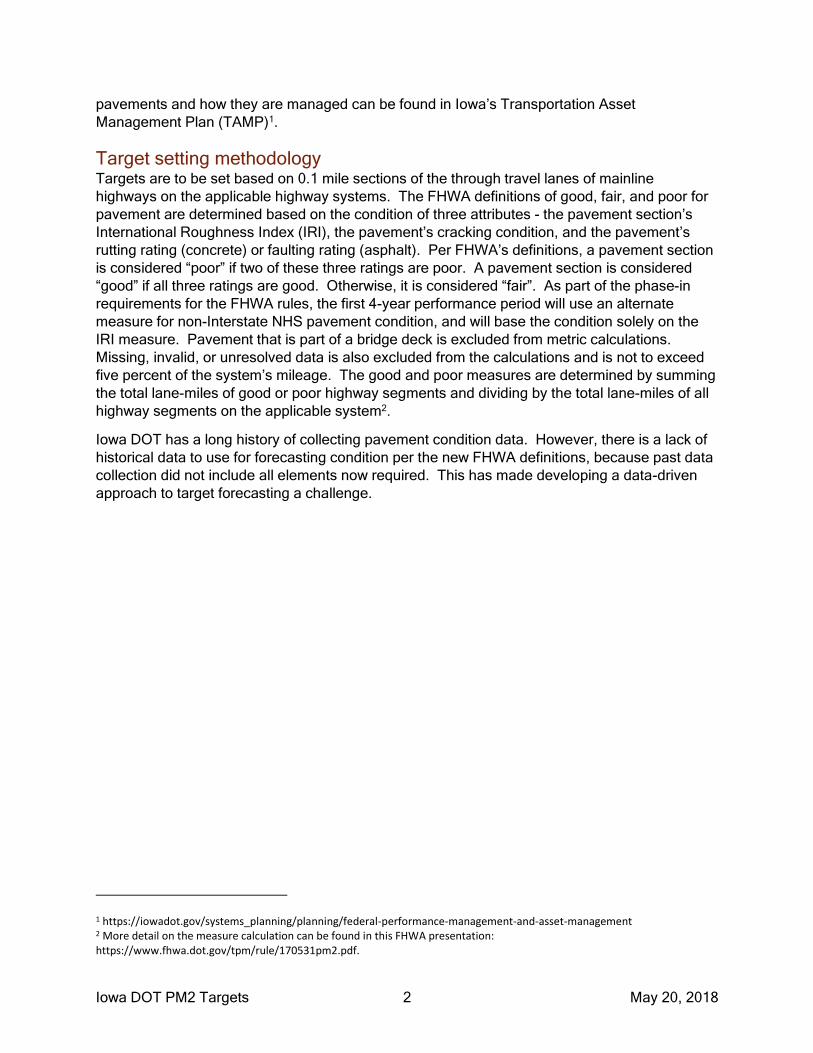
Pavement measures 1 and 2
1. Percentage of pavements of the Interstate System in Good condition
2. Percentage of pavements of the Interstate System in Poor condition
As discussed previously, there is a lack of historical data that Iowa DOT can translate to
FHWA’s new condition definitions. For the Interstate System, there are four years of data
available. Figure 1 shows the historical performance for the Iowa DOT Interstate System from
2014 to 2017, and Table 2 shows the percentages of the condition categories for the same
timeframe. Good, fair, and poor condition categories are shown, though targets are only
required for the good and poor categories. The calculation of good, fair, and poor condition
excludes unresolved/missing data.
Figure 1: Iowa Interstate System condition based on FHWA definitions for PM2
Table 2: Iowa Interstate System condition based on FHWA definitions for PM2
Year Good Fair Poor Unresolved/missing (excluded from calculation)
2014 63.63% 35.76% 0.61% 21.93%
2015 68.44% 31.27% 0.28% 22.46%
2016 59.84% 38.67% 1.49% 4.01%
2017 57.68% 40.57% 1.75% 1.66%
Iowa DOT used a hybrid approach to target setting, given that the FHWA data requirements are
different from what Iowa DOT uses to manage pavements, particularly with respect to how the
pavement sections are segmented. To establish targets, Iowa DOT used output from its
pavement management system to forecast the percentage of all Interstate pavements in good,
0.00%
10.00%
20.00%
30.00%
40.00%
50.00%
60.00%
70.00%
80.00%
90.00%
100.00%
2014 2015 2016 2017
Good Fair Poor
Iowa DOT PM2 Targets 4 May 20, 2018
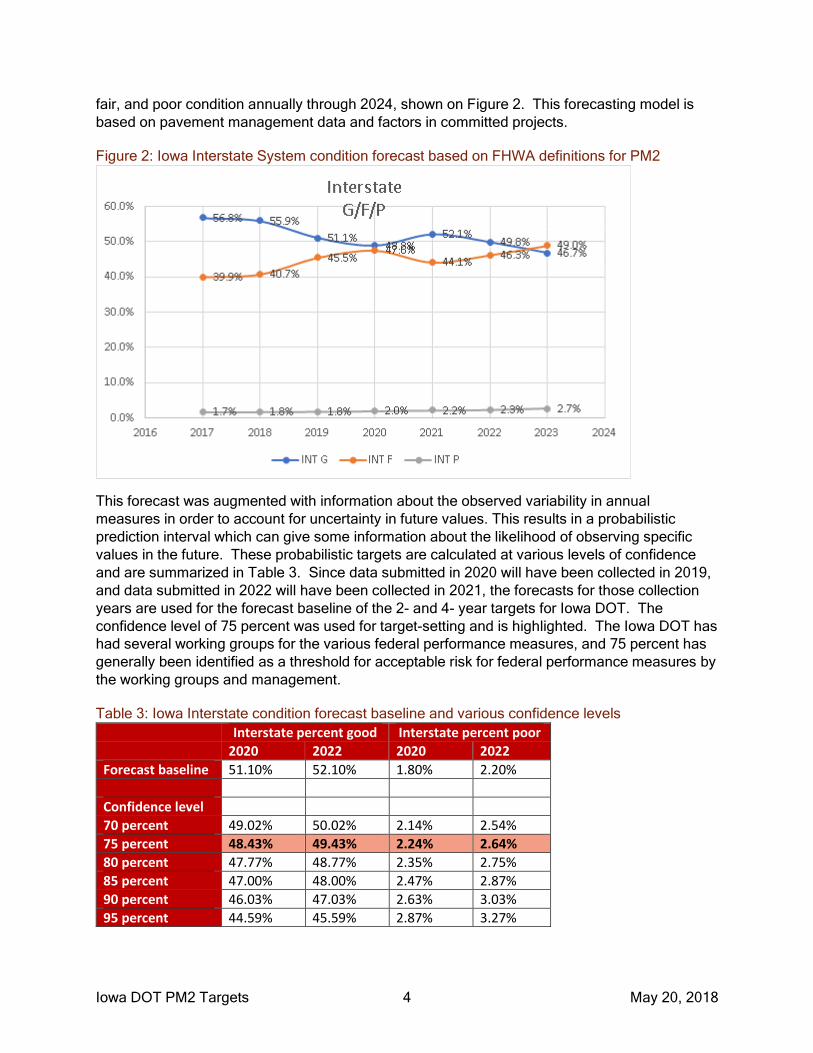
fair, and poor condition annually through 2024, shown on Figure 2. This forecasting model is
based on pavement management data and factors in committed projects.
Figure 2: Iowa Interstate System condition forecast based on FHWA definitions for PM2
This forecast was augmented with information about the observed variability in annual
measures in order to account for uncertainty in future values. This results in a probabilistic
prediction interval which can give some information about the likelihood of observing specific
values in the future. These probabilistic targets are calculated at various levels of confidence
and are summarized in Table 3. Since data submitted in 2020 will have been collected in 2019,
and data submitted in 2022 will have been collected in 2021, the forecasts for those collection
years are used for the forecast baseline of the 2- and 4- year targets for Iowa DOT. The
confidence level of 75 percent was used for target-setting and is highlighted. The Iowa DOT has
had several working groups for the various federal performance measures, and 75 percent has
generally been identified as a threshold for acceptable risk for federal performance measures by
the working groups and management.
Table 3: Iowa Interstate condition forecast baseline and various confidence levels Interstate percent good Interstate percent poor
2020 2022 2020 2022
Forecast baseline 51.10% 52.10% 1.80% 2.20%
Confidence level
70 percent 49.02% 50.02% 2.14% 2.54%
75 percent 48.43% 49.43% 2.24% 2.64%
80 percent 47.77% 48.77% 2.35% 2.75%
85 percent 47.00% 48.00% 2.47% 2.87%
90 percent 46.03% 47.03% 2.63% 3.03%
95 percent 44.59% 45.59% 2.87% 3.27%
Iowa DOT PM2 Targets 5 May 20, 2018
Pavement measures 3 and 4
Percentage of pavements of the non-Interstate NHS in Good condition
Percentage of pavements of the non-Interstate NHS in Poor condition
Table 4 shows the percentages of good, fair, poor, and unresolved/missing values for 2017
using the IRI-based non-Interstate NHS performance measure, as required by FHWA for the
phase-in period. Due to the restructuring of past IRI data that is necessary to compute the
measure per FHWA guidelines, only one year of data was available at the time the measure was
constructed. Good, fair, and poor condition categories are shown, though targets are only
required for the good and poor categories. The calculation of good, fair, and poor condition
excludes unresolved/missing data.
Table 4: Iowa Non-Interstate NHS condition based on FHWA definitions for phase-in period of
PM2
Good Fair Poor
Unresolved/missing (excluded from calculation)
NHS – local 9.14% 33.05% 57.81% 1.16%
NHS – State 50.14% 36.81% 13.05% 1.37%
Non-Interstate NHS 49.06% 36.71% 14.22% 1.36%
Iowa DOT used a hybrid approach to target setting, given that the FHWA data requirements are
different from what Iowa DOT uses to manage pavements, particularly with respect to how the
pavement sections are segmented. To establish targets, Iowa DOT used output from its
pavement management system to forecast the IRI of all non-Interstate NHS pavements and
classify each segment as good, fair, or poor condition through 2024, shown on Figure 3. This
forecasting model is based on pavement management data and factors in committed projects.
Figure 3: Iowa non-Interstate NHS condition forecast based on FHWA definitions for phase-in
period of PM2
Iowa DOT PM2 Targets 6 May 20, 2018
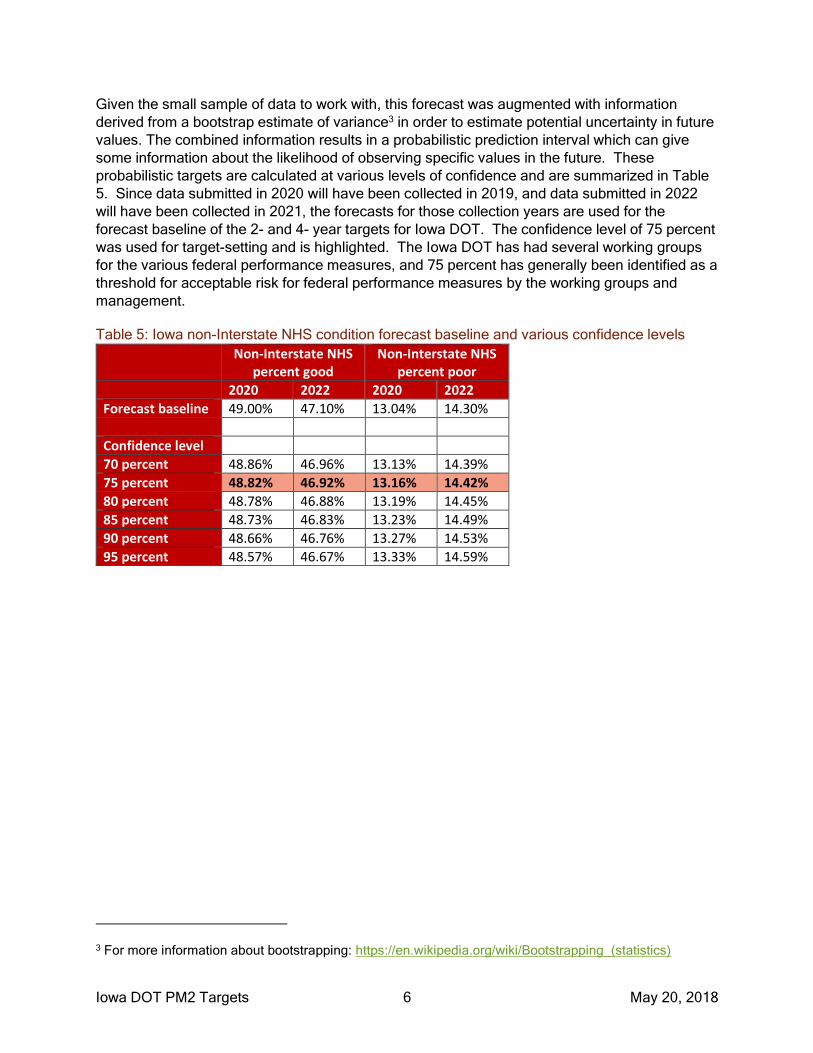
Given the small sample of data to work with, this forecast was augmented with information
derived from a bootstrap estimate of variance3 in order to estimate potential uncertainty in future
values. The combined information results in a probabilistic prediction interval which can give
some information about the likelihood of observing specific values in the future. These
probabilistic targets are calculated at various levels of confidence and are summarized in Table
5. Since data submitted in 2020 will have been collected in 2019, and data submitted in 2022
will have been collected in 2021, the forecasts for those collection years are used for the
forecast baseline of the 2- and 4- year targets for Iowa DOT. The confidence level of 75 percent
was used for target-setting and is highlighted. The Iowa DOT has had several working groups
for the various federal performance measures, and 75 percent has generally been identified as a
threshold for acceptable risk for federal performance measures by the working groups and
management.
Table 5: Iowa non-Interstate NHS condition forecast baseline and various confidence levels
Non-Interstate NHS percent good
Non-Interstate NHS percent poor
2020 2022 2020 2022
Forecast baseline 49.00% 47.10% 13.04% 14.30%
Confidence level
70 percent 48.86% 46.96% 13.13% 14.39%
75 percent 48.82% 46.92% 13.16% 14.42%
80 percent 48.78% 46.88% 13.19% 14.45%
85 percent 48.73% 46.83% 13.23% 14.49%
90 percent 48.66% 46.76% 13.27% 14.53%
95 percent 48.57% 46.67% 13.33% 14.59%
3 For more information about bootstrapping: https://en.wikipedia.org/wiki/Bootstrapping_(statistics)
Iowa DOT PM2 Targets 7 May 20, 2018
Iowa DOT pavement performance targets Targets for the pavement performance measures are established by the State DOTs for 4-year
performance periods, with the first set of 2- and 4-year targets being set by May 20, 2018 for
target years 2020 and 2022. Data reported and evaluated in these target years will be collected
in 2019 and 2021. For the first performance period, a 2-year target is not required for the
Interstate pavement measures as States were not previously required to collect data in the
manner necessary for the performance measure. States will have the opportunity to revisit the
4-year targets halfway through the performance period, at which point changes can be made if
additional data would result in revised assumptions.
Table 6 provides historical annual values for pavement condition for the current FHWA
definitions of good, fair, and poor. Interstate values are based on the combination of three
attributes (IRI, cracking, and rutting/faulting), and non-Interstate NHS values are based on IRI.
Table 6: Iowa Interstate and non-Interstate NHS condition based on FHWA definitions for PM2
Year Good Fair Poor Unresolved/missing
Interstate 2014 63.63% 35.76% 0.61% 21.93%
Interstate 2015 68.44% 31.27% 0.28% 22.46%
Interstate 2016 59.84% 38.67% 1.49% 4.01%
Interstate 2017 57.68% 40.57% 1.75% 1.66%
Non-Interstate NHS 2017 49.06% 36.71% 14.22% 1.36%
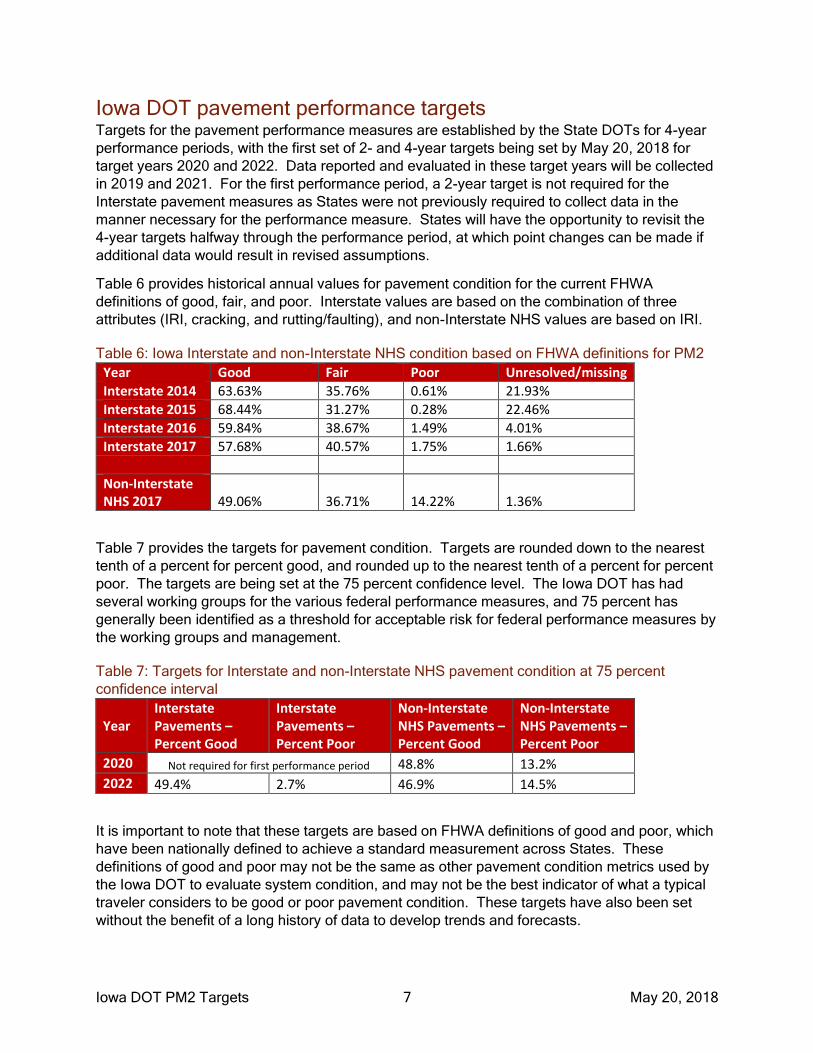
Table 7 provides the targets for pavement condition. Targets are rounded down to the nearest
tenth of a percent for percent good, and rounded up to the nearest tenth of a percent for percent
poor. The targets are being set at the 75 percent confidence level. The Iowa DOT has had
several working groups for the various federal performance measures, and 75 percent has
generally been identified as a threshold for acceptable risk for federal performance measures by
the working groups and management.
Table 7: Targets for Interstate and non-Interstate NHS pavement condition at 75 percent
confidence interval
Year Interstate Pavements – Percent Good
Interstate Pavements – Percent Poor
Non-Interstate NHS Pavements – Percent Good
Non-Interstate NHS Pavements – Percent Poor
2020 Not required for first performance period 48.8% 13.2%
2022 49.4% 2.7% 46.9% 14.5%
It is important to note that these targets are based on FHWA definitions of good and poor, which
have been nationally defined to achieve a standard measurement across States. These
definitions of good and poor may not be the same as other pavement condition metrics used by
the Iowa DOT to evaluate system condition, and may not be the best indicator of what a typical
traveler considers to be good or poor pavement condition. These targets have also been set
without the benefit of a long history of data to develop trends and forecasts.
Iowa DOT PM2 Targets 8 May 20, 2018
Minimum level for condition of Interstate pavements In addition to requiring performance targets, MAP-21 also set a minimum condition level for
Interstate pavements. Per 23 CFR 490.315, States are required to maintain Interstate
pavements so that the percentage of the lane-miles of the Interstate System classified as poor
condition does not exceed 5.0 percent. FHWA annually determines whether a State exceeds
this threshold. If a State’s percentage of poor condition Interstate lane-miles exceeds 5.0
percent, in the following year the State will be subject to funding penalties that require a certain
amount of National Highway Performance Program (NHPP) and Surface Transportation Block
Grant (STBG) funding to be used for eligible projects on the Interstate System. The percentage
of Iowa’s Interstate lane-miles in poor condition is currently below the 5.0 percent threshold, and
is forecast to remain below that threshold through the first performance period.
Iowa DOT PM2 Targets 9 May 20, 2018
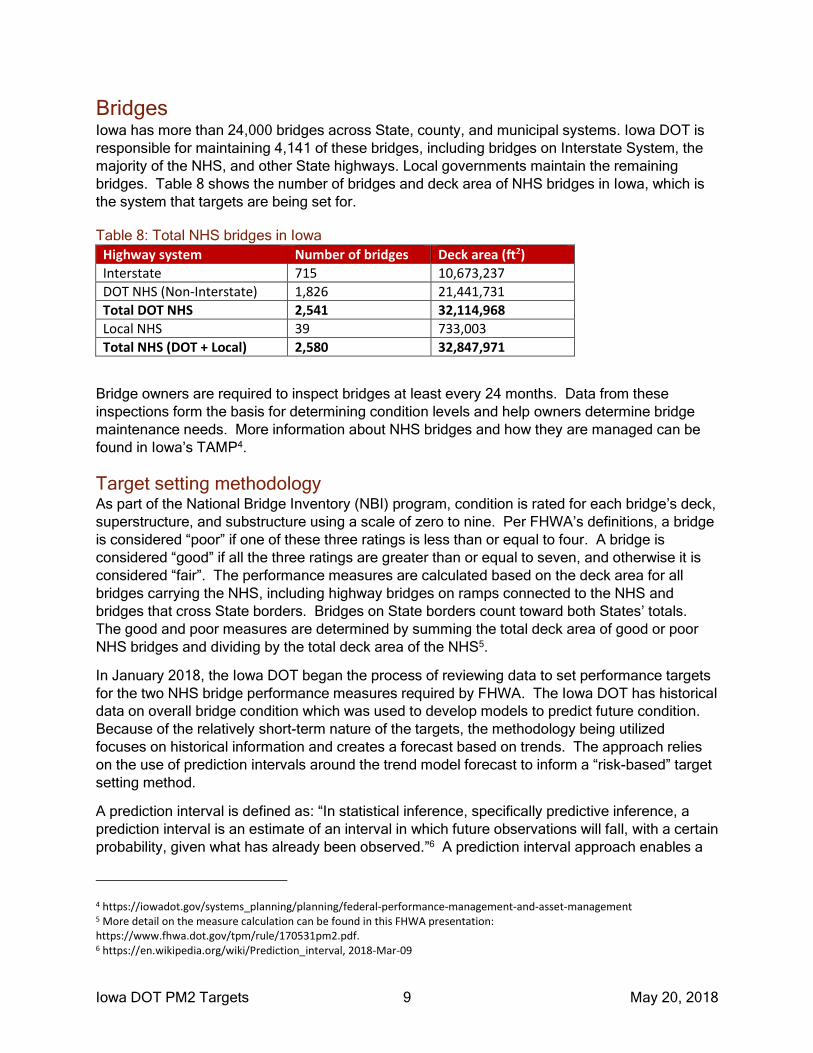
Bridges Iowa has more than 24,000 bridges across State, county, and municipal systems. Iowa DOT is
responsible for maintaining 4,141 of these bridges, including bridges on Interstate System, the
majority of the NHS, and other State highways. Local governments maintain the remaining
bridges. Table 8 shows the number of bridges and deck area of NHS bridges in Iowa, which is
the system that targets are being set for.
Table 8: Total NHS bridges in Iowa
Highway system Number of bridges Deck area (ft2)
Interstate 715 10,673,237
DOT NHS (Non-Interstate) 1,826 21,441,731
Total DOT NHS 2,541 32,114,968
Local NHS 39 733,003
Total NHS (DOT + Local) 2,580 32,847,971
Bridge owners are required to inspect bridges at least every 24 months. Data from these
inspections form the basis for determining condition levels and help owners determine bridge
maintenance needs. More information about NHS bridges and how they are managed can be
found in Iowa’s TAMP4.
Target setting methodology As part of the National Bridge Inventory (NBI) program, condition is rated for each bridge’s deck,
superstructure, and substructure using a scale of zero to nine. Per FHWA’s definitions, a bridge
is considered “poor” if one of these three ratings is less than or equal to four. A bridge is
considered “good” if all the three ratings are greater than or equal to seven, and otherwise it is
considered “fair”. The performance measures are calculated based on the deck area for all
bridges carrying the NHS, including highway bridges on ramps connected to the NHS and
bridges that cross State borders. Bridges on State borders count toward both States’ totals.
The good and poor measures are determined by summing the total deck area of good or poor
NHS bridges and dividing by the total deck area of the NHS5.
In January 2018, the Iowa DOT began the process of reviewing data to set performance targets
for the two NHS bridge performance measures required by FHWA. The Iowa DOT has historical
data on overall bridge condition which was used to develop models to predict future condition.
Because of the relatively short-term nature of the targets, the methodology being utilized
focuses on historical information and creates a forecast based on trends. The approach relies
on the use of prediction intervals around the trend model forecast to inform a “risk-based” target
setting method.
A prediction interval is defined as: “In statistical inference, specifically predictive inference, a
prediction interval is an estimate of an interval in which future observations will fall, with a certain
probability, given what has already been observed.”6 A prediction interval approach enables a
4 https://iowadot.gov/systems_planning/planning/federal-performance-management-and-asset-management 5 More detail on the measure calculation can be found in this FHWA presentation: https://www.fhwa.dot.gov/tpm/rule/170531pm2.pdf. 6 https://en.wikipedia.org/wiki/Prediction_interval, 2018-Mar-09
Iowa DOT PM2 Targets 10 May 20, 2018
focus on the acceptable risk of meeting, or failing to meet a target, which allows stakeholders at
all levels of the organization to understand the targets in better context. The bridge
management and PM2 working groups evaluated several prediction intervals and recommended
a prediction interval of 75%, meaning that there would be 75% confidence that the actual
percentage of the total bridge deck area in good condition would be higher than the targets and
the actual percentage of the total bridge area in poor condition would be lower than the targets.
For each category, a time-series model was developed. An integrated moving average (IMA)
model was used to predict the values for the next 5 years. The following pages show the
model’s output and predictions at various confidence levels for each measure. This helps
illustrate the level of risk associated with various confidence levels, as well as the fact that
higher confidence levels lead to more conservative targets. The NBI Bridge data used for this
analysis can be obtained from the following URL: https://www.fhwa.dot.gov/bridge/nbi/ascii.cfm.
Iowa DOT PM2 Targets 11 May 20, 2018
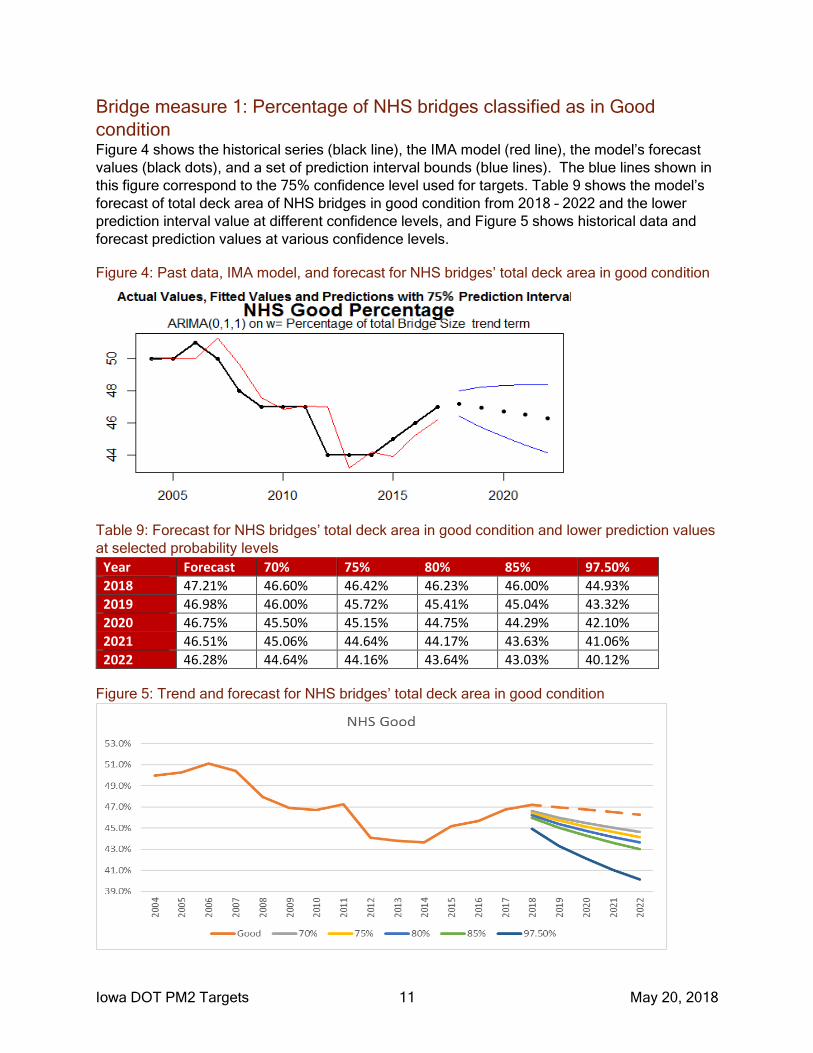
Bridge measure 1: Percentage of NHS bridges classified as in Good
condition Figure 4 shows the historical series (black line), the IMA model (red line), the model’s forecast
values (black dots), and a set of prediction interval bounds (blue lines). The blue lines shown in
this figure correspond to the 75% confidence level used for targets. Table 9 shows the model’s
forecast of total deck area of NHS bridges in good condition from 2018 – 2022 and the lower
prediction interval value at different confidence levels, and Figure 5 shows historical data and
forecast prediction values at various confidence levels.
Figure 4: Past data, IMA model, and forecast for NHS bridges’ total deck area in good condition
Table 9: Forecast for NHS bridges’ total deck area in good condition and lower prediction values
at selected probability levels
Year Forecast 70% 75% 80% 85% 97.50%
2018 47.21% 46.60% 46.42% 46.23% 46.00% 44.93%
2019 46.98% 46.00% 45.72% 45.41% 45.04% 43.32%
2020 46.75% 45.50% 45.15% 44.75% 44.29% 42.10%
2021 46.51% 45.06% 44.64% 44.17% 43.63% 41.06%
2022 46.28% 44.64% 44.16% 43.64% 43.03% 40.12%
Figure 5: Trend and forecast for NHS bridges’ total deck area in good condition
Iowa DOT PM2 Targets 12 May 20, 2018
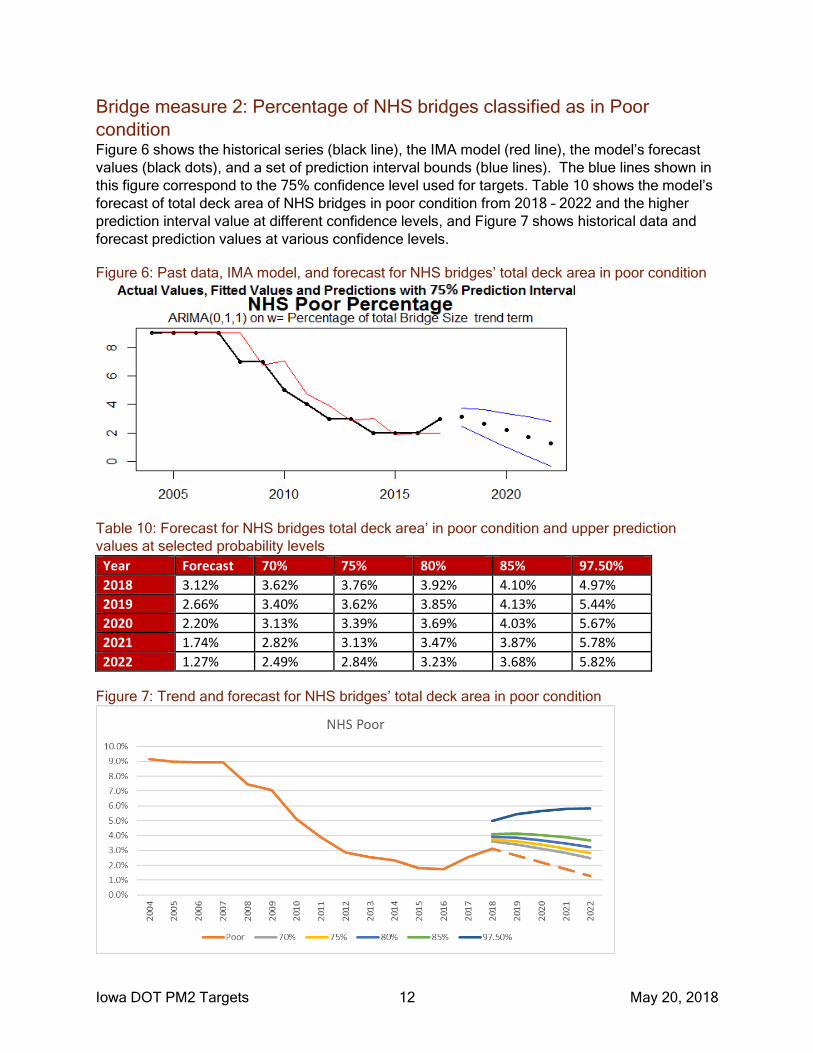
Bridge measure 2: Percentage of NHS bridges classified as in Poor
condition Figure 6 shows the historical series (black line), the IMA model (red line), the model’s forecast
values (black dots), and a set of prediction interval bounds (blue lines). The blue lines shown in
this figure correspond to the 75% confidence level used for targets. Table 10 shows the model’s
forecast of total deck area of NHS bridges in poor condition from 2018 – 2022 and the higher
prediction interval value at different confidence levels, and Figure 7 shows historical data and
forecast prediction values at various confidence levels.
Figure 6: Past data, IMA model, and forecast for NHS bridges’ total deck area in poor condition
Table 10: Forecast for NHS bridges total deck area’ in poor condition and upper prediction
values at selected probability levels
Year Forecast 70% 75% 80% 85% 97.50%
2018 3.12% 3.62% 3.76% 3.92% 4.10% 4.97%
2019 2.66% 3.40% 3.62% 3.85% 4.13% 5.44%
2020 2.20% 3.13% 3.39% 3.69% 4.03% 5.67%
2021 1.74% 2.82% 3.13% 3.47% 3.87% 5.78%
2022 1.27% 2.49% 2.84% 3.23% 3.68% 5.82%
Figure 7: Trend and forecast for NHS bridges’ total deck area in poor condition
Iowa DOT PM2 Targets 13 May 20, 2018
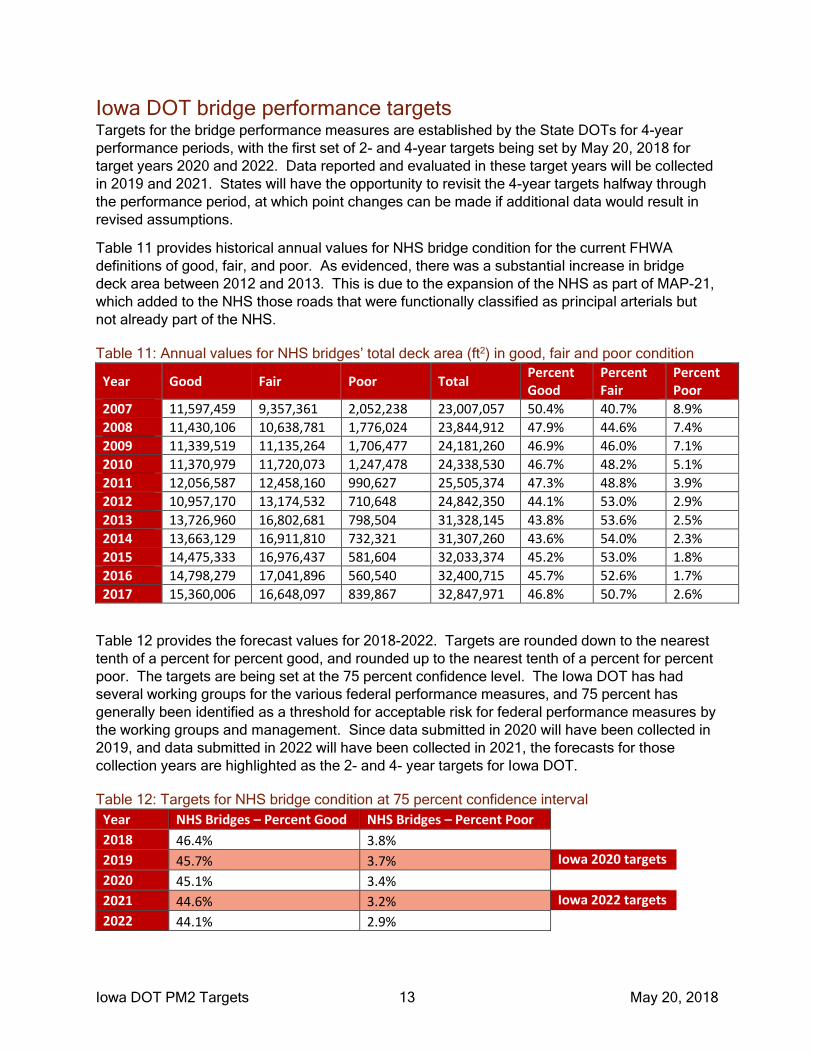
Iowa DOT bridge performance targets Targets for the bridge performance measures are established by the State DOTs for 4-year
performance periods, with the first set of 2- and 4-year targets being set by May 20, 2018 for
target years 2020 and 2022. Data reported and evaluated in these target years will be collected
in 2019 and 2021. States will have the opportunity to revisit the 4-year targets halfway through
the performance period, at which point changes can be made if additional data would result in
revised assumptions.
Table 11 provides historical annual values for NHS bridge condition for the current FHWA
definitions of good, fair, and poor. As evidenced, there was a substantial increase in bridge
deck area between 2012 and 2013. This is due to the expansion of the NHS as part of MAP-21,
which added to the NHS those roads that were functionally classified as principal arterials but
not already part of the NHS.
Table 11: Annual values for NHS bridges’ total deck area (ft2) in good, fair and poor condition
Year Good Fair Poor Total Percent Good
Percent Fair
Percent Poor
2007 11,597,459 9,357,361 2,052,238 23,007,057 50.4% 40.7% 8.9%
2008 11,430,106 10,638,781 1,776,024 23,844,912 47.9% 44.6% 7.4%
2009 11,339,519 11,135,264 1,706,477 24,181,260 46.9% 46.0% 7.1%
2010 11,370,979 11,720,073 1,247,478 24,338,530 46.7% 48.2% 5.1%
2011 12,056,587 12,458,160 990,627 25,505,374 47.3% 48.8% 3.9%
2012 10,957,170 13,174,532 710,648 24,842,350 44.1% 53.0% 2.9%
2013 13,726,960 16,802,681 798,504 31,328,145 43.8% 53.6% 2.5%
2014 13,663,129 16,911,810 732,321 31,307,260 43.6% 54.0% 2.3%
2015 14,475,333 16,976,437 581,604 32,033,374 45.2% 53.0% 1.8%
2016 14,798,279 17,041,896 560,540 32,400,715 45.7% 52.6% 1.7%
2017 15,360,006 16,648,097 839,867 32,847,971 46.8% 50.7% 2.6%
Table 12 provides the forecast values for 2018-2022. Targets are rounded down to the nearest
tenth of a percent for percent good, and rounded up to the nearest tenth of a percent for percent
poor. The targets are being set at the 75 percent confidence level. The Iowa DOT has had
several working groups for the various federal performance measures, and 75 percent has
generally been identified as a threshold for acceptable risk for federal performance measures by
the working groups and management. Since data submitted in 2020 will have been collected in
2019, and data submitted in 2022 will have been collected in 2021, the forecasts for those
collection years are highlighted as the 2- and 4- year targets for Iowa DOT.
Table 12: Targets for NHS bridge condition at 75 percent confidence interval
Year NHS Bridges – Percent Good NHS Bridges – Percent Poor
2018 46.4% 3.8%
2019 45.7% 3.7% Iowa 2020 targets
2020 45.1% 3.4%
2021 44.6% 3.2% Iowa 2022 targets
2022 44.1% 2.9%
Iowa DOT PM2 Targets 14 May 20, 2018
It is important to note that these targets are based on FHWA definitions of good and poor, which
have been nationally defined to achieve a standard measurement across States. These
definitions of good and poor may not be the same as other bridge condition metrics the Iowa
DOT uses to evaluate system condition, and may not be the best indicator of what a typical
traveler considers to be good or poor bridge condition.
Minimum level for condition of NHS bridges In addition to requiring performance targets, MAP-21 also set a minimum condition level for NHS
bridges. Per 23 CFR 490.411, States are required to maintain NHS bridges so that the
percentage of the deck area of bridges classified as structurally deficient (also referred to as
“poor” for the performance measures and targets) does not exceed 10.0 percent. FHWA
annually determines whether a State exceeds this threshold. If, for three consecutive years, a
State’s percentage of NHS bridge deck area in poor condition exceeds 10.0 percent, in the
following year the State will be subject to funding penalties that require a certain amount of
NHPP funding to be used for eligible bridge projects on the NHS. The percentage of Iowa’s
NHS bridges in poor condition is currently below the 10.0 percent threshold, and is forecast to
remain below that threshold through the first performance period.