Embed Size (px)
Citation preview
G. J. Hanson R. A. Lohnes F. W. Klaiber
Final Report on Phases I1 and 1x1
Emluation sf Control Structures for Stablilizing Degrading Stream Channels in Wstern Ism
July 1985
Iowa DOT HR-208A Project 1502
ISU-ERI-Ames-86050
Sponsored by the Iowa Department of Transportation. Highway Division. and the Iowa Highway Research Board I
College - sf Engineering
Iowa State University
The opinions, findings, and conclusions expressed in this publication are those of the authors and not necessarily those of
the Highway Division of the Iowa Department of Transportation.
Final Report on Phases 11 and 111
Evaluation of Control Stmctu~es box StabUizing Deg~ading Stream Channels in Wesft~~en Zom
July 1985
Submitted to the Highway Division of the Iowa Department of Transportation and the Iowa Highway Research Board
Iowa DOT HR-208A DEPARTMENT OF CmE ENGINEERING
Project 1502 ENGINEERING RESEARCH INSTITUTE ISU-ERI-limes-86050 IOWA STATE UNmRSIn, A.MES, IOWA 50011
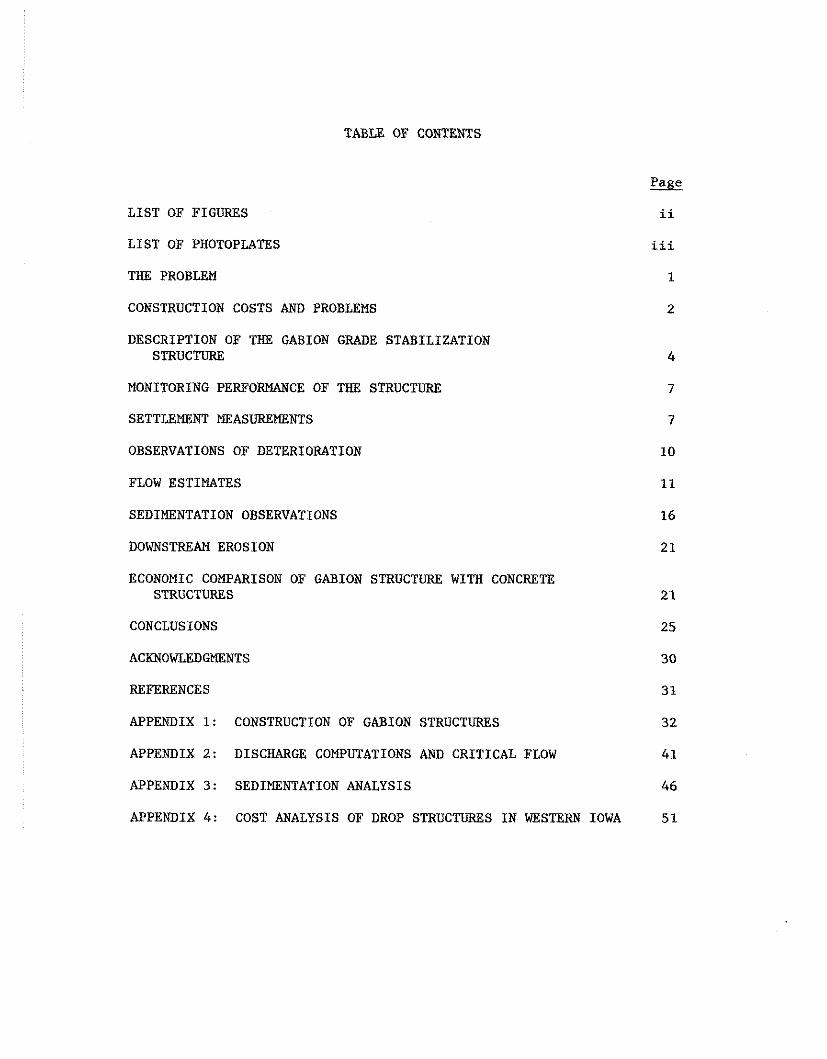
TABLE OF CONTENTS
LIST OF FIGURES
LIST OF PHOTOPLATES
THE PROBLEM
CONSTRUCTION COSTS AND PROBLEMS
DESCRIPTION OF THE GABION GRADE STABILIZATION STRUCTURE
MONITORING PERFORMANCE OF THE STRUCTURE
SETTLEMENT MEASUREMENTS
OBSERVATIONS OF DETERIORATION
FLOW ESTIMATES
SEDIMENTATION OBSERVATIONS
DOWNSTREAM EROSION
ECONOMIC COMPARISON OF GABION STRUCTURE WITH CONCRETE STRUCTURES
CONCLUSIONS
ACKNOWLEDGMENTS
REFERENCES
APPENDIX 1: CONSTRUCTION OF GABION STRUCTURES
APPENDIX 2: DISCHARGE COMPUTATIONS AND CRITICAL FLOW
APPENDIX 3: SEDIMENTATION ANALYSIS
APPENDIX 4 : COST ANALYSIS OF DROP STRUCTURES IN WESTERN IOWA
ii
iii
1
2

i i
LIST OF FIGURES
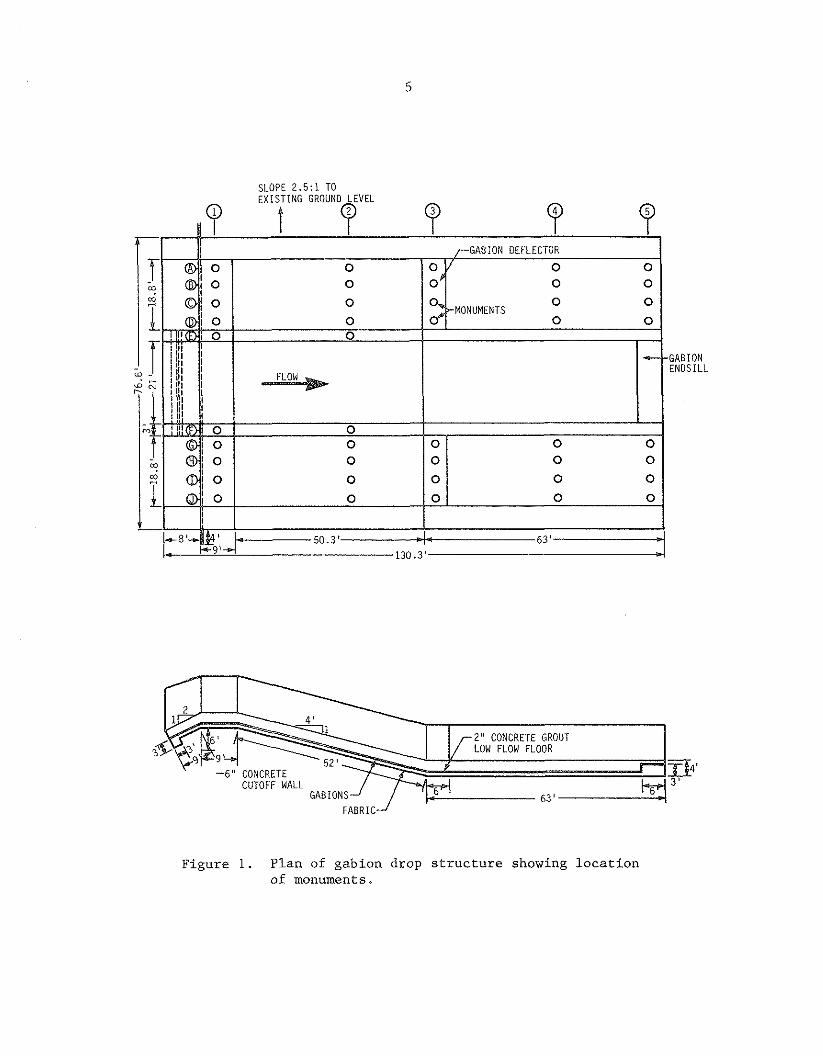
1. Plan of gabion drop structure showing location of monuments.
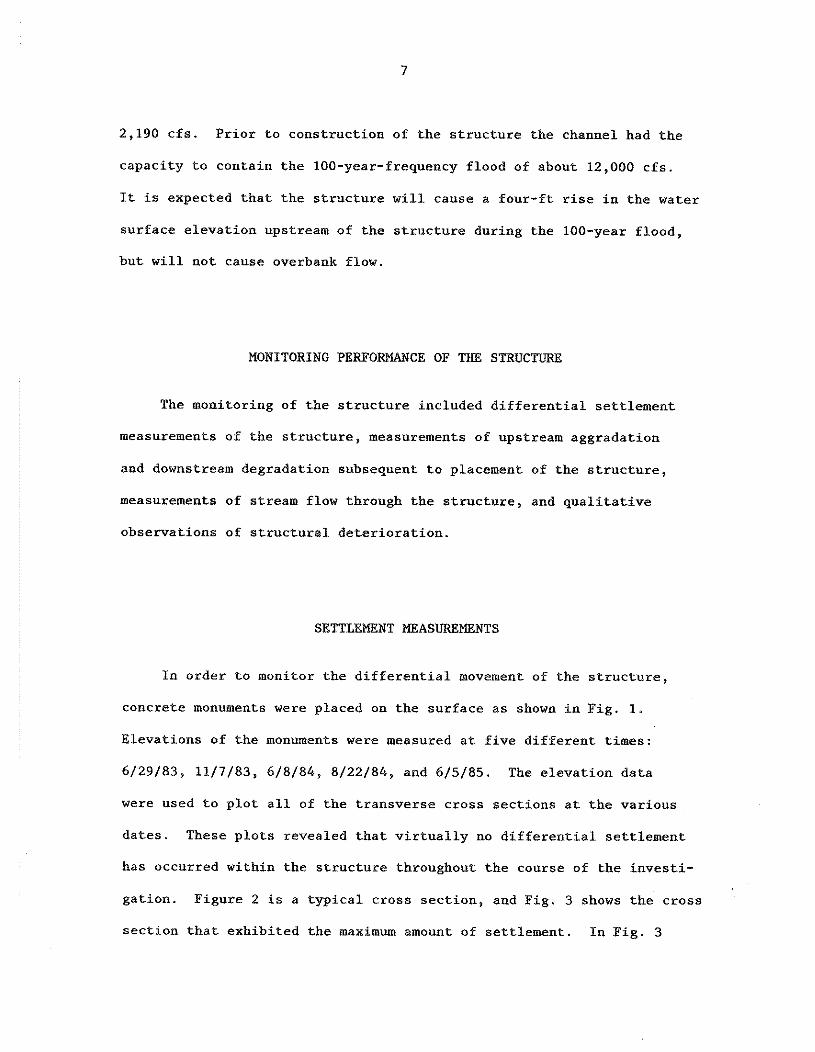
2. Cross section at top of structure. Note differential movement at monument A. This is the only measurable movement observed in the structure.
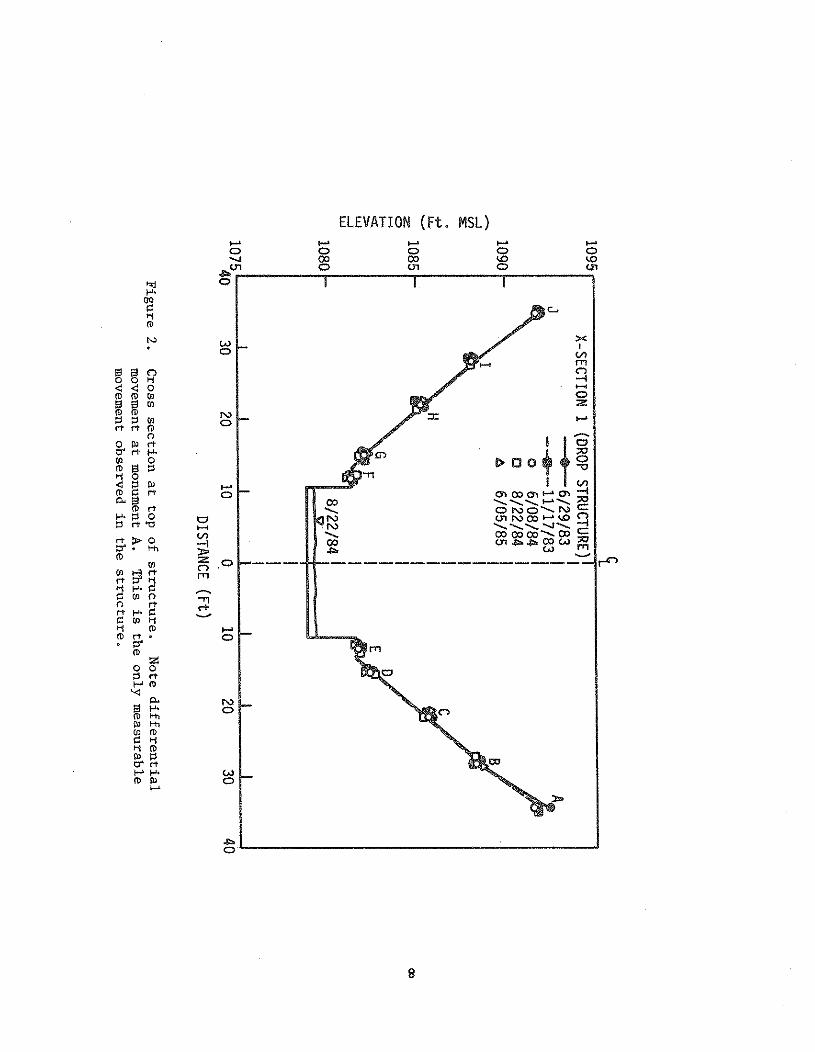
3. Cross section at about middle of structure. Virtually no differential movement is observed, which is typical of all five cross sections.
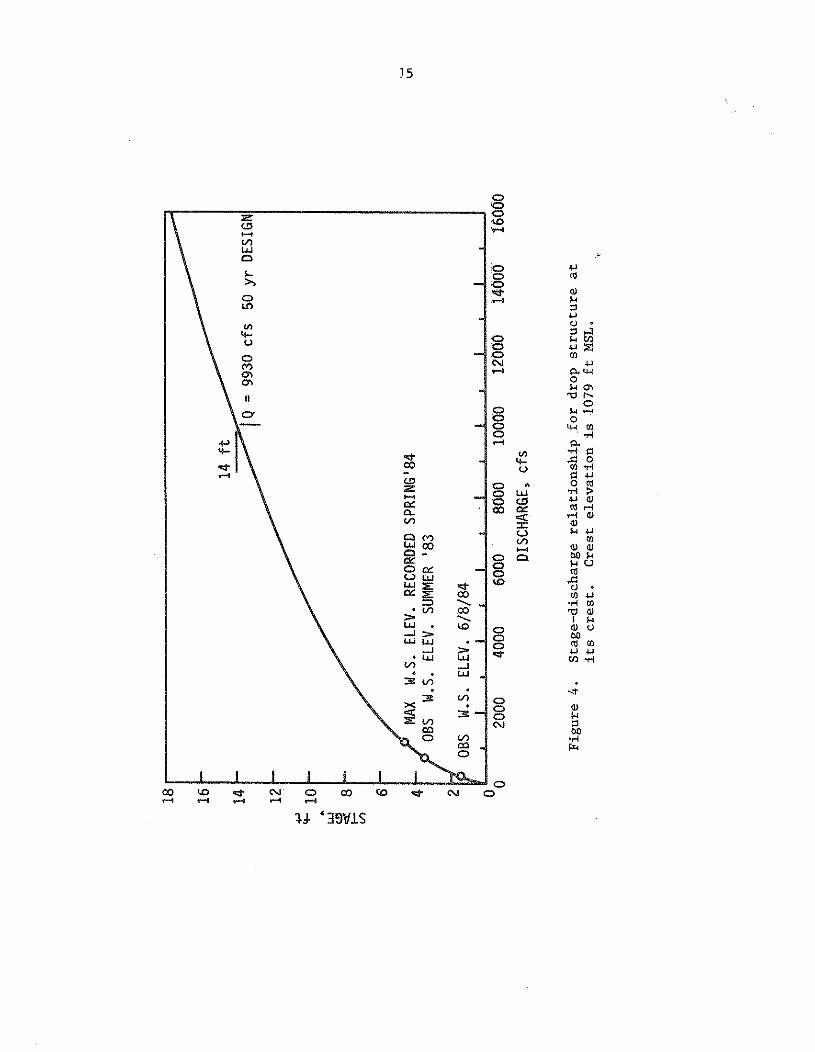
4. Stage-discharge relationship for drop structure at its crest. Crest elevation is 1079 ft MSL.
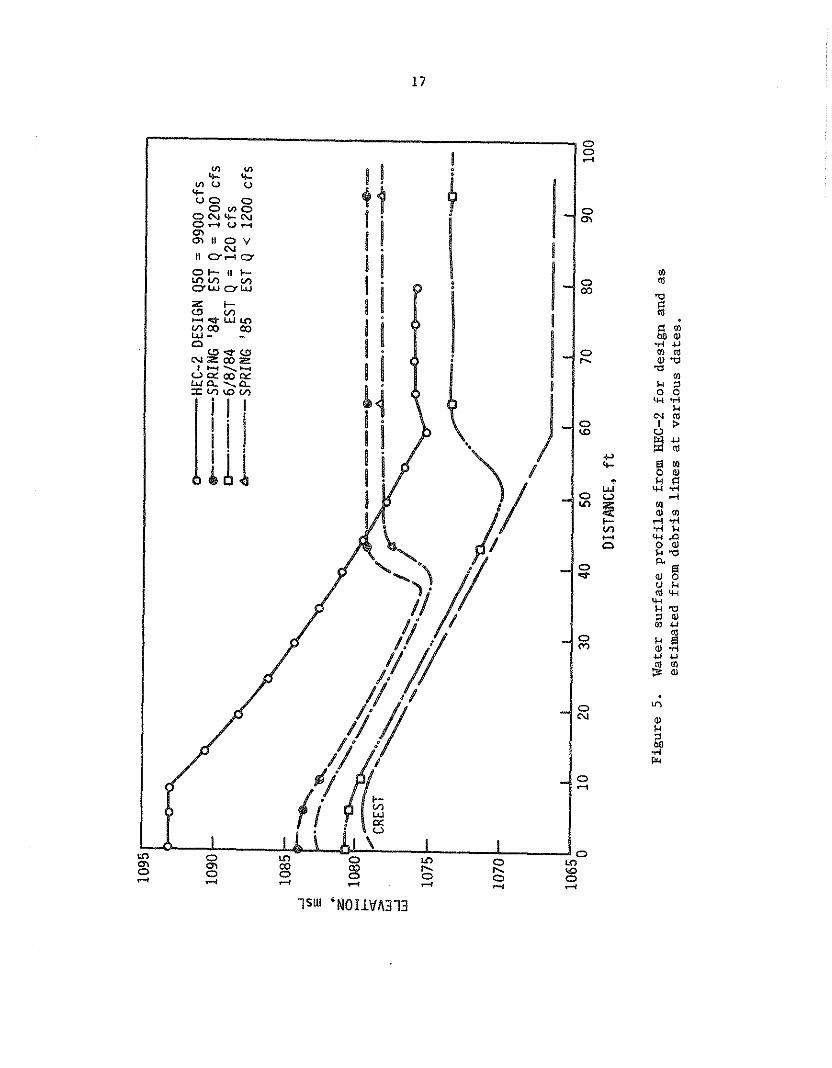
5. Water surface profiles from HEC-2 for design and as estimated from debris lines at various dates.
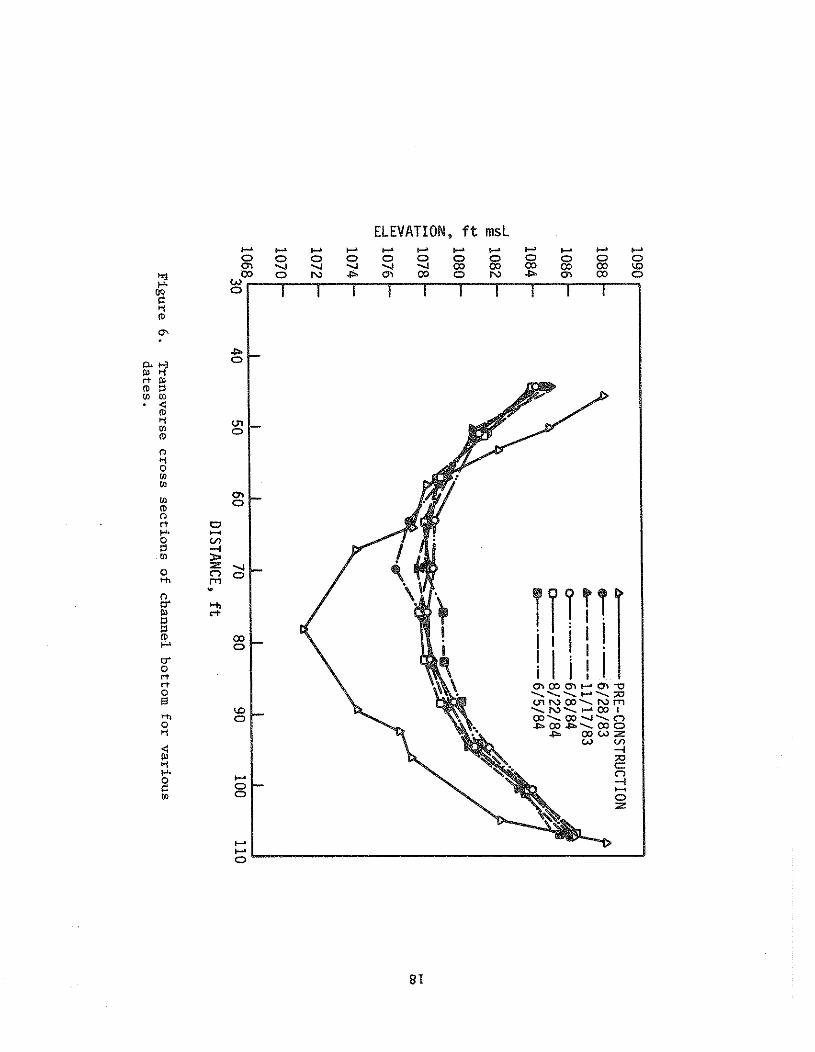
6. Transverse cross sections of channel bottom for various dates.
7. Longitudinal profile of channel bottom and water surface in pool upstream of structure.
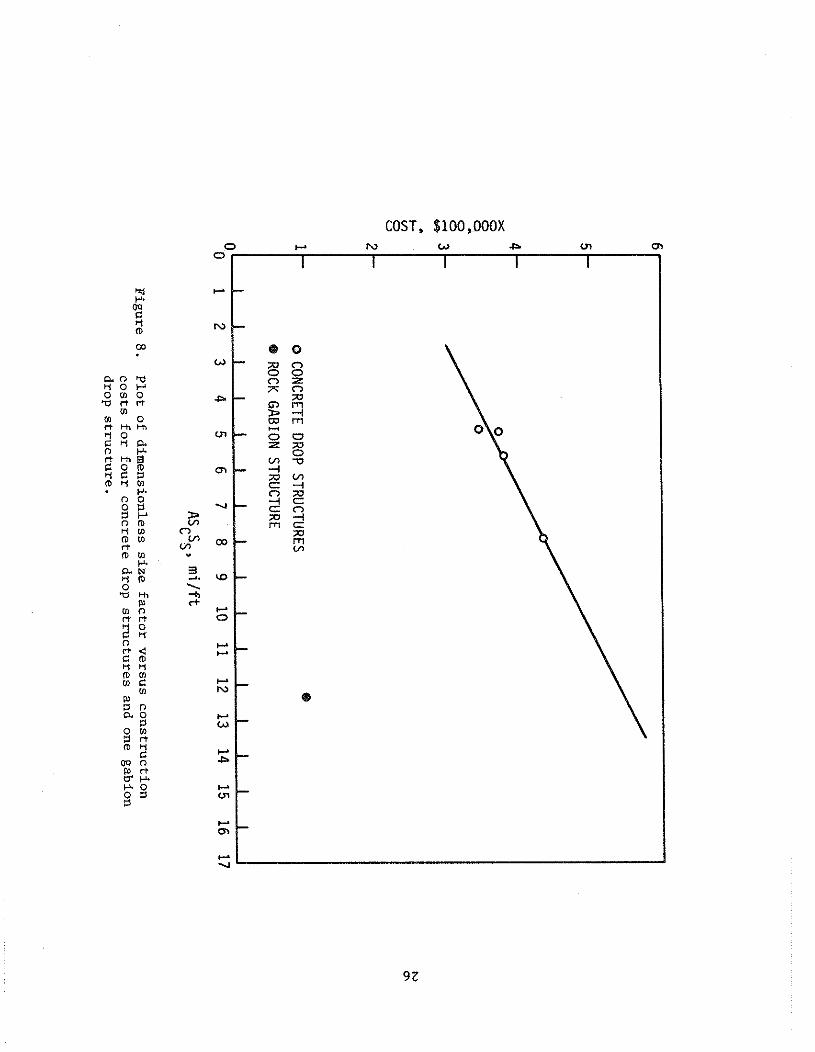
8. Plot of dimensionless size factor versus construction costs for four concrete drop structures and one gabion drop structure.
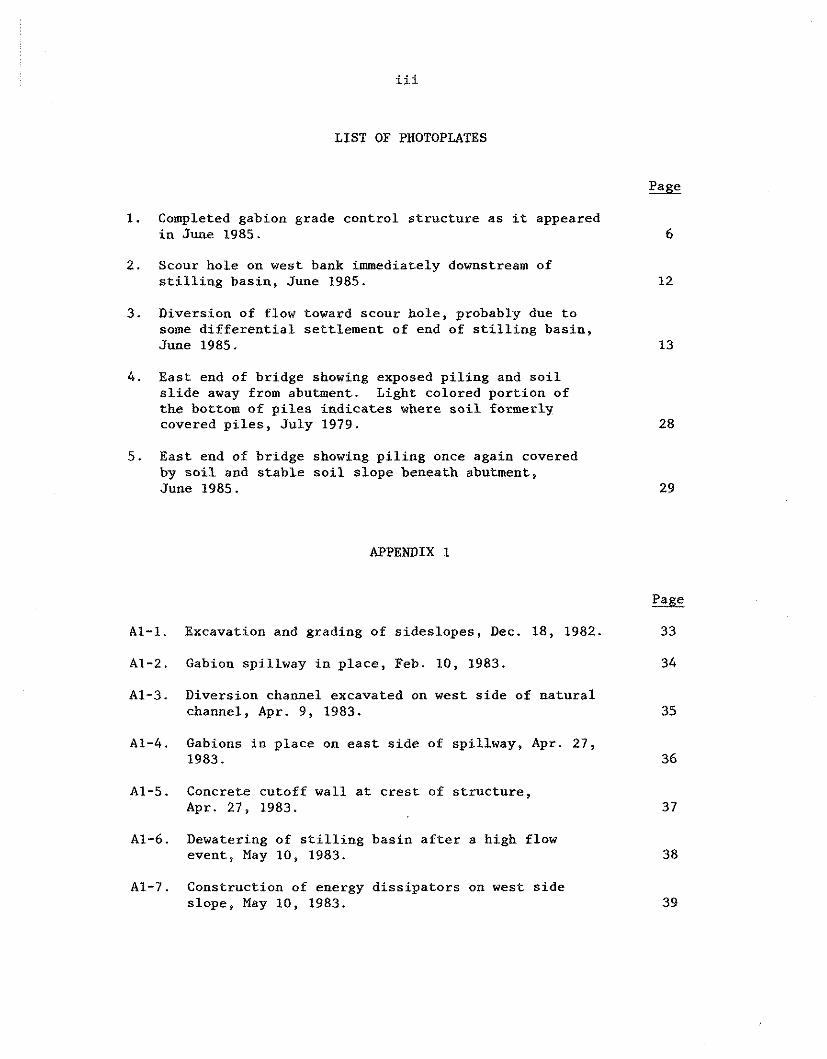
LIST OF PHOTOPLATES
Page
1. Completed gabion grade control structure as it appeared in June 1985. 6
2. Scour hole on west bank immediately downstream of stilling basin, June 1985.
3. Diversion of flow toward scour hole, probably due to some differential settlement of end of stilling basin, June 1985. 13
4 . East end of bridge showing exposed piling and soil slide away from abutment. Light colored portion of the bottom of piles indicates where soil formerly covered piles, July 1979.
5. East end of bridge showing piling once again covered by soil and stable soil slope beneath abutment, June 1985.
APPENDIX 1
1 . Excavation and grading of sideslopes, Dec. 18, 1982. 33
A1-2. Gabion spillway in place, Feb. 10, 1983. 34
A1-3. Diversion channel excavated on west side of natural channel, Apr. 9, 1983. 35
A1-4. Gabions in place on east side of spillway, Apr. 27, 1983. 36
A1-5. Concrete cutoff wall at crest of structure, Apr. 27, 1983.
A1-6. Dewatering of stilling basin after a high flow event, May 10, 1983.
A1-7. Construction of energy dissipators on west side slope, May 10, 1983. 39
A1-8 . Main channel flow through the structure. At this time, only work remaining is grading above side slopes, May 18, 1983.
Page
40
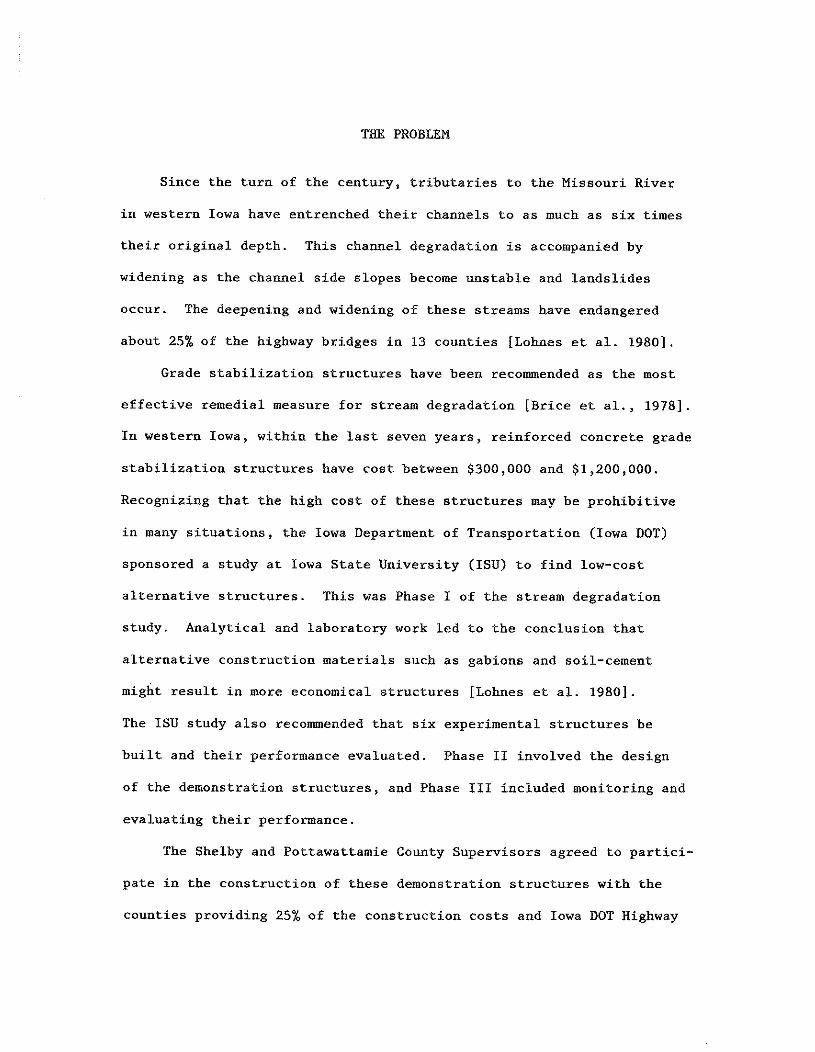
THE PROBLEM
Since the turn of the century, tributaries to the Missouri River
in western Iowa have entrenched their channels to as much as six times
their original depth. This c h a ~ e l degradation is accompanied by
widening as the channel side slopes become unstable and landslides
occur. The deepening and widening of these streams have endangered
about 25% of the highway bridges in 13 counties [Lohnes et al. 19801.
Grade stabilization structures have been recommended as the most
effective remedial measure for stream degradation [Brice et al., 19781.
In western Iowa, within the last seven years, reinforced concrete grade
stabilization structures have cost between $300,000 and $1,200,000.
Recognizing that the high cost of these structures may be prohibitive
in many situations, the Iowa Department of Transportation (Iowa DOT)
sponsored a study at Iowa State University (ISU) to find low-cost
alternative structures. This was Phase I of the stream degradation
study. Analytical and laboratory work led to the conclusion that
alternative construction materials such as gabions and soil-cement
might result in more economical structures [Lohnes et al. 19801.
The ISU study also recommended that six experimental structures be
built and their performance evaluated. Phase I1 involved the design
of the demonstration structures, and Phase I11 included monitoring and
evaluating their performance.
The Shelby and Pottawattamie County Supervisors agreed to partici-
pate in the construction of these demonstration structures with the
counties providing 25% of the construction costs and Iowa DOT Highway
Research Board providing 50%. It was expected that the remaining 25%
would come from a third agency that would have some interest in the
results of a full-scale field experiment. Because the agricultural
sector would benefit from stream channel stabilization, attempts were
made by the ISU research team to obtain funding from various agencies
within the U.S. Department of Agriculture. These attempts to obtain
the final funding increment were unsuccessful; however, the Iowa State
Water Resources Research Institute (ISWRRI) provided sufficient funds
for 25% of two structures, one in Shelby County and the other in
Pottawattamie County.
CONSTRUCTION COSTS AND PROBLEMS
Plans were developed for a soil-cement structure in Shelby County
and a gabion structure in Pottawattamie County. The original cost
estimate of the Shelby County structure was about $60,000; however,
the final cost estimate doubled because of problems anticipated with
the excavation of the stilling basin. In spite of the large increase
in the estimated cost, no bids were received at the scheduled March
1982 letting. The construction money allocated to this project
reverted to ISWRRI and was reallocated to other projects within the
Institute.
Although the laboratory studies at ISU suggest that soil-cement
is a feasible construction material for grade stabilization structures
[Litton and Lohnes 19821, the absence of any contractor willing to bid
on the project indicates that a major practical problem exists with
the use of soil-cement in this type of structure. The problem may be
associated with conditions at this specific site or with the lack of
contractor experience in constructing soil-cement water control struc-
tures. Another possibility is that the contractors did not accept the
results of the lab studies and needed evidence of the field performance
of such structures. If lack of construction experience is the reason
for no bids, then specifications outlining construction procedures
need to be developed. If the third reason is the primary cause for
the lack of bids on the Shelby County structure, field scale research
needs to be conducted to support or reject the validity of the labora-
tory work. It is the Shelby county engineer's opinion that lack of
contractor experience in mixing and placing soil-cement is the major
problem; in addition, the practical construction problems may drive
the cost of the structure so high they will offset any savings in
material cost [Eldo Schornhorst, personal communication, Nov. 7, 19841.
The Potawattamie County gabion structure was originally estimated
at a cost of $60,000; but after detailed design and modifications sug-
gested by the county engineer, the cost estimate increased to $85,000.
Bid letting was September 16, 1982, when with three bids were received;
the lowest was $97,000. The required additional funds were provided
by the county supervisors, and construction began November 29. The
photographs in Appendix 1 provide documentation of the construction's
progress. Except for four weeks during January, construction continued
through the winter. Although several problems were encountered during
construction, the contractor was able to get water through the structure
by May 16. The structure was completed by June 30, 1983 at a final cost
of $108,000. The cost overrun was due largely to construction problems.
A comparative cost analysis of this gabion structure with reinforced
concrete structures follows in this report.
DESCRIPTION OF THE GABION GRADE STABILIZATION STRUCTURE
The demonstration grade stabilization structure is located on
Keg Creek, three miles east of McClelland at Sec 1-75-42. The drop
structure is situated 100 ft downstream from a bridge where, since
1958, 14 ft of channel degradation had exposed bridge piers and caused
landslides that removed soil from the east abutment. The drainage
area of Keg Creek at this location is approximately 90 sq mi. Prior to
construction, the stream gradient was from 6 to 8 ft/mi with a channel
width of about 50 ft at top.
The structure consists of a gabion weir and ramp with a net drop
of 12.6 ft, which is intended to reduce the effects of the degradation
at the bridge site. Fig. 1 shows the plan and profile of the structure.
The bottom width of the weir and ramp is 21 ft with 2:l side slopes
extending 27 ft upward. The ramp is 51 ft long with a 4:l downstream
slope. The stilling basin has a length of 63 ft. Photoplate 1 is a
photograph of the structure as it appeared in Summer 1985.
The structure was designed for the 50-year-frequency flood of
9,930 cfs to contain the hydraulic jump and avoid overbank flooding.
As a point of comparison, the two-year-frequency flood is estimated at
SLOPE 2.5:) TO E X I S T I N G GROUND LEVEL
LOW FLOW FLOOR
-6" CONCRETE CUTOFF WALL 3 '
Figure 1. Plan of gabion drop structure showing location of monuments.
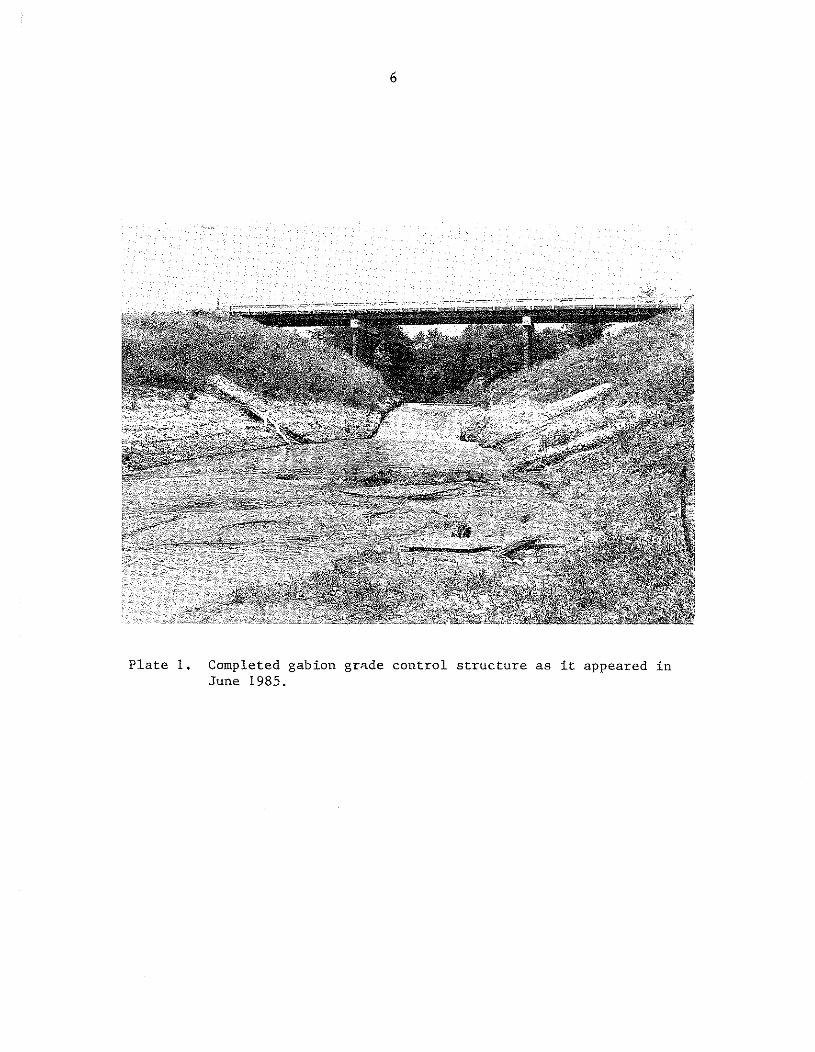
Plate 1. Completed gabion grade control structure as it appeared in June 1985.
2,190 cfs. Prior to construction of the structure the channel had the
capacity to contain the 100-year-frequency flood of about 12,000 cfs.
It is expected that the structure will cause a four-ft rise in the water
surface elevation upstream of the structure during the 100-year flood,
but will not cause overbank flow.
MONITORING PERFORMANCE OF THE STRUCTURE
The monitoring of the structure included differential settlement
measurements of the structure, measurements of upstream aggradation
and downstream degradation subsequent to placement of the structure,
measurements of stream flow through the structure, and qualitative
observations of structural deterioration.
SETTLEMENT MEASUREMENTS
In order to monitor the differential movement of the structure,
concrete monuments were placed on the surface as shown in Fig. 1.
Elevations of the monuments were measured at five different times:
6/29/83, 11/7/83, 6/8/84, 8/22/84, and 6/5/85. The elevation data
were used to plot all of the transverse cross sections at the various
dates. These plots revealed that virtually no differential settlement
has occurred within the structure throughout the course of the investi-
gation. Figure 2 is a typical cross section, and Fig. 3 shows the cross
section that exhibited the maximum amount of settlement. In Fig. 3
DISTANCE (F
t)
Figure 2.
Cross section at
top of
structure. Note
differential movement
at monument
A. This is the only m
easurable
movement observed
in t
he structure.
the monument 1A, at the top of the sideslope immediately downstream
from the crest, settled about four inches between the first two obser-
vation dates. No differential movement has been observed since 11/7/83;
thus, it has been concluded that differential settlement is not a problem.
Because soil consolidation occurs most rapidly soon after loading, it
appears settlement will not be a problem.
OBSERVATIONS OF DETERIORATION
Minor deterioration of the structure is being observed visually
and has been recorded on photographs. Some deformation of the side
slope is apparent in the vicinity of monuments 20 and 2E, but this
movement occurred during construction after a very high runoff event.
Because runoff had filled the channel, the contractor, in an effort
to dewater the site and resume work quickly, pumped the water out of
the channel in a very short time. It is interpreted that this rapid
drawdown condition created instability and caused slippage. A rapid
drawdown condition is not likely to occur during normal operation of
the structure; consequently, the side slopes are expected to be stable
in the future. The stability of the side slopes is verified by the
constant elevations of the monuments. Although the observed slope
deformation is not of great concern, anchors were placed on the slope
as a precaution.
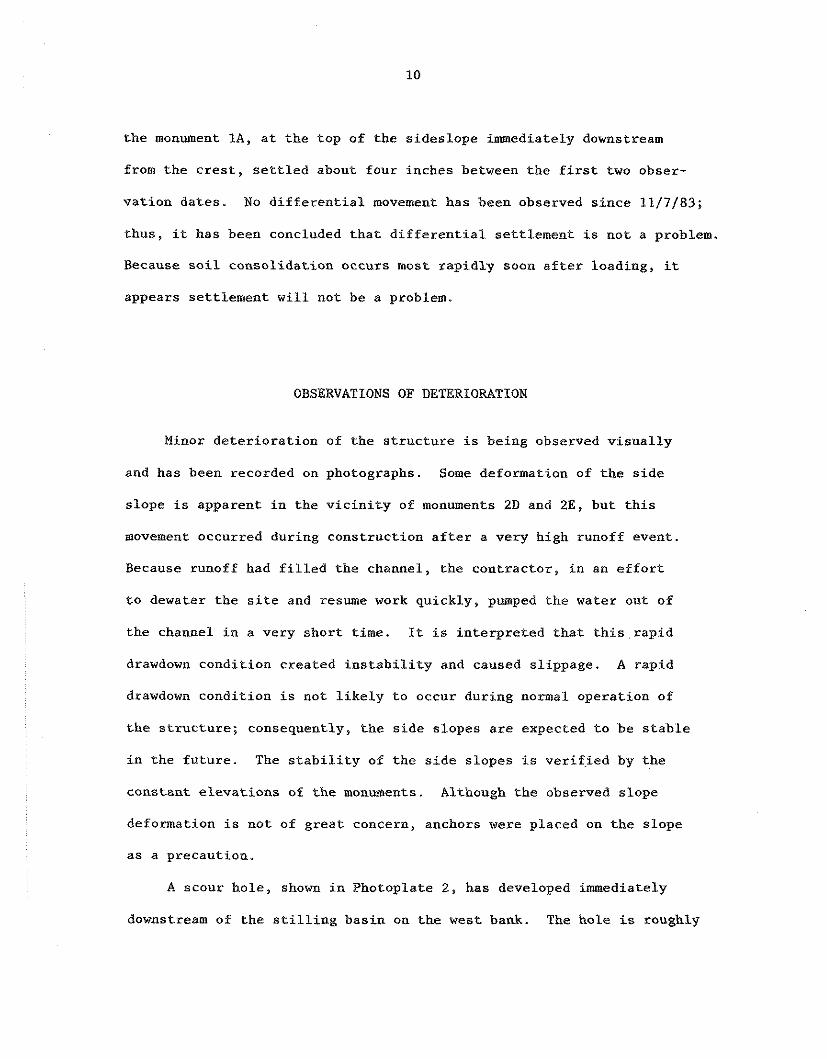
A scour hole, shown in Photoplate 2, has developed immediately
downstream of the stilling basin on the west bank. The hole is roughly
ten ft long parallel to the channel and extends about three ft into the
bank. This area is where the construction diversion channel was located,
and the backfill in this area may have been improperly compacted.
This area should be continuously observed for any expansion of the
scour hole. If erosion proceeds in the upstream direction, it may
undermine the side slope and stilling basin. If the hole expands, it
should be protected with riprap or additional gabions.
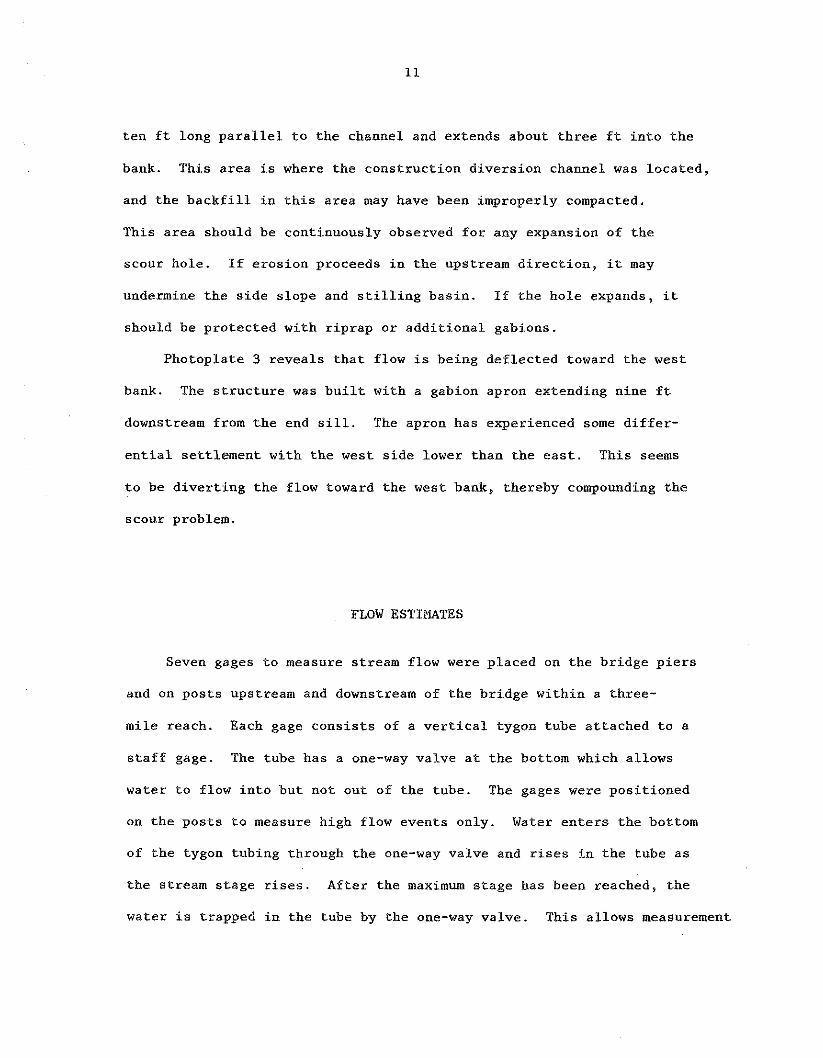
Photoplate 3 reveals that flow is being deflected toward the west
bank. The structure was built with a gabion apron extending nine ft
downstream from the end sill. The apron has experienced some differ-
ential settlement with the west side lower than the east. This seems
to be diverting the flow toward the west bank, thereby compounding the
scour problem.
FLOW ESTIMATES
Seven gages to measure stream flow were placed on the bridge piers
and on posts upstream and downstream of the bridge within a three-
mile reach. Each gage consists of a vertical tygon tube attached to a
staff gage. The tube has a one-way valve at the bottom which allows
water to flow into but not out of the tube. The gages were positioned
on the posts to measure high flow events only. Water enters the bottom
of the tygon tubing through the one-way valve and rises in the tube as
the stream stage rises. After the maximum stage has been reached, the
water is trapped in the tube by the one-way valve. This allows measurement
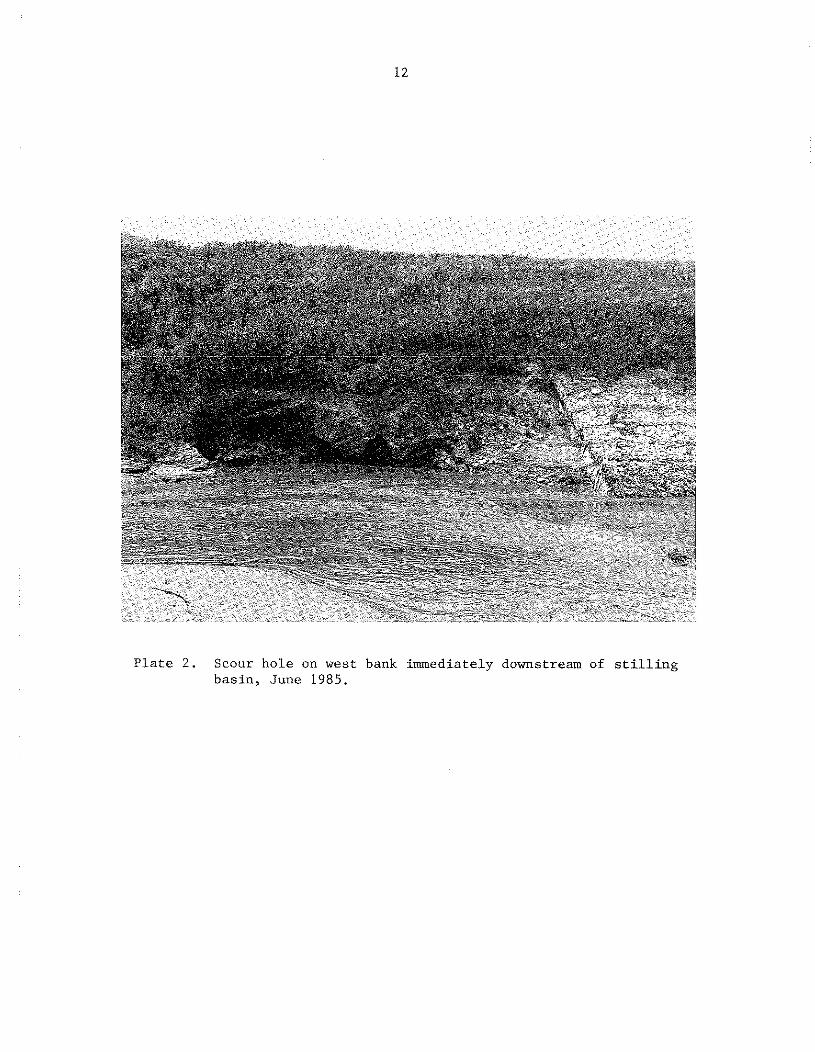
Plate 2. Scour hole on west bank immediately downstream of stilling basin, June 1985.
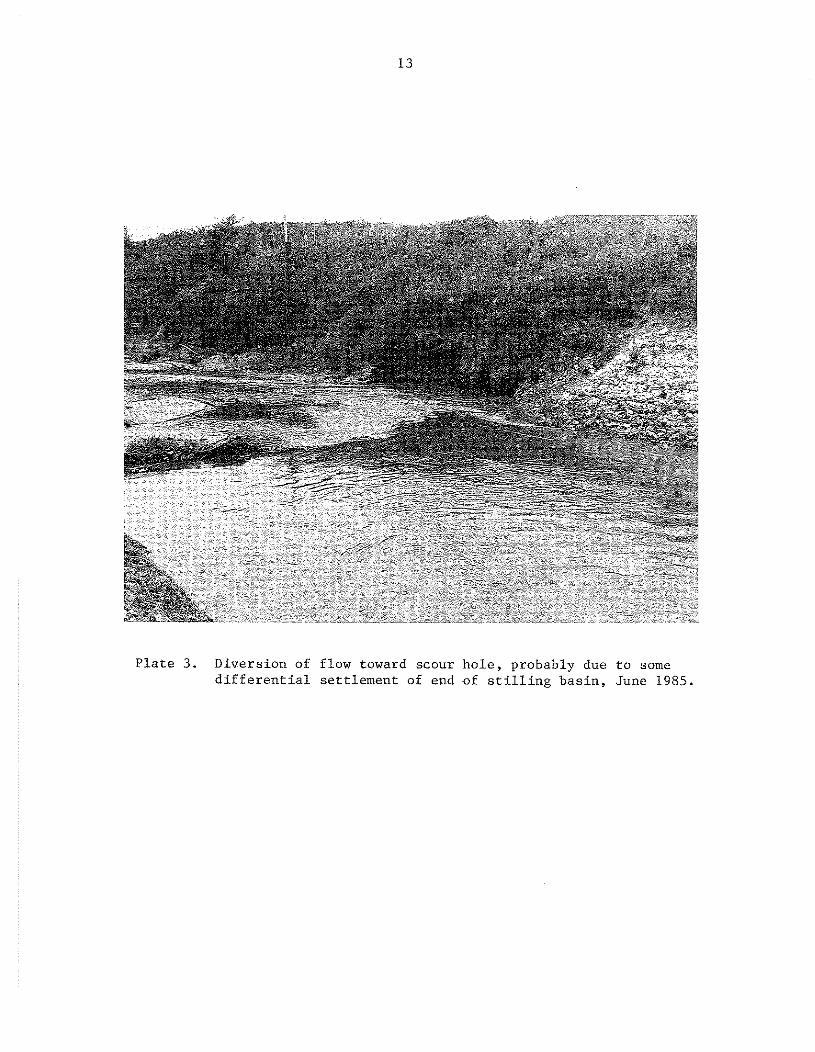
Plate 3. Diversion of flow toward scour hole, probably due to some differential settlement of end of stilling basin, June 1955.
of the maximum stage from the staff gage attached to the tube. The
gages have not functioned as well as anticipated. Debris has plugged
the one-way valves; consequently, no data were collected from the gages.
For future applications of these gages, an attempt should be made to
design some type of debris trap on the intake end of the system.
Because the gages failed to perform adequately, an alternate method
of estimating flows was devised. The spillway structure produces
critical flow at its crest and therefore acts as a control in the stream
channel. Controls are defined as certain features in a channel that
tend to produce critical flow [Henderson, 19661. At any feature
which acts as a control, the discharge can be calculated if the flow
depth is known by using the following relationship:
where Q is the discharge flowing through the crest of the spillway in
cfs, A is the area of the wetted section in sq ft, B is the corresponding
width of the water surface in ft, and g is the acceleration due to
2 gravity (32.2 ft/sec ) . The geometry of the spillway crest of the
gabion grade control structure was used to calculate the discharge
for various depths of flow from the previous equation; that relation-
ship is shown graphically in Fig. 4 . Details of the calculation are
in Appendix 2. Note that for the 50-year flood frequency with a dis-
charge of 9,930 cfs, the depth of flow through the structure is 14 ft.
For the design of this structure the KEC-2 backwater calculation program
STAGE, ft
P. rn rt n m er
(19 n m ti I m a m P. n m . n 7 er
0 ti ti (19 m m m rt rl
0 m r i--1 P) m n 2 g rt D G 3 D P. u
w ra m 0
-ti 0 v a wti 0
mu rt
m i5 z !" E

was used, and it estimated the flow depth at 13.5. The data shown in
Fig. 4 give good agreement with the design estimates.
Debris deposited on the sidewalls of the structure during a flood
event are physical evidence of the maximum stage for that event.. The
elevations of the debris lines were measured during Summer 1983, Spring
1984, on 6/8/84, and on 6/5/85. These depths of flow are plotted on
Fig. 4, and indicate that, to date, the flows have been well below the
design flood with discharges less than 1,200 cfs.
The water surface profile for the design flow of 9,900 cfs was
estimated using the HEC-2 program. The design water surface profile
and the water surface profiles for 120 and 1,200 cfs discharges, which
were estimated from the debris lines, are shown in Fig. 5. These curves
suggest that the downstream effects of the structure and stream force
the hydraulic jump upstream onto the spillway to create a submerged
jump.
SEDIMENTATION OBSERVATIONS
Changes in the upstream channel geometry caused by sedimentation
have been monitored by surveying transverse profiles at the bridge and
at 5 0 0 - f t intervals upstream to a distance of 5,000 ft. Transverse
profiles at the bridge were measured on 11/12/83, 6/28/83, 6/8/84,
8/22/84, and 6/5/85. A set of transverse profiles is shown in Fig. 6.
These sections show that sedimentation to a depth of 6 it had occurred
prior to 6/28/83, but little change has been noticed since that date.
-HEC
-2 DESIGN 9
50 =
990
0 c
fs
.$+.-----
*-.-
SPRING '84
EST Q
= 12
00 c
fs
6"
---
--..- 6/8/84
EST Q
= 12
0 c
fs
SPRING '85
EST Q
< 12
00 c
fs
C
.J
DISTAMCE,
ft
Figure 5.
Wate
r surface pro
file
s from HEC-2 fo
r design and as
esti
mate
d from debris l
ines at
vari
ous
dates.
ELEVATION, f t msL C , - C I I t - C C C C C C 0 m%.,s3?~3~ggwo 0 " " $ 5 : W O N
This indicates that the major amount of sedimentation above the crest
occurred during construction and that the 1,200 cfs event since
construction has had little effect on deposition.
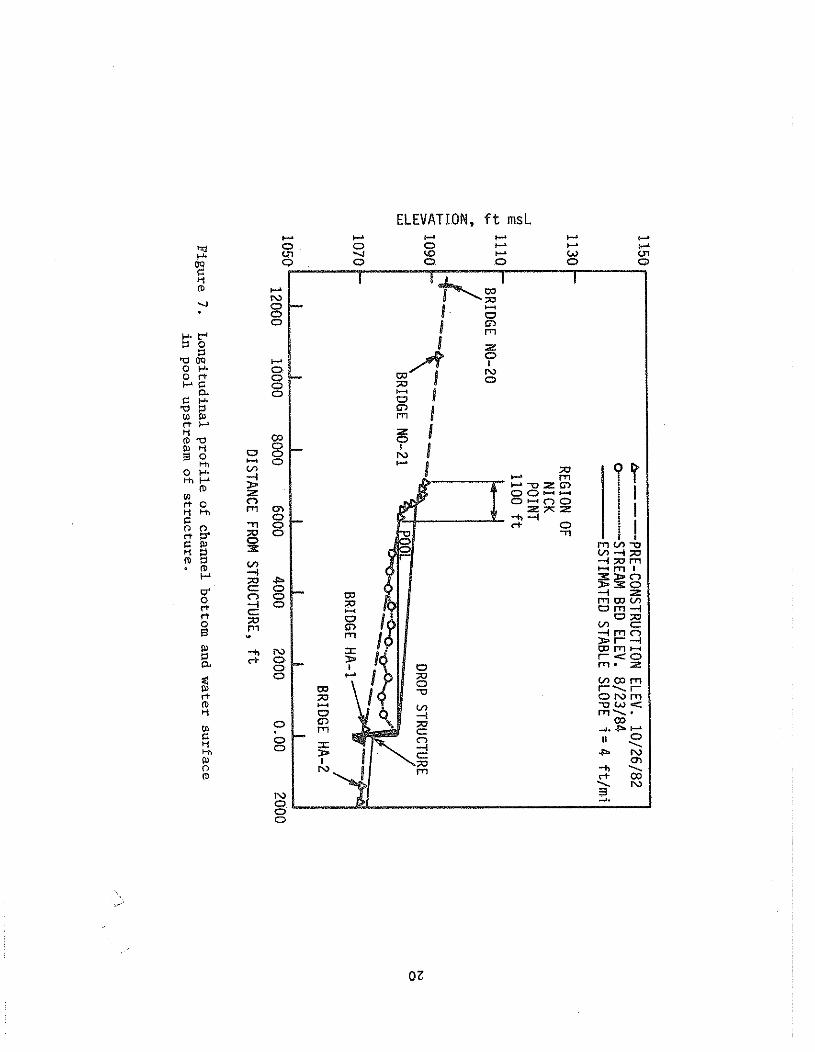
A longitudinal profile surveyed on 8 / 2 3 / 8 4 is shown in Fig. 7.
The water surface extends upstream from the crest of the structure to
a distance of 5,500 ft upstream, and the sediment surface extends
approximately 4,000 ft upstream from the structure. It is expected
that this sediment will extend further upstream in the future. A con-
servative estimate is that it will continue to the point where the
water surface profile intersects the stream bed profile, i.e., about
5,500 ft.
A less conservative estimate of the ultimate upstream extent of
the sediment is calculated from the method suggested by Maccaferri I19841
The stable slope of a channel can be estimated from the following
equation:
where i is the stable slope; u is the maximum permissible velocity
(which depends upon the size of bed material at which bed erosion starts);
v is the ratio between mean water velocity and the corresponding velocity
at the channel bottom; u is the maximum permissible velocity developing a on size of bed material; B is the wetted perimeter, n is the roughness
coefficient, and Q is the design flow. This relationship is an
extension of Manning's equation, and the detailed analysis with
1150
1130 REGION OF
_I
2 1100 ft
+, 1110
IC e
Z
E
b- = 1090 W
-I w
BRIDGE NO-21
1070
1050 12000
10000 8000
6000 4000
2000 0.00
2000
DISTANCE FROM STRUCTURE, ft
Figure 7.
Longitudinal profile
of channel bottom and w
ater surface
in pool
upstream of
structure.
application to the gabion structure is in Appendix 3. That analysis
estimated a stable slope of 4 ft/mi, which would cause the sediment to
extend upstream for a distance of about 6,500 ft. That slope is also
plotted on Fig. 7 where it can be seen that the wedge of sediment would
intersect the knickpoint at about midheight.
Even though the sedimentation effects of the structure may extend
6,500 ft upstream, there is field evidence that the c h a ~ e l banks are
barely stable and that sloughing of the side slopes may cause further
loss of land and damage to roads. Also, the upstream knickpoint was not
submerged by the grade control structure, so it is likely that the
knickpoint will continue to progress upstream.
DOWNSTREAM EROSION
Bank erosion is occurring downstream beyond the stilling basin
to a distance of approximately 80 ft. This may be partially because of
the submerged jump, which was discussed in a previous portion of this
report. The submerged jump provides a relatively inefficient energy
dissipation, may be cause for future concern, and may require an exten-
sion of the stilling basin to provide better energy dissipation.
ECONOMIC COMPARISON OF GABION STRUCTURE WITH CONCRETE STRUCTURES
The major objective of this research was to find low-cost alterna-
tives for the stabilization of degrading streams. It is difficult to
compare the cost of the gabion drop structure, which was built and
evaluated as part of this study, with the reinforced concrete structures
which have been used in the past, because of the variations in the size
of the structures and the drainage areas that contribute flow to them.
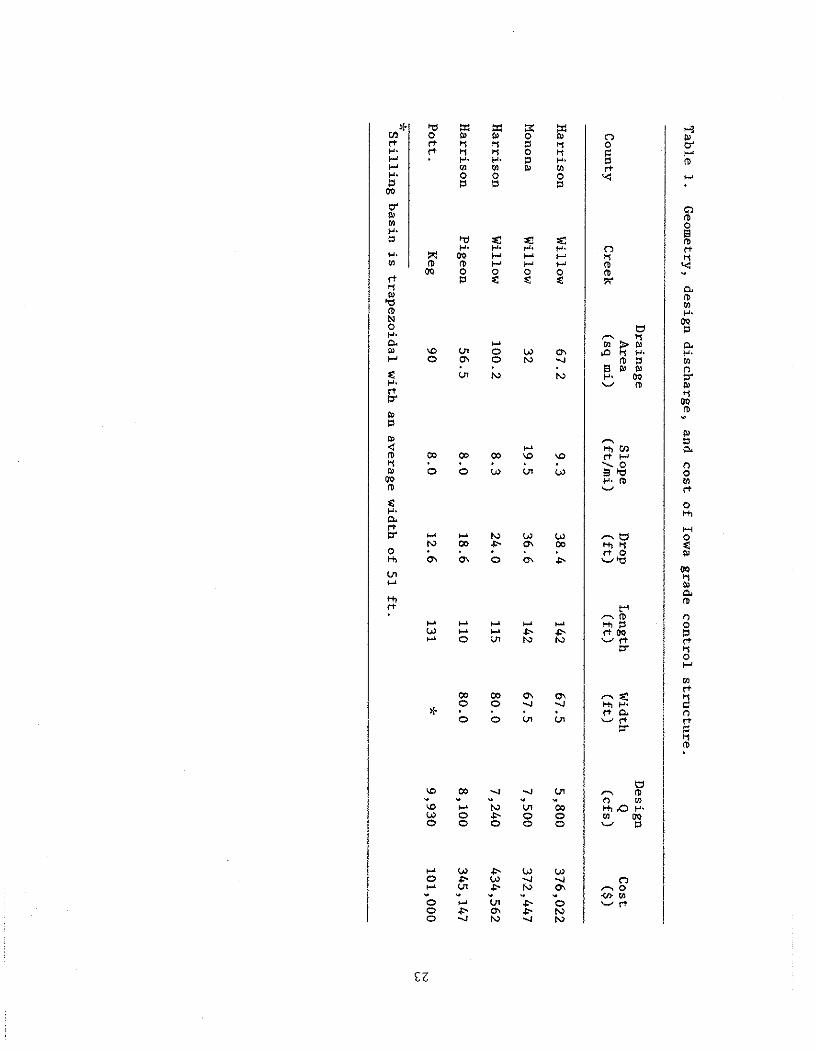
Table 1 shows the costs of four reinforced concrete drop structures,
which were constructed in western Iowa within the last seven years, and
the gabion structure. These data are the 1982 costs based on Iowa
DOT'S construction index; the calculations of these costs can be found
in Appendix 4 . Although the gabion structure is less than one-third
the cost of the least expensive concrete structure, it also has the
smallest drop. On the other hand, it does have the second largest
drainage area and the largest design flow of the structures listed.
The following analysis is an attempt to normalize the cost of the drop
structures with design flow, drainage area, c h a ~ e l slope, and structural
dimensions.
Design discharge and structure width can be combined to provide
a flow area at the crest based on the assumption that critical flow
occurs at the crest of the structure [Henderson 19661:
where A is the area of the wetted section at the critical depth, Q is
the design flow, B is the corresponding width of the water surface,
and g is the acceleration due to gravity. The wetted section, A, has
been calculated for the five drop structures and the data shown in
Table 2.
Table
1.
Geometry, design discharge, and cost of Iowa grade control structure.
Drainage
Design
Area
Slope
Drop
Length
Width
9 Cost
County
Creek
(sq mi)
(ftlmi)
(ft) (ft)
(ft) (c
fs)
($1
Harrison
Willow
67
.2
9.3
3
8.4
1
42
6
7.5
5
,80
0
37
6,0
22
Monona
Willow
32 1
9.5
3
6.6
1
42
6
7.5
7
,50
0
37
2,4
47
Harrison
Willow
10
0.2
8
.3
24
.0
11
5
80
.0
7,2
40
4
34
,56
2
Harrison
Pigeon
56
.5
8.0
1
8.6
1
10
8
0.0
8
,10
0
34
5,1
47
Pott.
Keg
90
8
.0
12
.6
13
1
* 9
,93
0
10
1,0
00
N
W
* Stilling basin is trapezoidal with an average width of 5
1 ft.
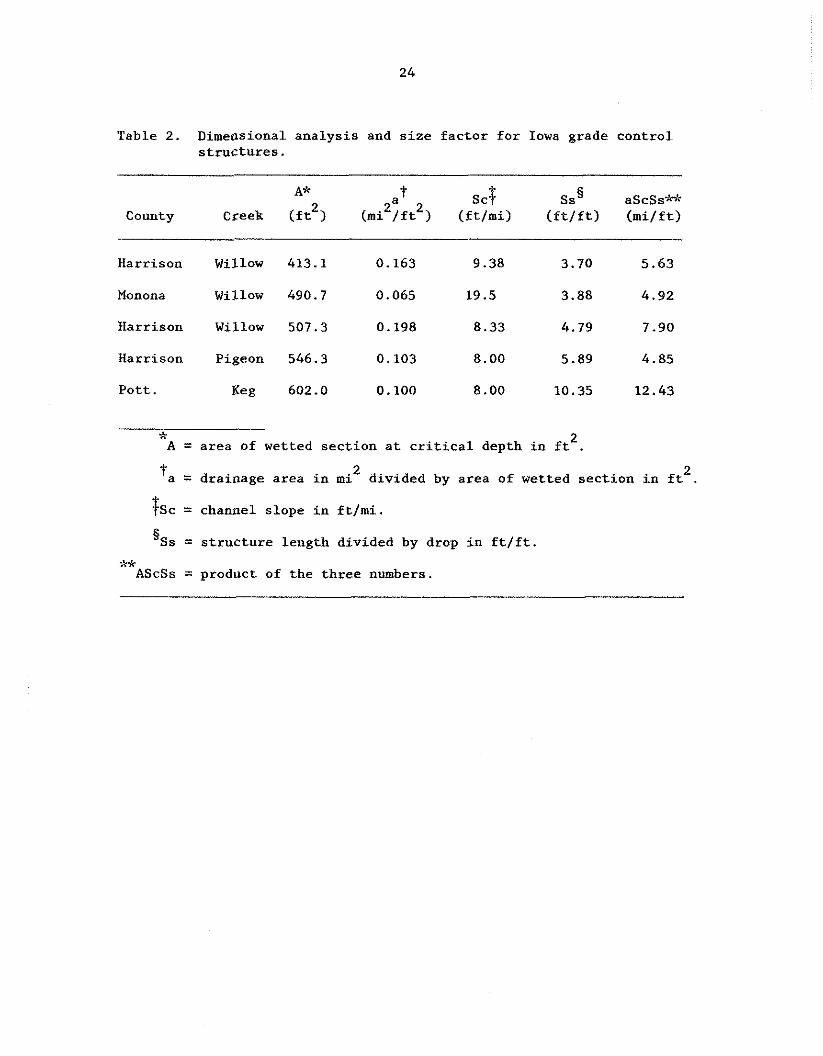
Table 2. Dimensional analysis and size factor for Iowa grade control structures.
A* t sc? Ss § 2a 2
aScSs-k"; County Creek (ft2) (mi /ft ) (ft/mi) (ft/ft) (mi/ft)
Harrison Willow 413.1 0.163 9.38 3.70 5.63
Monona Willow 490.7 0.065 19.5 3.88 4.92
Harrison Willow 507.3 0.198 8.33 4.79 7.90
Harrison Pigeon 546.3 0.103 8.00 5.89 4.85
Pott. Keg 602.0 0.100 8.00 10.35 12.43
;5 2 A = area of wetted section at critical depth in ft .
t 2 a = drainage area in mi2 divided by area of wetted section in ft . fsc = channel slope in ft/mi.
'SS = structure length divided by drop in ft/ft. ** AScSs = product of the three numbers.
The wetted area can be combined with drainage area, D.A., to form a
semi-dimensionless term:
The term is semi-dimensionless because the drainage area is in sq mi and
the wetted area is in sq ft. The values of "a" for all five structures
are also shown in Table 2. The channel slope, Sc, is a semi-dimen-
sionless term in ft/mi, and a dimensionless term, Ss, can be generated
by dividing the overall length of the structure by its drop. These
terms, along with their combined values, are shown in Table 2. This
combined term describes the structure according to size, design flow,
and drainage area and is defined here as the size factor. The cost of
each structure is plotted versus the size factor in Fig. 8; it can be
seen that the cost of the concrete structures increases linearly with
increasing size factor. Note that the cost of the plotted gabion struc-
ture versus its size factor falls considerably below the projection
of the line for the concrete structures. This analysis suggests that
the gabion structure may be about 20% of the cost of an equivalent
reinforced concrete structure.
CONCLUSIONS
The gabion grade stabilization structure has shown satisfactory
structural performance throughout the two-year observation period,
with minimal differential settling and no evidence of side slope
a n w r i o t - ' o m 0 a n n
m V, 0 n m m ri 0 $ r i a
w.'. n m ~ C o m r i C 1 m ri V, . w.
n 0 0 P s I-' o m ri w m V, n m V,
w a N ri m 0 ld m
pi m 0 n n 11 0
g H n 4 C m ri ri m m m C
V, lu s 0 a o s 0 V, I n m ri
C 119 o Dl rt 5 P.
G $ P
COST, $100,00OX 0 c N W P VI 0, 0
C
N
W
P
0 7
m
V
m
\O
C 0
C C
C N
I-' W
I-' P
I-' VI
I-' m
instability since construction was finished. It should be recognized
that the maximum flow to date has been less than 15% of the design
flow.
The major amount of sedimentation occurred during construction
and is likely to extend at least 5,500 ft upstream of the structure.
A more optimistic estimate is that the depositional wedge will extend
6,500 Et upstream. In any event the sedimentation effects of the
structure will not submerge the knickpoint that exists upstream, so
continued upstream erosion problems are likely upstream of the sedi-
mentation area.
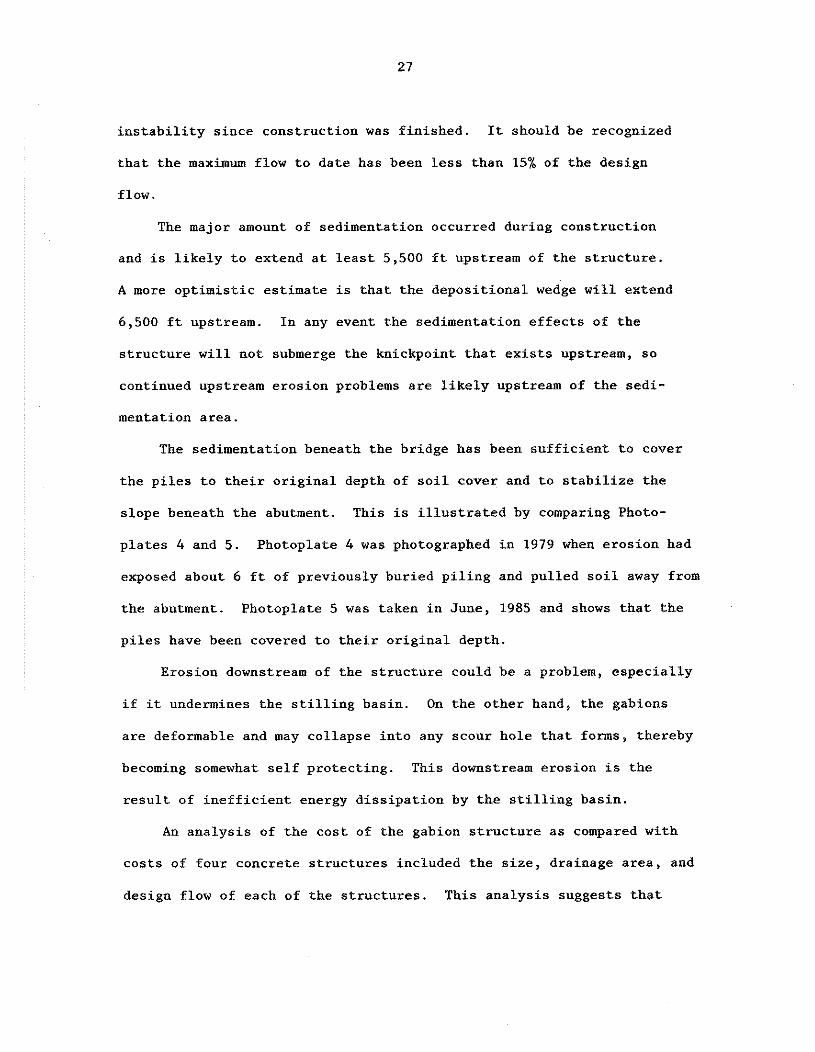
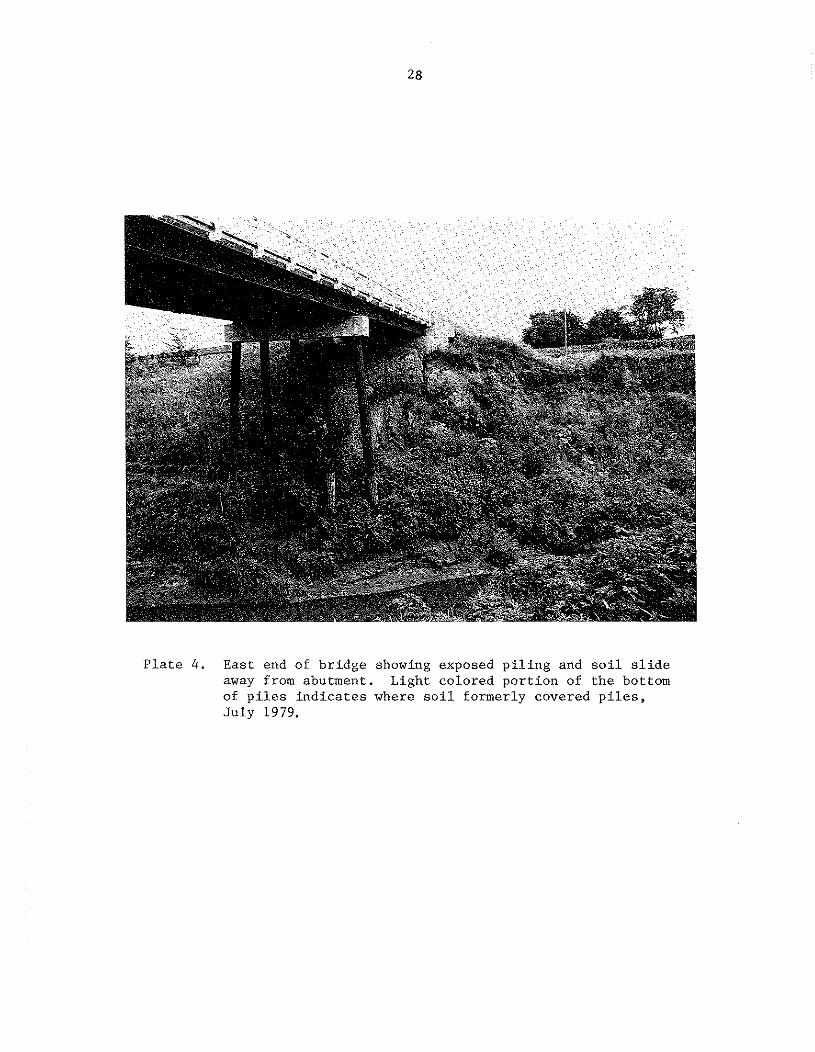
The sedimentation beneath the bridge has been sufficient to cover
the piles to their original depth of soil cover and to stabilize the
slope beneath the abutment. This is illustrated by comparing Photo-
plates 4 and 5. Photoplate 4 was photographed in 1979 when erosion had
exposed about 6 ft of previously buried piling and pulled soil away from
the abutment. Photoplate 5 was taken in June, 1985 and shows that the
piles have been covered to their original depth.
Erosion downstream of the structure could be a problem, especially
if it undermines the stilling basin. On the other hand, the gabions
are deformable and may collapse into any scour hole that forms, thereby
becoming somewhat self protecting. This downstream erosion is the
result of inefficient energy dissipation by the stilling basin.
An analysis of the cost of the gabion structure as compared with
costs of four concrete structures included the size, drainage area, and
design flow of each of the structures. This analysis suggests that
P l a t e 4. East end of br idge showing exposed p i l i n g and s o i l s l i d e away from abutment. Light colored po r t ion of t h e bottom of p i l e s i n d i c a t e s where s o i l formerly covered p i l e s , Ju ly 1979.
P l a t e 5. East end of br idge showing p i l i n g once again covered by s o i l and s t a b l e s o i l s lope beneath abutment, June 1985.
the gabion structure cost about 20% of what an equivalent concrete
structure would have cost.
The authors gratefully acknowledge the financial support provided
for this study by the Highway Research Board and the Highway Division,
Iowa DOT; by ISWRRI, and by Pottawattami County. The support and technical
expertise of Gene Hales, Pottawattami County Engineer; Brian Hunter,
Assistant Pottawattami County Engineer; and Eldo Schornhorst, Shelby County
Engineer, were most valuable in advancing the project. T. A1 Austin,
Director of ISWRRI, provided important guidance in the hydraulic design.
Former ISU graduate students G. Tom Wade and Lester Litton collected
the data for Phase I of this research, and many of their ideas and
suggestions were carried into the design phase.
The Engineering Research Institute administered this project,
and The Office of Editorial Services prepared this report; their
support is also gratefully acknowledged.
REFERENCES
Brice, J. C. et al., 1978, "Countermeasures for Hydraulic Problems at Bridges," Federal Highway Administration Report No. FWA-RD-78-163, Vols. 1 and 2, National Technical Information Service, Springfield, Va .
Henderson, F. M., 1966, Open Channel Flow, MacMillan Pub. Co., New York, 352 pp.
Litton, L. L. and R. A. Lohnes, 1982, "Soil-cement for Use in Stream Channel Grade Stabilization Structures," Transportation Research Record 839:33-40.
Lohnes, R. A., F. W. Klaiber, and M. D. Dougal, 1980, "Alternate Methods of Stabilizing Degrading Stream Channels in Western Iowa, Final Report on Phase I," ISU-ERI-Ames-81047, Engineering Research Institute, Iowa State Univ., Ames, Ia.
Maccaferri, 1984, Flexible Weirs for River Training, Maccaferri Gabion Go., Rome, Italy, 56 pp.
APPENDIX 1
CONSTRUCTION OF GABION STRUCTURES
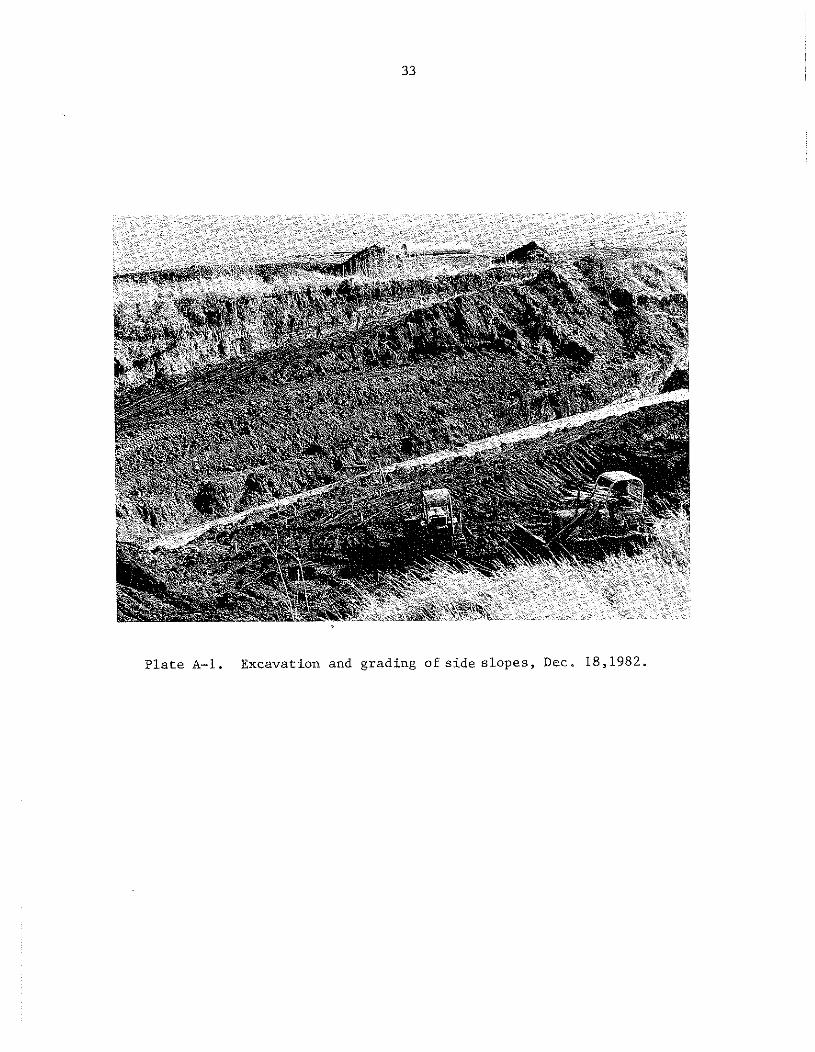
P l a t e A-1. Excavation and grading of s i d e s lopes , Dec. 18,1982.
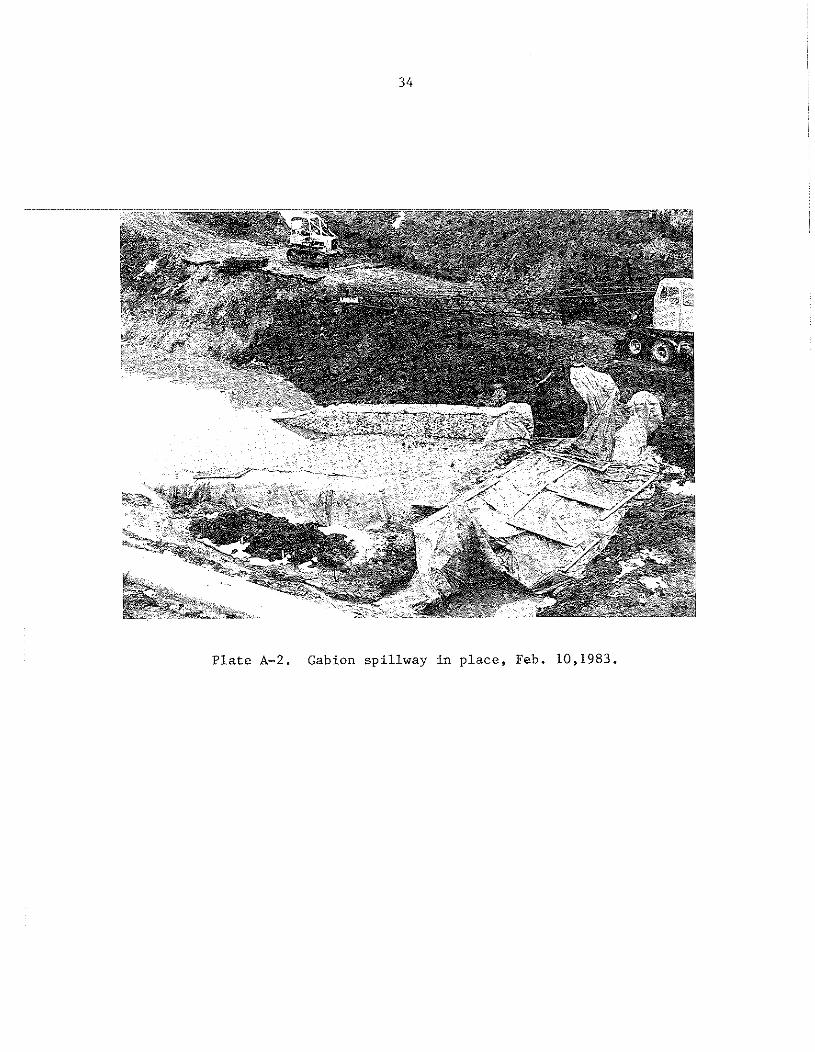
P l a t e A-2. Gabion spi l lway i n p lace , Feb. 10,1983.
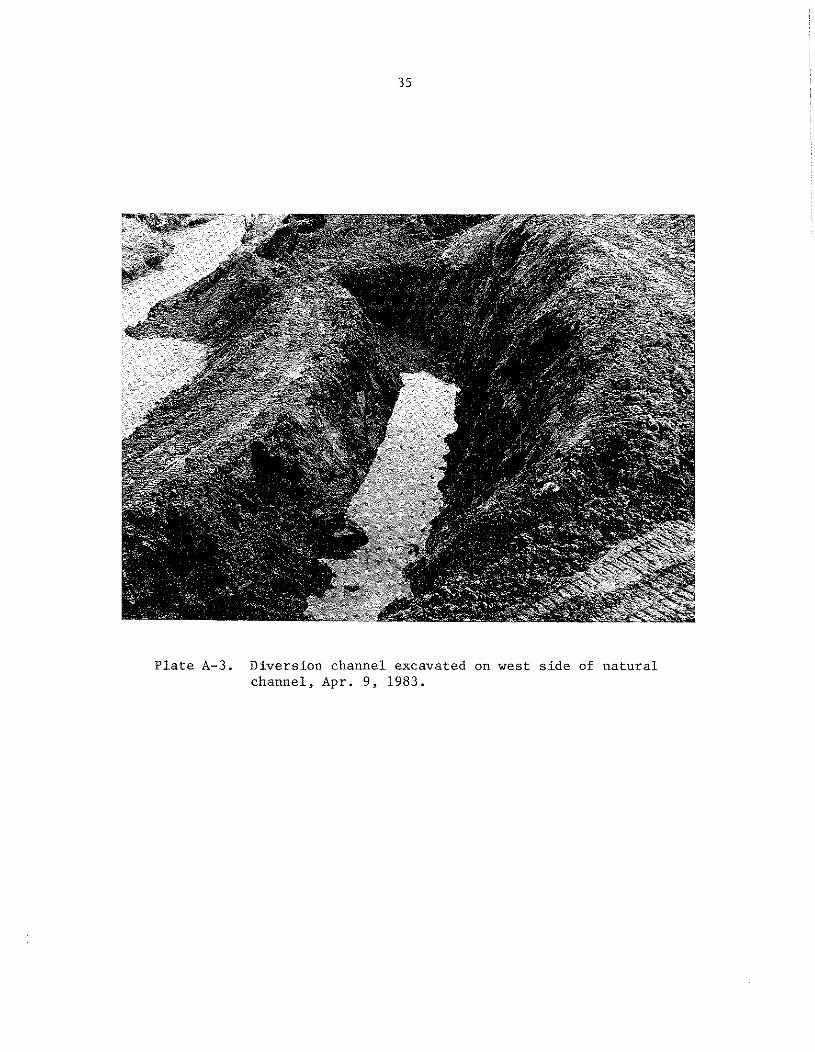
P l a t e A-3. Diversion channel excavated on west s i d e of n a t u r a l channel, Apr. 9 , 1983.
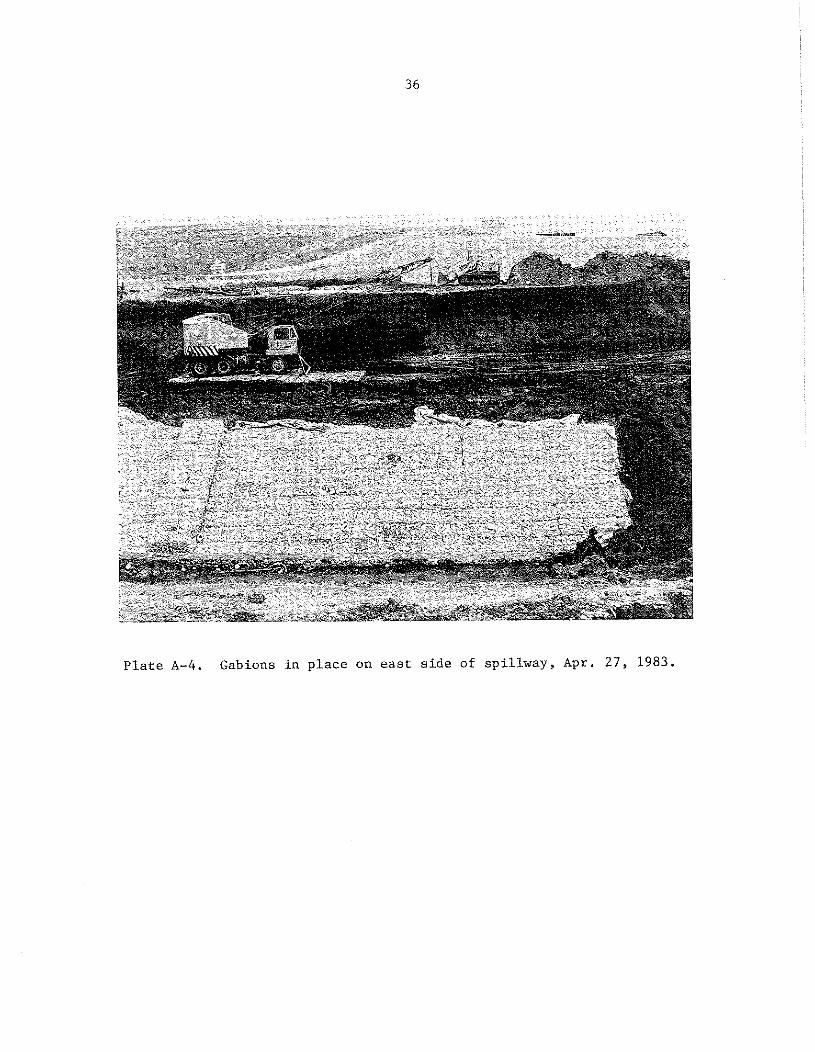
P l a t e A-4. Gabions i n p l ace on e a s t s i d e of sp i l lway, Apr. 27 , 1983.

P l a t e A-5. Concrete cutoff wal l a t c r e s t of s t r u c t u r e , Apr. 27 , 1983,
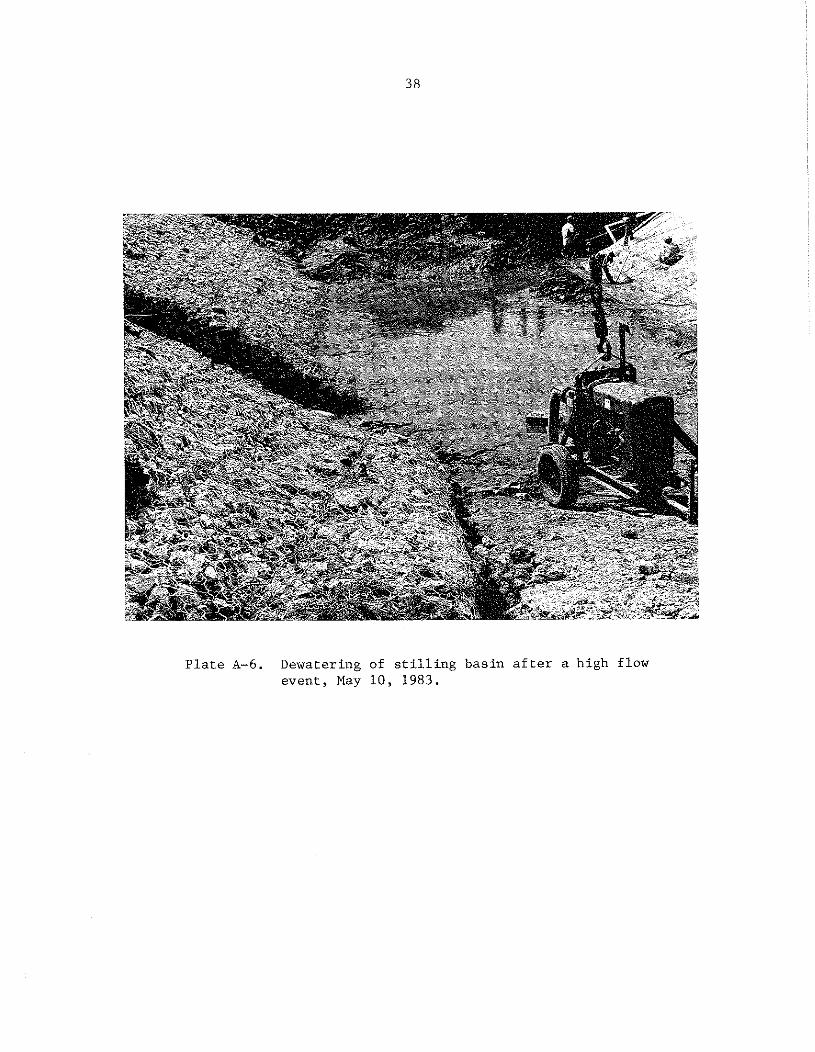
P l a t e A-6. Dewatering of s t i l l i n g bas in a f t e r a high flow event , May 10, 1983.
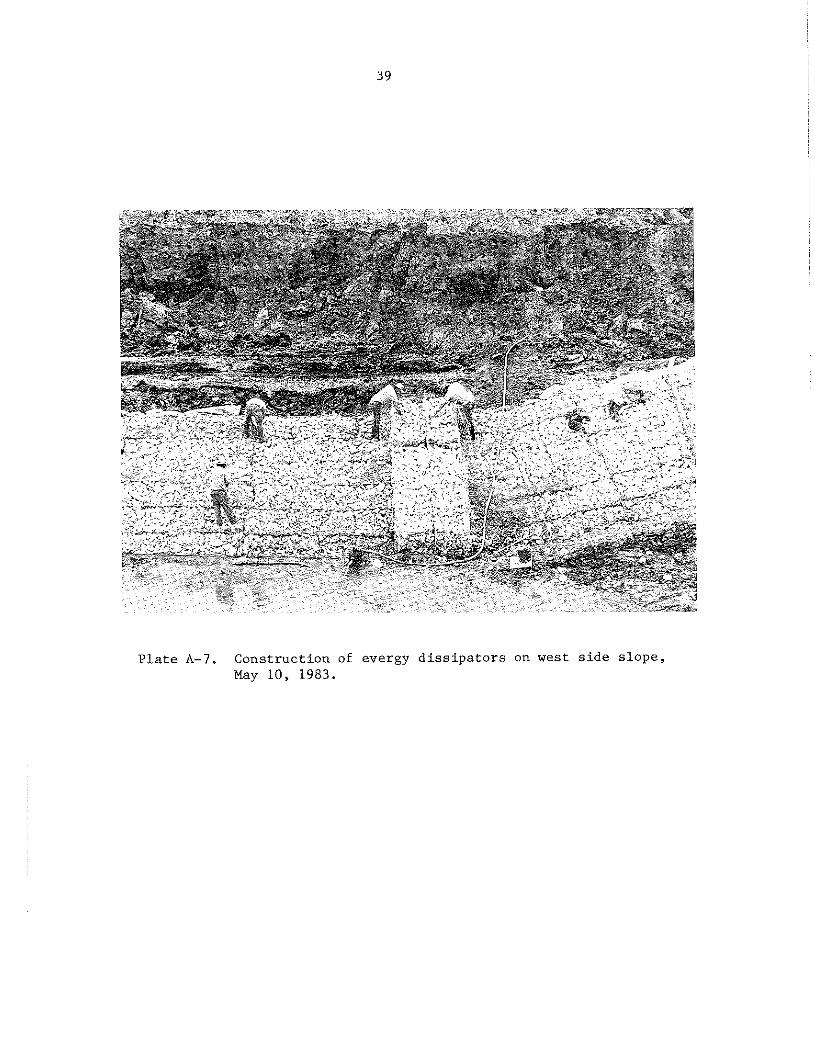
P l a t e A-7. Construct ion of evergy d i s s i p a t o r s on west s i d e s lope , May 10, 1983.
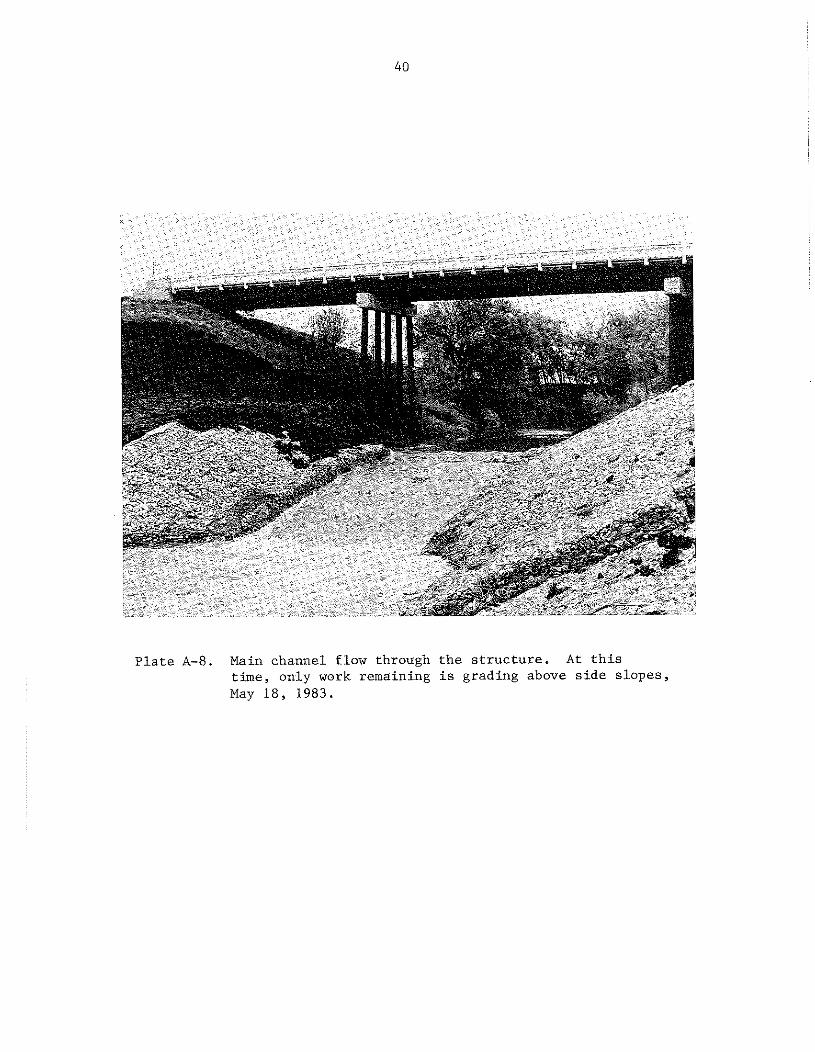
P l a t e A-8. Main channel flow through t h e s t r u c t u r e . A t t h i s t ime, only work remaining i s grading above s i d e s lopes , May 18 , 1983.
APPENDIX 2
DISCHARGE COMPUTATIONS AND CRITICAL FLOW
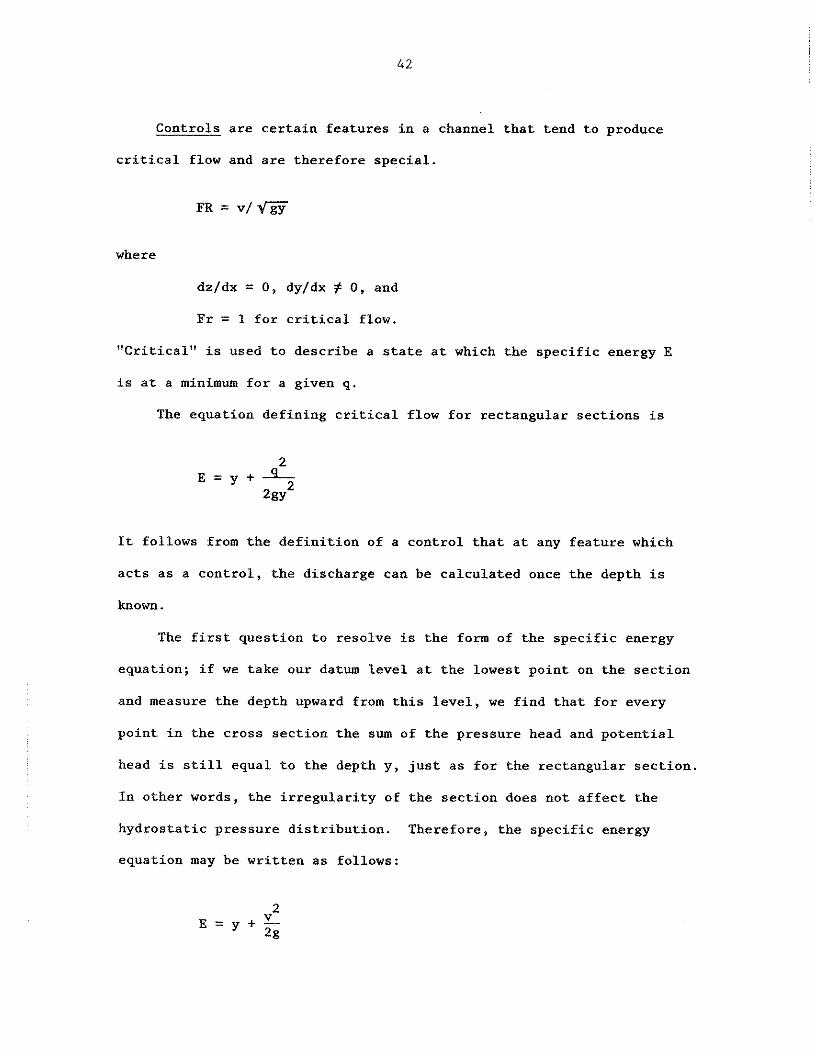
Controls are certain features in a channel that tend to produce
critical flow and are therefore special.
where
dz/dx = 0, dy/dx $ 0, and
Fr = 1 for critical flow.
"Critical" is used to describe a state at which the specific energy E
is at a minimum for a given q.
The equation defining critical flow for rectangular sections is
It follows from the definition of a control that at any feature which
acts as a control, the discharge can be calculated once the depth is
known.
The first question to resolve is the form of the specific energy
equation; if we take our datum level at the lowest point on the section
and measure the depth upward from this level, we find that for every
point in the cross section the sum of the pressure head and potential
head is still equal to the depth y, just as for the rectangular section.
In other words, the irregularity of the section does not affect the
hydrostatic pressure distribution. Therefore, the specific energy
equation may be written as follows:
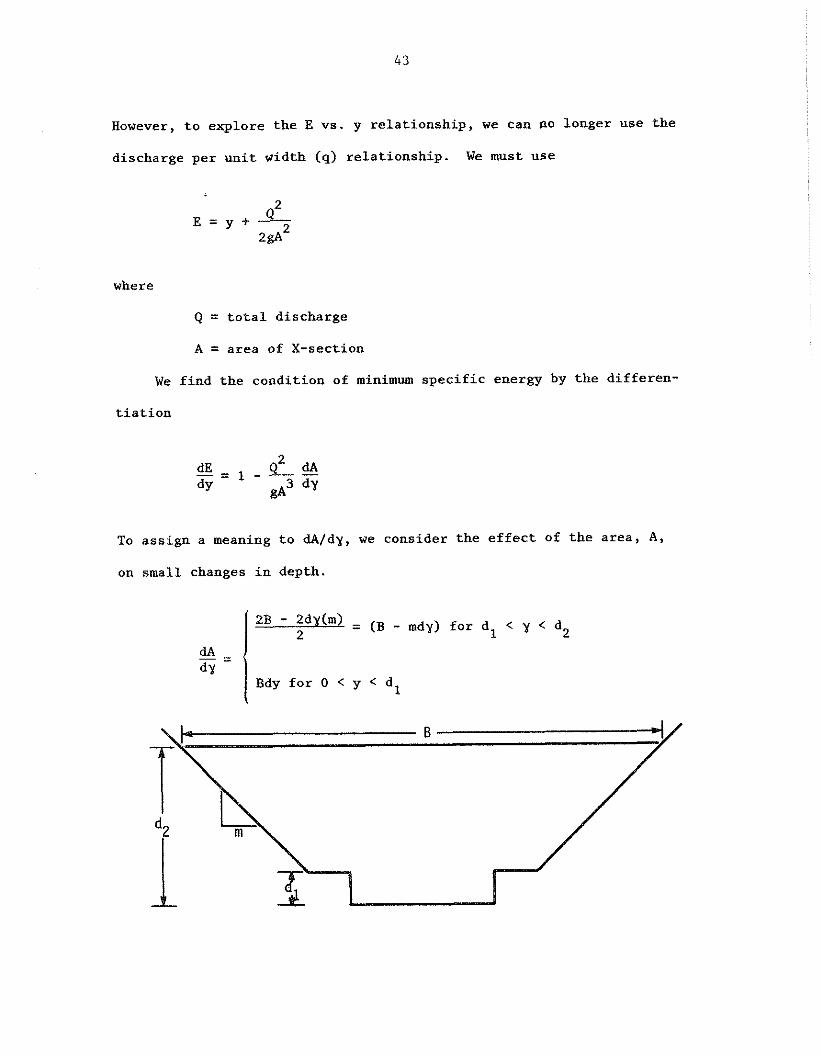
However, to explore the E vs. y relationship, we can ilo longer use the
discharge per unit width (q) relationship. We must use
where
Q = total discharge
A = area of X-section
We find the condition of minimum specific energy by the differen-
tiation
To assign a meaning to dA/dy, we consider the effect of the area, A ,
on small changes in depth.
( 2B - = (B - mdy) for dl < y < d2 ' = 1 Bdy for 0 < y < dl
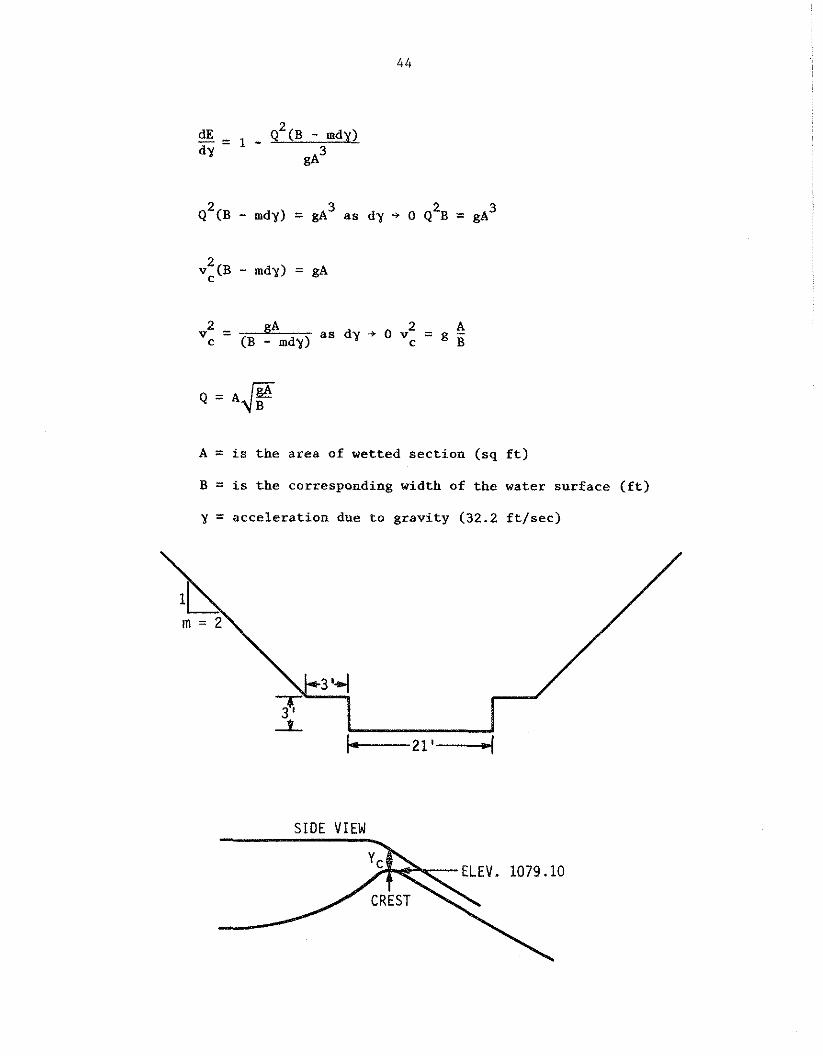
2 v (B - mdy) = gA C
A = is the area of wetted section (sq ft)
B = is the corresponding width of the water surface (ft)
y = acceleration due to gravity (32.2 ft/sec)
S I D E VIEW
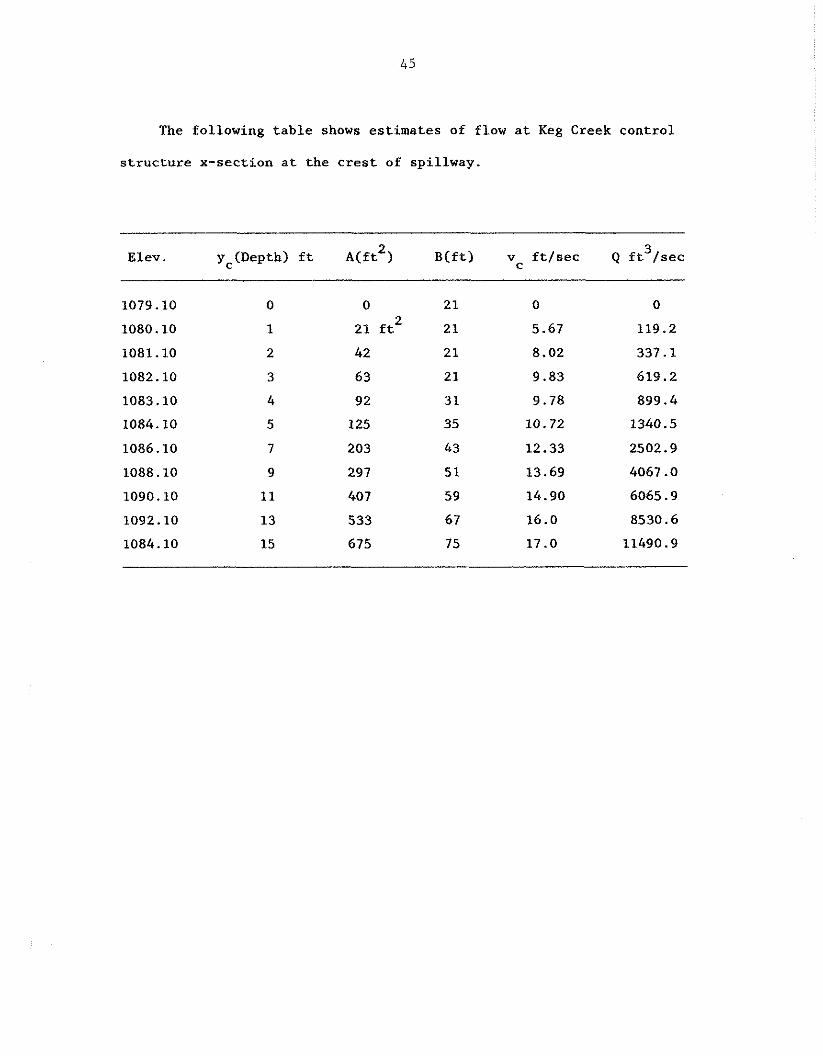
The following table shows estimates of flow at Keg Creek control
structure x-section at the crest of spillway.
Elev. yc(Depth) ft ~ ( f t ~ ) B(ft) v ft/sec Q ft /sec 3
C
APPENDIX 3
SEDIMENTATION ANALYSIS
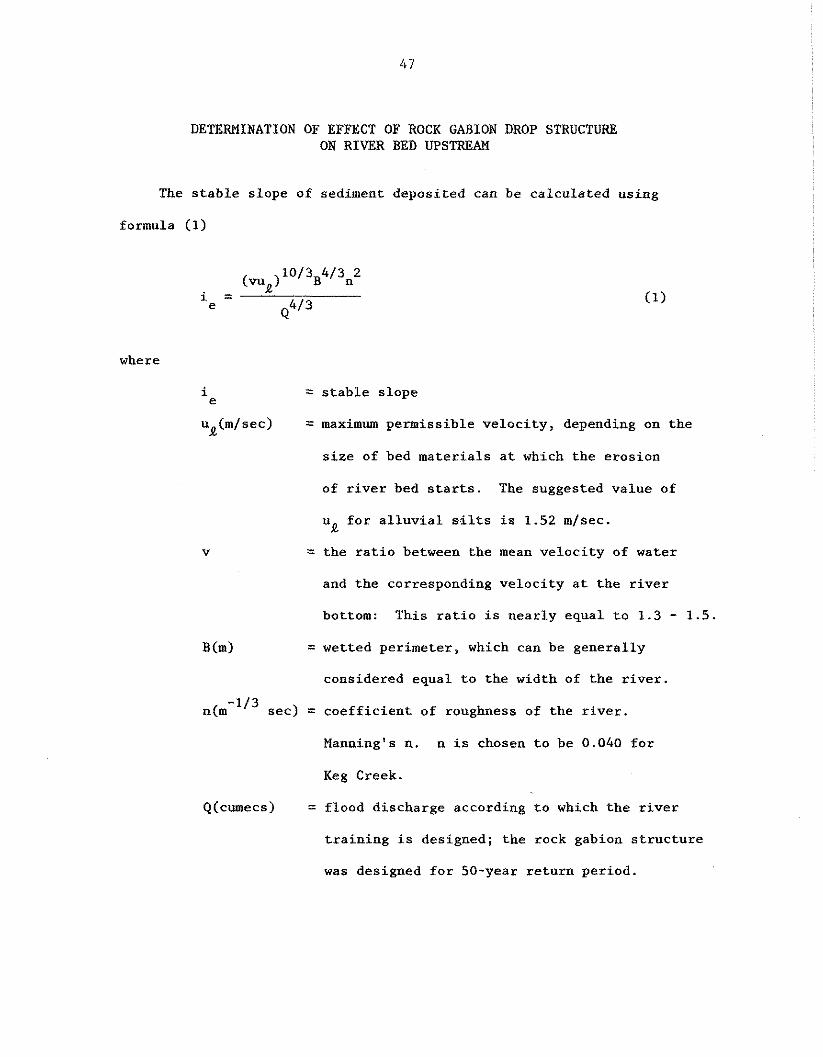
DETERMINATION OF EFFECT OF ROCK GABION DROP STRUCTURE ON RIVER BED UPSTREAM
The stable slope of sediment deposited can be calculated using
formula (1)
where
i = stable slope e
uQ(m/sec) = maximum permissible velocity, depending on the
size of bed materials at which the erosion
of river bed starts. The suggested value of
Ua for alluvial silts is 1.52 m/sec.
v = the ratio between the mean velocity of water
and the corresponding velocity at the river
bottom: This ratio is nearly equal to 1.3 - 1.5
B(m) = wetted perimeter, which can be generally
considered equal to the width of the river.
n(m-lf3 sec) = coefficient of roughness of the river.
Manning's n. n is chosen to be 0.040 for
Keg Creek.
Q(cumecs) = flood discharge according to which the river
training is designed; the rock gabion structure
was designed for 50-year return period.
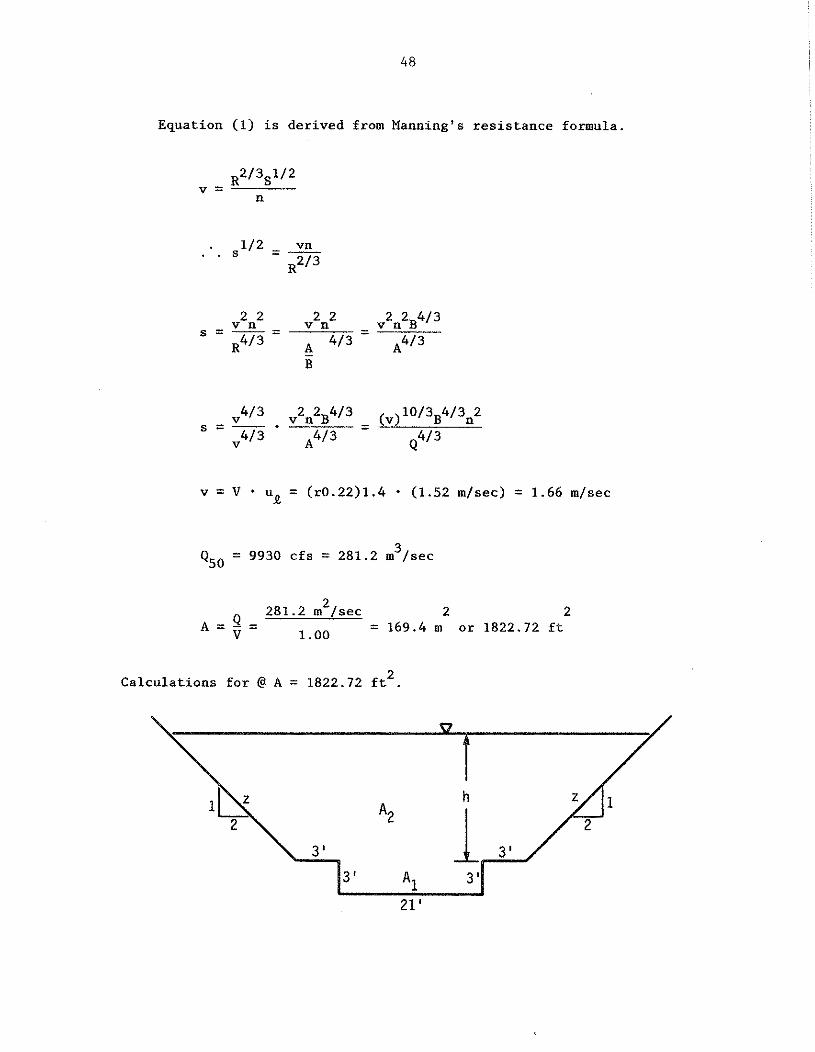
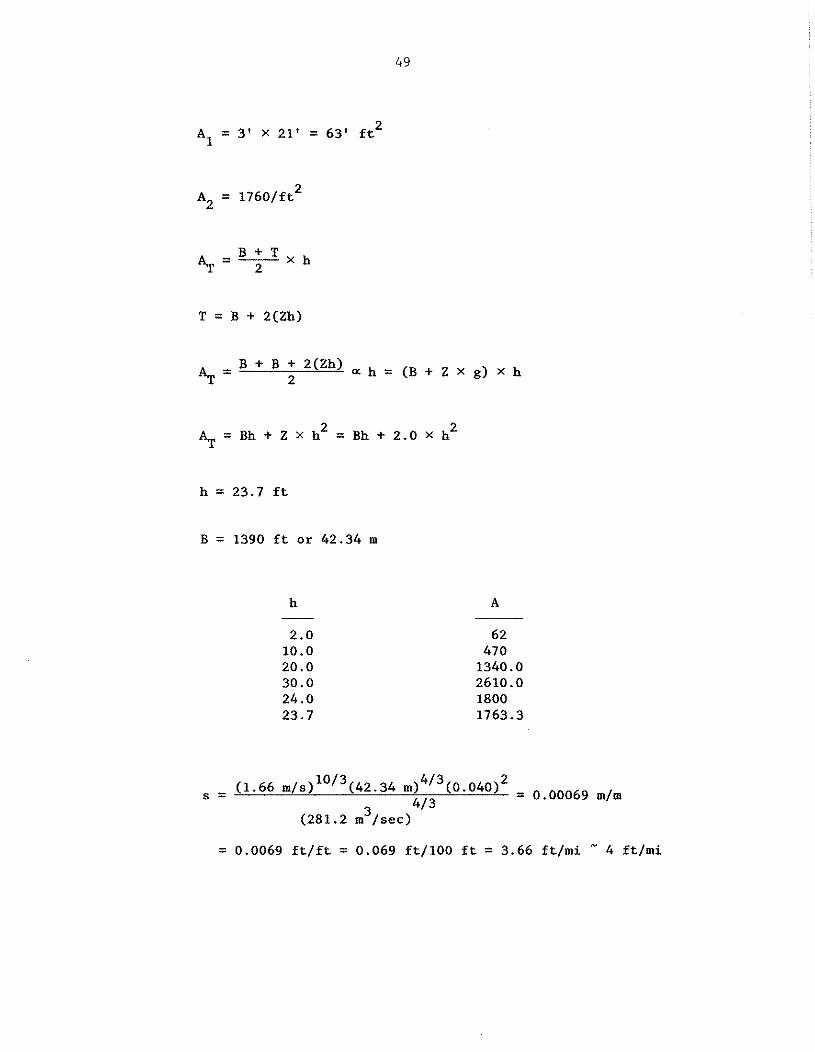
Equation (1) is derived from Manning's resistance formula.
3 Q50 = 9930 cfs = 281.2 m /sec
2 Calculations for @ A = 1822.72 ft .
When the above parameters along the whole length of the reach in
question are known, the stable slope is calculated, after which the
position and height of the structures must be determined.
If a stretch of a river, having natural slope i, is to be trained
to a slope i by means of a series of weirs at equidistant points, the e
height H and distance 1 between two weirs are connected by the relation:
H = H - H2 = (i - i )1. Consequently, the number n of weirs necessary 1 e
for the training of the considered length L is
In general, it is preferable to build small and closely separated
structures instead of high ones, particularly where the soil is subject
to erosion, in order to disturb the natural watercourse as little as
possible.
Recently, in addition to traditional forms of weirs constructed
for the prevention of river bed erosion, other types of structures
have been developed for this particular purpose, but they have differ-
ent characteristics.
APPENDIX 4
COST ANALYSIS OF DROP STRUCTURES IN WESTERN IOWA
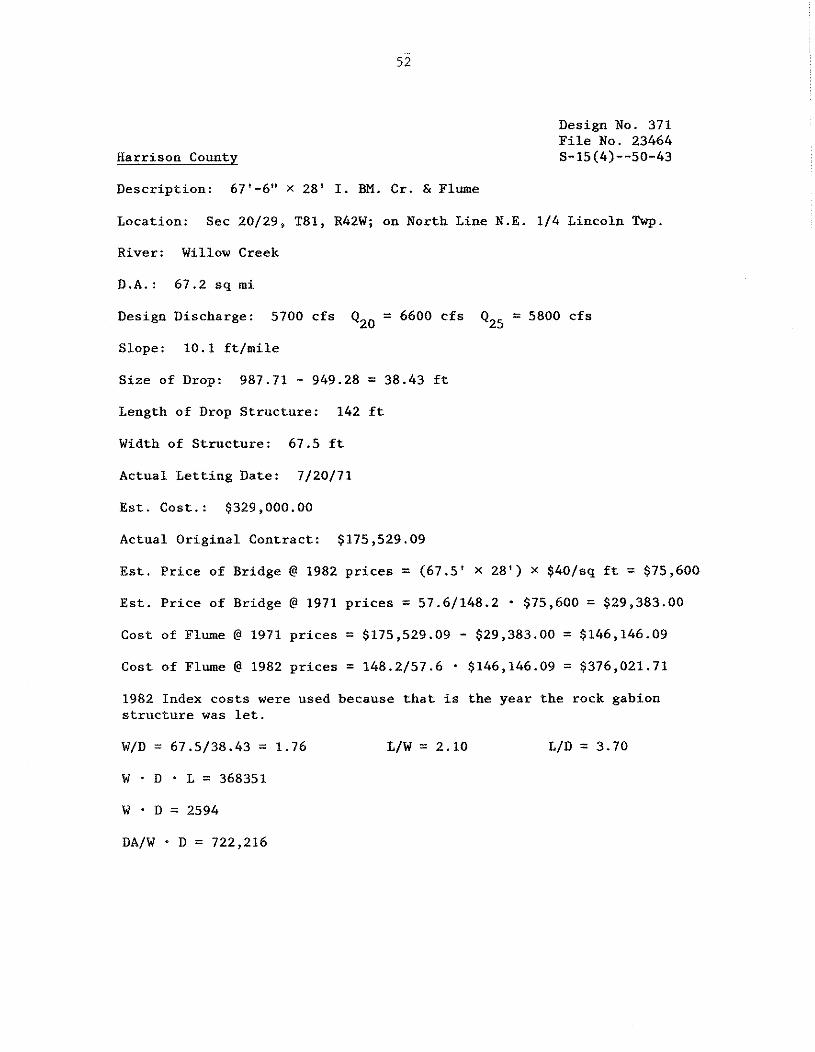
Design No. 371 F i l e No. 23464
Harr i son County S-15(4)--50-43
Desc r ip t ion : 67'-6" X 28' I. BM. C r . & Flume
Location: Sec 20/29, T81, R42W; on North Line N.E. 1/4 Lincoln Twp.
River: Willow Creek
D . A . : 67.2 s q m i
Design Discharge: 5700 c f s Q20 = 6600 c f s Q25 = 5800 c f s
Slope: 10 .1 f t / m i l e
S i z e of Drop: 987.71 - 949.28 = 38.43 f t
Length of Drop S t r u c t u r e : 142 f t
Width of S t r u c t u r e : 67.5 f t
Actual L e t t i n g Date: 7/20/71
E s t . Cost . : $329,000.00
Actual O r i g i n a l Cont rac t : $175,529.09
E s t . P r i c e of Bridge @ 1982 p r i c e s = (67.5' X 28 ' ) X $40/sq f t = $75,600
E s t . P r i c e of Bridge @ 1971 p r i c e s = 57.6/148.2 - $75,600 = $29,383.00
Cost of Flume @ 1971 p r i c e s = $175,529.09 - $29,383.00 = $146,146.09
Cost of Flume @ 1982 p r i c e s = 148.2/57.6 . $146,146.09 = $376,021.71
1982 Index c o s t s were used because t h a t i s t h e yea r t h e rock gabion s t r u c t u r e was le t .
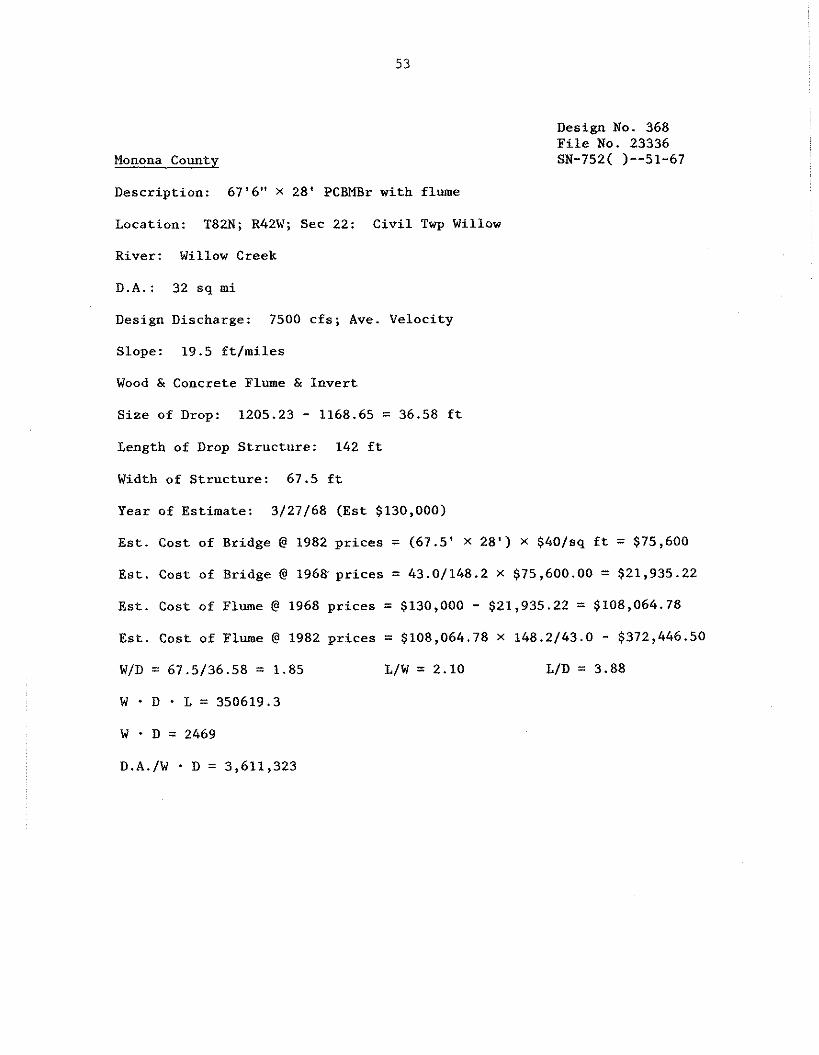
Monona County
Description: 67'6" x 28' PCBMBr with flume
Location: T82N; R42W; Sec 22: Civil Twp Willow
River: Willow Creek
D.A.: 32 sq mi
Design No. 368 File No. 23336 SN-752( )--51-67
Design Discharge: 7500 cfs; Ave. Velocity
Slope: 19.5 ft/miles
Wood & Concrete Flume & Invert
Size of Drop: 1205.23 - 1168.65 = 36.58 ft
Length of Drop Structure: 142 ft
Width of Structure: 67.5 ft
Year of Estimate: 3/27/68 (Est $130,000)
Est. Cost of Bridge @ 1982 prices = (67.5' x 28') x $40/sq ft = $75,600
Est. Cost of Bridge @ 1968. prices = 43.01148.2 X $75,600.00 = $21,935.22
Est. Cost of Flume @ 1968 prices = $130,000 - $21,935.22 = $108,064.78
Est. Cost of Flume @ 1982 prices = $108,064.78 X 148.2143.0 - $372,446.50
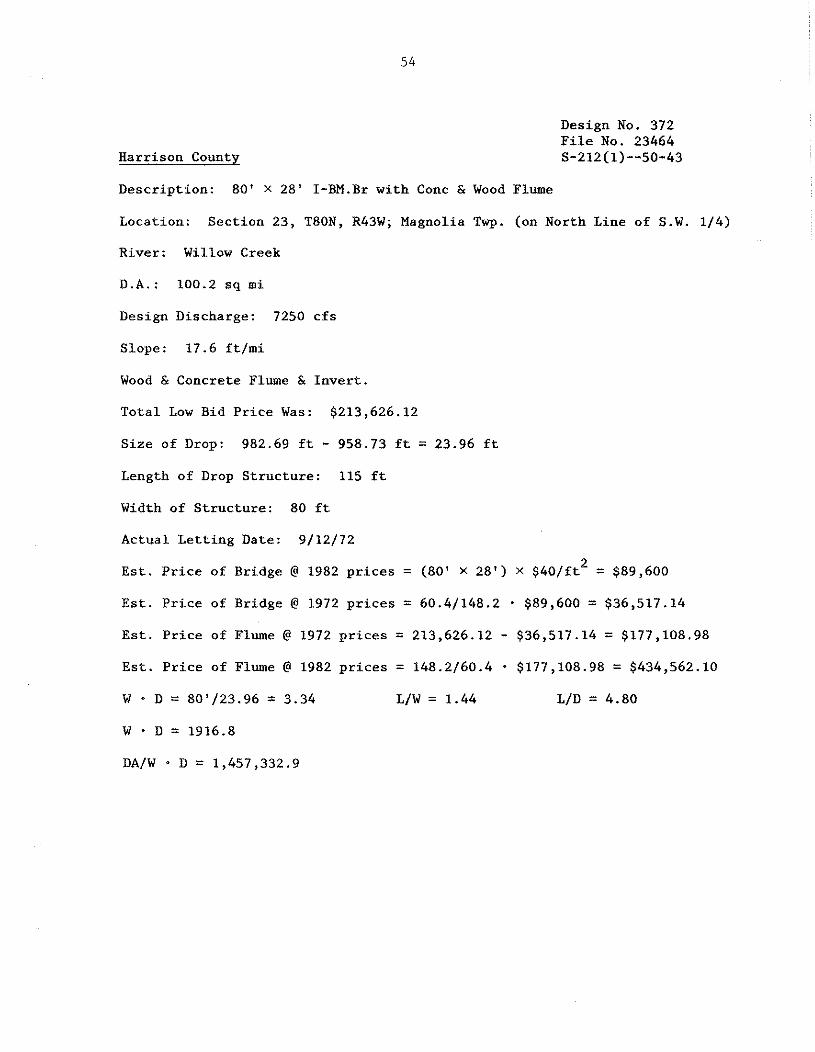
Design No. 372 F i l e No. 23464
Harr ison County S-212(1)--50-43
Descr ip t ion: 80' X 28' I-BM.Br wi th Conc & Wood Flume
Location: Sec t ion 23, T80N, R43W; Magnolia Twp. (on North Line of S.W. 1 /4)
River: Willow Creek
D . A . : 100.2 sq m i
Design Discharge: 7250 c f s
Slope: 17.6 f t / m i
Wood & Concrete Flume & I n v e r t .
T o t a l Low Bid P r i c e Was: $213,626.12
S ize of Drop: 982.69 f t - 958.73 f t = 23.96 f t
Length of Drop S t ruc tu re : 115 f t
Width of S t r u c t u r e : 80 f t
Actual L e t t i n g Date: 9/12/72
E s t . P r i c e of Bridge @ 1982 p r i c e s = (80' X 28 ' ) X $40/ f t2 = $89,600
E s t . P r i c e of Bridge @ 1972 p r i c e s = 60.4/148.2 $89,600 = $36,517.14
E s t . P r i c e of Flume @ 1972 p r i c e s = 213,626.12 - $36,517.14 = $177,108.98
E s t . P r i c e of Flume @ 1982 p r i c e s = 148.2/60.4 - $177,108.98 = $434,562.10
W - D = 801/23.96 = 3.34 L/W = 1.44 L/D = 4.80
W . D = 1916.8
DA/W D = 1,457,332.9
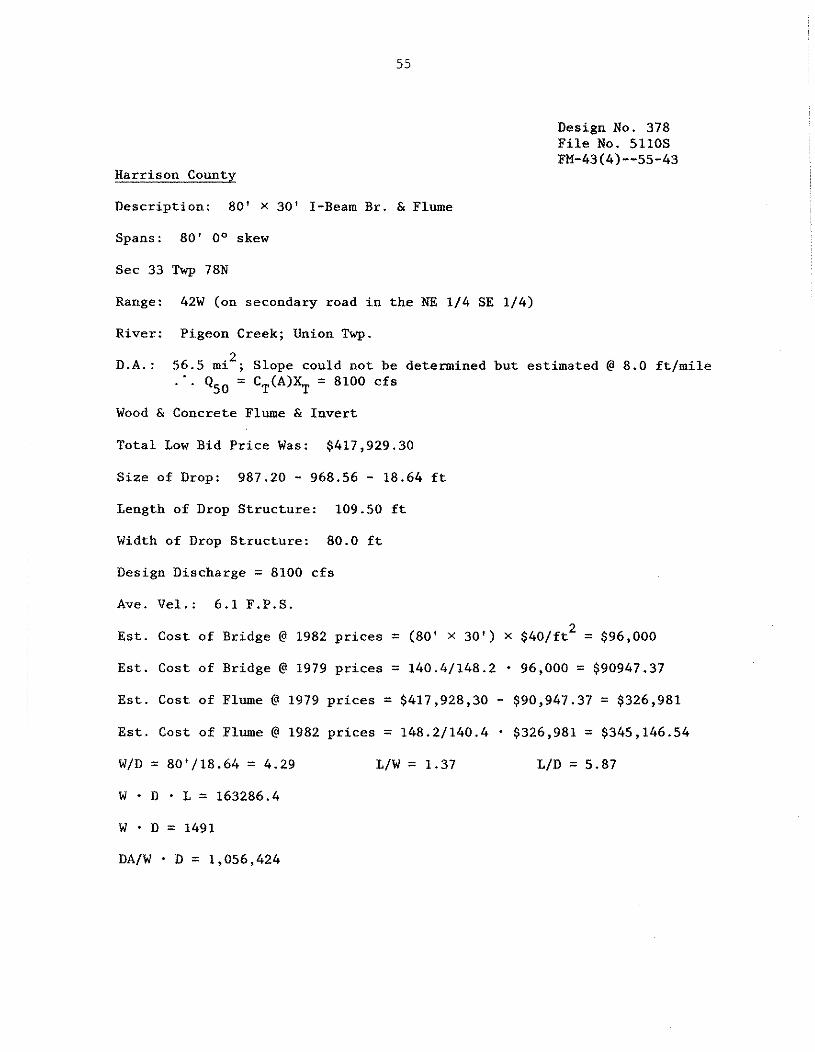
Harrison County
Description: 80' X 30' I-Beam Br. & Flume
Spans: 80' O0 skew
Sec 33 Twp 78N
Design No. 378 File No. 5110s FM-43(4)--55-43
Range: 42W (on secondary road in the NE 1/4 SE 1/4)
River: Pigeon Creek; Union Twp.
D.A. : 56.5 mi2; Slope could not be determined but estimated @ 8.0 ft/mile . ' . Q50 = C (A)XT = 8100 cfs T
Wood h Concrete Flume & Invert
Total Low Bid Price Was: $417,929.30
Size of Drop: 987.20 - 968.56 - 18.64 ft Length of Drop Structure: 109.50 ft
Width of Drop Structure: 80.0 ft
Design Discharge = 8100 cfs
Ave. VeT.: 6.1 F.P.S.
Est. Cost of Bridge @ 1982 prices = (80' X 30') X $40/ft2 = $96,000
Est. Cost of Bridge @ 1979 prices = 140.4/148.2 . 96,000 = $90947.37
Est. Cost of Flume @ 1979 prices = $417,928,30 - $90,947.37 = $326,981
Est. Cost of Flume @ 1982 prices = 148.2/140.4 - $326,981 = $345,146.54
W/D = 801/18.64 = 4.29 L/W = 1.37 L/D = 5.87
W . D . L = 163286.4
W . D = 1491
DA/W - D = 1,056,424
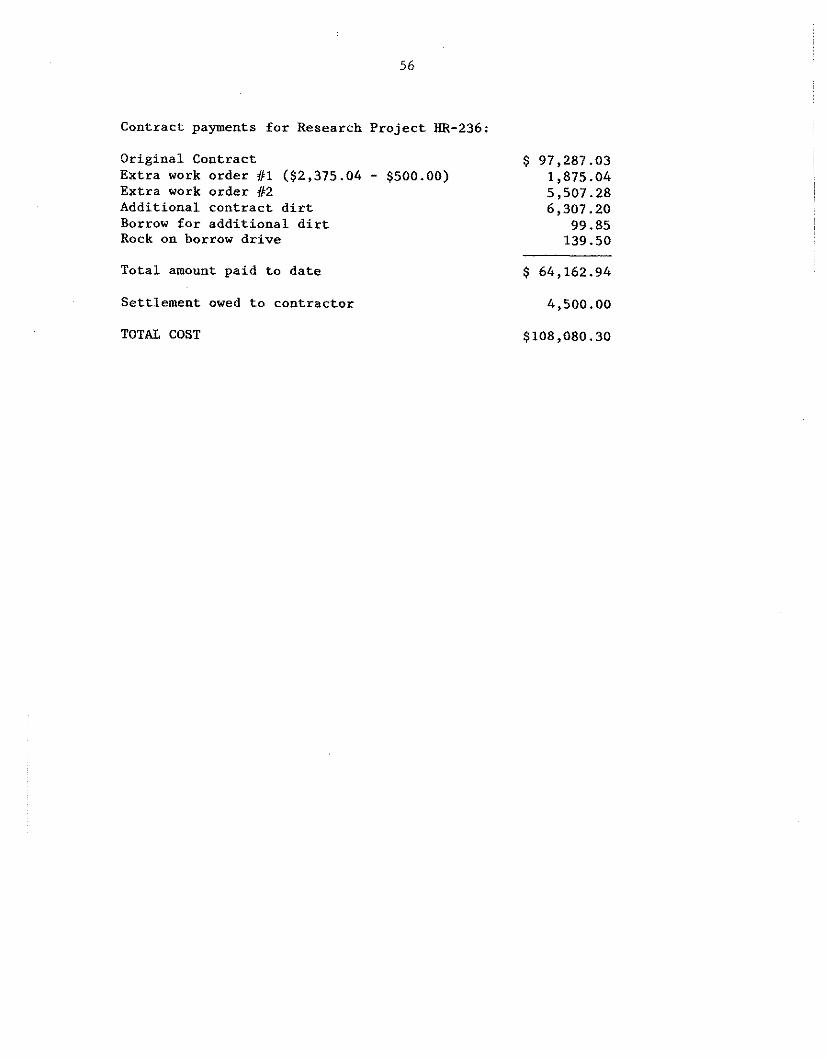
Contract payments for Research Project HR-236:
Original Contract Extra work order #l ($2,375.04 - $500.00) Extra work order #2 Additional contract dirt Borrow for additional dirt Rock on borrow drive
Total amount paid to date
Settlement owed to contractor
TOTAL COST
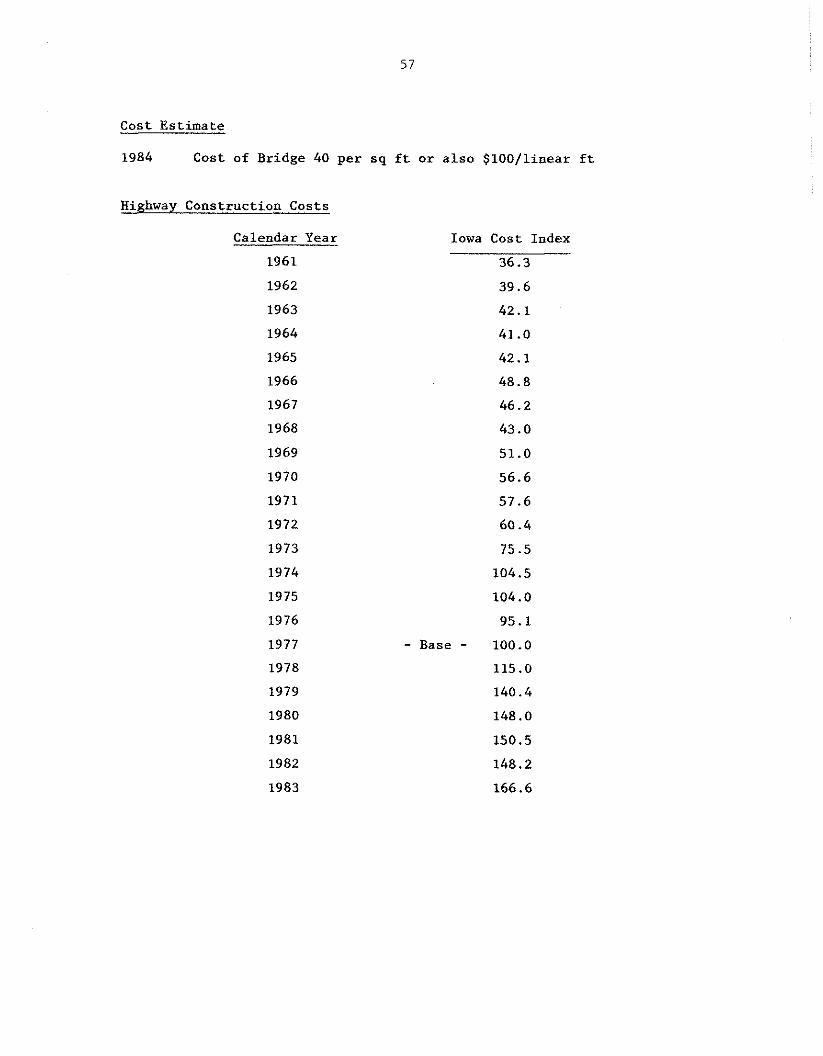
Cost Estimate
1984 Cost of Bridge 40 per sq ft or also $100/linear ft
Highway Construction Costs
Calendar Year
1961
1962
1963
Iowa Cost Index
36.3
39.6
42.1
41.0
42.1
48.8
46.2
43.0
51.0
56.6
57.6
60.4
75.5
104.5
104.0
95.1
- Base - 100.0
115.0
140.4
148.0
150.5
148.2
166.6