Embed Size (px)
Citation preview
Technologies and Policies to IncreaseEnergy Efficiency in Industry
Presentation for the American Physical Society’s Forum on Physics and SocietyPhysics of Sustainable Energy: Using Energy Efficiently and Producing It
Renewably
March 1, 2008
Lynn PriceEnergy Analysis Department
Environmental Energy Technologies DivisionLawrence Berkeley National Laboratory
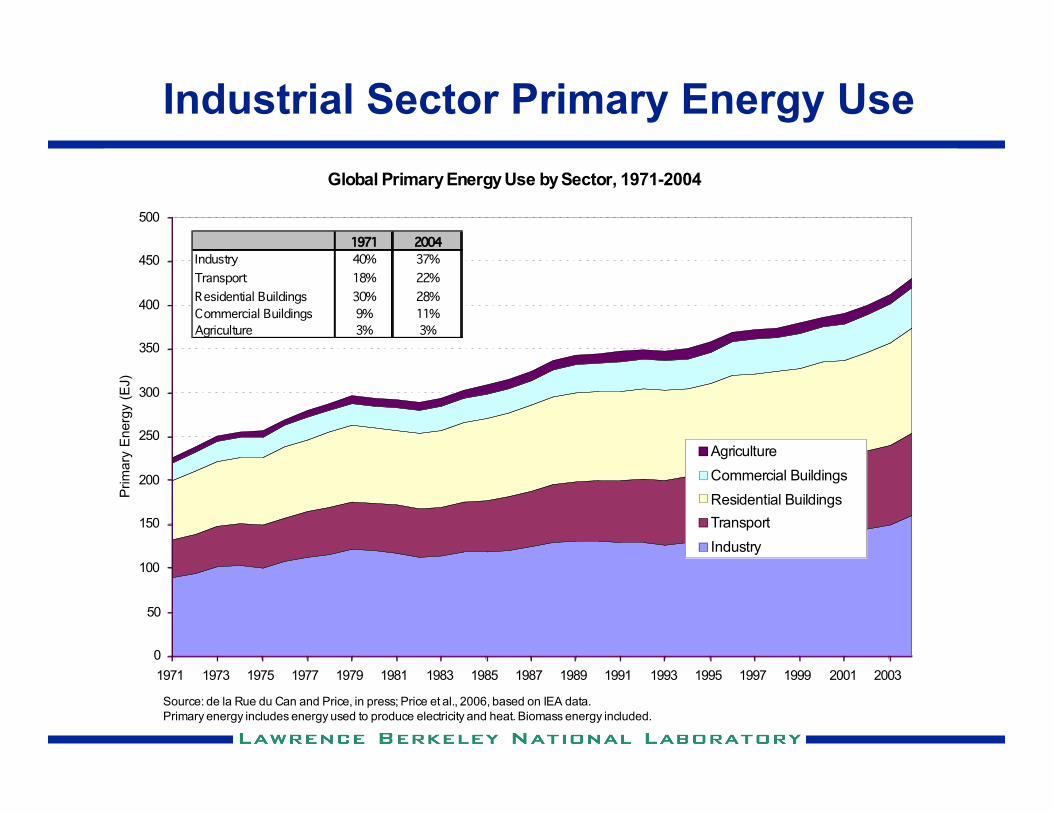
Industrial Sector Primary Energy UseGlobal Primary Energy Use by Sector, 1971-2004
0
50
100
150
200
250
300
350
400
450
500
1971 1973 1975 1977 1979 1981 1983 1985 1987 1989 1991 1993 1995 1997 1999 2001 2003
Pri
ma
ry E
ne
rgy (
EJ)
Agriculture
Commercial Buildings
Residential Buildings
Transport
Industry
Source: de la Rue du Can and Price, in press; Price et al., 2006, based on IEA data.
Primary energy includes energy used to produce electricity and heat. Biomass energy included.
1971 2004
Industry 40% 37%
Transport 18% 22%
Residential Buildings 30% 28%
Commercial Buildings 9% 11%
Agriculture 3% 3%
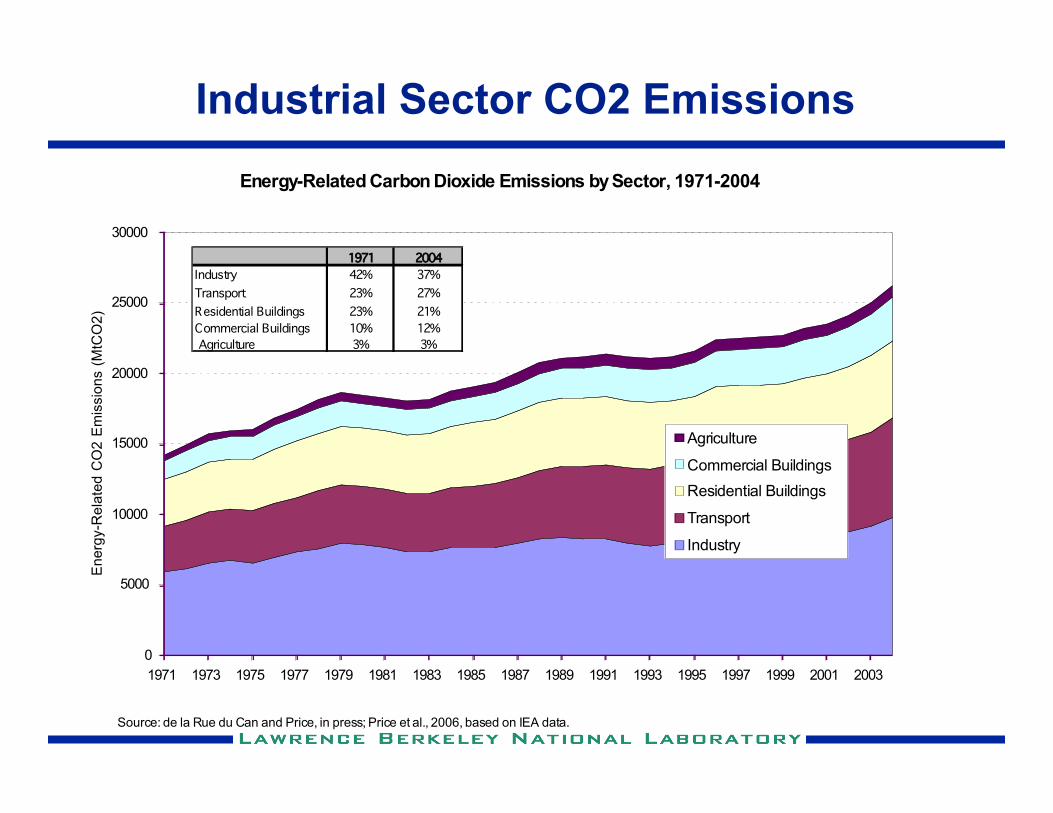
Industrial Sector CO2 EmissionsEnergy-Related Carbon Dioxide Emissions by Sector, 1971-2004
0
5000
10000
15000
20000
25000
30000
1971 1973 1975 1977 1979 1981 1983 1985 1987 1989 1991 1993 1995 1997 1999 2001 2003
En
erg
y-R
ela
ted
CO
2 E
mis
sio
ns (
MtC
O2
)
Agriculture
Commercial Buildings
Residential Buildings
Transport
Industry
Source: de la Rue du Can and Price, in press; Price et al., 2006, based on IEA data.
1971 2004
Industry 42% 37%
Transport 23% 27%
Residential Buildings 23% 21%
Commercial Buildings 10% 12%
Agriculture 3% 3%
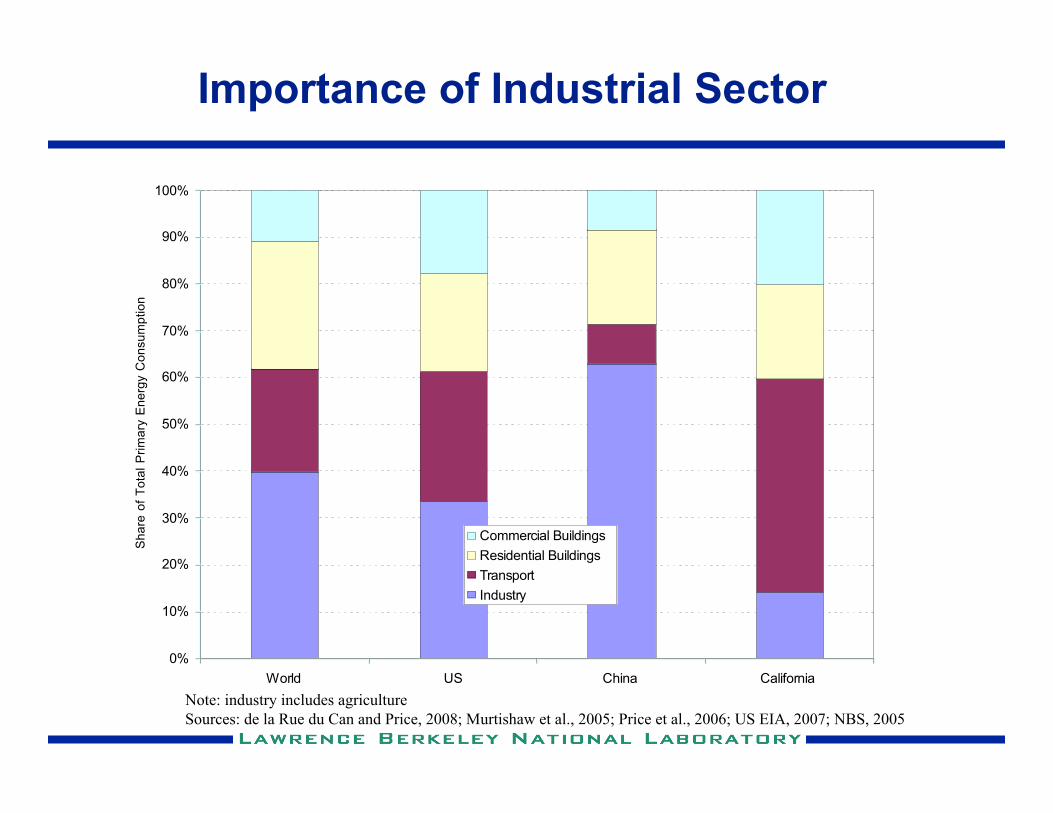
Importance of Industrial Sector
Note: industry includes agricultureSources: de la Rue du Can and Price, 2008; Murtishaw et al., 2005; Price et al., 2006; US EIA, 2007; NBS, 2005
0%
10%
20%
30%
40%
50%
60%
70%
80%
90%
100%
World US China California
Sh
are
of
To
tal
Pri
ma
ry E
ne
rgy C
on
su
mp
tio
n
Commercial Buildings
Residential Buildings
Transport
Industry
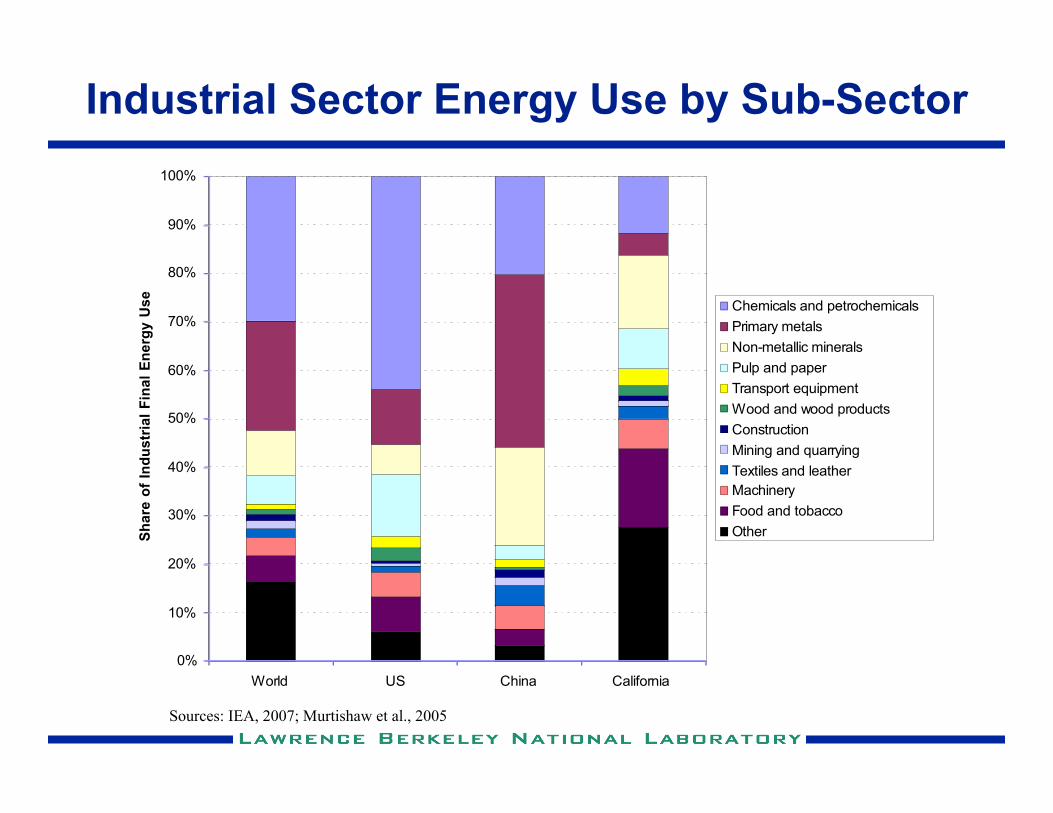
Industrial Sector Energy Use by Sub-Sector
0%
10%
20%
30%
40%
50%
60%
70%
80%
90%
100%
World US China California
Sh
are
of
Ind
us
tria
l F
ina
l E
ne
rgy
Us
e
Chemicals and petrochemicals
Primary metals
Non-metallic minerals
Pulp and paper
Transport equipment
Wood and wood products
Construction
Mining and quarrying
Textiles and leather
Machinery
Food and tobacco
Other
Sources: IEA, 2007; Murtishaw et al., 2005
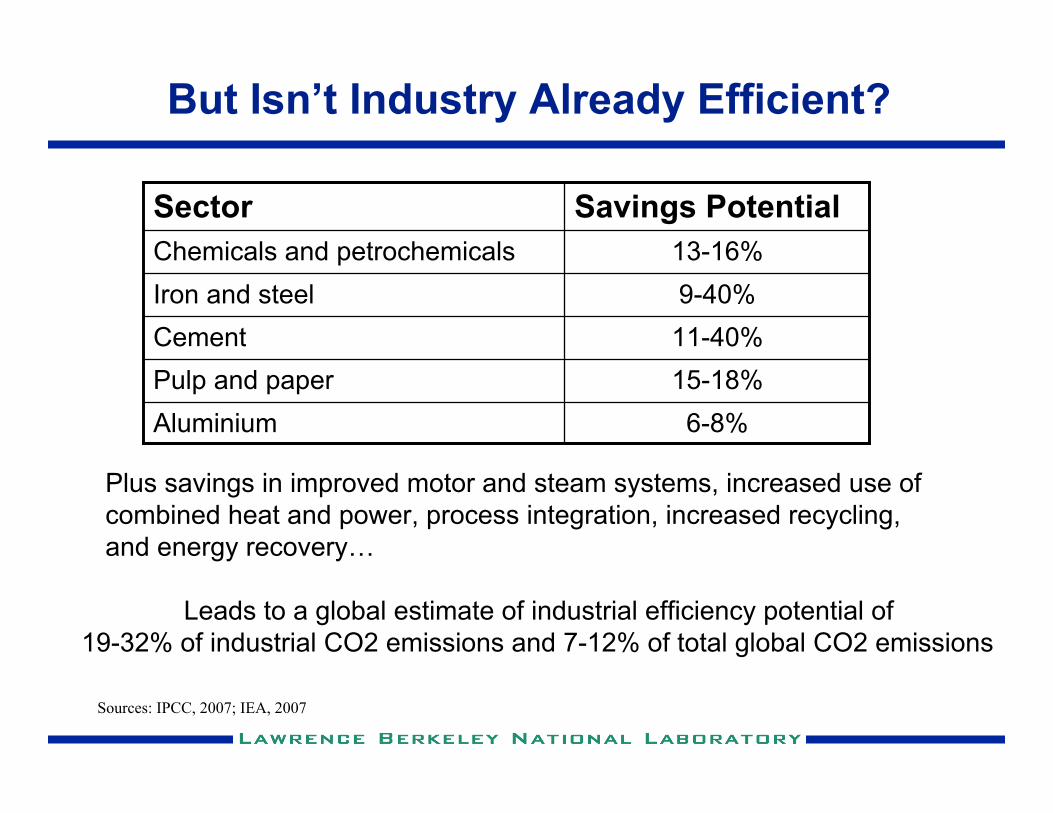
But Isn’t Industry Already Efficient?
6-8%Aluminium15-18%Pulp and paper11-40%Cement9-40%Iron and steel13-16%Chemicals and petrochemicals
Savings PotentialSector
Sources: IPCC, 2007; IEA, 2007
Plus savings in improved motor and steam systems, increased use ofcombined heat and power, process integration, increased recycling,and energy recovery…
Leads to a global estimate of industrial efficiency potential of19-32% of industrial CO2 emissions and 7-12% of total global CO2 emissions
7
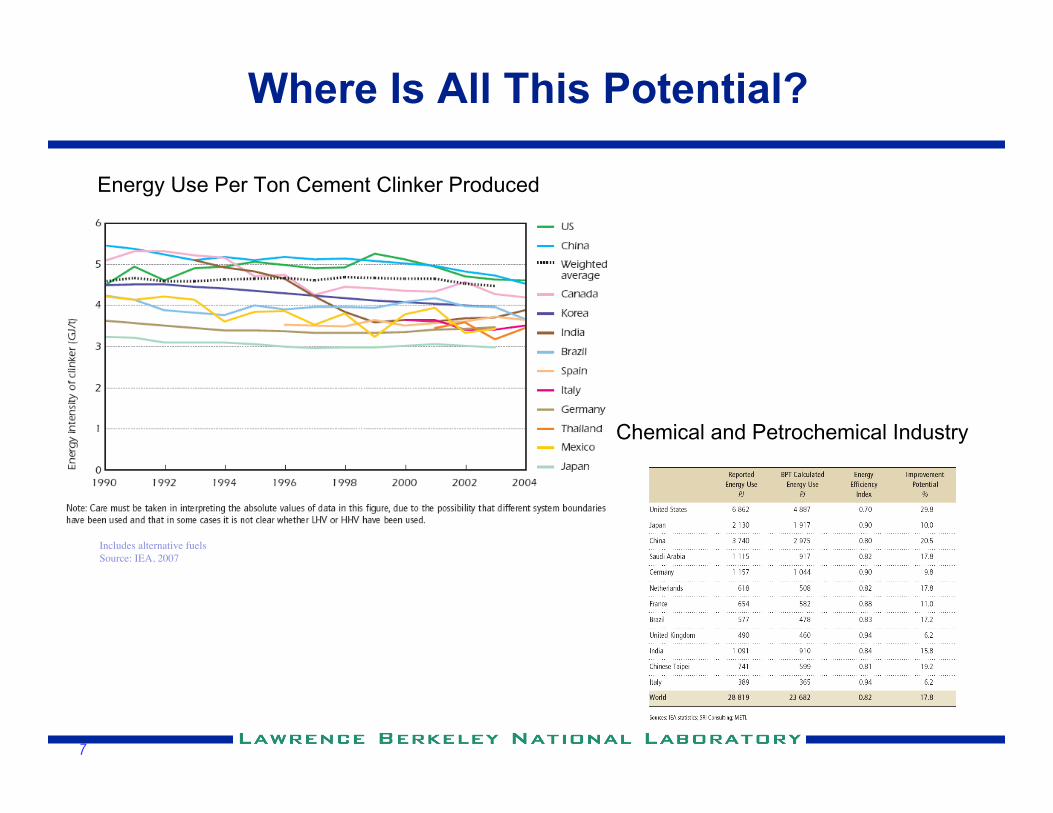
Where Is All This Potential?
Includes alternative fuelsSource: IEA, 2007
EnergyUsePerTonCementClinkerProduced
ChemicalandPetrochemicalIndustry
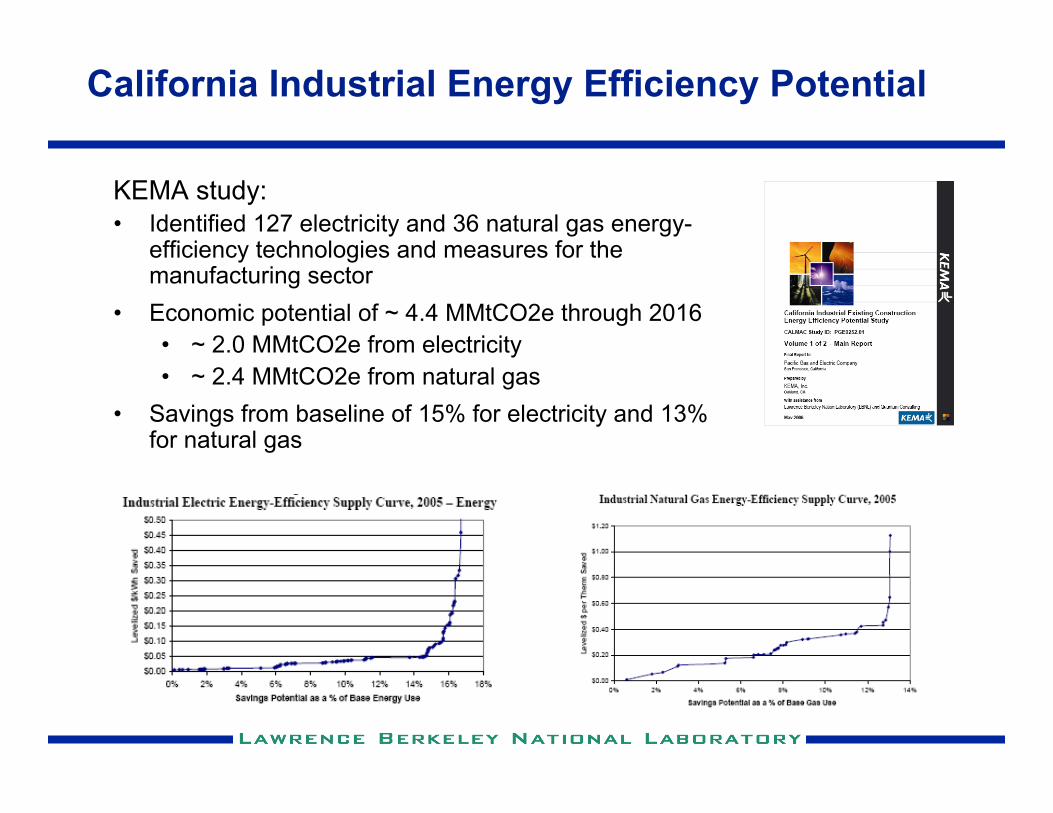
California Industrial Energy Efficiency Potential
KEMA study:• Identified 127 electricity and 36 natural gas energy-
efficiency technologies and measures for themanufacturing sector
• Economic potential of ~ 4.4 MMtCO2e through 2016• ~ 2.0 MMtCO2e from electricity• ~ 2.4 MMtCO2e from natural gas
• Savings from baseline of 15% for electricity and 13%for natural gas
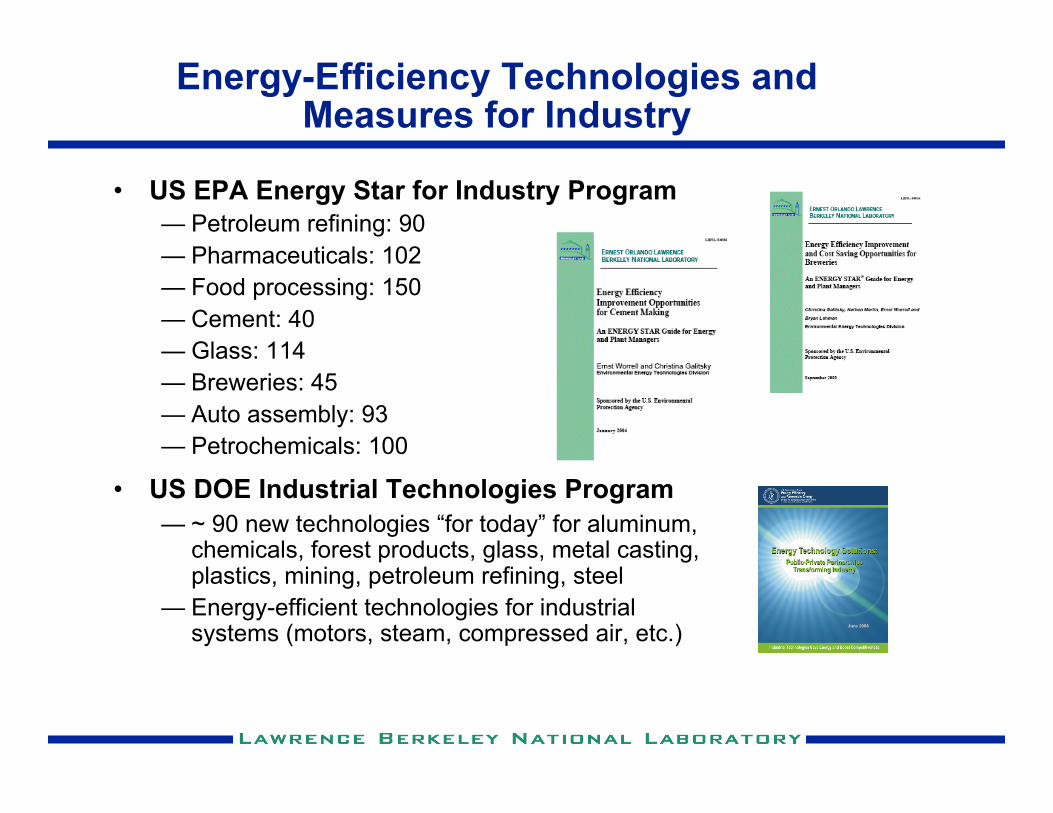
Energy-Efficiency Technologies andMeasures for Industry
• US EPA Energy Star for Industry Program— Petroleum refining: 90— Pharmaceuticals: 102— Food processing: 150— Cement: 40— Glass: 114— Breweries: 45— Auto assembly: 93— Petrochemicals: 100
• US DOE Industrial Technologies Program— ~ 90 new technologies “for today” for aluminum,
chemicals, forest products, glass, metal casting,plastics, mining, petroleum refining, steel
— Energy-efficient technologies for industrialsystems (motors, steam, compressed air, etc.)
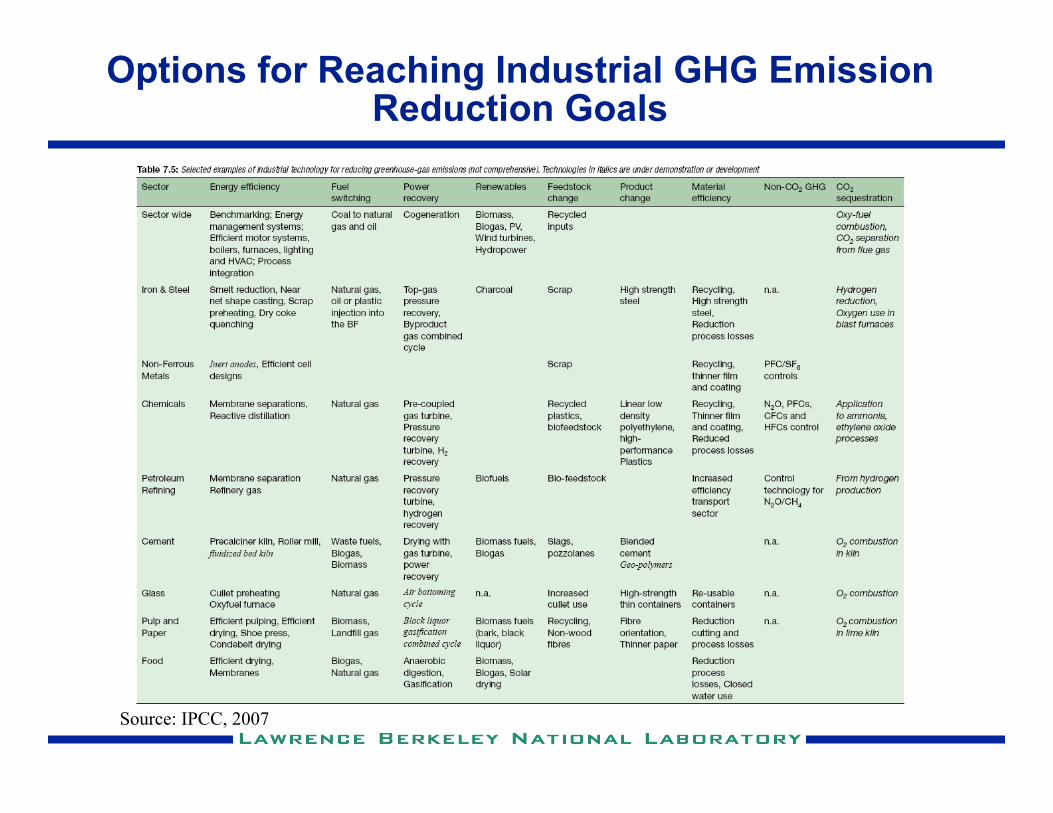
Options for Reaching Industrial GHG EmissionReduction Goals
Source: IPCC, 2007
Policies and Programs to Improve EnergyEfficiency and Reduce GHG Emissions
• Regulations/Standards• Energy or CO2 Taxes• Emissions Trading• Agreements/Target-Setting• Reporting• Benchmarking• Audits/Assessments• Information Dissemination and Demonstration
Industrial Energy Efficiency and GHG EmissionsReduction Programs
Target-setting programs• Industrial sector target-setting programs are common: over 20
national-level, target-based industrial sector programsidentified
• Range from voluntary to mandatory• Include targets for either industrial sub-sectors or industrial
facilities• Based on signed agreements committing upper management
to reaching targets• Some include energy or GHG taxes, some include emissions
trading• Supporting policies and programs are essential for assisting
industry in reaching targets
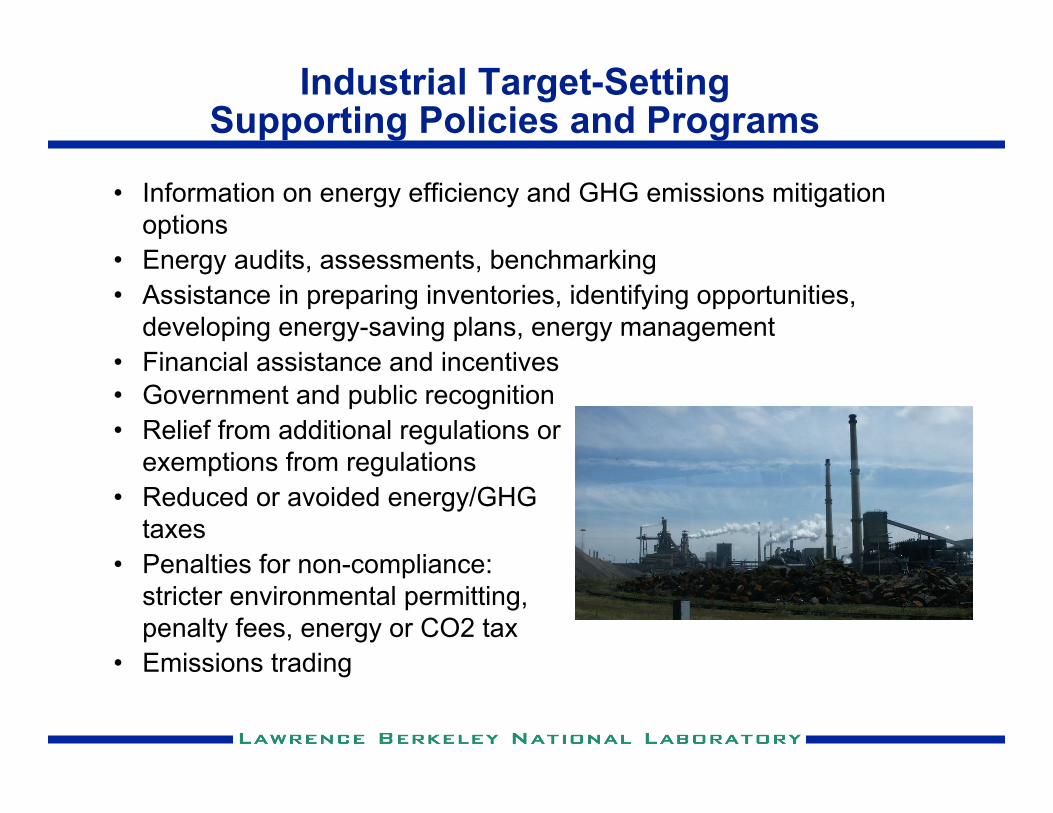
Industrial Target-SettingSupporting Policies and Programs
• Information on energy efficiency and GHG emissions mitigationoptions
• Energy audits, assessments, benchmarking• Assistance in preparing inventories, identifying opportunities,
developing energy-saving plans, energy management• Financial assistance and incentives• Government and public recognition• Relief from additional regulations or
exemptions from regulations• Reduced or avoided energy/GHG
taxes• Penalties for non-compliance:
stricter environmental permitting,penalty fees, energy or CO2 tax
• Emissions trading
Industrial Target-Setting Programs• Netherlands
• 20% energy efficiency improvement by 2000 (1989 baseline)• Long-Term Agreements: contracts between the Dutch Minister for
Economic Affairs and associations representing 29 industrial sectors(1250 firms) representing 90% of industrial energy consumption
• U.K.• 20% CO2 emissions reduction by 2010 (1990 baseline)• Climate Change Agreements: Government signed agreements with either
industrial sector associations or individual companies representing 44sectors (about 5,000 companies and 10,000 facilities) responsible for90% of energy-intensive industry
• China• 20% reduction of energy use per unit of GDP by 2010 (2005 baseline)• Top-1000 Energy-Consuming Enterprises: contracts between Provincial
governments and 1000 enterprises representing 48% of industrial energyconsumption and 30% of total energy consumption in China
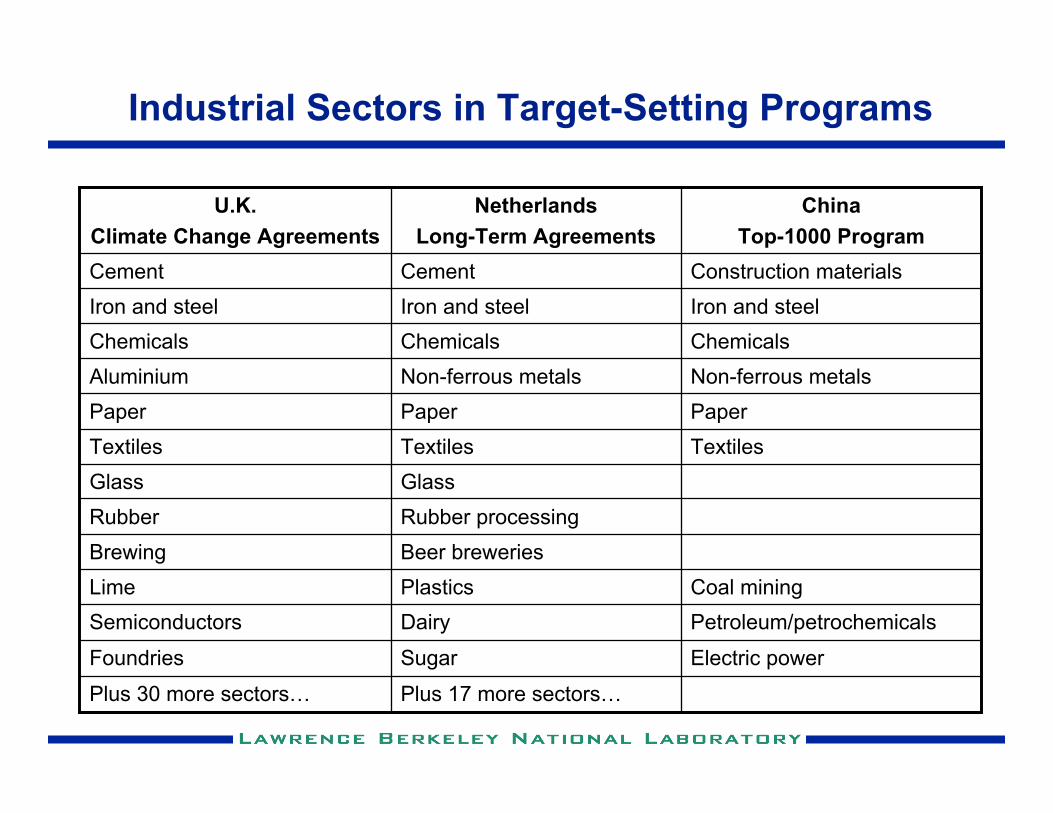
Industrial Sectors in Target-Setting Programs
Rubber processingRubberGlassGlass
Beer breweriesBrewing
Petroleum/petrochemicalsDairySemiconductors
Plus 17 more sectors…
Sugar
Plastics
TextilesPaperNon-ferrous metalsChemicalsIron and steelCement
NetherlandsLong-Term Agreements
Plus 30 more sectors…
Foundries
Lime
TextilesPaperAluminiumChemicalsIron and steelCement
U.K.Climate Change Agreements
Electric power
Coal mining
TextilesPaperNon-ferrous metalsChemicalsIron and steelConstruction materials
ChinaTop-1000 Program
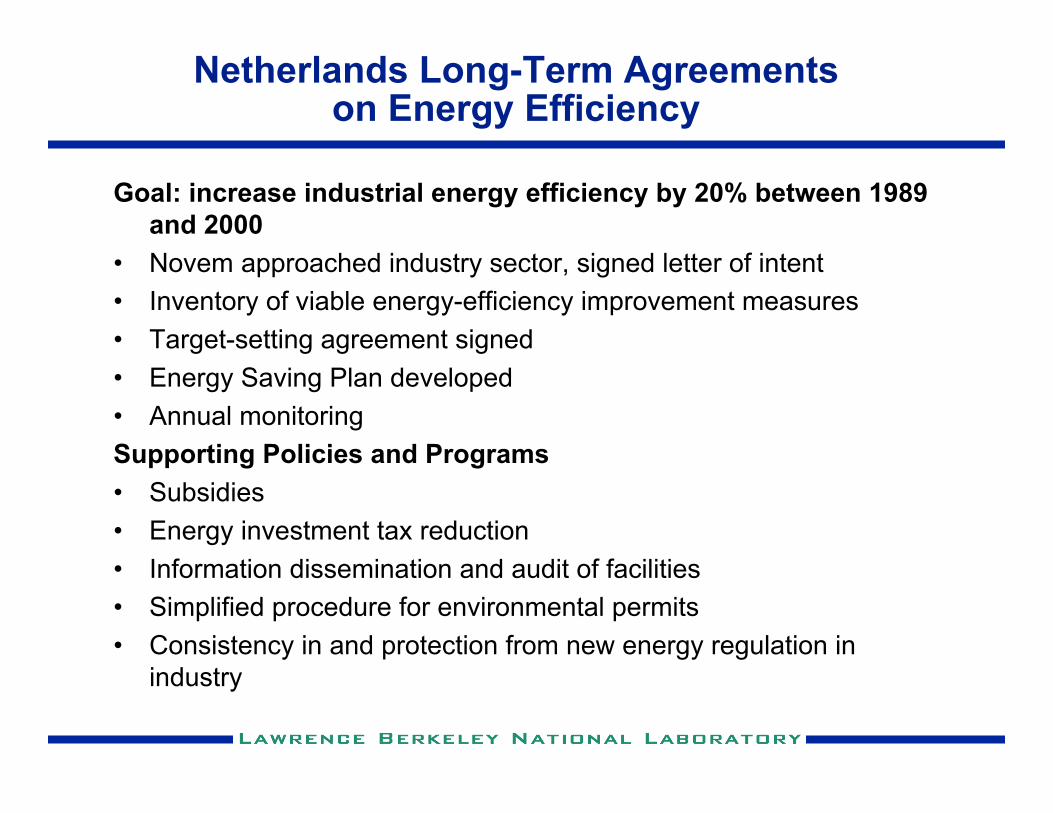
Netherlands Long-Term Agreementson Energy Efficiency
Goal: increase industrial energy efficiency by 20% between 1989and 2000
• Novem approached industry sector, signed letter of intent• Inventory of viable energy-efficiency improvement measures• Target-setting agreement signed• Energy Saving Plan developed• Annual monitoringSupporting Policies and Programs• Subsidies• Energy investment tax reduction• Information dissemination and audit of facilities• Simplified procedure for environmental permits• Consistency in and protection from new energy regulation in
industry
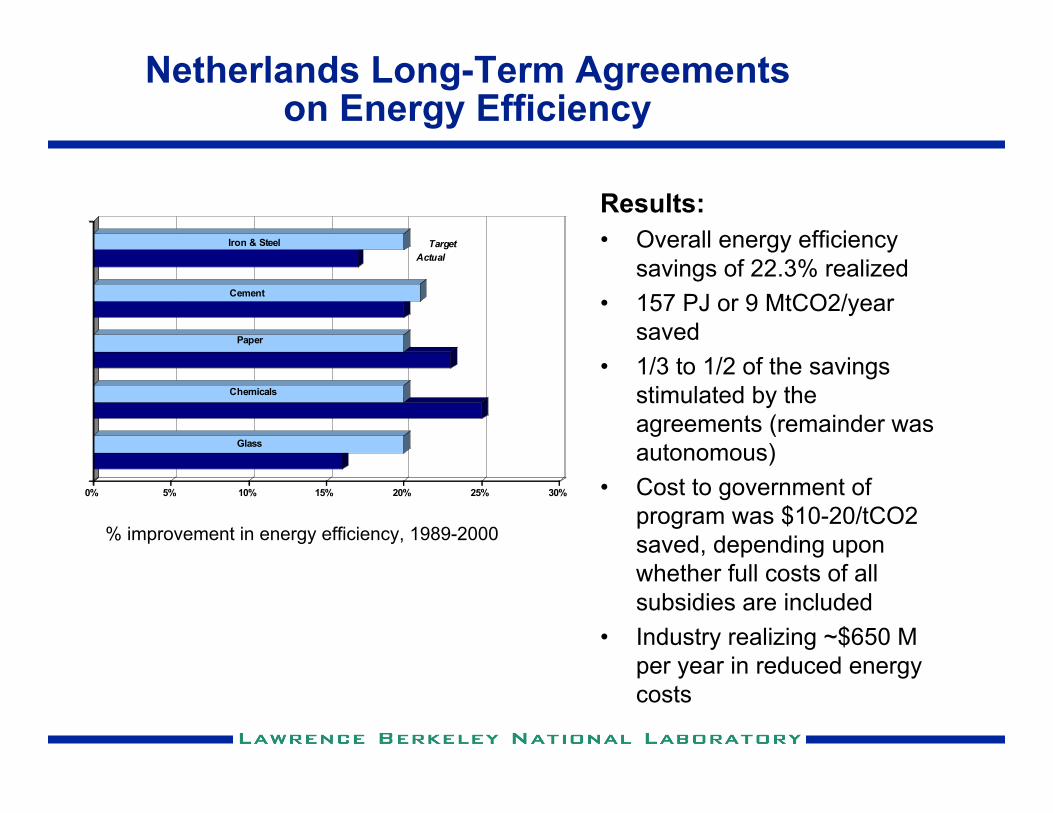
Netherlands Long-Term Agreementson Energy Efficiency
Results:• Overall energy efficiency
savings of 22.3% realized• 157 PJ or 9 MtCO2/year
saved• 1/3 to 1/2 of the savings
stimulated by theagreements (remainder wasautonomous)
• Cost to government ofprogram was $10-20/tCO2saved, depending uponwhether full costs of allsubsidies are included
• Industry realizing ~$650 Mper year in reduced energycosts
0% 5% 10% 15% 20% 25% 30%
Chemicals
Iron & Steel
Paper
Cement
Glass
Target
Actual
% improvement in energy efficiency, 1989-2000
UK Climate Change Agreements
Goal: 20% CO2 emissions reduction by 2010 (1990 baseline)• Climate Change Levy: tax on energy (natural gas, coal, LPG, electricity)• Companies that agree to and achieve GHG emissions reduction targets
receive an 80% Climate Change Levy discount• Company that does not enter into an agreement that does not reach its target,
must pay 100% of the energy taxSupporting Policies and Programs• Carbon Trust: an independent body to promote carbon reductions in industry
and commerce, advises industry through site visits, provides information andlow costs loans for energy efficiency projects
• Enhanced Capital Allowance Scheme: Business can claim 100% taxallowances on their capital spending on energy saving equipment (specified ina government list) against their taxable profits for the year during which theymake the investment
• Domestic Emissions Trading Scheme• “Light Touch” on energy efficiency regulation
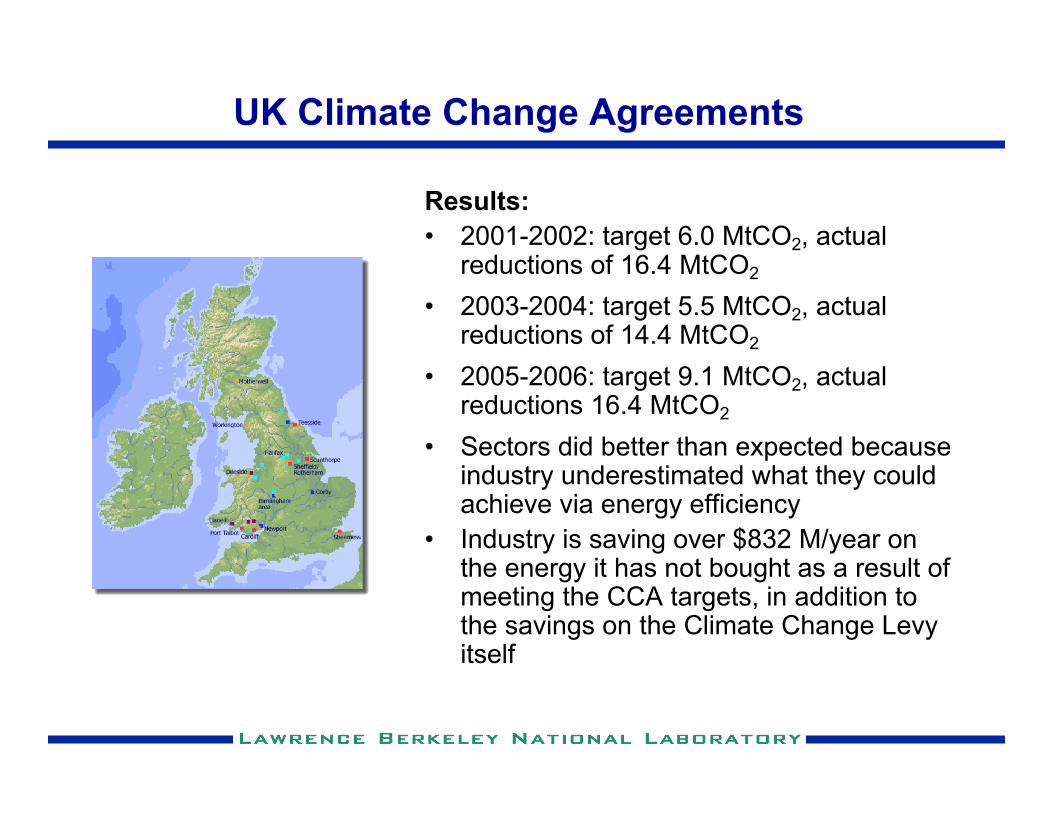
UK Climate Change Agreements
Results:• 2001-2002: target 6.0 MtCO2, actual
reductions of 16.4 MtCO2
• 2003-2004: target 5.5 MtCO2, actualreductions of 14.4 MtCO2
• 2005-2006: target 9.1 MtCO2, actualreductions 16.4 MtCO2
• Sectors did better than expected becauseindustry underestimated what they couldachieve via energy efficiency
• Industry is saving over $832 M/year onthe energy it has not bought as a result ofmeeting the CCA targets, in addition tothe savings on the Climate Change Levyitself
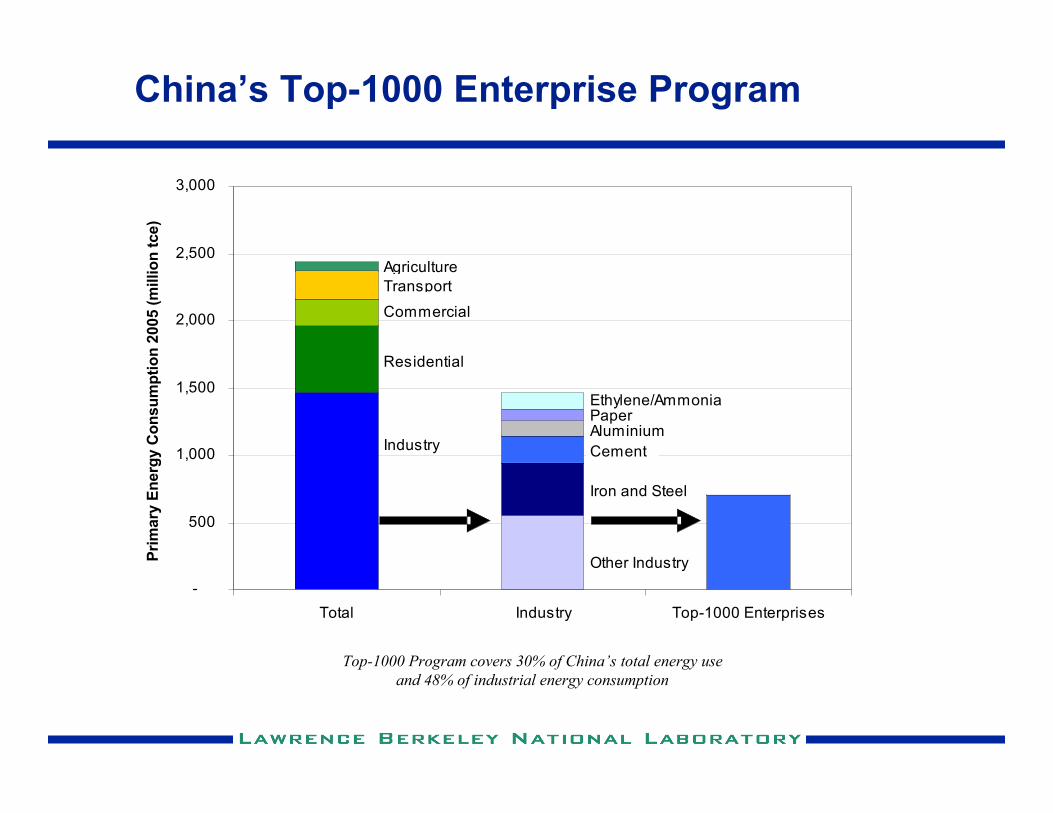
China’s Top-1000 Enterprise Program
-
500
1,000
1,500
2,000
2,500
3,000
Total Industry Top-1000 Enterprises
Pri
mary
En
erg
y C
on
su
mp
tio
n 2
005 (
millio
n t
ce)
Commercial
Residential
Transport
Industry
Agriculture
Other Industry
Ethylene/AmmoniaPaper
Cement
Iron and Steel
Aluminium
Top-1000 Program covers 30% of China’s total energy useand 48% of industrial energy consumption
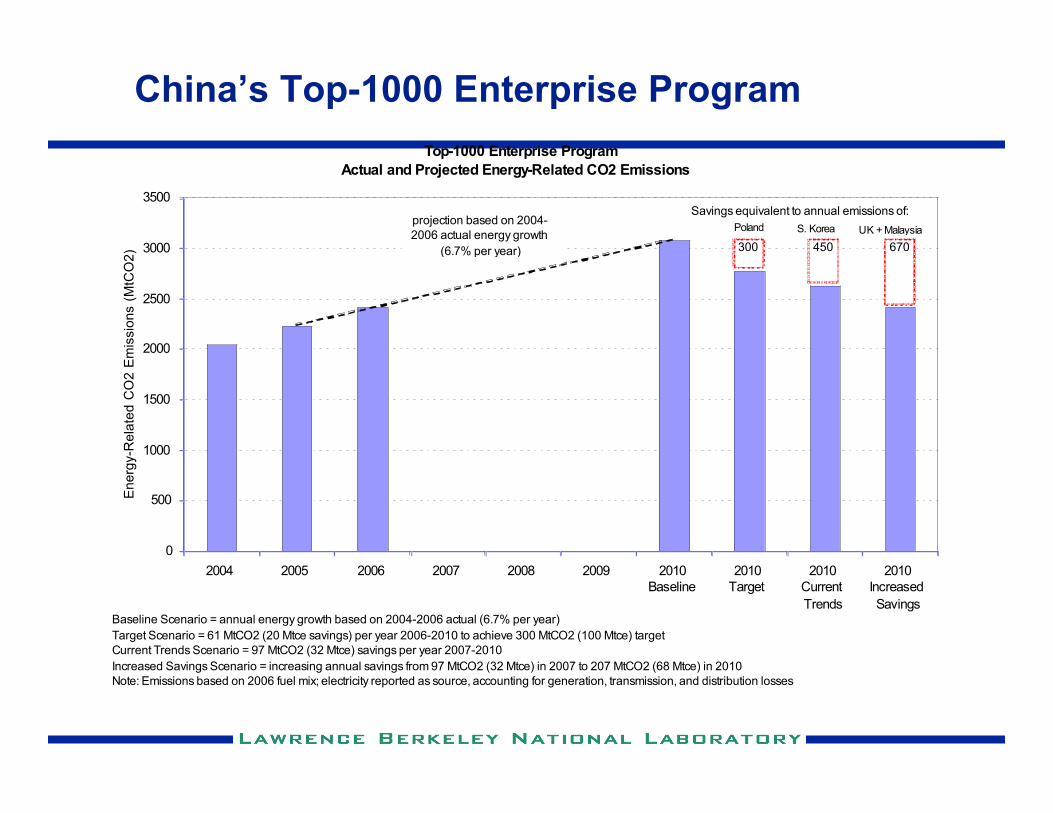
China’s Top-1000 Enterprise ProgramTop-1000 Enterprise Program
Actual and Projected Energy-Related CO2 Emissions
0
500
1000
1500
2000
2500
3000
3500
2004 2005 2006 2007 2008 2009 2010
Baseline
2010
Target
2010
Current
Trends
2010
Increased
Savings
En
erg
y-R
ela
ted
CO
2 E
mis
sio
ns (
MtC
O2
)
Baseline Scenario = annual energy growth based on 2004-2006 actual (6.7% per year)
Target Scenario = 61 MtCO2 (20 Mtce savings) per year 2006-2010 to achieve 300 MtCO2 (100 Mtce) target
Current Trends Scenario = 97 MtCO2 (32 Mtce) savings per year 2007-2010
Increased Savings Scenario = increasing annual savings from 97 MtCO2 (32 Mtce) in 2007 to 207 MtCO2 (68 Mtce) in 2010
Note: Emissions based on 2006 fuel mix; electricity reported as source, accounting for generation, transmission, and distribution losses
projection based on 2004-
2006 actual energy growth
(6.7% per year)
Savings equivalent to annual emissions of:
Poland
300
S. Korea
450
UK + Malaysia
670
Corporate GHG Mitigation Targets
• DuPont—65% reduction in GHG emissions below 1990 levels by 2010—$2 billion in savings since 1990
• 3M—Since 2000, 3M has challenged 150 company sites to reduce
their energy consumption 4% annually—Exceeded that goal each year, avoiding more than $190 million
in costs
• Dow Chemical Company—1994 to 2005 target: reduce energy intensity 20% - actual
achievement: 22% = $4 billion savings—2005 to 2015: reduce energy intensity by 25% (2004 base
year)
Conclusions
• No “silver bullet” – there are hundreds of emission reductiontechnologies and measures for industry
• Implementation of mitigation measures is key issue –industry excels at producing specific commodities, not at savingenergy or reducing GHG emissions
• Many policies and programs - comprehensive programs areneeded to assist industries in reaching their goals
• Target-setting can provide motivation - experience from othercountries and companies shows that target-setting with explicitcommitments can result in significant savings
Contact Information
Lynn PriceChina Energy Group
Energy Analysis DepartmentEnvironmental Energy Technologies Division
Lawrence Berkeley National Laboratory1 Cyclotron Road, MS 90R4000
Berkeley, CA 94720510-486-6519
industrial-energy.lbl.gov
Sources
• de la Rue du Can, S. and Price, L., in press. “Sectoral Trends in Global Energy Use andGreenhouse Gas Emissions, “ Energy Policy.
• Intergovernmental Panel on Climate Change, 2007. Climate Change 2007: Mitigation ofClimate Change. Cambridge University Press.
• International Energy Agency, 2007. Tracking Industrial Energy Efficiency and CO2Emissions. Paris: IEA.
• KEMA, with assistance from Lawrence Berkeley National Laboratory and QuantumConsulting 2006. California Industrial Existing Construction Energy Efficiency PotentialStudy. Oakland, CA: KEMA.
• Murtishaw, S., Price, L, de la Rue du Can, S., Masanet, E., Worrell, E., and Sathaye, J.,2005. Development of Energy Balances for the State of California. Sacramento, CA:California Energy Commission (500-2005-068).
• National Bureau of Statistics, 2005. China Statistical Yearbook 2004. Beijing: NBS.• Price, L., de la Rue du Can, S., Sinton, J., and Worrell, E., Zhou, N., Sathaye, J., and
Levine, M., 2006. Sectoral Trends in Global Energy Use and Greenhouse Gas Emissions.Berkeley, CA: Lawrence Berkeley National Laboratory (LBNL-56144).
• Price, L. and Wang, X., 2007. “Constraining Energy Consumption of China’s LargestIndustrial Enterprises Through the Top-1000 Energy-Consuming Enterprise Program,”Proceedings of the 2007 ACEEE Summer Study on Energy Efficiency in Industry.Washington, DC: American Council for An Energy-Efficient Economy (LBNL-62874).
• U.S. Energy Information Administration, 2007. Annual Energy Outlook 2007.http://www.eia.doe.gov/oiaf/archive/aeo07/pdf/appendixes.pdf