Embed Size (px)
Citation preview
8/3/2019 Tata Power 040310
http://slidepdf.com/reader/full/tata-power-040310 1/23
Tata Power Co. Ltd.
4 th
Mar, 2010
Mata Securities India Pvt. Ltd 1
On Robust Growth Path BuyTata Power Co. Ltd is India’s leading private sector integrated power
utility company with presence in power generation, transmission and
distribution, power trading and coal mining. The company has major
expansion plans over the next few years which would sustain the
company’s status as the major power sector player in the country. The
diversified business model provides the company value accretion from
the various segments as well as provides it the capability to take
advantage of the in cyclicality in various segments.
HIGHLIGHTS
Expansion Plans on Track: Tata Power has ambitious
capacity expansion plans to raise its installed power generation
capacity from 2791 MW to 8242 MW by FY’13. The company has
an excellent track record in the timely execution of the power
plants’ construction. The construction of the major plants viz.,
Mundra Ultra Mega Power Plant of 4000 MW capacity and
Maithon Power Plant of 1050 MW are progressing ahead of the
schedule and are expected to contribute significantly to the
overall power generation of the country. The company in FY’09
generated 14,807 MUs while the Mundra UMPP alone would
generate 29,784 MUs per annum assuming a PLF of 85% while
Maithon plant is expected to contribute 7818MUs of power (at
85% PLF), reflecting the high growth potential of the company.
Value Accretion from Coal Mining: Tata Power has 30%
stake in the Indonesian coal mine KPC and Arutmin which
during CY’08 generated 53mn tones of coal at the average
realization of $70 per tonne. The stake in the Indonesian coal
mines provides a significant contribution to the revenue growth
of the company. The Indonesian coal mines have the target of
raising the production level to 111mn tonnes by 2012 which
would provide quantum jump to the revenue and profitability
of the company.
Ensured Fuel Security: The timely fuel supply is a major
concern for the efficiency of the power plants in the country.
The company has not only secured fuel supply contracts until
2014 for the existing power plants, it has also ensured fuel
supply for its upcoming power projects. The Mundra UMPP has
been ensured an annual supply of 10.11mn tonnes of coal from
the KPC and Arutmin coal mines in which it has 30% stake
which also offers the company pricing benefit.
CMP: Rs.1335
Target: Rs.1610
Analyst Madhav Bhardwaj
022‐2264 2634
Sensex 17000
Nifty 5088
Stock Data
Equity Cap Rs.221.4 cr
Face Value Rs.10
Market Cap. Rs.31427cr
Avg. Vol.
(2 week)
0.71 lacs
High
Rs.1518.6
52 wk Low Rs.602
EPS
(St. Tr 4Q)
Rs.47.5
DPS Rs.11.6
P/E 28.1
P/B 3.41
Share Holding Pattern (%)
Promoter 31.06%
MFs/FIs/Banks 7.63%
FIIs 18.26%
Bodies Corporate 0.72%
Ins. Cos. 20.08%
Public 22.25%
As on 31st Dec’09
Increasing Customer Base in Mumbai LA: The Supreme
Court in its judgment in July’08, upheld Tata Power’s rights to
supply power to retail consumers in Mumbai Licence Area,
irrespective of consumption limits. The company is increasing
its customer base after the decision.

8/3/2019 Tata Power 040310
http://slidepdf.com/reader/full/tata-power-040310 2/23
Tata Power Co. Ltd.
Mata Securities India Pvt. Ltd 2
VALUATION
Tata Power’s
diversified
business
model
provides
it
the
value
accretion
from its various segments. We have valued the stock on the SOTP basis
and the fair value of the stock as per the valuation is Rs.1609.8. The
prospects of the standalone business remain to be encouraging with the
increasing contribution from the increasing customer base as well as the
merchant power capacity. The major contributors to the fair value of the
company are also its upcoming Mundra UMPP and Maithon Power
plant as well as its stake in the Indonesian coal mines. The investments
made by the company in the telecom companies, i.e., Tata teleservices
Ltd, Tata Communications Ltd and Tata Teleservices Maharashtra Ltd
are also major contributors to the embedded value of the company.
The SOTP valuation of the stock gives the fair value of the stock as
Rs.1,610.
S.N. Segment Stake Valuation Method Rs/Share
1 Tata Power Standalone 100% DCF 632.8
2 Mundra UMPP 100% DCF 205.1
3 Maithon Thermal Plant 74% DCF 50.7
4 IEL Jojobera 74% DCF 11.0
5 IEL Jamshedpur 74% DCF 10.6
6 Coal Mining JV 30% DCF 350.5
7 Powerlinks 51% 2 * FYʹ12 BV 23.9
8 NDPL 51% 2 * FYʹ12 BV 55.6
9 Tata Power Trading Co. 100% 5 * FYʹ12 EPS 34.9
10 Telecom Investments 30% Discount to Valuation 234.7
Total 1,609.8
At the current market price of Rs.1,335 as on 3rd March’10, the stock trades at a PE of 28.1x
based on 4Q Trailing EPS of Rs.47.5. The stock is expected to achieve the target of Rs.1,610
over the next 12‐15 months. We initiate the coverage on the stock with the ‘Buy’
recommendation.
8/3/2019 Tata Power 040310
http://slidepdf.com/reader/full/tata-power-040310 3/23
Tata Power Co. Ltd.
Mata Securities India Pvt. Ltd 3
COMPANY PROFILE
Emergence from a hydro power producer to a diversified player
Executing 5242mw power generating capacities
Track record of timely project execution
Tata Power Co. Ltd. was established in 1919 after the merger of the Tata
Hydroelectric
Power
supply
Co.
and
Andhra
Valley
Power
Supply
Co.
The company commissioned its first power plant, a hydro electric power
plant in Khopoli of capacity 72MW in 1915. It established the second
hydro station in Bhivpuri (75 MW) in 1919 and third one in Bhira (300
MW) in 1922. In 1960, the company set up its 1,350 MW thermal power
plant in Trombay followed by a 475 MW power plant near Jamshedpur
in Jharkhand and 87 MW thermal power plant in Belgaum. The
company later entered the transmission and distribution business in the
Mumbai. The company is now present in all the segments of the power
sector viz., generation, distribution, transmission and power trading.
The company has major expansion plans in terms of the new capacities
aggregating 5,451MW as of now, which are expected to be
commissioned by the end of FY’13. The company has the track record of achieving the timely execution of the power projects which provides
high visibility for achieving high power generation volume growth over
the next few years.
The company has also acquired 30% stake in the Indonesian coal mines
which would not only ensures the fuel supply for the company’s
upcoming Mundra UMPP but also provides the revenue upside for the
company with the high growth expected in the coal production from the
coal mines over the next few years as well as the upside in the selling
price of the coal in the international markets.
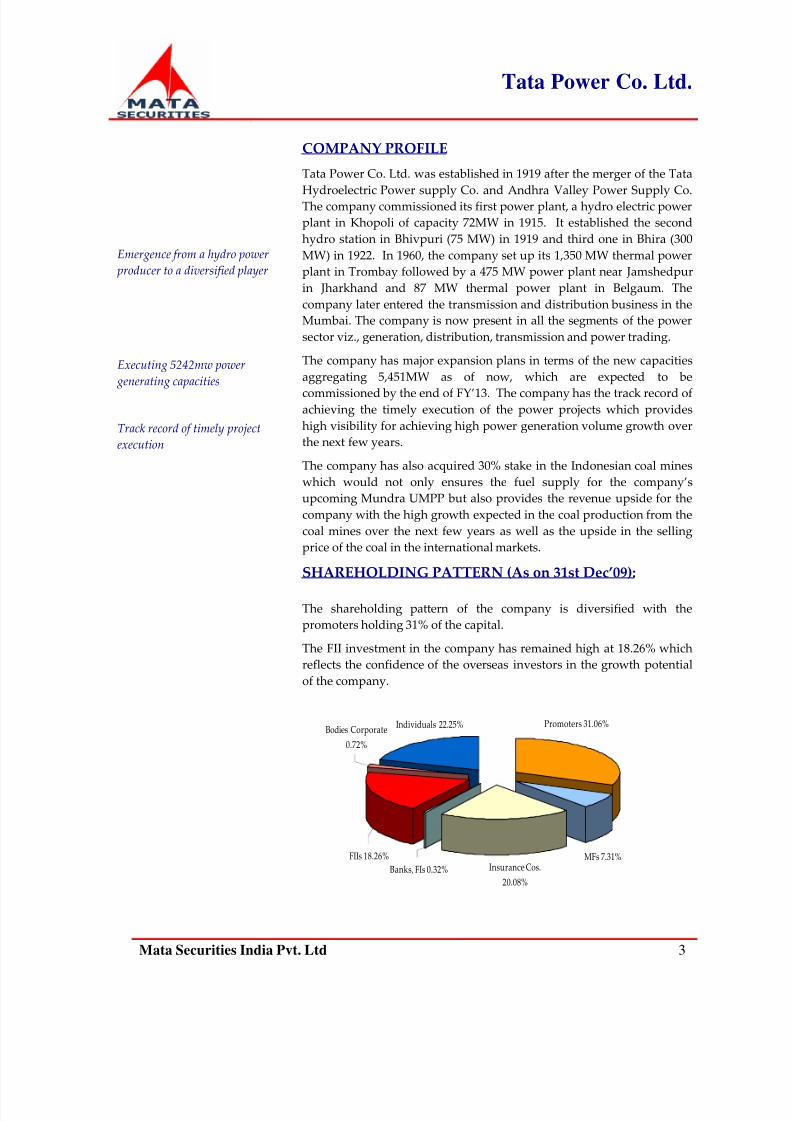
SHAREHOLDING PATTERN (As on 31st Dec’09):
The shareholding pattern of the company is diversified with the
promoters holding 31% of the capital.
The FII investment in the company has remained high at 18.26% which
reflects the confidence of the overseas investors in the growth potential
of the company.
Individuals 22.25%Bodies Corporate
0.72%
FIIs 18.26%
Banks, FIs 0.32% Insurance Cos.
20.08%
MFs 7.31%
Promoters 31.06%

8/3/2019 Tata Power 040310
http://slidepdf.com/reader/full/tata-power-040310 4/23
Tata Power Co. Ltd.
Mata Securities India Pvt. Ltd 4
CORPORATE STRUCTURE:
Tata Power
Subsidiaries Vs and Associates Investments
Coastal Gujarat
Power Ltd
Tata Power Trading
Co. Ltd
Trust EnergyResources Pvt. Ltd.
Maithon Power Ltd
Industrial Energy
Ltd.
North Delhi Power
Ltd
Powerlinks
Transmission Ltd.
Nelco Ltd.
Tata BP Solar
Ltd.
Tubed Coal
Mine Ltd.
Mandakini
Coal Mine Ltd.
TTML
Arutmin
30%
30%
33%
30%
30%
100%
100%
100%
74%
74%
51%
51%
50%
TTSL
Panatone
KPC
Tata Comm.
Dagachhu
Exergen
Geodynamics
40%
49%
26%
5%
10%
Indocoal30%
30%
30%

8/3/2019 Tata Power 040310
http://slidepdf.com/reader/full/tata-power-040310 5/23
8/3/2019 Tata Power 040310
http://slidepdf.com/reader/full/tata-power-040310 6/23
Tata Power Co. Ltd.
Mata Securities India Pvt. Ltd 6
Capacity Mix
Wind
7%
Thermal
78%
Hydro
15%
Electricity Generation (FYʹ09)
Mumbai
License
Area, 67%
Hydro, 8%
Belgaum,
3% Jamshedur
21%
Wind, 1%
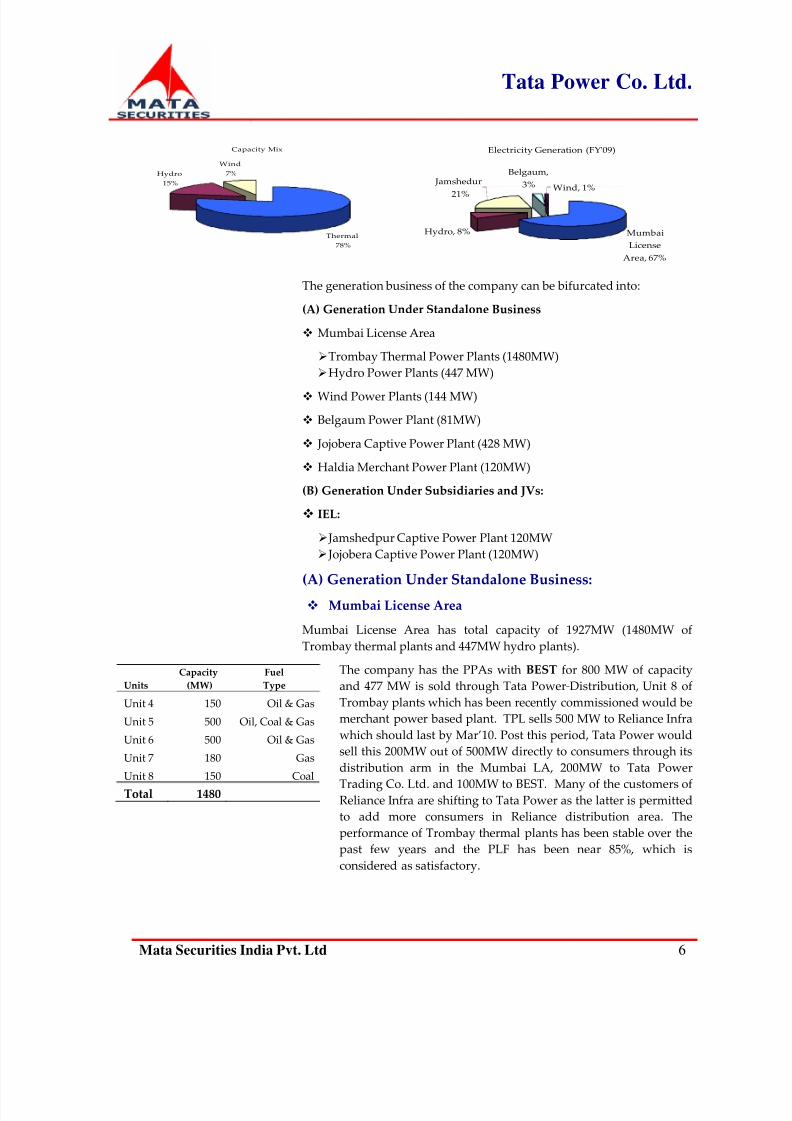
The generation business of the company can be bifurcated into:
(A) Generation Under Standalone Business
Mumbai License Area
Trombay Thermal Power Plants (1480MW)
Hydro Power Plants (447 MW)
Wind Power Plants (144 MW)
Belgaum Power Plant (81MW)
Jojobera Captive Power Plant (428 MW)
Haldia Merchant Power Plant (120MW)
(B) Generation Under Subsidiaries and JVs:
IEL:
Jamshedpur Captive Power Plant 120MW
Jojobera Captive Power Plant (120MW)
(A) Generation Under Standalone Business:
Mumbai License Area
Mumbai License Area has total capacity of 1927MW (1480MW of
Trombay thermal plants and 447MW hydro plants).
Units
Capacity
(MW)
Fuel
Type
Unit 4 150 Oil & Gas
Unit 5 500 Oil, Coal & Gas
Unit 6 500 Oil & Gas
Unit 7 180 Gas
Unit 8 150 Coal
Total 1480
The company has the PPAs with BEST for 800 MW of capacity
and 477 MW is sold through Tata Power‐Distribution, Unit 8 of
Trombay plants which has been recently commissioned would be
merchant power based plant. TPL sells 500 MW to Reliance Infra
which should last by Mar’10. Post this period, Tata Power would
sell this 200MW out of 500MW directly to consumers through its
distribution arm in the Mumbai LA, 200MW to Tata Power
Trading Co.
Ltd.
and
100MW
to
BEST.
Many
of
the
customers
of
Reliance Infra are shifting to Tata Power as the latter is permitted
to add more consumers in Reliance distribution area. The
performance of Trombay thermal plants has been stable over the
past few years and the PLF has been near 85%, which is
considered as satisfactory.

8/3/2019 Tata Power 040310
http://slidepdf.com/reader/full/tata-power-040310 7/23
Tata Power Co. Ltd.
Mata Securities India Pvt. Ltd 7
9180
100029845
8600
8800
9000
9200
9400
9600
9800
10000
10200
M U s
FYʹ07 FYʹ08 FYʹ09
Generation
93%
79%
95%
86%91%
84%
0%
20%
40%
60%
80%
100%
FYʹ07 FYʹ08 FYʹ09
Performance of Thermal Plants‐Trombay
PAF PLF
Hydro Power Plants 447MW):
The company has three hydroelectric power generating stations
with aggregate capacity of 447MW, situated in the Raigad
district of Maharashtra, Khopoli (72MW), Bhivpuri (75 MW) and
Bhira (300 MW). The hydel power plants are amongst the oldest
in the country.
The Krishna Water Dispute Tribunal Award determines the
amount of water that is available for power generation. So, even
though the plant availability is high, the PLF of the plant has
been low.
2138
1489
1151
0
500
1000
1500
2000
2500
M U s
FYʹ07 FYʹ08 FYʹ09
Generation ‐ Hydro Power Plants
98%
60%
99%
38%
95%
29%
0%
20%40%
60%
80%
100%
FYʹ07 FYʹ08 FYʹ09
Performance of Hydro Power Plants
PAF PLF
Wind Power Plants:
The company has a total installed capacity of 193MW in the wind
power segment. During FY’09, the company added 80.6MW of
capacity including 36 MW at Gadag (Karnataka), 29.6 MW at Samana
(Gujarat) and 15 MW at Sadawaghapur (Maharashtra). Out of the
total capacity 99MW is located in Maharashtra, 50 MW in Gujarat and
44 MW in Karnataka.
The power generated was 177 MUs in FY’09 by these wind farms as
against 127 MUs during FY’08. The wind power plants usually
operate at the PLF of about 20%. The major customers of the wind
power are BESCOM in Karnataka and GUVNL (Gujarat Urja Vikas
Nigam Ltd.) in Gujarat. In Maharashtra, the company sells power
from wind power plants through PPA with Tata Power Co.‐
Distribution.

8/3/2019 Tata Power 040310
http://slidepdf.com/reader/full/tata-power-040310 8/23
Tata Power Co. Ltd.
Mata Securities India Pvt. Ltd 8
Belgaum Thermal Power Plant:
Belgaum (Karnataka) thermal power plant of the company has a total
installed capacity of 81 MW. The plant runs on heavy fuel oil. The
major customer of the power from the plant is Karnataka Power
Transmission Corporation Ltd. (KPTCL) which buys power under
PPA valid till 2012. The PLF of the plant improved significantly to
63% during FY’09 as compared to 33% in FY’08.
Jojobera Thermal Power Plant:
The power plant in Jojobera, Jharkhand, has a capacity of 428 MW
through four coal fired units. The plants run on domestic coal. The
plant operates for the captive use by Tata Steel. During FY’09, the
plant operated at a PLF of 80% as compared to a PLF of 76% during
FY’08.
Haldia Merchant Power Plant:
Haldia plant has a total capacity of 120 MW. The plant has PPA
with Tata Power Trading Co. Ltd. The fuel for the plant is the hot flue
gases from Hoogly Metcoke.
(B) Generation Outside Standalone Business:
The company has entered into a 74:26 JV with Industrial energy Ltd.
(IEL) for setting up of two captive power plants.
Jamshedpur Power House 6:
A 120 MW capacity power plant is being constructed at Tata Steel
Works,
Jamshedpur
for
captive
use
of
Tata
Steel
and
the
coke
oven
gases of Tata Steel as fuel. The total cost of the project is Rs.490cr.
The plant would utilize waste blast furnace and it has been
commissioned in May’09.
Jojobera Unit 5:
Tata Power is also setting up a 120 MW power plant at Jojobera at a
total cost of Rs.620cr. The plant would have the coal linkages with the
West Bokaro and Mahanadi Coal fields. The plant is expected to be
commissioned in Q4FY’10.
II. Transmission and Distribution:
(A) T&D Under
Standalone
Business:
T&D Under Mumbai License Area
(B) T&D Outside Standalone Business: North Delhi Power Ltd
Powerlinks Transmission Ltd
(A) T&D Under Standalone Business – Mumbai License Area
The Company supplies power directly to bulk consumers such as
Central and Western Railways, Mumbai Port, refineries, textile mills,

8/3/2019 Tata Power 040310
http://slidepdf.com/reader/full/tata-power-040310 9/23
Tata Power Co. Ltd.
Mata Securities India Pvt. Ltd 9
Major T&D service provider in Mumbai License area
fertilizer factories, BARC, Municipal Corporation water pumping plants
and other major continuous processes industries requiring
uninterrupted power supply. The latest addition to the list is the
commercial district at the Bandra‐Kurla Complex and major commercial and residential complexes in the suburbs.
Tata Power had 25,400 customers with 2,468 MUs of electricity sold in
Mumbai LA during FY’09. It has 17 receiving and distribution stations,
318 consumer substations and 1335 kms of HT and LT cable network in
the Mumbai License area. The company has around 1,100 ckm of power
cable network comprising of 973 ckm of 220 kV/ 110 kV overhead lines
and 124 ckm of 220 kV/ 110 kV underground cables.
SC order
to
benefit
Tata
Power
Earlier, Tata Power was not allowed to add customers in the Mumbai
License Area. The Supreme Court in its judgment in July’08, upheld
Tata Power’s rights to supply power to retail consumers in Mumbai
Licence Area,
irrespective
of
their
consumption
limits.
The company is increasing its customer base significantly after this
decision and plans to develop the infrastructure for the retail supply. As
for the transmission business, the company plans new transmission lines
for increasing the load capacity and to add 1000 MVA transformer
capacity and upgrade the system to 400 kV.
(B) T&D Outside Standalone Business:
New Delhi Power Ltd.:
NDPL became a subsidiary of the company from Jan’08. NDPL
registered a revenue of Rs.2,479cr for FY’09 as against
Rs.2,278cr for
FY’08,
a YoY
growth
of
8.8%.
The
AT&C
losses
have been reduced from about 23.7% as at the end FY’07 to
10.5% for FY’09. The subsidiary has over 1mn customers with a
total of over 5,000MUs of power consumption.
Powerlinks Transmission Ltd.
The JV with Power Grid Corporation of India Ltd. is operating
and maintaining the 1200kms and 400 kV double circuit
transmission lines from Tala Hydroelectric Project in Bhutan to
New Delhi. The subsidiary earned revenue of Rs.279cr for
FY’09 as against Rs.245cr for FY’08.
III. Power Trading ‐ Tata Power Trading Co. Ltd.
Tata Power Trading Co. Ltd traded about 3,000 MUs during FY’09 as
compared to 1,711 MUs in the previous year. The revenue earned
registered a growth of 145.3% for FY’09 to Rs.2,167cr as compared to
Rs.883.5cr the previous year.

8/3/2019 Tata Power 040310
http://slidepdf.com/reader/full/tata-power-040310 10/23
Tata Power Co. Ltd.
Mata Securities India Pvt. Ltd 10
IV. Coal Mining Stake:
Tata Power has taken significant interest in owning the coal assets in
order to
ensure
the
fuel
supplies
for
its
power
business.
The
coal
mining
business of the company may be classified into:
Stake in Coal Blocks in India
Mandakini Coal Co. Ltd.
Tubed Coal Blocks
Stake in Indonesian Coal Mines
KPC
Arutmin
Captive Coal Blocks in India:
Mandakini Coal Co. Ltd.: Mandakini coal block, located in the Angul
district of Orissa, has been allocated to a JV of the company along‐
with Monnet Ispat & Energy Ltd. and Jindal Photo Ltd. The
company’s share is 33%. The block is estimated to have the reserves
of 291mn tonnes and 7.5 MTPA may be mined from the block (Tata
Power’s share – 2.5 MTPA). The company’s share of the mined coal is
estimated to provide sufficient fuel for a 1,000 MW thermal power
plant. The coal production from the block is expected to start by
FY’12.
Tubed Coal Blocks: The company also has a 40% stake in its JV with
Hindalco and Tubed Coal Mines Ltd for the Tubed Coal Blocks. The
block is located in Latehar, Jharkhand and has estimated reserves of
120mn tonnes.
5.75million
tones
is
estimated
to
be
mineable
per
year
from the block; out of which, Tata Power would have the share of 2.3
MTPA (40%). The coal production from the block is expected to start
by FY’13.
Stake in Indonesian Coal Mines:
Tata Power acquired 30% stake in the KPC and Arutmin coal mines in
2007. The production during Jan’09 to June’09 was 27mn tonnes while
the average selling price was $66 per tonne. The mines have the target
to raise the coal production upto 111mn tonnes by 2012.
Tata Power has 30% stake in Bumi Resources of Indonesia. Bumi’s coal
mining operations are conducted by its two mining subsidiaries, Kaltim
Prima Coal (KPC) and Arutmin located in East and South Kalitman,
Indonesia. The key markets for the mines are whole of Asia, Europe and
South America.
KPC and Arutmin together commanded over 28% of the market share of
the Indonesian coal production in 2007 and together constituted the
second largest coal exporter globally. KPC exported about 87% while
Arutmin shipped 92% of its coal production.

8/3/2019 Tata Power 040310
http://slidepdf.com/reader/full/tata-power-040310 11/23
Tata Power Co. Ltd.
Mata Securities India Pvt. Ltd 11
Superior Coal Quality:
The mineable coal at the KPC and Arutmin coal mines is of high
quality as reflected by the high calorific value of the coal as well as
the low sulphur content and low moisture. The high quality of the
coal is expected to result in the sustainable demand for the coal of the
mines as well as the high realization for the coal.
Operating
Mines
Calorific Value
(KCal/kg)
Total
Sulphur (%)
Total
Moisture (%)
Ash
(%)
Sangatta
Prima 7,100 0.70% 10.50% 4.00%
Pinanag 6,290 0.50% 17.00% 3.50%
Melawan 5,690 0.30% 23.00% 2.50% KPC
Bengalon 6,230 0.90% 14.00% 4.50%
Senakin 6,700 0.80% 11.00% 12.00%
Satul 6,800 0.80% 10.00% 8.00%
Mulia Asam‐asam 5,000 0.20% 35.00% 3.90%
Arutmin
Batullicin 6,600 1.40% 9.00% 12.00%
Source: KPC and Arutmin
Significant Coal Reserves:
KPC and Arutmin coal mines have coal reserves and resources of 9.49
billion tonnes which are sufficient to provide revenue visibility for
many more years to come. The slow growth in production during
2009 was on account of unusually heavy rains and equipment
delivery delays which created major bottlenecks. The decline in the
realization is on account of the decline in the fuel prices at the global
level in view of the ongoing economic constraints. However, given
the superior quality of the coal, the demand for the coal in the mines
of KPC and Arutmin would improve with the recovery in the
economic activity as well the realizations.
In million tonnes Coal Reserves Coal Resources Total
KPC
Sangatta 160 3,447 3,607
Melawan 337 ‐ 337
North Pinang 920 ‐ 920
Begalon 146 977 1,123
Total (KPC)
1,563
4,424
5,987
Arutmin
Senakin 43 411 454
Satui 84 269 353
Batulicin 25 216 241
Sub Bituminous 407 2,047 2,454
Total (Arutmin) 559 2,943 3,502
Source: KPC and Arutmin

8/3/2019 Tata Power 040310
http://slidepdf.com/reader/full/tata-power-040310 12/23
Tata Power Co. Ltd.
Mata Securities India Pvt. Ltd 12
Balanced Contract Composition:
Bumi Resources balances the fluctuations in the spot market prices
with entering into the contracts for medium and long term contracts.
Accordingly, the company is currently using 20:80 break‐down
between the spot and time contracts. The long term contracts have
enabled the company to avoid a major drastic decline in the
contracted prices for the coal.
V. Other Businesses:
Strategic Electronics Division:
SED is emerging as the Prime Contractor and Large Systems
Integrator in areas such as Launchers, Electronic Warfare,
Battlefield Management System, Tactical Communication System,
etc. In Mar’09, the SED received the order of Rs.182.46cr to
manufacture 16 Wheeled Launchers for the Akash Weapon System
to be delivered to the Indian Air Force in the subsequent 33 months.
Tata BP Solar:
Tata BP Solar is a 51:49 JV between BP Solar and Tata Power. The
JV is a market leader in photovoltaic technology in India with a
total turnover of Rs.1,147cr for FY’09. About 75% of the total sales
of the JV is from the exports to Europe and USA. The JV has a plant
with the solar cell manufacturing facility with the installed capacity
of 46 MW and module manufacturing facility with the installed
capacity of 88 MW as on Mar’09.

8/3/2019 Tata Power 040310
http://slidepdf.com/reader/full/tata-power-040310 13/23
Tata Power Co. Ltd.
Mata Securities India Pvt. Ltd 13
TPL’S GROWTH PLANS
Power Generation Capacity Expansion
Major Expansion plans The company is implementing 5451MW capacity expansion plan
which is expected to be completed by the end of FY13.
• Maithon Joint Venture Project to Drive Growth:
1050mw capacity at a cost of Rs.4450cr
PPA in place
To be completed by Apr’11
Coal linkages with CIL
The company is setting up a 1,050 MW (2*525 MW) JV project in
Maithon (Jharkhand) in a 74:26 JV with Damodar Valley
Corporation. The project involves an estimated cost of Rs.4,450cr
being funded in the debt‐equity ratio of 70:30.
PPAs have been signed and power evacuation arrangement is set
in place. The major buyers of power from the plant are DVC (300
MW), NDPL (300 MW), WBSEB (150 MW) and PSEB (300 MW).
Over 72%
of
the
work
has
been
completed.
The first unit is scheduled to commence operations by Oct’10 and
second unit by Apr’11. The total coal requirement for the plant
would be 5mn tons per annum which would be procured
through the coal linkages with Coal India mines. The efforts are
on to sign the fuel sale agreements for the plant.
• Mundra UMPP on Fast Track:
4000mw at an outlay of Rs.17000cr Implementation progressing well
Levelised tariff of Rs.2.26 per unit
Coal from Indonesian mines
TPL is setting up 4000mw UMPP (5 x 800mw) at a total cost of
Rs.17000cr, through its 100% subsidiary Coastal Gujarat Power
Ltd. The project is expected to be completed by 2012 as against
2014 as per the bid conditions. Overall, 42% of the project has
been completed and is progressing well.
The timely execution of the project would result in significant
upside in the units generated by the company. At the assumed
PLF of 85%, the plant would generate about 29,784MUs which is
almost twice of the current generation of 14,807MUs for FY’09.
The project has been awarded to Tata Power at the levelized tariff
of Rs.2.26 per unit over the 25 year period. The plant will use the
coal from the Indonesian coal mines.
Tata Power has the coal offtake agreement of 10.11mtpa (+ or ‐
20% at Tata Power’s Option) with KPC coal mines in Indonesia.
About 45% of the coal to be procured would be on a fixed F.O.B.
price of $36 per tonne while the remaining would be supplied
based on the prevailing coal prices in international markets.
The major customers of the electricity from the plant would be
Gujarat (1,805 MW), Maharashtra ((760 MW), Punjab (475 MW),
Haryana (380 MW) and Rajasthan (380 MW).

8/3/2019 Tata Power 040310
http://slidepdf.com/reader/full/tata-power-040310 14/23
Tata Power Co. Ltd.
Mata Securities India Pvt. Ltd 14
Coal Business Growth
Bumi Resources plans to extend the production capability to 111 mn
tonnes by 2012, which is expected to result in significant growth in
the revenues of the company, even considering the rates of coal to
remain stable in the future.

8/3/2019 Tata Power 040310
http://slidepdf.com/reader/full/tata-power-040310 15/23
Tata Power Co. Ltd.
Mata Securities India Pvt. Ltd 15
INVESTMENT RATIONALE
Power Capacity Expansion Programmes on Full Swing:
Major Expansion plans The company has the installed capacity of 2,791MW which is
expected to rise to 8,242MW by FY13. As against the power
generation capacity addition at the CAGR of merely 4% over the past
four years, the expansion is expected to rise at a CAGR of 31% over
the next four years. Out of the total planned capacity expansion
(5,451mw), Mundra UMPP forms about three fourths of the
incremental capacity.
2365 27913104
4242
5842
8242
0
2000
4000
6000
8000
10000
M W
FYʹ08 FYʹ09 FYʹ10E FY11E FY12E FY13E
Generation Capacity Addition
Composition of Capacity Expansion
Mundra
76%
Wind
1% Jojobera
2%Maithon
20%
SC Order to Improve Customer Base in Mumbai LA:
Subsequent upon the Supreme Court order in July’08, the company is
increasing its customer base in Mumbai License Area. After the
order, the company is increasing its customer base. In Q3FY’10, over
6,200 customers shifted over to Tata Power and over 14,700
changeover
applications
have
been
received.
During
Apr‐
Dec.’09,
the
total number of applications received number stands at 16,817. The
positive response of the customers in Mumbai LA ensures the leading
position of the company as the service provider in the License Area.
Coal Assets to be Growth Drivers
Ensuring Fuel for Future Power Capacities ‐ The company plans
to set up IPPs for utilizing the captive coal blocks. The company’s
share of the coal in domestic coal mines is estimated to provide
sufficient fuel for a 1,500 MW thermal power plant. The captive
coal blocks not only provide fuel security to the company for its
existing plants but also enable it to establish new thermal plants
in future.
Coal Sale from Indonesian Coal Mines to Sustain Growth ‐ The
Indonesian coal mines are expected to increase the coal
production significantly over the next few years. These are
expected to produce 111mn tonnes of coal by 2012 as against
53mn tonnes in 2008. Even assuming a conservative coal price
level of $65 per tonne, the production growth to 90mn tonnes per
annum by FY’12, the coal mining segment would contribute
significantly to the growth of the company in future.

8/3/2019 Tata Power 040310
http://slidepdf.com/reader/full/tata-power-040310 16/23
Tata Power Co. Ltd.
Mata Securities India Pvt. Ltd 16
FY’09 FY’10 FY’11 FY’12
Coal Price ($/ tonne) 65 65 65 65
Exchange
Rate
(Rs./$)
48
48
48
48
Production (mn tonnes) 60 70 80 90
Total Revenue (Rs. Cr.) 18,720 21,840 24,960 28,080
Tata Powerʹs Share (30%) 5,616 6,552 7,488 8,424
Coal From Indonesian Mines Providing Fuel Security ‐ As
discussed earlier, the Ultra Mega Power Plant of the company at
Mundra would receive imported coal from the coal mines KPC
and Arutmin in Indonesia in which it has 30% stake. The
company would not only have an ensured fuel supply but would
also have the pricing advantage.
Telecom Investments Providing Upside:
The telecom investments by Tata Power also provide it the value
accretion. DOCOMO had acquired 26% stake in Tata Teleservices
Ltd for Rs.12,770cr, hence valuing the company at Rs.49,115cr. Tata
Teleservices (Maharashtra) Ltd and Tata Communications Ltd have
been valued at the market cap.
Tata
Teleservices Ltd
Tata Teleservices
(Maharashtra) Ltd
Tata
Communications Total
Market Cap/Valuation (RsCr) 49115 4410 8149
Tata Powerʹs Shareholding 11.20% 11.50% 17.20%
Tata Powerʹs Attributable Value 5500.9 507.2 1401.6
No. of Tata Powerʹs Shares 22.1 22.1 22.1
Value per share 248.9 22.9 63.4
Discount 30% 30% 30%
Value per share for SOTP 174.2 16.1 44.4 234.7

8/3/2019 Tata Power 040310
http://slidepdf.com/reader/full/tata-power-040310 17/23
Tata Power Co. Ltd.
Mata Securities India Pvt. Ltd 17
INDUSTRY OUTLOOK
Leading Among Private Players:
Tata Power already has an installed capacity of 2791MW as against the
other emerging private sector operator which are having major capacity
expansion plans but very low existing capacity.
Capacity Expansion Plans of Private Players
0
1000
2000
3000
4000
5000
6000
7000
8000
9000
10000
Tata Power Rel ia n ce
Power
Adani
Power
Sterlite
Energy
JSW Energy
M
Installed Under Construction
Performance of the Power Sector in Recent Years:
The performance of the power sector in the recent years has been less
than satisfactory and the country has fallen short of the targeted
generation as well as capacity addition.
586412 587366621500 617382
658950 659419710000 704451
774344723556
0
200000
400000
600000
800000
M
U s
FYʹ05 FYʹ06 FYʹ07 FYʹ08 FYʹ09
Electricity Generated
Target Achievement
5245.523948.92
6934.52
3468.8
16418.8
6853
16335.2
9263
11061.2
3453.7
0
5000
10000
15000
20000
M W
FYʹ
05 FYʹ
06 FYʹ
07 FYʹ
08 FYʹ
09
Capacity Addition
Target Achievement
Source: CEA
Strong Demand to Continue:
The capacity addition at a robust pace is imperative to sustain the
growth of the nation. The primary reasons for the shortfalls witnessed
in previous plan periods are delays in acquiring sites and obtaining
approvals, equipment shortages and the inability to achieve financial
closure. According to Report of the Expert Committee on Integrated
Energy Policy issued by the Planning Commission the energy
requirement considering 8% GDP growth over the next 24 years is as
under:
143220
306
425
575
778
0
100
200
300
400
500
600
700
800
G W
2007‐0 8 2 01 1‐1 2 2 01 6‐1 7 2 02 1‐2 2 2 02 6‐2 7 2 03 1‐32
Inastalled Capacity Requirement
737
1097
1524
2118
2886
3880
0
500
1000
1500
2000
2500
3000
3500
4000
B i l l i o n U n i t s
2007‐0 8 2 01 1‐1 2 2 01 6‐1 7 2 02 1‐2 2 2 02 6‐2 7 2 03 1‐32
Energy Requirement
Source: Integrated Energy Policy, Planning Commission

8/3/2019 Tata Power 040310
http://slidepdf.com/reader/full/tata-power-040310 18/23
Tata Power Co. Ltd.
Mata Securities India Pvt. Ltd 18
FINANCIAL ANALYSIS (Standalone):
High
Revenue
Growth:
12663
13616
14269
1471714807
11500
12000
12500
13000
13500
14000
14500
15000
M
U
s
FYʹ05 FYʹ06 FYʹ07 FYʹ08 FYʹ09
Generation Total income of the company grew at the CAGR of 16.2% over the past
four years to Rs.7,869cr in FY’09 on account of the high growth in the fuel
prices (26.8% CAGR) over the same period. The fuel cost which
constitutes about 80% of the total cost in case of power sector companies,
is a pass through cost which is reflected in the higher realizations.
The units generated over the past four years have registered a CAGR of
only 4% on account of the low capacity addition.
4318
48605059
6414
7869
4000
4500
5000
5500
60006500
7000
7500
8000
R s . C r .
FYʹ05 FYʹ06 FYʹ07 FYʹ08 FYʹ09
Total Income
1864
2397
2709
3715
4813
1500
2000
2500
3000
3500
4000
4500
5000
R s . C r .
FYʹ05 FYʹ06 FYʹ07 FYʹ08 FYʹ09
Fuel Cost
Stable Profit Margins:
Operating profit of the company has grown at the CAGR of 7.9% over the
past four years and PAT by 13.7% over the same period. Since the cost
of production is passable to the customers, the profitability margins are
more or less stable in the range of 22‐24%. As per the power tariff policies
in the country, the return on the equity is assured.
1310
551
1191
611
1067
697
1434
870
1773
922
0
500
1000
1500
2000
R s . C r .
FYʹ05 FYʹ06 FYʹ07 FYʹ08 FYʹ09
Growth in Profits Stable Profit Margins
22.5%22.4%21.1%24.5%
30.3%
12.8% 12.6% 13.8%13.6%
11.7%
0%
5%
10%
15%
20%
25%
30%
35%
FYʹ05 FYʹ06 FYʹ07 FYʹ08 FYʹ09
OPM PAT Margin
Cash Flows Stable:
0%
5%
10%
15%
20%
FY06 FYʹ07 FYʹ08 FY09
Cash Accruals Stable
(Cash Flow+interest) / Av. total a ss et s Net Cash Accrual / Total Income
The cash accruals of the company have remained
stable over the last four years. The company has
maintained low cash balances over the past two
year as it increased its investments significantly
over the past two years.
However, the cash accruals over the past two
years have been sufficient to sustain the
expansion plans.

8/3/2019 Tata Power 040310
http://slidepdf.com/reader/full/tata-power-040310 19/23
Tata Power Co. Ltd.
Mata Securities India Pvt. Ltd 19
High Credit Quality:
0.60
0.500.42
0.63
0
2000
4000
6000
8000
10000
FY'06 FY' 07 FY' 08 FY' 09
R s . C r .
0.00
0.10
0.20
0.30
0.40
0.50
0.60
0.70
( x )
Gross Bloc k Gearing Ratio
The company has maintained its overall gearing
ratio at the low levels despite the capital intensive
nature and the debt: equity funding in ratio 70:30.
The low gearing ratio provides the company
sufficient leverage capacity.
Financial Performance (9m FY’10):
Total income of the company has declined by 9.1% for the
9mFY’10 on account of the sharp decline in the fuel cost by
20.6% which is a pass through cost for the company.
The drastic fall in the fuel cost has led to the operating profit
rising by 43.1% for the period.
The cost of power purchased has also decline as the company
purchased significantly lower number of units during 9mFY’09.
Rs.Cr.
Particulars 9mFYʹ10 9mFYʹ09 Growth
Units Generated (MUs) 12157 11241 8.1%
Total Inc. 5531.9 6083.5 ‐9.1%
Fuel Cost 3124.6 3935.2 ‐20.6%
Cost of Power Purchased 106.0 445.5 ‐76.2%
Employee Cost 241.6 215.6 12.1%
Other Exp. 418.2 339.8 23.1%
Total Expenditure 3890.4 4936.2 ‐21.2%
PBDIT 1641.5 1147.3 43.1%
Depreciation 351.0 230.3 52.4%
Interest 311.7 215.4 44.7%
PBT 978.8 701.7 39.5%
Tax 270.6 134.0 102.0%
PAT 708.2 567.7 24.8%

8/3/2019 Tata Power 040310
http://slidepdf.com/reader/full/tata-power-040310 20/23
Tata Power Co. Ltd.
Mata Securities India Pvt. Ltd 20
FINANCIAL PROJECTIONS(Standalone):
Consistent Growth to Sustain: Total income of the company is
expected to
register
a decline
for
FY10
on
account
of
the
decline
in
the
fuel
cost for the year. Subsequently, total income is expected to rise on
account of the expected rise in the fuel cost, expected improvement in the
units produced from Jojobera and Belgaum plants as well as the increased
contribution from the Haldia merchant power plant.
Total income of the company is expected to rise to Rs.8679cr for FY’12.
The operating profit is expected to register a growth of 14.4% to Rs.2658cr
and PAT to Rs.1425cr at the CAGR of 15.6% by FY’12.
78697034
78518679
0
5000
10000
R s C r
FYʹ09 FYʹ10E FYʹ11E FYʹ12E
Total Income
1773
922
2074
1031
2390
1248
2658
1425
0
1000
2000
3000
R s . C r .
FYʹ09 FYʹ10E FYʹ11E FYʹ12E
Growth in Profits
PBDIT PAT
29.5%
22.5%
30.4% 30.6%
14.6%
11.7%
15.0%15.6%
8.0%
13.0%
18.0%
23.0%
28.0%
33.0%
FYʹ09 FYʹ10E FYʹ11E FYʹ12E
OPM PAT Margin
Profit Margins to Remain Stable: The
operating profit and PAT margins are expected to
remain stable over the next few years on account of
the fuel cost which constitutes about 80% of the
total cost being a pass through cost.
Secondly the tariff fixing accounts for increase in
interest cost as well as depreciation, which protects
the bottomline of the power producers.
Gearing Ratio to Remain in Control: The gearing ratio of the
company is expected to remain low on account of high internal accrual
and low capex in the company (on standalone basis).
11.5%11.5%
11.0%
10.3%
10.9%10.8%
10.5%
10.4%
10.0%
10.2%
10.4%
10.6%
10.8%
11.0%
11.2%
11.4%
11.6%
11.8%
FYʹ09 FYʹ10 FYʹ11 FYʹ12
R OCE RONW
0
2000
4000
6000
8000
10000
12000
FYʹ09 FY ʹ10E FYʹ11E FYʹ12E
R s .
C r .
0.00
0.10
0.20
0.30
0.40
0.50
0.60
0.70
( x )
Gross B loc k G ea ri ng Ratio
Return Ratios to Improve: ROCE of the company is expected to
improve significantly over the next few years on account of the high
growth expected in PAT (with merchant power plant coming on stream)
as well as the lower pace of growth in gross block as the company is only
going to incur maintenance capex on the standalone basis.

8/3/2019 Tata Power 040310
http://slidepdf.com/reader/full/tata-power-040310 21/23
Tata Power Co. Ltd.
Mata Securities India Pvt. Ltd 21
Valuation:
Tata Power is on the robust growth path on account of:
High capacity expansion of 5451MW leading to the total installed
capacity of 8242MW by FY’13 as against 2791MW now. The major
contributors to the growth would be the Mundra UMPP (4000MW)
and Maithon Power Plant (1050MW).
The robust growth expected in the Indonesian coal mines in which
it has 30% stake. The production is expected to rise to 111mn tonnes
by 2012 as against 53mn tonnes for 2008.
The telecom investments by the company also provide it the value
accretion.
The SOTP valuation of the stock gives the fair value of the stock as
Rs.1,610. The details are given in table on page‐2 of this report.
At the current market price of Rs.1,335 as on 3rd March’10, the stock trades
at a PE of 28.1x based on 4Q Trailing EPS of Rs.47.5. The stock is expected
to achieve the target of Rs.1,610 over the next 12‐15 months.
We initiate the coverage on the stock with the ‘Buy’ recommendation.
PEER GROUP COMPARISON:
Tata Power NTPC NLC Reliance Power
Revenues (Rs cr) 7868.58 44313.8 3545.9 360.38 YOY growth (%) 22.32% 14.52% 0.68% 171.90% OPM (%) 22.54% 24.20% 26% 74.12% PAT Margin (%) 11.72% 18.26% 23.15% 51.72% ROCE 11.54% 12.59% 8.10% 1.83% RONW 10.99% 14.14% 8.93% 1.36% EPS (Rs) 41.65 9.81 4.89 0.78

8/3/2019 Tata Power 040310
http://slidepdf.com/reader/full/tata-power-040310 22/23
Tata Power Co. Ltd.
Mata Securities India Pvt. Ltd 22
FINANCIAL PERFORMANCE
Profit & Loss Account Rs. Cr. Balance Sheet Rs. Cr. Particulars FYʹ06 FYʹ07 FYʹ08 FYʹ09 Particulars FYʹ06 FYʹ07 FYʹ08 FYʹ09
Assets
Net Sales 4532.2 4715.3 5915.9 7236.2 F.Assets 3214.8 3811.4 4687.2 5951.7
Other Income 327.5 344.0 497.9 632.4 Invest 3412.2 3570.2 4430.0 5443.5
Total Income 4859.8 5059.3 6413.8 7868.6 NCA 1668.2 2278.8 2017.3 2495.4
Cost of Sales 3668.7 3991.9 4979.3 6095.3 C.A. 2973.0 4042.3 3875.5 4681.1
PBDILT 1191.1 1067.4 1434.5 1773.3 CurLiab. 1304.9 1763.5 1858.3 2185.8
Depreciation 278.3 291.9 290.5 328.9 Total Cap. 8295.2 9660.3 11134.5 13890.6
PBILT 912.7 775.5 1144.0 1444.4 Liabilities
Interest 165.3 189.5 173.9 327.8 Share Cap 197.9 197.9 220.7 221.4
Op. Profit bfr.Tax 747.4 586.0 970.1 1116.7 Reserves 5357.7 5835.2 7878.2 8470.9
Extra‐ord. Items 0.0 0.0 0.0 0.0 Misc Exp. Not w/o 15.5 6.2 1.7 0.0
PBT 747.4 586.0 970.1 1116.7 Net Worth 5540.2 6026.9 8097.2 8692.4
Tax 136.9 ‐110.8 100.2 194.5 Term Liab 2755.0 3633.4 3037.3 5198.2
PAT 610.5 696.8 869.9 922.2 Total Cap. 8295.2 9660.3 11134.5 13890.6
Key Ratios Cash Flow Statement Particulars FY'06 FY'07 FY'08 FY'09 Particulars FY'06 FY'07 FY'08 FY'09Gr Tot Inc. 12.6% 4.1% 26.8% 22.7% PAT 610.5 696.8 869.9 922.2
Gr PAT 10.7% 14.1% 24.8% 6.0% Depreciation 278.3 291.9 290.5 328.9PBDIT Mar 24.5% 21.1% 22.4% 22.5% Misc Exo w/o 0.0 0.0 0.0 0.0PAT Mar 12.6% 13.8% 13.6% 11.7% Change in WC -432.5 -233.4 -1077.5 -461.3ROCE 11.2% 8.6% 11.0% 11.5% Op. Cash Flow 456.4 755.3 82.9 789.7RONW 11.5% 12.0% 12.3% 11.0% Chg. In GB -458.9 -305.0 -252.5 -2503.6
Gearing (x) 0.50 0.60 0.38 0.60 Chg. In WIP 225.8 -569.2 -900.7 920.6Ov. Gearing (x) 0.50 0.60 0.42 0.63 Chg. In Inv. 90.8 -158.0 -859.9 -1013.5Current Ratio (x) 2.28 2.29 2.09 2.14 Csh Flw Inv. Act. -142.3 -1032.2 -2013.1 -2596.5Int. Cov. (x) 5.52 4.09 6.58 4.41 Pay. of Div. 191.9 220.2 282.4 300.8
Drs. Turnover 5.54 3.99 4.44 5.24 Chg. in Term Liab -105.0 878.4 -596.1 2160.9Sales Per Sh. 245.54 255.62 290.58 355.34 Chg. in Share Cap. 0.0 0.0 22.8 0.7EPS (Rs.) 25.84 29.49 36.82 39.03 Chg in Share Prem. 0.0 0.0 1376.0 48.2
Csh EPS (Rs.) 43.52 51.06 53.17 60.81 Csh Fl fr. Fin. Act -296.9 658.2 520.3 1909.0DPS (Rs.) 8.51 9.51 10.94 11.56 Op Cash Balance 979.6 990.55 1367.72 28.7
BV (Rs.) 279.92 304.51 366.85 392.54 Cl. Cash Balance 990.6 1367.7 28.7 45.5
FINANCIAL PROJECTIONS
Operational Performance Rs. Cr. Balance Sheet Rs. Cr. Particulars FY' 09 FY' 10E FY'11E FY' 12E Particulars FY'09 FY' 10E FY'11E FY'12E
AssetsNet Sales 7236.2 6274.8 6940.3 7586.3 Fixed Assets 5951.7 6256.5 6513.3 6742.2
Oth. Inc. 632.4 758.8 910.6 1092.7 Investments 5443.5 5493.5 5693.5 5993.5Total Income 7868.6 7033.6 7850.9 8679.0 NCA/NWC 2495.4 5924.1 6327.2 6832.4Cost of Sales 6095.3 4959.5 5460.9 6020.8 Current Assets 4681.1 7709.8 8412.9 9118.2
PBDILT 1773.3 2074.0 2390.0 2658.2 Current Liab. 2185.8 1785.8 2085.8 2285.8Depreciation 328.9 415.2 443.2 471.1 Tot. Cap. Emp. 13890.6 17674.1 18534.0 19568.1PBILT 1444.4 1658.8 1946.8 2187.1 Liabilities
Fin. Charges 327.8 422.0 530.0 560.0 Share Capital 221.4 236.3 236.3 236.3Op Pr. bfr. Tax 1116.7 1236.8 1416.8 1627.1 Reserves 8470.9 10780.4 11637.1 12668.3Ext.-ord. Items 0.0 0.0 0.0 0.0 Misc. Exp. 0.0 0.0 0.0 0.0PBT 1116.7 1236.8 1416.8 1627.1 Net Worth 8692.4 11016.7 11873.4 12904.6Less: Tax 194.5 210.3 240.9 276.6 Term Liab. 5198.2 6657.4 6660.6 6663.6PAT 922.2 1026.6 1175.9 1350.5 Tot. Cap. Emp. 13890.6 17674.1 18534.0 19568.1

8/3/2019 Tata Power 040310
http://slidepdf.com/reader/full/tata-power-040310 23/23
Tata Power Co. Ltd.
Mata Securities India Pvt Ltd 23
Key Ratios Cash Flows Rs. Cr.
Particulars FYʹ 09 FYʹ 10E FYʹ11E FYʹ 12E Particulars FYʹ 09 FYʹ 10E FYʹ11E FYʹ 12E
Gr Tot Inc. 22.68% ‐10.61% 11.62% 10.55% PAT 922.2 1026.6 1175.9 1350.5
Gro PAT
6.01%
11.32%
14.55%
14.84%
Depreciation 328.9
415.2
443.2
471.1
PBDIT Mar 22.54% 29.49% 30.44% 30.63% Misc Exo w/o 0.0 0.0 0.0 0.0
PAT Mar 11.72% 14.59% 14.98% 15.56% Change in WC ‐461.3 ‐10.0 ‐360.0 ‐460.0
ROCE 11.54% 10.51% 10.75% 11.48% Op. Cash Flow 789.7 1431.8 1259.1 1361.6
RONW 10.99% 10.42% 10.27% 10.90% Chg. In GB ‐2503.6 ‐670.0 ‐650.0 ‐650.0
Gearing (x) 0.60 0.60 0.56 0.52 Chg. In WIP 920.6 ‐50.0 ‐50.0 ‐50.0
Ov. Gearing (x) 0.63 0.60 0.56 0.52 Chg. In Inv. ‐1013.5 ‐50.0 ‐200.0 ‐300.0
Curr. Ratio (x) 2.14 4.32 4.03 3.99 Csh Flw Inv. Act. ‐2596.5 ‐770.0 ‐900.0 ‐1000.0
Int. Cov. (x) 4.41 3.93 3.67 3.91 Pay. of Div. ‐300.8 ‐319.3 ‐319.3 ‐319.3
Drs. Turnover 5.24 5.07 6.10 5.83 Chg. in Trm Liab 2160.9 1459.2 3.3 2.9
Sales Per Share 355.34 297.68 332.27 367.32 Chg. in Sh. Cap. 0.7 14.8 0.0 0.0
EPS (Rs.) 39.03 43.45 49.77 57.16 Chg in Sh. Prem. 48.2 1602.2 0.0 0.0
Csh EPS (Rs.) 60.8 61.0 68.5 77.1 Csh Fl fr. Fin. Act 1909.0 2757.0 ‐316.0 ‐316.3
DPS (Rs.) 11.56 11.50 11.50 11.50 Op Cash Bal. 28.7 45.5 3464.2 3507.3
BV(Rs.) 392.54 466.26 502.52 546.16 Cl. Cash Bal. 45.5 3464.2 3507.3 3552.5
Umesh Gupta Head – Capital Markets [email protected] 022‐ 22657907
Ravi Gupta Head ‐ Research [email protected] 022 – 65208816
Pavitra Subramanian Head – Sales [email protected] 022 ‐ 22695012
MATA SECURITIES (INDIA) PVT LTD2-Rahimtoola House, 1
stFloor,
7 – Homji Street, Fort,Mumbai – 400001
Disclaimer
This document is not for public distribution and has been furnished to you solely for your information and may not be reproduced toany other person. The manner of circulation and distribution of this document may be restricted by law or regulation in certaincountries. Persons into whose possession this document may come are required to inform themselves of, and to observe, suchrestrictions. This material is for the personal information of the authorized recipient, and we are not soliciting any action based uponit. This report is not to be construed as an offer to sell or the solicitation of an offer to buy any security in any jurisdiction where suchan offer or solicitation would be i llegal. No person associated with MATA Securities is obligated to call or initiate contact with you forthe purposes of elaborating or following up on the information contained in this document. The material is based upon information
that we consider reliable, but we do not represent that it is accurate or complete, and it should not be relied upon as such. NeitherMATA Securities, nor any person connected with it, accepts any liability arising from the use of this document. The recipient of thismaterial should rely on their own investigations and take their own professional advice. Opinions expressed are our currentopinions as of the date appearing on this material only. While we endeavor to update on a reasonable basis the informationdiscussed in this material, there may be regulatory, compliance, or other reasons that prevent us from doing so. Prospectiveinvestors and others are cautioned that any forward-looking statements are not predictions and may be subject to change withoutnotice. We and our affiliates, officers, directors, and employees world wide, including persons involved in the preparation orissuance of this material may; (a) from time to time, have long or short positions in, and buy or sell the securities thereof, ofcompany(ies) mentioned herein or (b) be engaged in any other transaction involving such securities and earn brokerage or othercompensation or act as a market in the financial instruments of the company(ies) discussed herein or may perform or seek toperform investment banking services for such company(ies) or act as advisor or lender / borrowed to such company(ies) or haveother potential conflict of interest with respect in any form and/or redistributed without MATA Securities prior written consent.


![Tata Power Delhi Distribution Limited - IREDA 1.pdf · Tata Power Delhi Distribution Limited Tata Power Delhi Distribution Limited [TPDDL], formerly known as “North Delhi Power](https://img.dokumen.tips/doc/110x75/5e6f104bdea9b33a617ce6e6/tata-power-delhi-distribution-limited-1pdf-tata-power-delhi-distribution-limited.jpg)