Embed Size (px)
Citation preview
ATKORE INTERNATIONAL HOLDINGS INC.
Financial Statements as of March 25, 2011 and September 24, 2010 and for the periods ended March 25, 2011, December 22, 2010 and March 26, 2010

ATKORE INTERNATIONAL HOLDINGS INC.
TABLE OF CONTENTS
Page
Financial Statements (unaudited)
Condensed Consolidated Statement of Operations for the three months ended March 25, 2011...................... (Successor Company)......................................................................................................................................... 3
Condensed Combined Statement of Operations for the three months ended March 26, 2010 (Predecessor..... Company)........................................................................................................................................................... 3
Condensed Consolidated Statement of Operations for the period from December 23, 2010 to March 25,...................................................................................................................................... 2011 (Successor Company)..........................................................................................................................................................................3
Condensed Combined Statements of Operations for the period from September 25, 2010 to December 22,. . ................................................. 2010 and the six months ended March 26, 2010 (both Predecessor Company)..........................................................................................................................................................................3
Condensed Consolidated Balance Sheet as of March 25, 2011 (Successor Company)..................................... 4
Condensed Combined Balance Sheet as of September 24, 2010 (Predecessor Company)................................ 4
Condensed Consolidated Statement of Cash Flows for the period from December 23, 2010 to March 25,.................................................................................................................................... 2011 (Successor Company) ..........................................................................................................................................................................5
Condensed Combined Statements of Cash Flows for the period from September 25, 2010 to December 22,. ................................................. 2010 and the six months ended March 26, 2010 (both Predecessor Company)..........................................................................................................................................................................5
Notes to Financial Statements............................................................................................................................ 6
Management’s Discussion and Analysis of Financial Condition and Results of Operations (unaudited)........................ 27
Quantitative and Qualitative Disclosures About Market Risk (unaudited)...................................................................... 44
2

ATKORE INTERNATIONAL HOLDINGS INC.
CONDENSED STATEMENTS OF OPERATIONS
($ in millions)
(Unaudited)
ConsolidatedSuccessor Company
CombinedPredecessor Company
For the Three Months Ended March 25, 2011
For the Three Months Ended March 26, 2010
Net sales...........................................................................................................................$406 $344Cost of sales.....................................................................................................................341 286Selling, general and administrative expenses...................................................................45 40Restructuring and asset impairment charges (see Note 3)...............................................1 1
Operating income.......................................................................................................19 17Interest expense, net.........................................................................................................13 12
Income before income taxes......................................................................................6 5Income tax expense..........................................................................................................2 4Net income.......................................................................................................................$4 $1
ConsolidatedSuccessor Company
CombinedPredecessor Company
For the Period from December 23, 2010 to
March 25, 2011
For the Period from September
25, 2010 to December 22,
2010
For the Six Months Ended March 26, 2010
Net sales...........................................................................................................................$406 $352 $649Cost of sales.....................................................................................................................341 304 534Selling, general and administrative expenses...................................................................60 41 80Restructuring and asset impairment charges (see Note 3)...............................................1 (1) 1
Operating income.......................................................................................................4 8 34Interest expense, net.........................................................................................................13 11 23
(Loss) income before income taxes...........................................................................(9) (3) 11Income tax expense..........................................................................................................2 — 7Net (loss) income.............................................................................................................$(11) $(3) $4
See Notes to Unaudited Financial Statements.
3

ATKORE INTERNATIONAL HOLDINGS INC.
CONDENSED BALANCE SHEETS
($ in millions)
(Unaudited)
Consolidated Successor Company
Combined Predecessor Company
March 25, 2011
September 24,2010
AssetsCurrent Assets:
Cash and cash equivalents.......................................................................................................... $49 $33Accounts receivable, less allowance for doubtful accounts of $1 and $10, respectively........... 238 204Receivables due from Tyco International Ltd. and affiliates (see Note 10)............................... — 356Inventories................................................................................................................................... 315 272Prepaid expenses and other current assets.................................................................................. 27 25Deferred income taxes................................................................................................................ 22 22
Total current assets................................................................................................................. 651 912Property, plant and equipment, net................................................................................................. 348 234Intangible assets, net....................................................................................................................... 268 —Goodwill......................................................................................................................................... 101 —Deferred income taxes.................................................................................................................... 57 52Other assets..................................................................................................................................... 46 26
Total Assets............................................................................................................................ $1,471 $1,224Liabilities and EquityCurrent Liabilities:
Short-term debt and current maturities of long-term debt, including due to Tyco International Ltd. and affiliates of $0 and $312, respectively (see Note 11).......................... $61 $312
Accounts payable........................................................................................................................ 151 138Payable due to Tyco International Ltd. and affiliates (see Note 10).......................................... — 6Accrued and other current liabilities........................................................................................... 97 79
Total current liabilities............................................................................................................ 309 535Long-term debt, including due to Tyco International Ltd. and affiliates of $0 and $388,
respectively (see Note 11)........................................................................................................... 411 389Deferred income taxes.................................................................................................................... 104 —Income taxes payable...................................................................................................................... 23 20Other liabilities................................................................................................................................ 30 47
Total Liabilities..................................................................................................................... 877 991Commitments and contingencies (see Note 14)Predecessor Company Parent Company Equity:
Parent company investment........................................................................................................ — 212Accumulated other comprehensive income................................................................................ — 21
Total Predecessor Company Parent Company Equity...................................................... — 233Successor Company Stockholder’s Equity:
Common stock, $.01 par value, 1,000 shares authorized, 100 shares issued and outstanding... — —Additional paid in capital............................................................................................................ 600 —Accumulated deficit.................................................................................................................... (11)Accumulated other comprehensive income................................................................................ 5 —
Total Successor Company Stockholder’s Equity............................................................... 594 —Total Liabilities and Equity................................................................................................. $1,471 $1,224
See Notes to Unaudited Financial Statements.
4

ATKORE INTERNATIONAL HOLDINGS INC.
CONDENSED STATEMENTS OF CASH FLOWS
($ in millions)
(Unaudited)
Consolidated Successor Company
Combined Predecessor Company
For the Period from
December 23, 2010 to
March 25, 2011
For the Period from
September 25, 2010 to
December 22, 2010
For the Six Months Ended
March 26, 2010
Cash Flows From Operating Activities:Net (loss) income............................................................................................................. $(11) $(3) 4Adjustments to reconcile net cash used in operating activities:
Depreciation and amortization..................................................................................... 11 7 14Deferred income taxes.................................................................................................. (6) (6) 5Provision for losses on accounts receivable and inventory.......................................... 1 3 3Other items................................................................................................................... — 2 (1)Changes in assets and liabilities, net of the effects of acquisitions:
Accounts receivable................................................................................................. (14) (18) (6)Prepaid expenses and other current assets................................................................ (1) (2) (2)Inventories................................................................................................................ (20) (10) (68)Accounts payable..................................................................................................... 35 (34) 17Income taxes payable............................................................................................... 8 2 1Accrued and other liabilities.................................................................................... 21 (8) (3)Other......................................................................................................................... 1 — (1)
Net cash provided by (used in) operating activities............................................. 25 (67) (37)Cash Flows From Investing Activities:Capital expenditures......................................................................................................... (15) (12) (25)Change in due to (from) Tyco International Ltd. and affiliates....................................... — 357 64Purchase price adjustment................................................................................................ (7) — —Acquisition of a business, net of cash acquired............................................................... — — (39)
Net cash (used in) provided by investing activities.............................................. (22) 345 —Cash Flows From Financing Activities:Repayments of long-term debt due to Tyco International Ltd. and affiliates, net........... (400) (300) —Proceeds from issuance of senior secured notes.............................................................. 410 — —Borrowings under credit facility, net................................................................................ 61 — —Payment of debt issuance costs........................................................................................ (36) — —(Repayments) proceeds from short-term debt.................................................................. (4) 4 —Change in parent company investment............................................................................ — (1) 14
Net cash provided by (used in) financing activities............................................. 31 (297) 14
Effect of currency translation on cash.............................................................................. 1 — —Net increase (decrease) in cash and cash equivalents................................................. 35 (19) (23)Cash and cash equivalents at beginning of period...................................................... 14 33 31Cash and cash equivalents at end of period................................................................. $49 $14 $8Supplementary Cash Flow Information:Interest paid...................................................................................................................... $— $11 $25Income taxes paid, net of refunds..................................................................................... 1 1 4Purchase price adjustment, not yet paid........................................................................... 7 — —
See Notes to Unaudited Financial Statements.
5

ATKORE INTERNATIONAL HOLDINGS INC.
NOTES TO UNAUDITED FINANCIAL STATEMENTS
1. Basis of Presentation and Summary of Significant Accounting Policies
Atkore International Holdings Inc. (hereinafter collectively with all its subsidiaries referred to as the “Company” or “Atkore”) was incorporated in the State of Delaware on November 4, 2010. The Company is 100% owned by Atkore International Group Inc., (“Atkore Group”). The Company is the sole owner of Atkore International, Inc. (“Atkore International”). Prior to the transactions described below, all the capital stock of Atkore International was owned by Tyco International Ltd. (“Tyco”). The business operated as the Electrical and Metal Products Business of Tyco (“TEMP”). Atkore was initially formed by Tyco as a holding company to hold TEMP.
Sale—On November 9, 2010, Tyco announced that it entered into an agreement to sell a majority interest in TEMP to an affiliate of the private equity firm Clayton Dubilier & Rice, LLC (“CD&R”). On December 22, 2010, the transaction closed and CD&R acquired shares of a newly created class of cumulative convertible preferred stock (the “Preferred Stock”) of Atkore Group. The Preferred Stock initially represented 51% of the outstanding capital stock (on an as-converted basis) of Atkore Group. On December 22, 2010, Atkore Group also issued common stock to a Tyco subsidiary that initially represented the remaining 49% of the outstanding capital stock of Atkore Group. Atkore Group continues to be the sole owner of the Company, which in turn continues to be the sole owner of the Atkore International. Collectively, the transactions described herein are referred to as the “Transactions.”
Subsequent to December 22, 2010, Atkore began operating as an independent, standalone entity (see Note 2).
Basis of Presentation—The Electrical and Metal Products Business of Tyco prior to the sale described above and in Note 2 is considered a predecessor company (the “Predecessor Company”) to Atkore (the “Successor Company”). Combined statements of operations and cash flows for periods ended December 22, 2010 or March 26, 2010 and the combined balance sheet as of September 24, 2010 include the results of operations, cash flows and the financial condition of TEMP reflecting the historical carrying values of that business on a predecessor basis. Combined financial statements for December 22, 2010 are as of and for the period immediately prior to the close of the sale as described in Note 2. The period from September 25, 2010 through December 22, 2010 is the “Predecessor 2011 Period.” The period from December 23, 2010 through March 25, 2011 is the “Successor 2011 Period.”
The financial statements as of and for periods ended on March 25, 2011 include the financial condition, results of operations and cash flows for Atkore on a successor basis, reflecting the impact of the preliminary purchase price allocation.
The financial statements have been prepared in United States dollars, in accordance with generally accepted accounting principles in the United States of America (“GAAP”). The financial statements included herein are unaudited, but in the opinion of management, such financial statements include all adjustments, consisting of normal recurring adjustments, necessary to summarize fairly the Company’s financial position, results of operations and cash flows for the interim periods presented. The results reported in the Predecessor Company’s combined financial statements should not be taken as indicative of results that may be expected for the entire year. These financial statements should be read in conjunction with the Company’s audited annual combined financial statements as of September 24, 2010.
Additionally, the Predecessor Company’s combined financial statements may not be indicative of the Company’s future performance and do not necessarily reflect what its combined results of operations, financial position and cash flows would have been had the Company operated as an independent, standalone company during the periods presented. To the extent that an asset, liability, revenue or expense is directly associated with the Company, it is reflected in the accompanying combined financial statements. Certain general corporate overhead and other expenses have been allocated by Tyco to the Company (see Note 10). Management believes such allocations are reasonable; however, they may not be indicative of the actual expenses that would have been incurred had the Company been operating as an independent, standalone company for the periods presented, nor are they indicative of the costs that will be incurred in the future as an independent, standalone company.
Principles of Combination and Consolidation—The balance sheets presented herein include the assets and liabilities used in operating the Company’s business, including entities in which the Company owns or controls more than 50% of the voting shares or has the ability to control through similar rights. All intercompany transactions have been eliminated. The results of companies acquired or disposed of are included in the combined balance sheet from the effective date of acquisition
6

or up to the date of disposal. The eventual composition of the Company as of the December 22, 2010 transaction differed from that as of September 24, 2010 in that one holding company was not included. This holding company had no operating activities; it held certain intercompany loans and investments in subsidiaries.
Description of Business—The Company is engaged in the design, manufacture and distribution of electrical conduits, cable products, steel tube and pipe products. The Company conducts business globally and is organized into the following business segments:
1. Electrical and Infrastructure designs and manufactures electrical conduits, cable and other products. It also manufactures and distributes metal framing, support products and systems such as strut channels, cable tray and cable ladder products.
2. Engineered Products and Services (formerly referred to as Pipe and Tube) designs, manufactures and fabricates steel tube, plate and pipe products. It also provides conceptual design, engineering and installation services regarding strut related applications.
The Company also provides general corporate services to its segments and these costs are reported as Corporate and other (see Note 16).
Use of Estimates—The preparation of the financial statements in conformity with GAAP requires management to make estimates and assumptions that affect the reported amount of assets and liabilities, disclosure of contingent assets and liabilities and reported amounts of revenues and expenses. Significant estimates in these financial statements include the preliminary allocation of purchase price, restructuring charges, allowances for doubtful accounts receivable, estimates of future cash flows associated with asset impairments, useful lives for depreciation and amortization, loss contingencies, net realizable value of inventories, legal liabilities, income taxes and tax valuation allowances, and pension and postretirement employee benefit liabilities. Actual results could differ materially from these estimates.
Recently Adopted Accounting Pronouncements— In June 2009, the Financial Accounting Standards Board ("FASB") issued authoritative guidance which amended the existing guidance for the consolidation of variable interest entities, to address the elimination of the concept of a qualifying special purpose entity. The guidance also replaces the quantitative based risks and rewards calculation for determining which enterprise has a controlling financial interest in a variable interest entity with an approach focused on identifying which enterprise has the power to direct the significant activities of a variable interest entity, and the obligation to absorb losses or the right to receive benefits that may be significant to the variable interest entity. The guidance became effective for the Company in the first quarter of fiscal 2011. The adoption of this guidance did not have a material impact on the Company’s financial position, results of operations or cash flows.
In September 2009, the FASB issued authoritative guidance for the accounting for revenue arrangements with multiple deliverables. The guidance establishes a selling price hierarchy for determining the selling price of a deliverable. The selling price used for each deliverable will be based on vendor-specific objective evidence ("VSOE") if available, third-party evidence ("TPE") if VSOE is not available, or estimated selling price if neither VSOE nor TPE is available. The guidance requires arrangements under which multiple revenue generating activities to be performed be allocated at inception. The residual method under the existing accounting guidance has been eliminated. The guidance became effective for the Company for revenue arrangements entered into or materially modified beginning in the first quarter of fiscal 2011. The adoption of this guidance did not have a material impact on the Company's financial position, results of operations or cash flows.
2. Acquisitions
Fiscal 2011 Transactions
On December 22, 2010, Tyco sold a majority interest in Atkore Group to an affiliate of the private equity firm CD&R. The Transactions were completed at the end of business on December 22, 2010. In connection with the closing, Atkore International paid Tyco cash proceeds of $400 million for the repayment of indebtedness due to Tyco (see Note 11). In order to finance the transaction, Atkore International issued senior secured notes in the face amount of $410 million, due on January 1, 2018, with a coupon of 9.875% and obtained an asset-backed credit facility of up to $250 million, of which $55 million was drawn as of December 22, 2010 (see Note 11).
7

This acquisition is being accounted for as a business combination using the acquisition method of accounting, whereby the purchase price was preliminarily allocated to tangible and intangible assets acquired and liabilities assumed, based on their estimated fair values. Fair value measurements have been applied based on assumptions that market participants would use in the pricing of the asset or liability. The following table summarizes the fair values assigned to the net assets acquired as of the December 22, 2010 acquisition date (in millions):
Fair value of consideration transferred:Fair value of equity $ 600 Purchase price adjustment 14
614Fair value of assets acquired and liabilities assumed:
Cash and cash equivalents 14 Accounts receivable 221Inventories 294 Property and equipment 340 Intangible assets 271 Deferred income tax assets—current and long-term 79Other assets—current and long-term 37Indebtedness—current and long-term, including amounts due to Tyco and affiliates of
$400 (405) Accounts payable and amounts due Tyco (114) Deferred income tax liabilities—current and long-term (113)Other liabilities—current and long-term (111)
Net assets acquired 513 Excess purchase price attributed to goodwill acquired $ 101
As of March 25, 2011, the purchase price allocation is preliminary and could change materially in subsequent periods. Any subsequent changes to the purchase price allocation that result in material changes to our consolidated financial results will be adjusted retrospectively. The final purchase price allocation is pending the finalization of valuation work and the completion of the Company’s internal review of such work, which is expected to be completed during fiscal 2011. The provisional items pending finalization include, but are not limited to, the valuation of our property and equipment, operating lease intangible assets and liabilities, inventory, intangible assets, goodwill, pension obligations and income tax related matters. These adjustments could include, but are not limited to, adjustments to reflect the fair value of tangible and intangible assets and liabilities acquired, and the resulting goodwill. In connection with applying the provisions of purchase accounting, to state inventory at fair value, the Company increased its value by $13 million, which negatively impacted cost of sales over the Successor 2011 Period.
The acquisition resulted in the recognition of $101 million of goodwill, which is not deductible for income tax purposes. Goodwill consists of the excess of the purchase price over the fair value of the acquired assets and represents the estimated economic value attributable to future operations.
The Company recorded $16 million of transaction-related costs incurred in connection with the Transactions within selling, general and administrative expenses in our Consolidated Statement of Operations for the period from December 23, 2010 to March 25, 2011. Additionally, in connection with the funding of the senior secured notes and credit facility (see Note 11) upon closing of the sale, the Company capitalized $37 million in debt issuance costs.
Pro Forma Impact of the Transactions
The following table presents unaudited pro forma consolidated results of operations for the six months ended March 25, 2011 and March 26, 2010, as if the Transactions had occurred as of the first day of our fiscal 2010 period:
For the Six Months EndedMarch 25, 2011 March 26, 2010
Net sales..................................................................................................................................$758 $649Net income (loss)....................................................................................................................7 (27)
8

The unaudited pro forma consolidated results of operations were prepared using the acquisition method of accounting and are based on the historical financial information of the Company. In addition, the unaudited pro forma information does not reflect any incremental costs to operate as a stand-alone company.
The unaudited pro forma information is not necessarily indicative of what the Company's consolidated results of operations actually would have been had the Transactions been completed on the first day of our fiscal 2010 period. In addition, the unaudited pro forma information does not purport to project the future results of operations of the Company. The unaudited pro forma information reflects primarily the following unaudited pro forma adjustments:
Additional amortization expense related to the fair value of identifiable intangible assets acquired; Additional depreciation expense related to the fair value adjustment to property, plant and equipment acquired; Additional cost of goods sold in the six months ended March 26, 2010 to reflect the increased value of
inventory sold as a result of applying purchase accounting, and an offsetting impact in the six months ended March 25, 2011;
Additional expense in the six months ended March 26, 2010 to reflect the transaction-related costs incurred, and an offsetting impact in the six months ended March 25, 2011;
An incremental increase of interest expense related to the financing of the Transactions including associated deferred financing costs;
Additional expense for the annual management fee of $6 million per annum to be paid to CD&R and Tyco; A reduction in pension expense from the impacts of revaluing obligations under purchase accounting; and All of the above adjustments were adjusted for the applicable tax impact.
Fiscal 2010 Transaction
On November 13, 2009, the Company completed an acquisition from Barzel Industries of substantially all of the assets related to the business of Novamerican Steel for $39 million in cash. This business is included within the Company’s Engineered Products and Services segment. The acquisition is not material to the combined financial statements.
3. Restructuring and Asset Impairment Charges
2009 Program
During fiscal 2009 and 2010, the Company identified and pursued opportunities for cost savings through restructuring activities and workforce reductions to improve operating efficiencies across all of the Company’s segments (the “2009 Program”). The Company expects such actions to be substantially completed by the end of fiscal 2011. The Company maintained a restructuring reserve related to the 2009 Program of $6 million as of both March 25, 2011 and September 24, 2010. The aggregate remaining reserves relate to employee severance and benefits as well as facility exit costs for long-term non-cancelable lease obligations. Restructuring and asset impairment charges during the Successor 2011 Period, the Predecessor 2011 Period, the six months ended March 26, 2010, and three months ended March 26, 2010 related to the 2009 Program were less than $1 million in each period. During Successor 2011 Period, the Predecessor 2011 Period, the six months ended March 26, 2010, and three months ended March 26, 2010, the Company utilized less than $1 million, less than $1 million, $4 million and $1 million of reserves, respectively.
2007 Program
During fiscal 2007 and 2008, the Company launched a restructuring program to streamline some of the businesses and reduce the operational footprint (the “2007 Program”). As of December 26, 2008, the Company had substantially completed this program. The Company maintained a restructuring reserve related to the 2007 Program of $5 million and $7 million as of March 25, 2011 and September 24, 2010, respectively. During the Successor 2011 Period, the Predecessor 2011 Period, the six months ended March 26, 2010, and three months ended March 26, 2010, the Company utilized less than $1 million, less than $1 million, $2 million, and $1 million of reserves, respectively. During the Predecessor 2011 Period, $2 million of reserves were reversed for previously contemplated actions that will not be taken. The aggregate remaining reserves relate to employee severance and benefits as well as facility exit costs for long-term non-cancelable lease obligations. The Company incurred charges of less than $1 million, less than $1 million, $1 million, and $1 million related to the 2007 Program actions for the Successor 2011 Period, the Predecessor 2011 Period, the six months ended March 26, 2010, and three months ended March 26, 2010, respectively.
9

Restructuring reserves
The roll-forward of the reserves is as follows ($ in millions):
Balance as of September 24, 2010................................................................ $13Charges......................................................................................................... 1Utilization..................................................................................................... (1)Reversals....................................................................................................... (2)Balance as of December 22, 2010................................................................ 11Charges......................................................................................................... 1Utilization..................................................................................................... (1)Balance as of March 25, 2011...................................................................... $11
As of March 25, 2011 and September 24, 2010, restructuring reserves related to the 2009 Program and the 2007 Program, were included in the Company’s Balance Sheets as follows ($ in millions):
March 25,2011
September 24,2010
Accrued and other current liabilities............................................................. $5 $8Other liabilities............................................................................................. 6 5
$11 $13
4. Income Taxes
The effective tax rate varied from the United States statutory tax rate in all periods as a result of the mix of earnings geographically, including the impact of incurring losses without an associated tax benefit, and to the impact of non-deductible expenses.
The Company did not have a significant change to its unrecognized tax benefits since September 24, 2010.
Many of the Company’s uncertain tax positions relate to tax years that remain subject to audit by the taxing authorities in the U.S. federal, state and local or foreign jurisdictions. Open tax years in significant jurisdictions are as follows:
Jurisdiction Years Open To AuditAustralia................................................................................................................... 2004 – 2010Brazil........................................................................................................................ 2005 – 2010Canada...................................................................................................................... 2002 – 2010United Kingdom....................................................................................................... 2009 – 2010United States............................................................................................................ 1997 – 2010
Based on the current status of its income tax audits, the Company believes that it is reasonably possible that $4 million in unrecognized tax benefits may be resolved in the next twelve months.
At each balance sheet date, management evaluates whether it is more likely than not that the Company’s deferred tax assets will be realized and if sufficient future taxable income will be available by assessing current period and projected operating results and other pertinent data. As of March 25, 2011, the Company had recorded deferred tax assets of $79 million, net of valuation allowances of $13 million. Depending on prevailing economic conditions future taxable income of entities with deferred tax assets may be negatively impacted, which may require additional valuation allowances to be recorded in future reporting periods related to the Company’s deferred tax assets.
Section 382 of the Internal Revenue Code subjects the utilization of net operating loss and credit carryforwards to an annual limitation that is applicable if a company experiences an ownership change. The Company believes the Transactions may have triggered an ownership change as defined by the Internal Revenue Code. However, the Company has yet to perform the computations under Section 382 which would determine the amount of annual limitations on its utilization of its
10

net operating loss and tax credit carryforwards. The annual limitation may result in the expiration of the Company’s net operating loss and tax credit carryforwards before they expire.
Other Income Tax Matters
No material provision has been made for U.S. or non-U.S. income taxes on the undistributed earnings of subsidiaries or for unrecognized deferred tax liabilities for temporary differences related to investments in subsidiaries, since the earnings are expected to be permanently reinvested, the investments are essentially permanent in duration, or the Company has concluded that no additional tax liability will arise as a result of the distribution of such earnings. A liability could arise if amounts are distributed by such subsidiaries or if such subsidiaries are ultimately disposed. It is not practicable to estimate the additional income taxes related to permanently reinvested earnings or the basis differences related to investments in subsidiaries.
The calculation of the Company’s tax liabilities involves dealing with uncertainties in the application of complex tax regulations in a multitude of jurisdictions across its global operations. The Company records tax liabilities for anticipated tax audit issues in the U.S. and other tax jurisdictions based on our estimate of whether, and the extent to which, additional taxes will be due. These tax liabilities are reflected net of related tax loss carryforwards. The Company adjusts these reserves in light of changing facts and circumstances; however, due to the complexity of some of these uncertainties, the ultimate resolution may result in a payment that is materially different from the Company’s current estimate of the tax liabilities. If the Company’s estimate of tax liabilities proves to be less than the ultimate assessment, an additional charge to expense would result. If payment of these amounts ultimately proves to be less than the recorded amounts, the reversal of the liabilities may result in income tax benefits being recognized in the period when the Company determines the liabilities are no longer necessary. All of these potential tax liabilities are recorded in other liabilities in the balance sheets as payment is not expected within one year.
Under the terms of the investment agreement entered into in connection with the Transactions, Tyco has agreed generally to indemnify and hold harmless the Company and its subsidiaries and their respective affiliates from and against any taxes of the Company with respect to any tax period ending on or before the closing of the Transactions, as well as all tax liabilities relating to events or transactions occurring on or prior to the closing date, with certain limited exceptions. In addition, the Company has agreed to indemnify and hold harmless Tyco and its affiliates from and against any liability for any taxes of the Company with respect to any post-closing tax period.
5. Inventories
As of March 25, 2011 and September 24, 2010, inventories were comprised of ($ in millions):
March 25,2011
September 24,2010
Purchased materials and manufactured parts................................................ $146 $109Work in process............................................................................................ 27 26Finished goods.............................................................................................. 142 137
Inventories................................................................................................ $315 $272
Inventories are recorded at the lower of cost (primarily first-in, first-out) or market value.
11

6. Property, Plant and Equipment
As of March 25, 2011 and September 24, 2010, property, plant and equipment at cost and accumulated depreciation were ($ in millions):
March 25,2011
September 24,2010
Land.............................................................................................................. $22 $18Buildings and related improvements............................................................ 126 158Machinery and equipment............................................................................ 172 330Leasehold improvements.............................................................................. 3 6Construction in progress............................................................................... 34 21Property, plant and equipment...................................................................... 357 533Accumulated depreciation............................................................................ (9) (299)
Property, plant and equipment, net........................................................... $348 $234
Depreciation expense was $8 million, $7 million, $14 million, and $7 million for the Successor 2011 Period, the Predecessor 2011 Period, the six months ended March 26, 2010, and three months ended March 26, 2010, respectively.
7. Intangible Assets
As of March 25, 2011, intangible assets and accumulated amortization were ($ in millions):
March 25,2011
Customer relationships................................................................................. $173Trade names/trademarks............................................................................... 98Intangible assets............................................................................................ 271Accumulated amortization on customer relationships.................................. (3)
Intangible assets, net................................................................................. $268
As of September 24, 2010, various intangible assets of $7 million, net of $1 million of accumulated amortization, were included in Other Assets.
The weighted-average amortization period for the $173 million of customer relationships recorded in connection with the Transactions is 13.7 years. Trade names and trademarks have indefinite lives and are not subject to amortization.
Amortization expense was $3 million for Successor 2011 Period. Amortization expense was negligible for the Predecessor 2011 Period and both the three and the six month periods ended March 26, 2010. Total estimated amortization expense for the remainder of fiscal 2011 is $6 million and $13 million for each of the five succeeding fiscal years.
8. Accrued and Other Current Liabilities and Other Liabilities
As of March 25, 2011 and September 24, 2010, accrued and other current liabilities were comprised of ($ in millions):
March 25,2011
September 24,2010
Accrued payroll and payroll related............................................................. $16 $27Accrued transportation costs......................................................................... 12 16Other............................................................................................................. 69 36
Accrued and other current liabilities......................................................... $97 $79
12

As of March 25, 2011 and September 24, 2010, other liabilities were comprised of ($ in millions):
March 25,2011
September 24,2010
Pension.......................................................................................................... $18 $27Other............................................................................................................. 12 20
Other liabilities......................................................................................... $30 $47
9. Comprehensive Income and Accumulated Other Comprehensive Income
Comprehensive income is as follows ($ in millions):
Successor Company
Predecessor Company
For the Three Months Ended March 25, 2011
For the Three Months Ended March 26, 2010
Net income.................................................................................................... $4 1Foreign currency translation adjustment...................................................... 5 —
Total comprehensive income.................................................................... $9 $1
Successor Company Predecessor CompanyFor the Period from
December 23, 2010 to March 25, 2011
For the Period from September 25, 2010 to
December 22, 2010
For the Six Months Ended March 26, 2010
Net (loss) income..........................................................................................$(11) $(3) $4Foreign currency translation adjustment.....................................................................................................5 2 1Total comprehensive (loss) income..............................................................$(6) $(1) $5
The components of accumulated other comprehensive income are as follows ($ in millions):
Foreign CurrencyTranslatio
n Adjustmen
tRetirement
Plans
AccumulatedOther
Comprehensive
Income
Balance as of September 24, 2010 (Predecessor)................................$41 $ $(20) $21Pre-tax current period change..........................................................1 1 2Income tax benefit, net....................................................................— — —
Balance as of December 22, 2010 (Predecessor).................................$ 42 $ (19) $ 23
Pre-tax current period change..........................................................5 — 5Income tax benefit, net....................................................................— — —
Balance as of March 25, 2011 (Successor)..........................................$ 5 $ — $ 5
13

10. Related Party Transactions
Cash Management and Balances due from (to) Tyco and affiliates —Through December 22, 2010, the Company was part of Tyco’s centralized approach to cash management and financing of operations. The Company’s cash was available for use and was regularly “swept” by Tyco at its discretion. Balances due from (to) Tyco and affiliates presented in the combined balance sheet as of September 24, 2010 primarily relate to cash to be transferred to or from Tyco’s cash management system. These balances were reflected as “Receivables due from Tyco and affiliates” in the combined balance sheets. As of September 24, 2010, the balance due from (to) Tyco and affiliates was classified as a current asset and liability as the Company utilized these balances to service their debt. Prior to the Transactions, the Company generally settled the amounts due from (to) Tyco.
Trade Activity with Tyco—Accounts payable includes $3 million and $2 million of payables to Tyco affiliates as of March 25, 2011 and September 24, 2010, respectively. Amounts payable relate to reimbursements owed Tyco, amounts due for management fees (see discussion below in this note), and for the purchase of certain raw materials, components and finished goods from Tyco affiliates. Purchases from Tyco totaled $2 million, $1 million, $3 million, and $1 million for the Successor 2011 Period, the Predecessor 2011 Period, the six months ended March 26, 2010, and the three months ended March 26, 2010, respectively. Accounts receivable includes $3 million and $3 million of receivables from Tyco affiliates as of March 25, 2011 and September 24, 2010, respectively. Amounts receivable relate to sales of certain products which totaled $5 million, $6 million, $12 million, and $6 million for the Successor 2011 Period, the Predecessor 2011 Period, the six months ended March 26, 2010, and three months ended March 26, 2010, respectively. The cost of sales associated with the sales are $4 million, $5 million, $11 million, and $5 million for each of the Successor 2011 Period, the Predecessor 2011 Period, the six months ended March 26, 2010, and three months ended March 26, 2010, respectively.
Other Activity with Tyco—Accrued liabilities as of March 25, 2011 includes $7 million owed to Tyco as a working capital adjustment related to the Transactions.
Other Related Party Trade Activity—A board member of the Successor Company is also a board member for a customer to which the Company sold $6 million of products during the Successor 2011 Period. Accounts receivable from this customer were $5 million as of March 25, 2011.
Debt—See Note 11 for further information relating to the amounts due to Tyco and affiliates.
Parent Company Investment—This account includes transactions with the Company’s parent for items such as tax payments, dividends and capital contributions.
Interest expense, net—The Company recognized $11 million, $23 million, and $11 million of interest expense associated with the debt due to Tyco and affiliates during the Predecessor 2011 Period, the six months ended March 26, 2010, and three months ended March 26, 2010, respectively. The Company recognized less than $1 million of interest income associated with cash to be transferred from Tyco’s cash management system during the Predecessor 2011 Period and the three months ended March 26, 2010. Subsequent to December 22, 2010, the Company no longer had any debt to Tyco.
Insurable Liabilities—Through December 22, 2010, the Company was insured for worker’s compensation, general and auto liabilities by a captive insurance company that was wholly-owned by Tyco. The Company paid a premium in each year to obtain insurance coverage during these periods. Premiums expensed by the Company were $1 million, $3 million, and $2 million for the Predecessor 2011 Period, the six months ended March 26, 2010, and three months ended March 26, 2010, respectively, and are included in the selling, general and administrative expenses in the combined statements of operations.
The Predecessor Company maintained liabilities related to workers’ compensation, general and auto liabilities. As of September 24, 2010, the Company maintained liabilities reflected in the combined balance sheet of $8 million (classified as $2 million in other current liabilities and $6 million in other liabilities), with offsetting insurance assets (classified as $2 million in other current assets and $6 million in Other Assets) due from Tyco’s captive insurance company.
Allocated Expenses—Prior to December 22, 2010, the Company was allocated corporate overhead expenses from Tyco for corporate related functions based on a pro-rata percentage of the Company’s net revenue to Tyco’s consolidated net revenue. Corporate overhead expenses primarily related to centralized corporate functions, including treasury, tax, legal, internal audit, human resources and risk management functions. During the Predecessor 2011 Period, the six months ended March 26, 2010, and three months ended March 26, 2010, the Company was allocated $4 million, $8 million, and $4 million,
14

respectively, of general corporate expenses incurred by Tyco which are included within selling, general and administrative expenses in the combined statements of operations.
The Company believes the assumptions and methodologies underlying the allocations of general corporate overhead from Tyco are reasonable. However, such expenses may not be indicative of the actual level of expenses that would have been or will be incurred by the Company if it were to operate as an independent, standalone company. As a result, the financial information herein may not necessarily reflect the combined financial position, results of operations and cash flows of the Company in the future or what it would have been had the Company been an independent, standalone company during the periods presented.
Transaction Costs and Debt Issuance Costs—In connection with the Transactions, the Company paid fees to CD&R of $6 million, which are included in selling, general and administrative expenses for the Successor 2011 Period. Debt issuance costs capitalized within other current assets and other assets include $9 million paid to CD&R in connection with their direct efforts to arrange financing for the Company.
Management Fees—The Company is obligated to pay an annual management fee to Tyco and CD&R, totaling $6 million annually, subsequent to the Transactions. Such fees are to be paid quarterly, in advance, except that the fee for the first calendar quarter of 2011 was paid in arrears.
11. Debt
Debt as of March 25, 2011 and September 24, 2010 is as follows ($ in millions):
March 25,2011
September 24,2010
Due to Tyco and affiliates............................................................................. $— $700Senior secured notes due January 1, 2018.................................................... 410 —Asset-backed credit facility.......................................................................... 61 —Other............................................................................................................. 1 1Total debt...................................................................................................... 472 701Current portion.............................................................................................. (61) (312)Long-term debt............................................................................................. $411 $389
Amounts due to Tyco and affiliates as of September 24, 2010 are as follows ($ in millions):
September 24,2010
7.59% due fiscal 2011................................................................................................................$2407.50% due fiscal 2011................................................................................................................ 5016.30% due fiscal 2011.............................................................................................................. 128.57% due fiscal 2011................................................................................................................ 106.44% due fiscal 2012................................................................................................................ 9817.88% due fiscal 2014.............................................................................................................. 177.60% due fiscal 2015................................................................................................................ 807.35% due fiscal 2017................................................................................................................ 205.65% due fiscal 2018................................................................................................................ 157.75% due fiscal 2020................................................................................................................135Other(1)...................................................................................................................................... 23Total...........................................................................................................................................$700
(1) The other amounts consist primarily of various loans between the Company and other Tyco subsidiaries.
On December 22, 2010, Atkore International issued senior secured notes (the “Notes”) of $410 million, due on January 1, 2018, with a coupon of 9.875%. The obligations under the Notes are senior to unsecured indebtedness of the Company. Interest on the Notes is payable on a semi-annual basis, commencing on July 1, 2011. Atkore International’s obligations under the Notes are guaranteed on a senior secured basis by the Company (the direct parent of Atkore International) and jointly and severally, on a senior secured basis, by each of Atkore International’s domestic subsidiaries that
15

is a borrower under or that guarantees obligations under its credit facility. The Notes are redeemable at the Company's option in whole or in part at any time, with not less than 30 nor more than 60 days notice, for an amount to be determined pursuant to provisions set forth in the notes indenture. In addition, during any 12-month period prior to January 1, 2014, the Company may redeem up to $41 million of Notes at a redemption price of 103%, plus accrued interest. In the event that Atkore International raises additional equity prior to January 1, 2014, then, subject to the restrictions in the Notes, Atkore International may redeem up to 35% of the Notes at par, plus the coupon, plus accrued and unpaid interest up to the redemption date. The Notes contain covenants typical to this type of financing, including limitations on indebtedness, restricted payments including dividends, liens, restrictions on distributions from restricted subsidiaries, sales of assets, affiliate transactions, mergers and consolidations. The Notes also contain customary events of default typical to this type of financing, including, without limitation, failure to pay principal and/or interest when due, failure to observe covenants, certain events of bankruptcy, the rendering of certain judgments, or the loss of any guarantee.
On December 22, 2010, Atkore International also obtained an asset-backed credit facility (“Credit Facility”) of up to $250 million, subject to borrowing base availability, of which $55 million was drawn as of December 22, 2010. The borrowing base is equal to the sum of 85% of eligible accounts receivable plus 80% of eligible inventory of each borrower and guarantor. The Credit Facility is guaranteed by the Company and the U.S. operating companies owned by Atkore International. At March 25, 2011, the borrowing base was $250 million, before considering the $61 million outstanding and approximately $3 million of undrawn outstanding letters of credit. The interest rate on the Credit Facility is LIBOR plus an applicable margin ranging from 2.25% to 2.75%, or an alternate base rate for U.S. dollar denominated borrowings plus an applicable margin ranging from 1.25% to 1.75%. The Credit Facility matures on December 22, 2015. The Credit Facility contains customary representations and warranties and customary affirmative and negative covenants. The negative covenants are limited to the following: limitations on indebtedness, dividends and distributions, investments, prepayments or redemptions of subordinated indebtedness, amendments of subordinated indebtedness, transactions with affiliates, asset sales, mergers, consolidations and sales of all or substantially all assets, liens, negative pledge clauses, changes in fiscal periods, changes in line of business and changes in charter documents.
As of March 25, 2011, Atkore International believes it was in compliance with all covenants of the Credit Facility and Notes. If the borrowing availability under the Credit Facility falls below certain levels, Atkore International would subsequently be required to maintain a minimum fixed charge coverage ratio. Atkore International was not subject to such financial covenant during any period subsequent to the establishment of the Credit Facility.
As of March 25, 2011 and September 24, 2010, the fair value of the short-term debt approximated its carrying amount based on the short-term nature of such debt. The fair value of the Company’s long-term debt was $443 million and $396 million as of March 25, 2011 and September 24, 2010, respectively. In determining the fair value of its long-term debt at September 24, 2010, the Company utilized a discounted cash flow technique that incorporated a market interest yield curve with adjustments for duration, optionality and risk profile. In determining the fair value of its long-term debt at March 25, 2011, the Company assessed the trading value amongst financial institutions for the Notes.
12. Guarantees
The Company has an outstanding letter of credit for $3 million supporting workers compensation and liability insurance policies. The Company also has $1 million in surety bonds primarily related to performance guarantees on supply agreements and construction contracts, and payment of duties and taxes. Tyco has guaranteed the performance to third-parties ($13 million) and provided financial guarantees for financial commitments ($5 million) on behalf of the Company. Tyco intends to obtain releases from the guarantees related to the Company.
In disposing of assets or businesses, the Company often provides representations, warranties and indemnities to cover various risks including unknown damage to the assets, environmental risks involved in the sale of real estate, liability to investigate and remediate environmental contamination at waste disposal sites and manufacturing facilities, and unidentified tax liabilities and legal fees related to periods prior to disposition. The Company does not have the ability to estimate the potential liability from such indemnities because they relate to unknown conditions. However, the Company has no reason to believe that these uncertainties would have a material adverse effect on the Company’s financial position, results of operations or cash flows.
In the normal course of business, the Company is liable for contract completion and product performance. In the opinion of management, such obligations will not significantly affect the Company’s financial position, results of operations or cash flows.
16

13. Financial Instruments
The Company’s financial instruments consist primarily of cash and cash equivalents, accounts receivable, accounts payable and debt. The fair value of cash and cash equivalents, accounts receivable and accounts payable approximated book value as of March 25, 2011 and September 24, 2010. The fair value of derivative financial instruments was not material to any of the periods presented. See Note 11 for the fair value of the Company’s debt.
14. Commitments and Contingencies
The Company has purchase obligations related to commitments to purchase certain goods and services. As of March 25, 2011, such obligations were $217 million for fiscal 2011 and nil for fiscal 2012 and thereafter.
Legal Contingencies—The Company is a defendant in a number of pending legal proceedings incidental to present and former operations, including several lawsuits alleging that the anti-microbial coated sprinkler pipe causes stress cracking in polyvinyl chloride pipe when installed with certain kinds of such pipe manufactured by unrelated parties. The Company has reserved its best estimate of the probable loss related to the matter, which is $5 million. The Company does not expect the outcome of these proceedings, either individually or in the aggregate, to have a material adverse effect on its financial position.
In October 2010, the Company was notified of an assessment by the Rio Grande do Sul State Treasury Secretariat related to the appropriateness of certain value added tax credits taken in Brazil during the periods 2005 to 2007. The Company believes the position was in accordance with the applicable law; however it has engaged a third party to assist in documenting and responding to the notice. The Company believes it will be successful in defending its position. The Company does not believe that the liability is probable or reasonably estimable and accordingly has not recorded a loss contingency related to this matter.
From time to time, the Company is subject to a number of disputes, administrative proceedings and other claims arising out of the conduct of the Company’s business. These matters generally relate to disputes arising out of the use or installation of the Company’s products, product liability litigation, contract disputes, employment matters and similar matters. On the basis of information currently available to the Company, it does not believe that existing proceedings and claims will have a material impact on its financial position or results of operations. However, litigation is unpredictable, and the Company could incur judgments or enter into settlements for current or future claims that could adversely affect its financial position.
Estimated loss contingencies are accrued only if the loss is probable and the amount of the loss can be reasonably estimated. With respect to a particular loss contingency, it may be probable that a loss has occurred but the estimate of the loss is a wide range. If the Company deems some amount within the range to be a better estimate than any other amount within the range, that amount is accrued. However, if no amount within the range is a better estimate than any other amount, the minimum amount of the range is accrued. While the Company believes that none of these claims, disputes, administrative, and legal matters will have a material adverse effect on its financial position, these matters are uncertain and the Company cannot at this time determine whether the financial impact, if any, of these matters will be material to its results of operations in the period in which such matters are resolved or a better estimate becomes available.
15. Retirement Plans
The Company sponsors a number of pension plans. The Company normally measures its pension plans as of its fiscal year end. In connection with the Transactions, the Company has obtained updated pension valuations as of the Transactions date. The application of purchase accounting resulted in a reduction to our pension liabilities of $10 million.
The Company has a number of noncontributory and contributory defined benefit retirement plans covering certain of its U.S. and non-U.S. employees, designed in accordance with conditions and practices in the countries concerned. Net periodic pension benefit cost is based on periodic actuarial valuations which use the projected unit credit method of calculation and is charged to the statements of operations on a systematic basis over the expected average remaining service lives of current participants. Contribution amounts are determined based on local regulations and the advice of professionally qualified actuaries in the countries concerned. The benefits under the defined benefit plans are based on various factors, such as years of service and compensation. The defined benefit pension plans are presented combined as the non-U.S. plans are not material to the total of all plans to warrant separate disclosure.
17

The net periodic benefit cost was $1 million, $1 million, $2 million, and $1 million for the Successor 2011 Period, the Predecessor 2011 Period, the six months ended March 26, 2010, and three months ended March 26, 2010, respectively.
The Company’s funding policy is to make contributions in accordance with the laws and customs of the various countries in which it operates and to make discretionary voluntary contributions from time-to-time. The Company anticipates that it will contribute at least the minimum required to its pension plans in fiscal year 2011, which is $2 million.
16. Segment and Geographic Data
Segment information is consistent with how management reviews the businesses, makes investing and resource allocation decisions and assesses operating performance. Selected information by business segment is presented in the following tables ($ in millions):
Successor Company Predecessor Company
For the Period from December 23
, 2010 To March 25,
2011
For the Period from
September 25, 2010 To
December 22, 2010
For the Six
Months Ended
March 26, 2010
Net sales(1):Electrical and Infrastructure....................................................................................................$226 $204 $359Engineered Products and Services..........................................................................................186 154 292Elimination of intersegment revenues.....................................................................................(6) (6) (2)
$406 $352 $649Operating income (loss):
Electrical and Infrastructure....................................................................................................$19 $13 $27Engineered Products and Services..........................................................................................15 — 28Corporate and Other................................................................................................................(30) (5) (21)
$4 $8 $34
Successor Company
Predecessor Company
For the Three Months Ended March 25, 2011
For the Three Months Ended March 26, 2010
Net sales(1):Electrical and Infrastructure....................................................................................................$226 $187Engineered Products and Services.......................................................................................... 186 158Elimination of intersegment revenues..................................................................................... (6) (1)
$406 $344Operating income (loss):
Electrical and Infrastructure.................................................................................................... $19 $13Engineered Products and Services.......................................................................................... 15 18Corporate and Other................................................................................................................(15) (14)
$19 $17
(1) Amounts represent sales to external customers and related parties (see Note 10). No single customer represented 10% or more of the Company’s total net sales in any period presented.
18

The reconciliation of operating income to income (loss) before taxes is as follows:
Successor Company Predecessor Company
For the Period from
December 23, 2010 To
March 25, 2011
For the Period from
September 25, 2010 To
December 22, 2010
For the Six Months Ended
March 26, 2010
Operating income.......................................................................................................................$4 $8 $34Interest expense, net................................................................................................................13 11 23
(Loss) income before taxes........................................................................................................$(9) $(3) $11
Successor Company
Predecessor Company
For the Three Months Ended
March 25, 2011
For the Three Months Ended
March 26, 2010
Operating income........................................................................................................................$19 $17Interest expense, net.................................................................................................................13 12
Income before taxes....................................................................................................................$6 $5
Successor Company
Predecessor Company
March 25,2011
September 24,
2010Total assets:
Electrical and Infrastructure....................................................................................................$645 $325Engineered Products and Services..........................................................................................659 472Corporate and Other................................................................................................................167 427
$1,471 $1,224
Selected information by geographic area is as follows ($ in millions):
Successor Company Predecessor CompanyFor the Period from
December 23, 2010 To March 25, 2011
For the Period from September 25, 2010 To
December 22, 2010
For the Six Months Ended March 26,
2010Net sales:
United States.............................................................................................................$331 $281 $505Other Americas.........................................................................................................52 50 105Europe.......................................................................................................................14 12 23Asia—Pacific............................................................................................................9 9 16
$406 $352 $649
19

Successor Company
Predecessor Company
For the Three
Months Ended
March 25, 2011
For the Three
Months Ended
March 26, 2010
Net sales:United States...........................................................................................................................$331 $272Other Americas....................................................................................................................... 52 54Europe..................................................................................................................................... 14 11Asia—Pacific.......................................................................................................................... 9 7
$406 $344
Successor Company
Predecessor Company
March 25,
2011
September 24,
2010Long lived assets:
United States...........................................................................................................................$317 $210Other Americas.......................................................................................................................28 32Europe..................................................................................................................................... 8 17Asia—Pacific..........................................................................................................................27 1
$355 $250
17. Subsequent Event
On May 16, 2011, the Board of Directors of Atkore Group adopted the Atkore International Group Inc. Stock Incentive Plan (the "Stock Incentive Plan"). A maximum of 6 million shares are reserved for issuance under the Stock Incentive Plan. The Stock Incentive Plan provides for stock purchases, and grants of other equity awards including non-qualified stock options, restricted stock, and restricted stock units, to officers and key employees. As of May 16, 2011, there were 183,200 shares of Atkore Group common stock outstanding as a result of stock purchases under the Stock Incentive Plan, and 871,750 shares underlying outstanding stock options issued under the Stock Incentive Plan.
Under the Stock Incentive Plan, an executive’s unvested stock options are canceled upon the termination of his or her employment, except for terminations due to death or disability. Upon death or disability, unvested stock options vest and remain exercisable for the period specified below. In the case of a termination for “cause” (as defined in the Stock Incentive Plan), the executive’s unvested and vested stock options are canceled as of the effective date of the termination. Following a termination of employment other than for “cause”, vested options are canceled unless the executive exercises them within 90 days (180 days if the termination was due to death, disability or retirement) or, if sooner, prior to the options’ normal expiration date.
If the termination of employment occurs prior to a public offering, the Atkore Group, CD&R and Tyco or its affiliates have the right to purchase any shares of Atkore Group common stock owned by the executive, including common stock that the executive acquired upon the exercise of options. Upon a termination other than for cause (as defined in the Stock Incentive Plan), the purchase price per share is equal to the fair market value (as defined in the Stock Incentive Plan) of the shares on the later of the date (i) the executive’s employment terminated and (ii) that is six months and one day after the shares were purchased by the executive. Upon termination for cause, the purchase price is equal to the lesser of fair market value and the cost of the shares to the executive.
If the Atkore Group experiences a change in control (as defined in the Stock Incentive Plan), stock options will generally accelerate and be canceled in exchange for a cash payment equal to the change in control price per share minus the exercise price of the applicable option, unless the Board of Directors of Atkore Group elects to allow alternative awards in lieu of acceleration and payment. The Board of Directors of Atkore Group also has the discretion to accelerate the vesting of options at any time and from time to time.
20

The Company has evaluated subsequent events after March 25, 2011 through May 16, 2011, the date it issued its financial statements.
18. Guarantor Financial Information
Under the credit facility Atkore International entered into December 22, 2010 (see Note 11), certain U.S. subsidiaries became guarantors on a joint and several basis of debt under this facility. The following tables present condensed combining financial information for (a) Atkore, the parent guarantor, in Successor periods, (b) Atkore International, the borrower, in Successor periods, (c) Atkore International’s domestically domiciled subsidiaries (“Guarantor Subsidiaries”); (d) Atkore International’s foreign subsidiaries (“Non-Guarantor Subsidiaries”), (e) elimination entries necessary to combine a parent guarantor with the non-guarantor subsidiaries; and (f) the Company on a consolidated basis in Successor periods and on a combined basis in Predecessor periods. The following unaudited condensed financial information presents the results of operations, financial position and cash flows and the eliminations necessary to arrive at the information for the Company on a condensed basis using the equity method of accounting for subsidiaries.
Condensed Consolidated Statements of Operations
For the Three Months Ended March 25, 2011
($ in millions)
Atkore International Holdings Inc.
Atkore International
Inc.Guarantor
Subsidiaries
Non-Guarantor
SubsidiariesEliminating Entries
Atkore Consolidate
dNet sales..............................................................................................................................................................$— $— $339 $73 $(6) $406Cost of sales........................................................................................................................................................— — 284 63 (6) 341Selling, general and administrative expenses.....................................................................................................— 3 34 8 — 45Restructuring and asset impairment charges (see Note 3)..................................................................................— — 1 — — 1
Operating (loss) income...............................................................................................................................— (3) 20 2 — 19Interest expense, net............................................................................................................................................— 3 10 — — 13
(Loss) income before income taxes.............................................................................................................— (6) 10 2 — 6Income tax expense.............................................................................................................................................— — 1 1 — 2Income from subsidiaries....................................................................................................................................(4) (10) — — 14 —Net income.........................................................................................................................................................$4 $4 $9 $1 $(14) $4
Condensed Combined Statements of Operations
For the Three Months Ended March 26, 2010
($ in millions)
Guarantor Subsidiaries
Non-Guarantor
SubsidiariesEliminating
EntriesAtkore
CombinedNet sales..............................................................................................................................................................$274 $71 $(1) $344Cost of sales........................................................................................................................................................226 61 (1) 286Selling, general and administrative expenses.....................................................................................................34 6 — 40Restructuring and asset impairment charges (see Note 3)..................................................................................1 — — 1
Operating income.........................................................................................................................................13 4 — 17Interest expense, net............................................................................................................................................10 2 — 12
Income before income taxes........................................................................................................................3 2 — 5Income tax expense.............................................................................................................................................2 2 — 4Net income.........................................................................................................................................................$1 $— $— $1
21

Condensed Consolidated Statements of Operations
For the Period from December 23, 2010 to March 25, 2011
($ in millions)
Atkore International Holdings Inc.
Atkore International
Inc.Guarantor
Subsidiaries
Non-Guarantor
SubsidiariesEliminating Entries
Atkore Consolidate
dNet sales..............................................................................................................................................................$— $— $339 $73 $(6) $406Cost of sales........................................................................................................................................................— — 284 63 (6) 341Selling, general and administrative expenses.....................................................................................................— 18 34 8 — 60Restructuring and asset impairment charges (see Note 3)..................................................................................— — 1 — — 1
Operating (loss) income...............................................................................................................................— (18) 20 2 — 4Interest expense, net............................................................................................................................................— 3 10 — — 13
(Loss) income before income taxes.............................................................................................................— (21) 10 2 — (9)Income tax expense.............................................................................................................................................— — 1 1 — 2Loss (income) from subsidiaries.........................................................................................................................11 (10) — — (1) —Net (loss) income...............................................................................................................................................$(11) (11) $9 $1 $1 $(11)
Condensed Combined Statements of Operations
For the Period from September 25, 2010 to December 22, 2010
($ in millions)
Guarantor Subsidiaries
Non-Guarantor
SubsidiariesEliminating
EntriesAtkore
CombinedNet sales..............................................................................................................................................................$288 $70 $(6) $352Cost of sales........................................................................................................................................................247 63 (6) 304Selling, general and administrative expenses.....................................................................................................33 8 — 41Restructuring and asset impairment charges.......................................................................................................(2) 1 — (1)
Operating income (loss)...............................................................................................................................10 (2) — 8Interest expense, net............................................................................................................................................10 1 — 11
Loss before income taxes.............................................................................................................................— (3) — (3)Income tax expense (benefit)..............................................................................................................................1 (1) — —Net loss...............................................................................................................................................................$(1) $(2) $— $(3)
Condensed Combined Statements of Operations
For the Six Months Ended March 26, 2010
($ in millions)
Guarantor Subsidiaries
Non-Guarantor
SubsidiariesEliminating
EntriesAtkore
CombinedNet sales..............................................................................................................................................................$508 $142 $(1) $649Cost of sales........................................................................................................................................................414 121 (1) 534Selling, general and administrative expenses.....................................................................................................67 13 — 80Restructuring and asset impairment charges (see Note 3)..................................................................................1 — — 1
Operating income.........................................................................................................................................26 8 — 34Interest expense, net............................................................................................................................................19 4 — 23
Income before income taxes........................................................................................................................7 4 — 11Income tax expense.............................................................................................................................................4 3 — 7Net income.........................................................................................................................................................$3 $1 $— $4
22

Condensed Consolidated Balance Sheet
As of March 25, 2011
($ in millions)
Atkore International Holdings Inc.
Atkore International
Inc.Guarantor
Subsidiaries
Non-Guarantor Subsidiarie
sEliminating
Entries
Atkore Consolidate
dAssetsCurrent Assets:
Cash and cash equivalents..................................................................................................................................................................$— $— $19 $30 $— $49Accounts receivable , net....................................................................................................................................................................— — 171 64 — 235Receivables due from Tyco International Ltd. and affiliates..............................................................................................................— — 1 2 — 3Inventories...........................................................................................................................................................................................— — 266 49 — 315Prepaid expenses and other current assets..........................................................................................................................................— — 23 4 — 27Deferred income taxes........................................................................................................................................................................— — 22 — — 22
Total current assets........................................................................................................................................................................— — 502 149 — 651Property, plant and equipment, net..........................................................................................................................................................— — 314 34 — 348Intangible assets, net................................................................................................................................................................................— — 268 — — 268Goodwill..................................................................................................................................................................................................— — 101 — — 101Deferred income taxes.............................................................................................................................................................................— — 50 7 — 57Investment in subsidiaries........................................................................................................................................................................594 619 — — (1,213) —Intercompany receivables........................................................................................................................................................................— 424 — — (424) —Other assets..............................................................................................................................................................................................— 36 6 4 — 46
Total Assets...................................................................................................................................................................................$594 $1,079 $1,241 $194 $(1,637) $1,471Liabilities and EquityCurrent Liabilities:
Short-term debt and current maturities of long-term debt..................................................................................................................$— $61 $— $— $— $61Accounts payable................................................................................................................................................................................— — 126 22 — 148Payable due to Tyco International Ltd. and affiliates.........................................................................................................................— — 3 — — 3Accrued and other current liabilities...................................................................................................................................................— 14 67 16 — 97
Total current liabilities...................................................................................................................................................................— 75 196 38 — 309Long-term debt.........................................................................................................................................................................................— 410 1 — — 411Deferred income taxes.............................................................................................................................................................................— — 105 (1) — 104Income taxes payable...............................................................................................................................................................................— — 23 — — 23Intercompany payables............................................................................................................................................................................— — 424 — (424) —Other liabilities.........................................................................................................................................................................................— — 27 3 — 30
Total Liabilities............................................................................................................................................................................— 485 776 40 (424) 877Successor Company Stockholder’s Equity:
Common stock and additional paid in capital..................................................................................................................600 600 456 148 (1,204) 600Accumulated deficit.........................................................................................................................................................(11) (11) 9 1 1 (11)Accumulated other comprehensive income.....................................................................................................................5 5 — 5 (10) 5
Total Successor Company Stockholder’s Equity...................................................................................................594 594 465 154 (1,213) 594Total Liabilities and Equity......................................................................................................................................$594 $1,079 $1,241 $194 $(1,637) $1,471
23

Condensed Combined Balance Sheets
As of September 24, 2010
($ in millions)
Guarantor Subsidiaries
Non-Guarantor
SubsidiariesAtkore
CombinedAssetsCurrent Assets:
Cash and cash equivalents..................................................................................................................................................................$— $33 $33Accounts receivable, net.....................................................................................................................................................................140 64 204Receivables due from Tyco International Ltd. and affiliates..............................................................................................................396 (40) 356Inventories...........................................................................................................................................................................................210 62 272Prepaid expenses and other current assets..........................................................................................................................................19 6 25Deferred income taxes........................................................................................................................................................................21 1 22
Total current assets........................................................................................................................................................................786 126 912
Property, plant and equipment, net..........................................................................................................................................................201 33 234Deferred income taxes.............................................................................................................................................................................47 5 52Other assets..............................................................................................................................................................................................17 9 26
Total Assets...................................................................................................................................................................................$1,051 $173 $1,224Liabilities and Parent Company EquityCurrent Liabilities:
Current maturities of long-term debt, including due to Tyco International Ltd. and affiliates......................................................................................................................................................
$251 $61 $312
Accounts payable................................................................................................................................................................................121 17 138Payable due to Tyco International Ltd. and affiliates.........................................................................................................................— 6 6Accrued and other current liabilities...................................................................................................................................................56 23 79
Total current liabilities...................................................................................................................................................................428 107 535
Long-term debt, net including due to Tyco International Ltd. and affiliates...............................................................................................................................................................................................
292 97 389
Income taxes payable...............................................................................................................................................................................20 - 20Other liabilities.........................................................................................................................................................................................46 1 47
Total Liabilities............................................................................................................................................................................786 205 991Commitments and contingenciesParent Company Equity:
Parent company investment................................................................................................................................................................286 (74) 212Accumulated other comprehensive (loss) income..............................................................................................................................(21) 42 21
Total Parent Company Equity....................................................................................................................................................265 (32) 233Total Liabilities and Parent Company Equity..........................................................................................................................$1,051 $173 $1,224
24

Condensed Consolidated Statements of Cash Flows
For the Period from December 23, 2010 to March 25, 2011
($ in millions)
Atkore International Holdings
Atkore Internationa
l Inc.Guarantor
Subsidiaries
Non-Guarantor
SubsidiariesEliminating
EntriesAtkore
Consolidated
Cash flows (used in) provided by operating activities $— (424) $431 $18 $— $25
Cash flows from investing activities: Capital expenditures — — (12) (3) — (15) Purchase price adjustment — (7) — — — (7) Net cash used in investing activities — (7) (12) (3) — (22)
Cash flows from financing activities Repayments of long-term debt due to Tyco International Ltd.
and affiliates, net— —
(400)— —
(400) Proceeds from issuance of senior secured notes — 410 — — — 410 Borrowings under credit facility — 61 — — — 61 Payment of debt issuance costs — (36) — — — (36) (Repayments) proceeds from short-term debt — — — (4) — (4) Capital contribution — (4) — 4 — - Net cash provided by (used in) financing activities — 431 (400) - — 31Effect of currency translation on cash — — — 1 — 1Net increase in cash and cash equivalents — — 19 16 — 35Cash and cash equivalents at beginning of period — — — 14 — 14
Cash and cash equivalents at end of period $— $— $19 $30 $— $49
Condensed Combined Statements of Cash Flows
For the Period from September 25, 2010 to December 22, 2010
($ in millions)
Guarantor Subsidiaries
Non-Guarantor
SubsidiariesEliminating
EntriesAtkore
Combined
Cash flows (used in) provided by operating activities $(77) $10 $— $(67)
Cash flows from investing activities: Capital expenditures (10) (2) — (12)
Change in due to (from) Tyco International Ltd. and affiliates 405 (48) — 357
Net cash provided by (used in) investing activities 395 (50) — 345
Cash flows from financing activities Repayments of long-term debt due to Tyco International Ltd. and affiliates, net (135) (165) — (300) Proceeds from short-term debt - 4 — 4
Change in parent company investment (183) 182 — (1)
Net cash (used in) provided by financing activities (318) 21 — (297)
Net decrease in cash and cash equivalents — (19) — (19)
Cash and cash equivalents at beginning of period — 33 — 33
Cash and cash equivalents at end of period $— $14 $— $14
25

Condensed Combined Statements of Cash Flows
For the Period from September 26, 2009 to March 26, 2010
($ in millions)
Guarantor Subsidiaries
Non-Guarantor
SubsidiariesEliminating
EntriesAtkore
Combined
Cash flows (used in) operating activities $(10) $(27) $— $(37)
Cash flows from investing activities: Capital expenditures (19) (6) — (25) Change in due to (from) Tyco International Ltd. and affiliates 59 5 — 64 Acquisition of businesses, net of cash acquired (39) — (39) Net cash provided by (used in) investing activities 1 (1) — —
Cash flows from financing activities Change in parent company investment 9 5 — 14 Net cash provided by financing activities 9 5 — 14Net decrease in cash and cash equivalents — (23) — (23)Cash and cash equivalents at beginning of period — 31 — 31
Cash and cash equivalents at end of period $— $8 $— $8
26

ATKORE INTERNATIONAL HOLDINGS INC.
MANAGEMENT’S DISCUSSION AND ANALYSIS OF FINANCIAL CONDITION AND RESULTS OF OPERATIONS
(Unaudited)
The following information should be read in conjunction with our unaudited financial statements and the related notes included elsewhere in this document. The following discussion may contain forward-looking statements that reflect our plans, estimates and beliefs. Our actual results could differ materially from those discussed in these forward-looking statements. References in this “Management’s Discussion and Analysis of Financial Condition and Results of Operations” to “us,” “our,” and “we” refer to Atkore International Holdings Inc.
CAUTIONARY STATEMENT CONCERNING FORWARD-LOOKING STATEMENTS
We make statements in this document that are not historical facts. These “forward-looking statements” can be identified by the use of terms such as “may,” “intend,” “might,” “will,” “should,” “could,” “would,” “expect,” “believe,” “estimate,” “anticipate,” “predict,” “project,” “potential,” or the negative of these terms, and similar expressions. You should be aware that these forward-looking statements are subject to risks and uncertainties that are beyond our control. Further, any forward-looking statement speaks only as of the date on which it is made and we undertake no obligation to update any forward-looking statement to reflect events or circumstances after the date on which it is made or to reflect the occurrence of anticipated or unanticipated events or circumstances. New factors emerge from time to time that may cause our business not to develop as we expect, and it is not possible for us to predict all of them.
Overview
We are a global manufacturer of fabricated steel tubes and pipes, pre-wired armored cables, cable management systems and metal framing systems. Our products are used primarily in non-residential construction applications, including installation of electrical systems, site perimeter security fences, steel pipe scaffolding, fire sprinkler pipe and protection systems and metal framing for various support structures. Our company operates through two business segments: Electrical and Infrastructure and Engineered Products and Services. Our Electrical and Infrastructure segment offers a broad and diverse range of electrical products, including (1) electrical conduits, (2) armored and metal-clad cable and (3) cable support systems. Products manufactured by our Engineered Products and Services segment include (1) mechanical tube, (2) fence framework, (3) fire sprinkler pipe, (4) metal framing systems, (5) hollow structural sections, and (6) sheets and plates, each of which is customized in a wide range of shapes, sizes and specifications. Through our Engineered Products and Services segment, we also provide ancillary services to our customers in the form of slitting and cutting of structural steel sheets, which are sold primarily to metal service centers.
We operate 25 manufacturing facilities and 15 distribution facilities that are strategically located to efficiently receive materials from our suppliers as well as deliver products to our customers. Our global footprint has been streamlined in recent years to improve manufacturing capacity utilization across our facilities and to enhance the efficiency of our transportation and logistics networks. To complement these efforts, in fiscal 2010 we completed a 500,000 square foot addition to our original facility in Harvey, Illinois to consolidate warehouse capacity, reduce logistics cost and handling damage, and expand our corporate offices.
We distribute our products to end-users through several distinct channels, including electrical distributors, home improvement retailers, industrial distributors, HVAC and plumbing distributors, datacom distributors and OEMs, as well as directly to a small number of general contractors. Many of our products are ultimately installed into non-residential and multi-family residential buildings during new construction and renovation by end-users, who are typically trade contractors. We serve a diverse group of end markets, including commercial construction, diversified industrials, power generation, agricultural, retail, transportation and government. The majority of our sales and operations are in North America. In fiscal 2010, 79% of our net sales were tied to customers located in the U.S. We also have a significant manufacturing and sales presence in Brazil and, to a lesser extent, in the United Kingdom, France, Australia and New Zealand. We also have a minority interest in a joint venture in the Middle East.
27

Our business is largely dependent on the non-residential construction industry. Approximately 60% of our net sales in fiscal 2010 were related to U.S. non-residential construction, where our product installation typically lags U.S. non-residential starts by six to nine months. U.S. non-residential construction starts, as reported by McGraw-Hill Construction – Dodge, Research & Analytics, reached an historic low of 650 million square feet in calendar year 2010. This level of activity is significantly below the previous cyclical troughs witnessed from 1967 through 2008, during which time non-residential construction starts did not fall below 936 million square feet in any given calendar year. We expect to capitalize on any recovery in non-residential construction activity over the coming years and potentially drive higher margins by leveraging the scalability of our operations.
Business Factors Influencing our Results of Operations
Our customers include OEMs, retail distributors, wholesale distributors and general contractors, serving a variety of end markets. In fiscal 2010, $1,128 million, or 79% of our net sales, were tied to customers located in the U.S. As a result, our operating results have been, and will continue to be, impacted by macroeconomic trends in the U.S. In particular, our sales activity in the U.S. is heavily dependent on non-residential construction activity. Electrical conduits, armored cable, strut channel, cable tray, fire sprinkler pipe, fence framework and metal framing are building materials that are directly impacted by U.S. non-residential construction activity.
We believe that our business is influenced by three main economic indicators: U.S. gross domestic product, or “GDP,” non-residential construction starts measured in terms of square footage and, to a lesser extent, the GDP of Brazil. The table below lists these metrics and their year-over-year trends from fiscal 2008 through fiscal 2010 as well as the period from September 25, 2010 through March 25, 2011:
Fiscal Year EndedPeriod from
Sept. 25, 2010 through
March 25, 2011 Sept. 24, 2010 Sept. 25, 2009 Sept. 26, 2008
U.S. GDP (% growth (decline) period-over-period).........................................................................................2.5% 3.3% (2.7)% (0.3)%
U.S. non-residential starts, mil sq ft (a) (% growth (decline) period-over-period).................................3.4% (25.4)% (40.4)% (11.2)%
Brazilian GDP (b) (% growth (decline) period-over-period)....................................................................N/A 7.5% (0.6)% 5.2%
(a) Source: McGraw-Hill Construction—Dodge, Research & Analytics
(b) Source: Institute of Applied Economic Research. Note: Calendar year data, other than for the period from September 25, 2010 through March 25, 2011, for which there is currently no data available
U.S. GDP growth rate trends are generally indicative of the strength in demand for our products. Historically, we have seen that year-over-year increasing U.S. GDP growth rates can be indicative of positive trends in our results, as a stronger economy generally increases demand for our products. The opposite is also generally true; decreases in U.S. GDP growth rates can signal negative trends in our results, as a weaker economy generally reduces demand or weakens pricing for our products. Similar to the U.S., Brazil’s GDP growth rate trends are generally indicative of the strength and demand for our products in Brazil.
In the U.S., non-residential construction had been strong through 2007, but slowed significantly in 2008 and 2009. Beginning in fiscal 2008 and throughout 2009, prolonged financial market and economic turmoil impacting the U.S. and the rest of the world caused a significant downturn in almost all of the end markets we serve, as the U.S. non-residential construction market suffered severe declines. As a result, demand for our products suffered an unprecedented and sharp decline. In fiscal 2010, shipments of North American steel products, in tons, declined further by 1% as compared to fiscal 2009 (excluding shipments related to the assets of the Novamerican Steel business we acquired from Barzel Industries in November 2009), and shipments of armored cable products, in feet, declined further by 13% as compared to fiscal 2009.
The cost of sales for our products is predominantly impacted by the cost of steel and, to a lesser extent, copper. Together, steel and copper raw material costs accounted for 61% of our cost of sales in fiscal 2010. We purchase raw
28

material inputs 60-90 days before we produce final products and we price our products based on a spread over the price of our commodity inputs. Our products are subject to intense price competition, with selling prices for finished products based on prevailing market prices for the primary commodity input in the product. As we account for inventory consumption using the first-in, first-out method in accordance with industry practice, and because we are required to maintain sufficient inventories to accommodate the needs of our customers, including, in many cases, short lead times and just-in-time delivery requirements, our gross margin is subject to changes in the market price of copper and steel, which at times can be rapid and dramatic.
In recent years, the quarterly fluctuation in the market price for steel has been one of the most significant factors impacting our cost of sales and revenue. For example, when steel prices begin to fall, we may still have steel that was purchased at higher prices included in our cost of sales. As steel prices fall, selling prices for our products will begin to contract to what the market will bear. The combination of higher costs of sales and selling price compression negatively impacts our earnings. Conversely, in a rising steel price environment, our earnings are generally favorably impacted as lower-priced inventory is included in our cost of sales and selling prices for our products increase at a faster pace to cover current replacement costs.
Besides steel, the quarterly fluctuation in the market price for copper has been one of the most significant factors impacting our cost of sales and revenue, mainly for our Electrical and Infrastructure segment, because our armored and metal-clad electrical cable products have copper wires encased in a protective metal jacket. For example, when copper prices begin to fall, we may still have copper that was purchased at higher prices included in our cost of sales. As copper prices fall, selling prices for our products will begin to contract to what the market will bear. The combination of higher cost of sales and selling price compression negatively impacts our earnings. Conversely, in a rising copper price environment, our earnings are generally favorably impacted as lower-priced inventory is included in our cost of sales and selling prices for our products increase at a faster pace to cover current replacement costs.
The table below shows the average market price per ton of hot-rolled and cold-rolled steel and average market price per pound of copper for the last three fiscal years, including on a quarterly basis since the second quarter of fiscal 2009.
Fiscal Quarter Ended Fiscal Year Ended
Mar 25,2011
Dec 24,2010
Sept 24,
2010
Jun 25,
2010
Mar 26,
2010
Dec 25,
2009
Sept 25,
2009
Jun 26,
2009
Mar 27,
2009
Dec 26,
2008Sept 24,
2010
Sept 25,
2009
Sept 26,
2008Hot-rolled steel (a)
(period average, $/ton)................................$ 796 $ 557
$583 $ 682 $ 592 $ 528 $ 491 $ 399 $ 509 $ 714 $ 596 $ 528 $ 814
Cold-rolled steel (a) (period average, $/ton)................................ 904 665 701 792 715 638 599 480 596 807 712 620 908
Copper prices (b) (period average, $/pound)..........................4.38 3.92 3.29 3.19 3.28 3.02 2.66 2.12 1.56 1.77 3.19 2.02 3.53
(a) Source: CRU (U.S. domestic, FOB Midwest spot price)
(b) Source: London Metal Exchange (LME)
As illustrated by the table above, commodity raw material prices for steel and copper have fluctuated significantly over the past three years, and have been especially volatile on a quarterly basis as well. Commodity prices fell precipitously during the first fiscal quarter of 2009 and continued to fall throughout the second and third fiscal quarters, stabilizing in the fourth fiscal quarter. The rapid decrease in commodity prices led to lower sales prices offered to customers and falling margins on our product sales throughout fiscal 2009.
In the first half of fiscal 2010, copper and steel commodity prices rebounded from the unusually low prices seen in fiscal 2009, resulting in a favorable impact on our gross margins. During the first half of fiscal 2011, steel commodity prices have increased approximately $200 per ton, while copper prices reached all-time highs.
We also watch the market trends of certain other commodities such as zinc (used in the galvanization process for a number of our products), electricity, natural gas and diesel fuel, as such commodities can be important to us as they can impact our cost of sales, both directly through our plant operations and indirectly through transportation and freight expense.
29

Our working capital needs are substantial and fluctuate based on economic activity and the market prices for our main raw materials, steel and copper. We are typically obligated to pay for our raw material purchases within 30 days of receipt, while we generally collect cash from the sale of manufactured products several months after receipt of raw materials. Our cash requirements for inventory typically rise during periods of increased economic activity as we generally maintain higher quantities of inventory to satisfy customer demand or if we expect the price of our raw materials to increase. Also, as raw materials prices rise, our average selling prices tend also to rise which results in an increase in total accounts receivable. During slower economic periods, we may experience decreasing raw material costs and may maintain lower quantities of raw materials. As our payment cycle tends to be significantly shorter than our collection cycle, we manage our processes to maintain efficient inventory levels and keep days of sales outstanding in line with our terms. We believe our working capital needs and working capital management policies are not unlike those of our competitors. Our working capital needs are also shaped by lead times for our main raw materials, steel and copper, as we generally increase raw material inventories if we expect lead times to increase. Steel lead times, for example, are influenced by annual cycles of demand and overall economic activity.
Fiscal 2011 Transactions
On December 22, 2010, Tyco International Ltd. (“Tyco”) sold a majority interest in Atkore International Group Inc. (“Atkore Group”) to an affiliate of the private equity firm Clayton Dubilier & Rice, LLC (“CD&R”). We are 100% owned by Atkore Group. The transaction was completed at the end of business on December 22, 2010. In connection with the closing, our 100% owned subsidiary Atkore International, Inc. (“Atkore International”) paid Tyco cash proceeds of $400 million for the repayment of indebtedness due to Tyco. In order to finance the transaction Atkore International issued senior secured notes in the face amount of $410 million, due on January 1, 2018, with a coupon of 9.875% and obtained an asset-backed credit facility (“ABL Credit Facility”) of up to $250 million, of which $55 million was drawn as of December 22, 2010. Collectively, the transactions described herein are referred to as the “Transactions.” This acquisition is accounted for as a business combination using the acquisition method of accounting, whereby the purchase price is allocated to tangible and intangible assets acquired and liabilities assumed, based on their estimated fair market values, with the remainder being allocated to goodwill. The purchase price allocation is preliminary and could change materially in future periods. The final purchase price allocation is pending the receipt of valuation work and the completion of our review of such work. Any subsequent changes to the purchase price allocation that result in material changes to our consolidated financial results will be adjusted retrospectively.
The Electrical and Metal Products Business of Tyco (“TEMP”) prior to the sale described above is considered a predecessor company (the “Predecessor Company”) to us. The combined statements of operations and cash flows for periods ended March 26, 2010 and December 22, 2010, and the combined balance sheet as of September 24, 2010 include the results of operations, cash flows and the financial condition of TEMP reflecting the historical carrying values of that business on a predecessor basis.
The financial statements as of March 25, 2011 and for the period then ended include the financial condition, results of operations and cash flows for us on a successor basis, reflecting the impacts of the preliminary purchase price allocation.
The results reported in the Predecessor Company’s combined financial statements should not be taken as indicative of results that may be expected for the entire year. Additionally, the Predecessor Company’s combined financial statements may not be indicative of the Company’s future performance and do not necessarily reflect what its combined results of operations, financial position and cash flows would have been had the Company operated as an independent, standalone company during the periods presented. To the extent that an asset, liability, revenue or expense is directly associated with the Company, it is reflected in the accompanying combined financial statements. Certain general corporate overhead and other expenses have been allocated by Tyco to us (see Note 10 to our financial statements). Management believes such allocations are reasonable; however, they may not be indicative of the actual expenses that would have been incurred had we been operating as an independent, standalone company for the periods presented, nor are they indicative of the costs that will be incurred in the future as an independent, standalone company.
Effect of the Transactions
The Transactions resulted in a change in ownership of Atkore Group and are accounted for in accordance with accounting guidance for business combinations and, accordingly resulted in the recognition of assets and liabilities assumed at fair value as of December 22, 2010. The preparation of the Predecessor Company financial statements includes the use of “push down” accounting procedures wherein certain assets, liabilities and expenses historically recorded or incurred at the Tyco level, which related to or were incurred on our behalf and have been identified and allocated or pushed down as
30

appropriate to reflect the stand-alone financial results of Atkore International for the periods presented. Additionally, the purchase price paid in the Transactions has been “pushed down” to our financial statements. The allocation of the purchase price has been recorded based on preliminary valuation studies. The allocation of the purchase price is subject to change based on finalization of these valuation studies and the determination of other facts impacting fair value estimates.
Matters Affecting Comparability of Results
The Transactions, which occurred on December 22, 2010, resulted in acquisition of control of our company by CD&R, and have been accounted for in accordance with accounting guidance for business combinations using the acquisition method of accounting, whereby the purchase price was preliminarily allocated to tangible and intangible assets acquired and liabilities assumed, based on their estimated fair values as of December 22, 2010. Fair-value measurements have been applied based on assumptions that market participants would use in the pricing of the asset or liability. See Note 2 to our unaudited financial statements for a table summarizing the preliminary allocation of fair value to the net assets acquired as of December 22, 2010.
For purposes of this “Management’s Discussion and Analysis of Financial Condition and Results of Operations,” the results of operations for all periods prior to December 22, 2010 are those of TEMP prior to the Transactions. Subsequent to December 22, 2010, we began operating as an independent, standalone entity. The results of operations for periods beginning on December 23, 2010 are those of our company subsequent to the Transactions (“Successor Company”). The financial statements for the period from December 23, 2010 through March 25, 2011 include the financial condition, results of operations and cash flows for our company on a successor basis, reflecting the impact of the preliminary purchase price allocation.
Generally accepted accounting principles in the United States of America (“U.S. GAAP”) do not allow for the combination of the financial results of our Predecessor Company and Successor Company as this approach yields results that are not comparable on a period-by-period basis due to the new basis of accounting established at the date of the Transactions.
Additionally, the Predecessor Company’s combined financial statements may not be indicative of our future performance and do not necessarily reflect what our combined results of operations, financial position and cash flows would have been had we operated as an independent, standalone company during the periods presented. To the extent that an asset, liability, revenue or expense is directly associated with our company, it is reflected in our financial statements. Certain general corporate overhead and other expenses have been allocated by Tyco to us (see Note 10 to our unaudited financial statements). We believe such allocations are reasonable; however, they may not be indicative of the actual expenses that would have been incurred had we been operating as an independent, standalone company for the periods presented, nor are they indicative of the costs that will be incurred in the future as an independent, standalone company.
Allocation of Purchase Price
The allocation of the purchase price to the assets acquired and liabilities assumed based on their respective fair values resulted in changes in the values of tangible and intangible assets. The adjustment of property and equipment basis and remaining useful lives affects comparability of depreciation expense for the Predecessor Company and Successor Company. Allocation of the purchase price to inventory and intangible assets affects the comparability of cost of goods sold and amortization expense between Predecessor and Successor periods.
As of March 25, 2011, the purchase price allocation is preliminary and could change materially in subsequent periods. Any subsequent changes to the purchase price allocation that result in material changes to our consolidated financial results will be adjusted retrospectively. The final purchase price allocation is pending the finalization of valuation work and the completion of our internal review of such work, which is expected to be completed during fiscal 2011. The provisional items pending finalization include, but are not limited to, the valuation of our property and equipment, operating lease intangible assets and liabilities, inventory, intangible assets, goodwill, pension obligations and income tax related matters. These adjustments could include, but are not limited to, adjustments to reflect the fair value of tangible and intangible assets and liabilities acquired, and the resulting goodwill. In addition, the Transactions resulted in the recognition of $94 million of goodwill, which is not deductible for income tax purposes. Goodwill consists of the excess of the purchase price over the fair value of the acquired assets and represents the estimated economic value attributable to future operations.
31
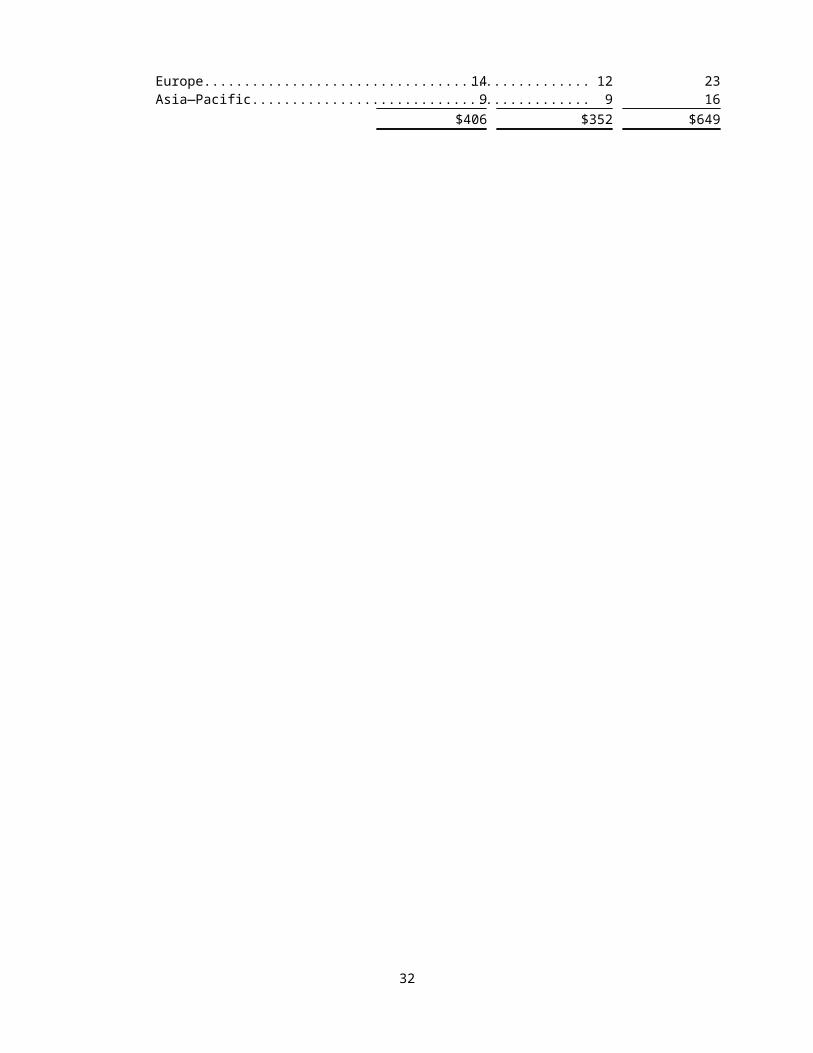
New Debt Structure
In connection with the Transactions, certain payments were made to a Tyco affiliate in order to retire Predecessor debt instruments. This change in long-term debt and related debt issuance costs affects the comparability of interest expense between the Predecessor and Successor periods.
General and Administrative Expense
Transaction costs expensed in the Predecessor and Successor periods have a significant impact on results and comparability between periods.
Provision For (Benefit From) Income Taxes
Non-deductibility of certain of the costs incurred in connection with the Transactions impacted the income tax rates in both the Successor period from December 23, 2010 through March 25, 2011 and the Predecessor period from September 25, 2010 through December 22, 2010.
For the reasons discussed above, our financial statements after December 23, 2010 are not comparable to those prior to that date.
Results of Operations
For purposes of this “Management’s Discussion and Analysis of Financial Condition and Results of Operations,” related to the discussion of interim year-to-date results, we separately show the results of operations of the Predecessor Company for the period from September 25, 2010 (the beginning of fiscal 2011) through December 22, 2010 (the date on which the Transactions occurred) and the results of operations of the Successor Company for the period from December 23, 2010 through March 25, 2011 (the end of our second quarter in fiscal 2011) along with the results of operations of the Predecessor Company for the six months ended March 26, 2010 (the end of our second quarter in fiscal 2010). We also separately show the results of operations for the second fiscal quarter of the Predecessor Company (the three month period from December 26, 2009 to March 26, 2010) and the Successor Company (the three month period from December 25, 2010 to March 25, 2011).
The tables below summarize key components of our operating results for the periods discussed in this section. The results of operations for all periods prior to December 22, 2010 are those of the Predecessor Company. Subsequent to December 22, 2010, we began operating as an independent, standalone entity. The results of operations for periods beginning on December 23, 2010 are those of the Successor Company. As a result of the Transactions, the financial statements after December 22, 2010 are not comparable to those prior to that date.
32

Quarter ended March 25, 2011 (Successor) compared to the quarter ended March 26, 2010 (Predecessor)
The following table sets forth our results of operations and their percentage of net sales for the periods shown ($ in millions):
Consolidated Successor Combined PredecessorPeriod
Dec. 25, 2010 to
Mar. 25,2011
% of NetSales
Period Dec. 26, 2009 to
Mar. 26,2010
% of NetSales
Net sales...........................................................................................$ 406 100% $ 344 100%Cost of sales..................................................................................... 341 84% 286 83%
Gross margin.............................................................................. 65 16% 58 17%Selling, general and administrative expenses.................................. 45 11% 40 12%Restructuring and asset impairment charges.................................... 1 0% 1 0 %
Operating income 19 5% 17 5%Interest expense, net......................................................................... 13 3 % 12 4 %
Income before income taxes...................................................... 6 2% 5 1%Income tax expense.......................................................................... 2 1 % 4 1 %
Net income..................................................................................$ 4 1 % $ 1 0 %
Net Sales
Net sales for the period December 25, 2010 to March 25, 2011 (the “2011 Period”) were $406 million, an increase of $62 million compared to $344 million for the period December 26, 2009 to March 26, 2010 (the “2010 Period”). Average selling prices for our North American electrical steel conduit, armored and metal-clad cable and steel pipe and tube were higher in the 2011 Period compared to the 2010 Period. The aggregate favorable impact of higher selling prices was approximately $42 million. The increase in average selling prices was due primarily to significantly higher average steel and copper market prices in the 2011 Period compared to the 2010 Period. Furthermore, we experienced an $8 million favorable impact due to North American volume shipped in the 2011 Period as compared to the 2010 Period. Sales also increased by $5 million across our metal framing businesses outside of North America.
Changes in foreign currency exchange rates had a favorable impact of $4 million, primarily as a result of the depreciation of the U.S. dollar versus the Brazilian real.
Cost of Sales
Cost of sales for the 2011 Period was negatively impacted by $13 million as inventory was sold that had a stepped-up value as the result of applying purchase accounting. Other impacts of purchase accounting also negatively impacted cost of sales by approximately $1 million, primarily due to increases in depreciation charges. Excluding these impacts, cost of sales increased by $41 million to $327 million in the 2011 Period compared to $286 million in the 2010 Period. The higher cost of sales in the 2011 Period is primarily due to increases in the volume of North American steel pipe and tube shipped as well as increases in steel and copper raw materials costs compared to the 2010 Period. The unfavorable impact of higher raw material prices for steel and copper was approximately $20 million. Cost of sales as a percent of net sales decreased to 81% in the 2011 Period from 83% in the 2010 Period.
Gross Margin
Excluding the purchase accounting impacts to cost of sales, gross margin increased by $21 million to $79 million in the 2011 Period compared to $58 million in the 2010 Period. The increase in gross margin was primarily due to higher average selling prices only partly offset by higher steel and copper raw material costs in North America. The favorable impact of higher average selling prices for North America was approximately $42 million. Gross margin was also favorably impacted by $2 million due to the net change in North American volume in the 2011 Period compared to the 2010 Period.
33

We generally sell our products on a spot basis (and not under long-term contracts). As a result, as the cost of the raw materials that compose these products to us declines, our customers generally seek price concessions. In addition, we account for consumption of inventory in our cost of sales using the first-in, first-out method. This means that in the short term, in a declining price environment our net sales will decline and our gross margins will contract or even turn negative, assuming the quantities of the affected products sold remain constant, as we consume inventories valued at higher prices based on the first-in, first-out method. Such declines may be material. Rising steel and copper prices have the opposite effect in the short term, increasing both net sales and gross margin, assuming the quantities of the affected products sold remain constant. This positively impacted gross margin for the 2011 Period.
Selling, General & Administrative
The 2011 Period includes a $3 million increase related to the application of purchase accounting, primarily due the amortization of intangible assets. Excluding this impact, selling, general and administrative expense, which includes sales commissions, increased $2 million to $42 million for the 2011 Period compared to $40 million in the 2010 Period.
Total selling expense, which primarily represents sales commissions, increased by approximately $3 million to $20 million compared to $17 million in the 2010 Period, primarily as a result of higher selling prices for North American products.
Excluding the impact of purchase accounting, general and administrative expenses of $23 million in the 2011 Period were unchanged from the prior-year period.
Restructuring and Asset Impairment Charges
New restructuring and asset impairment charges were less than $1 million in both periods, and represent additional charges associated with previously initiated actions.
Interest Expense, net
Interest expense, net was $13 million for the 2011 Period, as compared to $12 million in the 2010 Period. Interest expense in the 2011 Period is primarily attributable to interest on the senior secured notes issued in connection with the Transactions, which bear interest at 9.875% per annum. Interest expense in the 2010 Period is primarily attributable to borrowings then outstanding with Tyco.
Income Tax Expense
Income tax expense for the 2011 Period was $2 million compared to $4 million in the 2010 Period. The effective tax rate of 73% for the 2010 Period is significantly impacted by the mix of earnings geographically, including the impact of incurring losses without an associated tax benefit, as well as discrete items. As discussed in Note 4 to our financial statements, Tyco has agreed to indemnify us for such matters. For the 2011 Period, the effective tax rate is 33%.
Results of Operations by Segment
Segment information is consistent with how management reviews the businesses, makes investing and resource allocation decisions and assesses operating performance. Selected information by business segment is presented in the following tables ($ in millions):
Electrical and Infrastructure
Consolidated Successor
Combined Predecessor
Period Dec. 25, 2010 to Mar. 25,
2011
Period Dec. 26, 2009 to Mar. 26,
2010Net sales....................................................................................................... $ 226 $ 187Operating income......................................................................................... 19 13
34

Net Sales
Net sales for the 2011 Period increased $39 million from the 2010 Period to $226 million. Our North American electrical steel conduit and armored and metal-clad cable products generally have the largest impact on net sales in this segment. These products are used for the protection and routing of electrical wire. Electrical steel conduit products include electrical metallic tubing, intermediate metal conduit and rigid steel conduit. Our armored and metal-clad cable products include AC-90®, Mc-Quik® and Mc-Tuff®.
Higher average selling prices in the 2011 Period for both electrical steel conduit and armored and metal-clad cable products had a favorable impact of $28 million, offset in part by lower tons of electrical steel conduit and lower volume of footage sold for armored and metal-clad cable products resulting in a negative impact of approximately $7 million. In response to higher commodity prices for steel and copper raw material, average selling prices for electrical steel conduit products were 25% higher compared to the 2010 Period and average selling prices for armored and metal-clad cable products were 20% higher compared to the 2010 Period. The continued weakness in the non-residential construction market in North America, as described above, contributed to lower volumes for both electrical steel conduit, down 4%, and for armored and metal-clad cable products, down 5%. Changes in foreign currency exchange rates, primarily as a result of the depreciation of the U.S. dollar against the Australian and Canadian dollars had a favorable impact of approximately $1 million. A general recovery in volumes and selling prices for our cable management systems business resulted in a $8 million increase in sales.
Operating Income
The impacts of purchase accounting negatively impacted operating income in the 2011 Period by $10 million. Excluding this impact, operating income for the 2011 Period increased approximately $16 million from the 2010 Period. The $16 million increase in operating income was primarily due to a $28 million favorable impact from higher average selling prices for North American electrical steel conduit and armored and metal-clad cable offset in part by an unfavorable impact of $10 million from higher raw material steel and copper costs and an unfavorable impact of $4 million for lower volume of electrical steel conduit and armored and metal-clad cable products. Raw material steel costs for electrical steel conduit were 6% higher and raw material copper costs for armored and metal-clad cable products were 26% higher in the 2011 Period compared to the 2010 Period.
Engineered Products and Services
Consolidated Successor
Combined Predecessor
Period Dec. 25, 2010 to Mar. 25,
2011
Period Dec. 26, 2009 to Mar. 26,
2010Net sales....................................................................................................... $ 186 $ 158Operating income......................................................................................... 15 18
Net Sales
Net sales for the 2011 Period increased $28 million from the 2010 Period to $186 million. Our North American steel pipe and tube products generally have the largest impact on net sales in this segment. Steel pipe and tube products include mechanical tube, fence pipe, fire sprinkler and A53 pipe and hollow structural sections. This gain was primarily due to both higher average selling prices, resulting in a favorable impact of $14 million, and an increase in the volume of tons shipped, resulting in a favorable impact of $14 million versus the 2010 Period. North American average selling prices were up 12% and volume shipped for steel products was up 15% in the 2011 Period versus the 2010 Period. The higher steel volume was reflective of the strengthening U.S. economy. Changes in foreign currency exchange rates, primarily as a result of the depreciation of the U.S. dollar against the Brazilian real, had a favorable impact of $3 million in the 2011 Period versus the 2010 Period.
Operating Income
The impacts of purchase accounting negatively impacted operating income in the 2011 Period by $6 million. Excluding this impact, operating income for the 2011 Period was $3 million higher as compared to the 2010 Period. The increase in operating income, exclusive of purchase accounting adjustments, in the 2011 Period compared to the 2010 Period was primarily due to a $14 million favorable impact from higher average selling prices and a $2 million favorable impact
35

from higher volume shipped, partly offset by higher average raw material steel costs for North American steel pipe and tube products, up 19% compared to the 2010 Period, which had an unfavorable impact of approximately $10 million. Increased selling expenses also negatively impacted operating income.
Corporate and Other
“Corporate and Other” as included in the footnotes to our financial statements represents corporate administrative expense, including allocations from Tyco. The Corporate and Other operating loss for the 2011 Period was $15 million, an increase of $1 million from the 2010 Period expense of $14 million, primarily due to expenses associated with the Transactions that were completed on December 22, 2010.
Period from September 25, 2010 through December 22, 2010 (Predecessor), the period from December 23, 2010 through March 25, 2011 (Successor) and the six months ended March 26, 2010 (Predecessor)
The following table sets forth our results of operations and their percentage of net sales for the periods shown ($ in millions):
Consolidated Successor Combined Predecessor
Period from
Dec. 23, 2010
through March
25, 2011
% of Net
Sales
Period from Sept.
25, 2010 through Dec. 22,
2010
% of Net
Sales
Six months ended March
26, 2010
% of Net
SalesNet sales................................................................................... $406 100% $352 100% $649 100%Cost of sales............................................................................. 341 84% 304 86% 534 82%
Gross margin...................................................................... 65 16% 48 14% 115 18%Selling, general and administrative expenses.......................... 60 15% 41 12% 80 12%Restructuring and asset impairment charges............................ 1 0% (1) 0% 1 0%
Operating income (loss)..................................................... $4 1% $8 2% $34 5%Interest expense, net................................................................. 13 3% 11 3% 23 4%
Income (loss) before income taxes.................................... (9) (2) % (3) (1%) 11 1%Income tax (benefit) expense................................................... 2 (1) % – 0% 7 1%
Net income (loss)................................................................ $(11) (3)% $(3) (1%) $4 0%
Net Sales
Net sales were $406 million in the Successor period from December 23, 2010 to March 25, 2011 (the “Successor 2011 Period”) and $352 million in the Predecessor period from September 25, 2010 to December 22 2010 (the “Predecessor 2011 Period”), compared to $649 million for the six months ended March 26, 2010.
Average selling prices for our North American electrical steel conduit, armored and metal-clad cable and steel pipe and tube products were higher in both the Successor and Predecessor periods compared to the six months ended March 26, 2010. Furthermore, we experienced higher daily average volume for our North American steel pipe and tube products in each of the Successor 2011 Period and Predecessor 2011 Period, as compared to the daily average volume for the six months ended March 26, 2010, due in part to a modest improvement in the general economy in North America.
Changes in foreign currency exchange rates had a favorable impact of $4 million in the Successor 2011 Period and a favorable impact of $2 million Predecessor 2011 Period, primarily as a result of the depreciation of the U.S. dollar versus the Brazilian real.
36
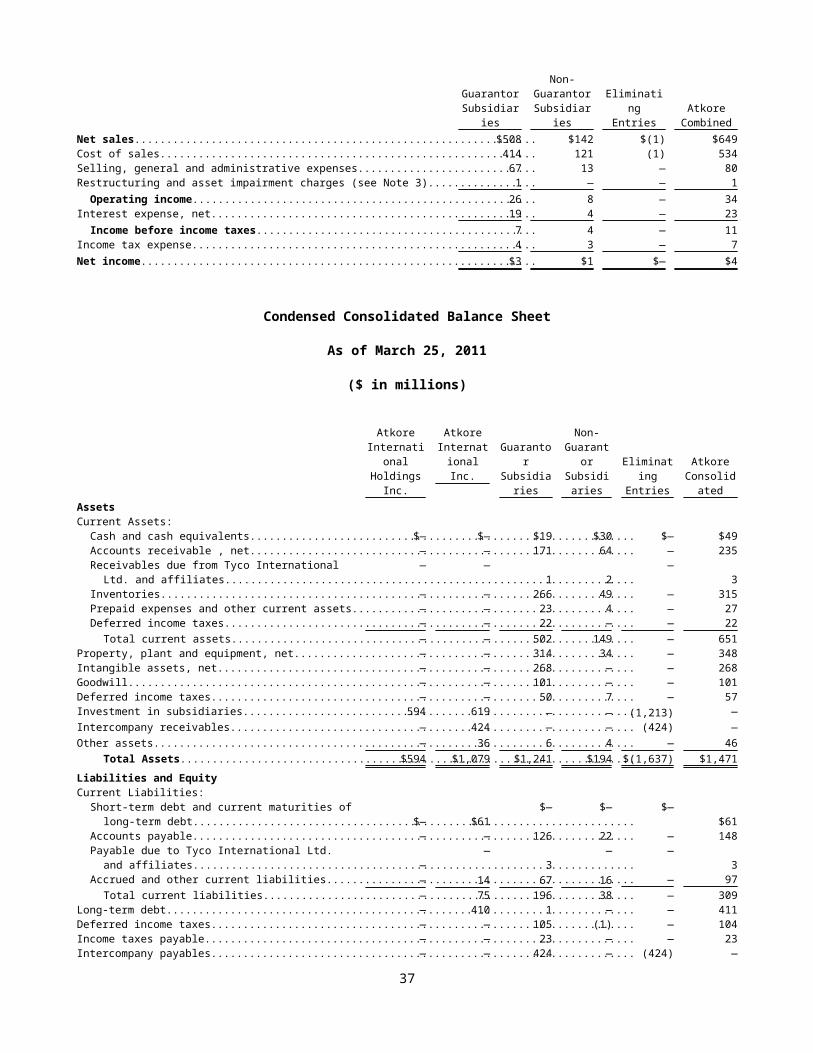
Cost of Sales
Cost of sales for the Successor 2011 Period was negatively impacted by $13 million as inventory was sold that had a stepped-up value as the result of applying purchase accounting. Other impacts of purchase accounting negatively impacted cost of sales by approximately $1 million, primarily due to increases in depreciation charges. Excluding these impacts, cost of sales were $328 million in the Successor 2011 Period and $304 million in the Predecessor 2011 Period, compared to $534 million for the six months ended March 26, 2010. Excluding the impacts of purchase accounting, cost of sales as a percent of net sales was 81% in the Successor 2011 Period and 86% in the Predecessor 2011 Period, compared to 82% for the six months ended March 26, 2010. Average raw material costs for our North American electrical steel conduit, armored and metal-clad cable and steel pipe and tube were higher in both the Successor and Predecessor periods compared to the six months ended March 26, 2010.
Gross Margin
Excluding the purchase accounting impacts to cost of sales described above, gross margin was $78 million in the Successor 2011 Period and $48 million in the Predecessor 2011 Period and $115 million for the six months ended March 26, 2010. Gross margin as a percent of net sales was 19% in the Successor 2011 Period and 14% in the Predecessor 2011 Period and 18% for the six months ended March 26, 2010. The gross margin percent of net sales in the Predecessor 2011 Period was lower than the other two periods primarily due to higher raw material costs relative to average selling prices for North American steel electrical conduit and steel pipe and tube products.
We generally sell our products on a spot basis (and not under long-term contracts). As a result, as the cost of the raw materials that compose these products to us declines, our customers generally seek price concessions. In addition, we account for consumption of inventory in our cost of sales using the first-in, first-out method. This means that in the short term, in a declining price environment our net sales will decline and our gross margins will contract or even turn negative, assuming the quantities of the affected products sold remain constant, as we consume inventories valued at higher prices based on the first-in first-out method. Such declines may be material. Rising steel and copper prices have the opposite effect in the short term, increasing both net sales and gross margin, assuming the quantities of the affected products sold remain constant.
Selling, General & Administrative
The Successor 2011 Period includes a $3 million increase related to the application of purchase accounting, primarily due the amortization of intangible assets. Excluding this impact, selling, general and administrative expense, which includes sales commissions, was $57 million in the Successor 2011 Period and $41 million in the Predecessor 2011 Period, compared to $80 million for the six months ended March 26, 2010. Selling, general and administrative expense as a percent of net sales, excluding the impact of purchase accounting, was 14% in the Successor 2011 Period and 12% in the Predecessor 2011 Period, and 12% for the six months ended March 26, 2010.
Total selling expense, which primarily represents sales commissions, was $20 million in the Successor 2011 Period and $18 million in the Predecessor 2011 Period, compared to $34 million for the six months ended March 26, 2010, primarily as a result of higher selling prices and volume for North American steel tubular products and higher selling prices for North American armored cable products during the six months ended March 26, 2010, which were partly offset by lower volume for such products.
Excluding the impact of purchase accounting, general and administrative expense was $37 million in the Successor 2011 Period and $23 million in the Predecessor 2011 Period, and $46 million for the six months ended March 26, 2010. General and administrative expense for the Successor 2011 Period included $16 million of expense associated with the Transactions that were completed on December 22, 2010.
Restructuring and Asset Impairment Charges
Restructuring and asset impairment charges were $1 million in the Successor 2011 Period. In the Predecessor 2011 Period we recorded a $1 million reversal, compared to $2 million in restructuring and asset impairment charges for the six months ended March 26, 2010. The additional charges represent further actions associated with previously initiated restructuring activities. During the Predecessor 2011 Period, $2 million of reserves were reversed for previously contemplated actions that will not be taken.
37

Interest Expense, net
Interest expense, net was $13 million in the Successor 2011 Period and $11 million in the Predecessor 2011 Period, and $23 million for the six months ended March 26, 2010. Interest expense in the Successor 2011 Period is primarily attributable to interest on the senior secured notes issued in connection with the Transactions, which bear interest at 9.875% per annum. Interest expense in the Predecessor periods is primarily attributable to borrowings then outstanding with Tyco.
Income Tax Expense
Income tax expense was $2 million (23% effective tax rate) in the Successor 2011 Period, negligible (4% effective tax rate) in the Predecessor 2011 Period, and $7 million (64% effective tax rate) for the six months ended March 26, 2010. The recognition of tax expense on a loss before income taxes for the Successor 2011 Period and the Predecessor 2011 Period, as well as the effective tax rate exceeding statutory rates for the six months ended March 26, 2010, are attributable to the mix of earnings geographically, including the impact of incurring losses without an associated tax benefit, and to the impact of non-deductible expenses.
Results of Operations by Segment
Segment information is consistent with how management reviews the businesses, makes investing and resource allocation decisions and assesses operating performance. Selected information by business segment is presented in the following tables ($ in millions):
Electrical and Infrastructure
Consolidated Successor Combined Predecessor
Period from Dec. 23, 2010
through March 25, 2011
Period from Sept. 25, 2010 through Dec.
22, 2010
Six months ended March
26, 2010Net sales.......................................................................................................$ 226 $ 204 $ 359Operating income......................................................................................... 19 13 27
Net Sales
Net sales were $226 million in the Successor 2011 Period and $204 million in the Predecessor 2011 Period and $359 million for the six months ended March 26, 2010. Our North American electrical steel conduit and armored and metal-clad cable products generally have the largest impact on net sales in this segment. These products are used for the protection and routing of electrical wire. Electrical steel conduit products include electrical metallic tubing, intermediate metal conduit and rigid steel conduit. Our armored and metal-clad cable products include AC-90®, Mc-Quik® and Mc-Tuff®.
Average selling prices for our North American electrical steel conduit were 32% higher in the Successor 2011 Period and 18% higher in the Predecessor 2011 Period compared to the six months ended March 26, 2010. Average selling prices for our North American armored and metal-clad cable products were 24% higher in the Successor 2011 Period and 11% higher in the Predecessor 2011 Period compared to the six months ended March 26, 2010. Average selling prices benefited from rising market prices for steel and copper in the Successor 2011 Period and in the Predecessor 2011 Period when compared to the six months ended March 26, 2010.
The favorable impact of higher average selling prices were partly offset from lower volume as we experienced lower daily average volume for our North American electrical steel conduit and armored and metal-clad cable products in each of the Successor 2011 Period and Predecessor 2011 Period, as compared to the daily average volume for the six months ended March 26, 2010, due in part to sluggish non-residential construction activity in North America and aggressive actions by competitors to increase market share.
Operating Income
The impacts of purchase accounting negatively impacted operating income in the Successor 2011 Period by $10 million. Excluding this impact, operating income was $29 million in the Successor 2011 Period and $13 million in the
38

Predecessor 2011 Period, compared to $27 million of operating income for the six months ended March 26, 2010. Operating income as a percent of net sales, excluding the impact of purchase accounting, was 13% in the Successor 2011 Period, 6% in the Predecessor 2011 Period and 7% for the six months ended March 26, 2010. Operating income was favorably impacted in the Successor 2011 Period primarily due to higher average selling prices for both electrical steel conduit and armored and metal-clad cable products relative to raw material costs.
Engineered Products and Services
Consolidated Successor Combined Predecessor
Period from Dec. 23, 2010
through March 25, 2011
Period from Sept. 25, 2010 through Dec.
22, 2010
Six months ended March
26, 2010Net sales.......................................................................................................$ 186 $ 154 $ 292Operating income......................................................................................... 15 -- 28
Net Sales
Net sales were $186 million in the Successor 2011 Period and $154 million in the Predecessor 2011 Period, compared to $292 million for the six months ended March 26, 2010. Our North American steel pipe and tube products generally have the largest impact on net sales in this segment. Steel pipe and tube products include mechanical tube, fence pipe, fire sprinkler and A53 pipe and hollow structural sections,
Average selling prices for our North American steel pipe and tube were 2% higher in the Successor 2011 Period and 4% higher in the Predecessor 2011 Period compared to the six months ended March 26, 2010. Average selling prices benefited from rising market prices for steel in the Successor 2011 Period and in the Predecessor 2011 Period when compared to the six months ended March 26, 2010.
Furthermore, we experienced higher daily average volume for our North American steel pipe and tube products in each of the Successor 2011 Period and Predecessor 2011 Period, as compared to the daily average volume for the six months ended March 26, 2010, due in part to a modest improvement in the general economy in North America.
Operating Income
The impacts of purchase accounting negatively impacted operating income in the 2011 Period by $6 million. Excluding this impact, operating income was $21 million in the Successor 2011 Period and was negligible in the Predecessor 2011 Period, compared to $29 million of income for the six months ended March 26, 2010. Operating income as a percent of net sales, excluding the impact of purchase accounting, was 12% in the Successor 2011 Period, negligible in the Predecessor 2011 Period and 10% for the six months ended March 26, 2010. During the Predecessor 2011 Period our results were unfavorably impacted by substantially higher steel raw material costs compared to the six months ended March 26, 2010.
Corporate and Other
“Corporate and Other” as included in the footnotes to our financial statements represents corporate administrative expense, including allocations from Tyco. The Corporate and Other operating loss was $30 million in the Successor 2011 Period and an operating loss of $5 million in the Predecessor 2011 Period, and a $21 million operating loss for the six months ended March 26, 2010. The Successor 2011 Period includes $16 million of expense related to the Transactions that were completed on December 22, 2010.
Liquidity and Capital Resources
General
Our business is cyclical and cash flows from operating activities may fluctuate during the year and from year to year due to changes in economic conditions and commodity prices. Our Predecessor Company historically relied on cash and the liquidation of inter-company investments to fund cyclical increases in working capital needs. The Successor company balances its cash from operations and available credit from our ABL Credit Facility. Cash requirements generally rise during
39

periods of increased economic activity or increasing raw material prices to fund increased inventories and accounts receivable. During economic slowdowns, or periods of decreasing raw material costs, cash requirements generally decrease as a result of the reduction of inventories and accounts receivable.
We maintain a substantial inventory of raw material and finished products to satisfy customers’ prompt delivery requirements. The timing of receipts from customers is not always aligned with the timing of payments to suppliers; therefore, our liquidity needs have generally consisted of working capital necessary to finance receivables and inventory.
Capital expenditures have historically been necessary to expand and update the production capacity of our manufacturing operations. Capital expenditures have ranged 1.3% to 3.2% of net sales from fiscal 2008 to 2010. Our capital expenditures in these fiscal years were primarily for maintenance or replacement of equipment. Fiscal 2009 and 2010 included $20 million and $10 million in capital expenditures, respectively, to consolidate selected manufacturing and warehousing activities in Harvey, Illinois. Our capital expenditures were $12 million for the period from September 25, 2010 through December 22, 2010 million and $15 million for the period from December 23, 2010 through March 25, 2011. We plan to spend $27 million on capital expenditures in the second half of fiscal 2011. Of these amounts, approximately $7 million pertains to completion of capital projects approved and started in fiscal 2010. We expect our funds from operations to be sufficient to meet our capital expenditure requirements. To the extent our funds from operations are not sufficient, we expect to utilize our ABL Credit Facility.
Our working capital requirements and capital for our general corporate purposes, including acquisitions and capital expenditures, were historically satisfied as part of the company-wide cash management practices of Tyco. Following the Transactions, Tyco no longer provides us with funds to finance our working capital or other cash requirements. Accordingly, we depend on our ability to generate cash flow from operations and to borrow funds, including under our ABL Credit Facility, and to issue debt securities in the capital markets to maintain and expand our business.
The following table is a summary of our cash flows for each period shown ($ in millions):
Successor PredecessorPeriod from Dec. 23,
2010 through March 25, 2011
Period from Sept. 25, 2010 throughDec. 22, 2010
Six Months ended March 26, 2010
Cash flows from operating activities:
Operating income (loss).......................... $ 4 $ 8 $ 34Depreciation and amortization................ 11 7 14Deferred income taxes............................ (6) (6) 5Provision for losses on accounts
receivable and inventory..................... 1 3 3Other, net................................................. — 2 (1)Net change in working capital................ 30 (70) (62)Interest expense, net................................ (13) (11) (23)Income tax expense................................. (2) — (7) Net cash provided (used) by
operating activities:........................... $ 25 $ (67 )$
(37 )Other cash flow items:Capital expenditures................................ (15) (12) (25)Acquisition of a business, net of cash
acquired............................................... — — (39)
Operating activities
During the period from September 25, 2010 through December 22, 2010 we used net cash from operating activities of $67 million. During the period from December 23, 2010 through March 25, 2011 we generated net cash from operating activities of $25 million. The improvement in cash generated by operating activities was a result of efforts to reduce working capital levels. During the first six months in fiscal 2010, we used net cash from operating activities of $37 million, primarily as a result of building inventory levels.
40

Investing activities
Capital expenditures were $12 million for the period from September 25, 2010 through December 22, 2010 and $15 million for the period from December 23, 2010 through March 25, 2011, compared to $25 million during the first six months of fiscal 2010. Capital expenditures in the periods from September 25, 2010 through December 22, 2010 and from December 23, 2010 through March 25, 2011 were primarily for maintenance or replacement of equipment and process improvements. For the first six months of fiscal 2010, $10 million in capital expenditures were for the consolidation of selected manufacturing and warehousing activities in Harvey, Illinois.
In the period from September 25, 2010 through December 22, 2010 and for the first six months of fiscal 2010, Tyco and affiliates provided investment inflows of $357 million and $64 million, respectively.
Investment activities are largely discretionary and future investment activities could be reduced significantly or eliminated as economic conditions warrant. We assess acquisition opportunities as they arise, and such opportunities may require additional financing. There can be no assurance, however, that any such opportunities will arise, that any such acquisitions will be consummated or that any needed additional financing will be available on satisfactory terms, or at all, when required.
Financing Activities
Financing activities prior to the Transactions primarily related to payments made to Tyco under corporate cash management sweep policies. For the first six months of fiscal 2010 the net impact was a cash inflow of $14 million. During the period from September 25, 2010 through December 22, 2010 we repaid $300 million to Tyco.
During the period from December 23, 2010 through March 25, 2011, the Successor Company implemented its new capital structure. See “—Post-Transactions Liquidity – Successor Company” below. We used proceeds from our debt facilities to repay $400 million owed to Tyco and transaction costs of $53 million, of which we capitalized $37 million as deferred financing fees.
Post-Transactions Liquidity – Successor Company
In connection with the Transactions, we entered into the ABL Credit Facility, which provides for up to $250 million of senior secured first-priority borrowings, subject to a borrowing base estimated to be $250 million as of March 25, 2011. The ABL Credit Facility is available to fund working capital and for general corporate purposes. We utilized borrowings of $55 million under the ABL Credit Facility to fund the Transactions.
Based on our current development plans, we anticipate that our cash flow from operations and available borrowings under the ABL Credit Facility will be adequate to meet our needs for normal operating costs, capital expenditures and working capital for our existing businesses for at least the next twelve months. If we require additional financing to meet cyclical increases in working capital needs, we may need to access the financial markets.
The Indenture and the ABL Credit Agreement contain significant covenants, including prohibitions on our ability to incur certain additional indebtedness and to make certain investments and to pay dividends.
41
Commitments and Contingencies
Contractual Obligations
The following table sets forth our contractual obligations as of March 25, 2011 ($ in millions):
Estimated Payments Due by Fiscal Year
Remainder of 2011 2012 2013 2014 2015
Later Fiscal Years Total
Contractual obligations:Senior Secured Notes..................................... $ — $ — $ — $ — $ — $ 410 $ 410ABL Credit Facility........................................ — — — — — 61 61Interest expense.............................................. 22 43 43 43 43 81 275Purchase commitments................................... 217 — — — — — 217Operating lease obligations............................ 4 8 7 6 4 4 33
Total(a)........................................................ $ 243 $ 51 $ 50 $ 49 $ 47 $ 556 $ 996
(a) As of March 25, 2011, we had gross unrecognized tax benefits and gross interest and penalties classified as non-current liabilities in the consolidated balance sheets as payment is not expected within one year. At this time, we are unable to make a reasonably reliable estimate of the timing for such payments in future years; therefore, such amounts have been excluded from the above contractual obligations table.
In the normal course of business, we are liable for contract completion and product performance. In the opinion of management, such obligations will not significantly affect our financial condition, results of operations or cash flows.
We expect to contribute at least the minimum required contribution of $2 million to our pension plans in fiscal 2011.
In connection with the Transactions, we, Atkore Group and Atkore International, entered into several Indemnification Agreements pursuant to which we, Atkore Group and Atkore International have agreed to indemnify each of CD&R Allied Holdings, L.P. (an affiliate of CD&R), Tyco and certain of their respective affiliates, related parties, directors, officers, partners, members, employees, agents, advisors, consultants, representatives and controlling persons for certain losses related to the Transactions.
Legal Matters
We have been named as a defendant in several lawsuits. We do not expect the outcome of these proceedings, either individually or in the aggregate, to have a material adverse effect on our financial condition, results of operations or cash flows.
We are a party to a variety of legal proceedings that arise in the normal course of our business. We are a defendant in a number of pending legal proceedings incidental to present and former operations, including several lawsuits alleging that the anti-microbial coated sprinkler pipe causes stress cracking in polyvinyl chloride pipe when installed with certain kinds of such pipe manufactured by unrelated parties. We have reserved our best estimate of the probable loss related to the matter, which is $5 million. We do not expect the outcome of these proceedings, either individually or in the aggregate, to have a material adverse effect on our financial position.
In October 2010, we were notified of an assessment by the Rio Grande do Sul State Treasury Secretariat related to the appropriateness of certain value added tax credits taken in Brazil during the periods 2005 to 2007. We believe the position was in accordance with the applicable law; however we have engaged a third party to assist in documenting and responding to the notice. We believe we will be successful in defending our position. We do not believe that the liability is probable or reasonably estimable and accordingly has not recorded a loss contingency related to this matter.
From time to time, we are subject to a number of disputes, administrative proceedings and other claims arising out of the conduct of our business. These matters generally relate to disputes arising out of the use or installation of our products,
42

product liability litigation, contract disputes, employment matters and similar matters. On the basis of information currently available to us, we do not believe that existing proceedings and claims will have a material impact on our financial position or results of operations. However, litigation is unpredictable, and we could incur judgments or enter into settlements for current or future claims that could adversely affect our financial position.
Off-Balance Sheet Arrangements
We do not have any off-balance sheet financing arrangements that we believe are reasonably likely to have a material current or future effect on our financial condition, results of operations, liquidity, capital expenditures or capital resources. We have an outstanding letter of credit for $3 million supporting our workers compensation and liability insurance policies. We also have $1 million in surety bonds primarily related to performance guarantees on supply agreements and construction contracts, and payment of duties and taxes. As of March 25, 2011, various letters of credit, bank guarantees, and surety bonds were provided by Tyco, which total $5 million, as well as Tyco has guaranteed our performance to third-parties ($13 million). Tyco intends to obtain releases for all guarantees they had provided related to us. In the future, we will have such items outstanding on our own behalf.
In disposing of assets or businesses, we often provide representations, warranties and indemnities to cover various risks including unknown damage to the assets, environmental risks, including obligations to investigate, remediate or otherwise address contamination, and unidentified tax liabilities and legal fees related to periods prior to disposition. We do not have the ability to estimate the potential liability from such indemnities because they relate to unknown conditions. However, in the opinion of management, there is no reason to believe these uncertainties would have a material adverse effect on our financial condition, results of operations or cash flows.
Recently Adopted Accounting Pronouncements
In June 2009, the Financial Accounting Standards Board ("FASB") issued authoritative guidance which amended the existing guidance for the consolidation of variable interest entities, to address the elimination of the concept of a qualifying special purpose entity. The guidance also replaces the quantitative based risks and rewards calculation for determining which enterprise has a controlling financial interest in a variable interest entity with an approach focused on identifying which enterprise has the power to direct the significant activities of a variable interest entity, and the obligation to absorb losses or the right to receive benefits that may be significant to the variable interest entity. The guidance became effective for the Company in the first quarter of fiscal 2011. The adoption of this guidance did not have a material impact on the Company’s financial position.
In September 2009, the FASB issued authoritative guidance for the accounting for revenue arrangements with multiple deliverables. The guidance establishes a selling price hierarchy for determining the selling price of a deliverable. The selling price used for each deliverable will be based on vendor-specific objective evidence ("VSOE") if available, third-party evidence ("TPE") if VSOE is not available, or estimated selling price if neither VSOE nor TPE is available. The guidance requires arrangements under which multiple revenue generating activities to be performed be allocated at inception. The residual method under the existing accounting guidance has been eliminated. The guidance became effective for the Company for revenue arrangements entered into or materially modified beginning in the first quarter of fiscal 2011. The adoption of the guidance did not have a material impact on the Company's financial position, results of operations or cash flows.
43

ATKORE INTERNATIONAL HOLDINGS INC.
QUANTITATIVE AND QUALITATIVE DISCLOSURES ABOUT MARKET RISK
(Unaudited)
In the normal course of conducting business, we are exposed to certain risks associated with potential changes in market conditions. These risks include fluctuations in foreign currency exchange rates, interest rates and commodity prices, including price fluctuations related to the purchase, production or sale of steel and copper products. Accordingly, we have established a comprehensive risk management process to monitor, evaluate and manage the principal exposures to which we believe we are subject. Our market risk strategy has generally been to obtain competitive prices for our products and services and allow operating results to reflect market price movements dictated by supply and demand; however, we have from time to time made forward commodity purchases to manage exposure to fluctuations in the purchase of steel and copper metals. We may also seek, and from time to time have sought, to manage certain of these risks through the use of financial derivative instruments. Our portfolio of derivative financial instruments may, from time to time, include forward foreign currency exchange contracts, foreign currency options, interest rate swaps and forward commodity contracts. Derivative financial instruments related to interest rate sensitivity of debt obligations, intercompany cross-border transactions and anticipated non-functional currency cash flows are used with the goal of mitigating a significant portion of these exposures when it is cost effective to do so.
To reduce the risk that a counterparty will be unable to honor its contractual obligations to us, we only enter into contracts with counterparties having at least an A-/A3 long-term debt rating. These counterparties are generally financial institutions and there is no significant concentration of exposure with any one party. We do not engage in metal futures trading, hedging activities or otherwise utilize derivative financial instruments for trading or speculative purposes.
In connection with the Transactions, we entered into the ABL Credit Facility, which bears interest at a floating rate, generally LIBOR plus 2.25% to 2.75%. As a result, we are exposed to fluctuations in interest rates to the extent of our borrowings under the ABL Credit Facility, which totaled $61 million at March 25, 2011. A ten percent change in interest rates would impact our interest expense by less than $1 million based on the amounts outstanding at March 25, 2011.
44