Embed Size (px)
Citation preview

North Lincs Engineering
2019
Switching to low carbon fuels from Low Grade Waste Streams GREEN FUELS FOR STATIC DIESEL GENERATORS NORTH LINCS ENGINEERING LTD

Phase 2 TRN 1674/10/2018
1 | P a g e
Contents Glossary of Terms ........................................................................................................................... 5 Executive Summary ........................................................................................................................ 6 Overview ......................................................................................................................................... 7 Operating the Big Rig with TATA and BFO feedstocks.................................................................... 7
1. Introduction .......................................................................................................................... 7 2. Big Rig Fabrication ............................................................................................................... 8 3. Instrumentation and Control Systems ................................................................................. 11 4. Results ............................................................................................................................... 15 5. GCMS and Feedstock Analysis .......................................................................................... 16 6. Life Cycle Analysis ............................................................................................................. 16
Methodology ......................................................................................................................... 16 Results .................................................................................................................................. 19 Limitation ............................................................................................................................... 20 References ............................................................................................................................ 20
7. Problems encountered during the project ........................................................................... 21 NLE Cleaning of Fuel, Fuel Delivery to Engine, Fuel Feasibility & Emissions testing .................... 23
8. Introduction ........................................................................................................................ 23 9. Test Cell 2 – Deutz 4-cylinder engine with alternator .......................................................... 24 10. Test Cell 3 – Single cylinder engine with alternator ......................................................... 30 11. University of Glasgow Fuel Arrival .................................................................................. 32 12. University of Glasgow Fuel Sample De-Watering, Cleaning and Polishing ...................... 32
Samples cleaned as of writing this report .............................................................................. 32 13. Separation, Filtration and Cleaning ................................................................................. 33
Settling .................................................................................................................................. 33 14. Filtration Problems .......................................................................................................... 36
Zahn Cup testing ................................................................................................................... 36 Test code 8 1st Distillate ........................................................................................................ 37 Test code 11 Distillate Brown ................................................................................................ 37
15. Results ........................................................................................................................... 38 16. Discussion ...................................................................................................................... 39 17. Conclusions .................................................................................................................... 39 18. Recommendations .......................................................................................................... 40 19. Fuel Sample Testing ....................................................................................................... 40
Lister Testing......................................................................................................................... 40 Fuel Consumption on Lister ................................................................................................... 43 Sample 1, 2 and 3 Consumption with Baselines from B100 & EN590 ................................... 45
20. Deutz Fuel Testing .......................................................................................................... 46 21. Results ........................................................................................................................... 47

Phase 2 TRN 1674/10/2018
2 | P a g e
Consumption figures ............................................................................................................. 47 Emissions Readings .............................................................................................................. 47 Temperature Charts .............................................................................................................. 49 Combustion Profile ................................................................................................................ 50
Fuel Samples Trials .................................................................................................................. 51 22. Discussion ...................................................................................................................... 51 23. Conclusions .................................................................................................................... 51 24. Recommendations .......................................................................................................... 51

Phase 2 TRN 1674/10/2018
3 | P a g e
Figures Figure 1 - Schematic of the Big Rig and system components ......................................................... 9 Figure 2 - Gas Burner ................................................................................................................... 10 Figure 3 - Big Rig burner assembly and rotary stirrer on top ......................................................... 10 Figure 4 - Assembled system; reactor, gas outlet, burner exhaust, condenser, liquid collection line, vacuum pump ............................................................................................................................... 11 Figure 5 - Bench Scale System ..................................................................................................... 12 Figure 6 - RIP-V 2.6L reactor ........................................................................................................ 13 Figure 7 - Big Rig with 36L reactor ................................................................................................ 14 Figure 8 - Samples sent to NLE for refining and engine testing ..................................................... 16 Figure 9 - System boundary of the LCA ........................................................................................ 17 Figure 10 - Deutz 4-Cylinder naturally aspirated IDI engine .......................................................... 24 Figure 11 - Deutz 4-Cylinder N/A power curve .............................................................................. 24 Figure 12 - Signal Gas Emissions Towers .................................................................................... 24 Figure 13 - Server grade data desk with extensive data collection capabilities .............................. 25 Figure 14 - Lab grade variable voltage DC power supply .............................................................. 25 Figure 15 - 30kg Marsden scale .................................................................................................... 25 Figure 16 - Deutz 4-Cylinder N/A engine with modifications and sensors attached ....................... 26 Figure 17 - High accuracy temperature sensors for data collection ............................................... 26 Figure 18 - Campbell Scientific CR1000X & LCD20 load cell amplifier .......................................... 26 Figure 19 - Picolog automotive data loggers ................................................................................. 27 Figure 20 - Deep Sea engine controller ......................................................................................... 27 Figure 21 - Bowman header tank heat exchanger ......................................................................... 27 Figure 22 - External radiator, fan & water pump ............................................................................ 28 Figure 23 - Weather capture station .............................................................................................. 28 Figure 24 - Weather station wireless unit ...................................................................................... 28 Figure 25 - 100kW load bank ........................................................................................................ 29 Figure 26 - 80kW Froude Dynomometer ....................................................................................... 29 Figure 27 - Spare load bank .......................................................................................................... 29 Figure 28 - Single-Cylinder Lister Diesel engine ........................................................................... 30 Figure 29 - Current and Voltage meters ........................................................................................ 30 Figure 30 - Fuel DTI ...................................................................................................................... 30 Figure 31 - Small fuel quantity measurement ................................................................................ 31 Figure 32 - Distillation Column ...................................................................................................... 33 Figure 33 - Example fuel separation - Test code 11 Distillate Brown ............................................. 33 Figure 34 - 2 & 3 Distillate, Non-Centrifuge ................................................................................... 34 Figure 35 – Test code 8 1st Distillate ............................................................................................ 34 Figure 36 - Heated filtering of fuel samples ................................................................................... 35 Figure 37 - Test code 7 Distillate after full filtration ........................................................................ 35 Figure 38 - Test code 8 1st Distillate De-gassing .......................................................................... 35 Figure 39 - Test code 8 1st Distillate Zahn cup test graph ............................................................. 37 Figure 40 - Test code 11 Distillate Brown Zahn cup graph ............................................................ 37 Figure 41 - University of Glasgow Fuel Sample Datasheet ........................................................... 38 Figure 42 - Single-Cylinder Lister engine with DTI fitted ................................................................ 41 Figure 43 - Lister engine running sample 2 & 3 ............................................................................. 41 Figure 44 - Test sample viles for Lister engine .............................................................................. 41 Figure 45 - EN590 diesel emissions .............................................................................................. 42 Figure 46 - Pyrolised BFO emissions (2 & 3) ................................................................................ 42 Figure 47 - Pyrolised BFO emissions (4 & 5) ................................................................................ 42 Figure 48 - Single-Cylinder Lister fuel consumption ...................................................................... 43 Figure 49 - TATA Steel Sample 1 emissions ................................................................................. 43 Figure 50 - TATA Steel sample 2 emissions ................................................................................. 44 Figure 51 - TATA Steel sample 3 emissions ................................................................................. 44 Figure 52 - B100 & EN590 fuel consumption baselines ................................................................ 45 Figure 53 - B100 & EN590 emissions baselines ........................................................................... 45 Figure 54 - Deutz 4-Cylinder EN590 exhaust temperatures (9kW) ................................................ 49

Phase 2 TRN 1674/10/2018
4 | P a g e
Figure 55 - Deutz 4-Cylinder EN590 injector temperatures (9kW) ................................................. 49 Figure 56 - Deutz 4-Cylinder EN590 injector pipe temperatures (9kW) ......................................... 49 Figure 57 - Deutz 4-Cylinder EN590 air intake temperature (9kW) ................................................ 49 Figure 58 - Deutz 4-Cylinder EN590 fuel temperature (9kW) ........................................................ 50 Figure 59 - Deutz 4-Cylinder EN590 water temperatures (9kW) .................................................... 50 Figure 60 - Deutz 4-Cylinder EN590 combustion profile (9kW) ..................................................... 50

Phase 2 TRN 1674/10/2018
5 | P a g e
Glossary of Terms B100 – Pure biodiesel, this fuel is not blended with EN590 at all.
Big Rig – a 36 ltr reaction vessel with various ancillary components specially made for the Feasi-
bility Study by University of Glasgow.
BFO – Boiler Fuel Oil, the residual waste left at the bottom of the distillation column when manu-
facturing B100 EN14214.
Dial Test Indicator (DTI) - a delicate measuring instrument used to determine small differences in
the height or width of mechanical components.
Distillation Column - A piece of equipment used to separate a mixture into its separate compo-
nents
EN590 – Automotive/red diesel EU standard, used for baseline tests to compare with test sample
data.
Gas Emissions Towers – A set of devices that measure emission levels of a multitude of gasses
from the exhaust systems of engines.
GCMS - Gas chromatography–mass spectrometry (GC-MS) is an analytical method that combines
the features of gas-chromatography and mass spectrometry to identify different substances within
a test sample. Like liquid chromatography–mass spectrometry, it allows analysis and detection
even of tiny amounts of a substance.
Life Cycle Analysis (LCA) – A technique used to assess environmental impacts associated with
the stages of the life cycle of a process.
Load Bank – A device which develops and electrical load, this is used in conjunction with the alter-
nator on test cells.
Pyrolysis – a thermal reaction process which decomposition of long chain hydrocarbon into
shorter chains. Typically used for gasification into Synthetic gas. In this case to partially pyrolysis
into liquids.
TATA – Waste oils from the rolling of steel.
Torrefaction – a thermal process to convert biomass into a coal-like material and is a mild form of
Pyrolysis, in this case to create a liquid fuel rather than solid.

Phase 2 TRN 1674/10/2018
6 | P a g e
BEIS Industrial Fuel Switching Competition: Phase 2 TRN 1674/10/2018
Feasibility Study
December 2019
NLE Report - Abridged Version
Executive Summary The consortium was made up of 4 principle organisations; North Lincs Engineering Limited (NLE
and Lead on the Grant Bid), Argent Energy (AE) and 2 Universities; University of Glasgow and
University of Lincoln. There were small sub-contractors to undertake lab testing etc.
NLE was formed in 1963 and specializes in Heavy Marine Engines and large-scale diesel genera-
tors. NLE have been maintaining and servicing engines successfully running on the ‘better’ alterna-
tive fuels such as Used Cooking Oil and higher quality Rapeseed oils (Canola) for many years.
NLE have also been deeply involved in providing solutions to using more difficult fuels such as
Beef Tallow derived from the whole animals including bones, various Chicken Oils including high
temperature and high pressure recovered oils, 3rd press Canola which produce gums and resins in
the fuel lines and injectors, as well as Heavy Fuel Oil in marine engines.
Over the years NLE have helped to develop various technologies to reduce or eliminate many of
the problems with these alternative fuels. Some are fuel processing technologies to allow the suc-
cessful use of Beef Tallow for stationary IC engines (https://core.ac.uk/download/pdf/9837903.pdf)
with the University of Birmingham for Jon Pointon and Sons Ltd.
Other specialist help included technologies to de-gum fuel systems, modify fuel delivery systems to
handle difficult and inconsistent feed stocks such as the chicken oils, engine technologies to create
a cleaner burn in the chamber, re-mapping engines to prevent exhaust valve burn out, etc. etc.
Argent Energy produce in excess of 200,000 tonnes of road grade B100 from their 3 plants (2 in
the UK and 1 in the Netherlands) and is the largest bio-fuel producer from waste in the UK. Argent
take the relatively high-quality Fats, Oils and Greases (FOG) from water treatment plants and sew-
ers and convert this into B100 for adding to Diesel to produce biodiesel for cars, trucks and buses.
There is limited supply of these quality FOG’s and as the demand for biodiesel has increased the
market price for these waste streams is at an all-time high.
To increase production to meet the growing demand Argent need to develop different waste
streams sources and different production methods to increase output.

Phase 2 TRN 1674/10/2018
7 | P a g e
The purpose of this Feasibility study is to investigate lower quality feedstock for their potential as a
fuel for static diesel generation due to the ability to add technologies to make difficult fuels work
which would not be possible on moving plant such as trucks or buses.
There is a clear need to raise the amount of fuels from waste as these wastes are currently going
to land fill which then degrades to Methane. The opportunity is to extract economically all the calo-
rific value from these materials.
The consortium includes 2 Universities; University of Glasgow has worked with Argent Motherwell
on many research initiatives previously and will lead on the fuel processing. University of Lincoln
has a long established relationship with NLE build up over many years and Industrial Professor
Ron Bickerton who has 50 years in diesel at the highest level (and who designed the engine we
will be using for test cell 2) and will support NLE with his mechanical expertise.
This is a very high impact project with the intention of producing 100’s of thousands of tonnes of
fuel for diesel generators from waste currently being thrown away.
Overview
The aim of the Industrial Fuel Switching initiative is to identify and test the processes and technolo-
gies required for industries in the UK to switch to low carbon fuels.
The resultant outputs will reduce the UK’s carbon emissions and the cost of decarbonization by ac-
celerating the commercialisation of innovative clean energy technologies and processes into the
mid-2020s and 2030s. This collaborative feasibility study comprised of 4 partners, NLE, AE, UoL
and UoG. The study was divided into 4 Work Packages: WP1 -Pre-treatment sampling. Evaluating
feedstock handling & transfer model into biocrude; WP2 - Sample Fuel processing. Working
through processes to create sample fuels & LCA and TEA; WP3 - Fuel Module and Emissions.
Modify fuel module to handle fuels and commission the full emissions towers and WP4 -Engine
Combustion Testing and Emissions Measurement.
Operating the Big Rig with TATA and BFO feedstocks This report covers the work done on the Big Rig and a summary of GCMS data collected over the
project for different feedstock and fuel samples. It should be noted that smaller systems existed,
such as the F1 and RIPV, but had to be modified to produce fuel samples from both the liquid and
solid feedstocks, the solid feedstock processing led to a unique design to reduce the likelihood of
pipe blockages.

Phase 2 TRN 1674/10/2018
8 | P a g e
1. Introduction
Based on the results from the two smaller systems, a larger 36 L reactor was designed and built.
This used internal electrical cartridge heaters, gas heating or a combination of both. In the summary
of the work below, in section 5, the predominant heating source was gas (propane gas burner) unless
otherwise noted.
Prior to the experiments, some samples of the feedstock were placed in a tube and allowed to stand
overnight; there was no visible separation of phases (e.g. water and oil) which led to the feedstocks
being treated as delivered.
2. Big Rig Fabrication
A schematic of the system and system components for the Big Rig is shown in Figure 1. Because of
the size of the rig electrical heating was expensive and complex, consequently a gas burner and
furnace were designed and fabricated (Figure 2) to sit around the lower half of the reactor. The outer
material was made from a plaster of Paris. Once assembled on the rig, a flow-rate controlled,
pumped air supply had to be used to provide sufficient control of the flame to enable a steady reactor
temperature and prevent the flame from extinguishing. A stress analysis was also done, data not
shown and pressure ratings calculated.

Phase 2 TRN 1674/10/2018
9 | P a g e
Figure 1 - Schematic of the Big Rig and system components
Number Part 1 Feedstock inlet from pump 2 Rotary seal, motor not shown 3 Reactor 4 Heat Exchanger 5 Splitter 6 Collection Vessel 7 Valve

Phase 2 TRN 1674/10/2018
10 | P a g e
Figure 2 - Gas Burner
Figure 3 shows the part- assembled Big Rig, with the rotary seal and stirrer installed on top of the system, the rotary seal was designed and fabricated in house. As with the F1 system (small rig), provision was made to collect the gases from the system, condense and collect the liquids. Figure 4 shows the assembled rig.
Figure 3 - Big Rig burner assembly and rotary stirrer on top

Phase 2 TRN 1674/10/2018
11 | P a g e
Figure 4 - Assembled system; reactor, gas outlet, burner exhaust, condenser, liquid collection line,
vacuum pump
3. Instrumentation and Control Systems
For the smaller two rigs (F1 and RIP-V) instrumentation was deployed to measure temperature and
pressure but the system needed to be expanded for the Big Rig. The Arduino platform was used as
the core of the instrumentation and control system and this was integrated with excel software to
allow real time monitoring (about 1 Hz) and control of the pyrolysis operation. As a result, the system
offered a high level of control and robustness for low cost with an open source protocol.
Two Arduino Mega ADK microcontroller (ATmega2560) boards were coded in C/C++ to provide the
operators with variety of online information, such as temperature, pressure and flow at different crit-
ical points of the pyrolysis system during running. It also allowed control of all of the important in-
struments involved in the operation, such as power-up of the heating systems and pumps (e.g. air
supply for the propane gas burner and fuel feed-in pump); with these effective service control mech-
anisms the operators had greater autonomy and flexibility to focus on the experiments. It should be
realised that there are dangerous safety issues and risks with pyrolysis which were addressed
throughout the work to ensure safe operation. The safety risks include a high pressure system, which
for the Big Rig was designed to be about 10 Bar and a critical burst pressure of about 30 Bar, high
temperature, naked flames, potentially noxious gases (especially with MONG, Matter Organic non-
glycerol, which was not processed further than preliminary experiments because of the gaseous
emissions). A safety pressure valve was fitted to the systems to avoid over pressure and various

Phase 2 TRN 1674/10/2018
12 | P a g e
regulators to allow control of the pressure on either side of the system (i.e. pyrolysis and condenser
side). It should be noted that these were not automated because of time and cost constraints.
The following diagrams illustrate details on the control system for the different setups. Figure 5
shows the system for the smallest rig, F1, with a reactor size of 60 mL; this system was modified
from a torrefaction/pyrolysis system and a gas condenser line had to be fabricated, and the system
mounted vertically. The fuel produced from this system was successful tested in an engine and this
system was scaled to the Big Rig, with a 36 L capacity.
5, F1 system, 60 mL reactor, instrumentation T1 = Furnace temperature, T2 = Temperature before needle valve, T3 = Temperature after needle valve, T4 = Liquid collected temperature, TF = Temperature of feed line; applicable for semi-batch protocols, TR = Temperature inside-bottom of the tubular reactor. P1 = Pressure in tubular rector side, P2 = Pressure in cooling and phase splitting line. C1 = Control of furnace temperature
Figure 5 - Bench Scale System

Phase 2 TRN 1674/10/2018
13 | P a g e
The second system, shown in Figure 6, shows RIP-V, with a reactor volume of 2.6 L. Again this was
modified from a torrefaction and pyrolysis system to include gas collection, condenser and liquid
collection systems. With the larger volume, solids were tested in this system. This was a unique
system that was designed for the heavy gas phase that was observed during solid feedstock
processing on F1, where the pipes became blocked. The fog pit screens (FPS) were successfully
processed with no blocking of the system. To our knowledge, no one has managed to process these
feedstocks in this way, as well as some fuel production (too small from this rig for further use), the
clear liquid samples may have application in anaerobic digestion.
Figure 6 - RIP-V 2.6L reactor
Figure 6 2.6 L reactor, T1 = Temperature inside-bottom of the reactor, T2 = Temperature inside-top of the reactor, T3 = Temperature of reactor output and before Heat exchanger, T4 = Temperature of the liquid collection and after Heat exchanger , TF = Temperature of liquid feed line; applicable for semi-batch protocols for liquid feedstock, Ti = Temperature of coolant water into Heat exchanger, To = Temperature of coolant water out of Heat exchanger, P1 = Pressure in RIP-V rector, F1 = Water coolant flow, C1 = Control of heat tape element Figure 7 shows the instrumentation and control system for the Big Rig, it is seen that the system is
considerably more complex and more sophisticated control systems were needed to make the
system run more efficiently. This system was a completely new build and based on the results in the
early phases of the work.

Phase 2 TRN 1674/10/2018
14 | P a g e
Figure 7 - Big Rig with 36L reactor
Figure 7, Big Rig with a reactor capacity of 36 L. T1 = Temperature inside-bottom of the reactor, T2 = Temperature inside-top of the reactorT3 = Temperature before needle valve, T4 = Temperature after needle valve and before Heat exchanger, T5 = Temperature after Heat exchanger, T6 = Temperature inside liquid collection vessel, TF = Temperature of feed line; applicable for semi-batch protocols, TG = Temperature of gas furnace, Tb = Temperature body of reactor, between middle and top, Ti = Temperature of coolant water into Heat exchanger, To = Temperature of coolant water out of Heat exchanger, P1 = Pressure in Big rig rector, P2 = Pressure in splitter column, P3 = Pressure in liquid collection vessel, FW = Water coolant flow, FG = Gas flow, C1 = Control of oil-pump, C2 = Control of Mixer, interval and speed, C3 = Control of heater cartridges, C4 = Control of gas ignition, C5 = Control of air-pump.

Phase 2 TRN 1674/10/2018
15 | P a g e
4. Results
A summary of the experiments on the Big Rig for liquid feedstocks, TATA and BFO, are given in
Table 1, where the feedstocks and the volume of the products that were produced are shown. It is
seen that the yields varied from 64% to 91%. The process i.e. either batch or semi-batch influenced
the yield significantly. An automated feedstock feed-in line was also fabricated.
Table 1 Summary of experimental results using the Big Rig, volume processed and yields Big rig-Test Code
Date Feed Volume (mL)
Pro-cess Products Volume
(mL) Yield (%)
2 01.10.2019 TATA 5000 Batch centrifuged Un centrifuged
2200 1000 64 3 04.10.2019 TATA Batch
6 16.10.2019 TATA 8500 Semi-Batch
Watery Distillate Oily distillate Left in reactor
1300 1000 5000
91
7 22.10.2019 TATA 6000 Semi-Batch
Distillate Left in reactor
2500 2500 83
8 31.10.2019 TATA 15000 Semi-Batch
1st Distillate 2nd distillate Left in reactor
4600 900 7900
89
SUM 34500 28900 84
10 05.11.2019 BFO 10000 Batch Distillate Left in reactor
300 8800 91
11 07.11.2019 BFO 10000 Batch Distillate Brown Distillate Golden Left in reactor
2750 525 5800
91
SUM 20000 18175 91
Temperature and pressure profiles were recorded, the fuel samples were packaged and sent to NLE, see Figure 8.

Phase 2 TRN 1674/10/2018
16 | P a g e
Figure 8 - Samples sent to NLE for refining and engine testing
5. GCMS and Feedstock Analysis
There were certain tests that could be done in house at Glasgow and within the consortium; this
included some GCMS analysis, measurement of CV and viscosity measurements. However,
because of the work being done it was felt that Py-GCMS would yield useful results on the feedstock
and the impact of process parameters, no commercially available facility could be found in the UK.
Analytix Limited, however, kindly sent samples to America for testing on one of their Py-GCMS rigs.
6. Life Cycle Analysis
Methodology Life cycle assessment (LCA) is a standardised tool for evaluating the possible environmental impacts
of a product, process, or system. It assists in identifying hot spots e.g. excess CO2 produced, in a
system's life cycle and thus shows opportunities for improvement. An LCA consists of four sequential
phases, i.e. goal and scope definition, inventory analysis, impact assessment, and interpretation.
LCA was carried out with GaBi and in-house MATLAB code. GaBi is a designated LCA software,
which was used to evaluate the avoided environmental impacts by displacing electricity and heat
otherwise generated by natural gas and to model the environmental impact of diesel consumption.
The impact categories considered in GaBi follow ReCiPe 1.08 Midpoint methodology. The entire
LCA is conducted in accordance with ISO 14040 (Finkbeiner et al., 2006).
In the analysis, the functional unit (FU) is taken to be the treatment of 1 tonne of feedstock (i.e. BFO,
TATA, Fog Pitscreens) using the technology. A system can become overly complex to include every
single impact or process and thus, it is important to define suitable system boundaries. The system
boundary and a basic flow chart of the different processes are shown in Figure 9. The model was
developed to support analysis of other applications in the future

Phase 2 TRN 1674/10/2018
17 | P a g e
Figure 9 - System boundary of the LCA
To simplify the model, environmental impacts related to the generation and transport of feedstock
were neglected. As shown by the experimental data, the yields of different products are highly
variable based on the feedstock and conditions applied. The yields (50 wt.% oil, 30 wt.% product
gas, and 20 wt.% biochar) of products in the LCA are estimated based on a summary of literature
data regarding waste cooking oil and sewage sludge (Trabelsi et al., 2018, Liu et al., 2013, Righi et
al., 2013) and the experimental data of this work, in practice there is some control over the
partitioning of products and this combination was selected to provide one possible route forward. Of
course, for electricity production from the feedstocks, the primary focus will be on delivering liquid
fuels at scale. This facilitates the adoption of relevant process data (e.g., electrical and heat
efficiency) that was reported in the literature and was only measured on the available systems in this
project. Assumptions would have to made over scaling. Note the biochar was included as an option
because it has the potential to impose a major positive environmental impact (carbon saving);
however, it is not considered in the LCA, making the results obtained in this study conservative and
because the fraction of solid residues was demonstrated to be relatively small when the parameters
were set for liquid production.
The electricity and heat generated are assumed to substitute electricity and heat generated by
natural gas. Avoided emissions due to displacing electricity and heat otherwise generated by natural
gas were modelled using the inbuilt GaBi processes “Electricity from natural gas” and “Thermal
energy from natural gas”. Both processes are country specific to the UK with a reference year of
2016. It is stated that the data is valid until 2021 (Thinkstep, 2019). Other process parameters are
shown in Figure 2, which detail the steps involved in the model and its development, showing CO2
emissions for different scenarios. In a) the electricity and heat generation is considered from oil and
gas, b) derived oil is used to generate electricity and heat, and any gas residues are used to generate
heat to support the endothermic processes for pyrolysis. It should be noted that there was a lot of
incondensable gases that were produced in the Big Rig which could be used to run the system, at

Phase 2 TRN 1674/10/2018
18 | P a g e
least in part if not fully. Augmenting the system increases process efficiency and reduces emissions.
And in c) oil is solely used to produce electricity and gas to produce system heating.
(a)
(b)

Phase 2 TRN 1674/10/2018
19 | P a g e
Fig.2. (a) Scenario 1: the oil and product gas are used in CHP units for both electricity and heat generation; (b) Scenario 2: the oil is used to generate electricity and heat, while the product gas is used to generate heat to support the pyrolysis process; Scenario 3: the oil is used to generate elec-tricity, while the product gas is used generate heat to support the pyrolysis process. Results For process scenario 1, the feedstock is converted into 50 wt.% oil (calorific value=30 MJ/kg), 30
wt.% product gas (calorific value=17 MJ/kg), and 20 wt.% char with the bio-oil and gas being used
in two CHP units (electrical efficiency of 35% and thermal efficiency of 45%). 50% of the heat
generated from the gas is used to support the auxiliary thermal energy demand of pyrolysis. In this
case, an annual treatment of 1,500 tonnes of waste will save ~900 tonnes of CO2-eq compared with
the conventional landfill-based practice based on our preliminary analysis (0.7 tonnes of CO2-
eq/tonne of feedstock vs 1.3 tonnes of CO2-eq/tonne of feedstock).
For process scenario 2, the oil is used to generate electricity and heat while the product gas is used
to generate heat to support the systems. In this case, an annual treatment of 1500 tonnes of waste
will save ~750 tonnes of CO2-eq compared with the conventional landfill-based practice based on our
preliminary analysis (0.8 tonnes of CO2-eq/tonne of feedstock vs 1.3 tonnes of CO2-eq/tonne of
feedstock).
For process scenario 3, the oil is used to generate electricity while the product gas is used to
generate heat to support the systems. In this case, an annual treatment of 1500 tonnes of waste will
save ~150 tonnes of CO2-eq compared with the conventional landfill-based practice based on our
preliminary analysis (1.2 tonnes of CO2-eq/tonne of feedstock vs 1.3 tonnes of CO2-eq/tonne of
(c)

Phase 2 TRN 1674/10/2018
20 | P a g e
feedstock). Table 1 summarises the carbon saving potential of different implementation scales
compared with waste landfill.
Table 1. A summary of the carbon saving potential of different implementation scales compared with waste landfill. Scale Waste capacity Scenario 1 Scenario 2 Scenario 3 1 6,000 t/y 3,600 t CO2-eq 3,000 t CO2-eq 600 t CO2-eq 2 100,000 t/y 60,000 t CO2-eq 50,000 t CO2-eq 10,000 t CO2-eq
It is clear then that the rationale for using static engines for electricity production, where emissions
can be captured is essential to improve the different scenarios considered. Scenarios 1 and 2
consider CHP as a counter factual, where in practice for the plant the heat can be used to save on
emissions from sya propane heating of the rig.
Limitation The LCA is based on reported values in literature for such parameters as calorific values of products,
efficiencies, and process emissions, which makes the results of indicative value only and does not
reflect the true scale of what could be achieved with electricity production for the waste scenarios
being developed at scale by the consortium. There are also potential scaling effects on the process
parameters, affecting the estimation of the carbon saving potential of up-scaling systems.
Uncertainty analysis (e.g., with a Monte Carlo simulation-based method) is needed to quantify the
confidence level of the results statistically upon the availability of more systematic data for the
systems of different scales.
References FINKBEINER, M., INABA, A., TAN, R., CHRISTIANSEN, K. & KLÜPPEL, H.-J. 2006. The new
international standards for life cycle assessment: ISO 14040 and ISO 14044. The international journal of life cycle assessment, 11, 80-85.
LIU, B., WEI, Q., ZHANG, B. & BI, J. 2013. Life cycle GHG emissions of sewage sludge treatment and disposal options in Tai Lake Watershed, China. Science of the Total Environment, 447, 361-369.
RIGHI, S., OLIVIERO, L., PEDRINI, M., BUSCAROLI, A. & DELLA CASA, C. 2013. Life cycle assessment of management systems for sewage sludge and food waste: centralized and decentralized approaches. Journal of Cleaner Production, 44, 8-17.
THINKSTEP. 2019. Thinkstep GaBi - life cylce assessment software [Online]. Available: http://www.gabi-software.com/uk-ireland/index/. [Accessed on July 18, 2019].
TRABELSI, A. B. H., ZAAFOURI, K., BAGHDADI, W., NAOUI, S. & OUERGHI, A. 2018. Second generation biofuels production from waste cooking oil via pyrolysis process. Renewable energy, 126, 888-896.
Phase 2 TRN 1674/10/2018
21 | P a g e
7. Problems encountered during the project
At the outset, it was thought that two of the existing systems in Glasgow could be used to produce
the samples; however, it was apparent that these would have to be modified to collect the distillates
and F1 moved to a vertical system. This led to a design for the larger reactor that was much more
complex than was first thought necessary, and with a fill factor that was lower. Consequently, the
design and build phase for all the systems took a lot longer which led to delays in the experimental
work. Additionally, while the smaller systems could be used relatively easily the larger rig, with of
course the larger associated risks, was much harder to handle. And with the larger reactor volume,
more feedstock is required for process optimisation. Unfortunately, because of these matters and
lack of feedstock, it was not possible to optimise the process for TATA and BFO.
It was also found out that the solid feedstocks supplied by Argent were only analogue models, with
three different samples available. All of these were processed in the RIP-V, 2.6 L reactor; however,
it should be reiterated that they were potentially unsafe and required specially handling. They
contained a large number of insects and flies which became a hazard in the laboratory, the samples
were contained in plastic containers, as supplied, double bagged in bin liners, and then placed in
metal oil drums. Samples were taken quickly and in a well-ventilated area, however, UoG of was
not equipped to handle this feedstock at scale and this process is more suited to an industrial site
that a University laboratory. A further and important health hazard was the ventilation of the area
where the experiments were being done. Whilst extraction was used, it was clear in some of the
processing that the fumes produced where potentially extremely hazardous. This was particularly
the case for MONG, where for preliminary trials a small leakage was very reactive and irritated the
eyes. This feedstock was not further examined because of these dangers and the lack of extraction
and scrubbers in the laboratory at the University of Glasgow. Also, with BFO feedstock processing
on the Big Rig, the fumes were considerably worse than on the small rig and smelt differently. It was
not clear whether this was because of a different batch of the BFO was used or just because of the
much larger volumes of the materials processed and the subsequently larger emissions. Further
work will require the installation of scrubbers and completely sealing the reactor in an enclosed
housing; this is currently done for gasification system we have in house and needs to be replicated
for the pyrolysis systems, lack of time and capital prevented this from being done in the timescales
available for the feasibility study.
Pre-treatment of the feedstock plays an important part in reducing the energy needed for pyrolysis,
where ideally any water is removed through settling or centrifuging. Pre-treatment was attempted
for some of the samples, including free standing in a tube and pre-centrifuging but there was no
separation of any water phase identified. It should be noted that different samples of the TATA
feedstock were used on the Big Rig compared to the work done on RIP-V; it was known that the
TATA samples had a higher water content, but it transpired that they were higher than originally
thought, which led to poor quality distillates and fuel samples. The process parameters that were

Phase 2 TRN 1674/10/2018
22 | P a g e
used for producing successful samples using RIP-V were translated to the Big Rig to produce
distillate.
After NLE received the samples, there was some phase separation. And it was clear that much of
the distillate from the Big Rig was only water-based and the samples from inside the reactor were
too thick to process directly. More time would be needed to optimise the process parameters to
produce the distillate. This is important work, however, as it led to developing the protocol for scaling
the plant to commercial scale. Here, it is proposed that more detailed experiments are done on the
feedstock over a wider range of parameters, with more rapid GCMS analysis of the distillate to speed
this process. This includes pre-treatment to remove water, something that could not be achieved at
Glasgow in the feasibility study, and only at small scale (or very large scale with their 7 t/hr systems)
at NLE.
In scaling and running the plant, the input feedstock needs to be fully characterised and the process
parameters optimised; it therefore makes sense to have a small duplicate rig that can process the
incoming new feedstock, to identify process parameters for that delivery, and identify any potential
problems that may occur before processing the larger volumes. Instrumentation and control of the
plant is also critical for maximising yields and product quality. As alternative feedstocks are sought,
their behaviour, water and fuel content need to be mapped.
Real time water concentration techniques are also being developed at Glasgow, which would allow
real time control of the pyrolysis process and separation and identification of the distillate phases.
Furthermore, the TATA samples appear to be an emulsion which could not be separated easily prior
to pyrolysis. A more thorough investigation into pre-centrifuging before thermal treatment would be
done for the pilot plant development to avoid large scale dewatering during the pyrolysis process,
where the availability of oxygen from the water phase may severely degrade the fuel product.
The LCA model needs to reflect the design for the scaled systems more accurately and take account
of downstream emission control technology.
Based on these results, two system designs were considered for scaling. An iterative design process
led to the submission for liquid and solid phase handling. However, the quality, composition and
composition variance of the feedstock needs to be understood in more detail to model the likely
output yields and usable fuel.

Phase 2 TRN 1674/10/2018
23 | P a g e
NLE Cleaning of Fuel, Fuel Delivery to Engine, Fuel Feasibility
& Emissions testing
8. Introduction
The Work Packages for NLE Phase 2 Feasibility was to evaluate the fuels produced from UoG by
running on NLE’s existing Test Facilities, namely the single cylinder Lister for small scale initial
results then on our endurance engine the Perkins 100kW test rig. This engine typically requires
around 1,000kg of fuel to run a limited trial.
To obtain best results both test engines needed upgrading to record very accurate emissions on
Signal Gas Analysers (which had been in storage for 9 years) and accurately measure ‘real’ fuel
consumption. I.E. All engines are designed to run on EN590 and NLE are aware of the requirements
to modify the standard configuration to optimise and set-up for the fuels we will be testing. These
modifications have been developed by NLE across a broad range of fuels and engine types. These
modifications even include - EN14214 (B100% Bio-Fuel) as they all have different fuel combustion
and consumption profiles and figures, especially if it is being worked across a varying power curve.
On our 1st visit to UoG labs following the Grant Submission it became clear that the production of
significant quantities of fuel batches was going to be impossible within the confines of the UoG lab
premises, so NLE reviewed the requirement and undertook – at its own expense – to make a medium
size fuel testing cell using a small 4 cylinder CI engine.
This would involve significant extra expenditure than budgeted but would provide a testing facility to
run smaller batches of fuel samples in the quantities that UoG could realistically produce.
Below is a breakdown of the new fuel test cell specifically built for the testing.

Phase 2 TRN 1674/10/2018
24 | P a g e
9. Test Cell 2 – Deutz 4-cylinder engine with alternator
D2008L04 - 4 Cylinder Deutz
Figure 10 - Deutz 4-Cylinder naturally aspi-rated IDI engine
This is a Deutz 4 cylinder naturally aspirated IDI Engine. This particular engine is a part of the devel-opment engines made for tuning and refining from the GOLD reference engine we also hold on Deutz behalf. .
The Power Curve
Figure 11 - Deutz 4-Cylinder N/A power curve
This engine produces 26kW at full load at 3,000 RPM. We need to run the engine at 1,500 RPM to allow the alternative fuels the maximum amount of time to full combust in the cham-ber. I.E. running at 3,000 would mean the total duration of burn would be half and we need to ensure all the long chains have time to complete ignition.
Exhaust Gas Emissions
Figure 12 - Signal Gas Emissions Towers
Signal Emissions towers with full calibration gases. Records NOx, CO, CO2, THC and O2. Includes prefilters, gas ovens, gas separa-tors.

Phase 2 TRN 1674/10/2018
25 | P a g e
Data Collection
Figure 13 - Server grade data desk with ex-tensive data collection capabilities
Data Desk with full server grade computer data collection. Records all sensors and weather data. In cylinder combustion sensor, 16 Pico log channels for fuel injection and exhaust gas temperatures. 8 channels of Campbell Scientific for Ther-mistors and Dyno control. Full weather station. Fuel weight scale to 1g recording per sec-ond.
Figure 14 - Lab grade variable voltage DC power supply
Variable Voltage controller to 3 decimal places. Kistler combustion probe amplifier. Marsden Plate scale monitor connected to data logger for continuous weight recording in 1g increments during trials
Fuel Measurement
Figure 15 - 30kg Marsden scale
30kg Marsden plate scale in 1g increments with stainless steel tea urn containing fuel samples. We have 2 scales, 1 for starter fuel and 1 for sample fuel (we use a smaller scale if we have limited sample fuel for greater granular-ity of results) The temperature of both fuels is carefully monitored and recorded during trials.

Phase 2 TRN 1674/10/2018
26 | P a g e
Deutz Euro 4 IDI engine
Figure 16 - Deutz 4-Cylinder N/A engine with modifications and sensors attached
Covers, heaters and insulation removed for viewing purposes. 14 X Various temperature sensors on fuel tanks and lines including special probes
Fuel temperature probes
Figure 17 - High accuracy temperature sen-sors for data collection
Covers, heaters and insulation removed for viewing purposes. 4 X T type clamp on Injection Temperature sensors 4 X K type Exhaust gas sensors T types Fuel tank sensors T types Water temperature Sensors T type Air Intake temperature sensors All linking to the 16 channels on the Pico Loggers 4 X RTD Thermistors on the fuel lines linking to Campbell Data logger
Data Creation devices
Figure 18 - Campbell Scientific CR1000X & LCD20 load cell amplifier
Campbell Scientific CR1000X data logger LCD20 load cell amplifier from Dyno Load cell for conversion to feed voltage generator for Dyno control at data desk.

Phase 2 TRN 1674/10/2018
27 | P a g e
Figure 19 - Picolog automotive data loggers
2 X 8 Channel Pico Loggers for recording fuel tank, lines, Injector and Exhaust gas temperatures. Pico Scope 4 channel oscilloscope to record and display Combustion Profile from Kistler in chamber pressure sensors
Figure 20 - Deep Sea engine controller
Control Panel with small Deep Sea engine controller for basic engine parameters with basic analogue oil, water, volts etc.
Heat exchanger rather than a bolt on radiator and engine fan
Figure 21 - Bowman header tank heat ex-changer
Bowman Heat exchanger for engine cooling. There is no radiator fan cooling the engine during trials.

Phase 2 TRN 1674/10/2018
28 | P a g e
External Radiator and Variable speed water pump for engine and Dyno cooling
Figure 22 - External radiator, fan & water pump
External radiator and variable speed water pump housed outside the test cell building.
Weather recording
Figure 23 - Weather capture station
Weather capture station situated immediately outside the test cell close to the air intake and exhaust.
Figure 24 - Weather station wireless unit
The unit measures temperature inside and outside, Relative humidity, wind direction and speed etc. It is connected to the internet and uploads live for use to use as required.

Phase 2 TRN 1674/10/2018
29 | P a g e
Calibrated Load Banks and Dyno
Figure 25 - 100kW load bank
The 100kW load bank that allows steps of 1kW increments to tune the load to the power curve of the engine under different speeds etc. (only useable when Dyno is fit-ted).
Figure 26 - 80kW Froude Dynomometer
80 kW Eddy Current dyno. Currently re-moved awaiting repair and servicing.
Figure 27 - Spare load bank
Spare load bank that is being modified to provide 100W granular loads for further test-ing of fuels.

Phase 2 TRN 1674/10/2018
30 | P a g e
10. Test Cell 3 – Single cylinder engine with alternator
Figure 28 - Single-Cylinder Lister Diesel engine
Single Cylinder Lister engine and alterna-tor. This has been modified to have a simple fuel change-over system to run EN590 then the sample fuel. The exhaust is connected to the Signal ex-haust Gas towers for full emissions meas-urement. Designed to run very small fuel samples to provide a rough guide to fuel consumption and emission.
Figure 29 - Current and Voltage meters
The Current and Voltage are recorded to in-dicate the stability of the fuel to ensure cor-rect 50Hz phase output.
Figure 30 - Fuel DTI
A DTI is connected to the ‘Rack’ which con-trols the amount of fuel being presented to the injector to maintain load and Hz. This is a good guide to indicate the calorific value of the sample fuel and to check against theoretical values to indicate if the fuel is being presented to the engine cor-rectly. i.e. Viscosity, temperature, filtration quality, etc. Deviations from theoretical will require investigation.

Phase 2 TRN 1674/10/2018
31 | P a g e
Figure 31 - Small fuel quantity measure-ment
We us a special heated container placed on a 0.1g scale to measure fuel consumption. The image shows example of the small quantities of fuel we can measure.

Phase 2 TRN 1674/10/2018
32 | P a g e
11. University of Glasgow Fuel Arrival
The fuel samples delivered by the University of Glasgow are as follows:
Samples were divided up into test codes (2 through 11) and different samples of each test code
were delivered (i.e. watery distillate, pyrolyzed oil left in reactor).
• Test code 2 & 3 – Non-Centrifuge, Centrifuge
• Test code 6 – Watery Distillate, Pyrolyzed oil left in reactor, Non-Centrifuge, Distillate &
Centrifuge
• Test code 7 – Pyrolyzed oil left in reactor, Distillate
• Test code 8 – Pyrolyzed oil left in reactor, 1st Distillate, 2nd Distillate
• Test code 10 – Pyrolyzed oil left in reactor, Distillate
• Test code 11 – Pyrolyzed oil left in reactor, Distillate Gold, Distillate Brown
12. University of Glasgow Fuel Sample De-Watering, Cleaning and Polishing
• All batches contained large quantities of water upon arrival. This caused a delay to the
cleaning process as this quantity of water was unexpected due to the quality of fuel that
was communicated prior to arrival. Therefore, the fuels required settling in distillation col-
umns.
Samples cleaned as of writing this report
• Test code 2 & 3 – Distillate & Non-Centrifuge
• Test code 6 – Non-Centrifuge, Distillate & Centrifuge
• Test code 7 – Distillate
• Test code 8 – 1st Distillate, 2nd Distillate
• Test code 11 – Distillate Brown, Distillate Gold

Phase 2 TRN 1674/10/2018
33 | P a g e
13. Separation, Filtration and Cleaning
Settling The settling process was carried out for all currently filtered samples (see list above) in distillation
columns under heated conditions using an oven at varying temperatures (See figure 32 & 33 below
for distillation column equipment used).
Figure 32 - Distillation Column
Distillation Column Using multiple Pyrex settlement col-umns to allow the fuel to separate. It was found that the fuel separated quicker in a controlled temperature. Each fuel seemed to settle at different temperatures.
Figure 33 - Example fuel separation - Test code 11 Distillate Brown
Example Fuel Separation – Test code 11 Distillate Brown This fuel settled best at 30 degrees.
This process took varying durations from between ~6 hours to a few days of settling before the water could be sufficiently separated from the oil. This then allowed all the oils to be pipetted off and transferred to their own containers.

Phase 2 TRN 1674/10/2018
34 | P a g e
A Few images (Figure 34 & 35) illustrating the separated oil and water are shown below:
Figure 34 - 2 & 3 Distillate, Non-Centrifuge
Opposite shows the significant quanti-ties of water compared to the oils in this sample.
Figure 35 – Test code 8 1st Distillate
Again the quantities of oil to water was significant but the percentage of oils re-covered was higher.

Phase 2 TRN 1674/10/2018
35 | P a g e
Figure 36 - Heated filtering of fuel samples
Extensive filtering Each of the samples was filtered exten-sively in a heated and controlled envi-ronment for up to three days depending on the quantity of solids using 12v Facet pump, multiple paper filter within a highly controlled oven. An example image, Figure 14, of this can be seen opposite.
Figure 37 - Test code 7 Distillate after full filtration
The samples were regularly centrifuged filtering to obtain readings pertaining to how much solid matter was contained in each oil. An example of a de-watered, fully filtered sample of the Test code 7 Distillate can be seen in Figure 15 as an illustration.
Figure 38 - Test code 8 1st Distillate De-gassing
When we prepared this sample for en-gine running we discovered there was still steam rising when we heated the fuel. We then undertook a de-gassing by heating in an oven at 95°C. This was done for 5 hours to evaporate all the wa-ter out of the oil.
After this another Zahn cup test was done on the sample to find the required temperature due to
the change in viscosity as no water present in the fuel.

Phase 2 TRN 1674/10/2018
36 | P a g e
14. Filtration Problems
There were some fuels that would not pass through our filtration system, even at an elevated tem-
perature of ~70°C.
These fuels were:
• Test Code 8 2nd distillate – Due to repeated blocking of filters • Test Code 2 & 3 Centrifuged – Due to repeated blocking of filters • Test Code 2 & 3 Non-Centrifuged – Insufficient amount of fuel to attempt to filter • Test Code 6 Distillate Centrifuged - Insufficient amount of fuel to attempt to filter
Zahn Cup testing After separation and filtration of the fuels, two samples were selected that looked the most viable
for running in Test cell 2. This was due to time constraints.
The samples chosen were:
Test code 8 1st Distillate &;
Test code 11 Distillate Brown. The Zahn cup test was done by heating the two samples to 100°C in an oven and taking time read-
ings for every degree lost (i.e. 100°C, 99°C, 98°C) until they reach around 40 seconds to complete
the test. This is due to the maximum time for a Zahn cup test with regards to clean fuel injection
being around 35 seconds due to viscosity of the fuel.
Zahn cup graphs/tables for these two samples can be found below.
Zahn cup graphs/tables for these two samples can be found below. The data below only shows +/-
5°C from the crucial 35 second mark that pertains to a low enough viscosity for injection.

Phase 2 TRN 1674/10/2018
37 | P a g e
Test code 8 1st Distillate
Tempera-ture (°C)
Time Taken (s)
71 32.32 70 32.76 69 33.01 68 33.64 67 33.96 66 34.52 65 35.57 64 35.88 63 36.17 62 36.68 61 36.99
Test code 11 Distillate Brown
Temperature (°C)
Time Taken (s)
50 31.59 49 32.43 48 33.04 47 33.67 46 34.12 45 34.87 44 35.88 43 36.65 42 37.32 41 38.29 40 39.17
Figure 39 - Test code 8 1st Distillate Zahn cup test graph
Figure 40 - Test code 11 Distillate Brown Zahn cup graph

Phase 2 TRN 1674/10/2018
38 | P a g e
15. Results
In total, the delivery contained 47.075 litres of fuel samples. The datasheet for the received fuels
is below in Figure 41.
Figure 41 - University of Glasgow Fuel Sample Datasheet
The combined weight of all fuels after cleaning, filtering and the removal of water was 5.491kg.
The weights for each individual sample after cleaning can be seen in the table below.
Test Code Sample Fuel Weight (g) Water Weight (g) Total Weight (g) 2 & 3 Distillate & Non-Centrifuge 55.54 803.4 858.94
Distillate & Centrifuge 1508.9 0* 1508.9 6 Non-Centrifuge 7.4 680.4 687.8
Distillate & Centrifuge 91.1 53.9 145 7 Distillate 392.3 1761.1 2153.4 8 1st Distillate 568.4 3306.3 3874.7
2nd Distillate 269.8 267.2 537 10 Distillate 8.7 231.6 240.3 11 Distillate Brown 2223.8 0 2223.8
Distillate Gold 365.6 0 365.6 Total 5491.54 7103.9 12595.44
Phase 2 TRN 1674/10/2018
39 | P a g e
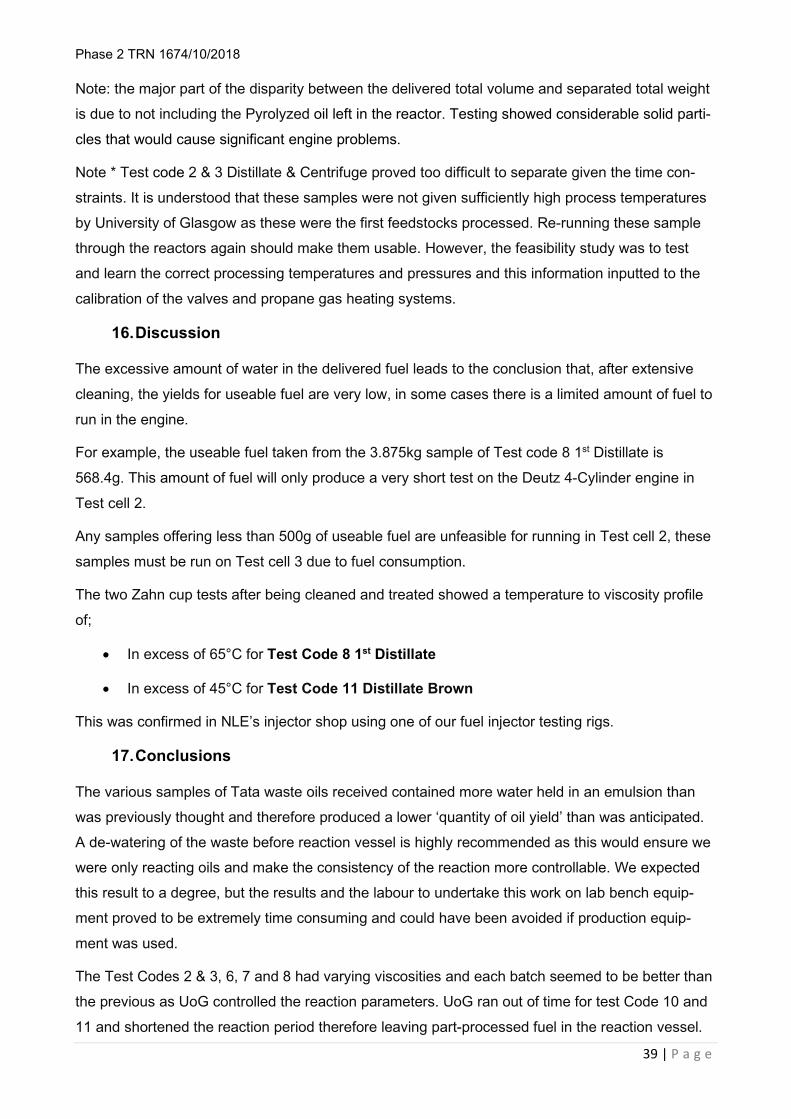
Note: the major part of the disparity between the delivered total volume and separated total weight
is due to not including the Pyrolyzed oil left in the reactor. Testing showed considerable solid parti-
cles that would cause significant engine problems.
Note * Test code 2 & 3 Distillate & Centrifuge proved too difficult to separate given the time con-
straints. It is understood that these samples were not given sufficiently high process temperatures
by University of Glasgow as these were the first feedstocks processed. Re-running these sample
through the reactors again should make them usable. However, the feasibility study was to test
and learn the correct processing temperatures and pressures and this information inputted to the
calibration of the valves and propane gas heating systems.
16. Discussion
The excessive amount of water in the delivered fuel leads to the conclusion that, after extensive
cleaning, the yields for useable fuel are very low, in some cases there is a limited amount of fuel to
run in the engine.
For example, the useable fuel taken from the 3.875kg sample of Test code 8 1st Distillate is
568.4g. This amount of fuel will only produce a very short test on the Deutz 4-Cylinder engine in
Test cell 2.
Any samples offering less than 500g of useable fuel are unfeasible for running in Test cell 2, these
samples must be run on Test cell 3 due to fuel consumption.
The two Zahn cup tests after being cleaned and treated showed a temperature to viscosity profile
of;
• In excess of 65°C for Test Code 8 1st Distillate
• In excess of 45°C for Test Code 11 Distillate Brown
This was confirmed in NLE’s injector shop using one of our fuel injector testing rigs.
17. Conclusions
The various samples of Tata waste oils received contained more water held in an emulsion than
was previously thought and therefore produced a lower ‘quantity of oil yield’ than was anticipated.
A de-watering of the waste before reaction vessel is highly recommended as this would ensure we
were only reacting oils and make the consistency of the reaction more controllable. We expected
this result to a degree, but the results and the labour to undertake this work on lab bench equip-
ment proved to be extremely time consuming and could have been avoided if production equip-
ment was used.
The Test Codes 2 & 3, 6, 7 and 8 had varying viscosities and each batch seemed to be better than
the previous as UoG controlled the reaction parameters. UoG ran out of time for test Code 10 and
11 and shortened the reaction period therefore leaving part-processed fuel in the reaction vessel.
Phase 2 TRN 1674/10/2018
40 | P a g e
These left-over residues are not suitable for engine use without significant further processing as
they contained significant amounts of ‘ash’ type deposits.
18. Recommendations
Both fuels produced some positive results. However, the failed processes indicate that significant
further development on the exact pressure, temperature, reaction time, vacuum, distillation height
etc is required to ensure a consistent output.
A continuous production style pre-cleaning and post cleaning including a separate distillation purifi-
cation last stage would make the fuel processing significantly easier than the very small batch han-
dling we had to undertake.
19. Fuel Sample Testing
Lister Testing 4 fuel samples were tested on the Lister single cylinder test cell in July and August to provide initial
data to UoG and to decide on the fuels to progress with.
Testing BFO
We combined sample 2 & 3 together as also sample 4 & 5 to provide 2 lots of around 80cc of fil-
tered fuel. Although the samples were small and the trial would be very short, the results were very
encouraging. The trials were carried out using an analog DTI (now replaced with a digital) and the
emissions were recorded using a Horiba Lab Quality multi gas emissions analyzer as the Signal
full emissions towers had not yet been repaired and commissioned.

Phase 2 TRN 1674/10/2018
41 | P a g e
Lister Single Cylinder with Generator
Figure 42 - Single-Cylinder Lister engine with DTI fitted
This has been upgraded with a DTI fitted to the fuel injection rack that clearly shows the ‘throw’ based on fuel delivery. This has proven a simple but effective way of ‘seeing’ the difference between the test fuels and the baseline EN590 and EN14214.
Figure 43 - Lister engine running sample 2 & 3
Put simply the Lister must inject more of the test fuel to maintain the 50Hz fre-quency of the attached generator com-pared to baseline fuels. Sample 2 & 3 were tested and showed promise – see consumption graphs be-low.
Sample 2 and Sample 3
Figure 44 - Test sample viles for Lister en-gine
Vile 2 and 3 (left) is one fuel type from UoG Vile 4 and 5 (right) is a second run. Both fuels were derived from BFO and broke down the long chains into Alkanes and other aromatic HC’s – chemical analysis is being undertaken – awaiting results.

Phase 2 TRN 1674/10/2018
42 | P a g e
EN590 Diesel Baseline Emissions
Figure 45 - EN590 diesel emissions
The single cylinder is not an efficient combustion engine. The 14.54% vol of O2 shows a higher value than you would expect on a more sophisticated engine. Hydrocarbons are higher due to ineffi-cient combustion. Other values are normal
Sample 2 & 3 BFO Pyrolysis Emissions
Figure 46 - Pyrolised BFO emissions (2 & 3)
Surprisingly the emissions are similar alt-hough fuel consumption increased (see graph) The NO was lower than EN590 which may be due to lower GCV and therefore cooler combustion. Requires lab testing and further work.
Sample 4 & 5 BFO Pyrolysis Emissions
Figure 47 - Pyrolised BFO emissions (4 & 5)
Very low NO figure compared to EN590 Slightly better fuel consumption. Slightly less stable running than Sample 2 & 3. Requires lab testing but looks encourag-ing.

Phase 2 TRN 1674/10/2018
43 | P a g e
Fuel Consumption on Lister
Figure 48 - Single-Cylinder Lister fuel con-sumption
Extensive baseline of EN590 and EN14214 under different RH and tem-perature conditions have shown signifi-cant variation on engine as expected. Baseline and testing were done under same weather conditions. Need GCV to evaluate against test. Alt-hough lower energy than EN590 the test fuel is close to EN14214
Initial feedback We did not have enough fuel to allow us to filter before running the test. This is sus-
pected to be why the engine ‘hunted’ during the run as there were clearly black particles
suspended in the fuel. However, it ran better than we could have anticipated before the
test – very encouraging.
TATA Steel Samples 1, 2 & 3
Sample 1 (Vacuum Filtered)
O2 18.26%: Failed sensor
CO 0%: Failed Sensor
HC 12ppm: Unreliable Result, expected sensor failure
CO2 2.14%: Unreliable Result, expected sensor failure
NO 249ppm: Unreliable result, expected sensor failure
NOX (corrected for O2 15%) 663.1
13.464 14.096
18.359
Average time to consume 10g of fuel (Seconds)
EN590 diesel
Sample 2 & 3
Sample 4 & 5
Figure 49 - TATA Steel Sample 1 emissions

Phase 2 TRN 1674/10/2018
44 | P a g e
Sample 2 (Centrifuged)
O2 18.49%: Failed sensor
CO 0%: Failed Sensor
HC 10ppm: Unreliable Result, expected sensor failure
CO2 2.14%: Unreliable Result, expected sensor failure
NO 258ppm: Unreliable result, expected sensor failure
NOX (corrected for O2 15%) 631.6
Sample 3 (Centrifuged and blended with B100 50:50)
O2 18.64%: Failed Sensor
CO 0%: Failed Sensor
HC 12ppm: Unreliable result, expected sensor failure
CO2 2.16%: Unreliable result, expected sensor failure
NO 254ppm: Unreliable result, expected sensor failure
NOX (corrected for O2 15%) 556.5
Conclusion Horiba unit was sent back to have the appropriate sensors replaced; however, a corrected figure
cannot be supplied as there was an insufficient amount of fuel to re-run the trial.
Due to the consistency of unreliable emissions results provided by the Horiba unit, the set of emis-
sions towers from Signal Group previously mention in this document have been installed and cali-
brated to ensure accurate and granular results for any trials going forward.
Both Test Cell 1: Single Cylinder & Test Cell 2: 4 Cylinder, have been connected to the Signal
Group Emissions Towers
Figure 50 - TATA Steel sample 2 emissions
Figure 51 - TATA Steel sample 3 emissions

Phase 2 TRN 1674/10/2018
45 | P a g e
Sample 1, 2 and 3 Consumption with Baselines from B100 & EN590
Figure 52 - B100 & EN590 fuel consumption baselines
Sample 1, 2 and 3 Emissions with Baselines from B100 & EN590
Figure 53 - B100 & EN590 emissions baselines
*It is to be noted that the B100 trial was conducted in different weather conditions to that of the other tests
9.453
18.596 17.520
24.18
16.779
Average time to consume 10g of fuel (seconds)
Sample 1 (vacuum filtered only) Sample 2 (centrifuge only) Sample 3 (centrifuged with B100) EN590 B100
663.1631.6
556.5596.1
687.1
NO
x Co
rrec
ted
for 1
5% 0
2
Emissions comparison
Sample 1 (vacuum filtered only) Sample 2 (centrifuge only) Sample 3 (centrifuged with B100) EN590 B100

Phase 2 TRN 1674/10/2018
46 | P a g e
20. Deutz Fuel Testing
Dozens of fuel trials were run to calibrate the Deutz engine, undertaken over several months. Mul-
tiple fuels were used to act as a proxy for the expected fuel to be received from UoG.
These include B100, cleaned used cooking oil, burnt used cooking oil, HAO and EN590.
Evaluation of the result of each fuel was investigated with Prof Ron Bickerton of UoL (the original
designer of the Deutz engine we were using) and recommendations as to timing modifications, cal-
ibration discussions, additional features such as water and ethanol injection were discussed.
During these calibration trials we unfortunately had a failure of the Dyno and had to replace it with
an alternator to undertake these trials and therefore had to run a new set of calibration trials while
we wait for the Dyno to be repaired.
During these trials it was agreed to run the engine at 75% load at 1,500 RPM as this would allow
us to calibrate accurately with EN590 and still be able to run a poor fuel with lower calorific value
(which would ‘die’ if the load was placed on the 100% power band.
Once fully calibrated the EN590 baselines achieved a 2% variance from theoretical values.
Below is an EN590 baseline on Test cell 2 prior to running the cleaned fuel samples. This test was
performed using a load bank at 9kW, giving 9.33kW of continuous load.
The baseline test was performed for 30 minutes to allow for a good amount of granular data cap-
ture.

Phase 2 TRN 1674/10/2018
47 | P a g e
21. Results
The EN590 baseline test results are shown below. CONSUMPTION FIGURES
TIME Weight (kg)
Time taken
Consumption (g)
Engine speed (RPM)
Engine load (kW)
g/kWh g/kW*.88
13:05:44 7.808 n/a n/a 1508 9.336 n/a n/a 13:07:43 7.71 00:01:59 98 1506 9.338 317.488 279.390 13:10:44 7.565 00:03:01 145 1515 9.333 309.009 271.928 13:13:44 7.422 00:03:00 143 1525 9.333 306.440 269.667 13:16:44 7.282 00:03:00 140 1519 9.338 299.850 263.868 13:19:45 7.141 00:03:01 141 1520 9.34 300.259 264.228 13:22:43 7.002 00:02:58 139 1512 9.335 301.150 265.012 13:25:45 6.862 00:03:02 140 1508 9.335 296.650 261.052 13:28:47 6.722 00:03:02 140 1508 9.338 296.555 260.968 13:31:45 6.584 00:02:58 138 1506 9.338 298.887 263.021 13:34:45 6.446 00:03:00 138 1497 9.342 295.440 259.987
RESULTS TRIAL
LENGTH Time taken
Total Fuel Used
Average Consump-
tion (g)
Engine speed (RPM)
Engine Load (kW)
g/kWh g/kW*.88
0:32:00 00:02:55 1.499 136.273 1500 9.336 301.552 265.366
EMISSIONS READINGS TIME NO
(ppm) THC
(ppm) CO
(ppm) O2
(%vol) Cor-
rected to 15%
O2 13:05:44 748 101 485 8.1 344.8 13:07:43 754 96 460 8.13 348.4 13:10:44 750 121 383 8.3 351.2 13:13:44 757 111 323 8.43 358.2 13:16:44 715 82 248 8.5 340.2 13:19:45 685 92 218 8.62 329.1 13:22:43 663 80 178 8.57 317.25 13:25:45 671 93 224 8.75 325.8 13:28:47 679 106 270 8.93 334.68 13:31:45 680 85 187 8.71 329.1 13:34:45 640 80 168 8.72 310.02

Phase 2 TRN 1674/10/2018
48 | P a g e
Emissions RESULTS
Total Time NO (ppm)
THC (ppm)
CO (ppm)
O2 (%vol)
Corrected to 15% O2
00:32:00 695.83 93.25 274.83 7.91 8.54
EN590 calculations Load 9.337 kw
Usable Calorific Value Calculation Calorific Value 45300 kJ/kg These figures are from
Digest of UK Energy Statistics
Density 0.832 kg/m3
Calculation 37.6896 kJ/litre (Usable power per litre) Energy
Fuel used 1,499 Grams Run time 32 minutes
Per second 0.7807292 g/s Energy In 35.367031 KJ/s
Actual Weight 2810.63 g/hr (measured Red Diesel) 301.02 g/kwh
Energy in Chemical 27612 kw/h Efficiency Calculation
Engine Efficiency 26.40% Engine efficiency based on diesel including 12% alternator loss
Actual Consumption 361.81 Litres/MW fuel consumption Costs Calculation
Fuel Price per Litre £ 0.611 Cost to produce 1MW £ 221.06 Actual Consumption* Price/Li-
tre

Phase 2 TRN 1674/10/2018
49 | P a g e
Temperature Charts
Figure 54 - Deutz 4-Cylinder EN590 exhaust temperatures (9kW)
Figure 55 - Deutz 4-Cylinder EN590 injector temperatures (9kW)
Figure 56 - Deutz 4-Cylinder EN590 injector pipe temperatures (9kW)
Figure 57 - Deutz 4-Cylinder EN590 air intake temperature (9kW)
-400
-200
0
200
400
00:0
0:00
00:0
0:55
00:0
1:50
00:0
2:45
00:0
3:40
00:0
4:35
00:0
5:30
00:0
6:25
00:0
7:20
00:0
8:15
00:0
9:10
00:1
0:05
00:1
1:00
00:1
1:55
00:1
2:50
00:1
3:45
00:1
4:40
00:1
5:35
00:1
6:30
00:1
7:25
00:1
8:20
00:1
9:15
00:2
0:10
00:2
1:05
00:2
2:00
00:2
2:55
00:2
3:50
00:2
4:45
00:2
5:40
00:2
6:35
00:2
7:30
00:2
8:25
00:2
9:20
00:3
0:15
00:3
1:10
00:3
2:05
Exhaust TemperaturesExhaust 1 Ave. (C)(Faulty)Exhaust 2 Ave. (C)
Exhaust 3 Ave. (C)
Exhaust 4 Ave. (C)
Exhaust towers Ave.(C)
020406080
00:0
0:00
00:0
0:54
00:0
1:48
00:0
2:42
00:0
3:36
00:0
4:30
00:0
5:24
00:0
6:18
00:0
7:12
00:0
8:06
00:0
9:00
00:0
9:54
00:1
0:48
00:1
1:42
00:1
2:36
00:1
3:30
00:1
4:24
00:1
5:18
00:1
6:12
00:1
7:06
00:1
8:00
00:1
8:54
00:1
9:48
00:2
0:42
00:2
1:36
00:2
2:30
00:2
3:24
00:2
4:18
00:2
5:12
00:2
6:06
00:2
7:00
00:2
7:54
00:2
8:48
00:2
9:42
00:3
0:36
00:3
1:30
00:3
2:24
Injector TemperatureInjector 1 Ave. (C)
Injector 2 Ave. (C)
Injector 3 Ave. (C)
Injector 4 Ave. (C)
01020304050
13:0
5:44
13:0
6:36
13:0
7:28
13:0
8:20
13:0
9:12
13:1
0:04
13:1
0:56
13:1
1:48
13:1
2:40
13:1
3:32
13:1
4:24
13:1
5:16
13:1
6:08
13:1
7:00
13:1
7:52
13:1
8:44
13:1
9:36
13:2
0:28
13:2
1:20
13:2
2:12
13:2
3:04
13:2
3:56
13:2
4:48
13:2
5:40
13:2
6:32
13:2
7:24
13:2
8:16
13:2
9:08
13:3
0:00
13:3
0:52
13:3
1:44
13:3
2:36
13:3
3:28
13:3
4:20
13:3
5:12
13:3
6:04
13:3
6:56
Injector Pipe Temperatures
Injector 1
Injector 2
Injector 3
Injector 4
4042444648
00:0
0:00
00:0
0:53
00:0
1:46
00:0
2:39
00:0
3:32
00:0
4:25
00:0
5:18
00:0
6:11
00:0
7:04
00:0
7:57
00:0
8:50
00:0
9:43
00:1
0:36
00:1
1:29
00:1
2:22
00:1
3:15
00:1
4:08
00:1
5:01
00:1
5:54
00:1
6:47
00:1
7:40
00:1
8:33
00:1
9:26
00:2
0:19
00:2
1:12
00:2
2:05
00:2
2:58
00:2
3:51
00:2
4:44
00:2
5:37
00:2
6:30
00:2
7:23
00:2
8:16
00:2
9:09
00:3
0:02
00:3
0:55
00:3
1:48
00:3
2:41
Air intake temperaturesAir In Filter Ave. (C)

Phase 2 TRN 1674/10/2018
50 | P a g e
Figure 58 - Deutz 4-Cylinder EN590 fuel temperature (9kW)
Combustion Profile
343638404244
00:0
0:00
00:0
0:53
00:0
1:46
00:0
2:39
00:0
3:32
00:0
4:25
00:0
5:18
00:0
6:11
00:0
7:04
00:0
7:57
00:0
8:50
00:0
9:43
00:1
0:36
00:1
1:29
00:1
2:22
00:1
3:15
00:1
4:08
00:1
5:01
00:1
5:54
00:1
6:47
00:1
7:40
00:1
8:33
00:1
9:26
00:2
0:19
00:2
1:12
00:2
2:05
00:2
2:58
00:2
3:51
00:2
4:44
00:2
5:37
00:2
6:30
00:2
7:23
00:2
8:16
00:2
9:09
00:3
0:02
00:3
0:55
00:3
1:48
00:3
2:41
Fuel Temperature
EN590 TemperatureAve. (C)
0
50
100
00:0
0:00
00:0
0:54
00:0
1:48
00:0
2:42
00:0
3:36
00:0
4:30
00:0
5:24
00:0
6:18
00:0
7:12
00:0
8:06
00:0
9:00
00:0
9:54
00:1
0:48
00:1
1:42
00:1
2:36
00:1
3:30
00:1
4:24
00:1
5:18
00:1
6:12
00:1
7:06
00:1
8:00
00:1
8:54
00:1
9:48
00:2
0:42
00:2
1:36
00:2
2:30
00:2
3:24
00:2
4:18
00:2
5:12
00:2
6:06
00:2
7:00
00:2
7:54
00:2
8:48
00:2
9:42
00:3
0:36
00:3
1:30
00:3
2:24
Water Temperatures
Water Out Ave. (C)
Water In Ave. (C)
Figure 59 - Deutz 4-Cylinder EN590 water temperatures (9kW)
Figure 60 - Deutz 4-Cylinder EN590 combustion profile (9kW)

Phase 2 TRN 1674/10/2018
51 | P a g e
Fuel Samples Trials
Test code 8 1st Distillate
Test code 11 Distillate Brown
22. Discussion
We still need to complete further work on preparing the fuel for testing. However, the initial results
from the above trials were very encouraging. Both fuels would benefit from a more granular reac-
tion procedure to refine the carbon-length chains to a more homogenized level.
23. Conclusions
The Test code 8 1st Distillate sample again proved to have very high calorific value and emissions,
although higher than we would like, were within parameters for post-combustion clean-up.
Test code 11 Distillate Brown had expected calorific value but higher total hydrocarbons. We be-
lieve this is due to higher than recommended reaction temperatures, producing shorter carbon-
length chain aromatics.
We are reasonably convinced that with a full pre-cleanup process prior to reaction vessel and a
post-cleanup process including potential distillation, these fuels would be close to being workable
with refinements on the reaction vessels to tune the fuels to optimum results.
24. Recommendations
Further work is required in a more conducive environment than a science lab in the centre of Glas-
gow for working with these raw feedstocks to the fullest extent. University of Glasgow can only op-
erate small quantities due to the nature of the feedstocks, therefore it as recommended that any-
thing other than the smallest scale fuel refinement takes place at a site with a Waste Collection
and a Waste Incinerator Directive license.