Embed Size (px)
Citation preview

Transport Energy InfrastructureRoadm
ap to 2050
LIQU
ID FUELS RO
ADMAP
Prepared for the LowCVP by Elem
ent Energy LtdCeline Cluzel &
Alastair Hope–Morley
JUN
E 2015

Project Steering Group
AutogasLimited
BOC Lim
itedBEAM
ACalorGas LtdEDF EnergyElectricity N
etworks Association
National Grid
Office for Low
Emission Vehicles
Renewable Energy Association
Transport for LondonTransport ScotlandU
K Petroleum Association
LowCVP
Project Manager
Jonathan Murray,
Policy and Operations Director
ContractorPrepared by Elem
ent Energy Ltd
AuthorsCeline CluzelAlastair Hope-M
orley
Reviewer
Alex Stewart
Transport Energy InfrastructureRoadm
ap to 2050
LIQU
ID FUELS RO
ADMAP
JUN
E 2015
Disclaimer
While
theauthorsconsiderthatthe
dataand
opinionscontainedin
thisreportare
sound,allpartiesm
ustrely
upontheir
own
skilland
judgement
when
usingit.
Theauthors
donot
make
anyrepresentation
orwarranty,expressed
orimplied,asto
theaccuracy
orcompletenessofthe
report.

3
Acknowledgem
ents
The LowCVP aim
s to:�
Develop initiatives to promote the sale and supply of low
carbon vehicles and fuels
�Provide input and advice on Governm
ent policy
�Provide a forum
for stakeholders to share knowledge and inform
ation
�Ensure that U
K motor, fuel and related businesses are best placed to capitalise on the opportunities in the low
carbon m
arkets of the future
�Contribute to the achievem
ent of UK Governm
ent targets for road transport carbon reduction
AutogasLimited
BOC Lim
itedBEAM
ACalorGas LtdEDF EnergyElectricity N
etworks Association
National Grid
Office for Low
Emission Vehicles
Renewable Energy Association
Transport for LondonTransport ScotlandU
K Petroleum Association
The LowCVP, established in 2003, is a public-private partnership that
exists to accelerate a sustainable shift to lower carbon vehicles and
fuels and create opportunities for UK business.
Aberdeen City CouncilAir ProductsBRCBYDCalorgasCN
G FuelsCN
G ServicesDearm
an Engine Company Ltd
Downstream
Fuel AssociationDrivelectricLtd.EN
N Group Europe
Gas Bus AllianceGasrec
GTCIntelligent EnergyN
issanO
penenergiRiversim
pleScaniaSGNSM
MT
TfLThrievTow
er TransitU
KLPGU
KPNU
LEMCo
UPS
Wales &
West U
tilities
Project Steering Comm
itteeW
orkshop attendees

4
Contents
−Introduction and context
−Background and status quo
−Future refueling infrastructure requirem
ents and barriers to deploym
ent
−The case of niche/future fuels
−Sum
mary roadm
ap and recomm
endations
−Appendix

5
Background -a ‘Transport Infrastructure roadmap’ is needed to
complem
ent existing vehicle and fuel roadmaps
Source: Auto Council and LowCVP
Vehicle roadmaps
Transport fuel roadmaps
Source: Auto Council and Element Energy for the Low
CVP
�In the context of the expected transition to low
er carbon powertrains
and fuels, the Auto Council vehicle roadmaps have proven to be a
useful toolto focus research, funding and policy, bringing into one place the industry’s view
s on future technology options, deployment
steps and corresponding policy drivers.
�To com
plement these pow
ertrain technologies roadmaps, the
LowCVP com
missioned a Road Transport Fuels Roadm
ap in 2013-14, w
hich also proved successful in bringing clarity to the fuel options available and m
apping the enabling milestones.
�This Infrastructure roadm
ap is the ‘missing piece’ that w
ill support new
powertrains and new
fuels. This roadmap is all the m
ore necessary as the
needs and barriers for deployment of electric,
hydrogen and gas refuelling stations differ significantly and refuelling/recharging infrastructure is a key enabler for low
emission
vehicles.
�The objectives of the Infrastructure Roadm
ap are to:
−Assess the infrastructure needs and barriers for deploym
ent of electric, hydrogen and gas refuelling stations to 2050, including im
pact on upstream distribution, as w
ell as to consider ‘conventional’ liquid fuels
−M
ake recomm
endations for delivery of infrastructure deploym
ent, both at national and local government level.
Source: Element Energy
6
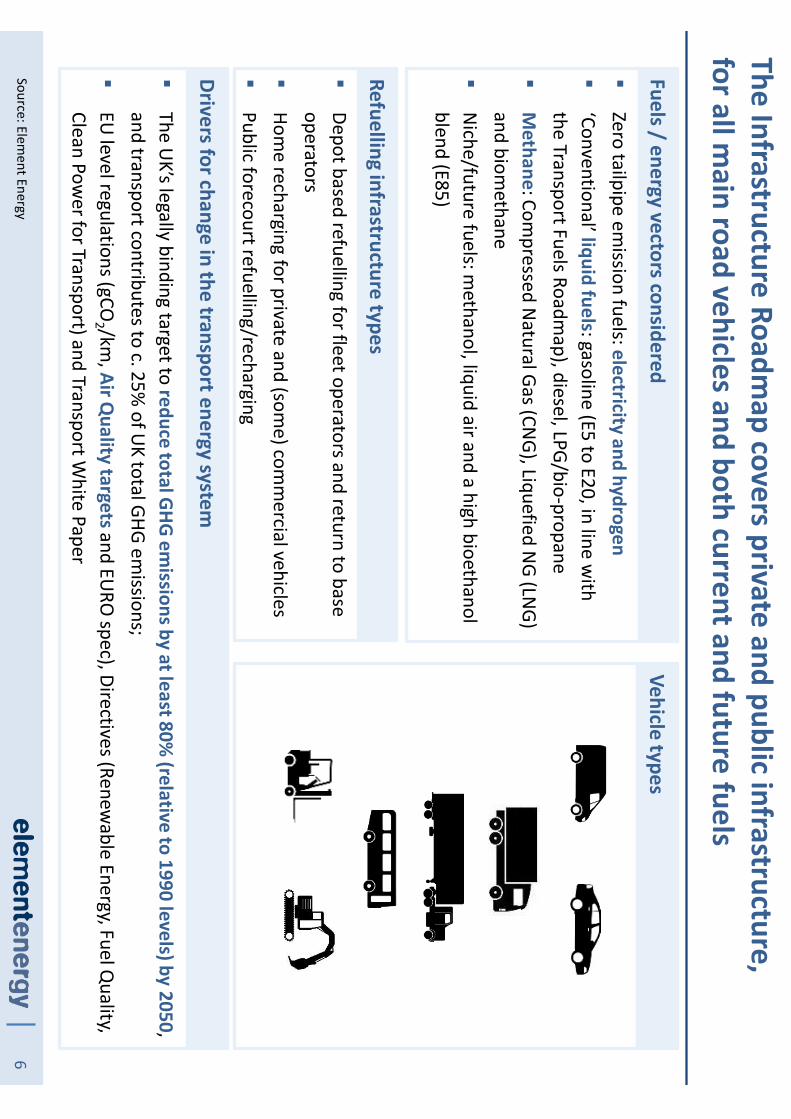
The Infrastructure Roadmap covers private and public infrastructure,
for all main road vehicles and both current and future fuels
�Depot based refuelling for fleet operators and return to base operators
�Hom
e recharging for private and (some) com
mercial vehicles
�Public forecourt refuelling/recharging
Refuelling infrastructure types
Fuels / energy vectors considered
�Zero tailpipe em
ission fuels: electricity and hydrogen�
‘Conventional’ liquid fuels: gasoline (E5 to E20, in line with
the Transport Fuels Roadmap), diesel, LPG/bio-propane
�M
ethane: Compressed N
atural Gas (CNG), Liquefied N
G (LNG)
and biomethane
�N
iche/future fuels: methanol, liquid air and a high bioethanol
blend (E85)
�The U
K’s legally binding target to reduce total GHG
emissions by at least 80%
(relative to 1990 levels) by 2050, and transport contributes to c. 25%
of UK total GHG em
issions; �
EU level regulations (gCO
2 /km, Air Q
uality targets and EURO
spec), Directives (Renewable Energy, Fuel Q
uality, Clean Pow
er for Transport) and Transport White Paper
Drivers for change in the transport energy system
Vehicle types
Source: Element Energy
7
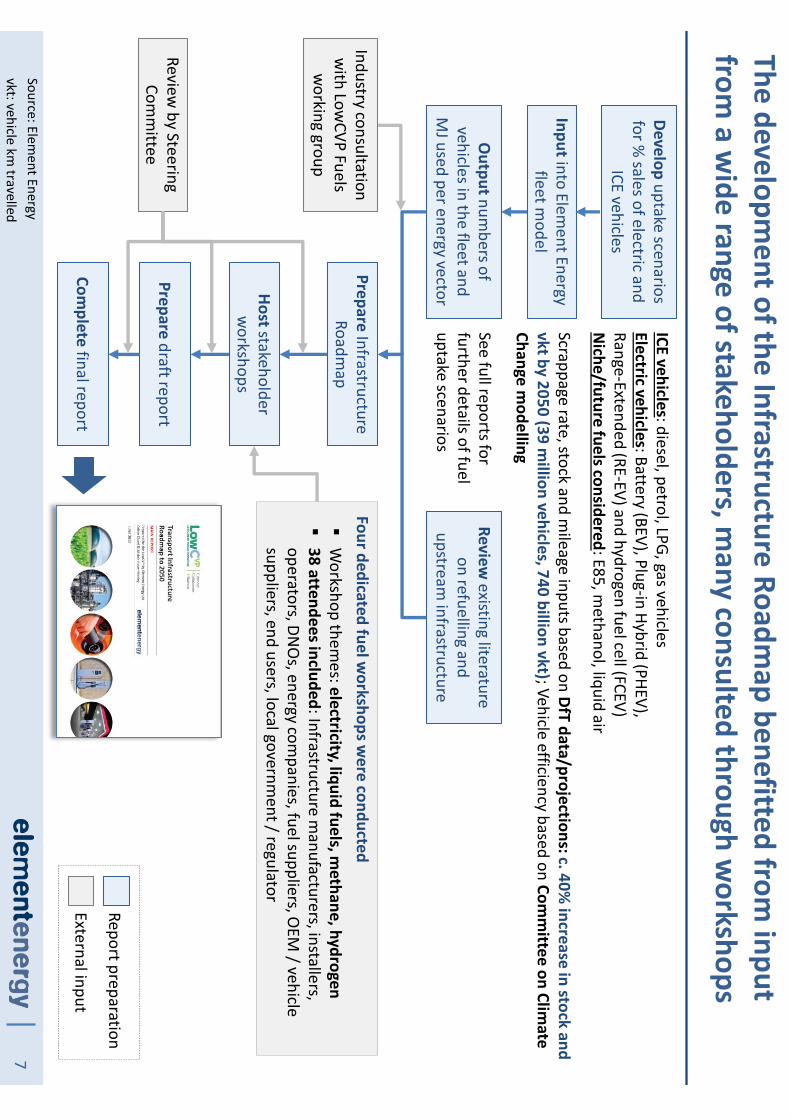
The development of the Infrastructure Roadm
ap benefitted from input
from a w
ide range of stakeholders, many consulted through w
orkshops
Developuptake scenarios
for % sales of electric and
ICE vehicles
Inputinto Element Energy
fleet model
Outputnum
bers of vehicles in the fleet and
MJ used per energy vector
ICE vehicles: diesel, petrol, LPG, gas vehicles Electric vehicles: Battery (BEV), Plug-in Hybrid (PHEV), Range-Extended (RE-EV) and hydrogen fuel cell (FCEV)N
iche/future fuels considered: E85, methanol, liquid air
PrepareInfrastructure
Roadmap
Reviewexisting literature
on refuelling and upstream
infrastructure
Industry consultation w
ith LowCVP Fuels
working group
Review by Steering
Comm
ittee Prepare
draft report
Complete final report
Hoststakeholder w
orkshops
Four dedicated fuel workshops w
ere conducted�
Workshop them
es: electricity, liquid fuels, methane, hydrogen
�38 attendees included: Infrastructure m
anufacturers, installers, operators, DN
Os, energy com
panies, fuel suppliers, OEM
/ vehicle suppliers, end users, local governm
ent / regulator
Report preparation
External input
Source: Element Energy
vkt: vehicle km travelled
See full reports for further details of fuel uptake scenarios
Scrappage rate, stock and mileage inputs based on DfT
data/projections: c. 40% increase in stock and
vkt by 2050 (39 million vehicles, 740 billion vkt); Vehicle efficiency based on Com
mittee on Clim
ate Change m
odelling
8
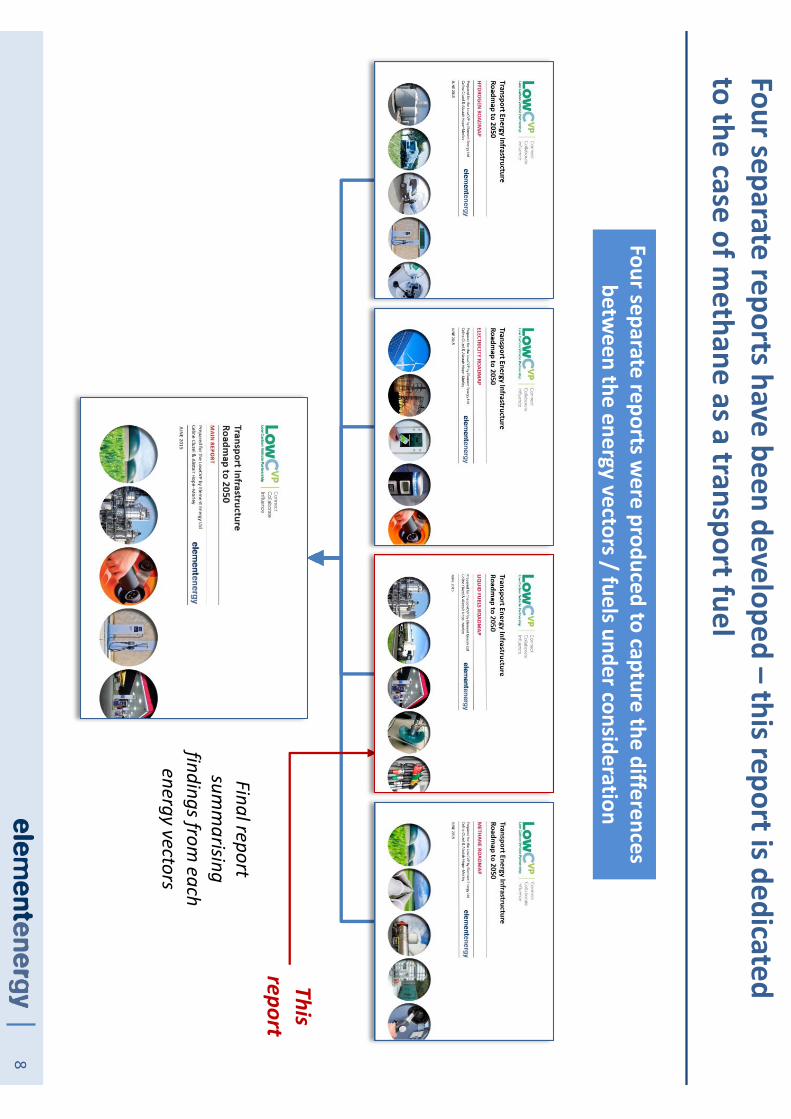
Four separate reports have been developed –this report is dedicated
to the case of methane as a transport fuel
Final report sum
marising
findings from each
energy vectors
Four separate reports were produced to capture the differences
between the energy vectors / fuels under consideration
This report

9
�Background and status quo
−Sum
mary of current upstream
to downstream
systems and liquid fuel consum
ption−
Current supply pathways
−Current trends regarding forecourts
�Future infrastructure requirem
ents and barriers to deployment
−Q
uantification of refuelling station needs, by location and/or vehicle segments -based on
projected demand, derived from
validated uptake scenarios−
Barriers to deployment of infrastructure -
barriers to deployment of corresponding
powertrains are not discussed –
successful deployment of new
powertrains/fuels is the
starting assumption
�The case of niche fuels
�Sum
mary: infrastructure roadm
ap and recomm
endations−
Roadmap schem
atic that summ
arises above findings −
Recomm
endations for delivery (national, local, RD&D needs, funding shortfall)
Structure of the report

10
Contents
−Introduction and context
−Background and status quo
−Future refueling infrastructure requirem
ents and barriers to deploym
ent
−The case of niche/future fuels
−Sum
mary roadm
ap and recomm
endations
−Appendix

11
Public forecourts
The extensive national infrastructure supporting the UK’s liquid
transport fuel demand can be divided into three stream
s
Crude oil refineries
Coastal refined oil im
port terminals
Distribution51%
via pipeline15%
via rail34%
by sea
Crude oilRefined products
e.g. petrol, diesel, biofuel
Inland terminals
Long-term storage
Bioethanol blending
Private depots
Distribution>95%
via road<5%
via pipeline
UpstreamMidstreamDownstream
10 million
tonnes/year30 m
illion tonnes/year
Total delivered petroleum
in 2011:
Relative %
share of consum
ption:
Total: c.50
Total: 20-30Total: 6
19992002
20052008
2011
PetrolDiesel
Source: DUKES (2014), DECC (2014), U
KPIA (2015), Ricardo AEA (2011)M
t = million tonnes
Non-transport
demand
2011: 50%
diesel, 50%
petrol
2011: >95%
diesel, <5%
petrol
Includes domestic heating
c.4Mt/year), feedstock for
chemical plants (3-4 M
t), lubricating oils and grease (0.5
Mt) and other non-energy
products including bitumen,
white spirt and coke (c. 2 M
t)
Over 70%
of total inland petroleum
deliveries are for
transport demand
20112005
19992002
2008
12
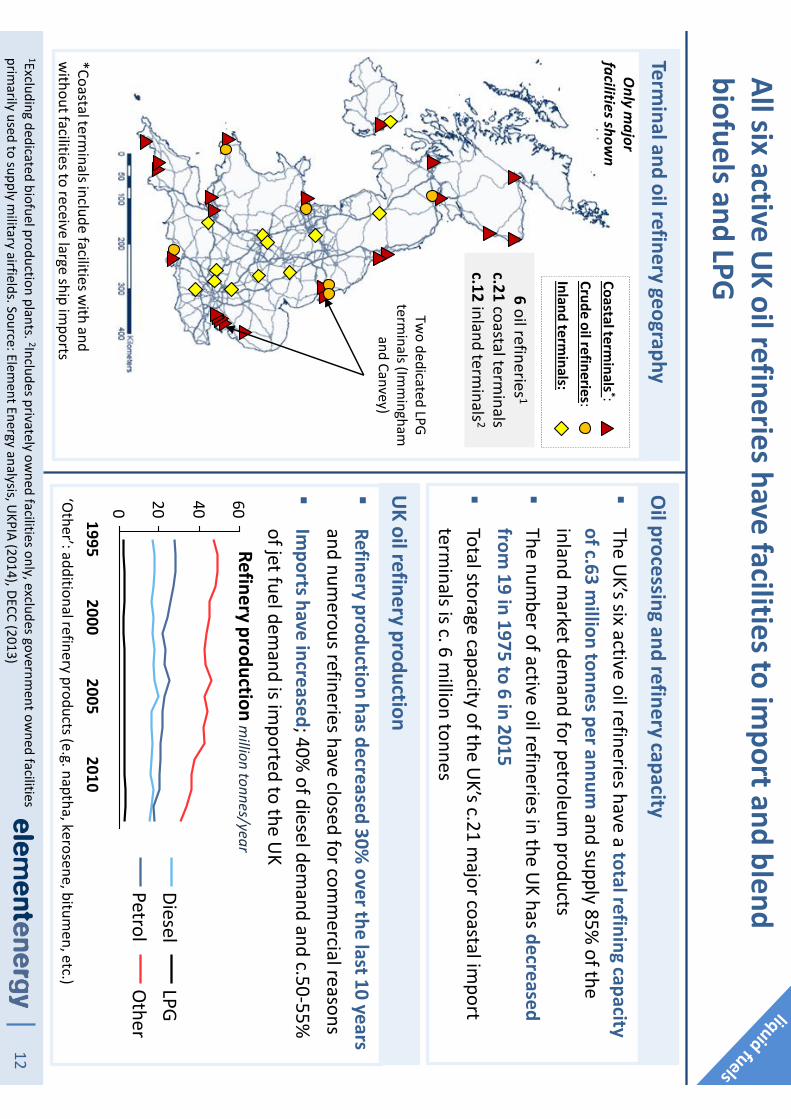
All six active UK oil refineries have facilities to im
port and blend biofuels and LPG
Terminal and oil refinery geography
Oil processing and refinery capacity
�The U
K’s six active oil refineries have a total refining capacity of c.63 m
illion tonnes per annumand supply 85%
of the inland m
arket demand for petroleum
products�
The number of active oil refineries in the U
K has decreased from
19 in 1975 to 6 in 2015�
Total storage capacity of the UK’s c.21 m
ajor coastal import
terminals is c. 6 m
illion tonnes
Coastal terminals *:
Crude oil refineries:Inland term
inals:
0 20 40 60
20101995
20052000
DieselO
therLPG
Petrol
�Refinery production has decreased 30%
over the last 10 years and num
erous refineries have closed for comm
ercial reasons�
Imports have increased; 40%
of diesel demand and c.50-55%
of jet fuel dem
and is imported to the U
K
UK oil refinery production
Refinery production million tonnes/year
‘Other’: additional refinery products (e.g. naptha, kerosene, bitum
en, etc.)
6oil refineries 1
c.21coastal term
inalsc.12
inland terminals 2
1Excluding dedicated biofuel production plants. 2Includes privately owned facilities only, excludes governm
ent owned facilities
primarily used to supply m
ilitary airfields. Source: Element Energy analysis, U
KPIA (2014), DECC (2013)
Two dedicated LPG
terminals (Im
mingham
and Canvey)
*Coastal terminals include facilities w
ith and w
ithout facilities to receive large ship imports
Only m
ajor facilities show
n

13
Generally, FAME is blended at refineries and im
port terminals and
ethanol blended at distribution terminal racks
1DECC RTFO Biofuel Statistics (2014). Sources: Ecofys(2013), Elem
ent Energy (2014)FAM
E = fatty acid methyl esters, U
CO = used cooking oil
Comm
ercial biofuel production plantsU
K biofuel production and consumption capacity
�The U
K has c. 20 dedicated biofuel production plants (total production capacity is c.1,500 m
illion litres/year)
�In 2014, the m
ajority of FAME w
as derived from U
CO and
tallow(adhering to RED sustainability criteria) but a potential
UCO
supply shortage could occur as global markets recognise
UCO
as a cost effective and low carbon feedstock
�In 2014, dom
estic feedstock supplied 20% of U
K biodiesel and bioethanol consum
ption; the remaining 80%
was im
ported1
�‘Drop-in’ biofuel is unlikely to be available in large quantities until post-2020 due to low
technology readiness and investm
ent uncertainty
Biodiesel plant:Large (>5 m
illion L/year):Sm
all (<5 million L/year):
Bioethanol plant:
17biodiesel plants
3 bioethanol plants
BiodieselBioethanol
Biodieselm
illion Litresm
illion LitresBioethanol
0
500
1,000
1,500
20142010
20082012
UK consum
ptionU
K production capacity
Biofuel
0
500
1,000
1,500
20142008
20102012

14
Road capacity is best suited to deliver higher blends to end users unless dem
and can justify new pipeline capacity
1Bioethanol derivatives can be distributed by pipeline if converted to ETBE at a refinery by reaction with isobutene, or by
producing biobutanol. 2FAME m
aximum
specification in jet fuels is <50ppm. Source: Ricardo AEA (2011)
Via road�
Distribute to depots and forecourts through logistics and oil com
panies�
Road tankers (rigid or semi-rigid)
generally comprise 3-6
compartm
ents with varying capacity
(1,000-7,000 litres each)�
Higher blend capability requires low
cost tanker upgrades (e.g. new seals
for >B7, and improved
heating/insulation for >E5)�
Operating close to full capacity but
appetite for expansion exists (e.g. organisations using third-party haulage vehicles have flexible fleet num
bers to meet dem
and variation)
Via pipeline�
Bioethanol could potentially corrode existing pipelines and is highly hydrophilic, therefore is only blended during truck filling at inland term
inals 1
�FAM
Es (surface active m
aterials with a propensity
to leave residue within
pipelines) could contaminate
jet fuels distributed via the sam
e pipeline2
�Costly new
infrastructure requires large throughput to repay capital investm
ent
Via rail�
Distribute primary supply from
refineries and im
port terminals
to inland terminals, w
holesale distributers and large end-user depots (e.g. airports, industry)
�N
o higher blends (>E5/B7) are currently transported by rail
�Infrastructure is operatingclose to full capacity due to lim
ited loading and discharge points at refineries or term
inals�
Rail network is also increasingly
limited by pathw
ay availability�
Only 3-4 rail loading facilities
remain active in the U
K
�Existing distribution infrastructure delivers tw
o petrol grades, one diesel and one heating/NRM
M grade
�Introduction of a new
gradeto the distribution system
would likely require displacem
ent of an existing grade�
Pipeline, road and rail distribution pathways in the U
K all have experience delivering E5-10 and B7 biofuel blends
Experience with higher
blends (>E5/B7)Effective capacity for higher blend distribution
Biofuel
15
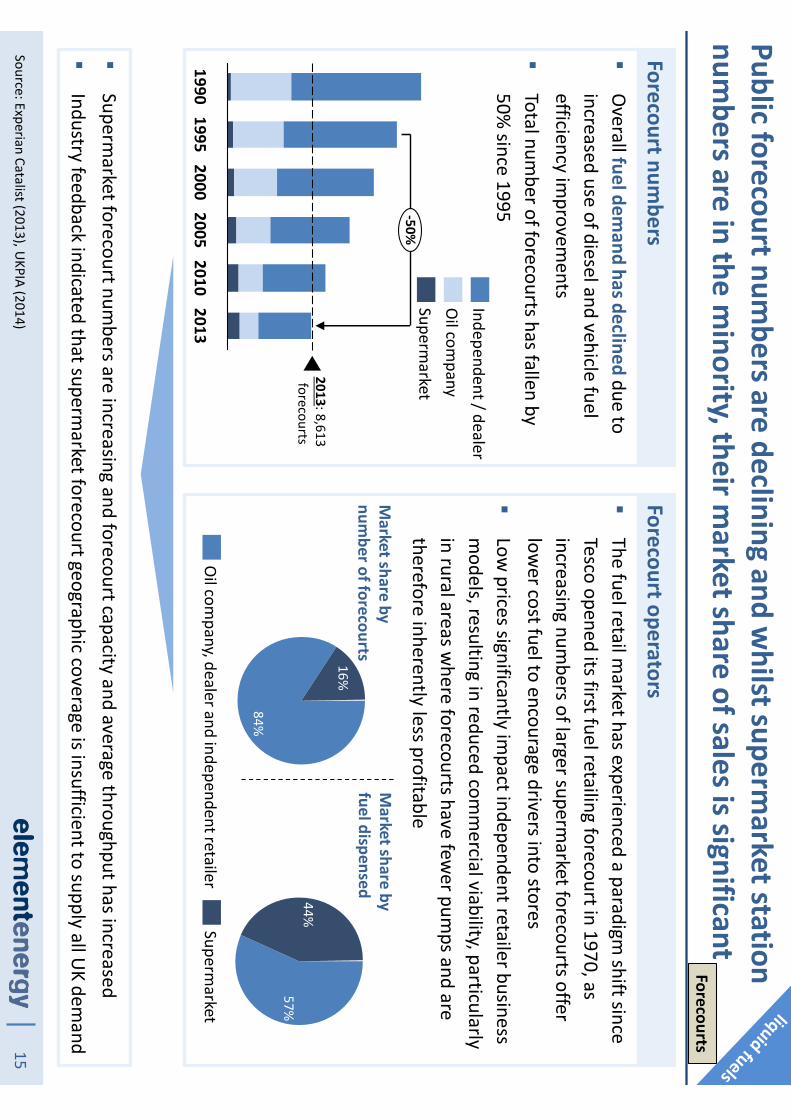
Public forecourt numbers are declining and w
hilst supermarket station
numbers are in the m
inority, their market share of sales is significant
Forecourt operators�
The fuel retail market has experienced a paradigm
shift since Tesco opened its first fuel retailing forecourt in 1970, as increasing num
bers of larger supermarket forecourts offer
lower cost fuel to encourage drivers into stores
�Low
prices significantly impact independent retailer business
models, resulting in reduced com
mercial viability, particularly
in rural areas where forecourts have few
er pumps and are
therefore inherently less profitable
Source: Experian Catalist (2013), UKPIA (2014)
�Superm
arket forecourt numbers are increasing and forecourt capacity and average throughput has increased
�Industry feedback indicated that superm
arket forecourt geographic coverage is insufficient to supply all UK dem
and
44%57%
16%
84%
Oil com
pany, dealer and independent retailerSuperm
arket
Market share by
number of forecourts
Market share by
fuel dispensed
�O
verall fuel demand has declined due to
increased use of diesel and vehicle fuel efficiency im
provements
�Total num
ber of forecourts has fallen by 50%
since 1995
Forecourt numbers
2013
2013: 8,613forecourts
19952010
20051990
2000
-50%
Oil com
panySuperm
arket
Independent / dealer
Forecourts
16
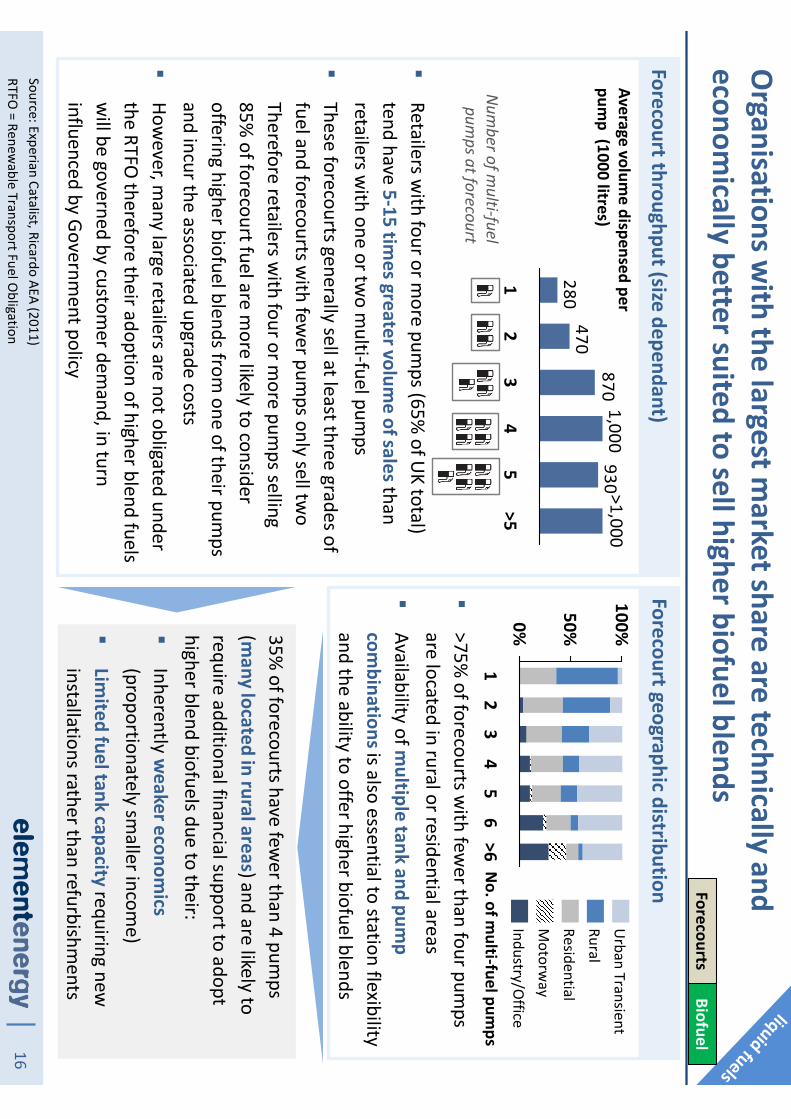
Organisations w
ith the largest market share are technically and
economically better suited to sell higher biofuel blends
Source: Experian Catalist, Ricardo AEA (2011)RTFO
= Renewable Transport Fuel O
bligation
Forecourt throughput (size dependant)Forecourt geographic distribution
�Retailers w
ith four or more pum
ps (65% of U
K total) tend have 5-15 tim
es greater volume of sales than
retailers with one or tw
o multi-fuel pum
ps�
These forecourts generally sell at least three grades of fuel and forecourts w
ith fewer pum
ps only sell two
Therefore retailers with four or m
ore pumps selling
85% of forecourt fuel are m
ore likely to consider offering higher biofuel blends from
one of their pumps
and incur the associated upgrade costs�
However, m
any large retailers are not obligated under the RTFO
therefore their adoption of higher blend fuels w
ill be governed by customer dem
and, in turn influenced by Governm
ent policy
�>75%
of forecourts with few
er than four pumps
are located in rural or residential areas�
Availability of multiple tank and pum
p com
binationsis also essential to station flexibility and the ability to offer higher biofuel blends
9301,000
870470
280
32
1>5
>1,000
54
Average volume dispensed per
pump (1000 litres)
Number of m
ulti-fuel pum
ps at forecourt
35% of forecourts have few
er than 4 pumps
(many located in rural areas) and are likely to
require additional financial support to adopt higher blend biofuels due to their:�
Inherently weaker econom
ics (proportionately sm
aller income)
�Lim
ited fuel tank capacity requiring new
installations rather than refurbishments
50%
100%0%>6
65
43
21
No. of m
ulti-fuel pumps
Industry/Office
ResidentialM
otorway
RuralU
rban Transient
ForecourtsBiofuel

17Source: Elem
ent Energy analysis for DfT (2012). 1See Appendix, 2Decision by forecourt operator to dedicate (at least) one tank to store a higher biofuel blend, and increm
entally upgrade with tim
e.
A) Install new storage and dispensing capacity
�N
ew capacity for higher blends increases the
overall forecourt capacity and therefore does not cannibalise any existing output
�How
ever, new tanks are costly and logistically
difficult to install on existing forecourts�
Estimated costs for installing new
capacity com
patible with higher blends of biofuels £90k-
110k/station (for E85 compatible tank and
dispenser)�
Installation of capacity compatible w
ith higher biofuel blends should be strategically tim
ed with
licensed decomm
issioning of old, regular fuel capacity
B) Modify and utilise existing capacity
�M
odifying existing capacity is considerably cheaper than installing new
capacity but requires partial displacement
of a profitable, high demand fuel
�N
ew equipm
ent will be required if existing diesel/petrol
capacity is to be utilised e.g. heating/insulation for biodiesel storage and vent/seal upgrades for bioethanol storage. This could be done as part of natural replacem
ent cycle, but this occurs only every 20-30 years�
Any change-of-use for pre-existing tanks to store E85 or B30 w
ill require dewatering, sludge rem
oval and disposal, filter replacem
ent and flushing of all suction linesw
ith an estimated cost of c. £30-40k/station
1
�Annual m
aintenance costs for inspection and cleaning are estim
ated to be c. £1-1.5k/year/station
�Both options have a cost prem
ium to the forecourt operator to enable the retail of less profitable fuel
�Industry stakeholder consultation (2013/14) show
ed that a single tank comm
itment 2(for forecourts of a particular
size) for gradually upgrading to higher blends was a barrier to adoption due to first m
over economic disadvantage
�Assurance for vehicle com
patibility with higher blends w
ould be needed before operators consider investment
Existing forecourts are compatible w
ith up to E10 only, selling higher blend biofuels (above E10 and B7) w
ould likely require new investm
entForecourts
Biofuel
18
Private depots generally only have one on-site tank, restricting supply to a single fuel and lim
iting multi-fuel higher blend trials
Drop-in fuel = biofuel blend indistinguishable from standard crude-derived fuel
Source: Ricardo AEA (2011), DfT(2014) “Petroleum
consumption by transport m
ode and fuel type”
Rail depots (demand: c. 0.6 m
illion tonnes/yr)
�Light m
aintenance and refuelling depots (c. 50 in the U
K) utilise a single pipe network
between dispensers and storage tanks (i.e.
single-fuel pumps)
�Higher blend biofuels require dedicated storage and dispensing facilities and have been lim
ited to trials in the UK
Airport depots (demand: c. 0.1 m
illion tonnes/yr)
�Airport depots store sm
all quantities of biodiesel up to B7 for airside ground vehicles and are believed to be capable of storing higher biofuel blends
�Appetite for higher blends exists but is restricted by concerns over vehicle com
patibility
HGV depots (demand: c. 8 m
illion tonnes/yr)
Coach/bus depots (demand: c. 1 m
illion tonnes/yr)
�Fragm
ented depot networks; estim
ated 2-3,000 private depots in the U
K storing biodiesel up to B7�
Majority of depots include single tanks only
(restricted to only one blend) but exceptions with
high demand have up to 3 tanks
�Require financial incentive, consistent supply and sustainable certification for fleets to begin considering feasibility
�HGVs travel across EU
so need consistent fuels �
More consistent depot netw
orks, with the
majority adopting return-to-base operation
with single tank sites
�To accom
modate higher biofuel blends
operators must either refurbish existing tank
and run buses on same higher blend of
biodiesel (c. £20k/depot) or install new
storage facilities (equivalent to c. £2.5k per bus served)
DepotsBiofuel

19
Despite an extensive infrastructure network, dem
and for LPG has fallen follow
ing the expiry of incentives for vehicle conversion
LPG transport dem
and relative to total UK supply
�Betw
een 2001-2006, LPG consumption for transport rose
due to attractive fuel duty incentives and a vehicle conversion grant schem
e�
The grant scheme expired in 2006 and the fuel duty
differential between LPG and other fuels has dim
inished�
In 2013, 90,000 tonnes of LPG (4% of total U
K LPG supply)w
as supplied to the transport sector, marking a 31%
decline in transport dem
and since 2006
SOU
RCE: DUKES “Petroleum
products: comm
odity balances” (3.2-3.4), DECC “Energy consumption in the U
K” (Chapter 2), industry input. FLT = Fork lift truck
LPG transport infrastructure in the U
K
�LPG is m
ost comm
only used by passenger cars, vans and forklift trucks (FLTs)
�O
ver 1,400 public selling points in the UK
currently have LPG dispensers �
In addition, over2,000 private depots include LPG refuelling facilities for FLTs –
an estimated
30% of FLTs in the U
K run on LPG�
The current LPG distribution supply chain is a com
mercial activity, requiring no support
LPG public forecourt: LPG
0 1 2 3 4
0.00
0.05
0.10
0.15
0.20
0.25
20132010
2001
LPG transport dem
and (Mt)
Total LPG supply (M
t)
20042007
-31%
Total LPG supply (left axis)LPG transport dem
and (right axis)
Note, DECC’s transport consum
ption figures do not account for all bunkered LPG for forklifts–
industry is working w
ith DECC to improve this dataset
20
Contents
−Introduction and context
−Background and status quo
−Future refueling infrastructure requirem
ents and barriers to deploym
ent
−The case of niche/future fuels
−Sum
mary roadm
ap and recomm
endations
−Appendix
21
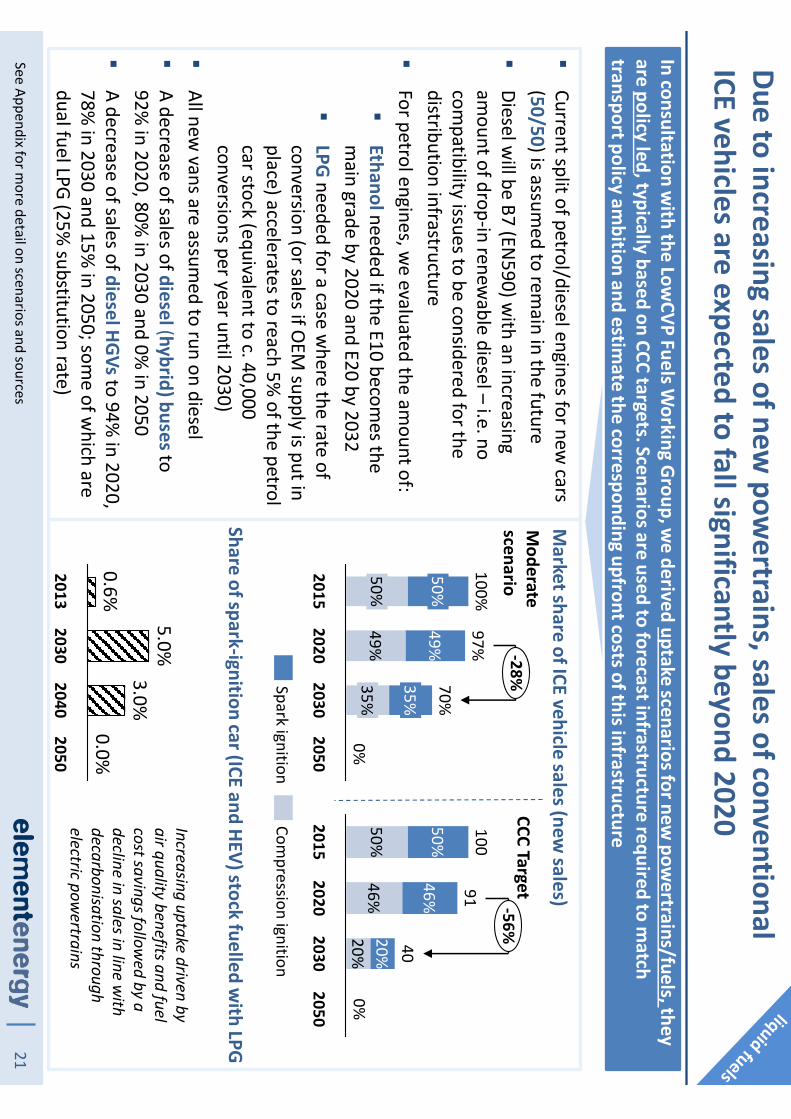
Due to increasing sales of new pow
ertrains, sales of conventional ICE vehicles are expected to fall significantly beyond 2020
�Current split of petrol/diesel engines for new
cars (50/50) is assum
ed to remain in the future
�Diesel w
ill be B7 (EN590) w
ith an increasing am
ount of drop-in renewable diesel –
i.e. no com
patibility issues to be considered for the distribution infrastructure
�For petrol engines, w
e evaluated the amount of:
�Ethanolneeded if the E10 becom
es the m
ain grade by 2020 and E20 by 2032�
LPGneeded for a case w
here the rate of conversion (or sales if O
EM supply is put in
place) accelerates to reach 5% of the petrol
car stock (equivalent to c. 40,000 conversions per year until 2030)
�All new
vans are assumed to run on diesel
�A decrease of sales of diesel(hybrid) buses to 92%
in 2020, 80% in 2030 and 0%
in 2050�
A decrease of sales of diesel HGVsto 94% in 2020,
78% in 2030 and 15%
in 2050; some of w
hich are dual fuel LPG (25%
substitution rate)
3.0%
0.0%
20302050
5.0%
2013
0.6%
2040
Share of spark-ignition car (ICE and HEV) stock fuelled with LPG
Market share of ICE vehicle sales (new
sales)
-28%
49%
97%
49%70%
35%
35%
2050
0%
2015
50%
20202030
50%
100%
20%
40
20152030
46%
100
50%
0%
91
20%46%
50%
20202050
-56%
Compression ignition
Spark ignition
Moderate
scenarioCCC Target
Increasing uptake driven by air quality benefits and fuel cost savings follow
ed by a decline in sales in line w
ith decarbonisation through electric pow
ertrains
In consultation with the Low
CVP Fuels Working G
roup, we derived uptake scenarios for new
powertrains/fuels, they
are policy led, typically based on CCC targets. Scenarios are used to forecast infrastructure required to match
transport policy ambition and estim
ate the corresponding upfront costs of this infrastructure
See Appendix for more detail on scenarios and sources

22
Under ‘CCC Target’ uptake
scenario
Demand for petrol &
diesel for road transport will significantly
decrease beyond 2020 while use of LPG could increase
99
86
1416
1512
9
1210
9
7
4
33
30 5 10 15 20 25 30 35
2015
35
2040
25
2030
31
2020
35-81%
-53%
2050
71
2050
16
Diesel -heavy vehiclesDiesel -light vehiclesPetrol
Source: EE fleet model, based on uptake scenarios presented on page 21
Fuel demand
Million tonnes/year
LPG case
�Total LPG dem
and for transport could increase to c. 360 ktpa under an am
bitious LPG conversion/vehicles uptake program
�Depending on the level of uptake of alternative fuel vehicles, the dem
and for petrol and diesel will decrease by 50 to 80%
between
now and 2050
147146
280130
8084
98
300
2,500
200
400
1000
2020
1482
2015
98
Total current supply
2,500
2050
80
2040
277
2030
364
Total UK supply
LPG -heavy vehiclesLPG -light vehicles
N.B. LPG dem
and could continue if bio-LPG is available at scale
Fuel demand
Thousand tonnes/year
23
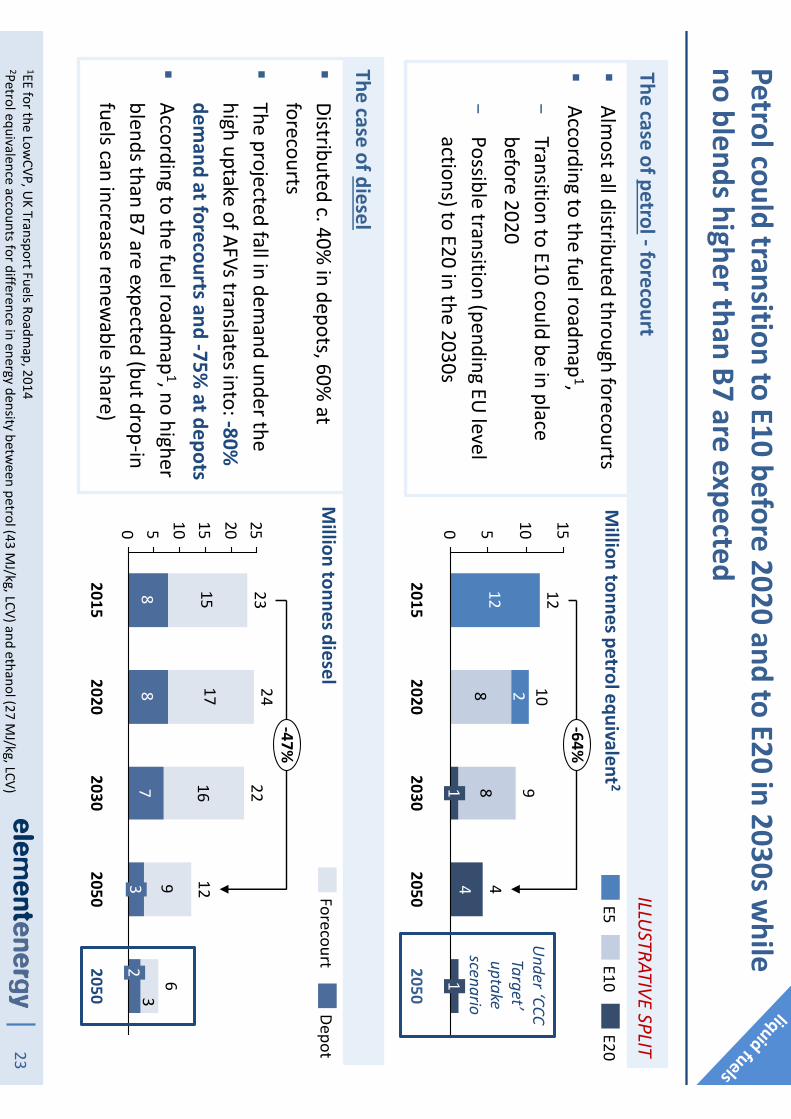
Petrol could transition to E10 before 2020 and to E20 in 2030s while
no blends higher than B7 are expected
48
8 212
0 5 10 15
2050
1
2050
4
-64%
2030
91
2020
10
2015
12
E5E20
E10
The case of petrol-forecourt
�Alm
ost all distributed through forecourts�
According to the fuel roadmap
1, −
Transition to E10 could be in place before 2020
−Possible transition (pending EU
level actions) to E20 in the 2030s
1EE for the LowCVP, U
K Transport Fuels Roadmap, 2014
2Petrol equivalence accounts for difference in energy density between petrol (43 M
J/kg, LCV) and ethanol (27 MJ/kg, LCV)
The case of diesel
�Distributed c. 40%
in depots, 60% at
forecourts�
The projected fall in demand under the
high uptake of AFVs translates into: -80%
demand at forecourts and -75%
at depots�
According to the fuel roadmap
1, no higher blends than B7 are expected (but drop-in fuels can increase renew
able share)
Million tonnes petrol equivalent 2
ILLUSTRATIVE SPLIT
88
7
1517
16
93
0 5 10 15 20 25
-47%
2050
24
2020
22
2030
23
2015
3 12
2050
2
6
DepotForecourt
Under ‘CCC Target’ uptake
scenario
Million tonnes diesel

24
The declining fuel demand at forecourts (m
ostly for light vehicles) is likely to result in further forecourt closures
20202030
2050Total fuel dem
and (M
t/year)
Forecourts
88
4
2
2030
1
13
320502020
169
171
2050
2527
4
E20E5
DieselE10
‘CCC Target’ uptake
scenario
Demand
mostly from
PHEVs/RE-EVs
�M
echanisms to support sm
all forecourts in remote areas w
ill be needed as existing supermarket forecourt
coverage is geographically insufficient to supply all UK dem
and. Under a scenario of extrem
e demand reduction,
the comm
ercial case for urban sites may becom
e challenging if replacement revenue stream
s cannot be found
�Securing planning approval for forecourt upgrades can often be difficult due to environm
ental concerns and unfam
iliarity with new
fuels (e.g. tank upgrade or new tank for high blends)
�Delays in approval process could accelerate forecourt closures
�Infrastructure adjustm
ents to cope with declining dem
and will be m
arket driven
�Associated safety risks of m
ultiple fuel coexistence at a single forecourt need to be better understood
�British standards for new
biofuels can be adopted through EU fram
eworks to ensure technical com
patibility
�Drivers should be inform
ed of fuel availability via a comm
unication system as fuel choice becom
e more diverse
�Im
pact of reduced demand on the continued decline in dom
estic refinery production is being addressed by DECC’s M
id Stream O
il Task Force
Expected issues in the short, medium
and long-term
Source: EE fleet model, based on uptake scenarios presented in Chapter 1 (Introduction and context)

25
Tanker distribution is well suited to delivering higher blend biofuels but
incentivising infrastructure operators to invest will be m
ore difficult
BarrierDescription
Example solution
Costs for installing new
station capacity
Civilworks and installation
of new
equipmentcan cost up to c.£100k per
station
Storage tanks, dispensers and pipework are
fully comm
ercial technologieswith little
opportunity for significant cost reduction
Costsfor upgrading existing station capacity
Refurbishment of existing
equipment can
cost up to c.£10k/stationDedicated financial support?
Lack of confidencefor
vehicle compatibility
with higher blends
Operators w
ill not invest in higher blendinfrastructure unless national vehicle com
patibilityis understood/in place
Infrastructure operators requireclear
dialogue from vehicle suppliers
Lack of confidence inlong term
viability
Uncertainty of biofuels policy and grow
ing com
petition from alternative fuels creates
strong demand risk for investors
Long term visibility ofdates for m
inimum
biofuel blends at forecourts?
First mover com
mercial
disadvantage for adopting higher blends
Forecourt upgrades are needed for E20; investm
ent necessitates displacement of
regular, more profitable fuel sales
Single tank comm
itment legislation
Comm
ercialnon-viability of sm
all throughput forecourts
Small/independent retailers are already
under strain and this affects rural areas m
ore; investmentto transition to E10/E20
might not be viable w
ithout support
Dedicatedstrategy to m
aintain forecourts in som
e areas (likely rural areas in short term
but more w
idespread issue over time)
Limited rail pathw
ay capacity
Fueldelivery by rail is being increasingly displaced by com
peting services for rail pathw
ays from e.g. passenger trains
Dedicated railpathway (capacity) for
transport fuel distribution
Forecourts
Source: Ricardo AEA (2011), Element Energy analysis
E10/E20

26
Although blends higher than B7 are not expected at forecourts, private depots can adopt higher blends
20202030
2050
Estimate of dem
and based on share of buses, trucks and vans refuelling through bunkered supply at depot –does not include the dem
and from
Non Road M
obile Machinery 1Based on the Low
CVP EE Fuel Roadmap and AutoCouncilEnergy roadm
ap
Depots
23
78
2050(CCC
target scenario)2050
(moderate
scenario)2030
2020
Diesel
�Depot fleets are increasingly utilising public forecourt facilities w
ith fuel cards instead of depot facilities
�This shift in operation is driven by the elim
ination of many, often cum
bersome, responsibilities associated
with the m
anagement of bunkered fuel at depots (e.g. m
itigation of leakages to avoid environmental dam
age, theft prevention, general m
aintenance)
�Dem
and from fleets through fuel cards effectively m
aintain many trunk road forecourts by providing a ‘base
load’ and associated spending (e.g. at the kiosk). A further move aw
ay from depot refuelling to fuel cards
could support forecourts, however, this benefit is likely to be outw
eighed by the overall decrease in fleet fuel dem
and
�W
hile blends higher than B7 are not expected at forecourts 1, captive fleets might choose to adopt higher
blends which can be delivered to depots by road tanker, e.g. C.120 buses are already running on B20 in
London
Total fuel dem
and (M
t/year)
Expected issues in the short, medium
and long-term
‘CCC Target’ uptake
scenario

27
Under an am
bitious conversion program for cars/vans, the LPG public
network w
ould have to increase significantly
Estimate of dem
and does not include the demand from
Non Road M
achinery. Source: EE for UKPLG (2013) 1-Driven for
example by incentives recognising its air quality benefits 2-see w
ww
.uklpg.org/shop/codes-of-practice/
Netw
ork to support increased demand
147146
280130
8084
980
100
200
300
400
20402050
80
277
98
2
2020
148
364
20302015
Heavy vehiclesLight vehicles
Thousand tonnes/year
1,800
3,000
2,0001,400
0
1,000
2,000
3,000
20152040
20202030
Assuming an increased in average throughput through m
ore frequent deliveries
LPG demand projection as per described in slide 19.
Assumes heavy vehicles w
ould refuel at depot
�U
nder the LPG uptake scenario1, dem
and for LPG at public forecourt could increase to c. 280 ktby 2030, from
under 100kt today
�To deliver this dem
and, the network of public LPG
selling points would need to increase from
1,400 to c. 3,000. These m
ight be mainly non-forecourt
installations as they are cheaper and quicker to com
mission (Code of Practices in place
2but fewer
restrictions than a forecourt integrated dispenser)
�N
ew investm
ent to deploy new LPG selling points
will be entirely m
arket driven but will also require
comm
itment signal from
UK governm
ent for use of LPG in transport
�Biopropane is expected to enter the U
K market in
the short term how
ever, as a renewable ‘drop-in’
fuel for conventional LPG, it w
ill not require any infrastructure upgrade
�Trucks and N
on Road Mobile M
achineries (forklifts, refrigeration units, etc.) refuel in depots –
there are no particular infrastructure challenges for a transition to/increase use of bunkered LPG
LPG
Corresponding public LPG selling points
Forecasted LPG transport fuel demand

28Assum
ptions: upgrade cost = £35k/site, capacity cost £100k/site (Source: Element Energy for DfT, 2012), 65%
of existing forecourts have 3+ pum
ps and separate storage tanks, remainder have <3 pum
ps and storage tanks.
All forecourts in 2015
£497m
50% of 2015
active forecourts75%
of 2015 active forecourts
£249m£373m
Upgrades / refurbishm
entsN
ew capacity installations
Approximate level of infrastructure investm
ent required for a transition for all public forecourts to adopt a single tank com
mitm
ent for a higher blend biofuel (e.g. E20)
Approximately £500 m
illion would be required to adapt the current U
K public forecourt netw
ork to be compatible w
ith higher biofuel blends
Total number of
public forecourts:
Assumes sam
e market share of
pumps per forecourt follow
ing 25%
and 50% closures
Scenario where all
forecourt petrol dem
and is met w
ith E20 by 2050
29
Contents
−Introduction and context
−Background and status quo
−Future refueling infrastructure requirem
ents and barriers to deploym
ent
−The case of niche/future fuels
−Sum
mary roadm
ap and recomm
endations
−Appendix
30
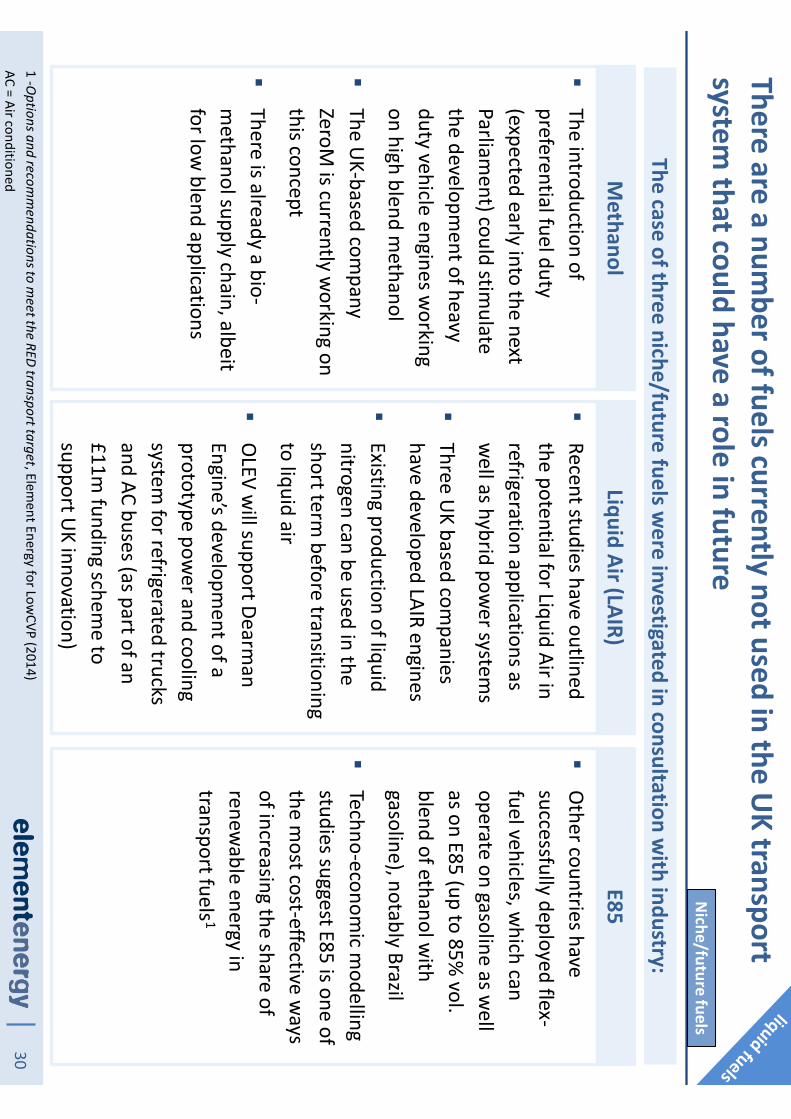
There are a number of fuels currently not used in the U
K transport system
that could have a role in future
1 -Options and recom
mendations to m
eet the RED transport target, Element Energy for Low
CVP (2014)AC = Air conditioned M
ethanol
�The introduction of preferential fuel duty (expected early into the next Parliam
ent) could stimulate
the development of heavy
duty vehicle engines working
on high blend methanol
�The U
K-based company
ZeroMis currently w
orking on this concept
�There is already a bio-m
ethanol supply chain, albeit for low
blend applications
Liquid Air (LAIR)
�Recent studies have outlined the potential for Liquid Air in refrigeration applications as w
ell as hybrid power system
s
�Three U
K based companies
have developed LAIR engines
�Existing production of liquid nitrogen can be used in the short term
before transitioning to liquid air
�O
LEV will support Dearm
anEngine’s developm
ent of a prototype pow
er and cooling system
for refrigerated trucks and AC buses (as part of an £11m
funding scheme to
support UK innovation)
E85
�O
ther countries have successfully deployed flex-fuel vehicles, w
hich can operate on gasoline as w
ell as on E85 (up to 85%
vol. blend of ethanol w
ith gasoline), notably Brazil
�Techno-econom
ic modelling
studies suggest E85 is one of the m
ost cost-effective ways
of increasing the share of renew
able energy in transport fuels 1
The case of three niche/future fuels were investigated in consultation w
ith industry:
Niche/future fuels
311Production of Bio-m
ethanol, Technology Brief (2013)Source: Energy Carriers for Pow
ertrains, ERTRAC 2014, Euro Care (2015)
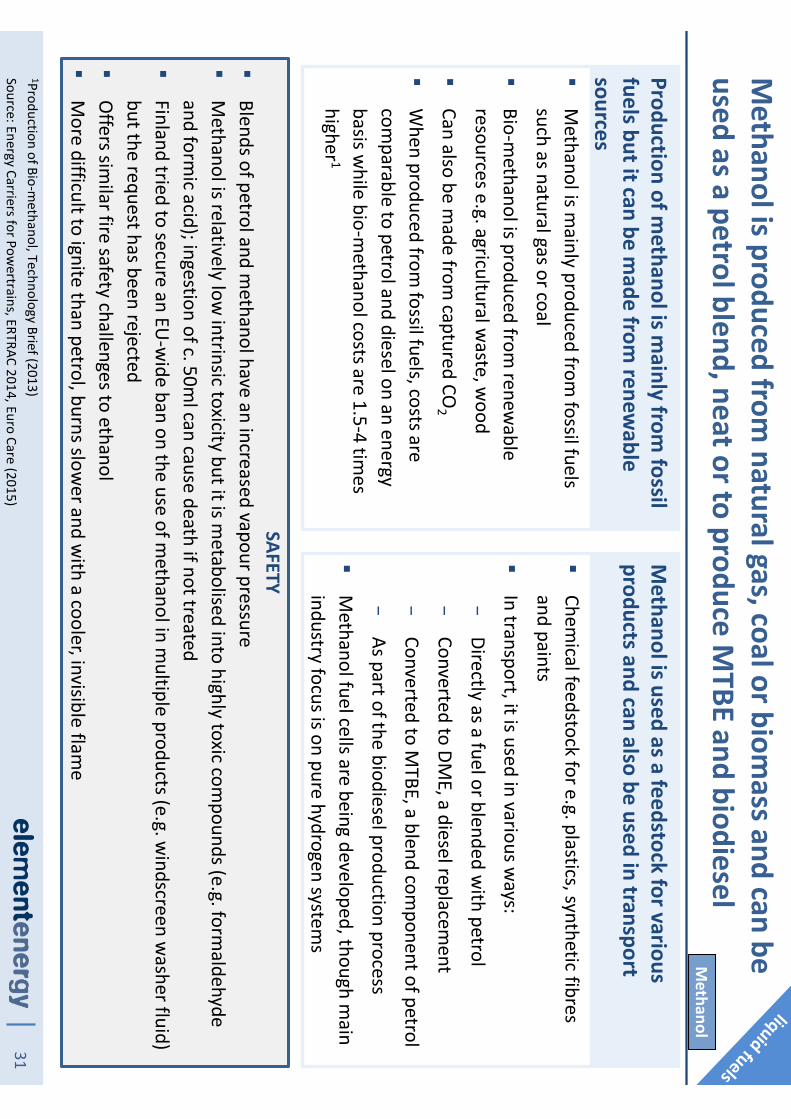
Production of methanol is m
ainly from fossil
fuels but it can be made from
renewable
sources�
Methanol is m
ainly produced from fossil fuels
such as natural gas or coal
�Bio-m
ethanol is produced from renew
able resources e.g. agricultural w
aste, wood
�Can also be m
ade from captured CO
2
�W
hen produced from fossil fuels, costs are
comparable to petrol and diesel on an energy
basis while bio-m
ethanol costs are 1.5-4 times
higher 1
Methanol is used as a feedstock for various
products and can also be used in transport
�Chem
ical feedstock for e.g. plastics, synthetic fibres and paints
�In transport, it is used in various w
ays:
−Directly as a fuel or blended w
ith petrol
−Converted to DM
E, a diesel replacement
−Converted to M
TBE, a blend component of petrol
−As part of the biodiesel production process
�M
ethanol fuel cells are being developed, though main
industry focus is on pure hydrogen systems
SAFETY�
Blends of petrol and methanol have an increased vapour pressure
�M
ethanol is relatively low intrinsic toxicity but it is m
etabolised into highly toxic compounds (e.g. form
aldehyde and form
ic acid); ingestion of c. 50ml can cause death if not treated
�Finland tried to secure an EU
-wide ban on the use of m
ethanol in multiple products (e.g. w
indscreen washer fluid)
but the request has been rejected�
Offers sim
ilar fire safety challenges to ethanol�
More difficult to ignite than petrol, burns slow
er and with a cooler, invisible flam
e
Methanol
Methanol is produced from
natural gas, coal or biomass and can be
used as a petrol blend, neat or to produce MTBE and biodiesel
32
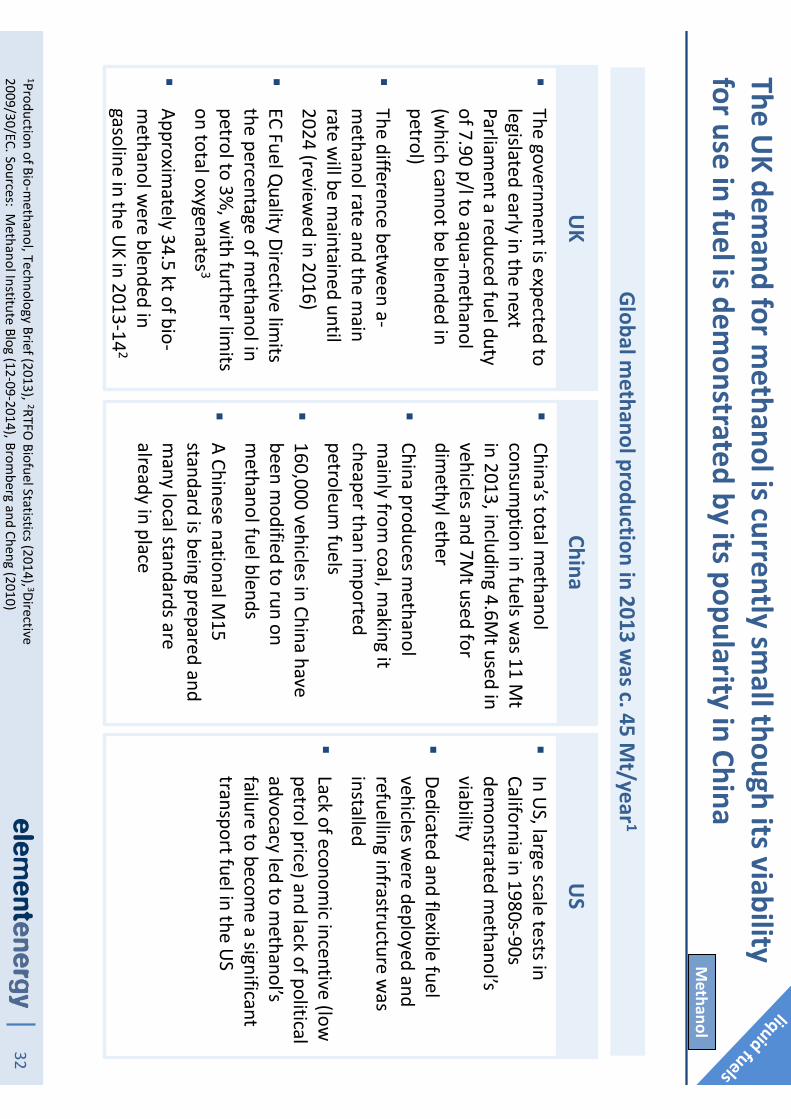
The UK dem
and for methanol is currently sm
all though its viability for use in fuel is dem
onstrated by its popularity in China
1Production of Bio-methanol, Technology Brief (2013), 2RTFO
Biofuel Statistics (2014), 3Directive 2009/30/EC. Sources: M
ethanol Institute Blog (12-09-2014), Bromberg and Cheng (2010)
UK
�The governm
ent is expected to legislated early in the next Parliam
ent a reduced fuel duty of 7.90 p/l to aqua-m
ethanol (w
hich cannot be blended in petrol)
�The difference betw
een a-m
ethanol rate and the main
rate will be m
aintained until 2024 (review
ed in 2016)
�EC Fuel Q
uality Directive limits
the percentage of methanol in
petrol to 3%, w
ith further limits
on total oxygenates 3
�Approxim
ately 34.5 ktof bio-m
ethanol were blended in
gasoline in the UK in 2013-14
2
China�
China’s total methanol
consumption in fuels w
as 11 Mt
in 2013, including 4.6Mt used in
vehicles and 7Mt used for
dimethyl ether
�China produces m
ethanol m
ainly from coal, m
aking it cheaper than im
ported petroleum
fuels
�160,000 vehicles in China have been m
odified to run on m
ethanol fuel blends
�A Chinese national M
15 standard is being prepared and m
any local standards are already in place
US
�In U
S, large scale tests in California in 1980s-90s dem
onstrated methanol’s
viability
�Dedicated and flexible fuel vehicles w
ere deployed and refuelling infrastructure w
as installed
�Lack of econom
ic incentive (low
petrol price) and lack of political advocacy led to m
ethanol’s failure to becom
e a significant transport fuel in the U
S
Global methanol production in 2013 w
as c. 45 Mt/year 1
Methanol

33
�M
ethanol is corrosive to many m
aterials but is com
patible with stainless steel, carbon steel and
methanol-com
patible fiberglass
�For storage at retail service stations, new
underground tank storage m
ay be necessary
�Existing tanks can be converted by thorough cleaning and, w
here necessary the use of a m
ethanol-compatible liner
�Pum
ps and piping used to move m
ethanol from
the storage tank to the dispenser must be m
ade of m
ethanol-compatible m
aterials
�Dispensers used for petroleum
fuels typically include elem
ents that are methanol incom
patible (alum
inium, brass, elastom
ers) so specially developed dispensers m
ust be used to avoid leaks
�Conventional nozzles designed for m
ethanol are available, as is a spill-free nozzle developed by the M
ethanol Fuel Cell Alliance
Transportation of methanol w
ould be mainly by truck and adaptation
of refuelling infrastructure would require investm
ent
Source: Use of M
ethanol as a Transportation Fuel, The Methanol Institute, 2007
1Methanol energy content = 20 M
J/kg (lower calorific value), Total HGV energy dem
and in 2050 = 264 PJ
Transportation�
Methanol typically shipped by railw
ay tank car, barge and truck tanker
�In the U
S some is sent by pipeline (over very short
distances)
�There are difficulties w
ith using pipelines usually used for other petroleum
products for shipping m
ethanol
−Degradation by m
ingling with other products
−M
ethanol will rem
ove water/residues in the
pipeline
−Pipelines can be converted by cleaning, though there m
ay be material com
patibility issues
�Assum
ing 5% of total HGV energy dem
and by 2050, 0.6 m
illion tonnes of methanol could be consum
ed in the U
K1
Forecourt storage and distribution
Methanol

34
Liquid air engine technology could offer significant benefits, particularly in refrigeration of trucks and trailers
1Dearman Engine Com
pany. TRU: Transport Refrigeration U
nit Source: Liquid Air on the Highw
ay, Liquid Air Energy Netw
ork, 2014
Various liquid air engine technologies have been proposed, of which the Dearm
anengine is the m
ost mature
�The Dearm
anengine uses the rapid expansion of liquid air as it com
es in contact with a w
arm heat
exchange fluid to power a piston engine
�This can be used in three configurations:
�O
ther engines using liquid air have been proposed including the Ricardo split cycle liquid nitrogen engine and the EpiQ
airrotary liquid air engine
Refrigeration�
Refrigeration in vans and small trucks is provided by the m
ain ICE, while for m
ost larger trucks and trailers it is provided by an auxiliary ICE
�M
ost refrigerated trucks and trailers use red diesel auxiliary engines, whose em
issions are currently unregulated and untreated, and can account for over 80%
of NO
x and PM em
issions despite accounting for only 20%
of the overall fuel consumption
�U
sing liquid nitrogen (N2(l) ) evaporation for refrigeration is being trialled in 6 vehicles in the U
K (1000 w
orldwide), though this requires ancillary pow
er from the m
ain engine, increasing its diesel consumption
�The use of a Dearm
anliquid air engine w
ould offer improved efficiency over N
2(l) evaporation as it would
produce both cooling and shaft power
�A prototype is currently in testing and sm
all series production is due to begin in 20161
On its ow
n, drawing heat from
the environm
ent (suitable for short range, low
power requirem
ent vehicles such as fork-lift trucks)
As a heat hybrid, using excess heat from
an ICE (suitable for buses, coaches, lorries, urban delivery vehicles)
For refrigeration in a ‘power and
cooling’ configuration (TRU for
vans, lorries, trailers, shipping containers)
Liquid air

35
Large volumes of spare liquid nitrogen production capacity exist in
the UK, w
ithin delivery distance of all major cities
Source: Liquid Air on the Highway, Liquid Air Energy N
etwork (2014), DECC press release “£8 m
illion boost for energy storage innovation” (13/02/2014)
Liquid air is not currently producedin the U
K (liquid nitrogen will be used)
�Liquid air is not yet produced com
mercially, but liquid nitrogen (LIN
) is w
idely produced and can be used for similar applications
�LIN
is produced at c. 10 Air Separation Units (ASU
s) in the UK via an
energy intensive process, generally run during off peak electricity hours�
According to the Liquid Air Energy Netw
ork report, using these facilities during the day could provide 2,200 tonnes of LIN
per day�
Major industrial users are supplied by pipeline w
hile other customers
are supplied by road tanker –m
ost large cities are within the
distribution range of one or more LIN
production sites�
LINis still routinely delivered to areas outside those covered on this
map, but costs m
ay be higher�
An operator would need to rent a cryogenic tank and pum
p in order to store and dispense LIN
Current UK locations w
ith spare LIN production
capacity with indicative delivery radius (c.350km
)
Liquid air
�DECC w
ill support a project to demonstrate a 5M
W/15M
Wh Liquid Air
Energy Storage (LAES) system, due to start operation in 2015 in
Manchester (led by Highview
Power and Viridor)
�Highview
have successfully piloted their energy storage concept at a 350kW
/2.5MW
h plant with SSE since 2010
�This new
project will assess the potential for liquid air technology to
address grid-scale energy storage needs and support the integration of interm
ittent renewable generation
36
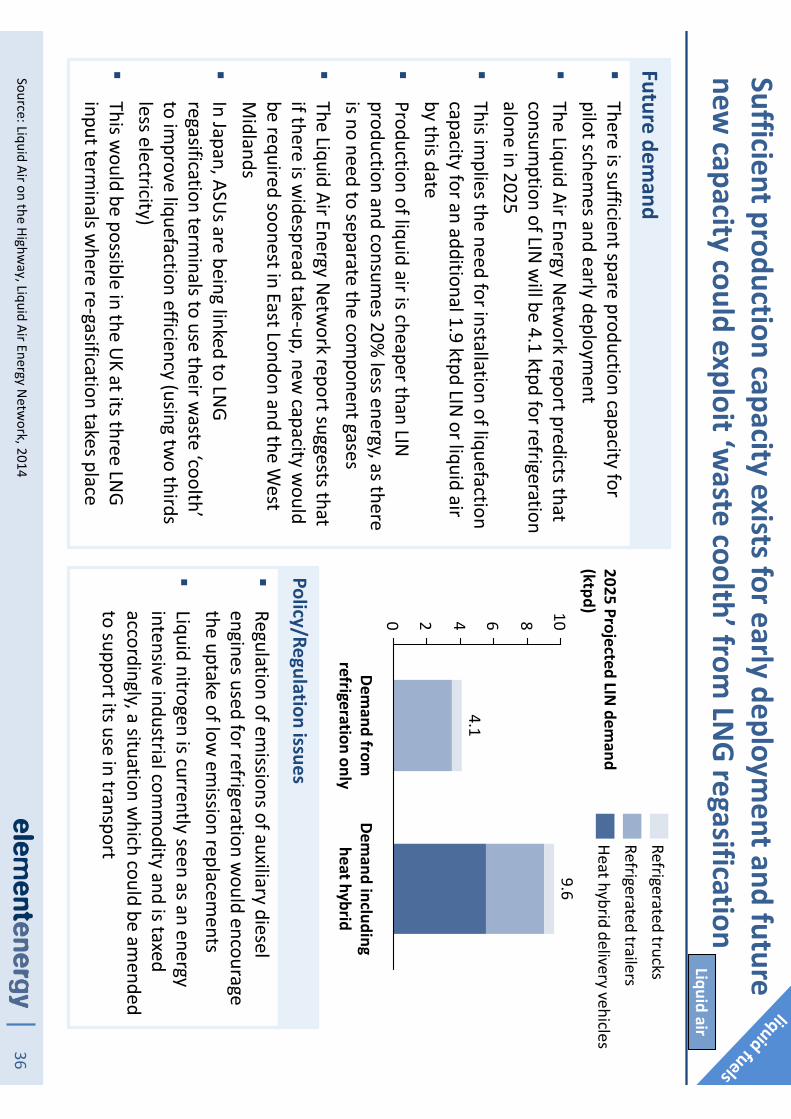
Sufficient production capacity exists for early deployment and future
new capacity could exploit ‘w
aste coolth’ from LN
G regasification
Source: Liquid Air on the Highway, Liquid Air Energy N
etwork, 2014
Policy/Regulation issues
�There is sufficient spare production capacity for pilot schem
es and early deployment
�The Liquid Air Energy N
etwork report predicts that
consumption of LIN
will be 4.1 ktpd
for refrigeration alone in 2025
�This im
plies the need for installation of liquefaction capacity for an additional 1.9 ktpd
LIN or liquid air
by this date�
Production of liquid air is cheaper than LIN
production and consumes 20%
less energy, as there is no need to separate the com
ponent gases�
The Liquid Air Energy Netw
ork report suggests that if there is w
idespread take-up, new capacity w
ould be required soonest in East London and the W
est M
idlands�
In Japan, ASUs are being linked to LN
G regasification term
inals to use their waste ‘coolth’
to improve liquefaction efficiency (using tw
o thirds less electricity)
�This w
ould be possible in the UK at its three LN
G input term
inals where re-gasification takes place
�Regulation of em
issions of auxiliary diesel engines used for refrigeration w
ould encourage the uptake of low
emission replacem
ents�
Liquid nitrogen is currently seen as an energy intensive industrial com
modity and is taxed
accordingly, a situation which could be am
ended to support its use in transport
Future demand
0 2 4 6 8 10
4.1
Demand including
heat hybrid
9.6
Demand from
refrigeration only
Heat hybrid delivery vehicles
Refrigerated trucksRefrigerated trailers
2025 Projected LIN dem
and (ktpd)
Liquid air

37
Contents
−Introduction and context
−Background and status quo
−Future refueling infrastructure requirem
ents and barriers to deploym
ent
−The case of niche/future fuels
−Sum
mary roadm
ap and recomm
endations
−Appendix

38
Infrastructure growth
entirely market driven
Operators trial niche fuel w
ith sm
all numbers of fleet vehicles
Key findings from trials inform
future operator investm
ent
With a predicted dem
and decrease for liquid fuels, forecourts may
have to integrate new fuels and/or receive support in certain locations
Continued slow rate of closures from
c.8,600 stations
Increased coexistence of multi-fuel
infrastructure to maxim
ise utilisation
Public forecourts
Growing proportion of bunkered dem
and w
ill shift to utilise forecourts with fuel cards
Private depots
20152050
20202030
2025
Support measures for som
e areas might be needed to m
aintain network
c. £250m-£600m
investment required for
upgrades and capacity installations
Trial integration of multiple
fuel infrastructures
Dashed lines represent high uncertainty
Major m
ilestone /enabler
c. 2,000c.1,400
c. 3,000
Niche fuels
Diesel
Integration
E20 forecourt investm
ent
Coverage
Potential transition to E20 would
require upgrades to existing forecourts
Dependent on feasibility of m
ulti-fuel integration and/or specific support
mechanism
s
Public selling points
LPG
Depot infrastructure fully comm
ercial –grow
th to follow dem
and
Cars
Vans
HDVs Thousand vehicles
Projections are based on policy-led uptake scenarios presented on page 21
Uptake scenarios inform
ed quantification of infrastructure requirem
ents
Liquid fuel vehicle stock
6,000-31,0001,000-5,000
360
32,000
4,300
700
32,000
4,300
700
30,000
4,000
700
By 2050 cars are mostly RE-EVs / PHEVs
50-80%
decrease in fuel
demand on
2015 levels
Infrastructure roadmap
20502020
20302025
c.2,000

39
Delays to planning to modify forecourts should be m
inimised to avoid
investor uncertainty and financial support may be needed in certain areas
Station economics and support
1�Steep decline in dem
and beyond 2030 is likely to significantly im
pact com
mercial viability of fuel retailing
(particularly for small public
forecourts located in rural areas of the U
K to start with, but m
ore w
idespread issue in long term)
�A transition to a higher biofuel blend w
ill require large investments
for tank replacements and/or
upgrades
Recomm
endationsCentral G
overnment: Consider
mechanism
s to ensure minim
um filling
station coverage, particularly in rural areas
Local Authorities: Identify any local supply shortages and forecourts m
ost affected by declining fuel dem
and
Planning permission guidance
2�Acquiring planning perm
ission to upgrade existing forecourt facilities can often be delayed or rejected
�Delays for upgrade approval can cause partial unavailability and negatively im
pact comm
ercial operation, thereby directly accelerating forecourt closure, particularly for underutilised areas
Recomm
endationsCentral G
ov. and LAs: Work w
ith regulators to identify com
mon causes
of delays and improve planning
permission guidelines as appropriate
Innovation opportunities3�
Biodiesel and bioethanol require additional handling considerations
�Higher bioethanol blends can dam
age regular refuelling facilities by causing stress corrosion cracking of steel and degradation of elastom
ers, therefore significant investm
ent will be
required to upgrade existing infrastructure
Recomm
endationsR&
D bodies: Investigate cost reduction opportunities for station upgrades to handle higher biofuel blends
Source: Element Energy

40
As declining liquid fuel demand causes station closures, facilitating
optimal use of rem
aining forecourts is likely to be required
Multi-fuel infrastructure integration
4�The transport system
is expected to be decarbonised through m
ultiple alternative fuels / energy vectors
�Existing forecourts are strategically sited to optim
ally service driver needs by m
ajor roads and junctions
�Co-locating infrastructure for m
ultiple fuels at forecourts could ensure utilisation is m
aintained
Recomm
endationsRegulators: Develop standards for co-locating m
ultiple infrastructures and w
ork with central governm
ent to develop planning guidance for Local Authorities
R&D bodies: Identify technical barriers to co-locating
multiple infrastructures (e.g. high pow
er rapid charge points adjacent to liquid fuels)
Industry and gov.:Liaise with APEA to update Blue Book
1
accordingly
Comm
unication of forecourt availability 5�
As forecourt closures continue (and new
blends are introduced), there will be an
increasing need to ensure drivers can easily access inform
ation detailing station & blend
availability and location
�Com
munication system
s to inform drivers of
real-time fuel availability at nearby public
forecourts supported by a national database could be developed
�Central coordination of softw
are developm
ent will ensure a consistent
interface between drivers and public
infrastructuree.g. allow
ing use with existing
navigation system providers
Recomm
endations
Industry: Develop comm
unication system
+
1National Guidance docum
ent jointly published by the Energy Institute and Association for Petroleum and
Explosives (APEA) used to assess and sign off the safety of new forecourt installations and upgrades

41Source: Elem
ent Energy and industry input
Methanol
�Consulted industry stakeholders are doubtful of the potential of m
ethanol in the UK, on the basis of
safety concernsand need for new
HGVs engine developm
ent (HGVs are target vehicles for m
ethanol in the U
K)
�Furtherm
ore, the air quality benefits and CO
2 benefits are not unclear
�If used for U
K transport, high blend m
ethanol will likely be bunkered
(not at forecourts)
�U
K would need to develop codes of
practise for storage and handlingof
methanol as w
ell as planning guidance; input from
industry players and countries fam
iliar with
methanol w
ill be valuable
Liquid Air (LAIR)�
Existing liquid nitrogen (LIN) production
will be used first, before dedicated
liquid air production is started
�LIN
/LAIR will be used m
ostly for cooling and/or for hybrid applications, as opposed to becom
ing a prime m
over
�It is expected LAIR w
ill be used exclusively by fleets w
ith depot refuelling
�Specialist skilled w
orkers will be
neededfor liquid air distribution (e.g.
cryogenic engineers and technicians )
�Skill-set overlap w
ith other sectors must
be investigated and consistent training program
mes developed as required
�Production of LIN
/ LAIR require electricity but the energy vector can also be used as a form
of energy storage
E85�
Consulted industry stakeholders are doubtful of the potential of E85, on the basis of the lack of vehicle supply, barriers to adoption of new
grade at inland term
inals and forecourtsand
low energy content(adding
issue to consumer
acceptance and fuel duty issue if price parity w
ith E5/E10 (per km
) must be
supported)
�Adoption of E85 could not be possible if E20 is adopted (lim
it to number of grades)
�Distribution w
ould be as for E10: blended at inland term
inals and transported by trucks to forecourts
Liquid air has the highest potential and developing a distribution infrastructure for transport m
ight require investment in U
K skills
42
Contents
−Introduction and context
−Background and status quo
−Future refueling infrastructure requirem
ents and barriers to deploym
ent
−The case of niche/future fuels
−Sum
mary roadm
ap and recomm
endations
−Appendix

43
References
−AEA for DfT, M
odes 3 study, 2011
−BP Statistical Energy Review, 2014
−Brom
berg and Cheng, Methanol as an alternative transportation fuel in the U
S, 2010
−Dearm
an Engine Company w
ebsite, 2015
−DECC, Energy consum
ption in the UK, 2014
−DfT, Road lengths in Great Britain, 2013
−DfT, RTFO
Biofuel Statistics, 2014
−DU
KES Chapter 3/4/5, 2015
−Ecofys, U
K Biofuel Industry overview, 2013
−Elem
ent Energy for Birmingham
City Council, A City Blue Print for Low Carbon Fuel Refuelling Infrastructure, 2015
−Elem
ent Energy for DfT, Ultra low
emission van study, 2012
−Elem
ent Energy for LowCVP, Scenarios for the im
plementation of the transport elem
ent of the RED to 2020, 2013
−Elem
ent Energy, Options and recom
mendations to m
eet the RED transport target, 2014
−ERTRAC, Energy Carriers for Pow
ertrains, 2014
−ETI, An affordable transition to sustainable and secure energy for light vehicles in the U
K, 2013
−European Parliam
ent and Council, Directive 2009/30/EC, 2009
−IEA-ETSAP and IREN
A, Production of Bio-methanol, Technology Brief, 2013
−JRC, W
TT analysis of future automotive fuels and pow
ertrains in the European context, 2014
−Liquid Air Energy N
etwork, Liquid Air on the Highw
ay, 2014
−M
ethanol Institute Blog, 2014
−Ricardo AEA, Assessm
ent of the existing UK infrastructure capacity and vehicle fleet capability for the use of biofuels, 2011
−U
KPIA, Statistical Review, 2014

44
Acronyms
AFVAlternative Fuel Vehicle
ASUAir Separation U
nitBtL
Biomass-to-Liquids
CCCCom
mittee on Clim
ate ChangeCHP
Combined Heat and Pow
erCO
MAH
Control of Major Accident Hazard
DECCDepartm
ent of Energy & Clim
ate ChangeDfT
Department for Transport
DUKES
Digest of United Kingdom
Energy StatisticsEC
European Comm
issionEE
Element Energy
ETBEEthyl Tertiary Butyl Ether
ETIEnergy Technologies Institute
EUEuropean U
nionFAM
EFatty Acid M
ethyl EstersFLT
Fork Lift TruckHGV
Heavy Goods VehicleHSE
Health and Safety ExecutiveICE
Internal Combustion Engine
LCN
Low Carbon N
etwork
LINLiquid N
itrogenLPG
Liquefied Petroleum Gas
MTBE
Methyl tert-butyl ether
Mt
Million tonnes
NG
National Grid
OEM
Original Equipm
ent Manufacturer
OLEV
Office for Low
Emission Vehicles
PMParticulate M
atterR&
DResearch and Developm
ent RED
Renewable Energy Directive
RTFORenew
able Transport Fuel Obligation
TEN-T
Trans-European Transport Netw
orksTRU
Transport Refrigeration Unit
TSBTechnology Strategy Board
TTWTank-to-W
heelU
COU
sed Cooking Oil
ULEV
Ultra-Low
Emissions Vehicle
WTT
Well-to-Tank
WTW
Well-to-W
heel

45
Total UK vehicle stock (m
illion vehicles)�
Future vehicle projections use figures provided by DfT:
−Cars stock to increase from
c. 30 m
illion to 39 million and c. 550 billion
vehicle km travelled by 2050
−Vans stock to increase from
c. 3.5m
illion to 7 million by 2050
−HGVs stock to increase from
c. 500 thousands today to c. 630 thousand by 2050
−Buses stock and vehicle km
travelled to stay broadly constant at around 170 thousand units and 5 billion vehicle km
travelled
�O
verall fleet and km increase of c. 40%
betw
een 2015 and 2050
The modelling of the future U
K fleet is based on DfTtraffic and park
size projections
75
44
3039
20302020
3732
2015
34
+37%
2050
47
4135
CarsVans
HGVsBuses
103142
8272413
449
+43%
2015
517
5
512556
27
2050
738
2030
305
55
28
650
2020
35564
Total vehicle km travelled (billion km
)
Source: DfTRoad transport forecasts (available online) as w
ell as direct supply of National Travel
Model outputs for the case of cars

46
The powertrain/fuel uptake scenarios underpinning the
Infrastructure Roadmap are policy led
Uptake scenarios focus on alternative fuels
�The scenarios used are not intended to cover all possible outcom
es but instead focus on cases w
ith ambitious uptake of alternative fuels
�Scenarios are policy led,typically based on targets set by the Com
mittee on Clim
ate Change (sources show
n next); they are illustrative rather than based on detailed of new m
odelling technology costs and custom
er decision making behaviour
�Therefore the uptake scenarios represent possible futures w
here low and ultra low
emission
powertrains are successfully deployed
�Focus is intended to provide the m
ost interesting inputs for the analysis of the Infrastructure Roadm
ap –e.g. a ‘business as usual’ case w
here petrol and diesel continue to provide over 98%
of road transport energy would not require new
refuelling/recharging infrastructure
�In accordance w
ith the Fuel Roadmap, blends higher than B7 are not considered for the
mainstream
fuels and E20 is considered only from the 2030s
�Scenarios have enabled future infrastructure requirem
ents to be quantified and upfront costs capital costs for public infrastructure have been estim
ated. Cost of setting new fuel
production assets, distribution/logistics costs and general infrastructure operating costs have not been considered. Costs of other incentives that m
ight be required to achieve the uptake scenarios (e.g. vehicle grants) haven not been estim
ated in this study
47
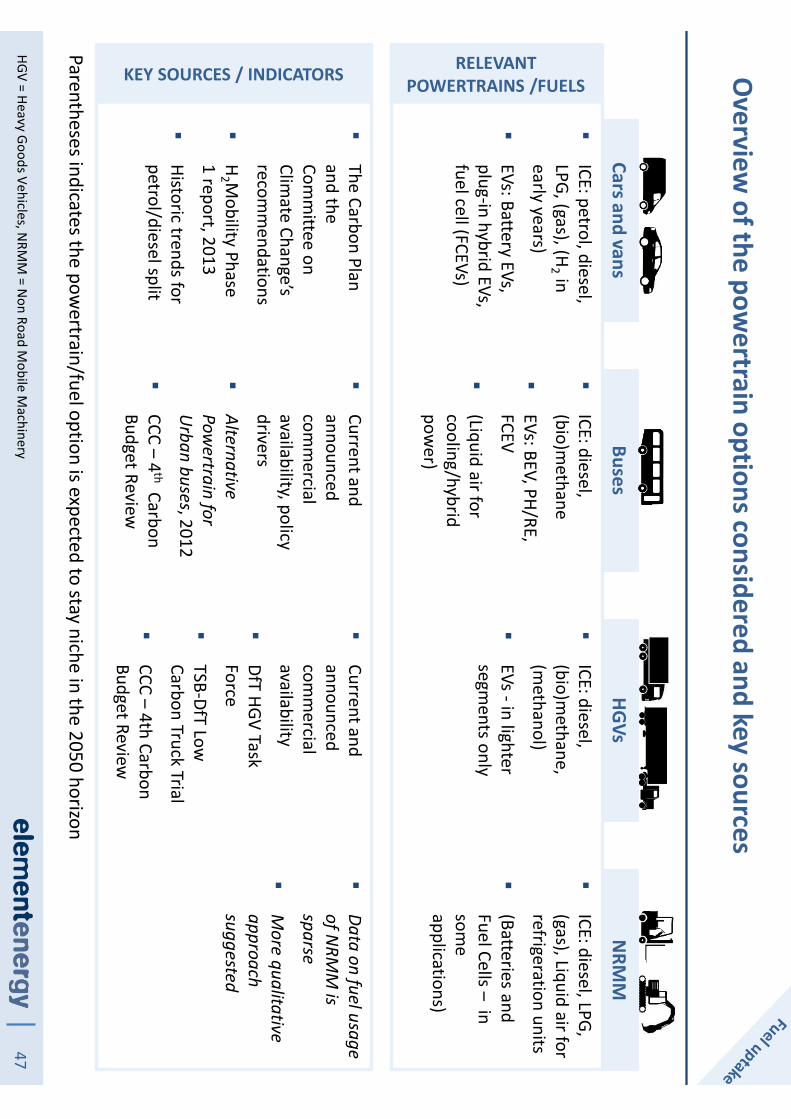
Overview
of the powertrain options considered and key sources
Cars and vansBuses
HGVsN
RMM
HGV = Heavy Goods Vehicles, NRM
M = N
on Road Mobile M
achinery
�ICE: petrol, diesel, LPG, (gas), (H
2 in early years)
�EVs: Battery EVs, plug-in hybrid EVs, fuel cell (FCEVs)
�The Carbon Plan and the Com
mittee on
Climate Change’s
recomm
endations
�H
2 Mobility Phase
1 report, 2013
�Historic trends for petrol/diesel split
�ICE: diesel, (bio)m
ethane
�EVs: BEV, PH/RE, FCEV
�(Liquid air for cooling/hybrid pow
er)
�Current and announced com
mercial
availability, policy drivers
�Alternative Pow
ertrain for Urban buses, 2012
�CCC –
4th
Carbon Budget Review
�ICE: diesel, (bio)m
ethane, (m
ethanol)
�EVs -in lighter segm
ents only
�Current and announced com
mercial
availability
�DfT
HGV Task Force
�TSB-DfT
Low
Carbon Truck Trial
�CCC –
4th Carbon Budget Review
�ICE: diesel, LPG, (gas), Liquid air for refrigeration units
�(Batteries and Fuel Cells –
in som
e applications)
�Data on fuel usage of N
RMM
is sparse
�M
ore qualitative approach suggested
Parentheses indicates the powertrain/fuel option is expected to stay niche in the 2050 horizon
RELEVANT POWERTRAINS /FUELSKEY SOURCES / INDICATORS

48
Cars and vans are expected to transition to zero emission pow
ertrains for the U
K to meet its G
HG reduction targets
Source: Element Energy
�Cars and light com
mercial vehicles (‘vans’) are treated together as they have the
same technology options and fall under the sam
e electrification targets in the Carbon Plan.
�Sales of vans running on m
ethaneare not considered in the m
odelling on the basis of the low
comm
ercial availability (only 2 models on the m
arket), lack of policy drivers for grow
th and aforementioned electrification targets. Any gas dem
and resulting from
vans would be sm
all enough to be considered negligible, in com
parison to the potential gas demand from
trucks.
�Dual fuel vans running on diesel and hydrogen and Range Extender Fuel Cell electric vans (being deployed currently in the U
K and in continental Europe) are not m
odelled explicitly. Instead, their hydrogen demand is accounted for in the ‘FCEV’
heading. The specific requirements for dual fuel and range-extender H
2 vans are how
ever considered in the Infrastructure Roadmap (e.g. dispensing pressure).

49Sources: Elem
ent Energy, UK H
2 Mobility report Phase 1 (2013), Pathw
ays to high penetration of EVs, EE for the CCC (2013), O
ptions and recomm
endations to meet the RED transport target, EE for Low
CVP (2014)
2030 60%
30%
2020
100%2050 100%
3%
2015
9%
Moderate am
bitionCCC targets
<1%
Market share of EVs (new
sales)
50%60%
50%75%
50%39%
35%50%0%
20302050
10%
15%
2020
15%0%
100%
2050
50%
2015
1%
BEVFCEV
PH/RE EV
Breakdown of m
arket share of EVs
�Tw
o EV uptake scenarios have been used:
−‘CCC targets’: EVs reach 60%
m
arket share by 2030 and Zero Em
ission vehicles reach 100%
of market share before 2050
−‘M
oderate ambition’: the
2030 CCC targets are not met
but EV uptake is nonetheless high (30%
new sales); by 2050
EVs represent 100% of sales
but are mainly PHEVs or RE-
EVs, i.e. still reliant on liquid fuels
Scenarios
We studied infrastructure requirem
ents set by the Comm
ittee on Climate
Change targets as well as a case w
ith a slower EV uptake

50Sources: Elem
ent Energy, SMM
T data for 2000-2013 sales, UKLPG for LPG 2013 figures
Sales of new cars w
ith Internal Combustion Engine vehicles -split
between spark-ignition (‘petrol’ type) and com
pression ignition engines (‘diesel’ type)
37%46%
51%50%
50%
86%63%
54%49%
50%50%
20052000
14%
2020-502013
100%
20102012 Com
pression ignitionSpark-ignition
PROPO
SED SCEN
ARIORise of diesel
Stabilisation
2013
5.0%
2030
0.6%
Share of spark-ignition cars (ICE and HEV) stock that run on LPG
c. 112,000 units
c. 800,000 units
�W
e assumed that the current split of
petrol/diesel engines for new cars (50/50)
is maintained going forw
ard
�In line w
ith the Fuels Roadmap, diesel w
ill be B7 (EN
590) with an increasing am
ount of drop-in renew
able diesel –i.e. no
compatibility issue to be considered for the
distribution infrastructure
�For petrol engines, w
e will evaluate the
amount of:
−Ethanol needed if the E10 becom
es the m
ain grade by 2020 and E20 by 2032
−LPG needed for a case w
here the rate of conversion (or sales if O
EM supply
is put in place) accelerates to reach 5%
of the petrol car stock (equivalent to c. 40,000 conversions per year until 2030)
�All new
vans are assumed to run on diesel
Scenarios
We assum
ed continuation of the observed petrol /diesel share for cars and m
odelled an ambitious LPG uptake
Decreasing stock post-2030 as no new
conversion/sales are assum
ed

51Source: Elem
ent Energy, DfTStatistics Table VEH0601, Low
CVPLow
Carbon Emission Bus M
arket Monitoring (Jan 2015), CCC,
4thCarbon budget, 2013 1 -Alternative Pow
ertrain for Urban buses study (2012)
30%10%
60%Single deck bus/coachDouble deck bus/coachM
inibus
UK bus fleet, c. 165,000 vehicles:
UK low
emission buses (all single or double deck,
no mini-buses)
274127
8518
2014
1,787
FC EVBattery EVBiom
ethaneM
icro-hybridHybrid
ScenarioCurrent U
K bus market
�W
e ramped up the alternative fuel m
arket share from
2030, in line with the European study
1that suggests that the TCO
of battery and FC e-city buses will becom
e com
parable and competitive w
ith diesel and CNG buses by
20301
�W
e assume 90%
uptake for Zero Emission Vehicles by 2050
�This is low
er that the 100% FCEVs assum
ed in the CCC projections, to reflect the fact that double decker buses (and buses in highly rural areas) m
ight require gas
0%
92%60%
80%
10%
40%
5%15%
15%5%
2020
100%
2050
50%
20402030
2%
10%
10%4%
New
buses sales scenario:
‘Diesel’ refers to a blend of B7 and drop-in renew
able diesel, as per the Fuels Roadm
ap Diesel, includes hybrid
BEVFCEV
(Bio)methane
Buses have many pow
ertrain options but overall small fuel use so w
e used only one scenario, w
here all technologies see high sales
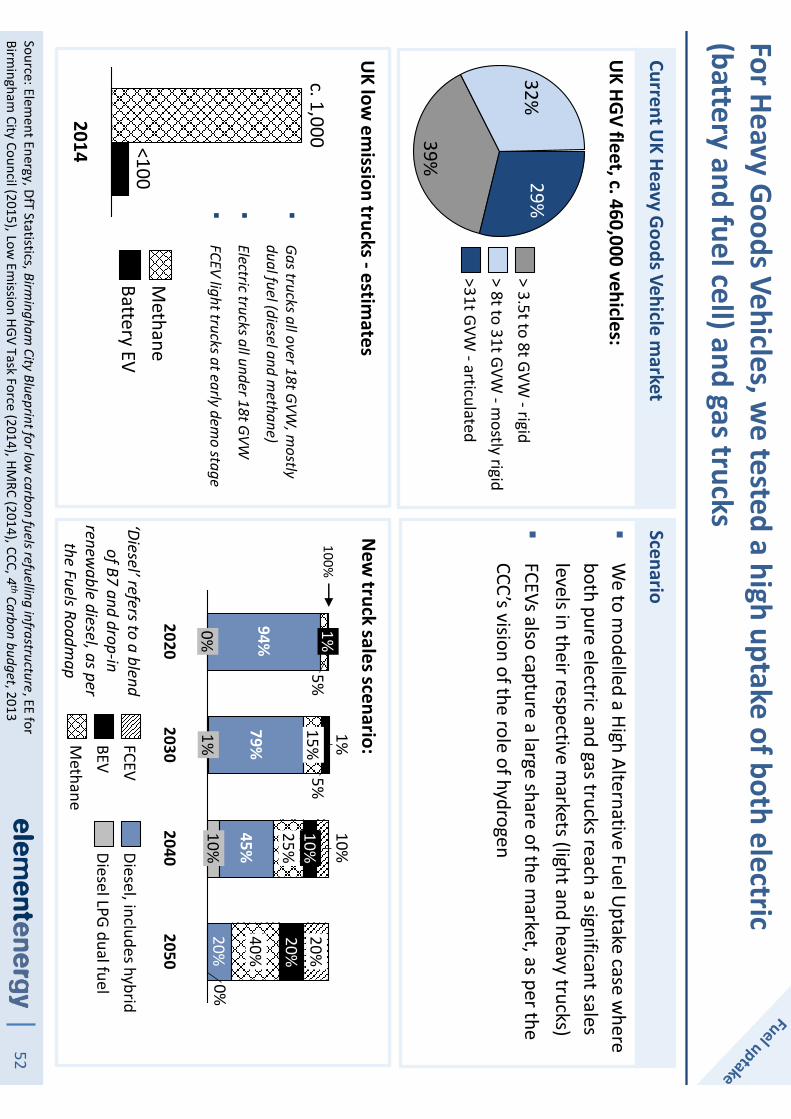
52Source: Elem
ent Energy, DfTStatistics, Birm
ingham City Blueprint for low
carbon fuels refuelling infrastructure, EE for Birm
ingham City Council (2015), Low
Emission HGV Task Force (2014), HM
RC (2014), CCC, 4thCarbon budget, 2013
29%32%
39%
>31t GVW -articulated
> 8t to 31t GVW -m
ostly rigid> 3.5t to 8t GVW
-rigid
UK HGV fleet, c. 460,000 vehicles:
UK low
emission trucks -estim
ates
<100
c. 1,000
2014
Methane
Battery EV
94%79%
0%45%
20%
5%5%
20%
10%1%
2050
0%1%
10%
40%
20%15%
2020
1%
2040
100%10%25%
2030
New
truck sales scenario:
�Gas trucks all over 18t GVW
, mostly
dual fuel (diesel and methane)
�Electric trucks all under 18t GVW
�FCEV light trucks at early dem
o stage
‘Diesel’ refers to a blend of B7 and drop-in
renewable diesel, as per
the Fuels Roadmap
Diesel, includes hybrid
Methane
BEVFCEV
Diesel LPG dual fuel
ScenarioCurrent U
K Heavy Goods Vehicle m
arket
�W
e to modelled a High Alternative Fuel U
ptake case where
both pure electric and gas trucks reach a significant sales levels in their respective m
arkets (light and heavy trucks)�
FCEVs also capture a large share of the market, as per the
CCC’s vision of the role of hydrogen
For Heavy Goods Vehicles, we tested a high uptake of both electric
(battery and fuel cell) and gas trucks

53
Non-Road M
obile Machinery typically refuels in private depots/prem
ises but the case of LPG, liquid air and hydrogen w
ere considered
Source: Element Energy analysis based, on DfT
statistics requested in Jan 2015 and Non-Road M
obile Machinery Usage,
Life and Correction FactorsAEA for Dt (2004) , industry input for LPG use in forklift
10%7%23%
17%
42%
Forklifts
Other off-roads
Agricultural tractors
Refrigeration units on HGVs
Portable generator sets
Other off-roads: Telescopic Handlers, Backhoe Loaders, Excavators, Cranes, Bulldozers, Com
pressors etc.
UK N
RMM
fleet for industry, construction and agriculture, c. 700,000 units in 2014:
(Could transition to LPG, Battery and Fuel Cell packs for some uses)
LPG, could transition to Liquid Air
Use of LPG (already used by c. 30%
of forklifts ) and batteries could increase, could transition to hydrogen
(Limited options, possibly (bio)m
ethane or high blend biodiesel)
Scenario
(LPG, limited alternative fuel options)
Beyond the blending of renewable drop-in diesel in diesel,
options for cleaner fuels are:
�W
e to considered (qualitatively, considering the lack of disaggregated data on fuel use) the infrastructure im
pacts of:
−A transition to Liquid Air for HGV refrigeration units
−An increase in LPG, battery and hydrogen use for forklifts
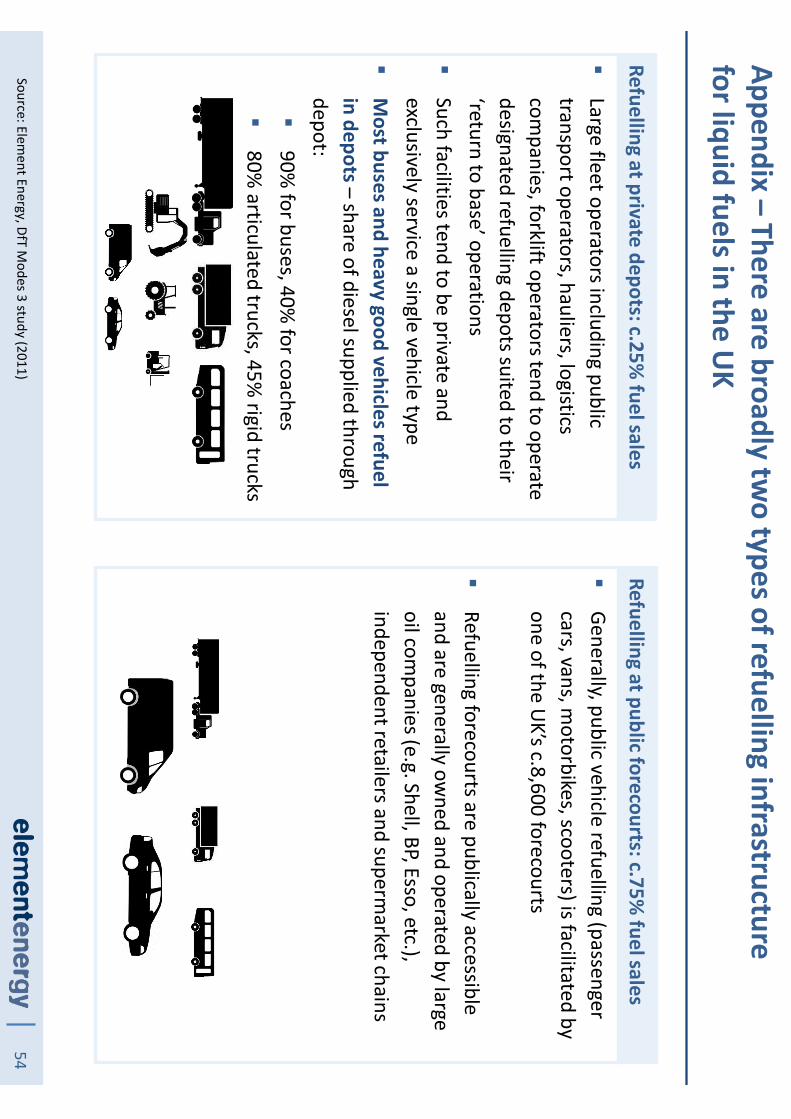
54
Appendix –There are broadly tw
o types of refuelling infrastructure for liquid fuels in the U
K
Source: Element Energy, DfT M
odes 3 study (2011)
�Large fleet operators including public transport operators, hauliers, logistics com
panies, forklift operators tend to operate designated refuelling depots suited to their ‘return to base’ operations
�Such facilities tend to be private and exclusively service a single vehicle type
�M
ost buses and heavy good vehicles refuel in depots –
share of diesel supplied through depot:�
90% for buses, 40%
for coaches�
80% articulated trucks, 45%
rigid trucks
Refuelling at private depots: c.25% fuel sales
Refuelling at public forecourts: c.75% fuel sales
�Generally, public vehicle refuelling (passenger cars, vans, m
otorbikes, scooters) is facilitated by one of the U
K’s c.8,600 forecourts
�Refuelling forecourts are publically accessible and are generally ow
ned and operated by large oil com
panies (e.g. Shell, BP, Esso, etc.), independent retailers and superm
arket chains