Embed Size (px)
Citation preview
Low Carbon Fossil Fuels Sustainability Risks and Accounting
Methodology
Final Report
Work Package Ref: 04/102/
E4tech (UK) Ltd for the Department for Transport
January 2018
Final Report
2
Contents
Acronyms ........................................................................................................................................................... 4
Executive Summary ........................................................................................................................................... 5
1 Objectives and structure of the report ...................................................................................................... 6
1.1 Definition of “low carbon fossil fuels” (LCFFs) .................................................................................................. 6
2 Technology landscape of low carbon fossil fuels ...................................................................................... 6
2.1 Fuels produced from natural gas ...................................................................................................................... 9
2.1.1 Liquefied Natural Gas (LNG) by cooling ........................................................................................................ 9
2.1.2 Compressed Natural Gas (CNG) by compression ........................................................................................ 10
2.1.3 Liquefied Petroleum Gas (LPG) by separation ............................................................................................ 10
2.1.4 Gasoline by oxidative coupling of methane and catalytic conversion of ethylene to liquids ..................... 10
2.1.5 Diesel, jet and gasoline by catalytic synthesis of syngas ............................................................................ 10
2.1.6 Methanol by catalytic synthesis of syngas .................................................................................................. 11
2.1.7 Hydrogen by water-gas-shift conversion of syngas .................................................................................... 11
2.2 Fuels produced from coal (with CCS) .............................................................................................................. 11
2.2.1 Diesel, jet and gasoline by direct liquefaction ............................................................................................ 12
2.2.2 Diesel, jet, gasoline, hydrogen, methanol or SNG by coal gasification + catalytic synthesis ...................... 12
2.3 Fuels produced from waste plastic / rubber ................................................................................................... 13
2.3.1 Diesel, jet and gasoline by pyrolysis and upgrading ................................................................................... 13
2.3.2 Diesel, jet, gasoline by thermal depolymerisation and upgrading ............................................................. 15
2.3.3 Diesel, jet, gasoline or methanol by gasification of waste plastics + catalytic conversion ......................... 15
2.4 Fuels produced from the fossil portion of mixed waste streams .................................................................... 16
2.4.1 Diesel/jet by gasification + catalytic synthesis ............................................................................................ 16
2.4.2 SNG via gasification + catalytic synthesis .................................................................................................... 17
2.4.3 Methanol by gasification + catalytic synthesis............................................................................................ 17
2.4.4 Ethanol by gasification + microbial fermentation ....................................................................................... 18
2.4.5 Hydrogen by gasification + water-gas-shift reaction .................................................................................. 18
2.5 Fuels produced from gasification of waste fossil liquids ................................................................................. 18
2.5.1 Methanol by gasification + catalytic synthesis............................................................................................ 18
2.6 Fuels produced from industrial gas containing fossil CO ................................................................................ 19
2.6.1 Ethanol by microbial fermentation ............................................................................................................. 19
2.6.2 Jet by microbial fermentation + AtJ ............................................................................................................ 19
2.7 Fuels produced from CO2 ............................................................................................................................... 20
2.7.1 Methanol by catalytic methanol synthesis ................................................................................................. 20
2.7.2 Diesel by catalytic synthesis ........................................................................................................................ 21
2.7.3 SNG by catalytic synthesis........................................................................................................................... 21
2.7.4 SNG by biological synthesis (microbial methanation) ................................................................................ 21
2.8 Hydrogen ......................................................................................................................................................... 22
2.8.1 Hydrogen from fossil electricity .................................................................................................................. 22
2.8.2 Hydrogen as a by-product of industrial processes ...................................................................................... 22
Final Report
3
3 Sustainability assessment framework ..................................................................................................... 22
3.1 Summary of sustainability risks and sustainability assessment framework.................................................... 22
3.2 Defining LCFFs ................................................................................................................................................. 24
3.2.1 Does the feedstock contain any energy? .................................................................................................... 24
3.2.2 Is the feedstock a waste? ............................................................................................................................ 24
3.3 Production and use of the fuel will cause non-GHG environmental impacts ................................................. 25
3.3.1 Risk description ........................................................................................................................................... 25
3.3.2 Summary of risk across different fuel chains .............................................................................................. 27
3.3.3 How this risk is assessed ............................................................................................................................. 29
3.4 Risk that use of a waste feedstock will increase production of that waste .................................................... 29
3.4.1 Risk description ........................................................................................................................................... 29
3.4.2 Summary of risk across different fuel chains .............................................................................................. 30
3.4.3 How this risk is assessed ............................................................................................................................. 30
3.5 Risk of feedstock not meeting the waste hierarchy ........................................................................................ 31
3.5.1 Risk description ........................................................................................................................................... 31
3.5.2 Summary of risk across different fuel chains .............................................................................................. 32
3.5.3 How this risk is assessed ............................................................................................................................. 32
3.6 Risk that production and use of fuel leads to increased lifecycle GHG emissions .......................................... 34
3.6.1 Risk description ........................................................................................................................................... 34
3.6.2 Methodology for assessing GHG emissions ................................................................................................ 35
3.6.3 Summary of risk for all fuel types ............................................................................................................... 40
3.6.4 How this risk is assessed ............................................................................................................................. 41
3.7 Risk of increasing fossil fuel extraction or extending the lifetime of fossil fuel assets ................................... 42
3.7.1 Risk description ........................................................................................................................................... 42
3.7.2 Summary of risk for all fuel types ............................................................................................................... 42
3.7.3 How this risk is assessed ............................................................................................................................. 43
3.8 Threshold for GHG emissions .......................................................................................................................... 44
4 Inclusion of LCFFs within UK and Ireland carbon calculator ................................................................... 45
5 Conclusions .............................................................................................................................................. 45
Appendix A Technology readiness level scale ............................................................................................. 48
Appendix B Assessing severity and likelihood of risk ................................................................................. 49
Appendix C Risk that use of fuel will increase local air pollutants ............................................................. 50
Appendix D Risk of feedstock not meeting the waste hierarchy ................................................................ 52
Appendix E Review of GHG accounting approaches .................................................................................. 56
Appendix F Risk that production and use of the fuel will lead to increased lifecycle GHG emissions ....... 60
E4tech (UK) Ltd 83 Victoria Street London SW1H 0HW United Kingdom Tel: +44 20 3008 6140 Fax: +44 20 7078 6180
Incorporated in England and Wales
Company no. 4142898
Registered address: 133-137 Alexandra Road, Wimbledon, London SW19 7JY United Kingdom
www.e4tech.com
Final Report
4
Acronyms
CCS Carbon Capture and Storage
CEN European Committee for Standardisation
CNG Compressed Natural Gas
DfT Department for Transport (United Kingdom)
DCL Direct Coal Liquefaction
EfW Energy from Waste
FT Fischer Tropsch
GHG Greenhouse Gas
L Litres
LCA Life Cycle Assessment
LCFF Low Carbon Fossil Fuel
LHV Lower Heating Value
LNG Liquefied Natural Gas
LPG Liquefied Petroleum Gas
MBT Mechanical Biological Treatment
MHT Mechanical Heat Treatment
MRF Materials Recycling Facility
RDF Refuse Derived Fuel
RFNBO Renewable Fuel of Non-Biological Origin
RTFC Renewable Transport Fuel Certificate
RTFO Renewable Transport Fuel Obligation
SLF Secondary Liquid Fuel
SNG Synthetic Natural Gas
SRF Solid Recovered Fuel
t Tonnes
TRL Technology Readiness Level
WFD Waste Framework Directive
Final Report
5
Executive Summary
Decarbonising the transport sector is central to addressing climate change, and alongside
other options such as biofuels and electrification, low carbon fossil fuels could contribute to
this objective. However there is little consideration to-date of the potential sustainability
impacts of these fuels, nor an agreed methodology to assess lifecycle carbon emissions. This
study aims to identify and assess these sustainability impacts, propose a methodological
framework which could be used for their assessment in relation to specific fuel chains, and
assess broad categories of alternative fossil fuels against this framework, recognising that the
assessment is highly specific to the specific feedstock used, fuel production process, and final
fuel. Not all of the alternative fossil fuels referred to in this report will classify as low carbon
fossil fuels, i.e. will have lower carbon emissions than ordinary petrol or diesel.
Alternative fossil fuels can be produced from waste or non-waste fossil feedstocks, or from
non-renewable energy. Across this broad scope, the technology routes cover a wide range of
Technology Readiness Levels (TRL). Some, particularly those produced from non-waste
feedstocks, are already commercial.
The main sustainability risk of alternative fossil fuels is making low or even negative
greenhouse gas savings compared to conventional fossil fuels.
A key conclusion of the report is that to understand the real world emissions of alternative
fossil fuels, the lifecycle assessment needs to account for where the carbon would otherwise
have been destined, had it not been used to make a new fuel product. Adopting this approach,
this research illustrates that lifecycle carbon impacts of alternative fossil fuels range from
significantly higher, to significantly lower emissions than ordinary petrol and diesel. Very
broadly, fuels using carbon sources which would have been sequestered (e.g. in landfill) tend
to create a fuel with higher greenhouse gas emissions than those using carbon which would
otherwise have been combusted. For example fuels produced from the fossil portion of MSW
that would have been landfilled could have GHG emissions which are similar to fossil petrol or
diesel. Fuels produced from waste industrial gases, which would always have alternatively
been combusted, are highly likely to reduce GHG emissions compared to fossil petrol or diesel.
The report also identifies a range of broader sustainability risks relating to air quality impacts,
encouraging the production of more wastes, and of making an inefficient use of resources, for
example, through contravening the waste hierarchy. If low carbon fossil fuels are given policy
support, the report concludes that robust sustainability criteria should be in place to mitigate
these risks. Furthermore, there is a risk that support for non-waste low carbon fossil fuels
could support continued fossil fuel use, so should be carefully considered in the context of
wider government decarbonisation policy.
Finally, given that the GHG methodology proposed here includes indirect emissions, whilst
policies supporting biofuels generally do not, it may not be appropriate to impose the same
GHG thresholds on both categories of fuels.

Final Report
6
1 Objectives and structure of the report
A number of new technology developers have emerged in recent years aiming to produce fuels
from fossil or waste fossil sources, and even some established fossil fuel routes may produce
fuels with lower greenhouse gas (GHG) emissions than conventional gasoline or diesel. There is
an opportunity for these fuels to contribute to decarbonisation of the UK transport sector, but
they could also pose new or additional sustainability risks. Therefore this study aims to:
Identify and analyse the sustainability risks posed by specific low carbon fossil fuel
routes in order to assess whether they should receive government support
Provide a framework for DfT to assess the sustainability risks associated with any low
carbon fossil fuel
Develop a GHG emissions accounting methodology for low carbon fossil fuels and a set
of illustrative GHG emission values for some key fuel chains
Propose an approach to setting a GHG threshold for sustainable low-carbon fossil fuels
This report is divided into two main sections. The first section (chapter two) provides an
overview of the landscape of fuels which could, with sufficiently low GHG emissions, be low-
carbon fossil fuels, including technology and commercial readiness and costs where these are
available. The objective of this section is to ensure that all relevant sustainability risks are
identified, and to provide an overview of which fuel routes and companies are closest to
commercial production. The second section of the report (chapter three) defines five key
sustainability risks, and proposes a framework to assess fuels against these risks and
determine which are likely to be sustainable low carbon fossil fuels. For each risk, its severity
and likelihood of occurrence for specific feedstocks or fuels is analysed and practical guidance
for assessing this risk in novel fuel chains is provided. Finally key considerations for inclusion of
these fuels within the UK and Ireland carbon calculator are discussed in chapter four.
Information relating to specific feedstocks and illustrative GHG calculations for fuels produced
from a number of these feedstocks is provided in the Appendices.
1.1 Definition of “low carbon fossil fuels” (LCFFs)
In this report, the term Low Carbon Fossil Fuels (LCFFs) is used to denote fuels that have the
potential (e.g. when CCS is used in feedstock processing) to have lower GHG emissions than
the typical GHG emissions associated with the weighted life cycle GHG intensity of diesel and
gasoline from a variety of feedstocks of 94.1gCO2eq/MJ. It is possible that some of the fuels
presented in chapter 2 do not actually result in lower GHG emissions, which will become
evident during their GHG assessment. Ultimately, those fuels should be termed “alternative
fossil fuels” rather than “low carbon fossil fuels”.
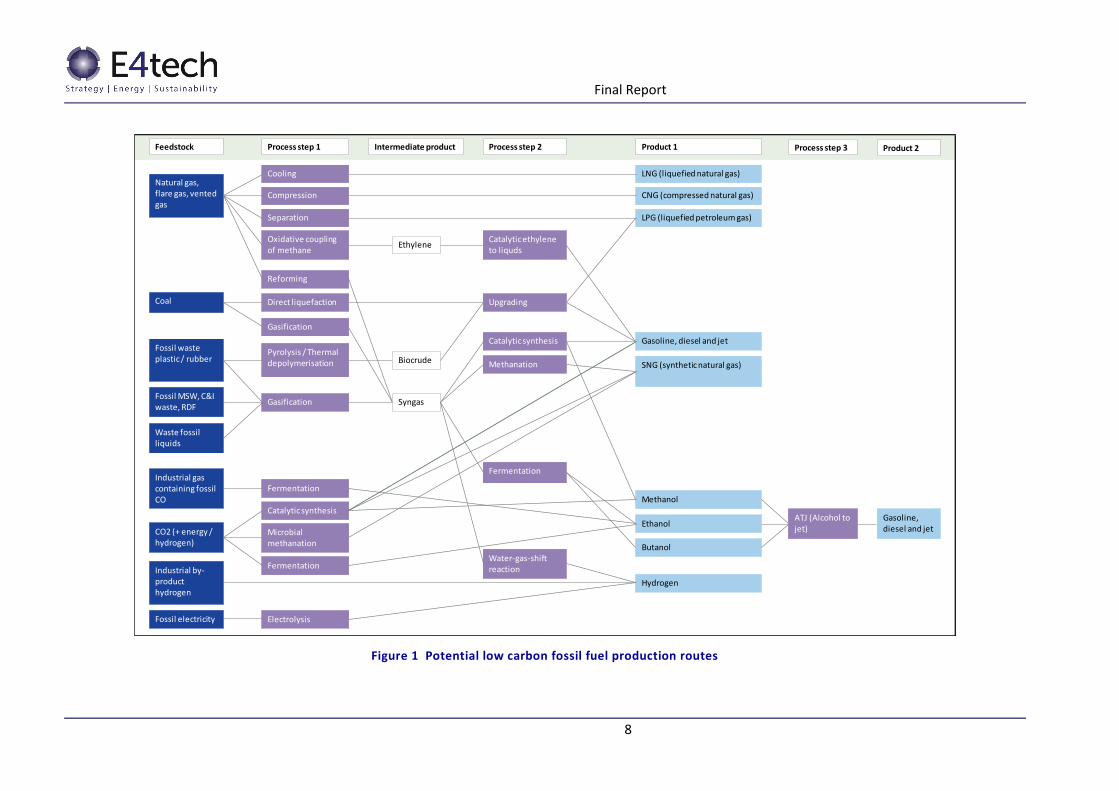
2 Technology landscape of low carbon fossil fuels
This section aims to provide an overview of technology routes that are currently
commercialised, emerging into the market, or known to be being pursued by researchers or
developers that could be used to produce LCFFs. An overview of these technology routes is
given in Figure 1, and additional detail is given in the rest of this chapter. Numerous routes are

Final Report
7
shown here to be technically possible, for example a wide range of feedstocks can be
transformed into syngas, and a wide range of products can be produced from this syngas.
However some downstream processes are more likely with certain feedstocks, for technical
reasons such as levels of syngas contamination, or for economic reasons. Therefore in the
detailed discussion in this section, priority has been given to fuel routes which are being
pursued commercially or actively researched today.
Final Report
8
Figure 1 Potential low carbon fossil fuel production routes
Natural gas, flare gas, ventedgas
Industrial gas containing fossil CO
Fossil waste plastic / rubber
Fossil MSW, C&I waste, RDF
CO2 (+ energy / hydrogen)
Feedstock
Gasoline, diesel and jet
Methanol
Ethanol
SNG (synthetic natural gas)
LNG (liquefied natural gas)
CNG (compressed natural gas)
Product 1Process step 1 Process step 2
Cooling
Compression
LPG (liquefied petroleum gas)Separation
Fermentation
Pyrolysis / Thermal depolymerisation
Gasification
Catalytic synthesis
Methanation
Fermentation
Oxidative coupling of methane
Catalytic ethylene to liquds
Industrial by-product hydrogen
Hydrogen
Catalytic synthesis
Reforming
Microbial methanation
Intermediate product
Ethylene
Syngas
Biocrude
Waste fossil liquids
Fermentation
Butanol
Coal Direct liquefaction
Gasification
Water-gas-shiftreaction
Fossil electricity
Gasoline, diesel and jet
Electrolysis
Upgrading
Process step 3
ATJ (Alcohol to jet)
Product 2
Final Report
9
The following sections each describe how a particular feedstock can be processed into a
particular fuel, providing an assessment of the TRL1 of each route and case studies of key
companies, focussing where possible on companies within the UK.
Processing a particular feedstock into specific fuels(s) requires a system that is highly
optimised to the feedstock, the detail of which is out of scope of this report. Nevertheless in
many cases a given conversion technology can process a variety of feedstocks, for example the
Fischer-Tropsch process can produce gasoline, diesel or jet fuel from syngas, regardless of the
origin of the syngas, if sufficient syngas cleaning steps are in place. Therefore for the purposes
of this report the high level conversion process is described only once and then referred to
later on when required.
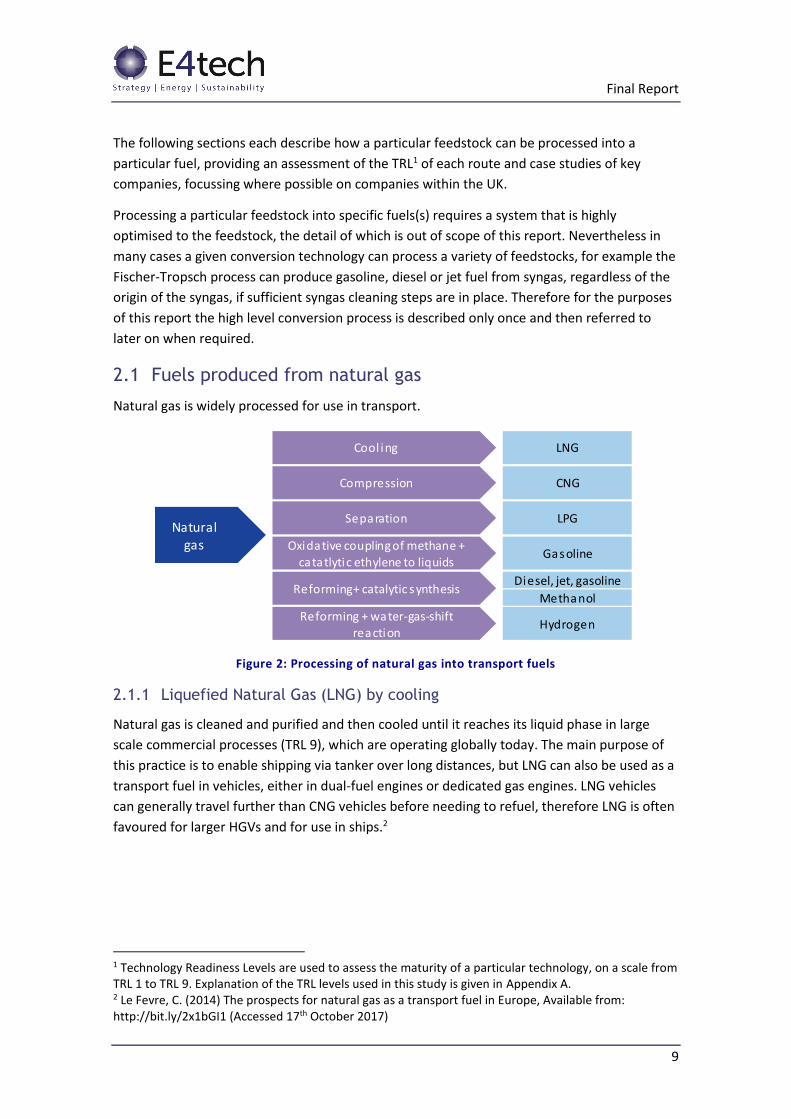
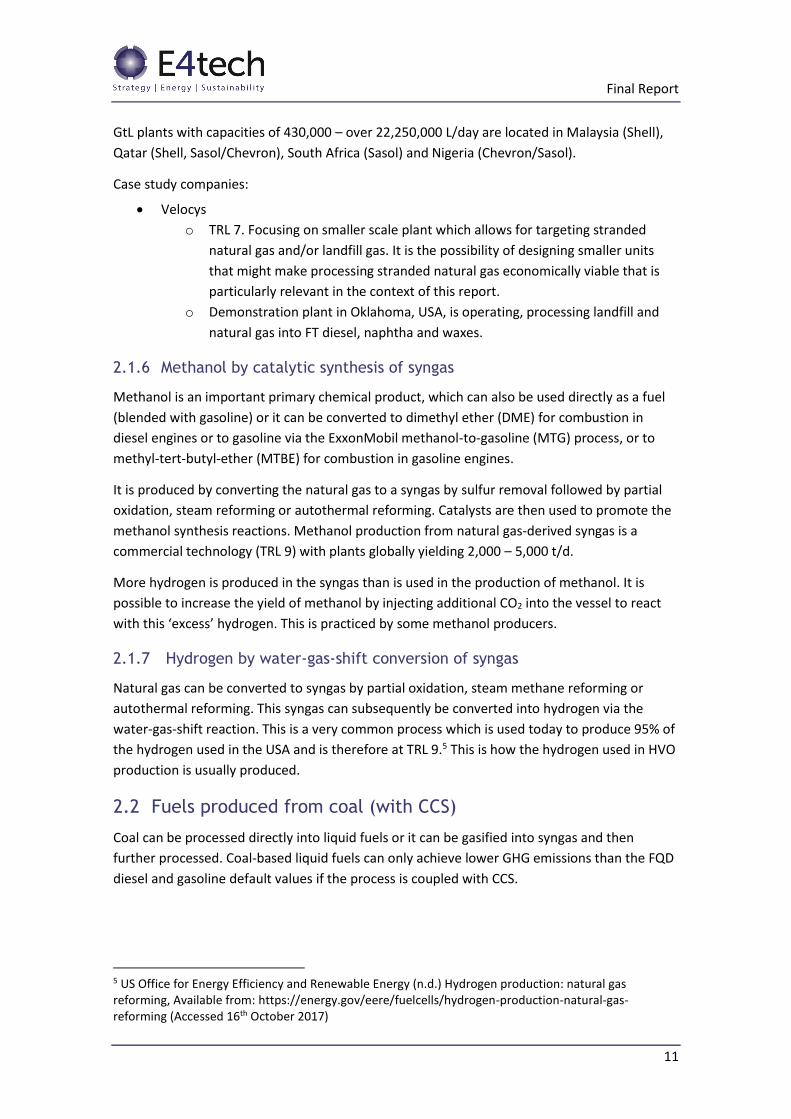
2.1 Fuels produced from natural gas
Natural gas is widely processed for use in transport.
Figure 2: Processing of natural gas into transport fuels
2.1.1 Liquefied Natural Gas (LNG) by cooling
Natural gas is cleaned and purified and then cooled until it reaches its liquid phase in large
scale commercial processes (TRL 9), which are operating globally today. The main purpose of
this practice is to enable shipping via tanker over long distances, but LNG can also be used as a
transport fuel in vehicles, either in dual-fuel engines or dedicated gas engines. LNG vehicles
can generally travel further than CNG vehicles before needing to refuel, therefore LNG is often
favoured for larger HGVs and for use in ships.2
1 Technology Readiness Levels are used to assess the maturity of a particular technology, on a scale from TRL 1 to TRL 9. Explanation of the TRL levels used in this study is given in Appendix A. 2 Le Fevre, C. (2014) The prospects for natural gas as a transport fuel in Europe, Available from: http://bit.ly/2x1bGI1 (Accessed 17th October 2017)
2,700
140000
10.5Natural gas
Cool ing LNG
Compression CNG
Separation LPG
Oxidative coupling of methane +
catatlytic ethylene to liquidsGasoline
Reforming + water-gas-shift reaction
Hydrogen
Reforming+ catalytic synthesisDiesel, jet, gasoline
Methanol
Final Report
10
2.1.2 Compressed Natural Gas (CNG) by compression
The compression of natural gas is practiced globally at TRL 9, and CNG can be used either in
dual-fuel or dedicated gas engines. As CNG vehicles generally have a smaller range than LNG
vehicles, priority markets tend to be smaller road vehicles and ‘back to depot’ type operations.
2.1.3 Liquefied Petroleum Gas (LPG) by separation
Natural gas liquids, also known as condensates, are produced alongside methane when natural
gas is extracted. Natural gas liquids make up between 1% and 10% of the unprocessed natural
gas stream. Propane, butane and isobutane are separated from this stream and sold as LPG
(TRL 9). Currently LPG is used in around 150,000 UK vehicles, all of which can run on both LPG
and conventional gasoline.3 There is a small cost associated with conversion of the engine to
run on LPG, generally between £1000 and £2000. As well as road transport vehicles, around a
third of all fork lift trucks in the UK also run on LPG. LPG is subject to lower fuel duties in the
UK than conventional gasoline or diesel, and is therefore cheaper at the pump, although this
cost saving is partially offset by the additional fuel volume that is required for an equivalent
mileage. Nevertheless LPG remains a cheaper fuel option than gasoline or diesel at present.4
2.1.4 Gasoline by oxidative coupling of methane and catalytic conversion of ethylene to liquids
In oxidative coupling of methane (OCM), methane reacts with oxygen over a catalyst in an
exothermic reaction to form ethylene, water and heat. The ethylene is an intermediate
product that has many uses in the chemicals industry, but it can also be oligomerised using
another catalytic process to produce liquids such as gasoline.
Case study companies:
Siluria (USA)
o TRL 6-7 Silura’s OCM catalyst also allows for co-feeding of ethane alongside
methane to produce ethylene. Siluria has developed a catalytic process for the
conversion of ethylene to gasoline.
o Siluria has a demonstration plant in Texas, which began operation in 2015. It is
operated by Braskem and can produce approximately 350 t/year of ethylene.
2.1.5 Diesel, jet and gasoline by catalytic synthesis of syngas
The gas-to-liquid process involves conversion of natural gas to syngas by sulfur removal
followed by partial oxidation, steam reforming or autothermal reforming. This is then followed
by Fischer-Tropsch synthesis, which is a catalytic process that can be tailored to produce fuel
products such as diesel, jet fuel, naphtha and other products such as waxes from syngas. Large
3 Atlantic consulting (2015) Available from: LPG, biopropane and low-carbon transport http://www.lowcvp.org.uk/assets/workingdocuments/LPGBioPropaneDfT.pdf (Accessed on 17th October 2017) 4 UK LPG (2017) LPG as a transport fuel, Available from: http://www.uklpg.org/about-uklpg/lpg-as-a-transport-fuel/ (Accessed on 17th October 2017)
Final Report
11
GtL plants with capacities of 430,000 – over 22,250,000 L/day are located in Malaysia (Shell),
Qatar (Shell, Sasol/Chevron), South Africa (Sasol) and Nigeria (Chevron/Sasol).
Case study companies:
Velocys
o TRL 7. Focusing on smaller scale plant which allows for targeting stranded
natural gas and/or landfill gas. It is the possibility of designing smaller units
that might make processing stranded natural gas economically viable that is
particularly relevant in the context of this report.
o Demonstration plant in Oklahoma, USA, is operating, processing landfill and
natural gas into FT diesel, naphtha and waxes.
2.1.6 Methanol by catalytic synthesis of syngas
Methanol is an important primary chemical product, which can also be used directly as a fuel
(blended with gasoline) or it can be converted to dimethyl ether (DME) for combustion in
diesel engines or to gasoline via the ExxonMobil methanol-to-gasoline (MTG) process, or to
methyl-tert-butyl-ether (MTBE) for combustion in gasoline engines.
It is produced by converting the natural gas to a syngas by sulfur removal followed by partial
oxidation, steam reforming or autothermal reforming. Catalysts are then used to promote the
methanol synthesis reactions. Methanol production from natural gas-derived syngas is a
commercial technology (TRL 9) with plants globally yielding 2,000 – 5,000 t/d.
More hydrogen is produced in the syngas than is used in the production of methanol. It is
possible to increase the yield of methanol by injecting additional CO2 into the vessel to react
with this ‘excess’ hydrogen. This is practiced by some methanol producers.
2.1.7 Hydrogen by water-gas-shift conversion of syngas
Natural gas can be converted to syngas by partial oxidation, steam methane reforming or
autothermal reforming. This syngas can subsequently be converted into hydrogen via the
water-gas-shift reaction. This is a very common process which is used today to produce 95% of
the hydrogen used in the USA and is therefore at TRL 9.5 This is how the hydrogen used in HVO
production is usually produced.
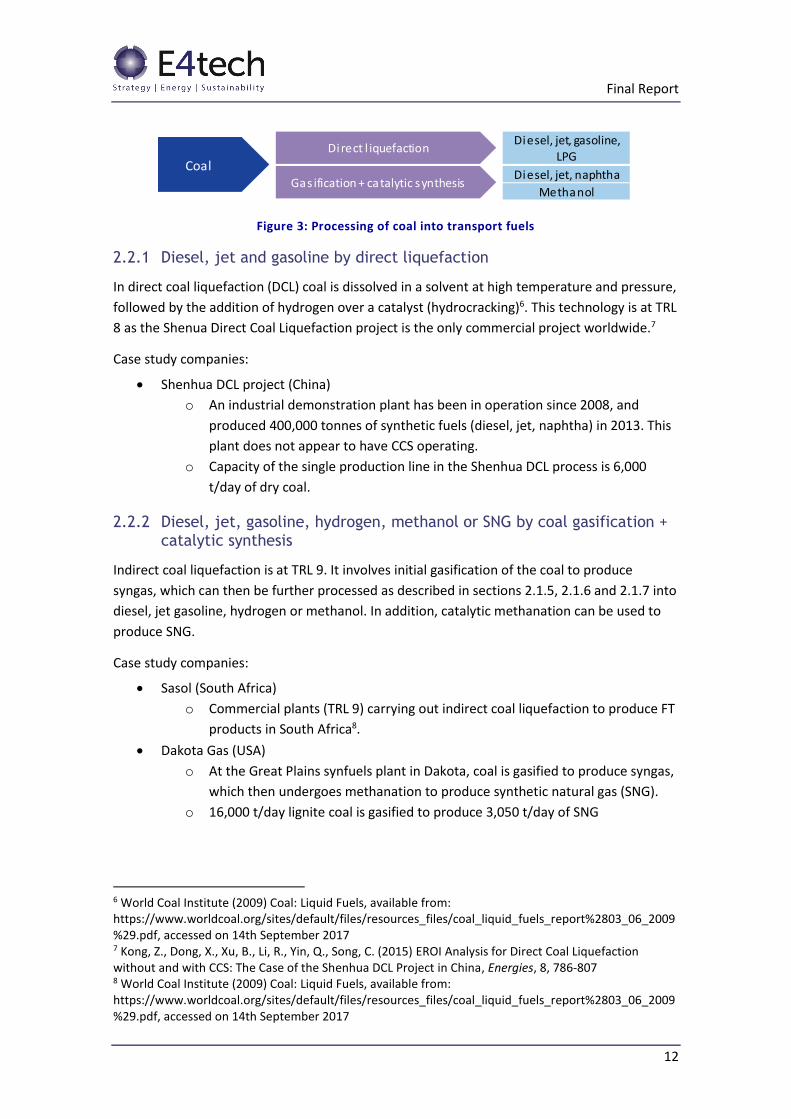
2.2 Fuels produced from coal (with CCS)
Coal can be processed directly into liquid fuels or it can be gasified into syngas and then
further processed. Coal-based liquid fuels can only achieve lower GHG emissions than the FQD
diesel and gasoline default values if the process is coupled with CCS.
5 US Office for Energy Efficiency and Renewable Energy (n.d.) Hydrogen production: natural gas reforming, Available from: https://energy.gov/eere/fuelcells/hydrogen-production-natural-gas-reforming (Accessed 16th October 2017)
Final Report
12
Figure 3: Processing of coal into transport fuels
2.2.1 Diesel, jet and gasoline by direct liquefaction
In direct coal liquefaction (DCL) coal is dissolved in a solvent at high temperature and pressure,
followed by the addition of hydrogen over a catalyst (hydrocracking)6. This technology is at TRL
8 as the Shenua Direct Coal Liquefaction project is the only commercial project worldwide.7
Case study companies:
Shenhua DCL project (China)
o An industrial demonstration plant has been in operation since 2008, and
produced 400,000 tonnes of synthetic fuels (diesel, jet, naphtha) in 2013. This
plant does not appear to have CCS operating.
o Capacity of the single production line in the Shenhua DCL process is 6,000
t/day of dry coal.
2.2.2 Diesel, jet, gasoline, hydrogen, methanol or SNG by coal gasification + catalytic synthesis
Indirect coal liquefaction is at TRL 9. It involves initial gasification of the coal to produce
syngas, which can then be further processed as described in sections 2.1.5, 2.1.6 and 2.1.7 into
diesel, jet gasoline, hydrogen or methanol. In addition, catalytic methanation can be used to
produce SNG.
Case study companies:
Sasol (South Africa)
o Commercial plants (TRL 9) carrying out indirect coal liquefaction to produce FT
products in South Africa8.
Dakota Gas (USA)
o At the Great Plains synfuels plant in Dakota, coal is gasified to produce syngas,
which then undergoes methanation to produce synthetic natural gas (SNG).
o 16,000 t/day lignite coal is gasified to produce 3,050 t/day of SNG
6 World Coal Institute (2009) Coal: Liquid Fuels, available from: https://www.worldcoal.org/sites/default/files/resources_files/coal_liquid_fuels_report%2803_06_2009%29.pdf, accessed on 14th September 2017 7 Kong, Z., Dong, X., Xu, B., Li, R., Yin, Q., Song, C. (2015) EROI Analysis for Direct Coal Liquefaction without and with CCS: The Case of the Shenhua DCL Project in China, Energies, 8, 786-807 8 World Coal Institute (2009) Coal: Liquid Fuels, available from: https://www.worldcoal.org/sites/default/files/resources_files/coal_liquid_fuels_report%2803_06_2009%29.pdf, accessed on 14th September 2017
Coal
Direct l iquefactionDiesel, jet, gasoline,
LPG
Gas ification + catalytic synthesisDiesel, jet, naphtha
Methanol
Final Report
13
o The plant started operation in 1988, and has been upgraded since, notably to
capture the CO2 separated during SNG purification which became operational
in 2000. The captured CO2 is used for enhanced oil recovery.
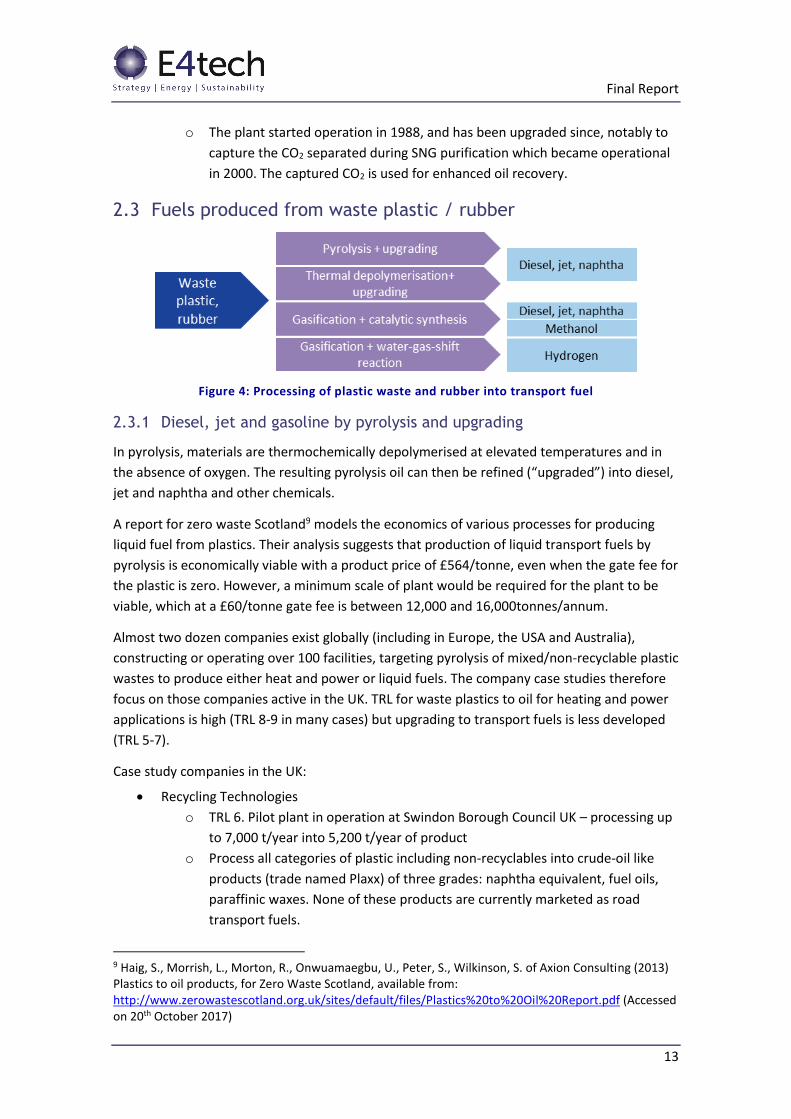
2.3 Fuels produced from waste plastic / rubber
Figure 4: Processing of plastic waste and rubber into transport fuel
2.3.1 Diesel, jet and gasoline by pyrolysis and upgrading
In pyrolysis, materials are thermochemically depolymerised at elevated temperatures and in
the absence of oxygen. The resulting pyrolysis oil can then be refined (“upgraded”) into diesel,
jet and naphtha and other chemicals.
A report for zero waste Scotland9 models the economics of various processes for producing
liquid fuel from plastics. Their analysis suggests that production of liquid transport fuels by
pyrolysis is economically viable with a product price of £564/tonne, even when the gate fee for
the plastic is zero. However, a minimum scale of plant would be required for the plant to be
viable, which at a £60/tonne gate fee is between 12,000 and 16,000tonnes/annum.
Almost two dozen companies exist globally (including in Europe, the USA and Australia),
constructing or operating over 100 facilities, targeting pyrolysis of mixed/non-recyclable plastic
wastes to produce either heat and power or liquid fuels. The company case studies therefore
focus on those companies active in the UK. TRL for waste plastics to oil for heating and power
applications is high (TRL 8-9 in many cases) but upgrading to transport fuels is less developed
(TRL 5-7).
Case study companies in the UK:
Recycling Technologies
o TRL 6. Pilot plant in operation at Swindon Borough Council UK – processing up
to 7,000 t/year into 5,200 t/year of product
o Process all categories of plastic including non-recyclables into crude-oil like
products (trade named Plaxx) of three grades: naphtha equivalent, fuel oils,
paraffinic waxes. None of these products are currently marketed as road
transport fuels.
9 Haig, S., Morrish, L., Morton, R., Onwuamaegbu, U., Peter, S., Wilkinson, S. of Axion Consulting (2013) Plastics to oil products, for Zero Waste Scotland, available from: http://www.zerowastescotland.org.uk/sites/default/files/Plastics%20to%20Oil%20Report.pdf (Accessed on 20th October 2017)
Final Report
14
o In 2016 announced that commercial scale production was reached.10
Cynar
o TRL 6. Cynar constructed a full-scale plant in Ireland in 2010.
o Process plastics (grades 4, 5, 6) into pyrolysis oil and then fuels1112
o Cynar agreed a deal with Suez Sita UK to build 10 facilities, but then left the
agreement. Only one plant in Avonmouth was constructed and Cynar went
into administration in 2016.13
Integrated Green Energy Solutions (formerly FOY group)
o TRL 7. In April 2017 signed a US$90 million funding commitment for rollout of
4 commercial sites in the UK with Structured Growth Capital, Inc.
o Each site is expected to process 200 t/day of plastic into 70M litres per year of
product14
o In late 2017 announced plans to invest in a plastics-to-fuel plant in Grimsby
producing 69 ML/year of fuel from non-recyclable plastic15
Pyreco
o TRL 5. In 2011 had plans to build plant in Teesside to produce pyrolysis oil &
gas. However no evidence that this started up (2013 struggling with funding
for the £80M plant)16
Anergy
o TRL 9 for electricity applications, likely TRL 6 for transport fuels.
o Globally active, with over 200 installations in over 50 countries17, Anergy
provides fixed installation of high-temperature pyrolysis: larger plant (in 3
MWe modules) as well as 250 kW-1MWe semi-portable units constructed
within shipping containers.
10 Lets Recycle (2016) Swindon council to pilot plastics-to-fuel technology, Available from: https://www.letsrecycle.com/news/latest-news/swindon-council-to-pilot-plastics-to-fuel-technology/ (Accessed on 19th October 2017) 11 Murray, M. (2011)Converting end of life plastic into diesel: the Cynar experience, Available from: https://www.rockwellautomation.com/resources/downloads/rockwellautomation/pdf/events/automation-fair/2011/psug/af11psug_cs08_cynar.pdf (Accessed on 23rd October 2017) 12 Biofuels digest (2015) 17 Pyromaniax changing the energy landscape, available from: http://www.biofuelsdigest.com/bdigest/2015/10/08/17-pyromaniax-changing-the-energy-landscape/ (Accessed on 19th October 2017) 13 Brewster, S. (2016) The eight steps in turning plastic back into oil, Available from: https://www.mrw.co.uk/knowledge-centre/the-eight-steps-in-turning-plastic-back-into-oil/10012840.article (Accessed on 19th October 2017) 14 FOY GROUP LTD (2017) FOY signs funding commitment for the construction of 4 sites in the UK, Available from: http://bit.ly/2il9dpp (Accessed on 19th October 2017) 15 Biofuels digest (2017) IGE Solutions to invest $26.3 million in UK plastics-to-fuel plant, Available from: http://www.biofuelsdigest.com/bdigest/2017/11/15/ige-solutions-to-invest-26-3-million-in-uk-plastics-to-fuel-plant/ (Accessed on 26th January 2018) 16 Waste management world (2013) 80m Tyre recycling pyrolysis project struggling to finance teesside plant, Available from: https://waste-management-world.com/a/80m-tyre-recycling-pyrolysis-project-struggling-to-finance-teesside-plant (Accessed on 23 October2017) 17 Anergy Ltd (n.d.) About us, Available from: http://www.greenanergy.com/about-us.php (Accessed on 19th October 2017)
Final Report
15
o The main products of this pyrolysis process are pyrolysis gas which is upgraded
and cleaned to syngas for electricity generation.
o Anergy are developing technology for production of fuels from waste tyres and
waste oil.
Plastic Energy18
o TRL 7. Headquartered in the UK, with 2 plants in Spain producing pyrolysis oil
that is upgraded to inputs for chemicals industry and transport fuels.
Feedstock is mixed plastics, mostly contaminated post-consumer plastic waste.
Tourian
o TRL 5. Targeting diesel/gasoline production from plastics foils and films in Tees
Valley
2.3.2 Diesel, jet, gasoline by thermal depolymerisation and upgrading
Thermal depolymerisation (sometimes also referred to as hydrothermal upgrading) uses
hydrous pyrolysis to decompose long chain polymers into short-chain petroleum hydrocarbons
in the form of pyrolysis oil, which can then be refined (“upgraded”) into diesel, jet and gasoline
and other chemicals.
Case study companies:
Vadxx (USA)
o TRL 7. $25M commercial scale demonstrator plant started operation in 2017 at
25% of capacity. Full capacity operation in 2018 expected to be 23,000 t/year
of waste processed19
o Process a mix of post-industrial and post-consumer waste plastics into liquid
transport fuel and lubricants / waxes.
o Pilot plant at 1/50th of commercial scale was operated for 4 years, also in Ohio.
Global Renewables (UK)
o Had plans to develop a facility in the UK but company is now dissolved.
2.3.3 Diesel, jet, gasoline or methanol by gasification of waste plastics + catalytic conversion
Waste plastic can be gasified to produce syngas, which can then either undergo water-gas-shift
to yield hydrogen or can be further transformed into SNG, methanol or Fischer-Tropsch liquids.
While waste plastics are gasified within the mixed MSW stream processed by companies such
as Enerkem, there do not appear to be many developers pursuing gasification of isolated
plastics. This may be because the techno-economics of gasification of this feedstock do not
appear to be very favourable20.
18 Plastic Energy (n.d.) Technology, Available from: http://plasticenergy.net/technology.php (Accessed on 1st November 2017) 19 Polymer Ohio (2016) Vadxx Energy Establishes Waste Plastic to EcoFuel™ Facility in Akron, Available from: https://polymerohio.org/vadxx-energy-establishes-waste-plastic-ecofuel-facility-akron/ (Accessed on 19th October 2017) 20 Haig, S., Morrish, L., Morton, R., Onwuamaegbu, U., Peter, S., Wilkinson, S. of Axion Consulting (2013) Plastics to oil products, for Zero Waste Scotland, available from:
Final Report
16
2.4 Fuels produced from the fossil portion of mixed waste streams
Most processes using municipal solid waste (MSW), commercial and industrial waste (C&I
waste) or other mixed waste streams pre-process the waste to remove recyclables and some
inert materials to produce a dryer, higher calorific value fuel which does not have oversize
particles. Depending on composition of the fuel this may be called refuse derived fuel (RDF) or
solid recovered fuel (SRF). Fuel production from mixed waste streams produces a partially
renewable fuel, only the non-renewable portion of which is within scope of this report.
Nevertheless, producers generally aim to maximise the biogenic components of the feedstock
as support in Europe and the USA is primarily focussed on the renewable portion of the fuel.
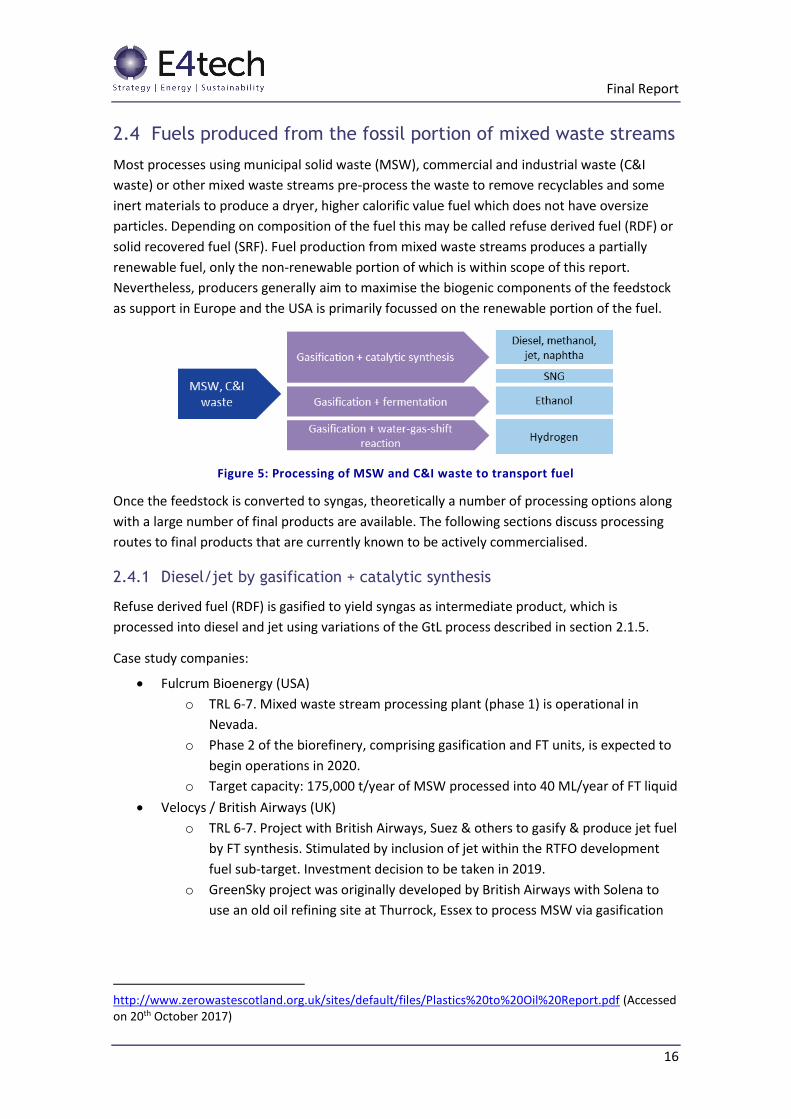
Figure 5: Processing of MSW and C&I waste to transport fuel
Once the feedstock is converted to syngas, theoretically a number of processing options along
with a large number of final products are available. The following sections discuss processing
routes to final products that are currently known to be actively commercialised.
2.4.1 Diesel/jet by gasification + catalytic synthesis
Refuse derived fuel (RDF) is gasified to yield syngas as intermediate product, which is
processed into diesel and jet using variations of the GtL process described in section 2.1.5.
Case study companies:
Fulcrum Bioenergy (USA)
o TRL 6-7. Mixed waste stream processing plant (phase 1) is operational in
Nevada.
o Phase 2 of the biorefinery, comprising gasification and FT units, is expected to
begin operations in 2020.
o Target capacity: 175,000 t/year of MSW processed into 40 ML/year of FT liquid
Velocys / British Airways (UK)
o TRL 6-7. Project with British Airways, Suez & others to gasify & produce jet fuel
by FT synthesis. Stimulated by inclusion of jet within the RTFO development
fuel sub-target. Investment decision to be taken in 2019.
o GreenSky project was originally developed by British Airways with Solena to
use an old oil refining site at Thurrock, Essex to process MSW via gasification
http://www.zerowastescotland.org.uk/sites/default/files/Plastics%20to%20Oil%20Report.pdf (Accessed on 20th October 2017)
Final Report
17
and FT to jet fuel, but was aborted at the end of 2015 due to financing
difficulties, and Solena went into liquidation.21
2.4.2 SNG via gasification + catalytic synthesis
In this process RDF is gasified and then tars are removed, followed by several further cleaning
and conditioning steps to produce a clean syngas. The syngas can be converted to synthetic
natural gas by a catalytic methanation process.
Levelised cost of SNG production in a first-of-a-kind commercial-scale gasification facility
processing MSW are estimated to be £50/MWh, with potential to fall to £21/MWh with capex
reductions, improved operations, reduced hurdle rate and increased scale that are likely to
come from increased deployment of the technology. These costs refer to the combined
biological and fossil portion of the SNG.22
Case study companies:
Advanced Plasma Power (UK)
o TRL 6. The main focus is currently on producing bioSNG from syngas. Syngas is
converted to SNG via catalytic water-gas-shift and methanation, followed by
CO2 removal (and addition of some propane) before injection into the gas grid.
o Pilot plant in Swindon has been running different feedstocks for a number of
years. 2.7 MW demonstration plant under construction with DfT and Cadent
funding, processing 10,000 t/year of waste. Biogenic SNG is supported under
development fuel RTFO sub-target.
2.4.3 Methanol by gasification + catalytic synthesis
In this process, wastes are gasified to produce syngas, which is then cleaned and converted to
methanol and/or ethanol via catalytic synthesis. The process used is the same as that outlined
in section 2.1.6 for the production of methanol from natural gas-derived syngas, but the
process is more challenging due to the high level of impurities in syngas from wastes.
Case study companies:
Enerkem (Canada/Netherlands)
o TRL 7-8. Operating first commercial plant in Alberta processing >100,000
t/year of RDF, and a pilot and a demonstration facility in Westbury. Recently
added back-end methanol to ethanol conversion step.
o Developing a project at Cleantech Delta in Rotterdam in partnership with
AkzoNobel
21 Neslen, A. (2016) BA blames UK government for scrapping of GBP 340m green fuels project. The Guardian. Available from https://www.theguardian.com/environment/2016/jan/06/ba-blames-uk-government-for-scrapping-of-340m-green-fuels-project (Accessed 23rd October 2017) 22 GoGreenGas (2017) BioSNG Demonstration Plant Summary of Commercial Results, Available from: http://gogreengas.com/wp-content/uploads/2015/11/P167-BioSNG-Commercial.pdf, Accessed on 20th October 2017
Final Report
18
2.4.4 Ethanol by gasification + microbial fermentation
Waste gasification produces syngas, which is then cleaned and fermented using microbes
developed for this purpose.
Case study companies:
LanzaTech
o TRL 5. Pilot plant installed at MSW gasification site
2.4.5 Hydrogen by gasification + water-gas-shift reaction
Waste gasification produces syngas, which can then be processed using the water-gas-shift
reaction into hydrogen. The syngas-to-hydrogen step is analogous to that used in the
production of hydrogen from methane, which is globally practiced at commercial scale (section
2.1.7). However there is little experience worldwide with waste gasification to hydrogen,
which remains at TRL 5.
Case study companies:
Powerhouse Energy (UK)
o TRL 6/7 for electricity generation from syngas, TRL 5 for catalytic conversion of
syngas to transport fuels
o Developing a waste-to-hydrogen facility, targeting hydrogen use in the
transport sector.23
2.5 Fuels produced from gasification of waste fossil liquids
Waste fossil liquids encompass a range of possible feedstocks, including waste lubricant oils,
coal slurry, petroleum sludge and waste solvents.
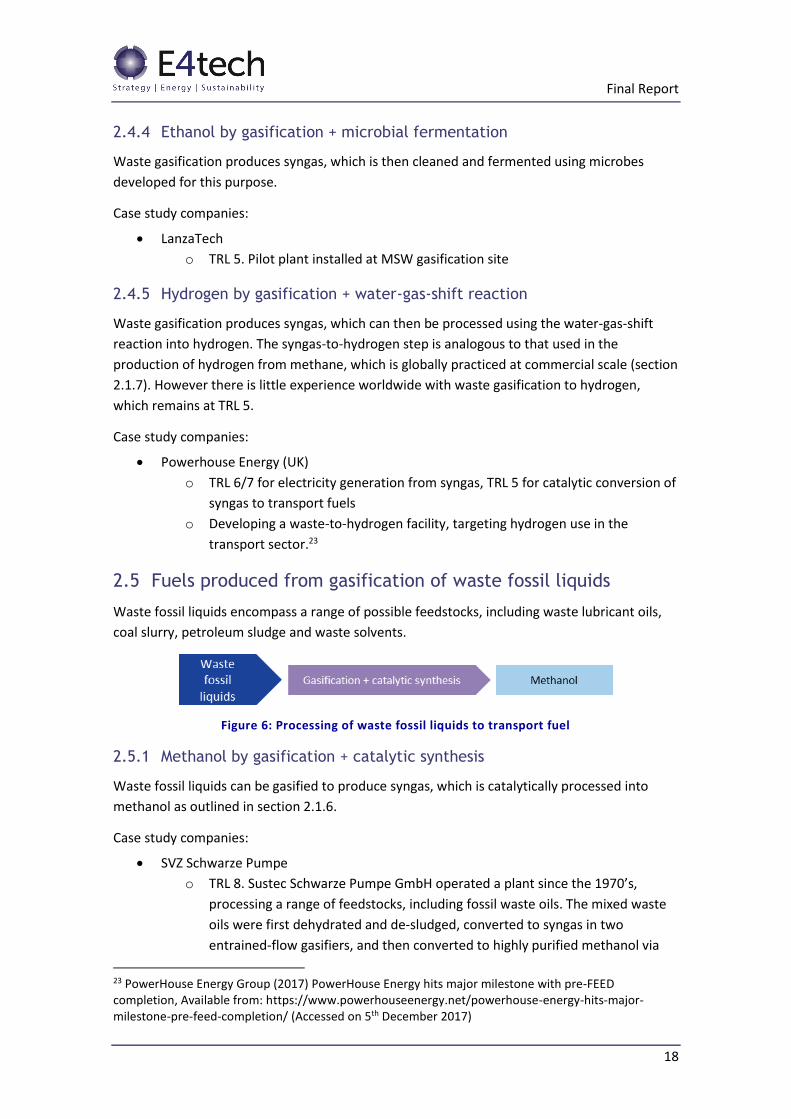
Figure 6: Processing of waste fossil liquids to transport fuel
2.5.1 Methanol by gasification + catalytic synthesis
Waste fossil liquids can be gasified to produce syngas, which is catalytically processed into
methanol as outlined in section 2.1.6.
Case study companies:
SVZ Schwarze Pumpe
o TRL 8. Sustec Schwarze Pumpe GmbH operated a plant since the 1970’s,
processing a range of feedstocks, including fossil waste oils. The mixed waste
oils were first dehydrated and de-sludged, converted to syngas in two
entrained-flow gasifiers, and then converted to highly purified methanol via
23 PowerHouse Energy Group (2017) PowerHouse Energy hits major milestone with pre-FEED completion, Available from: https://www.powerhouseenergy.net/powerhouse-energy-hits-major-milestone-pre-feed-completion/ (Accessed on 5th December 2017)
Final Report
19
methanol synthesis and distillation. The plant never became economically
viable.
o The company went into administration in 2010. Many of the peripheral
systems necessary for the process have since been dismantled.
2.6 Fuels produced from industrial gas containing fossil CO
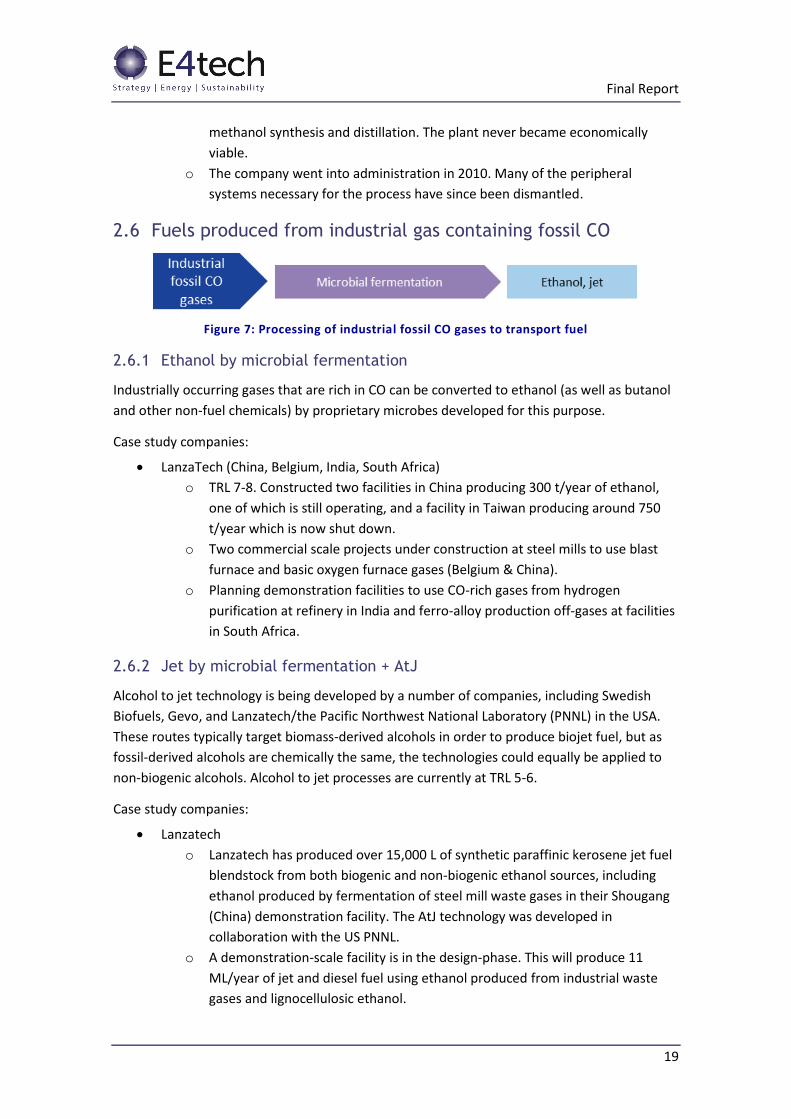
Figure 7: Processing of industrial fossil CO gases to transport fuel
2.6.1 Ethanol by microbial fermentation
Industrially occurring gases that are rich in CO can be converted to ethanol (as well as butanol
and other non-fuel chemicals) by proprietary microbes developed for this purpose.
Case study companies:
LanzaTech (China, Belgium, India, South Africa)
o TRL 7-8. Constructed two facilities in China producing 300 t/year of ethanol,
one of which is still operating, and a facility in Taiwan producing around 750
t/year which is now shut down.
o Two commercial scale projects under construction at steel mills to use blast
furnace and basic oxygen furnace gases (Belgium & China).
o Planning demonstration facilities to use CO-rich gases from hydrogen
purification at refinery in India and ferro-alloy production off-gases at facilities
in South Africa.
2.6.2 Jet by microbial fermentation + AtJ
Alcohol to jet technology is being developed by a number of companies, including Swedish
Biofuels, Gevo, and Lanzatech/the Pacific Northwest National Laboratory (PNNL) in the USA.
These routes typically target biomass-derived alcohols in order to produce biojet fuel, but as
fossil-derived alcohols are chemically the same, the technologies could equally be applied to
non-biogenic alcohols. Alcohol to jet processes are currently at TRL 5-6.
Case study companies:
Lanzatech
o Lanzatech has produced over 15,000 L of synthetic paraffinic kerosene jet fuel
blendstock from both biogenic and non-biogenic ethanol sources, including
ethanol produced by fermentation of steel mill waste gases in their Shougang
(China) demonstration facility. The AtJ technology was developed in
collaboration with the US PNNL.
o A demonstration-scale facility is in the design-phase. This will produce 11
ML/year of jet and diesel fuel using ethanol produced from industrial waste
gases and lignocellulosic ethanol.
Final Report
20
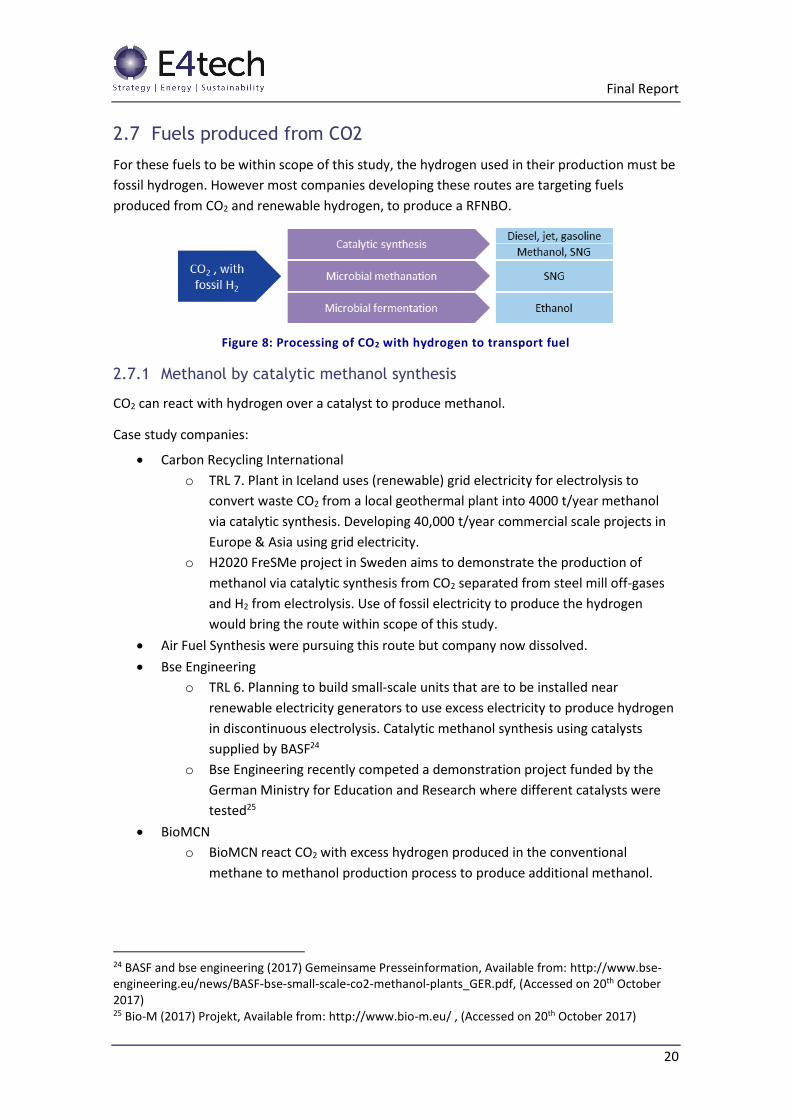
2.7 Fuels produced from CO2
For these fuels to be within scope of this study, the hydrogen used in their production must be
fossil hydrogen. However most companies developing these routes are targeting fuels
produced from CO2 and renewable hydrogen, to produce a RFNBO.
Figure 8: Processing of CO2 with hydrogen to transport fuel
2.7.1 Methanol by catalytic methanol synthesis
CO2 can react with hydrogen over a catalyst to produce methanol.
Case study companies:
Carbon Recycling International
o TRL 7. Plant in Iceland uses (renewable) grid electricity for electrolysis to
convert waste CO2 from a local geothermal plant into 4000 t/year methanol
via catalytic synthesis. Developing 40,000 t/year commercial scale projects in
Europe & Asia using grid electricity.
o H2020 FreSMe project in Sweden aims to demonstrate the production of
methanol via catalytic synthesis from CO2 separated from steel mill off-gases
and H2 from electrolysis. Use of fossil electricity to produce the hydrogen
would bring the route within scope of this study.
Air Fuel Synthesis were pursuing this route but company now dissolved.
Bse Engineering
o TRL 6. Planning to build small-scale units that are to be installed near
renewable electricity generators to use excess electricity to produce hydrogen
in discontinuous electrolysis. Catalytic methanol synthesis using catalysts
supplied by BASF24
o Bse Engineering recently competed a demonstration project funded by the
German Ministry for Education and Research where different catalysts were
tested25
BioMCN
o BioMCN react CO2 with excess hydrogen produced in the conventional
methane to methanol production process to produce additional methanol.
24 BASF and bse engineering (2017) Gemeinsame Presseinformation, Available from: http://www.bse-engineering.eu/news/BASF-bse-small-scale-co2-methanol-plants_GER.pdf, (Accessed on 20th October 2017) 25 Bio-M (2017) Projekt, Available from: http://www.bio-m.eu/ , (Accessed on 20th October 2017)
Final Report
21
2.7.2 Diesel by catalytic synthesis
Reaction of CO2 with hydrogen over a catalyst can produce hydrocarbons, which can be refined
into a diesel fuel.
Case study companies:
Sunfire:
o TRL 6. Pilot plant in partnership with Audi in Germany. Producing small
quantities of liquid hydrocarbon (which is refined to diesel) via catalytic
synthesis of H2 that is produced by high temperature electrolysis, and CO2
obtained from a biogas plant. Also known as power to liquids.
Carbon Engineering:
o TRL 5-6. Capture CO2 from the air and react it with hydrogen to generate first
syngas and then hydrocarbons, with a focus on diesel and jet fuel. Currently
aiming to produce RFNBO fuel by using renewable electricity to produce
hydrogen via electrolysis. Use of non-renewable electricity would bring it
within scope of this study
o Claim that when scaled up this process can produce fuels for less than $1/L26
2.7.3 SNG by catalytic synthesis
Reaction of CO2 with hydrogen over a catalyst can produce SNG.
Case study companies:
Hitachi Zosen Inova Etogas GmbH
o TRL 6-7. Developed Audi e-gas in collaboration with Audi in Germany,
demonstration plant went online 2013, currently delivering 300 m3/hour SNG
to the gas grid.
o Another SNG pilot plant online at HBFZ research centre in Germany, delivering
4 m3/hour to the gas grid
o A few other small research initiatives in Germany.
2.7.4 SNG by biological synthesis (microbial methanation)
Microorganisms can process CO2 and hydrogen into methane in a process called microbial
methanation.
Case study companies:
Viessman Group and Audi
o TRL 5-6. Developed SNG production via biological/microbial methanation, first
sizeable pilot plant of its kind started injecting 15-55 m3/hour SNG into the gas
grid in Germany in 2015.
o Smaller research plant went online in 2012 with 5 m3/hour
26 Carbon Engineering (2017) Air to Fuels, Available from: http://carbonengineering.com/about-a2f/ (Accessed on 5th December 2017)
Final Report
22
2.8 Hydrogen
Hydrogen can be produced from a range of sources: biomass, fossil fuels, fossil wastes and
directly from electricity. Hydrogen produced from fossil electricity, and hydrogen produced
from fossil fuels such as natural gas are both within scope of this report.
2.8.1 Hydrogen from fossil electricity
Hydrogen production from electricity via electrolysis is at TRL 9. However, given the high cost
of hydrogen production from electrolysis and the poor GHG performance of transforming fossil
based electricity into hydrogen, strong (policy) drivers targeting air quality may be needed for
producers to target this in particular. If hydrogen is produced from grid electricity then a
portion of that hydrogen is likely to be produced from fossil electricity.
2.8.2 Hydrogen as a by-product of industrial processes
In some industrial processes hydrogen can be produced in excess as a by-product of the
process. Hydrogen production by this method is at TRL 9. One notable example of this is in the
chlor-alkali process. In the majority of plants the hydrogen is captured and used as a chemical
feedstock or for provision of heat and/or power to the plant27, but it has been estimated that
216,000 t/year (equivalent to 15% of the global chlor-alkali hydrogen production) is vented.28
3 Sustainability assessment framework
3.1 Summary of sustainability risks and sustainability assessment framework
For the low carbon fuel chains described in the technology landscape (section 2) to be
supported through policy, it needs to be ascertained whether they pose any sustainability
risks. This section identifies key sustainability risks and proposes a framework for assessing
whether fuels pose a risk.
The key sustainability risks are:
1. Production and use of the fuel causes non-GHG environmental impacts, including
air pollution and other local environmental impacts
2. Use of a waste feedstock will increase production of that waste (if the feedstock is
a waste)
3. Other viable options for using the feedstock are higher up in the waste hierarchy
(if the feedstock is a waste)
4. Production and use of the fuel will lead to increased lifecycle GHG emissions
27 Euro Chlor (2010) The European Chlor-Alkali industry: an electricity intensive sector exposed to carbon leakage, Available from: http://www.eurochlor.org/media/9385/3-2-the_european_chlor-alkali_industry_-_an_electricity_intensive_sector_exposed_to_carbon_leakage.pdf (Accessed on 16th October 2017) 28 Cox, R. (2011) for Fuel Cell and Hydrogen Energy Association, Waste / Byproduct hydrogen, available from: https://energy.gov/sites/prod/files/2014/03/f12/waste_cox.pdf (Accessed on 16th October 2017)

Final Report
23
5. Production of these fuels will support increased production and use of fossil fuels
Figure 9 proposes a framework that can be used by DfT to evaluate the sustainability of a low
carbon fossil fuel. A series of questions (shaded in dark blue and numbered 1 – 5) aim to assess
whether a fuel poses any of the five sustainability risks identified above. The final question is
not solely a sustainability question: the GHG saving threshold adopted for each fuel type is
likely to be influenced by DfT policy priorities and the GHG methodology used for that fuel
type.
Whether a fuel is considered sustainable is usually specific to a given production process, and
even in some cases to a given consignment of feedstock. Therefore while a summary of the
risk across different fuel chains is given for each sustainability risk (section 3.3 to 3.8), for each
question a recommendation is given as to the level of detail that would be required for the
assessment of the sustainability of a particular fuel were LCFFs to be supported by DfT.
The questions in Figure 9 that are shaded purple classify the fuels in order to target
appropriate sustainability assessment questions, and to define the appropriate GHG
calculation methodology to use.
Figure 9: Sustainability assessment and support decision tree for low carbon fossil fuels
In the following sections 3.3 to 3.8 each of the key sustainability risks is examined in turn. Each
risk is explained, and identified as most relevant to the feedstock, the fuel production process,
or the final fuel. The severity and likelihood of this risk materialising for the relevant part of
each fuel chain is summarised in a table (criteria on which these are assessed are given in
Appendix B), and additional explanation relating to specific feedstocks or fuels is given in the

Final Report
24
Appendices. Finally for each risk we explore in more detail how DfT can assess the relevant
question 1 to 5 of the sustainability framework above in order to support truly sustainable
fuels.
3.2 Defining LCFFs
The purple boxes in the sustainability assessment framework split fuels into three different
categories: those for which the feedstock contains no energy, those which are made from
waste feedstocks, and those which are made from non-waste feedstocks.
Feedstock is here defined as an input to the fuel production process which provides atoms to
the final fuel. For example: natural gas which is reformed into methanol is a feedstock, plastic
which is pyrolysed to make diesel is a feedstock, and water which is split by electrolysis to
make hydrogen is a feedstock. Natural gas which is combusted to provide process heat and
water used for cooling are not feedstocks.
3.2.1 Does the feedstock contain any energy?
This should be assessed on the basis of the lower heating value (LHV) of the dry feedstock, and
is the same criteria as currently proposed for differentiating between RFNBOs, for which the
answer to this question would be ‘no’, and biofuels, for which the answer would be ‘yes’. Both
CO2 and water contain no energy, so when the atoms in a fuel come only from these sources,
question 2b is answered ‘no’. For consistency with existing RTFO policy, the treatment of these
fuels should parallel RFNBO policy. For example the existing methodology for determining the
renewable fraction of a partial RFNBO, which states that the renewability of the products is
determined based on the percentage of all the energy inputs to the process that are
renewable29, should also be applied to determining the fossil portion of a partial RFNBO.
If any of the energy content of the fuel comes from the atoms of the feedstock then the
answer to this question must be ‘yes’. For example if a microorganism processes both CO and
CO2 from an industrial waste gas stream then the answer to the above question is ‘yes’. This
currently follows the same principle as the definition between RFNBOs and biofuels, but
should that change then this LCFF classification method should also be reviewed.
3.2.2 Is the feedstock a waste?
The Waste Framework Directive (WFD)30 identifies a feedstock as a waste if the holder
‘discards or intends to discard’ the material, and this criteria should be applied in the
assessment of this question. . The UK guidance clarifies that discarding covers activities and
operations such as recycling and recovery options, as well as disposal or incineration, so that
even material that is intended to be recycled is by this definition a waste. The following
feedstocks are likely to be considered as wastes, though each feedstock should be assessed
individually:
29 Excluding biomass-derived energy, see the Draft RTFO Year 11 Process Guidance, Part 1. 30 Directive 2008/98/EC of the European Parliament and of the Council of 19 November 2008 on waste and repealing certain Directives (Text with EEA relevance), available from: http://eur-lex.europa.eu/legal-content/EN/TXT/?uri=CELEX:32008L0098
Final Report
25
Industrial off-gases
Waste fossil plastic / rubber
Mixed municipal and commercial and industrial waste
Associated natural gas that is otherwise flared or vented
Waste fossil liquid
Note that the aim of this question is not to assess whether use of this waste is sustainable, but
simply to determine whether further criteria concerning waste sustainability should be applied
to this feedstock.
DfT already operates a process for assessing whether biomass feedstocks are wastes, which
was reviewed by DfT and E4tech in December 2016. A similar process could also be used for
assessing fossil feedstocks.
3.3 Production and use of the fuel will cause non-GHG environmental impacts
3.3.1 Risk description
3.3.1.1 Air pollution
This sustainability risk applies to the final fuel. Air pollution from especially older diesel and
gasoline engines currently cause significant environmental and human health impacts across
the UK. The likelihood of a given fuel increasing local air pollutants depends primarily on:
1. Emissions regulation - What emissions regulation is in place for the sector concerned?
2. Fuel standards - Does the end fuel (either pure or blended) comply with a European
Committee for Standardisation (CEN) standard or is at least classed as a reference fuel
for compliance testing?
3. Vehicle technology - Will the fuel be used in new vehicles or into existing fleets with
no or some (retrofit) modification?
If this risk was to occur the impact is judged to be severe.
Emission regulation:
Emission limits on new land based vehicles and machinery have become increasingly stringent
over the last 20 years, which has led to automotive manufacturers bringing increasingly
complex after-treatment technologies to market in order to meet these limits. Some fuel
standards have had to be updated (for example lead and sulfur reduction) in order to meet
these regulations.
However, emissions regulations in shipping and especially aerospace are less stringent than for
land-based vehicles. Bringing a new fuel to market in sectors with less emission regulation can
pose a risk of increased levels of pollutant emissions, but could also represent an opportunity
to reduce emissions compared to current levels.
Fuel standards
Final Report
26
The CEN standards and reference fuel standards are the two main fuel standards for road
transport fuels that apply in the EU.. CEN standards apply to most commercially available fuels
and are set by national standards organisations in conjunction with stakeholders in the supply
and demand sectors. The reference fuel standard is typically developed ahead of the full CEN
standard, and is mostly used for new vehicle compliance testing. Fuel standards in this report
refer to the end-fuel, not the individual component – for example ethanol can be blended into
gasoline to meet the EN228 gasoline standard even though ethanol for blending has a separate
standard.
Standards aim to ensure that both the fuel infrastructure and the vehicles operate safely and
as intended, including the functioning of the engine and the exhaust after-treatment systems.
Within Europe, manufacturers must ensure that all new vehicles meet regulated pollutant
limits using the reference standard fuels. These reference standards are a slightly narrower
specification fuel than the fuel for sale at forecourts across the EU which is covered by the CEN
standard. Fuels which only have a reference standard but not a CEN standard (e.g. ED95, a fuel
containing 95% ethanol and 5% ignition enhancer for use in adapted compression ignition
engines) can only be used in a captive fleet and new vehicles designed to run on these fuels,
but must still meet legal emissions requirements. New vehicles designed for fuels which do not
have a standard cannot be demonstrated to meet the emission limits and can therefore not
legally be sold in the EU. Vehicles already in the fleet might be tolerant of a new fuel, but
might see different levels of pollutant emissions compared to the existing fuel.
Therefore a new fuel that complies with an existing CEN or reference fuel standard will have a
lower risk profile compared to a non-standardised fuel.
Standards exist for aviation fuel, but to-date these have mostly focussed on performance
characteristics rather than emissions control.31 No global standards apply to ocean going
shipping fuel, although limits on marine fuel sulfur content will be introduced by the
International Maritime Organisation from 2020.
Vehicle technology of fuel end-user
The introduction of stricter emission legislation in recent years has led to the introduction of
novel engine and after-treatment technology. Vehicles and machinery tend to remain in
operation for a considerable time ranging from between 10 years for passenger vehicles to 40
years for ships and aircraft. Therefore the sector-specific UK fleet consists of a mix of different
technologies that are implemented in different ways for each product model.
New fuels supplied into the market can be used in three broad ways in the vehicle fleet:
1. Used in new vehicles
2. Used in vehicles in the existing fleet with no modifications
3. Used in vehicles with retro-fit technology
31 Kapadia, Z. Z., Spracklen, D. V., Arnold, S. R., Borman, D. J., Mann, G. W., Pringle, K. J., Monks, S. A., Reddington, C. L., Benduhn, F., Rap, A., Scott, C. E., Butt, E. W., and Yoshioka, M.: Impacts of aviation fuel sulfur content on climate and human health, Atmos. Chem. Phys., 16, 10521-10541, https://doi.org/10.5194/acp-16-10521-2016, 2016
Final Report
27
The risk profile follows the list above:
Bringing a new fuel into the market alongside new vehicles will mean that, as long as the
new fuel has a standard, those new vehicles will have to meet legal emissions regulations
(when the vehicle is first introduced into the market) with the fuel, therefore the
manufacturer has largely eliminated the risk.
Using a new fuel in the existing fleet has a fairly low risk as long as the fuel meets existing
fuel standards. Whilst the existing fleet may have lower emissions standards than new
cars, use of a new fuel in that fleet, as long as it meets existing fuel standards, is unlikely to
increase emissions compared to the existing fleet running on conventional fuel of the
same standard.
Bringing a new fuel into the market for use in vehicles with retrofit technology has a larger
risk as these vehicles and technology do not have to undergo the rigorous compliance
testing required for new vehicles. The recently-introduced Clean Vehicle Retrofit
Accreditation Scheme32, which verifies that vehicles with retrofit technologies comply with
the emissions levels required for Clean Air Zones, mitigates this risk, but only for vehicles
which choose to take part in the scheme.
3.3.1.2 Non-GHG environmental impacts of fuel production
The risk of causing local environmental impacts, such as toxic or hazardous emissions or by-
products, and high water consumption in water-stressed areas, is applicable to all production
processes for potential low-carbon fossil fuels. The extraction of primary fossil fuel feedstocks
can also cause severe local environmental impacts. In general, processes for the production of
low-carbon fossil fuels are not anticipated to pose a more severe risk of local pollution than
other industrial processes, so this risk category is judged to be moderately severe for these
fuel routes.
It should be noted that currently DfT does not require biofuels to meet sustainability criteria
regarding local environmental pollution in order to obtain Renewable Transport Fuel
Certificates (RTFCs).
3.3.2 Summary of risk across different fuel chains
3.3.2.1 Air pollution
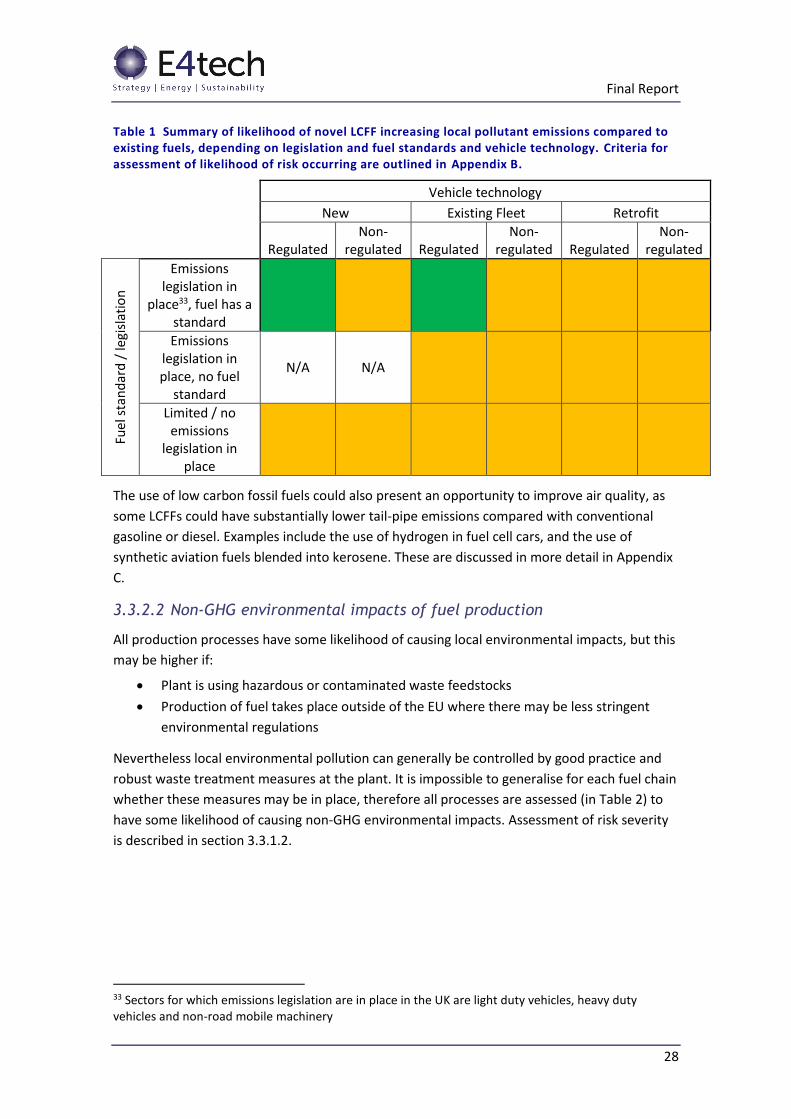
Table 1 summarises the likelihood of fuel types increasing local air pollutant emissions
compared to conventional gasoline or diesel. The severity if any of these did occur is severe.
Each individual fuel may fit into one or more of these categories (e.g. ethanol is supplied under
CEN standard EN228 and is regularly used in both new and existing fleet vehicles), and may fit
into different categories depending on the blend in which it is supplied to the market. For each
fuel type the standards in place and vehicle technologies in which they are commonly
deployed are discussed in Appendix C.
32 Low CVP (2018) Clean Vehicle Retrofit Accreditation Scheme, Available from: http://www.lowcvp.org.uk/projects/joint-working-projects/clean-vehicle-retrofit-accreditation-scheme.htm (Accessed on 22nd January 2018)
Final Report
28
Table 1 Summary of likelihood of novel LCFF increasing local pollutant emissions compared to existing fuels, depending on legislation and fuel standards and vehicle technology. Criteria for assessment of likelihood of risk occurring are outlined in Appendix B.
Vehicle technology
New Existing Fleet Retrofit
Regulated Non-
regulated Regulated Non-
regulated Regulated Non-
regulated
Fuel
sta
nd
ard
/ le
gisl
atio
n
Emissions legislation in
place33, fuel has a standard
Emissions legislation in place, no fuel
standard
N/A N/A
Limited / no emissions
legislation in place
The use of low carbon fossil fuels could also present an opportunity to improve air quality, as
some LCFFs could have substantially lower tail-pipe emissions compared with conventional
gasoline or diesel. Examples include the use of hydrogen in fuel cell cars, and the use of
synthetic aviation fuels blended into kerosene. These are discussed in more detail in Appendix
C.
3.3.2.2 Non-GHG environmental impacts of fuel production
All production processes have some likelihood of causing local environmental impacts, but this
may be higher if:
Plant is using hazardous or contaminated waste feedstocks
Production of fuel takes place outside of the EU where there may be less stringent
environmental regulations
Nevertheless local environmental pollution can generally be controlled by good practice and
robust waste treatment measures at the plant. It is impossible to generalise for each fuel chain
whether these measures may be in place, therefore all processes are assessed (in Table 2) to
have some likelihood of causing non-GHG environmental impacts. Assessment of risk severity
is described in section 3.3.1.2.
33 Sectors for which emissions legislation are in place in the UK are light duty vehicles, heavy duty vehicles and non-road mobile machinery
Final Report
29
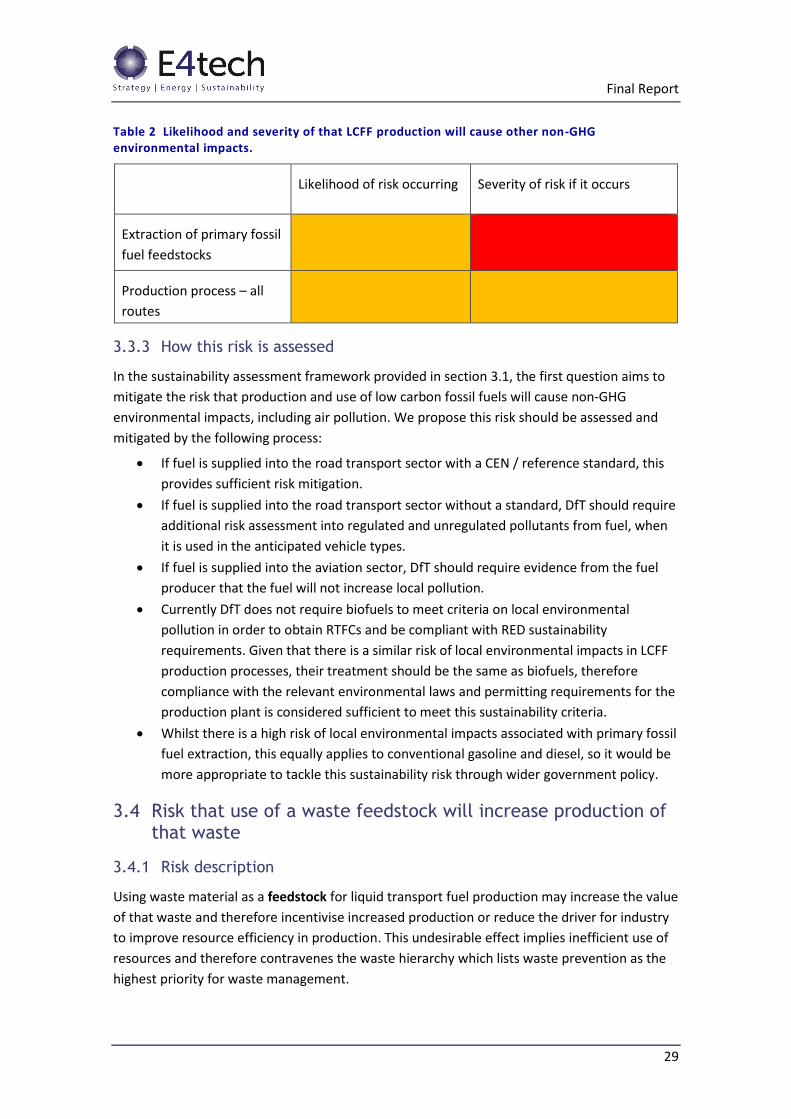
Table 2 Likelihood and severity of that LCFF production will cause other non-GHG environmental impacts.
Likelihood of risk occurring Severity of risk if it occurs
Extraction of primary fossil
fuel feedstocks
Production process – all
routes
3.3.3 How this risk is assessed
In the sustainability assessment framework provided in section 3.1, the first question aims to
mitigate the risk that production and use of low carbon fossil fuels will cause non-GHG
environmental impacts, including air pollution. We propose this risk should be assessed and
mitigated by the following process:
If fuel is supplied into the road transport sector with a CEN / reference standard, this
provides sufficient risk mitigation.
If fuel is supplied into the road transport sector without a standard, DfT should require
additional risk assessment into regulated and unregulated pollutants from fuel, when
it is used in the anticipated vehicle types.
If fuel is supplied into the aviation sector, DfT should require evidence from the fuel
producer that the fuel will not increase local pollution.
Currently DfT does not require biofuels to meet criteria on local environmental
pollution in order to obtain RTFCs and be compliant with RED sustainability
requirements. Given that there is a similar risk of local environmental impacts in LCFF
production processes, their treatment should be the same as biofuels, therefore
compliance with the relevant environmental laws and permitting requirements for the
production plant is considered sufficient to meet this sustainability criteria.
Whilst there is a high risk of local environmental impacts associated with primary fossil
fuel extraction, this equally applies to conventional gasoline and diesel, so it would be
more appropriate to tackle this sustainability risk through wider government policy.
3.4 Risk that use of a waste feedstock will increase production of that waste
3.4.1 Risk description
Using waste material as a feedstock for liquid transport fuel production may increase the value
of that waste and therefore incentivise increased production or reduce the driver for industry
to improve resource efficiency in production. This undesirable effect implies inefficient use of
resources and therefore contravenes the waste hierarchy which lists waste prevention as the
highest priority for waste management.
Final Report
30
This risk is considered severe if it occurs, given existing UK legislation implementing the waste
hierarchy.
3.4.2 Summary of risk across different fuel chains
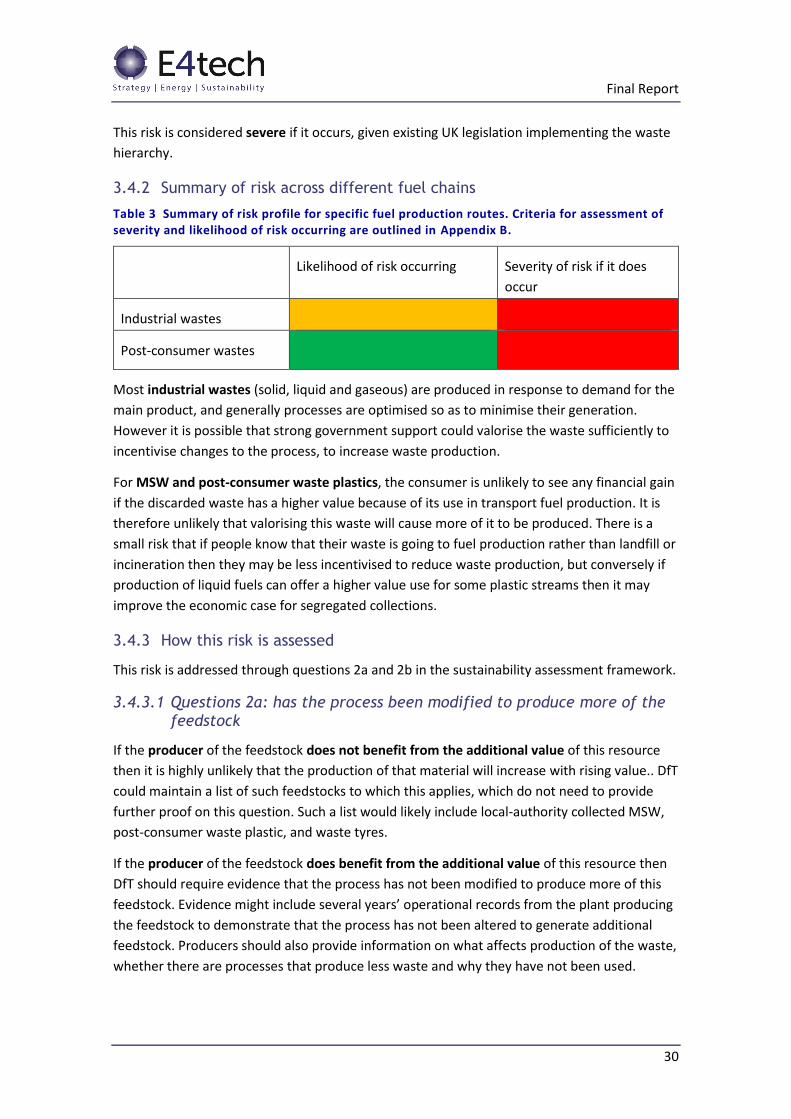
Table 3 Summary of risk profile for specific fuel production routes. Criteria for assessment of severity and likelihood of risk occurring are outlined in Appendix B.
Likelihood of risk occurring Severity of risk if it does
occur
Industrial wastes
Post-consumer wastes
Most industrial wastes (solid, liquid and gaseous) are produced in response to demand for the
main product, and generally processes are optimised so as to minimise their generation.
However it is possible that strong government support could valorise the waste sufficiently to
incentivise changes to the process, to increase waste production.
For MSW and post-consumer waste plastics, the consumer is unlikely to see any financial gain
if the discarded waste has a higher value because of its use in transport fuel production. It is
therefore unlikely that valorising this waste will cause more of it to be produced. There is a
small risk that if people know that their waste is going to fuel production rather than landfill or
incineration then they may be less incentivised to reduce waste production, but conversely if
production of liquid fuels can offer a higher value use for some plastic streams then it may
improve the economic case for segregated collections.
3.4.3 How this risk is assessed
This risk is addressed through questions 2a and 2b in the sustainability assessment framework.
3.4.3.1 Questions 2a: has the process been modified to produce more of the feedstock
If the producer of the feedstock does not benefit from the additional value of this resource
then it is highly unlikely that the production of that material will increase with rising value.. DfT
could maintain a list of such feedstocks to which this applies, which do not need to provide
further proof on this question. Such a list would likely include local-authority collected MSW,
post-consumer waste plastic, and waste tyres.
If the producer of the feedstock does benefit from the additional value of this resource then
DfT should require evidence that the process has not been modified to produce more of this
feedstock. Evidence might include several years’ operational records from the plant producing
the feedstock to demonstrate that the process has not been altered to generate additional
feedstock. Producers should also provide information on what affects production of the waste,
whether there are processes that produce less waste and why they have not been used.
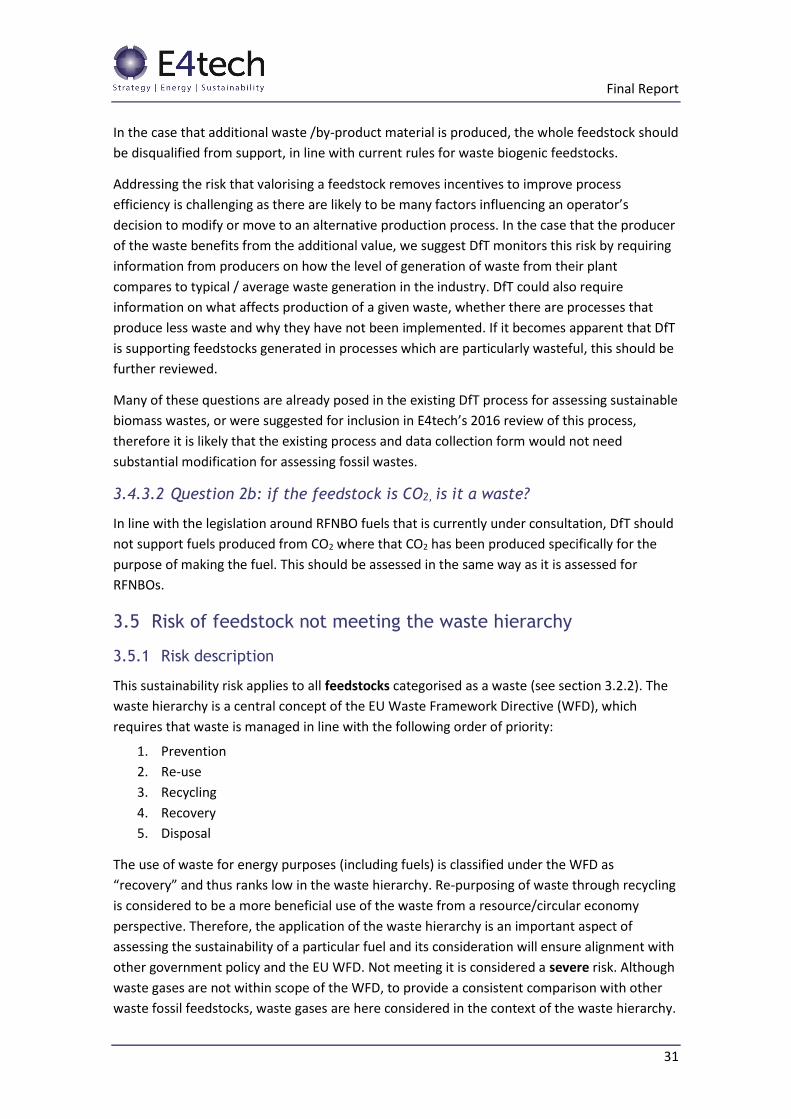
Final Report
31
In the case that additional waste /by-product material is produced, the whole feedstock should
be disqualified from support, in line with current rules for waste biogenic feedstocks.
Addressing the risk that valorising a feedstock removes incentives to improve process
efficiency is challenging as there are likely to be many factors influencing an operator’s
decision to modify or move to an alternative production process. In the case that the producer
of the waste benefits from the additional value, we suggest DfT monitors this risk by requiring
information from producers on how the level of generation of waste from their plant
compares to typical / average waste generation in the industry. DfT could also require
information on what affects production of a given waste, whether there are processes that
produce less waste and why they have not been implemented. If it becomes apparent that DfT
is supporting feedstocks generated in processes which are particularly wasteful, this should be
further reviewed.
Many of these questions are already posed in the existing DfT process for assessing sustainable
biomass wastes, or were suggested for inclusion in E4tech’s 2016 review of this process,
therefore it is likely that the existing process and data collection form would not need
substantial modification for assessing fossil wastes.
3.4.3.2 Question 2b: if the feedstock is CO2, is it a waste?
In line with the legislation around RFNBO fuels that is currently under consultation, DfT should
not support fuels produced from CO2 where that CO2 has been produced specifically for the
purpose of making the fuel. This should be assessed in the same way as it is assessed for
RFNBOs.
3.5 Risk of feedstock not meeting the waste hierarchy
3.5.1 Risk description
This sustainability risk applies to all feedstocks categorised as a waste (see section 3.2.2). The
waste hierarchy is a central concept of the EU Waste Framework Directive (WFD), which
requires that waste is managed in line with the following order of priority:
1. Prevention
2. Re-use
3. Recycling
4. Recovery
5. Disposal
The use of waste for energy purposes (including fuels) is classified under the WFD as
“recovery” and thus ranks low in the waste hierarchy. Re-purposing of waste through recycling
is considered to be a more beneficial use of the waste from a resource/circular economy
perspective. Therefore, the application of the waste hierarchy is an important aspect of
assessing the sustainability of a particular fuel and its consideration will ensure alignment with
other government policy and the EU WFD. Not meeting it is considered a severe risk. Although
waste gases are not within scope of the WFD, to provide a consistent comparison with other
waste fossil feedstocks, waste gases are here considered in the context of the waste hierarchy.
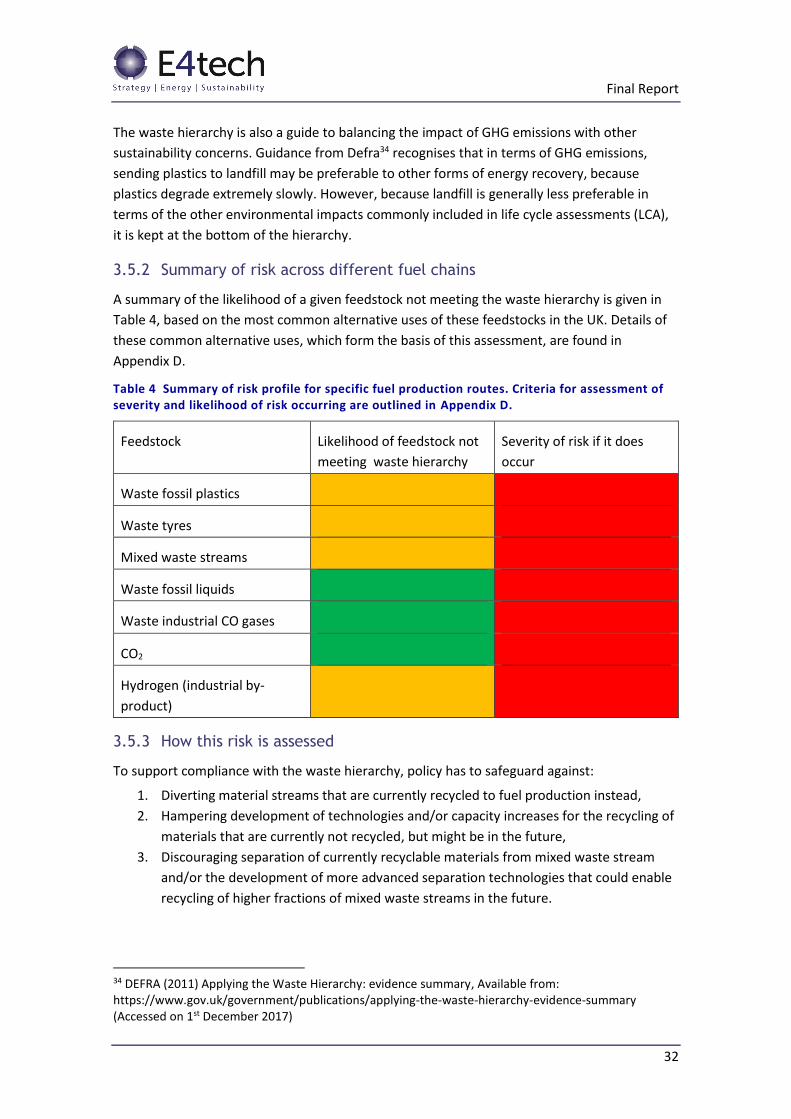
Final Report
32
The waste hierarchy is also a guide to balancing the impact of GHG emissions with other
sustainability concerns. Guidance from Defra34 recognises that in terms of GHG emissions,
sending plastics to landfill may be preferable to other forms of energy recovery, because
plastics degrade extremely slowly. However, because landfill is generally less preferable in
terms of the other environmental impacts commonly included in life cycle assessments (LCA),
it is kept at the bottom of the hierarchy.
3.5.2 Summary of risk across different fuel chains
A summary of the likelihood of a given feedstock not meeting the waste hierarchy is given in
Table 4, based on the most common alternative uses of these feedstocks in the UK. Details of
these common alternative uses, which form the basis of this assessment, are found in
Appendix D.
Table 4 Summary of risk profile for specific fuel production routes. Criteria for assessment of severity and likelihood of risk occurring are outlined in Appendix D.
Feedstock Likelihood of feedstock not
meeting waste hierarchy
Severity of risk if it does
occur
Waste fossil plastics
Waste tyres
Mixed waste streams
Waste fossil liquids
Waste industrial CO gases
CO2
Hydrogen (industrial by-
product)
3.5.3 How this risk is assessed
To support compliance with the waste hierarchy, policy has to safeguard against:
1. Diverting material streams that are currently recycled to fuel production instead,
2. Hampering development of technologies and/or capacity increases for the recycling of
materials that are currently not recycled, but might be in the future,
3. Discouraging separation of currently recyclable materials from mixed waste stream
and/or the development of more advanced separation technologies that could enable
recycling of higher fractions of mixed waste streams in the future.
34 DEFRA (2011) Applying the Waste Hierarchy: evidence summary, Available from: https://www.gov.uk/government/publications/applying-the-waste-hierarchy-evidence-summary (Accessed on 1st December 2017)
Final Report
33
This risk can be assessed by asking question 3 in the sustainability assessment framework:
“Can the feedstock be reused or recycled?”. However, answering this question is not trivial as
there are several reasons why a particular waste stream may not be able to be recycled:
- The feedstock cannot technically be recycled
- The feedstock is too mixed or contaminated for re-use/recycling, or
- Re-use/recycling facilities are not available, for example they do not have spare
capacity or are at a considerable distance from the source of the waste.
Only rarely do technical barriers preclude the recycling of a material – in some cases even
plastic films and thermosetting plastics can be re-used or recycled35,36 . However, the
application of a strict “technical feasibility criterion” would make very few materials eligible for
support, and could therefore miss an opportunity to divert some material from landfill or
reduce greenhouse gases.
Economics are an important driver for recycling, since producers of recycled materials
compete on the market with those produced from virgin (fossil) materials. The more advanced
processing technologies, sorting steps, feedstock cleaning processes or long transport
distances that are are involved in producing recycled materials, the higher the cost of
producing recycled material, and hence the more likely it is that waste streams are sent to
waste incineration or landfill instead.
An important policy dilemma is whilst withholding support for fuel production from a material
is unlikely to encourage recycling of this material today, incentivising fuel production from this
material may create a disincentive for recycling in the future, for example by reducing
investment into R&D of sorting or recycling technologies. Increased competition for resource
may result in transport fuel production undercutting other EfW facilities, and even recycling
facilities: it has been estimated that if all residual waste infrastructure committed in 2017 was
fully utilised then the maximum recycling rate achievable in 2030 would be only 63%.37
Support for liquid fuels produced from waste should therefore be developed in close
collaboration with waste management, recycling and circular economy policy to eliminate
undesirable unintended consequences from this support. Undercutting the economic case for
recycling is a key risk of supporting liquid fuel production from those feedstocks which could
otherwise be recycled, particularly those such as plastics for which there is a clear policy
objective to increase recycling rates.
In practice, the assessment of question 3 is likely to be very specific to each feedstock, and
may even vary within a given feedstock type depending on where the material was sourced,
35 Axion Consulting (2012) for Wrap, Film reprocessing technologies and collection schemes, Available from: http://www.wrap.org.uk/sites/files/wrap/Film%20reprocessing%20technologies%20and%20collection%20schemes.pdf 36 Recycled Plastic (n.d.) Thermoplastics vs. thermosetting plastics, Available from: http://www.recycledplastic.com/index.html%3Fp=10288.html (Accessed on 17th January 2018) 37 Eunomia (2017) Residual waste infrastructure review, Issue 12, Available from: http://www.eunomia.co.uk/reports-tools/residual-waste-infrastructure-review-12th-issue/ (Accessed on 5th December 2017)
Final Report
34
how contaminated it is etc. Therefore it is recommended that this assessment should occur on
a case-by-case basis for each feedstock in a given plant. Moreover, if substantial amounts of a
given feedstock are used for production of liquid transport fuels, DfT should review regularly
whether this creates a ‘market’ for residual waste which disincentivises recycling.
When a fuel production process can result in some material recovery, for example the
production of carbon black which can be recycled back into other products, or recovery of
metals from process residue, this should also be taken into account.
It is advisable to make a distinction between consignments from planned supply chains
(feedstock is produced on a continuous basis) vs “one-off” consignments (batches of a material
that cannot be reused or recycled for specific ad-hoc reasons, such as contamination). For
planned supply chains, fuel suppliers should provide information about the origin of the
feedstock, as well as verifiable information about the reasons that feedstock cannot be reused
or recycled.
Similar to the determination of “waste status” (section 3.2.2), DfT could collect information
through a questionnaire in a process similar to the current biomass wastes and residues
assessment process. Once approved, a supply chain should be re-tested periodically to ensure
that the conditions of its original application persist. For one-off consignments under a certain
size, it may be most effective to implement a fast-track questionnaire plus evidence approval
system to keep administrative efforts low, but maintain the rigour of the waste hierarchy.
3.6 Risk that production and use of fuel leads to increased lifecycle GHG emissions
3.6.1 Risk description
GHG emissions are affected mainly by the feedstock and the fuel production process. In
addition, the nature of the final fuel can influence its associated GHG emissions, either
because of potential fuel leakages such as CH4 emissions in the case of natural gas engines, or
because of the conversion efficiency of the engine, which differs for fuel cells and conventional
gasoline or diesel internal combustion engines.
Life cycle fuel GHG emissions comprise direct and indirect emissions. The direct emissions are
those directly associated with producing the fuel and feedstock, and the inputs required for
this. The indirect emissions are those not directly caused by the fuel production process, but
caused by a change in the wider economy when that fuel is produced, and include:
Increased GHG emissions caused by the use of alternative fuels or materials when
feedstocks are diverted away from existing uses
Increased release of CO2 emissions resulting from extraction of a particular feedstock,
for example if the use of CO2 from volcanic/geothermal vents accelerates the release
of CO2
Final Report
35
3.6.2 Methodology for assessing GHG emissions
In this study a methodology for assessing the GHG emissions from low carbon fossil fuels has
been developed, based on a review of existing methodologies, which is given in Appendix E.
The different nature of fuels produced from waste/by-product feedstocks, those which are
produced from feedstock extracted specifically for liquid fuel production, and those which are
produced from only CO2 or water means that different methodologies are appropriate for each
of these fuel types. These methodologies are given in sections 3.6.2.1 to 3.6.2.3.
3.6.2.1 For fuels produced from feedstock with zero energy content
Many RFNBO fuel production pathways can produce non-renewable fuels alongside the RFNBO
in the same production process, for example if an electrolyser uses grid electricity supplied by
electricity from both renewable and non-renewable sources.38 Therefore for consistency of
reporting, and to avoid loss or double-counting of emissions, the methodology adopted for
non-renewable fuels where the feedstock has no energy content should be the same as that
adopted for RFNBOs. A feedstock would here be defined as any substance which contributes
atoms to the final fuel. This definition would therefore include hydrogen produced by
electrolysis using fossil or biomass electricity, and methanol produced from CO2 and fossil or
biomass electricity.
We note that the current methodology allows fuels to be designated as part RFNBO, part fossil
fuel according to the ratio of renewable: non-renewable energy entering the process (RTFO
Year 11 draft Process Guidance Part 1). However the RFNBO and non-RFNBO portions of the
fuel are required to take the same GHG intensity value, where the emissions are calculated
based on all energy (both renewable and non-renewable) into the plant. This decision was
made as both the renewable and non-renewable portion share the same process energy input.
The result of this decision is that neither the renewable nor the non-renewable portion of part-
RFNBO fuels produced from UK grid electricity will be likely to make a 70% GHG emission
saving, so will not be supported under the RTFO. For example the GHG emissions of hydrogen
produced by electrolysis using UK grid electricity (emissions factor currently 72.8 gCO2eq./MJ)
will likely be around 41 gCO2eq./MJ (including a 0.4 efficiency factor for hydrogen used in fuel
cell engines) which does not provide a 70% GHG saving (see example calculations in Appendix
F).
3.6.2.2 For fuels produced from feedstock which was extracted specifically for this purpose
The GHG emissions of fuels produced from feedstocks which are not wastes or co-products
should be assessed using the methodology currently used in the FQD for default GHG values of
conventional fossil fuels.
Default values are provided in the FQD for many of the fuels considered in this study. These
default values must be used for reporting on the UK’s compliance with the 2020 FQD target
(actual value calculations are not allowed), and according to the current guidance under
38 The definition of a RFNBO excludes renewable electricity from biomass, so for the purposes of this discussion fuels produced from biomass electricity are included under the heading of non-renewable

Final Report
36
consultation, should be used within the UK’s GHG Mechanism for meeting this target. This
limits the LCFFs that can be rewarded within the GHG Mechanism to those fuels which
currently have a default value in the FQD legislation, or are in the process of acquiring one
through the JRC.
After 2020, DfT could allow fuel suppliers to use these default values if they wish, but could
also accept actual value calculations using the same methodology.39 This would allow a wider
range of fuels to be adopted, and would incentivise those fuel chains which do have default
values to make improvements to their process which reduce their overall GHG emissions.
3.6.2.3 For fuels produced from feedstocks not extracted specifically for this purpose
This category of fuels refers to those produced from wastes. LCA studies of wastes often take
as their functional unit 1 tonne of waste, and analyse the GHG emissions associated with
different ways of dealing with that waste. This is a useful comparison to carry out, particularly
for the purposes of designing waste-treatment policy, and could for example illustrate that one
waste treatment method saves CO2 compared with another waste treatment method.
However the purpose of this study is to develop a GHG methodology for assessing the GHG
emissions of the fuel produced from fossil wastes / by-products for comparison with other
transport fuels, and assess potential participation in the same market.
The system boundary can be drawn either starting after the collection of the feedstock, or can
also include the alternative use of the feedstock from which it was diverted.
Option A: System boundary after feedstock collection
Figure 10 System boundary, GHG methodology option A
In this approach, emissions accounting starts after the point of collection of the feedstock at
the first separation or processing stages. For waste fossil feedstocks, feedstock collection is
assumed to be required regardless of the their use, so is not included within scope of the fuel
GHG emissions. A key choice within this method is how to account for the embodied fossil
carbon within the feedstock:
1. Always assign it to the transport fuel
2. Assign it to the transport fuel only if that carbon would not otherwise have been
emitted to atmosphere.
3. Never assign it to the transport fuel
39 Some changes such as the use of exergy allocation instead of energy allocation, and a review of the credit for exported electricity might be appropriate, particularly if these factors are changed in the post-2020 biofuels methodology.

Final Report
37
These three options are compared in Table 5.
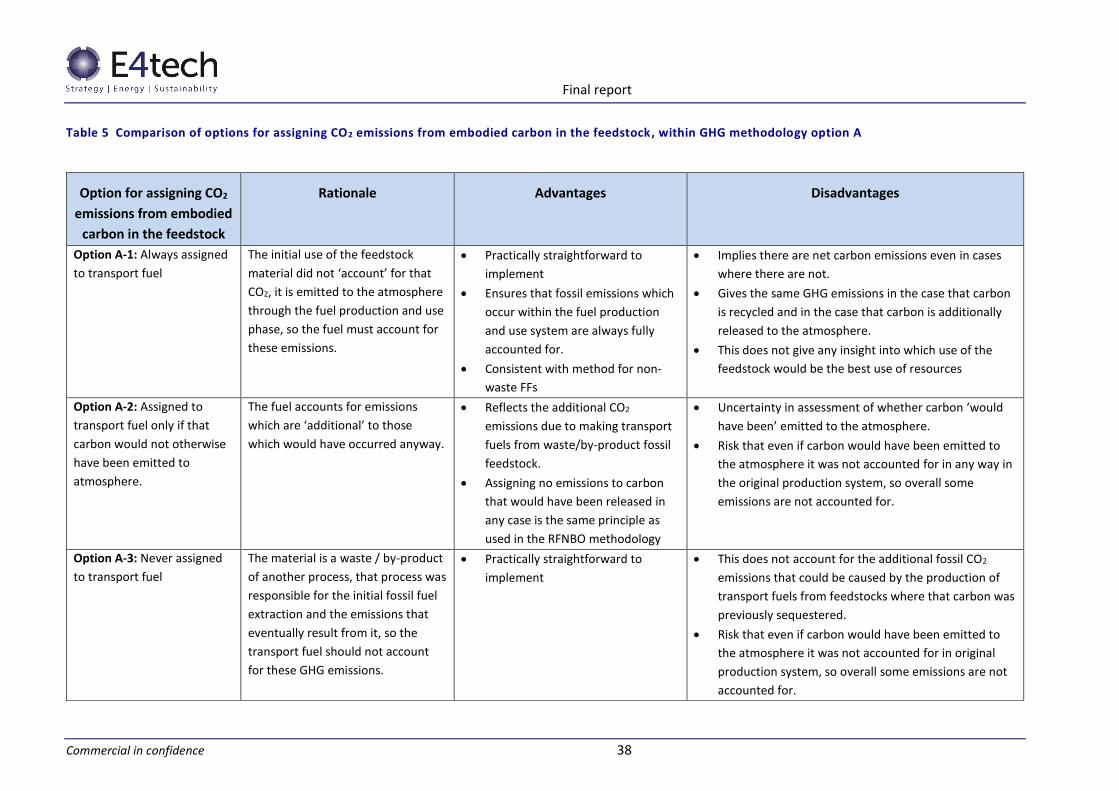
Final report
Commercial in confidence 38
Table 5 Comparison of options for assigning CO2 emissions from embodied carbon in the feedstock, within GHG methodology option A
Option for assigning CO2
emissions from embodied
carbon in the feedstock
Rationale Advantages Disadvantages
Option A-1: Always assigned
to transport fuel
The initial use of the feedstock
material did not ‘account’ for that
CO2, it is emitted to the atmosphere
through the fuel production and use
phase, so the fuel must account for
these emissions.
Practically straightforward to
implement
Ensures that fossil emissions which
occur within the fuel production
and use system are always fully
accounted for.
Consistent with method for non-
waste FFs
Implies there are net carbon emissions even in cases
where there are not.
Gives the same GHG emissions in the case that carbon
is recycled and in the case that carbon is additionally
released to the atmosphere.
This does not give any insight into which use of the
feedstock would be the best use of resources
Option A-2: Assigned to
transport fuel only if that
carbon would not otherwise
have been emitted to
atmosphere.
The fuel accounts for emissions
which are ‘additional’ to those
which would have occurred anyway.
Reflects the additional CO2
emissions due to making transport
fuels from waste/by-product fossil
feedstock.
Assigning no emissions to carbon
that would have been released in
any case is the same principle as
used in the RFNBO methodology
Uncertainty in assessment of whether carbon ‘would
have been’ emitted to the atmosphere.
Risk that even if carbon would have been emitted to
the atmosphere it was not accounted for in any way in
the original production system, so overall some
emissions are not accounted for.
Option A-3: Never assigned
to transport fuel
The material is a waste / by-product
of another process, that process was
responsible for the initial fossil fuel
extraction and the emissions that
eventually result from it, so the
transport fuel should not account
for these GHG emissions.
Practically straightforward to
implement
This does not account for the additional fossil CO2
emissions that could be caused by the production of
transport fuels from feedstocks where that carbon was
previously sequestered.
Risk that even if carbon would have been emitted to
the atmosphere it was not accounted for in original
production system, so overall some emissions are not
accounted for.
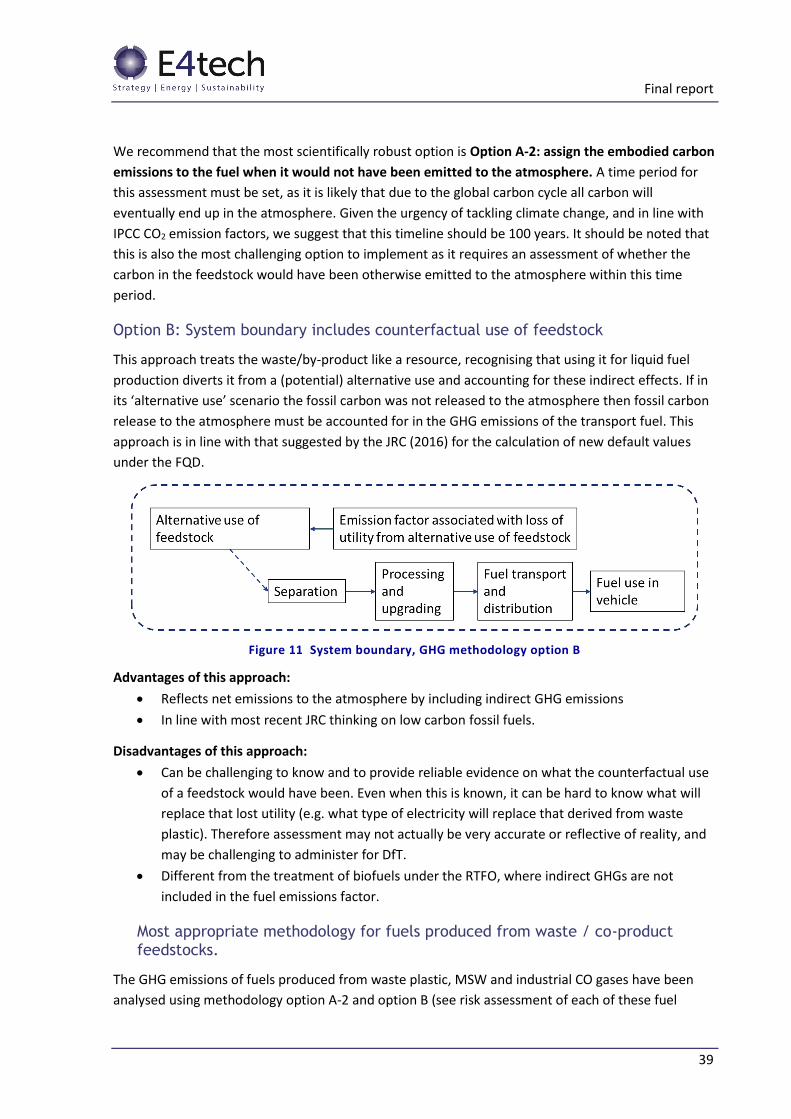
Final report
39
We recommend that the most scientifically robust option is Option A-2: assign the embodied carbon
emissions to the fuel when it would not have been emitted to the atmosphere. A time period for
this assessment must be set, as it is likely that due to the global carbon cycle all carbon will
eventually end up in the atmosphere. Given the urgency of tackling climate change, and in line with
IPCC CO2 emission factors, we suggest that this timeline should be 100 years. It should be noted that
this is also the most challenging option to implement as it requires an assessment of whether the
carbon in the feedstock would have been otherwise emitted to the atmosphere within this time
period.
Option B: System boundary includes counterfactual use of feedstock
This approach treats the waste/by-product like a resource, recognising that using it for liquid fuel
production diverts it from a (potential) alternative use and accounting for these indirect effects. If in
its ‘alternative use’ scenario the fossil carbon was not released to the atmosphere then fossil carbon
release to the atmosphere must be accounted for in the GHG emissions of the transport fuel. This
approach is in line with that suggested by the JRC (2016) for the calculation of new default values
under the FQD.
Figure 11 System boundary, GHG methodology option B
Advantages of this approach:
Reflects net emissions to the atmosphere by including indirect GHG emissions
In line with most recent JRC thinking on low carbon fossil fuels.
Disadvantages of this approach:
Can be challenging to know and to provide reliable evidence on what the counterfactual use
of a feedstock would have been. Even when this is known, it can be hard to know what will
replace that lost utility (e.g. what type of electricity will replace that derived from waste
plastic). Therefore assessment may not actually be very accurate or reflective of reality, and
may be challenging to administer for DfT.
Different from the treatment of biofuels under the RTFO, where indirect GHGs are not
included in the fuel emissions factor.
Most appropriate methodology for fuels produced from waste / co-product feedstocks.
The GHG emissions of fuels produced from waste plastic, MSW and industrial CO gases have been
analysed using methodology option A-2 and option B (see risk assessment of each of these fuel

Final report
40
chains in Appendix F) to illustrate the impact of these different methodologies. Both of these options
drive similar behaviours: diverting feedstock from a use where it was sequestered results in a fuel
with high GHG emissions, whereas diverting feedstock from a use where it was emitted results in a
fuel with lower GHG emissions.
Use of methodology A-1 or A-3, where all feedstocks, regardless of alternative uses, are treated the
same does not capture the impact of diverting feedstock from one use or another. Therefore these
methods would be useful for comparing a number of alternative waste treatment scenarios to
understand which has the lowest associated GHG emissions, but are less appropriate for the aims of
this study.
Many wastes/co-products, which might be processed into LCFFs, will already have an existing use,
and diversion of the feedstock from that use will cause indirect GHG impacts. Therefore here
methodology option B, which includes assessment of the counterfactual use of that feedstock, is
recommended for assessing the GHG emissions of LCFFs produced from wastes or co-product
feedstocks.
3.6.3 Summary of risk for all fuel types
The lifecycle GHG emissions of a potentially low-carbon fossil fuel are highly specific to the feedstock
and production process of that fuel. Minor changes to the setup of similar production processes, for
example in the fuels used to provide heat and power to the plant, can determine whether the fuel
provides GHG savings compared to gasoline or diesel. Therefore all fuel routes carry the risk of not
meeting the GHG threshold due to their processing emissions, as is the case for biofuels.
In Table 6 we have assessed the likelihood that, given typical conversion efficiencies, a fuel produced
from a given feedstock will have higher GHG emissions than gasoline or diesel. This should be treated
as indicative only: the GHG emissions of the final fuel also depend on processing emissions which
cannot be generalised for a given feedstock. The GHG emissions associated with each feedstock
depend on its production, indirect impacts associated with its use, which means that within each
broad feedstock category (e.g. waste plastic) a wide range of GHG emissions is conceivable.
Therefore the assessment given in Table 6 of the likelihood of fuel produced from a given feedstock
not making GHG savings is dependent upon two factors: the GHG impacts associated with different
feedstock origins or counterfactual situations, and how likely these different scenarios are to occur.
For each feedstock these are discussed in more detail in Appendix F. Decarbonisation of transport
fuel is a high priority for DfT, therefore if this risk occurs the impact is severe for all fuel chains.
Table 6 Summary of risk profile for specific fuel production routes. Criteria for assessment of severity and likelihood of risk occurring are outlined in Appendix B.
Feedstock Likelihood of fuel increasing GHG
emissions due to emissions
associated with feedstock
Severity of risk if it does occur
Natural gas
Coal
Waste fossil plastics
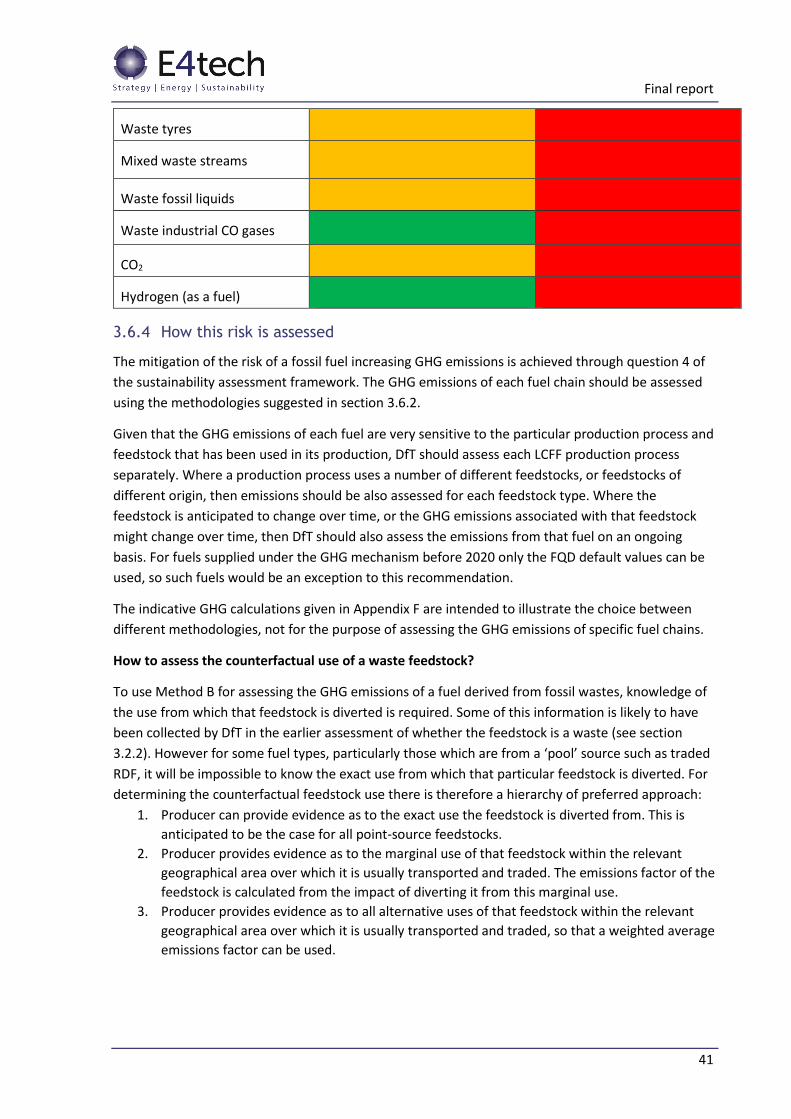
Final report
41
Waste tyres
Mixed waste streams
Waste fossil liquids
Waste industrial CO gases
CO2
Hydrogen (as a fuel)
3.6.4 How this risk is assessed
The mitigation of the risk of a fossil fuel increasing GHG emissions is achieved through question 4 of
the sustainability assessment framework. The GHG emissions of each fuel chain should be assessed
using the methodologies suggested in section 3.6.2.
Given that the GHG emissions of each fuel are very sensitive to the particular production process and
feedstock that has been used in its production, DfT should assess each LCFF production process
separately. Where a production process uses a number of different feedstocks, or feedstocks of
different origin, then emissions should be also assessed for each feedstock type. Where the
feedstock is anticipated to change over time, or the GHG emissions associated with that feedstock
might change over time, then DfT should also assess the emissions from that fuel on an ongoing
basis. For fuels supplied under the GHG mechanism before 2020 only the FQD default values can be
used, so such fuels would be an exception to this recommendation.
The indicative GHG calculations given in Appendix F are intended to illustrate the choice between
different methodologies, not for the purpose of assessing the GHG emissions of specific fuel chains.
How to assess the counterfactual use of a waste feedstock?
To use Method B for assessing the GHG emissions of a fuel derived from fossil wastes, knowledge of
the use from which that feedstock is diverted is required. Some of this information is likely to have
been collected by DfT in the earlier assessment of whether the feedstock is a waste (see section
3.2.2). However for some fuel types, particularly those which are from a ‘pool’ source such as traded
RDF, it will be impossible to know the exact use from which that particular feedstock is diverted. For
determining the counterfactual feedstock use there is therefore a hierarchy of preferred approach:
1. Producer can provide evidence as to the exact use the feedstock is diverted from. This is
anticipated to be the case for all point-source feedstocks.
2. Producer provides evidence as to the marginal use of that feedstock within the relevant
geographical area over which it is usually transported and traded. The emissions factor of the
feedstock is calculated from the impact of diverting it from this marginal use.
3. Producer provides evidence as to all alternative uses of that feedstock within the relevant
geographical area over which it is usually transported and traded, so that a weighted average
emissions factor can be used.
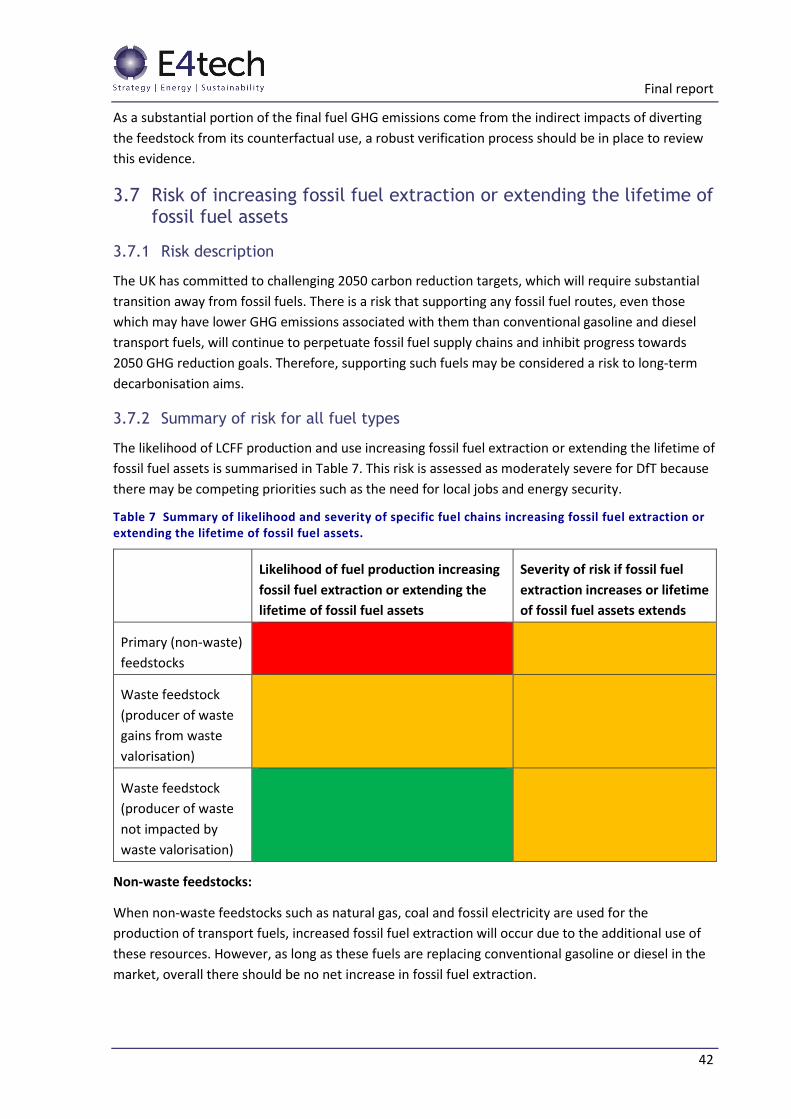
Final report
42
As a substantial portion of the final fuel GHG emissions come from the indirect impacts of diverting
the feedstock from its counterfactual use, a robust verification process should be in place to review
this evidence.
3.7 Risk of increasing fossil fuel extraction or extending the lifetime of fossil fuel assets
3.7.1 Risk description
The UK has committed to challenging 2050 carbon reduction targets, which will require substantial
transition away from fossil fuels. There is a risk that supporting any fossil fuel routes, even those
which may have lower GHG emissions associated with them than conventional gasoline and diesel
transport fuels, will continue to perpetuate fossil fuel supply chains and inhibit progress towards
2050 GHG reduction goals. Therefore, supporting such fuels may be considered a risk to long-term
decarbonisation aims.
3.7.2 Summary of risk for all fuel types
The likelihood of LCFF production and use increasing fossil fuel extraction or extending the lifetime of
fossil fuel assets is summarised in Table 7. This risk is assessed as moderately severe for DfT because
there may be competing priorities such as the need for local jobs and energy security.
Table 7 Summary of likelihood and severity of specific fuel chains increasing fossil fuel extraction or extending the lifetime of fossil fuel assets.
Likelihood of fuel production increasing
fossil fuel extraction or extending the
lifetime of fossil fuel assets
Severity of risk if fossil fuel
extraction increases or lifetime
of fossil fuel assets extends
Primary (non-waste)
feedstocks
Waste feedstock
(producer of waste
gains from waste
valorisation)
Waste feedstock
(producer of waste
not impacted by
waste valorisation)
Non-waste feedstocks:
When non-waste feedstocks such as natural gas, coal and fossil electricity are used for the
production of transport fuels, increased fossil fuel extraction will occur due to the additional use of
these resources. However, as long as these fuels are replacing conventional gasoline or diesel in the
market, overall there should be no net increase in fossil fuel extraction.
Final report
43
Nevertheless, support for these fuels supports fossil fuel infrastructure and may contravene wider UK
decarbonisation objectives.
Waste feedstocks (producer of waste gains from waste valorisation):
There is a risk that providing support for some low carbon fossil fuels based on by-products (e.g. CO
off gas from the steel industry) or wastes from industrial plants, extends the lifetime of fossil fuel
assets or fossil fuel based production processes, by providing an additional revenue stream for the
plant or reducing the plant’s ETS payments40 . This may discourage companies from seeking
alternative non-fossil fuel sources, investing in alternative infrastructure or production processes, or
making plant efficiency improvements which might reduce overall fossil fuel use. The extent to which
this is likely to happen is highly uncertain.
Waste feedstocks (producer of waste not impacted by waste valorisation):
In cases where the producer of the waste does not benefit from valorisation of the waste, this risk is
unlikely to occur, because the use or value of the waste has minimal impact on the materials chosen
in production of a product.
3.7.3 How this risk is assessed
This risk is assessed through question 5 of the assessment framework, ‘is the fuel in line with
strategic decarbonisation of the UK economy’.
To understand whether the fuel chain poses a risk of increasing or supporting fossil-fuel based
industries, DfT should establish which of the following three categories the fuel fits into:
(a) non-waste feedstock
(b) waste feedstock where the producer gains from waste valorisation
(c) waste feedstock where the producer does not gain from waste valorisation
In case (c) no further evidence would be required by DfT. In case (a) the risk is known and if DfT
chooses to support these fuel types this risk must be accepted.
In case (b) further evidence may be required to establish whether support for fuel production from
waste supports a fossil fuel industry, or industry use of fossil fuels in a manner that is inconsistent
with UK decarbonisation targets. Evidence on the percentage of overall plant revenue that is
anticipated to come from the feedstock compared to percentage of overall plant revenue that
currently comes from the use of that waste could indicate whether this would provide substantial
support to the plant. This should be considered in the context of wider UK policy (such as the phasing
out of coal-fired power generation) to understand whether supporting the fuel might oppose existing
UK decarbonisation strategy in other sectors.
Nevertheless, DfT should also weigh up the risk of supporting these fuels with the contribution they
may make to wider DfT decarbonisation strategy of the transport sector, for example:
Support for low-carbon fossil fuels may provide a greater incentive for increased production of
fuel from mixed non-recyclable wastes, in line with circular economy and waste reduction goals,
40 Whiriskey, K., Wolthuys, J.V., for Bellona (2016) CCU in the EU ETS: risk of CO2 laundering preventing a permanent CO2 solution
Final report
44
by enabling support to be claimed for the whole portion of the fuel, rather than just the biogenic
portion. This could result in (a) more biogenic waste being used, and (b) reduce energy use in
separation of the biogenic from the non-biogenic fraction of waste.
Support for some low-carbon fossil fuels may develop conversion technologies that can also
process renewable feedstocks, therefore facilitating production and use of higher volumes of
renewable fuels in the medium to long-term. For example development of the Fischer-Tropsch
process supports production of diesel from both biogenic and non-biogenic feedstocks. Similarly,
use of low-carbon fossil feedstocks may enable plant construction at a viable scale in areas
where it would not be possible to reliably feed a plant on renewable resources alone, which
could unlock potential for new renewable feedstocks, reduce renewable feedstock transport
distances, or enable lower cost or higher efficiency conversion through increased plant scale.
Whether a fuel is of strategic importance for long-term decarbonisation of UK transport, such as
aviation fuel or diesel substitutes, which can reduce GHG emissions in sectors which are difficult
to electrify.
3.8 Threshold for GHG emissions
Currently biofuels supplied under the RTFO must meet a minimum 70% GHG emissions saving
compared to the fossil fuel comparator of 83.8 gCO2eq./MJ, whilst not including indirect emissions in
their GHG emission factor. This section provides an approach to setting a GHG threshold for LCFFs.
A GHG threshold is likely to be implemented for one of two reasons:
Where there are uncertainties in GHG emission factor calculations, to ensure that some GHG
saving is achieved.
To ensure that the switch to a new fuel type results in substantial GHG emissions savings, in
line with long term decarbonisation requirements of the sector.
Given the different nature of the three LCFF fuel types identified in the sustainability assessment
framework, the different sustainability requirements that are imposed on them, and the different
GHG calculation methodologies, it may be appropriate to apply different GHG thresholds.
In particular it should be noted that if the ‘counterfactual’ methodology (option B) is applied to
waste-based fossil fuels, indirect GHG emissions of diverting the feedstock from an alternative use
are also included in the fuel emissions factor. Therefore a 70% threshold, which is currently used for
biofuels which do not include indirect emissions in their GHG intensity, may not be appropriate for
waste-based fossil fuels calculated using this methodology. Moreover, indicative calculations
(Appendix F) suggest that using method option B, only if MSW and waste plastic that has been
diverted from energy recovery could fuels produced from these feedstocks meet a 70% threshold,
and even with this alternative use it would be challenging for plastics to fuel chains and very
challenging for MSW to fuel chains to meet a 70% savings threshold.
Currently, biofuels and RFNBOs are assessed on their carbon savings compared to the RED
comparator (83.8 gCO2eq./MJ) whilst fossil fuels are assessed against the FQD fossil fuel comparator
of 94.1 gCO2eq./MJ. If a GHG threshold for LCFFs is implemented, comparability with other
renewable fuels is likely to be a priority in setting the most appropriate comparator.
Final report
45
4 Inclusion of LCFFs within UK and Ireland carbon calculator
Should DfT decide to support low carbon fossil fuels, the UK and Ireland carbon calculator could be
modified so that fuel producers could make GHG calculations within this tool.
LCFFs produced from non-waste feedstocks would fit within the existing modules with minimal
modification. Only the ‘feedstock cultivation’ module for biomass would need to be changed to
calculate instead emissions from raw material extraction.
LCFFs produced from feedstocks which have no energy content would have a similar GHG
methodology to RFNBO fuels, but this is quite different to the existing biofuel methodology used
within the calculator. Therefore inclusion of these fuels within the calculator would likely require
several new module types and a different underlying calculation methodology. If RFNBO fuels were
already included within the calculator, which seems plausible given that they are shortly to be
included within the RTFO, then the additional inclusion of LCFFs produced from feedstocks which
have no energy content would require substantially less work.
LCFFs produced from waste-based feedstock would require some modification to the existing
calculator, likely an additional or alternative module at the start of the chain to reflect the GHG
emissions associated with the feedstock.
5 Conclusions
This study aimed to assess the sustainability impacts of low carbon fossil fuels, in order to
understand whether they should receive government support. The scope included a wide range of
fuels which could potentially be low-carbon: fuels produced from waste fossil feedstock, fuels
produced from non-waste fossil feedstocks, and fuels produced from CO2 or water and non-
renewable energy (RFNBO-type fuels). The aims of the project were achieved through carrying out a
broad landscape assessment of possible low carbon fossil fuel routes, developing a sustainability
assessment framework, and assessing broad classes of fuels against this framework. Key
sustainability and policy conclusions from the study are provided in this section.
Sustainability of low carbon fossil fuels
The main sustainability risks which could be presented by low carbon fossil fuels are the risk of
making poor use of resources through contravening the waste hierarchy, and the risk of making low
or even negative greenhouse gas savings compared to conventional fossil fuels. Existing fuel
standards and emissions legislation means that in most cases LCFFs are unlikely to pose a severe risk
to air quality compared to conventional gasoline or diesel or other alternative fuels.
Producing liquid fuels with a feedstock that is diverted from landfill or energy from waste does not
contravene the waste hierarchy, as liquid fuel production comes higher in the waste hierarchy than
landfilling that material, and at an equal level to other forms of energy recovery such as energy from
waste. However there is a risk that incentivising use of a feedstock for liquid fuel production will
undercut the economic case for future measures or investments to increase recycling. Therefore
policy support for waste-based fossil fuels should be closely integrated with recycling policies to
avoid unintended consequences of incentivising liquid fuel production.
Final report
46
A number of approaches to calculating the GHG emissions of low-carbon fossil fuels have been
reviewed. Calculation of the GHG impact of RFNBO-type fuels (made from CO2 or water and non-
renewable electricity) and non-waste fossil fuels should be in line with existing DfT methodology for
these fuels. Illustrative calculations using these methods demonstrate that some RFNBO-type fossil
fuels, such as hydrogen produced from natural gas or nuclear-derived electricity, and some non-
waste fossil fuels, such as natural gas used in vehicles or hydrogen produced from natural gas, could
reduce GHG emissions compared to conventional gasoline or diesel. In certain cases, for example
when CCS is used in the production process, these emissions savings could be greater than 70%
compared to conventional gasoline or diesel.
The most robust approach to calculating the GHG impacts of waste-based fossil fuels would account
for the indirect emissions associated with diverting that feedstock from an existing use. In cases
where the feedstock would have been sequestered, for example in landfill, the GHG emissions of the
fuel are likely to be similar to, or higher than, those from conventional gasoline or diesel. For
feedstocks that would have been combusted, the net emissions of the fuel can vary from
substantially lower than conventional fossil fuels to substantially higher, depending on what replaces
the waste as a fuel or what energy sources replace the electricity and heat from the waste-to-energy
plant. Those feedstocks which would have alternatively been incinerated with no energy recovery,
such as flared waste gas and hazardous liquids, have the lowest GHG emissions and would likely be
able to meet a 70% GHG saving threshold.
Whilst a 70% GHG saving threshold is applied to biofuels, it is not necessarily appropriate to apply
the same GHG saving threshold to low carbon fossil fuels. In particular, the GHG methodology
proposed here for waste-based fossil fuels includes the indirect emissions from diverting that
feedstock from an existing use, whereas indirect emissions are not included within the GHG
assessment for biofuels.
Policy support for low carbon fossil fuels
This study has shown that some low carbon fossil fuels can sustainably reduce GHG emissions,
potentially with additional benefits such as a reduction in air pollutants and diversion of waste from
landfill. Given that the future production of advanced biofuels is likely to be limited by the availability
of sustainable volumes of waste biomass and the early commercialisation status of some of the
production technologies, low carbon fossil fuels could provide a valuable contribution towards the
reduction of GHG emissions in the transport sector. Indeed they could even facilitate the longer-term
transition to alternative renewable fuels, for example use of natural gas in engines may facilitate the
uptake of more biogas, and use of fossil hydrogen may promote the construction of the necessary
infrastructure for renewable hydrogen in the longer-term. Robust sustainability criteria should be
implemented if support is provided by DfT. Moreover, support for non-waste low carbon fossil fuels
could support continued fossil fuel use so should be carefully considered in the context of wider
government decarbonisation policy.
Several of the technologies for producing low carbon fossil fuels are still pre-commercial, therefore if
DfT decides to support low carbon fossil fuels, market pull policies such as the existing RTFO
mechanism, and push policies such as competitions or grants would both be appropriate. Market-
based policies are likely to be most effective for fuels which are commercial or close to
commercialisation. For technologies which are at an earlier stage of development, competitions or
Final report
47
grants may be needed to achieve early deployment of these fuels. Such support, for a technology
route which is not yet commercial, could be given by DfT where the fuels have particular strategic
importance for long-term decarbonisation of the UK transport sector. Nevertheless, market based
support for these fuels is also needed to give investor confidence, as investment relies on the future
market prospects rather than one plant alone.
To 2020, market-based support for low carbon fuels is separated into support for renewable fuels
(Renewable Transport Fuel Obligation) and support for other low-carbon fuels (Greenhouse Gas
mechanism). Currently only fuels that have defaults in the FQD legislation can count towards the
GHG mechanism. DfT could widen the range of fuels supported under the GHG mechanism by
allowing suppliers of fuels which do not currently have a GHG default in the FQD legislation to gain
GHG credits, using the methodology suggested in this study. However few low carbon fossil fuels are
expected before 2020 which do not have a GHG default value in the FQD legislation so this may have
a limited impact.
Post 2020 there are two main options for supporting low carbon fuels: a) keep support for renewable
fuels and non-renewable fuels separate, which could enable a greater reward to be given to
renewable fuels, or b) bring renewable and non-renewable fuels together under a GHG-based target
such as that already used by Germany, with strict sustainability criteria for all fuels. If approach b) is
adopted, DfT should ensure that inclusion of low carbon fossil fuels within a support scheme does
not push out renewable fuels, especially where these are less established and may not be able to
compete economically. In addition, the more fuel types, and the greater diversity of fuel types that
are included within the same support scheme, the more difficult it is for producers to assess the
potential supply and therefore the price, which can lead to reduced investor confidence.
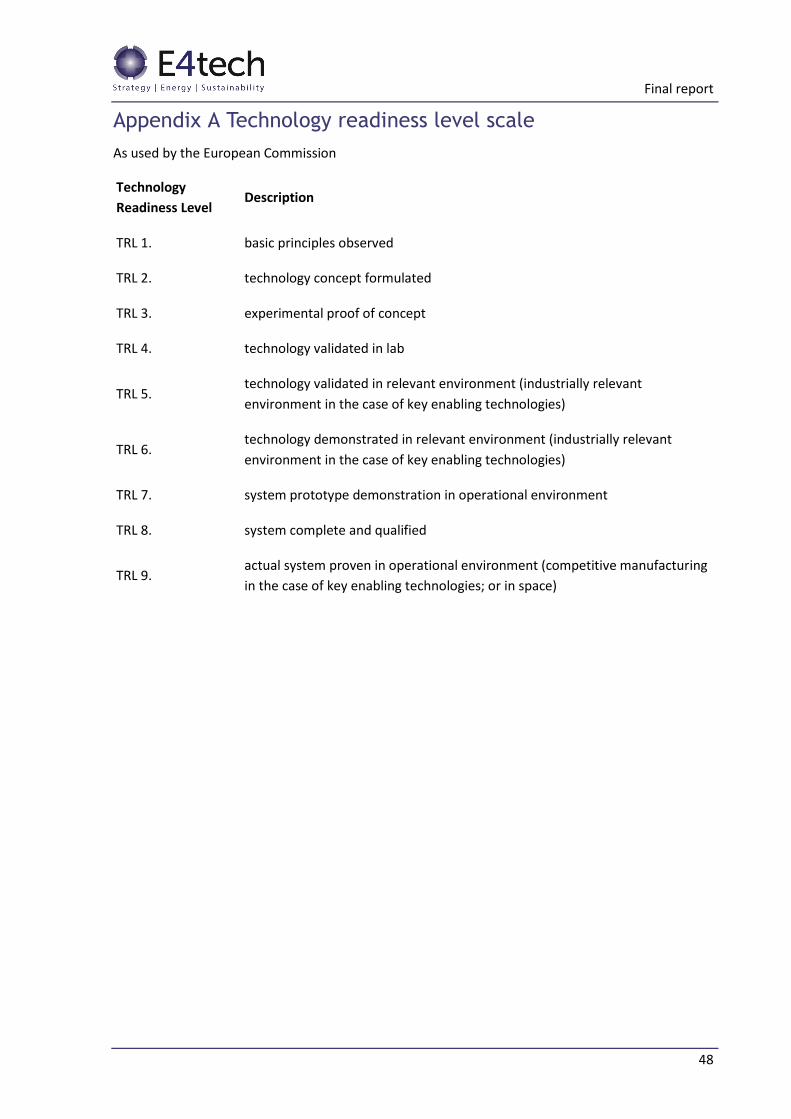
Final report
48
Appendix A Technology readiness level scale
As used by the European Commission
Technology
Readiness Level Description
TRL 1. basic principles observed
TRL 2. technology concept formulated
TRL 3. experimental proof of concept
TRL 4. technology validated in lab
TRL 5. technology validated in relevant environment (industrially relevant
environment in the case of key enabling technologies)
TRL 6. technology demonstrated in relevant environment (industrially relevant
environment in the case of key enabling technologies)
TRL 7. system prototype demonstration in operational environment
TRL 8. system complete and qualified
TRL 9. actual system proven in operational environment (competitive manufacturing
in the case of key enabling technologies; or in space)
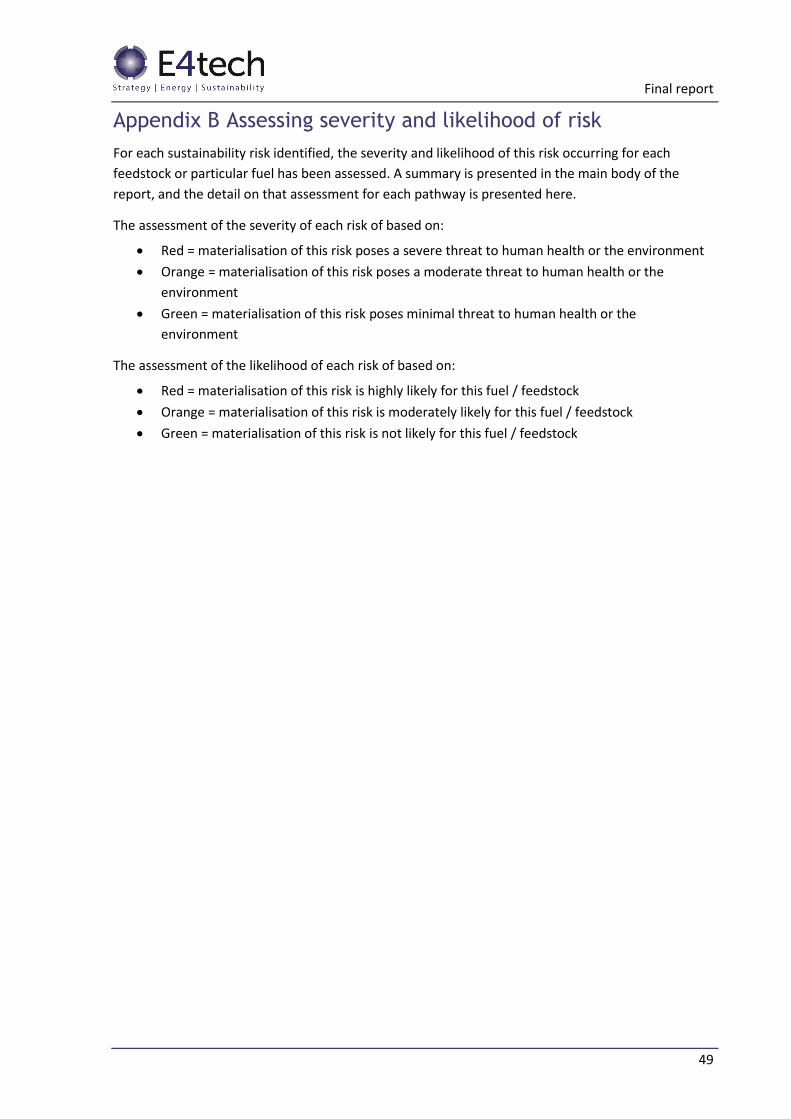
Final report
49
Appendix B Assessing severity and likelihood of risk
For each sustainability risk identified, the severity and likelihood of this risk occurring for each
feedstock or particular fuel has been assessed. A summary is presented in the main body of the
report, and the detail on that assessment for each pathway is presented here.
The assessment of the severity of each risk of based on:
Red = materialisation of this risk poses a severe threat to human health or the environment
Orange = materialisation of this risk poses a moderate threat to human health or the
environment
Green = materialisation of this risk poses minimal threat to human health or the
environment
The assessment of the likelihood of each risk of based on:
Red = materialisation of this risk is highly likely for this fuel / feedstock
Orange = materialisation of this risk is moderately likely for this fuel / feedstock
Green = materialisation of this risk is not likely for this fuel / feedstock

Final report
50
Appendix C Risk that use of fuel will increase local air pollutants
LNG, CNG and SNG
Liquefied natural gas (LNG) and compressed natural gas (CNG) are two ways of delivering natural gas
into an engine and therefore have similar pollutant emission profiles. Synthetic natural gas (SNG)
could be used in either of these forms in engines. A standard exists for natural gas and biomethane
used in vehicles (EN 16723)41. LNG and CNG are primarily used either in dedicated spark ignition
engines, or in dual fuel engines which may be manufactured specifically for this process or retrofitted
to existing engines. As of May 2017 the only natural gas engine that had met the EURO VI emissions
standard is the dedicated stoichiometric engines, although other technologies such as the dual fuel
high-pressure direct injection system are expected to meet these criteria in the future.42
Emissions of specific pollutants from a range of vehicle types operating on LNG and CNG were
investigated in a recent study by the LowCVP.43
LPG
LPG used in the automotive sector is covered by CEN standard EN 589, and is mainly used in
dedicated (factory fitted or converted) LPG engines but can also be used in dual fuel engines.
More information on specific pollutants emitted through the use of LPG in engines is available from
the LowCVP (2017).
Synthetic gasoline and diesel
Synthetic gasoline and diesel are likely to be supplied into the UK blended into conventional gasoline
or diesel to meet the existing standard for these fuels.44 Compliance with these standard mitigates
the risk of these fuels creating adverse air quality impacts, but DfT may wish to investigate further
the impact of these novel fuels on emissions of non-regulated pollutants.
If synthetic gasoline or diesel are supplied outside of the existing standard, for example a private
supply from a fuel producer to a HGV fleet operator, there is a higher risk of these fuels creating
adverse air pollution impacts.
41 CEN (2017) Natural gas and biomethane for use in transport and biomethane for injection in the natural gas grid, Available from: https://standards.cen.eu/dyn/www/f?p=204:32:0::::FSP_ORG_ID,FSP_LANG_ID:853454,25&cs=1A6E2885FFA69ED2A8C4FA137A6CEF3DA (Accessed 4th December 2017) 42 ETI (2017) Natural gas pathway analysis for heavy duty vehicles, Available from: http://bit.ly/2zNxfRR (Accessed on 28th November 2017) 43 Department for Transport and LowCVP (2017) Emissions testing of gas-powered commercial vehicles, Available from: http://www.lowcvp.org.uk/assets/reports/LowCVP%202016%20DfT%20Test%20Programme%20Final%20Report.pdf (Accessed on 28th November 2017) 44 EN228 for gasoline and EN590 for diesel
Final report
51
Jet fuel
There are two types of synthetic aviation kerosene within scope of this study – synthetic paraffinic
kerosene (SPK) produced from Fischer Tropsch synthesis, which can be blended up to 50% in
conventional aviation kerosene, and SPK produced from an alcohol to jet process. This can currently
be blended up to 30% in kerosene if produced from sugars, and pathways from synthetic alcohol are
in the process of certification. 45
Aircraft have no combustion after-treatment systems so their emissions profile is very sensitive to
the fuel composition which, while tightly regulated in terms of composition, is generally less tightly
regulated in terms of its environmental impact. For example sulfur limits for aviation fuel are
3000ppm compared to 10ppm for road diesel in the UK. Therefore novel jet fuels could pose a
substantial risk to air quality, due to the lack of pollutant emissions regulations in this sector. On the
other hand the lack of existing regulation in the aviation sector could also provide opportunity for
novel jet fuels to reduce non-GHG pollutants. The synthetic jet fuels within scope of this study tend
to have lower sulfur and aromatics content, which lowers SOx and particulate matter emissions
compared to conventional refinery kerosene. 46
Methanol, ethanol and butanol
Alcohols are typically, but not exclusively, blended into gasoline at limited levels in order to meet the
EN228 gasoline standard. Compliance with this standard mitigates the risk of these fuels having an
adverse impact on local air pollution in new and existing vehicles.
For higher alcohol blends such as E85 there is currently a reference standard and a draft CEN
standard. E85 was briefly commercially available in the UK, (mainly for racing applications) but today
this blend is more likely to be supplied into a captive fleet, representing a very small proportion of
total UK fuel supply, therefore limiting the extent of this risk.
Hydrogen
When hydrogen is used in a fuel cell, the only tailpipe emission is water. Consequently, the use of
hydrogen in a fuel cell is pollutant free at the point of use.
Limited work has been conducted on the use of hydrogen in internal combustion engines, but it is
anticipated that particulate matter and NOx may be reduced when the optimum combustion and
after-treatment strategies are used.
45 CAAFI (2017) Commercial aviation alternative fuels initiative, Available from: http://www.caafi.org/resources/faq.html (Accessed on 4th December 2017) 46 Lobo, P., Hagen, D.E., Whitefield, P.D. (2011) Comparison of PM Emissions from a Commercial Jet Engine Burning Conventional, Biomass, and Fischer–Tropsch Fuels, Environ. Sci. Technol., 2011, 45 (24), pp 10744–10749, Available from: http://pubs.acs.org/doi/abs/10.1021/es201902e
Final report
52
Appendix D Risk of feedstock not meeting the waste hierarchy
Waste fossil plastic
The majority of plastic contained within UK mixed waste stream is not separated, and ends up in
landfill or energy from waste (Appendix F, Figure 14). Therefore a feedstock that is composed only of
waste plastic will likely have been derived from a specific plastic waste collection scheme, having
undergone some sorting to remove more readily recyclable plastics.
Most types of plastic can technically be recycled, either into the same product (closed-loop recycling)
or into alternative products (open-loop recycling). Even thermosetting plastics for example, which
cannot be melted into new products, can still be re-used in other applications such as re-
manufacture into carpet underlay, or as a mixture in the production of non-structural lightweight
concrete.47
However, there are other reasons, aside from technical ability to recycle plastics, why plastics might
not be able to be recycled48:
Collection
o Limited recycling infrastructure
o Collection is widely dispersed and small in scale
o Complex shipping regulations may limit transportation
Processing
o Lack of knowledge and skills of processor
o Technological limitations of sorting and reprocessing
o Restrictions on contaminates
o Value chain partners are not connected (e.g. recyclers may be small and not global
players)
o Underdeveloped market for recycled plastics
Economics
o Technologically advanced processes or the number of processing steps may prove
too costly for the production of recycled plastics that can compete against virgin
fossil plastics on the market.
Using a type of plastic that cannot be recycled for liquid fuel production would not contravene the
waste hierarchy. However DfT should note that developments in plastic recycling technology, for
example improvements in black plastic separation49, may change over time the definition of what
material can be recycled.
47 Panyakapo, P., Panyakapo, M. (2008) Reuse of thermosetting plastic waste for lightweight concrete, Waste Management, 28(9), 1581-1588 48 Vlugter, J. for the Circular Economy 100, Ellen MacArthur Foundation and other partners (2017) Scaling recycled plastics across industries, Available from: https://www.ellenmacarthurfoundation.org/assets/downloads/ce100/Scaling-Recycled-Plastics-across-Industries.pdf (Accessed on 21st September 2017) 49 Waste Management World (2017) Roadmap to Better Recycling for Black Plastics Launched, Available from: https://waste-management-world.com/a/roadmap-to-better-recycling-for-black-plastics-launched (Accessed on 1st December 2017)
Final report
53
Given the recent tightening legislation from China regarding the export of plastic for recycling50, in
the short term there may be a larger volume of plastic within the UK which would have previously
been exported to China.51 There are fears that this material could now be landfilled or combusted for
energy instead of recycled, potentially increasing the volume of waste plastic available for
sustainable liquid fuel production. However, industry opinion seems to be that more of this material
could be recycled if the quality of it can be improved, for example through improved segregated
collections, sorting and decontamination. There is a risk that creating an incentive for such materials
to be transformed into liquid fuels, means that the economic case for investments in improvements
in the recycling chain is less robust.
Therefore while for all plastics there is a risk of contravening the waste hierarchy, whether this is
actually the case depends on the specific characteristics of the type of plastic in question, within a
specific time frame and geographic limitation. Given these considerations, waste fossil plastic
feedstocks have a moderate risk of not meeting the waste hierarchy.
Waste tyres
Waste tyres are likely to be partially biogenic and partially fossil, depending on the exact composition
of the rubber. Only the fossil portion of the tyre is within scope of this report, although in reality the
natural and synthetic components are distributed throughout the material and would not be
separated.
Waste tyres can be re-treaded, re-used or recycled, or can be used for energy recovery, primarily in
cement kilns in the UK. Only bicycle tyres and those with an outside diameter above 1.4m are
allowed to go to landfill in the EU52, although this may be higher in other countries.
Data from the DEFRA used tyres working groups (Figure 12) demonstrates the fate of all used tyres in
the UK in 2016, grouped as re-use (blue), export (red), recycling (green) or energy recovery (orange).
DEFRA consider that 23% of the mass of used tyres sent to cement kilns is ‘recycling’ as the metal is
incorporated into the cement clinker. The fate of exported tyres is unknown, but correspondence
with the used tyres working group suggested that while some of the exported tyres would be re-
used, a significant portion would be used for energy recovery.
50 Lets Recycle (2017) Government ‘looking into implications’ of China restrictions, Available from: https://www.letsrecycle.com/news/latest-news/government-looking-china-restrictions/ 51 Resource (2018) EAC launches special inquiry into effects of China waste ban, Available from: http://resource.co/article/eac-launches-special-inquiry-effects-china-waste-ban-12351 (Accessed on 18th January 2018) 52 DEFRA (2010) Environmental Permitting Guidance - The Landfill Directive, Available from: https://www.gov.uk/government/publications/environmental-permitting-guidance-the-landfill-directive (Accessed on 1st December 2017)
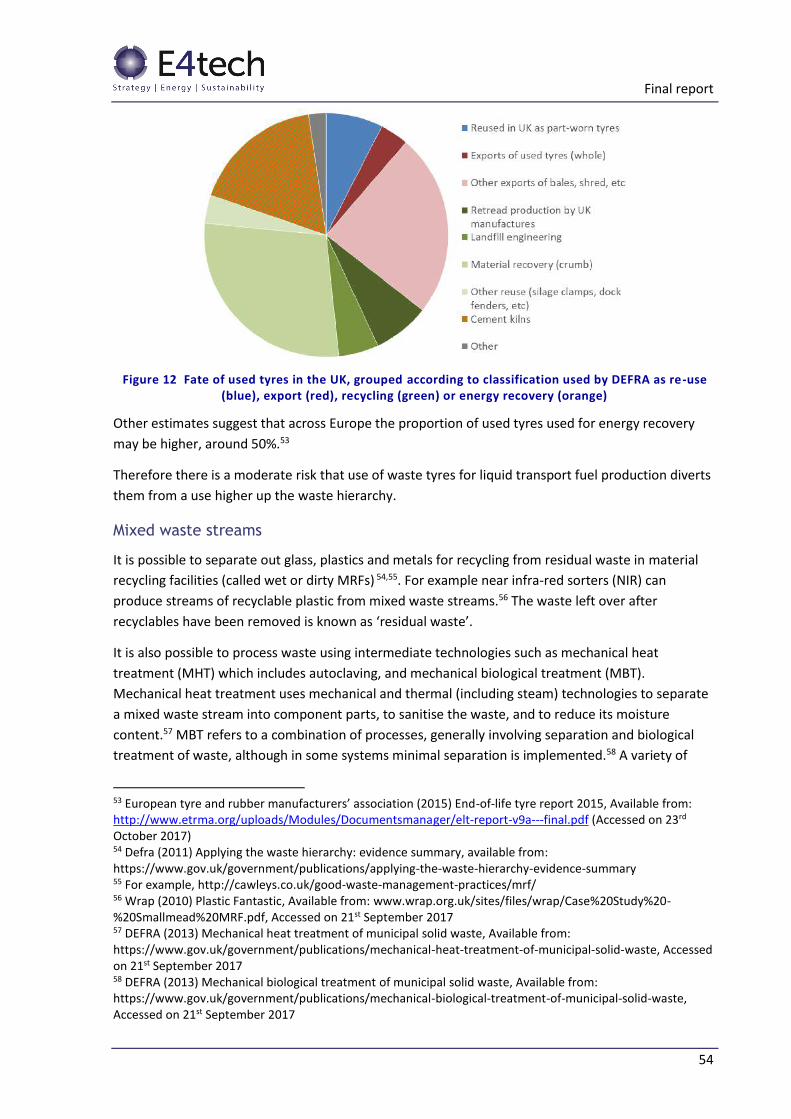
Final report
54
Figure 12 Fate of used tyres in the UK, grouped according to classification used by DEFRA as re-use (blue), export (red), recycling (green) or energy recovery (orange)
Other estimates suggest that across Europe the proportion of used tyres used for energy recovery
may be higher, around 50%.53
Therefore there is a moderate risk that use of waste tyres for liquid transport fuel production diverts
them from a use higher up the waste hierarchy.
Mixed waste streams
It is possible to separate out glass, plastics and metals for recycling from residual waste in material
recycling facilities (called wet or dirty MRFs) 54,55. For example near infra-red sorters (NIR) can
produce streams of recyclable plastic from mixed waste streams.56 The waste left over after
recyclables have been removed is known as ‘residual waste’.
It is also possible to process waste using intermediate technologies such as mechanical heat
treatment (MHT) which includes autoclaving, and mechanical biological treatment (MBT).
Mechanical heat treatment uses mechanical and thermal (including steam) technologies to separate
a mixed waste stream into component parts, to sanitise the waste, and to reduce its moisture
content.57 MBT refers to a combination of processes, generally involving separation and biological
treatment of waste, although in some systems minimal separation is implemented.58 A variety of
53 European tyre and rubber manufacturers’ association (2015) End-of-life tyre report 2015, Available from: http://www.etrma.org/uploads/Modules/Documentsmanager/elt-report-v9a---final.pdf (Accessed on 23rd October 2017) 54 Defra (2011) Applying the waste hierarchy: evidence summary, available from: https://www.gov.uk/government/publications/applying-the-waste-hierarchy-evidence-summary 55 For example, http://cawleys.co.uk/good-waste-management-practices/mrf/ 56 Wrap (2010) Plastic Fantastic, Available from: www.wrap.org.uk/sites/files/wrap/Case%20Study%20-%20Smallmead%20MRF.pdf, Accessed on 21st September 2017 57 DEFRA (2013) Mechanical heat treatment of municipal solid waste, Available from: https://www.gov.uk/government/publications/mechanical-heat-treatment-of-municipal-solid-waste, Accessed on 21st September 2017 58 DEFRA (2013) Mechanical biological treatment of municipal solid waste, Available from: https://www.gov.uk/government/publications/mechanical-biological-treatment-of-municipal-solid-waste, Accessed on 21st September 2017
Final report
55
different plant configurations for these techniques are possible, but both MHT and MBT generally
produce a high calorific value waste stream termed refuse derived fuel (RDF) or solid recovered fuel
(SRF), with the recyclable material already separated out. If RDF or SRF used in liquid fuel production
have already had recyclables removed then their use is in accordance with the waste hierarchy. The
main alternative use of RDF is in production of power, heat or both, including in cement kilns, which
is at the same level in the waste hierarchy as production of liquid fuels.
Given these considerations, mixed waste stream feedstocks have a moderate risk of not meeting the
waste hierarchy.
Waste fossil liquids
Waste fossil liquids are often hazardous and are likely to be either disposed of or used to produce
secondary liquid fuel (SLF) for energy recovery. Therefore using these materials for fuel production is
unlikely to contravene the waste hierarchy.
Given these considerations, waste fossil liquids feedstocks have a low risk of not meeting the waste
hierarchy.
Industrial waste CO gases
In general industrial CO gases are either flared, which is disposal under the waste hierarchy, or
combusted to produce heat and/or power. Therefore in both cases diverting the CO gases to fuel
production would not contravene the waste hierarchy. In theory CO can be used as a feedstock for
the chemicals industry, but the concentration and purity of waste CO gas produced by industrial
processes makes this unlikely.
Given these considerations, industrial waste CO gas feedstocks have a low risk of not meeting the
waste hierarchy.
Final report
56
Appendix E Review of GHG accounting approaches
GHG assessments of fuels produced from fossil wastes or by-products are not widespread, therefore
here examples from Argonne national laboratory (Benavides, 2017) and the California Air Resources
Board (Unnasch, 2015) are reviewed, along with the guidance provided by the Joint Research
Commission (JRC) of the European Union for the calculation of default values under the FQD (JRC,
2016)
For each approach we outline below:
Short description of the approach, including aims and scope
System boundary, including whether ‘alternative’ use of waste feedstock is considered and if
so how this is dealt with.
How allocation of emissions amongst products and co-products is conducted
Californian Air Resources Board (CARB)
Description
The Californian Air Resources Board use the GREET model to certify fuel chains, and assess each
chain on a case-by-case basis. They have so far only certified one fuel which uses waste fossil
material: the MSW to FT diesel fuel pathway submitted by Fulcum Bioenergy. Therefore the
methodology used to assess this particular fuel chain is reviewed here, based on the document
submitted alongside the 2B application for this process.59
System boundary
The system boundary includes both the biogenic and fossil portion of the MSW, and runs from the
delivery of MSW to the plant, through the fuel production process and fuel use in the vehicle. An
emissions credit is given to the fuel for avoided landfill emissions for the biogenic portion of the
waste. No burden is given to the fuel for the ‘avoided sequestration’ of fossil carbon that now does
not enter landfill. The emissions from fuel combustion and CO2 vented during the production process
are also added to the total.
59 Unnasch. S. (2015) Avoided Life Cycle GHG Emissions from MSW Disposal, Life Cycle Associates, Report No. LCA6060.120.2015, Prepared for Fulcrum BioEnergy, Available from:
https://www.arb.ca.gov/fuels/lcfs/2a2b/apps/ful-ftd-rpt-123015.pdf (Accessed on 22nd November 2017)
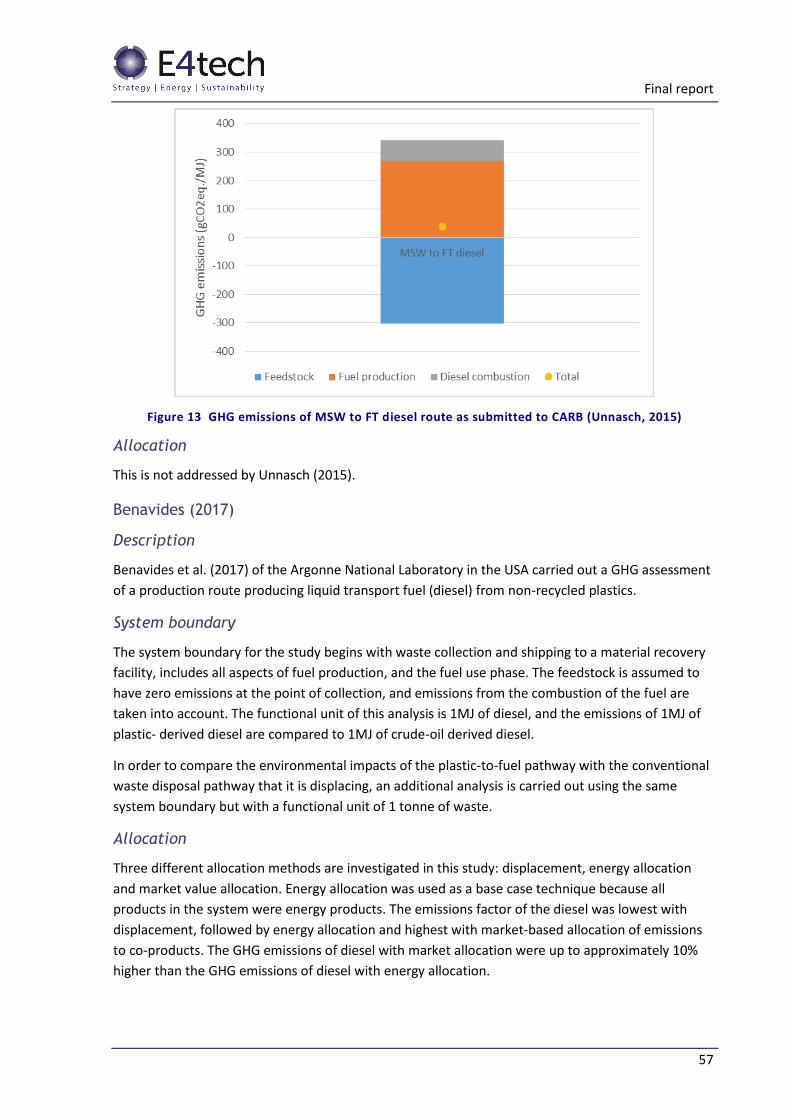
Final report
57
Figure 13 GHG emissions of MSW to FT diesel route as submitted to CARB (Unnasch, 2015)
Allocation
This is not addressed by Unnasch (2015).
Benavides (2017)
Description
Benavides et al. (2017) of the Argonne National Laboratory in the USA carried out a GHG assessment
of a production route producing liquid transport fuel (diesel) from non-recycled plastics.
System boundary
The system boundary for the study begins with waste collection and shipping to a material recovery
facility, includes all aspects of fuel production, and the fuel use phase. The feedstock is assumed to
have zero emissions at the point of collection, and emissions from the combustion of the fuel are
taken into account. The functional unit of this analysis is 1MJ of diesel, and the emissions of 1MJ of
plastic- derived diesel are compared to 1MJ of crude-oil derived diesel.
In order to compare the environmental impacts of the plastic-to-fuel pathway with the conventional
waste disposal pathway that it is displacing, an additional analysis is carried out using the same
system boundary but with a functional unit of 1 tonne of waste.
Allocation
Three different allocation methods are investigated in this study: displacement, energy allocation
and market value allocation. Energy allocation was used as a base case technique because all
products in the system were energy products. The emissions factor of the diesel was lowest with
displacement, followed by energy allocation and highest with market-based allocation of emissions
to co-products. The GHG emissions of diesel with market allocation were up to approximately 10%
higher than the GHG emissions of diesel with energy allocation.

Final report
58
JRC (2016)
Description
In 2016 the JRC put forward guidelines for calculating the GHG emissions associated with low-carbon
fossil fuels and renewable fuels of non-biological origin, for the purposes of calculating default values
for these fuels under the FQD legislation. The methodology is generally consistent with that laid out
in Annex IV of the FQD / Annex V of the RED.
System boundary
The approach taken depends on whether the input is elastic or rigid. Elastic feedstocks are defined
as those for which supply can expand to satisfy additional demand, for example a commodity such as
natural gas, in which case attributional LCA is used. A rigid feedstock is defined as one where the
supply of the input cannot be expected to expand to meet demand, such as MSW. The GHG intensity
of a rigid feedstock is assessed based on the GHG impacts of removing a quantity of that material /
energy from its current use. If the feedstock would have had a productive use then the GHG
emissions of providing that service / product by an alternative resource are included in the rigid
feedstock emission factor.
Allocation
Allocation of emissions to co-products is not explicitly addressed in this guidance from the JRC. In the
few cases where it was required, allocation was done on an exergy basis.
Existing DfT biofuels methodology
Description
The existing method that DfT uses for calculating the GHG emissions associated with biofuels is based
on the method prescribed in the Renewable Energy Directive legislation.
System boundary
The system boundary includes biomass cultivation and harvesting, fuel production, and fuel use.
Because the carbon in the system is biogenic, emissions from fuel combustion and any CO2 released
as part of the fuel production process are assumed to be zero in terms of their GHG impact.
When biomass wastes or residues are used for fuel production, the system boundary starts at the
point of collection of the waste. Emissions from avoided alternative uses of these wastes are not
included.
Allocation
Energy allocation is used, except in the case of excess electricity produced by feedstocks which are
not co-products of the system (except for agricultural crop residues) for example excess electricity
produced from on-site natural gas CHP, where the fuel is given an emissions credit for displaced
electricity.
Final report
59
Existing DfT RFNBO methodology
Description
DfT has put forward a methodology for calculating the GHG emissions of RFNBOs in the RTFO
guidance documents which are currently under consultation.
System boundary
The system boundary of this methodology includes emissions from the extraction / collection of raw
materials, all emissions associated with fuel production, and the emissions from the fuel in use.
Allocation
As for biofuels, energy allocation is proposed, except in the case where excess electricity is produced
by cogeneration, in which case a credit is given for avoided generation of an equal amount of
electricity using the same fuel.

Final report
60
Appendix F Risk that production and use of the fuel will lead to increased lifecycle GHG emissions
Fuel produced from natural gas
In most cases, transport fuels produced from natural gas are likely to have emissions similar to those
from conventional gasoline or diesel.
Indicative values are given in the FQD Implementing Directive60 for the emissions factors of fuels
produced from natural gas (Table 8), illustrating that their emissions factors are slightly lower than
those of the fossil fuel comparator61. A recent study from the ETI (2017)62 explores in more detail the
impact of different natural gas upstream emissions, transportation, distribution, dispensing and
vehicle use scenarios. They conclude that LNG and CNG have the potential to reduce greenhouse gas
emissions on a well-to-motion basis by 13% and 20% respectively in dedicated engines and by 16%
and 24% respectively for dual-fuel HPDI engines. However they also note that methane slip, which
can be particularly problematic in retrofit engines, can result in GHG emissions that are worse than
the diesel comparator. Given this variability in the GHG emissions, it is assessed in Table 6 that
natural gas pathways are moderately likely to increase lifecycle GHG emissions compared to the
fossil comparator.
Use of CCS in liquid fuel production has the potential to significantly reduce the GHG emissions of the
final fuel. While use of CCS is not widespread globally there are some facilities operating today. For
example Air Products in Texas and Shell in Alberta currently carry out hydrogen production from
natural gas with CCS.63
Table 8 Average life cycle greenhouse gas intensity values for fuels produced from natural gas (Default values from FQD Implementing Directive)
Raw material
source and process
Fuel placed on the market GHG intensity of fuel
(gCO2eq/MJ)
GHG intensity
of fuel
(gCO2eq/MJ)
Natural gas (EU mix) Compressed natural gas in a
spark ignition engine
69.3 94.1
Natural gas (EU mix) Liquefied natural gas in a spark
ignition engine
74.5 94.1
Any fossil sources Liquefied petroleum gas in a
spark ignition engine
73.6 94.1
60 Council Directive (EU) 2015/652 61 In this section of the study these emissions factors from the FQD Implementing Directive will be used for comparison of potential low-carbon fossil fuels with conventional gasoline or diesel, noting that these are slightly higher than the fossil fuel comparator used in the RED, 83.8gCO2eq/MJ 62 ETI (2017) Natural gas pathway analysis for heavy duty vehicles, Available from: http://bit.ly/2zNxfRR (Accessed on 28th November 2017) 63 Global CCS Institute (2017) Projects Database, Available from: https://www.globalccsinstitute.com/projects/large-scale-ccs-projects (Accessed on 21st October 2017)
Final report
61
Natural gas using
steam reforming
Compressed hydrogen in a fuel
cell
104.3 94.1
If natural gas that is currently flared is used for fuel production, then the emissions from its
combustion could be assumed to have occurred anyway in the counterfactual case. If this is taken
into account, the GHG impacts of the gas feedstock would be low.
However, several aspects complicate the accurate assessment of the GHG impacts of using
associated natural gas for fuel production:
Reductions in associated gas flaring can also count as upstream emission reductions (UERs) to
contribute to the 2020 FQD target, which means that there is a risk of double-counting these
emissions savings.
Given that globally natural gas flaring is decreasing, and significant efforts are being made and
supported by multilateral donors to reduce associated gas flaring, it is likely that many producers
will soon implement methane capture or other means of reduced production. If this is likely to
occur without government subsidy then this reduces the case for UK government supporting its
use for fuels today.
Therefore we would recommend that flared gas reduction / use should be considered as a UER
rather than being able to be counted as a ‘waste’ feedstock for liquid fuel production.
Fuel produced from coal
Transport fuels produced from coal are likely to have emissions substantially higher than those from
conventional gasoline or diesel. Use of CCS could reduce these emissions, potentially so that the fuel
overall has lower GHG emissions compared to gasoline or diesel (Table 9). However there are no
known commercial coal to liquids plants with CCS operating today. Demonstration-scale CCS was
carried out at the Shenhua Group coal-to-liquids plant in China. Also a large-scale coal-to-liquids
plant with CCS is planned for the 2020’s in the Ningxia region of China,64 and a coal to hydrogen plant
including CCS is planned for Australia.65 Given the early stage of these CCS technologies and isolated
implementation, fuels produced from coal are assessed as highly likely to have increased lifecycle
GHG emissions compared to conventional gasoline or diesel in summary Table 6.
Table 9 Average life cycle greenhouse gas intensity values for fuels produced from coal (Default values from FQD Implementing Directive)
Raw material source and process Fuel placed on the market GHG intensity of
fuel (gCO2eq/MJ)
Coal Compressed hydrogen in a fuel
cell
234.4
64 Global CCS Institute (2017) Projects Database, Available from: https://www.globalccsinstitute.com/projects/large-scale-ccs-projects (Accessed on 21st October 2017) 65 ChEnected (2017) Kawasaki Industries Wants to Make Dirty Lignite Coal Useful and Clean, Available from: https://www.aiche.org/chenected/2017/04/kawasaki-industries-wants-make-dirty-lignite-coal-useful-and-clean (Accessed on 28th November 2017)
Final report
62
Coal with carbon capture and storage
of process emissions
Compressed hydrogen in a fuel
cell
52.7
Fuel produced from waste fossil plastic
Summary
The GHG emissions associated with using waste fossil plastics as a feedstock depend on the use from
which that plastic is diverted:
Diversion of plastic from landfill or recycling results in high GHG emissions associated with
the feedstock.
Waste plastic diverted from combustion with energy recovery can have GHG emissions
ranging from low to high, depending on the energy that replaces the plastic.
Waste plastic diverted from combustion without energy recovery would be likely to have low
GHG emissions
Plastic used to make low carbon fossil fuels, which is likely to be diverted from either landfill or
energy from waste in the UK, if it cannot be diverted from recycling due to the sustainability
assessment framework, generally has emissions similar to or lower than conventional fossil fuels,
except in some specific cases such as plastic use in cement kilns.
Most likely fate of waste fossil plastic in the UK
Wrap and Valpak66 carried out a study in 2016 into the fate of all waste plastic arising in the UK from
both household and commercial sectors. They concluded that of the plastic that was collected
specifically for recycling, reuse and recovery, 28% was recycled in the UK, 59% was exported
(ostensibly for recycling, but in reality this is very hard to monitor)67 and 13% was sent to energy
from waste. Of the plastic in residual waste, 56% was treated in an energy from waste plant, 37%
was sent to landfill and 7% was treated by mechanical biological treatment (MBT). Figure 14
summarises the fate of all waste plastic in the UK, including both the plastic collected specifically for
recycling, reuse and recovery, and the plastic in residual waste.
66 Wrap and Valpak (2016) Plastics spatial flow, an assessment of the quantity of un-recycled plastic in the UK 67 Velis C.A. (2014). Global recycling markets - plastic waste: A story for one player – China. Report prepared by FUELogy and formatted by D-waste on behalf of International Solid Waste Association - Globalisation and Waste Management Task Force. ISWA, Vienna, September 2014.
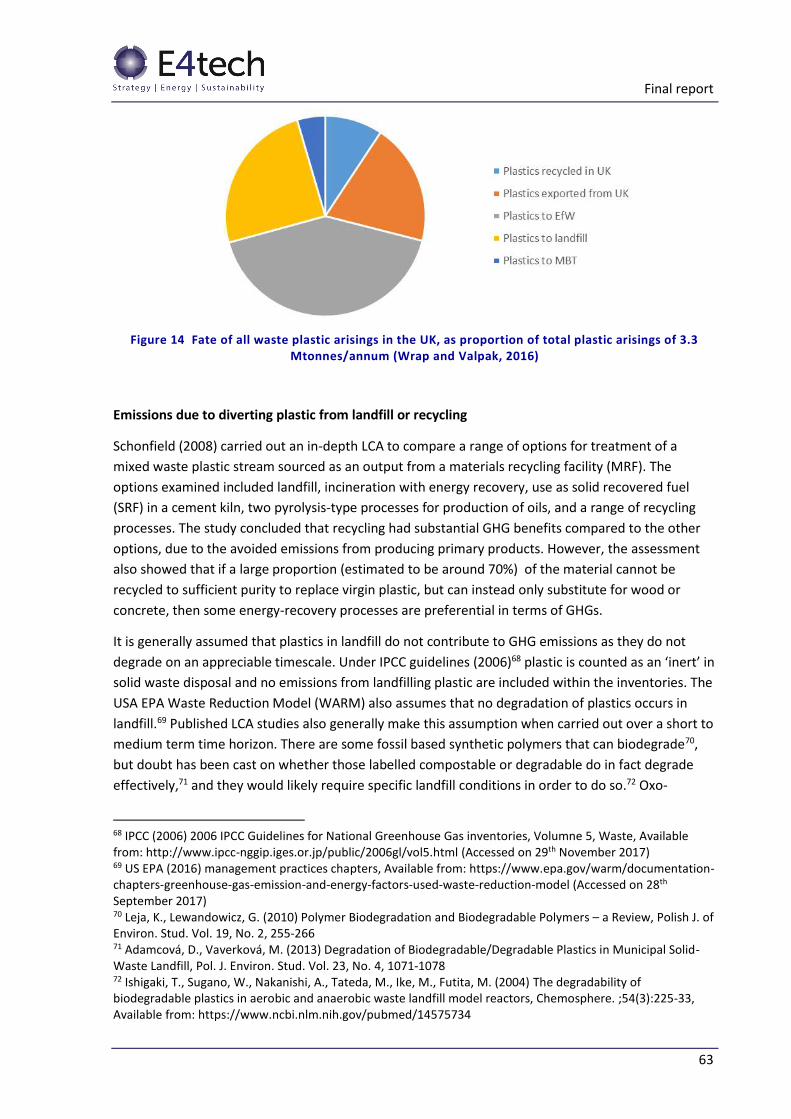
Final report
63
Figure 14 Fate of all waste plastic arisings in the UK, as proportion of total plastic arisings of 3.3 Mtonnes/annum (Wrap and Valpak, 2016)
Emissions due to diverting plastic from landfill or recycling
Schonfield (2008) carried out an in-depth LCA to compare a range of options for treatment of a
mixed waste plastic stream sourced as an output from a materials recycling facility (MRF). The
options examined included landfill, incineration with energy recovery, use as solid recovered fuel
(SRF) in a cement kiln, two pyrolysis-type processes for production of oils, and a range of recycling
processes. The study concluded that recycling had substantial GHG benefits compared to the other
options, due to the avoided emissions from producing primary products. However, the assessment
also showed that if a large proportion (estimated to be around 70%) of the material cannot be
recycled to sufficient purity to replace virgin plastic, but can instead only substitute for wood or
concrete, then some energy-recovery processes are preferential in terms of GHGs.
It is generally assumed that plastics in landfill do not contribute to GHG emissions as they do not
degrade on an appreciable timescale. Under IPCC guidelines (2006)68 plastic is counted as an ‘inert’ in
solid waste disposal and no emissions from landfilling plastic are included within the inventories. The
USA EPA Waste Reduction Model (WARM) also assumes that no degradation of plastics occurs in
landfill.69 Published LCA studies also generally make this assumption when carried out over a short to
medium term time horizon. There are some fossil based synthetic polymers that can biodegrade70,
but doubt has been cast on whether those labelled compostable or degradable do in fact degrade
effectively,71 and they would likely require specific landfill conditions in order to do so.72 Oxo-
68 IPCC (2006) 2006 IPCC Guidelines for National Greenhouse Gas inventories, Volumne 5, Waste, Available from: http://www.ipcc-nggip.iges.or.jp/public/2006gl/vol5.html (Accessed on 29th November 2017) 69 US EPA (2016) management practices chapters, Available from: https://www.epa.gov/warm/documentation-chapters-greenhouse-gas-emission-and-energy-factors-used-waste-reduction-model (Accessed on 28th September 2017) 70 Leja, K., Lewandowicz, G. (2010) Polymer Biodegradation and Biodegradable Polymers – a Review, Polish J. of Environ. Stud. Vol. 19, No. 2, 255-266 71 Adamcová, D., Vaverková, M. (2013) Degradation of Biodegradable/Degradable Plastics in Municipal Solid-Waste Landfill, Pol. J. Environ. Stud. Vol. 23, No. 4, 1071-1078 72 Ishigaki, T., Sugano, W., Nakanishi, A., Tateda, M., Ike, M., Futita, M. (2004) The degradability of biodegradable plastics in aerobic and anaerobic waste landfill model reactors, Chemosphere. ;54(3):225-33, Available from: https://www.ncbi.nlm.nih.gov/pubmed/14575734
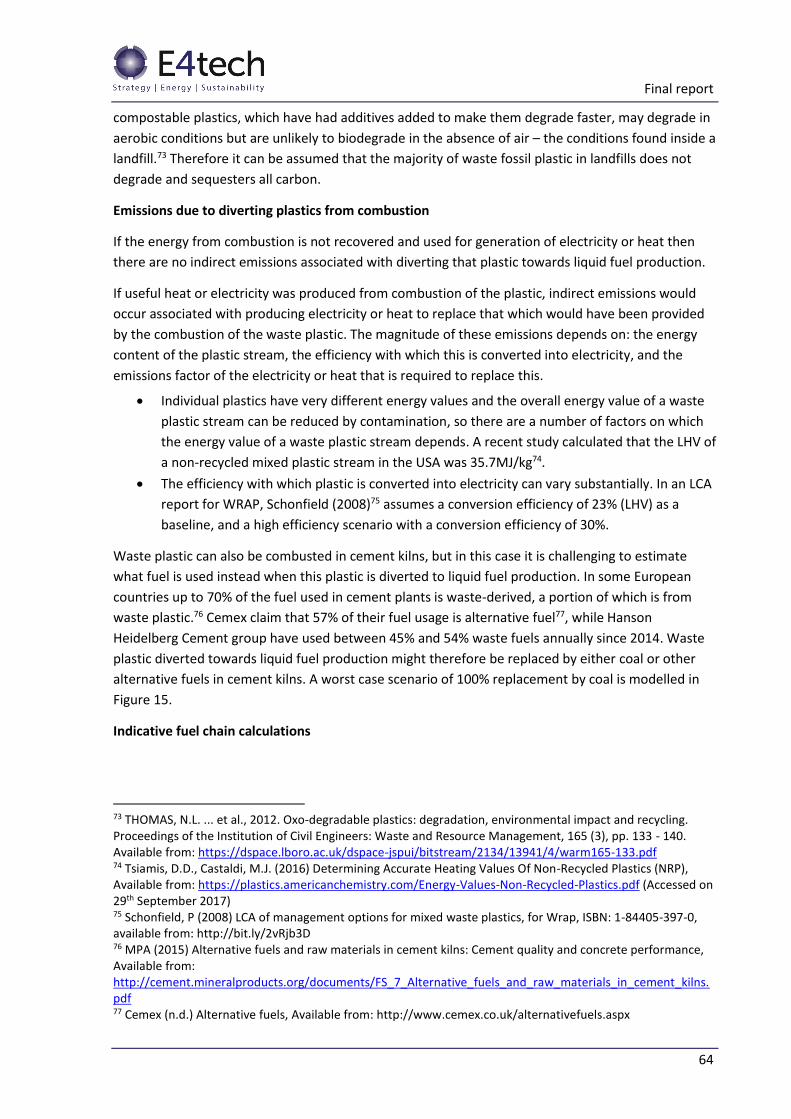
Final report
64
compostable plastics, which have had additives added to make them degrade faster, may degrade in
aerobic conditions but are unlikely to biodegrade in the absence of air – the conditions found inside a
landfill.73 Therefore it can be assumed that the majority of waste fossil plastic in landfills does not
degrade and sequesters all carbon.
Emissions due to diverting plastics from combustion
If the energy from combustion is not recovered and used for generation of electricity or heat then
there are no indirect emissions associated with diverting that plastic towards liquid fuel production.
If useful heat or electricity was produced from combustion of the plastic, indirect emissions would
occur associated with producing electricity or heat to replace that which would have been provided
by the combustion of the waste plastic. The magnitude of these emissions depends on: the energy
content of the plastic stream, the efficiency with which this is converted into electricity, and the
emissions factor of the electricity or heat that is required to replace this.
Individual plastics have very different energy values and the overall energy value of a waste
plastic stream can be reduced by contamination, so there are a number of factors on which
the energy value of a waste plastic stream depends. A recent study calculated that the LHV of
a non-recycled mixed plastic stream in the USA was 35.7MJ/kg74.
The efficiency with which plastic is converted into electricity can vary substantially. In an LCA
report for WRAP, Schonfield (2008)75 assumes a conversion efficiency of 23% (LHV) as a
baseline, and a high efficiency scenario with a conversion efficiency of 30%.
Waste plastic can also be combusted in cement kilns, but in this case it is challenging to estimate
what fuel is used instead when this plastic is diverted to liquid fuel production. In some European
countries up to 70% of the fuel used in cement plants is waste-derived, a portion of which is from
waste plastic.76 Cemex claim that 57% of their fuel usage is alternative fuel77, while Hanson
Heidelberg Cement group have used between 45% and 54% waste fuels annually since 2014. Waste
plastic diverted towards liquid fuel production might therefore be replaced by either coal or other
alternative fuels in cement kilns. A worst case scenario of 100% replacement by coal is modelled in
Figure 15.
Indicative fuel chain calculations
73 THOMAS, N.L. ... et al., 2012. Oxo-degradable plastics: degradation, environmental impact and recycling. Proceedings of the Institution of Civil Engineers: Waste and Resource Management, 165 (3), pp. 133 - 140. Available from: https://dspace.lboro.ac.uk/dspace-jspui/bitstream/2134/13941/4/warm165-133.pdf 74 Tsiamis, D.D., Castaldi, M.J. (2016) Determining Accurate Heating Values Of Non-Recycled Plastics (NRP), Available from: https://plastics.americanchemistry.com/Energy-Values-Non-Recycled-Plastics.pdf (Accessed on 29th September 2017) 75 Schonfield, P (2008) LCA of management options for mixed waste plastics, for Wrap, ISBN: 1-84405-397-0, available from: http://bit.ly/2vRjb3D 76 MPA (2015) Alternative fuels and raw materials in cement kilns: Cement quality and concrete performance, Available from: http://cement.mineralproducts.org/documents/FS_7_Alternative_fuels_and_raw_materials_in_cement_kilns.pdf 77 Cemex (n.d.) Alternative fuels, Available from: http://www.cemex.co.uk/alternativefuels.aspx
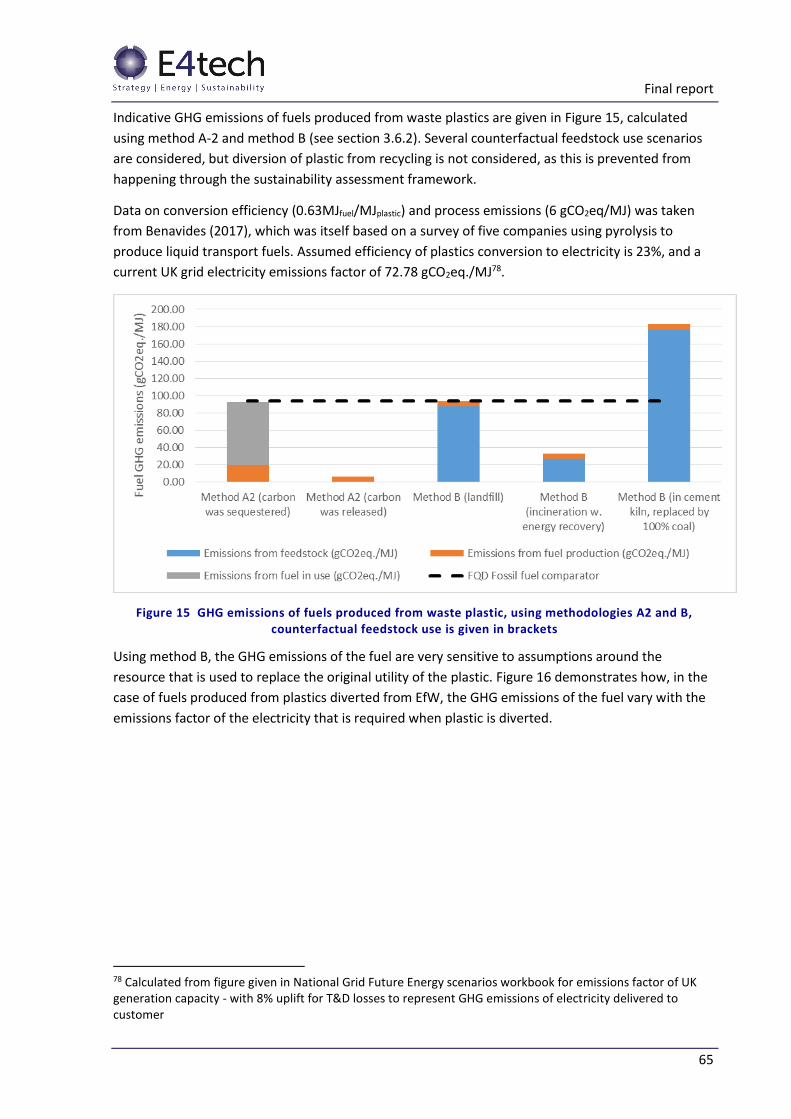
Final report
65
Indicative GHG emissions of fuels produced from waste plastics are given in Figure 15, calculated
using method A-2 and method B (see section 3.6.2). Several counterfactual feedstock use scenarios
are considered, but diversion of plastic from recycling is not considered, as this is prevented from
happening through the sustainability assessment framework.
Data on conversion efficiency (0.63MJfuel/MJplastic) and process emissions (6 gCO2eq/MJ) was taken
from Benavides (2017), which was itself based on a survey of five companies using pyrolysis to
produce liquid transport fuels. Assumed efficiency of plastics conversion to electricity is 23%, and a
current UK grid electricity emissions factor of 72.78 gCO2eq./MJ78.
Figure 15 GHG emissions of fuels produced from waste plastic, using methodologies A2 and B, counterfactual feedstock use is given in brackets
Using method B, the GHG emissions of the fuel are very sensitive to assumptions around the
resource that is used to replace the original utility of the plastic. Figure 16 demonstrates how, in the
case of fuels produced from plastics diverted from EfW, the GHG emissions of the fuel vary with the
emissions factor of the electricity that is required when plastic is diverted.
78 Calculated from figure given in National Grid Future Energy scenarios workbook for emissions factor of UK generation capacity - with 8% uplift for T&D losses to represent GHG emissions of electricity delivered to customer
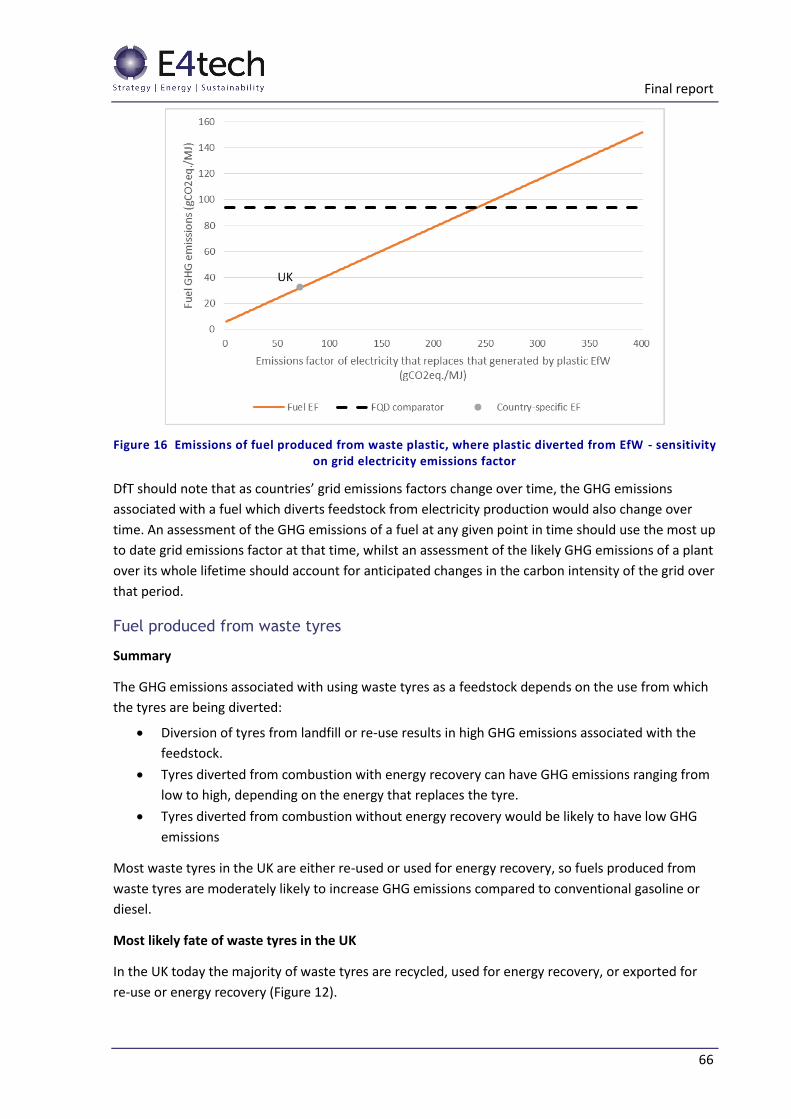
Final report
66
Figure 16 Emissions of fuel produced from waste plastic, where plastic diverted from EfW - sensitivity on grid electricity emissions factor
DfT should note that as countries’ grid emissions factors change over time, the GHG emissions
associated with a fuel which diverts feedstock from electricity production would also change over
time. An assessment of the GHG emissions of a fuel at any given point in time should use the most up
to date grid emissions factor at that time, whilst an assessment of the likely GHG emissions of a plant
over its whole lifetime should account for anticipated changes in the carbon intensity of the grid over
that period.
Fuel produced from waste tyres
Summary
The GHG emissions associated with using waste tyres as a feedstock depends on the use from which
the tyres are being diverted:
Diversion of tyres from landfill or re-use results in high GHG emissions associated with the
feedstock.
Tyres diverted from combustion with energy recovery can have GHG emissions ranging from
low to high, depending on the energy that replaces the tyre.
Tyres diverted from combustion without energy recovery would be likely to have low GHG
emissions
Most waste tyres in the UK are either re-used or used for energy recovery, so fuels produced from
waste tyres are moderately likely to increase GHG emissions compared to conventional gasoline or
diesel.
Most likely fate of waste tyres in the UK
In the UK today the majority of waste tyres are recycled, used for energy recovery, or exported for
re-use or energy recovery (Figure 12).
Final report
67
Diversion of tyres from landfill or re-use
Whilst used tyres can be re-treaded, re-used or recycled, the sustainability assessment framework
ensure that tyres should not be diverted from these fates to make liquid transport fuels, so this
scenario will not be further considered here.
If tyres are landfilled the carbon is sequestered, as tyres do not degrade. Therefore as for the waste
fossil plastic stream, the GHG emissions from fuels produced from tyres that would have been
landfilled is likely to be similar to the GHG emissions from conventional gasoline or diesel.
Diversion of tyres from combustion:
If tyres are diverted from combustion without energy recovery then the GHG emissions associated
with use of those tyres for liquid fuel production are low.
If tyres are diverted from combustion with energy recovery then, as outlined above for waste
plastics, GHG emissions could range from low to high depending on what type of energy is used to
replace the energy that was generated by tyre combustion.
As for waste plastics, waste tyres can be combusted in cement kilns. A worst case scenario of 100%
replacement with coal would produce a fuel with GHG emissions substantially higher than
conventional gasoline or diesel.
Fuel produced from mixed waste streams
Summary:
The GHG emissions associated with using the fossil fraction of mixed waste (municipal solid waste or
commercial and industrial waste) as a feedstock depends from which use the waste is diverted:
Diversion of mixed waste from landfill results in high GHG emissions associated with the
feedstock.
Mixed waste diverted from combustion with energy recovery can have GHG emissions
ranging from low to high, depending on the fuel that replaces it.
Mixed waste diverted from combustion without energy recovery would be likely to have low
GHG emissions
Use of mixed waste for liquid fuels production is likely to divert it either from landfill or from
combustion with energy recovery in the UK.
Most likely fate of mixed waste in the UK
Figure 17 illustrates that the majority of local-authority collected waste in England is recycled or
composted, the second most prevalent treatment route is incineration with energy from waste, and
around 20% is still sent to landfill.
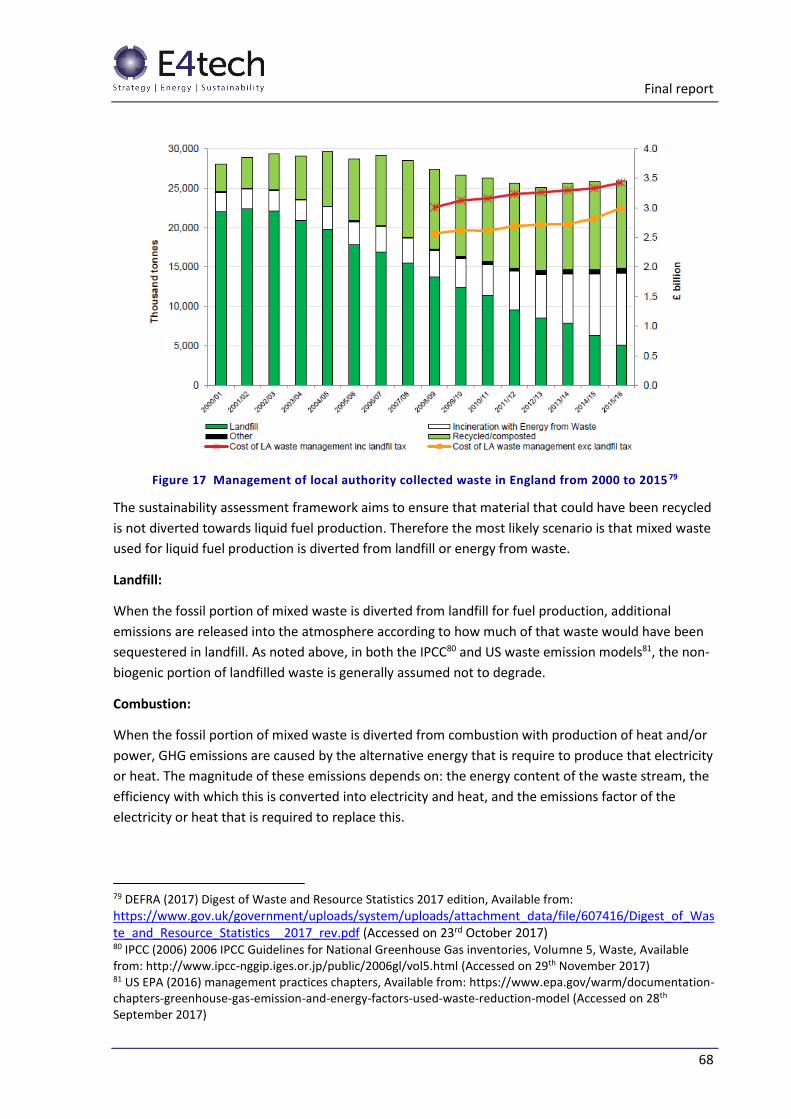
Final report
68
Figure 17 Management of local authority collected waste in England from 2000 to 2015 79
The sustainability assessment framework aims to ensure that material that could have been recycled
is not diverted towards liquid fuel production. Therefore the most likely scenario is that mixed waste
used for liquid fuel production is diverted from landfill or energy from waste.
Landfill:
When the fossil portion of mixed waste is diverted from landfill for fuel production, additional
emissions are released into the atmosphere according to how much of that waste would have been
sequestered in landfill. As noted above, in both the IPCC80 and US waste emission models81, the non-
biogenic portion of landfilled waste is generally assumed not to degrade.
Combustion:
When the fossil portion of mixed waste is diverted from combustion with production of heat and/or
power, GHG emissions are caused by the alternative energy that is require to produce that electricity
or heat. The magnitude of these emissions depends on: the energy content of the waste stream, the
efficiency with which this is converted into electricity and heat, and the emissions factor of the
electricity or heat that is required to replace this.
79 DEFRA (2017) Digest of Waste and Resource Statistics 2017 edition, Available from:
https://www.gov.uk/government/uploads/system/uploads/attachment_data/file/607416/Digest_of_Waste_and_Resource_Statistics__2017_rev.pdf (Accessed on 23rd October 2017) 80 IPCC (2006) 2006 IPCC Guidelines for National Greenhouse Gas inventories, Volumne 5, Waste, Available from: http://www.ipcc-nggip.iges.or.jp/public/2006gl/vol5.html (Accessed on 29th November 2017) 81 US EPA (2016) management practices chapters, Available from: https://www.epa.gov/warm/documentation-chapters-greenhouse-gas-emission-and-energy-factors-used-waste-reduction-model (Accessed on 28th September 2017)
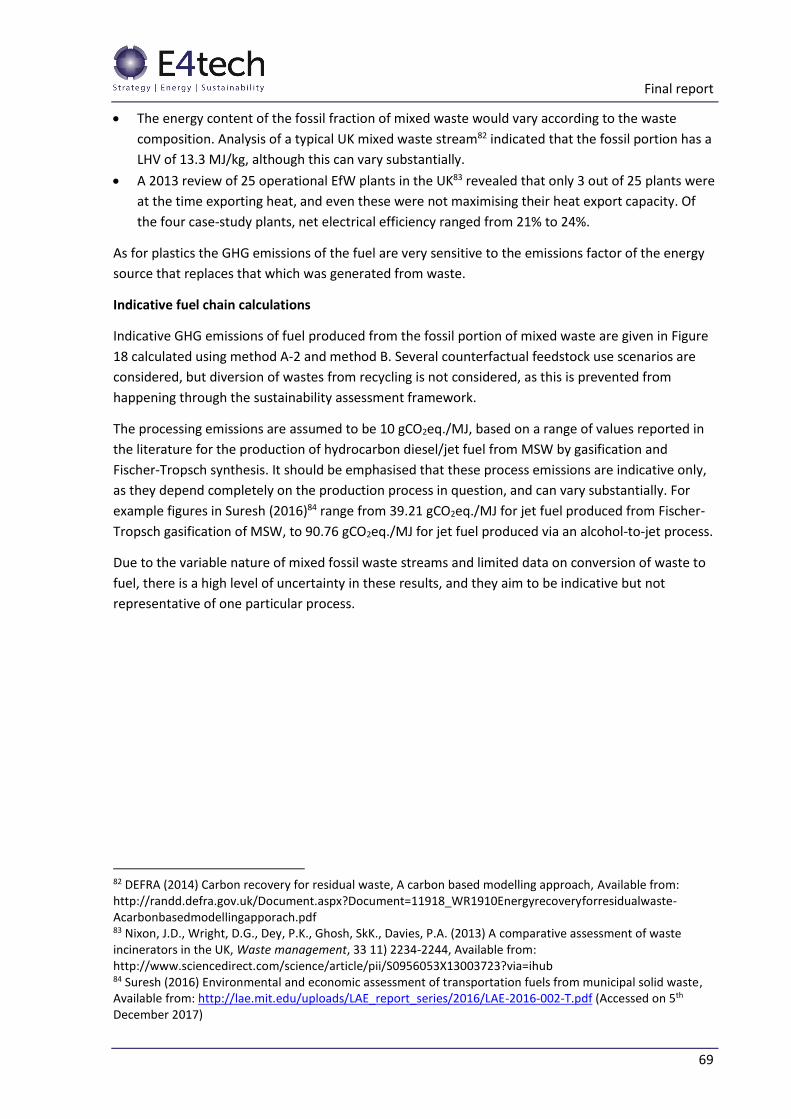
Final report
69
The energy content of the fossil fraction of mixed waste would vary according to the waste
composition. Analysis of a typical UK mixed waste stream82 indicated that the fossil portion has a
LHV of 13.3 MJ/kg, although this can vary substantially.
A 2013 review of 25 operational EfW plants in the UK83 revealed that only 3 out of 25 plants were
at the time exporting heat, and even these were not maximising their heat export capacity. Of
the four case-study plants, net electrical efficiency ranged from 21% to 24%.
As for plastics the GHG emissions of the fuel are very sensitive to the emissions factor of the energy
source that replaces that which was generated from waste.
Indicative fuel chain calculations
Indicative GHG emissions of fuel produced from the fossil portion of mixed waste are given in Figure
18 calculated using method A-2 and method B. Several counterfactual feedstock use scenarios are
considered, but diversion of wastes from recycling is not considered, as this is prevented from
happening through the sustainability assessment framework.
The processing emissions are assumed to be 10 gCO2eq./MJ, based on a range of values reported in
the literature for the production of hydrocarbon diesel/jet fuel from MSW by gasification and
Fischer-Tropsch synthesis. It should be emphasised that these process emissions are indicative only,
as they depend completely on the production process in question, and can vary substantially. For
example figures in Suresh (2016)84 range from 39.21 gCO2eq./MJ for jet fuel produced from Fischer-
Tropsch gasification of MSW, to 90.76 gCO2eq./MJ for jet fuel produced via an alcohol-to-jet process.
Due to the variable nature of mixed fossil waste streams and limited data on conversion of waste to
fuel, there is a high level of uncertainty in these results, and they aim to be indicative but not
representative of one particular process.
82 DEFRA (2014) Carbon recovery for residual waste, A carbon based modelling approach, Available from: http://randd.defra.gov.uk/Document.aspx?Document=11918_WR1910Energyrecoveryforresidualwaste-Acarbonbasedmodellingapporach.pdf 83 Nixon, J.D., Wright, D.G., Dey, P.K., Ghosh, SkK., Davies, P.A. (2013) A comparative assessment of waste incinerators in the UK, Waste management, 33 11) 2234-2244, Available from: http://www.sciencedirect.com/science/article/pii/S0956053X13003723?via=ihub 84 Suresh (2016) Environmental and economic assessment of transportation fuels from municipal solid waste, Available from: http://lae.mit.edu/uploads/LAE_report_series/2016/LAE-2016-002-T.pdf (Accessed on 5th December 2017)
Final report
70
Figure 18 GHG emissions of fuels produced from MSW, using methodologies A2 and B, counterfactual feedstock use is given in brackets
Fuel produced from waste fossil liquids
Summary
Waste fossil liquids produced in the UK and Europe are likely to be either disposed of through
incineration, particularly if they are hazardous, or transformed into secondary liquid fuel (SLF) which
is produced by waste management companies such as Veolia and Chemkel in the UK and can be used
in cement kilns.85 Use of waste fossil liquids for liquid transport fuel production could cause no
indirect emissions if the feedstock would have been incinerated with no energy recovery, or could
have indirect emissions ranging from low to high if the feedstock would have been used to generate
energy, therefore it is assessed in Table 6 as moderately likely to cause increased GHG emissions
compared to conventional gasoline or diesel.
Combustion:
If the counterfactual is incineration with no energy recovery, there are no indirect emissions
associated with diverting the waste fossil liquids away from this fate.
If the liquids would have otherwise been used to provide heat and/or power then there are GHG
emissions associated with alternative methods of producing this energy. If secondary liquid fuels are
diverted away from use in lime and cement kilns, they may be replaced by fossil fuels, or they may be
replaced by other waste-based fuels which are also commonly used in these industries in the UK,
including waste tyres. As noted above, Cemex claim to use 57% alternative fuels in their cement
kilns, including SLF and waste tyres.86 Therefore the indirect emissions associated with using this
feedstock for transport fuel production could range from low to high depending on the energy with
which it is replaced.
85 Environment Agency (2008) The use of substitute fuels in the UK cement and lime industries, Available from: http://cdn.environment-agency.gov.uk/scho1207bnna-e-e.pdf (Accessed on 26th September 2017) 86 Cemex (2017) Alternative fuels, available from: http://www.cemex.co.uk/alternativefuels.aspx (Accessed on 26th September 2017)
Final report
71
Landfill:
In the UK it is not permitted to dispose of liquid waste in landfill,87 however this could be a possible
counterfactual if the feedstock originates in another country, where disposal of hazardous liquids in
landfill is permitted. If liquid fossil waste feedstock was supplied into the UK from regions where
landfill disposal was an option, further work would be required to understand the impact of diverting
it from this use.
Fuel produced from industrial waste CO-containing gases
Likely fate of waste CO-containing gases
Waste gases are extremely expensive to store, and cannot be released to the atmosphere as CO,
therefore are combusted either without energy recovery (flared) or with energy recovery in the form
of electricity and/or heat.
Indicative fuel chain calculations
Indicative GHG emissions values are given for fuels produced from industrial waste CO-containing
gases in Figure 19. Calculation of GHG emissions using option A-2 (system boundary at point of
collection of feedstock) is only considered for these fuels in the case where this carbon was released,
because there is no way to store or sequester the carbon in the gaseous feedstock. It is always
released to the atmosphere either by flaring or combustion for energy recovery.
Two illustrative counterfactuals are used with method B:
Gas would have been incinerated for energy recovery, additional electricity with UK grid
electricity emissions factor required to replace this.
Gas would have been flared, with no energy recovery
These calculations indicate that these fuels are unlikely to increase GHG emissions compared to
conventional diesel or gasoline, therefore in Table 6 they are rated as low likelihood that this risk will
materialise.
87 Environment Agency (2010) Waste acceptance at landfills, Available from: https://www.gov.uk/government/uploads/system/uploads/attachment_data/file/296422/geho1110btew-e-e.pdf (Accessed on 26th September 2017)
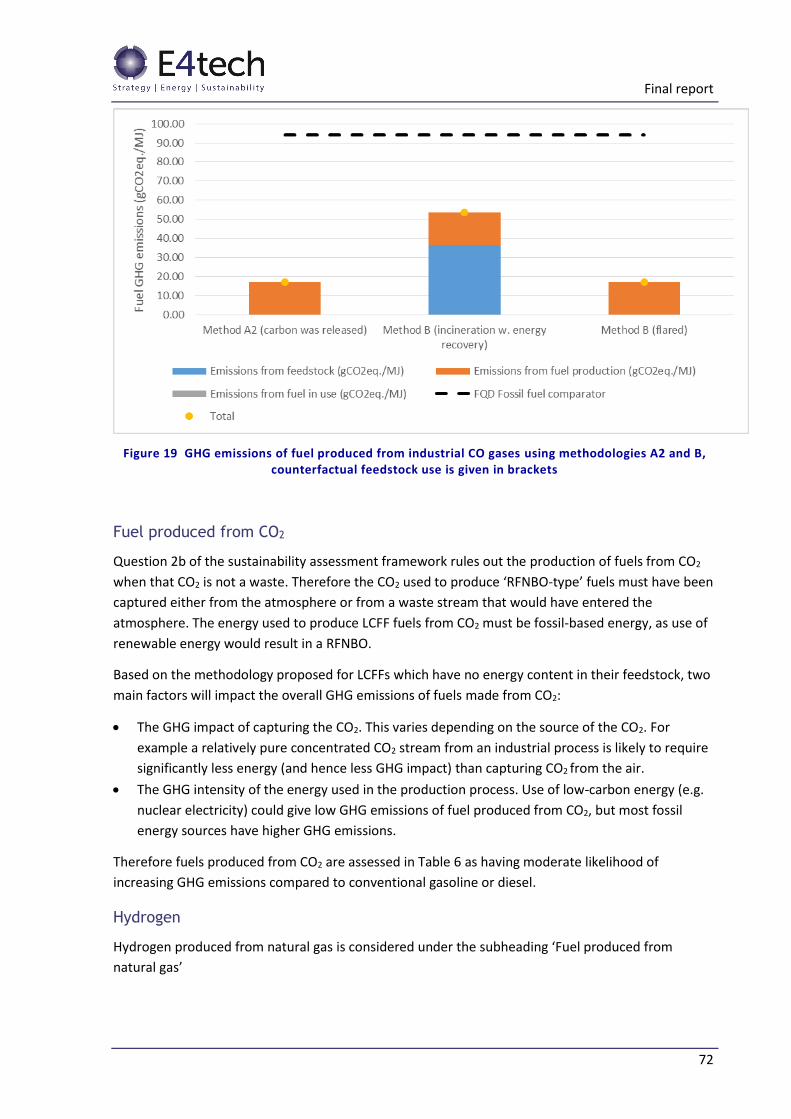
Final report
72
Figure 19 GHG emissions of fuel produced from industrial CO gases using methodologies A2 and B, counterfactual feedstock use is given in brackets
Fuel produced from CO2
Question 2b of the sustainability assessment framework rules out the production of fuels from CO2
when that CO2 is not a waste. Therefore the CO2 used to produce ‘RFNBO-type’ fuels must have been
captured either from the atmosphere or from a waste stream that would have entered the
atmosphere. The energy used to produce LCFF fuels from CO2 must be fossil-based energy, as use of
renewable energy would result in a RFNBO.
Based on the methodology proposed for LCFFs which have no energy content in their feedstock, two
main factors will impact the overall GHG emissions of fuels made from CO2:
The GHG impact of capturing the CO2. This varies depending on the source of the CO2. For
example a relatively pure concentrated CO2 stream from an industrial process is likely to require
significantly less energy (and hence less GHG impact) than capturing CO2 from the air.
The GHG intensity of the energy used in the production process. Use of low-carbon energy (e.g.
nuclear electricity) could give low GHG emissions of fuel produced from CO2, but most fossil
energy sources have higher GHG emissions.
Therefore fuels produced from CO2 are assessed in Table 6 as having moderate likelihood of
increasing GHG emissions compared to conventional gasoline or diesel.
Hydrogen
Hydrogen produced from natural gas is considered under the subheading ‘Fuel produced from
natural gas’

Final report
73
Hydrogen produced from electricity, and CO2 or water should be assessed following the methodology
laid out in section 3.6.2.1 which is equivalent to the methodology for RFNBOs currently under
consultation by DfT. As discussed above, hydrogen produced from UK grid electricity must, under
these proposals use an average emissions factor from the UK grid. We also give indicative emissions
for hydrogen produced solely from natural gas and nuclear electricity, which would be the emissions
factors if the renewable and non-renewable portions of these fuels could be given different GHG
emissions.
Indicative fuel chain calculations
Figure 13 illustrates the emissions of hydrogen produced from natural gas by steam methane
reforming (orange bars) and by electrolysis (blue bars), assessed according to the appropriate
methodologies. Electrolysis efficiency of 70MJhydrogen/MJelectricity is assumed, and data for hydrogen
production from natural gas is taken from the JEC Well-to-Wheels study, which uses this method.
For all hydrogen emissions factors shown in Figure 20, it is assumed that the fuel is used in a fuel cell
vehicle, so a multiplier of 0.4 has been applied to reflect higher powertrain efficiency than an internal
combustion engine.
Figure 20 GHG emissions of hydrogen produced from non-waste fossil fuel (orange bars) and electricity (blue bars). Dashed line shows FQD fossil fuel comparator (94.1gCO 2eq./MJ)
The GHG emissions for production of hydrogen from electricity are assessed based on the RFNBO
methodology laid out in the most recent RTFO consultation (Figure 20, blue bars). As discussed
above, hydrogen produced from UK grid electricity must, under these proposals, use an average
emissions factor from the UK grid. We also illustrate the emissions factor of hydrogen produced
solely from natural gas and nuclear electricity.