Embed Size (px)
Citation preview
Supporting Information
Solid-state NMR Study of the YadA Membrane-Anchor Domain in theBacterial Outer MembraneShakeel A. Shahid, Madhu Nagaraj, Nandini Chauhan, Trent W. Franks, Benjamin Bardiaux,Michael Habeck, Marcella Orwick-Rydmark, Dirk Linke,* and Barth-J. van Rossum*
ange_201505506_sm_miscellaneous_information.pdf
1
Supplementary Information
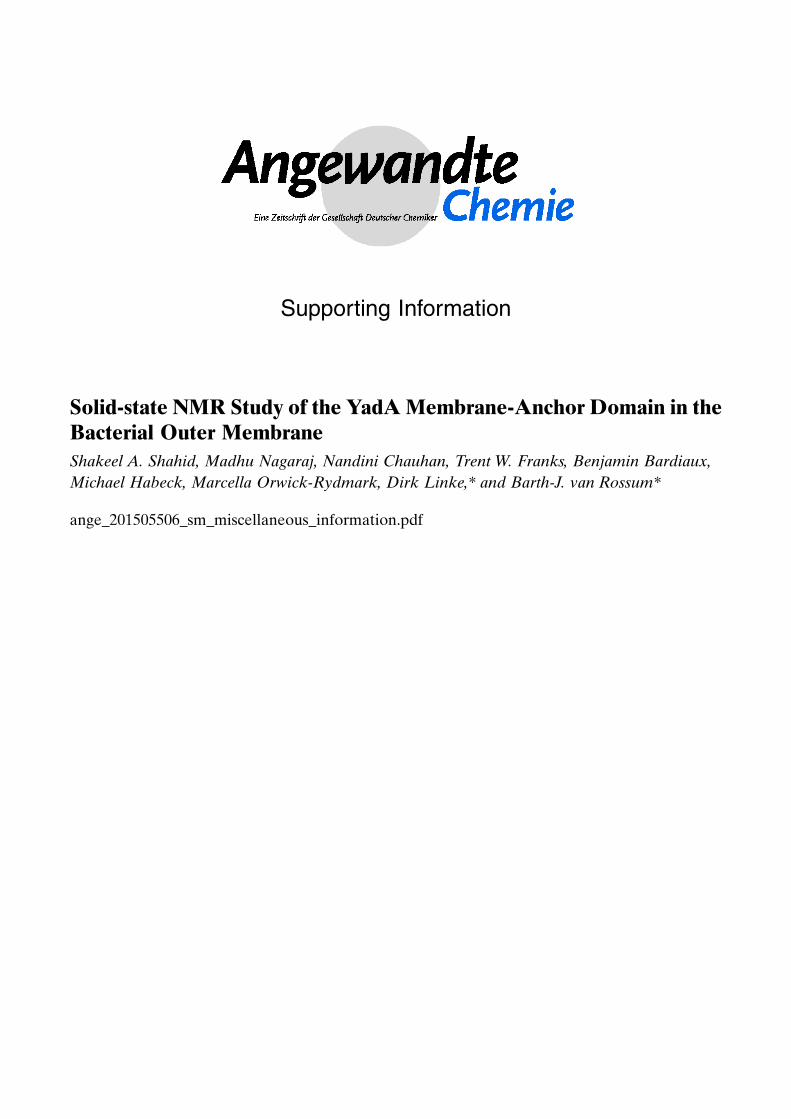
Supplementary Figure 1: GVAS labeled YadA-M. G, V, A, and S are colored red, magenta, blue, and yellow, respectively. Most Gly and Ala residues in YadA-M face the pore lumen to presumably minimize resistance to the passenger domain during autotransport, Val sidechains point tohe lipid membrane and occupy the exterior wall of the β-barrel, and Ser residues are exclusively present in the β-turn regions
Preparation of Yad-M in the outer membrane for solid-state MAS NMR
The following YadA-M samples were prepared for solid-state MAS NMR studies,
directly in bacterial outer membranes: (1) a uniformly 13C, 15N labeled sample; (2) a
selectively 13C labeled “GVAS” YadA-M, where only glycines, valines, alanines and
serines were labeled. YadA-M was overexpressed in freshly transformed CaCl2-
competent Escherichia coli BL21Omp8 cells following the established protocol [1].
Cells were grown in Luria broth supplemented with 60 µg/ml Carbenicillin. The
incubation was carried out in a shaker with 170 rpm at 30ºC. When the OD600
reached 0.4, the cells were harvested by gentle centrifugation (2000 g) for 20
minutes at 18ºC. The pellets were resuspended in M9 medium to achieve both
uniformly (YadA-M Uni) and GVAS labeled (YadA-M GVAS) samples. For producing
the uniformly labeled sample, we resuspended the cells in M9 medium which was
enriched with 13C-labeled glucose and 15N-labeled ammonium chloride. The YadA-M
2
GVAS sample was produced by a reverse labeling strategy by resuspending the cell
pellet in M9 medium which was supplemented with 4 g 13C-labeled glucose and
sixteen unlabeled amino acids, except for G,V,A and S. The cells were incubated for
15 minutes at 37ºC before inducing them with 0.2µg/ml anhydrotetracycline (AHTC).
The culture was shaken overnight with 170 RPM at 30ºC and the cells were
subsequently harvested at 4500 g for 30 minutes at 4ºC, followed by resuspension in
lysis buffer (PBS supplemented with 1mM MgCl2 and DNase). The cells were lysed
with a homogenizer (Avestin Emulsiflex C3) for 15 minutes and pelleted at 4500 g to
remove unlysed cells. The supernatant was then spun in a Beckmann SW 45Ti rotor
at 100000 g for 30 minutes at 8ºC to collect the membrane fraction. The inner
membrane (IM) fractions were removed by solubilizing the pellet in IM solubilization
buffer (1% (w/v) N-lauroylsarcosine in 20 mM Tris, pH 8.0) [2]. The outer membrane
(OM) pellet was washed with PBS buffer six times before packing it in the NMR rotor.
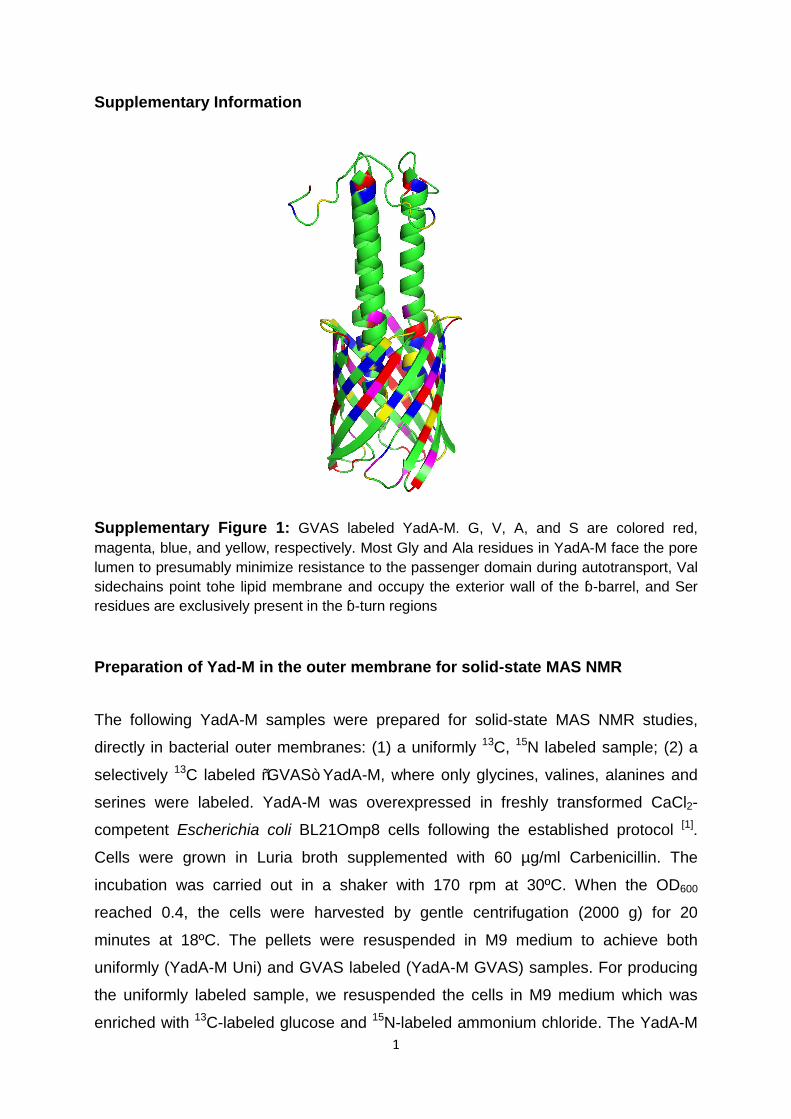
Supplementary Figure 2: Preparation of membrane-bound YadA-M samples for solid-state MAS NMR studies; (left) A schematic representation of major steps from overexpression to NMR measurement of YadA-M (right) SDS-PAGE for YadA-M in native outer membranes (OM). YadA-M was overexpressed and purified according to the reference [1]. After discarding the inner-membrane (IM) debris, the OM pellet (Pellet 1) was resuspended and washed. The supernatant was ultracentrifuged to obtain the pellet (Pellet 2). The SDS-PAGE shows the presence of YadA-M in both pellet fractions. In fact, the amount of YadA is presumably higher in the supernatant fraction (Pellet 2). The stability of YadA was checked by heating it with and without 1M Urea. YadA-M remains an intact trimer under these conditions [1].
3
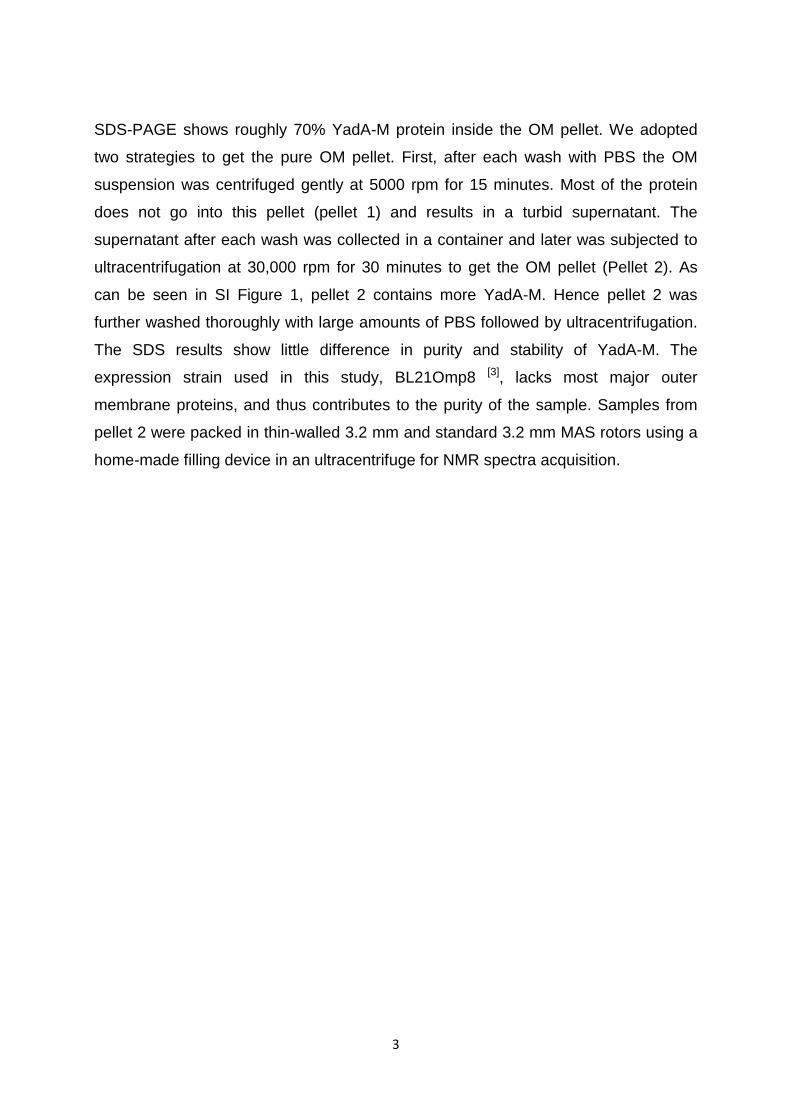
SDS-PAGE shows roughly 70% YadA-M protein inside the OM pellet. We adopted
two strategies to get the pure OM pellet. First, after each wash with PBS the OM
suspension was centrifuged gently at 5000 rpm for 15 minutes. Most of the protein
does not go into this pellet (pellet 1) and results in a turbid supernatant. The
supernatant after each wash was collected in a container and later was subjected to
ultracentrifugation at 30,000 rpm for 30 minutes to get the OM pellet (Pellet 2). As
can be seen in SI Figure 1, pellet 2 contains more YadA-M. Hence pellet 2 was
further washed thoroughly with large amounts of PBS followed by ultracentrifugation.
The SDS results show little difference in purity and stability of YadA-M. The
expression strain used in this study, BL21Omp8 [3], lacks most major outer
membrane proteins, and thus contributes to the purity of the sample. Samples from
pellet 2 were packed in thin-walled 3.2 mm and standard 3.2 mm MAS rotors using a
home-made filling device in an ultracentrifuge for NMR spectra acquisition.
4
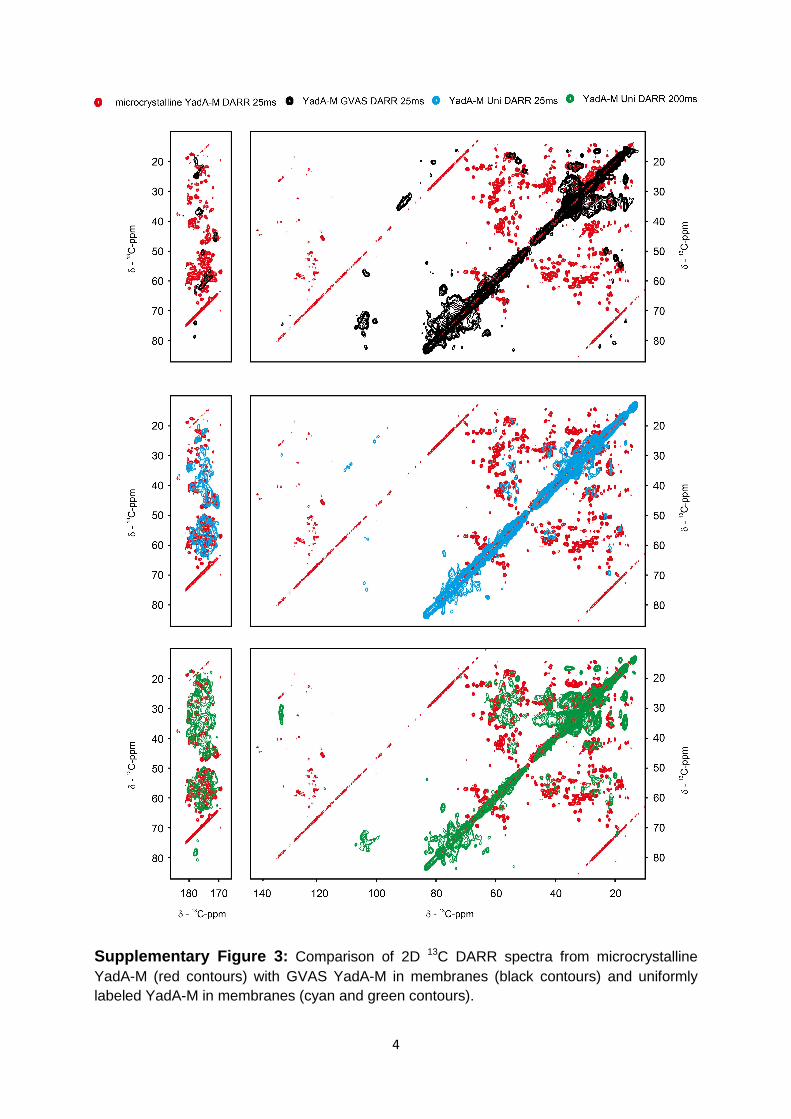
Supplementary Figure 3: Comparison of 2D 13C DARR spectra from microcrystalline YadA-M (red contours) with GVAS YadA-M in membranes (black contours) and uniformly labeled YadA-M in membranes (cyan and green contours).
5
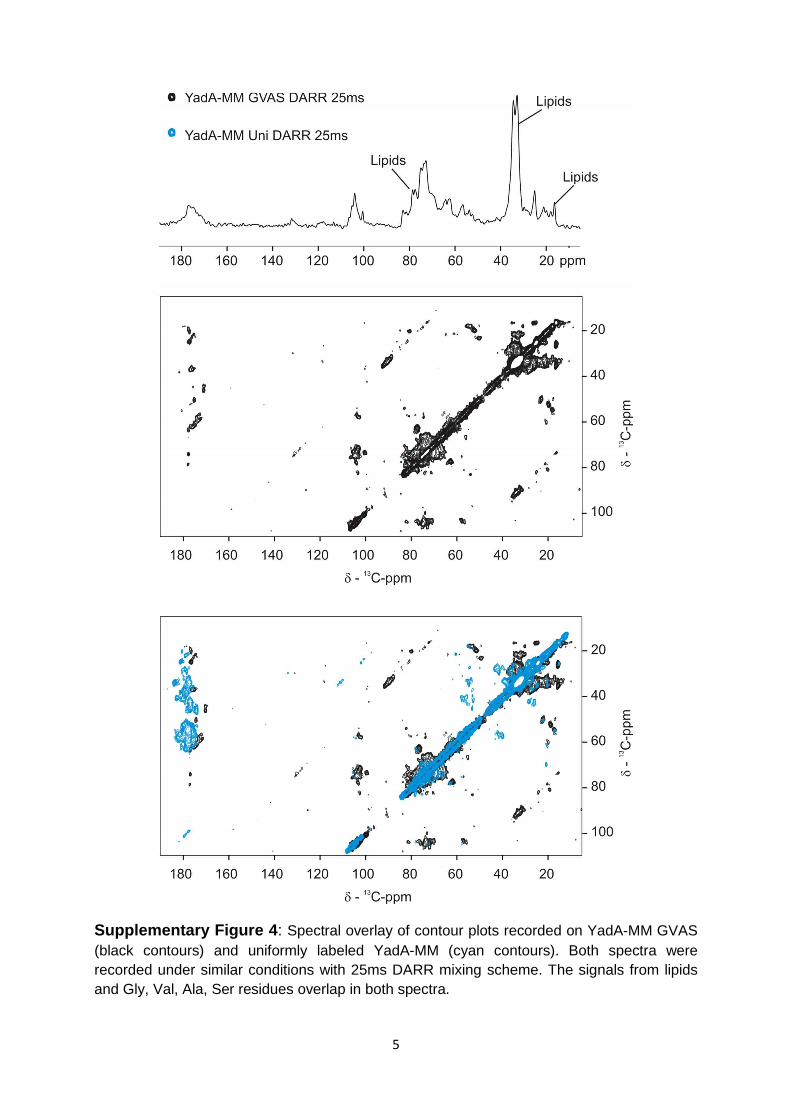
Supplementary Figure 4: Spectral overlay of contour plots recorded on YadA-MM GVAS (black contours) and uniformly labeled YadA-MM (cyan contours). Both spectra were recorded under similar conditions with 25ms DARR mixing scheme. The signals from lipids and Gly, Val, Ala, Ser residues overlap in both spectra.
6
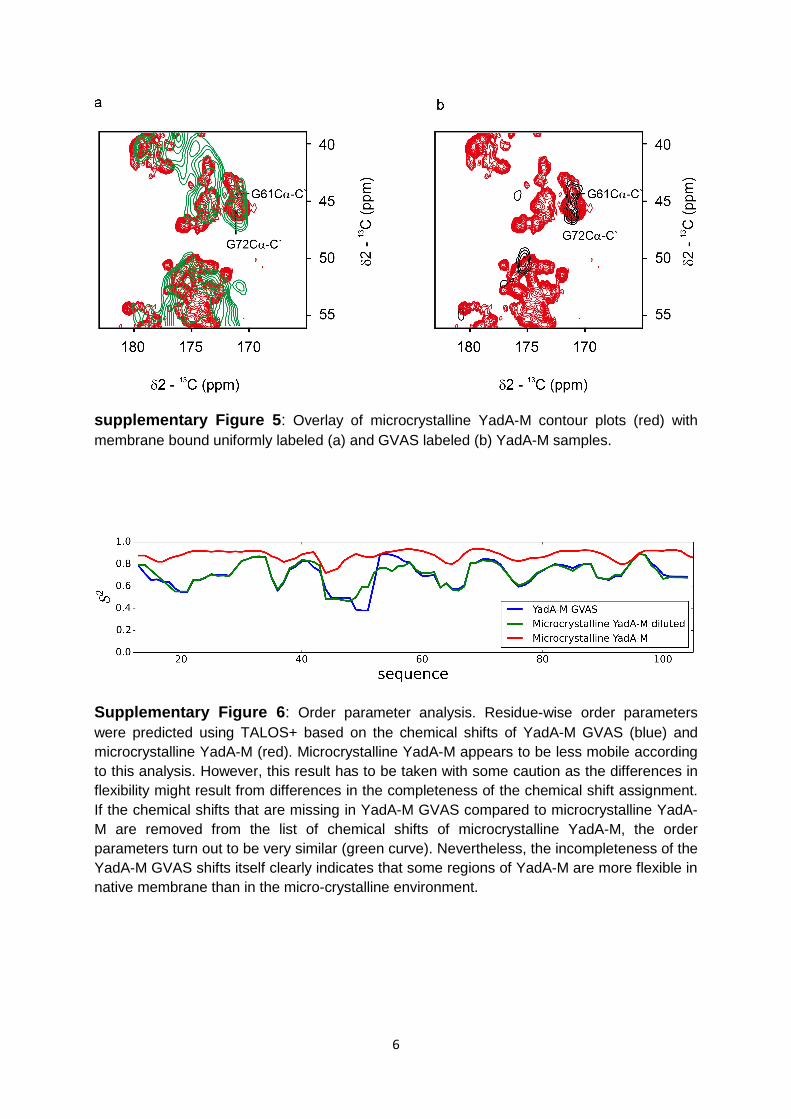
supplementary Figure 5: Overlay of microcrystalline YadA-M contour plots (red) with membrane bound uniformly labeled (a) and GVAS labeled (b) YadA-M samples.
Supplementary Figure 6: Order parameter analysis. Residue-wise order parameters were predicted using TALOS+ based on the chemical shifts of YadA-M GVAS (blue) and microcrystalline YadA-M (red). Microcrystalline YadA-M appears to be less mobile according to this analysis. However, this result has to be taken with some caution as the differences in flexibility might result from differences in the completeness of the chemical shift assignment. If the chemical shifts that are missing in YadA-M GVAS compared to microcrystalline YadA-M are removed from the list of chemical shifts of microcrystalline YadA-M, the order parameters turn out to be very similar (green curve). Nevertheless, the incompleteness of the YadA-M GVAS shifts itself clearly indicates that some regions of YadA-M are more flexible in native membrane than in the micro-crystalline environment.
7
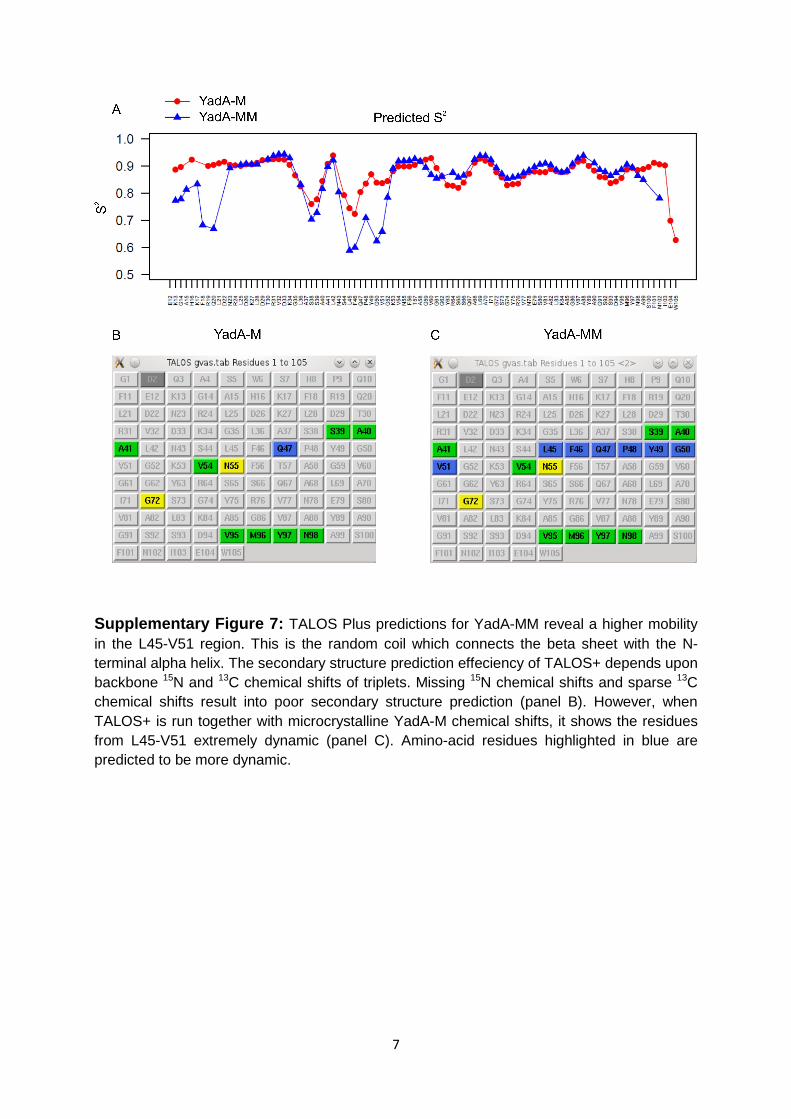
Supplementary Figure 7: TALOS Plus predictions for YadA-MM reveal a higher mobility in the L45-V51 region. This is the random coil which connects the beta sheet with the N-terminal alpha helix. The secondary structure prediction effeciency of TALOS+ depends upon backbone 15N and 13C chemical shifts of triplets. Missing 15N chemical shifts and sparse 13C chemical shifts result into poor secondary structure prediction (panel B). However, when TALOS+ is run together with microcrystalline YadA-M chemical shifts, it shows the residues from L45-V51 extremely dynamic (panel C). Amino-acid residues highlighted in blue are predicted to be more dynamic.
8
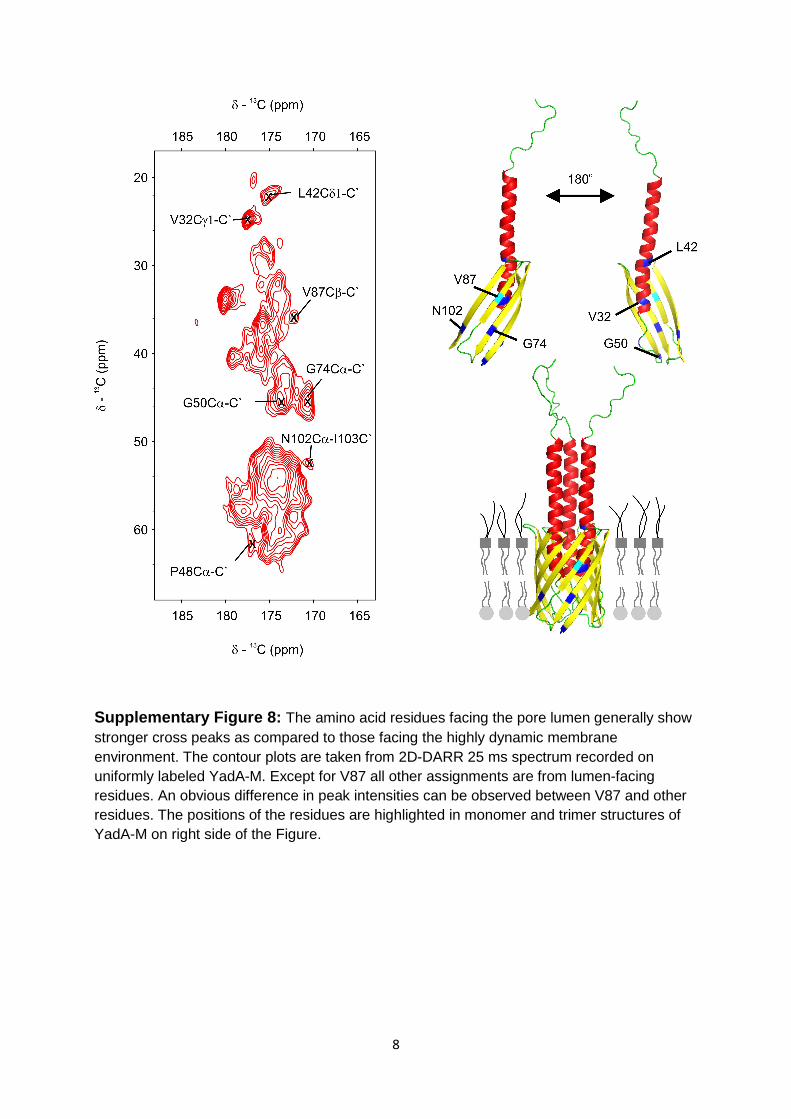
Supplementary Figure 8: The amino acid residues facing the pore lumen generally show stronger cross peaks as compared to those facing the highly dynamic membrane environment. The contour plots are taken from 2D-DARR 25 ms spectrum recorded on uniformly labeled YadA-M. Except for V87 all other assignments are from lumen-facing residues. An obvious difference in peak intensities can be observed between V87 and other residues. The positions of the residues are highlighted in monomer and trimer structures of YadA-M on right side of the Figure.
9
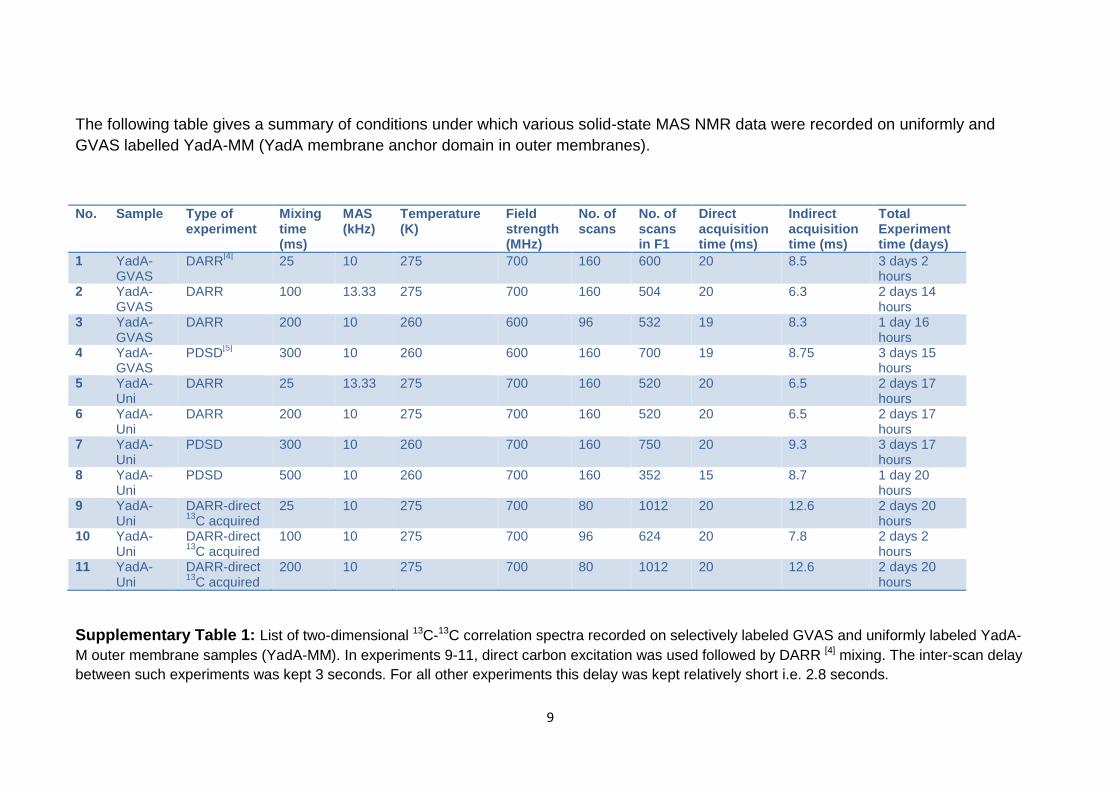
The following table gives a summary of conditions under which various solid-state MAS NMR data were recorded on uniformly and GVAS labelled YadA-MM (YadA membrane anchor domain in outer membranes).
No. Sample Type of experiment
Mixing time (ms)
MAS (kHz)
Temperature (K)
Field strength (MHz)
No. of scans
No. of scans in F1
Direct acquisition time (ms)
Indirect acquisition time (ms)
Total Experiment time (days)
1 YadA-GVAS
DARR[4] 25 10 275 700 160 600 20 8.5 3 days 2 hours
2 YadA-GVAS
DARR 100 13.33 275 700 160 504 20 6.3 2 days 14 hours
3 YadA-GVAS
DARR 200 10 260 600 96 532 19 8.3 1 day 16 hours
4 YadA-GVAS
PDSD[5] 300 10 260 600 160 700 19 8.75 3 days 15 hours
5 YadA-Uni
DARR 25 13.33 275 700 160 520 20 6.5 2 days 17 hours
6 YadA-Uni
DARR 200 10 275 700 160 520 20 6.5 2 days 17 hours
7 YadA-Uni
PDSD 300 10 260 700 160 750 20 9.3 3 days 17 hours
8 YadA-Uni
PDSD 500 10 260 700 160 352 15 8.7 1 day 20 hours
9 YadA-Uni
DARR-direct 13C acquired
25 10 275 700 80 1012 20 12.6 2 days 20 hours
10 YadA-Uni
DARR-direct 13C acquired
100 10 275 700 96 624 20 7.8 2 days 2 hours
11 YadA-Uni
DARR-direct 13C acquired
200 10 275 700 80 1012 20 12.6 2 days 20 hours
Supplementary Table 1: List of two-dimensional 13C-13C correlation spectra recorded on selectively labeled GVAS and uniformly labeled YadA-M outer membrane samples (YadA-MM). In experiments 9-11, direct carbon excitation was used followed by DARR [4] mixing. The inter-scan delay between such experiments was kept 3 seconds. For all other experiments this delay was kept relatively short i.e. 2.8 seconds.
10
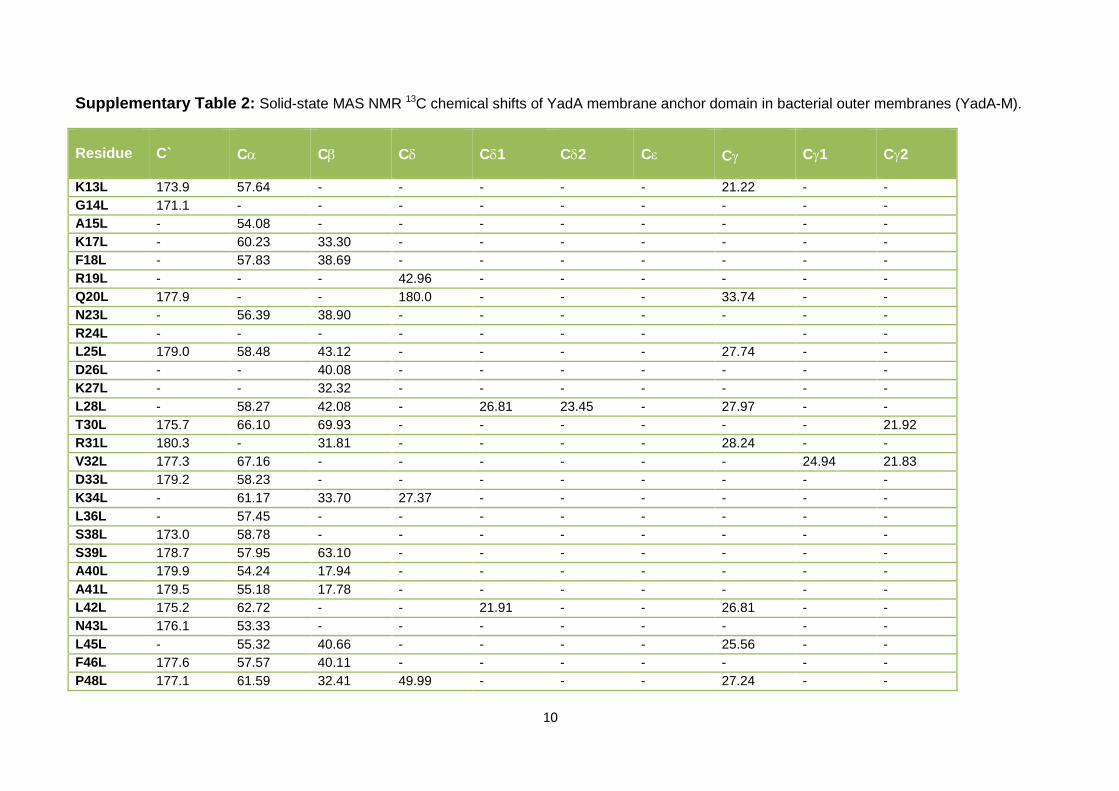
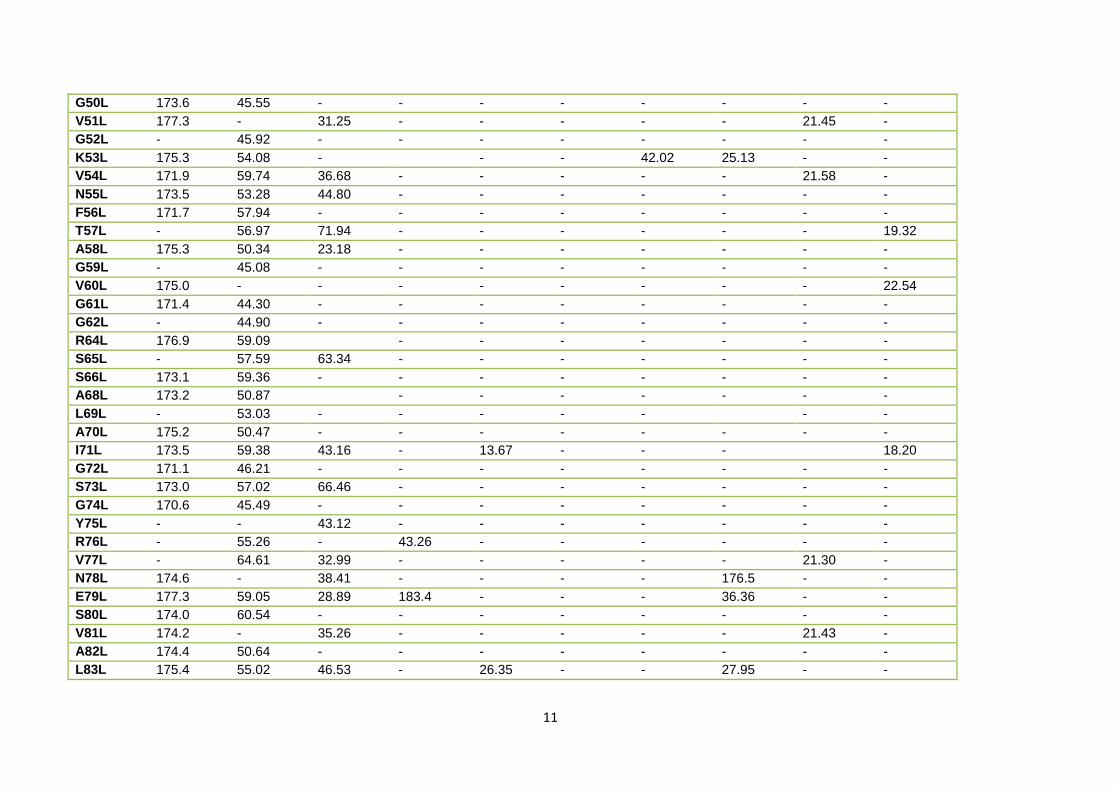
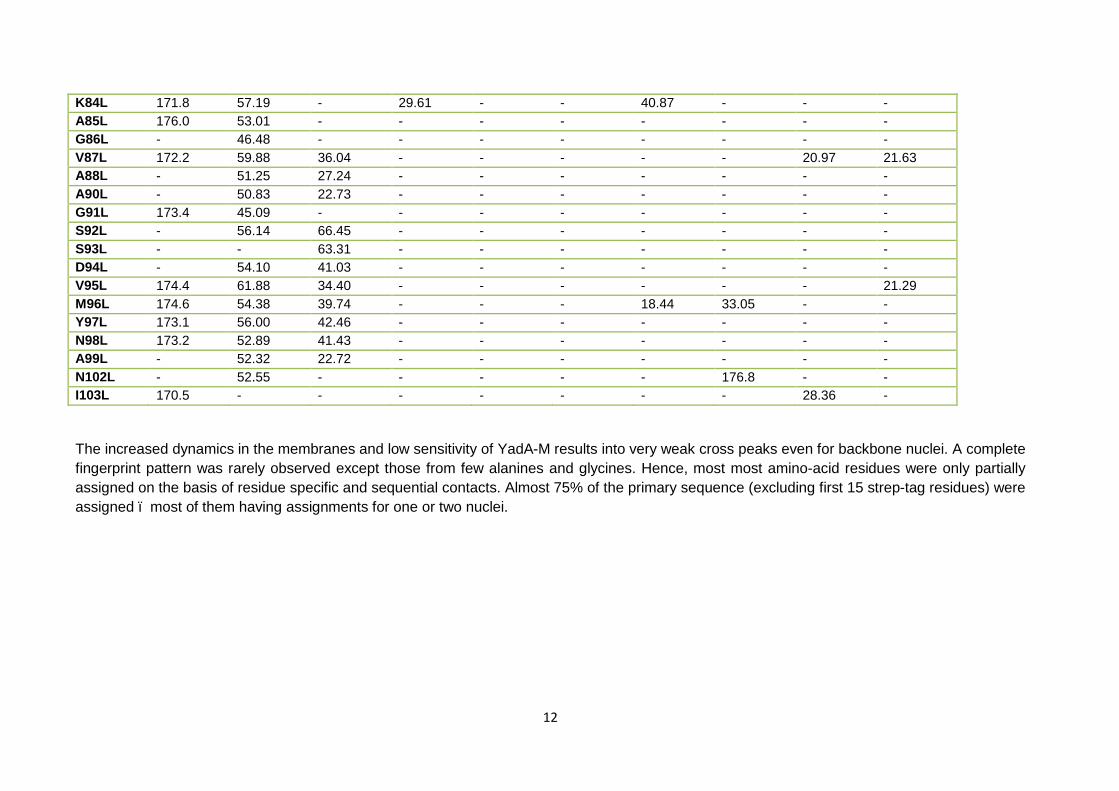
Supplementary Table 2: Solid-state MAS NMR 13C chemical shifts of YadA membrane anchor domain in bacterial outer membranes (YadA-M).
Residue
C`
Cα
Cβ
Cδ
Cδ1
Cδ2
Cε
Cγ
Cγ1
Cγ2
K13L 173.9 57.64 - - - - - 21.22 - - G14L 171.1 - - - - - - - - - A15L - 54.08 - - - - - - - - K17L - 60.23 33.30 - - - - - - - F18L - 57.83 38.69 - - - - - - - R19L - - - 42.96 - - - - - - Q20L 177.9 - - 180.0 - - - 33.74 - - N23L - 56.39 38.90 - - - - - - - R24L - - - - - - - - - L25L 179.0 58.48 43.12 - - - - 27.74 - - D26L - - 40.08 - - - - - - - K27L - - 32.32 - - - - - - - L28L - 58.27 42.08 - 26.81 23.45 - 27.97 - - T30L 175.7 66.10 69.93 - - - - - - 21.92 R31L 180.3 - 31.81 - - - - 28.24 - - V32L 177.3 67.16 - - - - - - 24.94 21.83 D33L 179.2 58.23 - - - - - - - - K34L - 61.17 33.70 27.37 - - - - - - L36L - 57.45 - - - - - - - - S38L 173.0 58.78 - - - - - - - - S39L 178.7 57.95 63.10 - - - - - - - A40L 179.9 54.24 17.94 - - - - - - - A41L 179.5 55.18 17.78 - - - - - - - L42L 175.2 62.72 - - 21.91 - - 26.81 - - N43L 176.1 53.33 - - - - - - - - L45L - 55.32 40.66 - - - - 25.56 - - F46L 177.6 57.57 40.11 - - - - - - - P48L 177.1 61.59 32.41 49.99 - - - 27.24 - -
11
G50L 173.6 45.55 - - - - - - - - V51L 177.3 - 31.25 - - - - - 21.45 - G52L - 45.92 - - - - - - - - K53L 175.3 54.08 - - - 42.02 25.13 - - V54L 171.9 59.74 36.68 - - - - - 21.58 - N55L 173.5 53.28 44.80 - - - - - - - F56L 171.7 57.94 - - - - - - - - T57L - 56.97 71.94 - - - - - - 19.32 A58L 175.3 50.34 23.18 - - - - - - - G59L - 45.08 - - - - - - - - V60L 175.0 - - - - - - - - 22.54 G61L 171.4 44.30 - - - - - - - - G62L - 44.90 - - - - - - - - R64L 176.9 59.09 - - - - - - - S65L - 57.59 63.34 - - - - - - - S66L 173.1 59.36 - - - - - - - - A68L 173.2 50.87 - - - - - - - L69L - 53.03 - - - - - - - A70L 175.2 50.47 - - - - - - - - I71L 173.5 59.38 43.16 - 13.67 - - - 18.20 G72L 171.1 46.21 - - - - - - - - S73L 173.0 57.02 66.46 - - - - - - - G74L 170.6 45.49 - - - - - - - - Y75L - - 43.12 - - - - - - - R76L - 55.26 - 43.26 - - - - - - V77L - 64.61 32.99 - - - - - 21.30 - N78L 174.6 - 38.41 - - - - 176.5 - - E79L 177.3 59.05 28.89 183.4 - - - 36.36 - - S80L 174.0 60.54 - - - - - - - - V81L 174.2 - 35.26 - - - - - 21.43 - A82L 174.4 50.64 - - - - - - - - L83L 175.4 55.02 46.53 - 26.35 - - 27.95 - -
12
K84L 171.8 57.19 - 29.61 - - 40.87 - - - A85L 176.0 53.01 - - - - - - - - G86L - 46.48 - - - - - - - - V87L 172.2 59.88 36.04 - - - - - 20.97 21.63 A88L - 51.25 27.24 - - - - - - - A90L - 50.83 22.73 - - - - - - - G91L 173.4 45.09 - - - - - - - - S92L - 56.14 66.45 - - - - - - - S93L - - 63.31 - - - - - - - D94L - 54.10 41.03 - - - - - - - V95L 174.4 61.88 34.40 - - - - - - 21.29 M96L 174.6 54.38 39.74 - - - 18.44 33.05 - - Y97L 173.1 56.00 42.46 - - - - - - - N98L 173.2 52.89 41.43 - - - - - - - A99L - 52.32 22.72 - - - - - - - N102L - 52.55 - - - - - 176.8 - - I103L 170.5 - - - - - - - 28.36 -
The increased dynamics in the membranes and low sensitivity of YadA-M results into very weak cross peaks even for backbone nuclei. A complete fingerprint pattern was rarely observed except those from few alanines and glycines. Hence, most most amino-acid residues were only partially assigned on the basis of residue specific and sequential contacts. Almost 75% of the primary sequence (excluding first 15 strep-tag residues) were assigned – most of them having assignments for one or two nuclei.
13
References:
[1] P. Wollmann, K. Zeth, A. N. Lupas, D. Linke, International Journal of Biological Macromolecules 2006, 39, 3-9.
[2] M. Thein, G. Sauer, N. Paramasivam, I. Grin, D. Linke, J Proteome Res 2010, 9, 6135-6147. [3] A. Prilipov, P. S. Phale, P. Van Gelder, J. P. Rosenbusch, R. Koebnik, FEMS Microbiol Lett 1998,
163, 65-72. [4] aC. R. Morcombe, V. Gaponenko, R. A. Byrd, K. W. Zilm, J Am Chem Soc 2004, 126, 7196-
7197; bK. Takegoshi, T. Yano, K. Takeda, T. Terao, J Am Chem Soc 2001, 123, 10786-10787. [5] aD. Suter, R. R. Ernst, Phys Rev B Condens Matter 1985, 32, 5608-5627; bN. M. Szeverenyi, M.
J. Sullivan, G. E. Maciel, Journal of Magnetic Resonance 1982, 47, 462-475.