Embed Size (px)
DESCRIPTION
IKK
Citation preview

47
0010011010011001001101001100100110100110010011010011001001101001001010101001010101001010101001010101001010101001010101001010101001010101001010101001010101001010101001010101001010101001010101001101001100110100110011010011001101001100110100110011010011001101001101100010101100010101100010101100010101100010101100010101100010101011010011001101001100110100110011010011001101001100110100110011010010100101010010101011000100110100101010010101011000100110100101010010101010110001001101001101001011010100110001001101001101001011010100110001001100101111010010101001010010111101001010100101001011110100101010010100101011010011001101001100110100110011010011001101001100110100110011010010010100110100010100110100010100110100010100110100010100110100010100101101001100110100110011010011001101001100110100110011010011001101001111010010101001010111010010111101001010100101011101001011110100101010010101011010011001101001100110100110011010011001101001100110100110011010011001011110101010010110010111101010100101100101111010101001011001010110100110011010011001101001100110100110011010011001101001100110100101001011010000100101101000010010110100001001011010000100101101000010010101101001100110100110011010011001101001100110100110011010011001101001
01010110001001101001101001011010101011000100110100110100101101010101011010011001101001100110100110011010011001101001100110100110011010011010010110010111101010100101010100101100101111010101001010101001010010011010011001001101001100100110100110010011010011001001101001001010101001010101001010101001010101001010101001010101001010101001010101001010101001010101001010101001010101001010101001010101001101001100110100110011010011001101001100110100110011010011001101001101100010101100010101100010101100010101100010101100010101100010101011010011001101001100110100110011010011001101001100110100110011010010100101010010101011000100110100101010010101011000100110100101010010101010110001001101001101001011010100110001001101001101001011010100110001001100101111010010101001010010111101001010100101001011110100101010010100101011010011001101001100110100110011010011001101001100110100110011010010010100110100010100110100010100110100010100110100010100110100010100101101001100110100110011010011001101001100110100110011010011001101001111010010101001010111010010111101001010100101011101001011110100101010010101011010011001101001100110100110011010011001101001100110100110011010011001011110101010010110010111101010100101100101111010101001011001010110100110011010011001101001100110100110011010011001101001100110100101001011010000100101101000010010110100001001011010000100101101000010010101101001100110100110011010011001101001100110100110011010011001101001
010010100110101010110010100101100101111010101001010100101010110001001
0101011000100110100110100101101010101100010011010011010010110101010101101001100110100110011010011001101001100110100110011010011001101001101001011001011110101010010101010010110010111101010100101010100101001001101001100100110100110010011010011001001101001100100110100100101010100101010100101010100101010100101010100101010100101010100101010100101010100101010100101010100101010100101010100101010100110100110011010011001101001100110100110011010011001101001100110100110110001010110001010110001010110001010110001010110001010110001010101101001100110100110011010011001101001100110100110011010011001101001010010101001010101100010011010010101001010101100010011010010101001010101011000100110100110100101101010011000100110100110100101101010011000100110010111101001010100101001011110100101010010100101111010010101001010010101101001100110100110011010011001101001100110100110011010011001101001001010011010001010011010001010011010001010011010001010011010001010010110100110011010011001101001100110100110011010011001101001100110100111101001010100101011101001011110100101010010101110100101111010010101001010101101001100110100110011010011001101001100110100110011010011001101001
010010100110101010110010100101100101111010101001010100101010110001001
Part III
Global health indicators
0010011010011001001101001100100110100110010011010011001001101001001010101001010101001010101001010101001010101001010101001010101001010101001010101001010101001010101001010101001010101001010101001101001100110100110011010011001101001100110100110011010011001101001101100010101100010101100010101100010101100010101100010101100010101011010011001101001100110100110011010011001101001100110100110011010010100101010010101011000100110100101010010101011000100110100101010010101010110001001101001101001011010100110001001101001101001011010100110001001100101111010010101001010010111101001010100101001011110100101010010100101011010011001101001100110100110011010011001101001100110100110011010010010100110100010100110100010100110100010100110100010100110100010100101101001100110100110011010011001101001100110100110011010011001101001

48

49
General notes
The following summary tables represent the best estimates of WHO for a broad range of key public health indicators – based on evidence available in 2011. These best estimates have wherever possible been computed by WHO using standardized categories and methods in order to enhance cross-national comparability. This approach may result in some cases in differences between the estimates presented here and the official national statistics prepared and endorsed by individual Member States.27
It is also important to stress that these estimates are subject to considerable uncertainty, especially for countries with weak statistical and health information systems where the quality of underlying empirical data is limited.
For indicators with a reference period expressed as a range in Tables 4, 5, 6 and 9, figures refer to the latest available year in the range. For more information on specific years, indicator definitions and metadata, please refer to: http://www.who.int/gho
... indicates data not available or not applicable.
The WHO regional, income-group and global aggregates for rates and ratios are weighted averages when relevant, while for absolute numbers they are the sums. Aggregates are calculated only if data are available for at least 50% of the population within an indicated group. Income-group aggregates are calculated using the 2011 World Bank list of economies28 unless otherwise noted.
27. South Sudan became an independent state in July 2011 and a WHO Member State in September 2011. As the re-ported data shown here only concern the time before July 2011, the term “Sudan” as used here only refers to the state as it existed prior to July 2011.
28. World Bank list of economies (November 2011). Washington, DC, World Bank, 2011 (http://siteresources.worldbank.org/DATASTATISTICS/Resources/CLASS.XLS).
011010011001101001100110100110011010011001101001100110100110011010011010010110010111101010100101010100101100101111010101001010101001010010011010011001001101001100100110100110010011010011001001101001001010101001010101001010101001010101001010101001010101001010101001010101001010101001010101001010101001010101001010101001010101001101001100110100110011010011001101001100110100110011010011001101001101100010101100010101100010101100010101100010101100010101100010101011010011001101001100110100110011010011001101001100110100110011010010100101010010101011000100110100101010010101011000100110100101010010101010110001001101001101001011010100110001001101001101001011010100110001001100101111010010101001010010111101001010100101001011110100101010010100101011010011001101001100110100110011010011001101001100110100110011010010010100110100010100110100010100110100010100110100010100110100010100101101001100110100110011010011001101001100110100110011010011001101001111010010101001010111010010111101001010100101011101001011110100101010010101011010011001101001100110100110011010011001101001100110100110011010011001011110101010010110010111101010100101100101111010101001011001010110100110011010011001101001100110100110011010011001101001100110100101001011010000100101101000010010110100001001011010000100101101000010010101101001100110100110011010011001101001100110100110011010011001101001
0101011000100110100110100101101010101100010011010011010010110101010101101001100110100110011010011001101001100110100110011010011001101001101001011001011110101010010101010010110010111101010100101010100101001001101001100100110100110010011010011001001101001100100110100100101010100101010100101010100101010100101010100101010100101010100101010100101010100101010100101010100101010100101010100101010100110100110011010011001101001100110100110011010011001101001100110100110110001010110001010110001010110001010110001010110001010110001010101101001100110100110011010011001101001100110100110011010011001101001010010101001010101100010011010010101001010101100010011010010101001010101011000100110100110100101101010011000100110100110100101101010011000100110010111101001010100101001011110100101010010100101111010010101001010010101101001100110100110011010011001101001100110100110011010011001101001001010011010001010011010001010011010001010011010001010011010001010010110100110011010011001101001100110100110011010011001101001100110100111101001010100101011101001011110100101010010101110100101111010010101001010101101001100110100110011010011001101001100110100110011010011001101001100101111010101001011001011110101010010110010111101010100101100101
010010100110101010110010100101100101111010101001010100101010110001001

50

Tabl
e 1
51
1. Life expectancy and mortality
The indicators of life expectancy and mortality presented in Table 1 are: life expectancy at birth; life ex-pectancy at age 60; stillbirth (fetal death) rate; neonatal mortality rate (the probability of death occurring during the first 28 days of life); infant and under-five mortality rates (the probability of dying between birth and 1 and 5 years of age, respectively); and adult mortality rate (the probability of dying between 15 and 60 years of age). Monitoring levels in child mortality has largely focused on liveborn infants with stillbirths often overlooked and underestimated. However, one third of all stillbirths occur during deliv-ery from complications that can be avoided with appropriate care. Neonatal mortality accounts for a large proportion of child deaths in many countries, especially in low-income settings. Levels and trends for child mortality are also particularly relevant in understanding public health trends, with almost 20% of all deaths occurring among children less than 5 years old.
The estimates of mortality presented here have been derived wherever possible from death-registration data reported annually to WHO. For countries where such data are not available or are of poor quality, household surveys and censuses are used to prepare estimates of mortality rates and life expectancy. In the case of child mortality, WHO is part of the Inter-agency Group for Child Mortality Estimation (IGME) which carries out annual updates of estimates for infant and child mortality for UNICEF, WHO and other international agencies. As well as harmonizing the child mortality estimates used by its mem-bers, the IGME monitors progress towards the achievement of the relevant MDG target.29
29. MDG 4; Target 4.A: Reduce by two thirds, between 1990 and 2015, the under-five mortality rate.
011010011001101001100110100110011010011001101001100110100110011010011010010110010111101010100101010100101100101111010101001010101001010010011010011001001101001100100110100110010011010011001001101001001010101001010101001010101001010101001010101001010101001010101001010101001010101001010101001010101001010101001010101001010101001101001100110100110011010011001101001100110100110011010011001101001101100010101100010101100010101100010101100010101100010101100010101011010011001101001100110100110011010011001101001100110100110011010010100101010010101011000100110100101010010101011000100110100101010010101010110001001101001101001011010100110001001101001101001011010100110001001100101111010010101001010010111101001010100101001011110100101010010100101011010011001101001100110100110011010011001101001100110100110011010010010100110100010100110100010100110100010100110100010100110100010100101101001100110100110011010011001101001100110100110011010011001101001111010010101001010111010010111101001010100101011101001011110100101010010101011010011001101001100110100110011010011001101001100110100110011010011001011110101010010110010111101010100101100101111010101001011001010110100110011010011001101001100110100110011010011001101001100110100101001011010000100101101000010010110100001001011010000100101101000010010101101001100110100110011010011001101001100110100110011010011001101001
0101011000100110100110100101101010101100010011010011010010110101010101101001100110100110011010011001101001100110100110011010011001101001101001011001011110101010010101010010110010111101010100101010100101001001101001100100110100110010011010011001001101001100100110100100101010100101010100101010100101010100101010100101010100101010100101010100101010100101010100101010100101010100101010100101010100110100110011010011001101001100110100110011010011001101001100110100110110001010110001010110001010110001010110001010110001010110001010101101001100110100110011010011001101001100110100110011010011001101001010010101001010101100010011010010101001010101100010011010010101001010101011000100110100110100101101010011000100110100110100101101010011000100110010111101001010100101001011110100101010010100101111010010101001010010101101001100110100110011010011001101001100110100110011010011001101001001010011010001010011010001010011010001010011010001010011010001010010110100110011010011001101001100110100110011010011001101001100110100111101001010100101011101001011110100101010010101110100101111010010101001010101101001100110100110011010011001101001100110100110011010011001101001100101111010101001011001011110101010010110010111101010100101100101
010010100110101010110010100101100101111010101001010100101010110001001

52
Member State Life expectancy at birth a (years)
Life expectancy at age 60 a (years)
Both sexes Male Female Both sexes Male Female
1990 2009 1990 2009 1990 2009 1990 2009 1990 2009 1990 2009
Afghanistan 44 48 42 47 46 50 14 14 13 13 15 15
Albania 68 73 65 72 71 75 16 18 15 17 18 19
Algeria 67 72 66 71 69 74 17 19 16 18 18 20
Andorra 77 82 74 79 81 85 22 25 19 22 24 27
Angola 42 52 38 51 45 53 14 15 13 14 15 16
Antigua and Barbuda 70 74 69 73 71 76 18 21 18 20 19 22
Argentina 73 75 69 72 76 79 20 21 17 18 22 23
Armenia 66 70 62 66 70 74 16 16 14 14 18 18
Australia 77 82 74 80 80 84 21 25 19 23 23 26
Austria 76 80 72 78 79 83 20 23 18 21 22 25
Azerbaijan 63 68 60 66 66 70 16 16 15 15 17 17
Bahamas 71 76 67 72 74 78 20 23 18 21 21 24
Bahrain 74 74 73 73 74 76 18 19 18 18 18 19
Bangladesh 54 65 54 64 53 66 15 16 14 16 15 17
Barbados 74 76 70 73 77 80 20 21 18 18 22 23
Belarus 71 70 66 64 75 76 19 18 16 14 20 20
Belgium 76 80 73 77 79 83 21 23 18 21 23 25
Belize 73 73 71 71 75 76 21 21 20 20 22 22
Benin 55 57 53 54 58 60 16 15 14 14 17 17
Bhutan 55 63 53 62 56 65 15 16 14 15 16 17
Bolivia (Plurinational State of) 60 68 58 66 63 70 16 18 15 16 17 19
Bosnia and Herzegovina 72 76 69 73 75 78 18 20 16 19 19 21
Botswana 66 61 64 59 67 62 17 17 16 16 18 18
Brazil 67 73 63 70 70 77 18 21 16 19 19 22
Brunei Darussalam 73 77 71 76 76 77 19 20 17 20 20 20
Bulgaria 71 74 68 70 75 77 18 19 16 17 19 21
Burkina Faso 51 52 49 49 53 56 15 15 14 14 16 16
Burundi 50 50 48 49 51 51 15 15 14 14 15 15
Cambodia 59 61 54 57 63 65 16 16 14 14 17 17
Cameroon 55 51 54 51 55 51 15 15 14 14 16 16
Canada 77 81 74 79 80 83 21 24 19 23 24 26
Cape Verde 68 71 65 66 70 75 19 19 18 17 19 20
Central African Republic 51 48 51 49 51 48 15 15 14 14 15 15
Chad 52 48 51 48 53 48 15 15 14 14 16 15
Chile 72 79 69 76 76 82 19 23 17 20 20 25
China 68 74 68 72 69 76 17 19 17 18 18 21
Colombia 71 77 66 73 75 80 20 23 19 22 21 24
Comoros 57 60 56 58 59 62 15 16 14 15 16 17
Congo 55 55 54 53 55 57 15 15 14 14 16 16
Cook Islands 69 76 67 72 72 80 17 22 16 19 18 24
Costa Rica 76 79 75 77 78 81 22 23 21 22 23 25
Côte d'Ivoire 52 50 50 49 56 52 15 14 14 13 16 15
Croatia 73 76 69 73 76 80 18 20 16 18 20 22
Cuba 74 78 72 76 76 80 20 22 19 20 21 23
Cyprus 76 81 74 78 78 83 20 23 19 22 21 25
Czech Republic 71 77 68 74 75 80 17 21 15 19 19 23
Democratic People's Republic of Korea 68 70 66 67 70 72 18 18 16 16 19 19
Democratic Republic of the Congo 48 49 47 47 49 51 14 15 14 14 15 15
1. Life expectancy and mortality

Tabl
e 1
53
MDG 4
Stillbirth rate b
(per 1000 total births)
Neonatal mortality rate c
(per 1000 live births)
Infant mortality rate c(probability of dying by age 1
per 1000 live births)
Under-five mortality rate c (probability of dying by age 5
per 1000 live births)
Adult mortality rate a (probability of dying between 15 and 60 years of age per 1000 population)
Member State
Both sexes Both sexes Both sexes Both sexes Male Female
2009 1990 2010 1990 2000 2010 1990 2000 2010 1990 2009 1990 2009
29 53 45 140 104 103 209 151 149 486 440 371 352 Afghanistan
5 17 9 36 25 16 41 29 18 158 126 104 88 Albania
11 29 18 55 41 31 68 49 36 184 135 154 105 Algeria
3 3 1 7 4 3 9 5 4 143 94 60 44 Andorra
25 51 41 144 119 98 243 200 161 577 377 386 353 Angola
7 13 4 23 13 7 26 15 8 218 197 170 158 Antigua and Barbuda
5 15 7 24 18 12 27 20 14 198 160 102 88 Argentina
15 26 11 46 29 18 55 33 20 279 246 135 103 Armenia
3 5 3 8 5 4 9 6 5 124 79 66 45 Australia
4 4 2 8 5 4 9 6 4 153 102 74 50 Austria
12 31 19 74 56 39 93 67 46 285 221 165 134 Azerbaijan
9 9 7 18 14 14 22 17 16 262 202 147 126 Bahamas
9 6 4 15 11 9 17 12 10 105 127 107 87 Bahrain
36 55 27 99 63 38 143 86 48 333 246 355 222 Bangladesh
9 9 10 16 15 17 18 17 20 188 136 109 80 Barbados
4 7 3 14 11 4 17 14 6 282 324 107 117 Belarus
3 4 2 9 5 4 10 6 4 139 105 75 59 Belgium
12 18 8 35 23 14 44 27 17 161 202 101 129 Belize
24 40 32 107 89 73 178 143 115 304 385 174 246 Benin
22 45 26 96 65 44 139 89 56 337 256 302 194 Bhutan
17 39 23 84 60 42 121 82 54 288 203 171 132 Bolivia (Plurinational State of)
4 12 5 17 8 8 19 10 8 181 145 86 67 Bosnia and Herzegovina
16 22 19 46 64 36 59 96 48 247 372 180 324 Botswana
10 28 12 50 31 17 59 36 19 272 205 150 102 Brazil
6 7 4 9 7 6 12 9 7 151 105 112 82 Brunei Darussalam
7 11 7 18 17 11 22 21 13 216 205 97 86 Bulgaria
26 41 38 103 98 93 205 191 176 398 443 274 262 Burkina Faso
28 49 42 110 100 88 183 164 142 408 424 353 407 Burundi
18 38 22 87 77 43 121 103 51 372 350 194 190 Cambodia
26 34 34 85 91 84 137 148 136 334 420 309 409 Cameroon
3 4 4 7 5 5 8 6 6 132 87 71 53 Canada
16 21 14 46 37 29 59 46 36 253 272 144 111 Cape Verde
24 43 42 110 115 106 165 176 159 366 461 347 470 Central African Republic
29 45 41 113 105 99 207 190 173 314 412 275 384 Chad
9 9 5 16 9 8 19 11 9 196 116 98 59 Chile
10 24 11 38 27 16 48 33 18 193 142 148 87 China
6 20 12 30 23 17 37 27 19 248 166 117 80 Colombia
27 40 32 88 75 63 125 104 86 313 284 265 229 Comoros
26 33 29 74 67 61 116 104 93 413 409 386 320 Congo
9 9 5 17 11 8 20 13 9 252 178 154 76 Cook Islands
5 10 6 15 11 9 17 13 10 129 115 86 69 Costa Rica
27 46 41 105 100 86 151 148 123 442 528 291 456 Côte d'Ivoire
3 8 3 11 7 5 13 8 6 223 153 89 60 Croatia
8 7 3 11 7 5 13 9 6 155 120 111 78 Cuba
3 5 2 10 5 3 11 7 4 110 81 61 41 Cyprus
3 9 2 12 5 3 14 7 4 230 138 95 63 Czech Republic
13 22 18 23 42 26 45 58 33 217 207 145 126 Democratic People's Republic of Korea
29 48 46 117 117 112 181 181 170 449 442 375 331 Democratic Republic of the Congo
011010011001101001100110100110011010011001101001100110100110011010011010010110010111101010100101010100101100101111010101001010101001010010011010011001001101001100100110100110010011010011001001101001001010101001010101001010101001010101001010101001010101001010101001010101001010101001010101001010101001010101001010101001010101001101001100110100110011010011001101001100110100110011010011001101001101100010101100010101100010101100010101100010101100010101100010101011010011001101001100110100110011010011001101001100110100110011010010100101010010101011000100110100101010010101011000100110100101010010101010110001001101001101001011010100110001001101001101001011010100110001001100101111010010101001010010111101001010100101001011110100101010010100101011010011001101001100110100110011010011001101001100110100110011010010010100110100010100110100010100110100010100110100010100110100010100101101001100110100110011010011001101001100110100110011010011001101001111010010101001010111010010111101001010100101011101001011110100101010010101011010011001101001100110100110011010011001101001100110100110011010011001011110101010010110010111101010100101100101111010101001011001010110100110011010011001101001100110100110011010011001101001100110100101001011010000100101101000010010110100001001011010000100101101000010010101101001100110100110011010011001101001100110100110011010011001101001
0101011000100110100110100101101010101100010011010011010010110101010101101001100110100110011010011001101001100110100110011010011001101001101001011001011110101010010101010010110010111101010100101010100101001001101001100100110100110010011010011001001101001100100110100100101010100101010100101010100101010100101010100101010100101010100101010100101010100101010100101010100101010100101010100101010100110100110011010011001101001100110100110011010011001101001100110100110110001010110001010110001010110001010110001010110001010110001010101101001100110100110011010011001101001100110100110011010011001101001010010101001010101100010011010010101001010101100010011010010101001010101011000100110100110100101101010011000100110100110100101101010011000100110010111101001010100101001011110100101010010100101111010010101001010010101101001100110100110011010011001101001100110100110011010011001101001001010011010001010011010001010011010001010011010001010011010001010010110100110011010011001101001100110100110011010011001101001100110100111101001010100101011101001011110100101010010101110100101111010010101001010101101001100110100110011010011001101001100110100110011010011001101001100101111010101001011001011110101010010110010111101010100101100101
010010100110101010110010100101100101111010101001010100101010110001001

54
Member State Life expectancy at birth a (years)
Life expectancy at age 60 a (years)
Both sexes Male Female Both sexes Male Female
1990 2009 1990 2009 1990 2009 1990 2009 1990 2009 1990 2009
Denmark 75 79 72 77 78 81 20 22 18 21 22 24
Djibouti 58 60 56 58 60 62 16 16 15 15 16 17
Dominica 73 74 71 72 75 77 20 20 19 19 21 21
Dominican Republic 69 72 68 71 70 72 19 20 19 19 19 20
Ecuador 69 75 67 73 72 78 20 23 19 22 21 24
Egypt 62 71 61 69 65 73 15 18 14 17 16 18
El Salvador 64 72 59 68 70 76 19 21 18 20 20 22
Equatorial Guinea 49 53 48 53 51 54 15 15 14 14 15 16
Eritrea 36 66 28 64 51 68 12 17 10 16 14 18
Estonia 70 75 65 70 75 80 18 21 15 17 19 23
Ethiopia 44 54 41 53 48 56 14 15 13 14 15 16
Fiji 68 69 65 66 71 73 17 17 15 15 18 19
Finland 75 80 71 77 79 83 20 24 17 21 22 26
France 77 81 73 78 82 85 22 25 20 22 25 27
Gabon 62 62 59 60 64 64 16 17 15 15 17 18
Gambia 54 60 53 58 55 61 15 16 14 15 16 17
Georgia 69 71 65 67 72 75 18 19 16 17 19 20
Germany 75 80 72 78 78 83 20 23 18 21 22 25
Ghana 60 60 60 57 60 64 16 16 16 14 16 17
Greece 77 80 75 78 79 83 21 23 20 22 22 25
Grenada 70 73 67 69 72 77 19 20 17 18 20 23
Guatemala 63 69 61 66 65 73 18 20 17 20 18 21
Guinea 50 52 48 49 52 55 15 15 14 13 16 16
Guinea-Bissau 45 49 42 47 48 51 14 15 13 14 15 15
Guyana 63 67 58 64 68 70 16 18 14 17 17 20
Haiti 50 62 48 60 51 63 14 16 13 15 15 17
Honduras 66 69 64 67 69 73 17 18 16 16 18 19
Hungary 69 74 65 70 74 78 17 20 15 17 19 22
Iceland 78 82 75 80 81 84 22 24 20 23 24 25
India 58 65 57 63 58 66 14 16 14 15 15 17
Indonesia 65 68 63 66 68 71 17 17 16 16 18 19
Iran (Islamic Republic of) 63 73 60 70 66 75 16 19 15 18 17 20
Iraq 67 66 64 62 69 71 17 17 16 16 18 19
Ireland 75 80 72 77 78 82 19 23 17 21 21 24
Israel 77 82 75 80 78 83 21 24 19 23 22 26
Italy 77 82 74 79 80 84 21 25 19 22 23 26
Jamaica 73 71 72 69 74 74 20 20 18 20 21 21
Japan 79 83 76 80 82 86 23 26 20 23 25 29
Jordan 69 71 67 69 71 74 17 18 16 17 19 20
Kazakhstan 65 64 61 59 70 70 17 16 15 14 18 18
Kenya 61 60 59 58 63 62 16 17 15 15 17 18
Kiribati 63 68 63 65 64 70 19 21 18 21 20 20
Kuwait 73 78 72 78 75 79 18 22 17 22 19 21
Kyrgyzstan 65 66 61 63 68 70 17 16 15 14 19 18
Lao People's Democratic Republic 50 63 50 62 51 64 14 16 14 15 15 17
Latvia 70 72 64 67 75 77 18 19 15 16 20 22
Lebanon 68 74 64 71 71 77 17 19 16 17 19 21
Lesotho 60 48 55 46 65 50 16 16 14 14 17 17
1. Life expectancy and mortality

Tabl
e 1
55
MDG 4
Stillbirth rate b
(per 1000 total births)
Neonatal mortality rate c
(per 1000 live births)
Infant mortality rate c(probability of dying by age 1
per 1000 live births)
Under-five mortality rate c (probability of dying by age 5
per 1000 live births)
Adult mortality rate a (probability of dying between 15 and 60 years of age per 1000 population)
Member State
Both sexes Both sexes Both sexes Both sexes Male Female
2009 1990 2010 1990 2000 2010 1990 2000 2010 1990 2009 1990 2009
2 4 2 7 5 3 9 6 4 152 107 99 65 Denmark
34 40 34 95 83 73 123 106 91 316 326 254 271 Djibouti
11 11 8 14 13 11 17 15 12 194 192 145 103 Dominica
12 29 15 48 33 22 62 41 27 180 172 153 149 Dominican Republic
12 20 10 41 27 18 52 33 20 219 173 141 96 Ecuador
13 28 9 68 37 19 94 47 22 238 215 182 130 Egypt
14 18 6 48 28 14 62 34 16 373 281 164 128 El Salvador
17 45 35 118 98 81 190 152 121 401 373 345 355 Equatorial Guinea
21 31 18 87 60 42 141 93 61 920 249 430 179 Eritrea
4 12 15 15 8 4 20 11 5 301 234 107 77 Estonia
26 48 35 111 87 68 184 141 106 590 445 399 379 Ethiopia
13 12 8 25 19 15 30 23 17 289 263 181 157 Fiji
2 4 2 6 4 2 7 4 3 183 124 70 56 Finland
4 3 2 7 4 3 9 5 4 162 117 67 54 France
17 31 26 68 63 54 93 88 74 278 321 210 262 Gabon
26 42 31 78 66 57 165 128 98 344 296 312 246 Gambia
17 27 15 40 29 20 47 33 22 242 235 110 97 Georgia
2 4 2 7 4 3 9 5 4 157 99 77 53 Germany
22 38 28 77 64 50 122 99 74 215 402 248 253 Ghana
3 9 2 11 7 3 13 8 4 117 106 56 44 Greece
11 10 5 17 13 9 21 15 11 215 248 150 143 Grenada
10 28 15 56 37 25 78 49 32 286 280 198 151 Guatemala
24 51 38 135 106 81 229 175 130 316 474 264 337 Guinea
30 48 40 125 107 92 210 177 150 490 431 360 369 Guinea-Bissau
17 34 19 50 37 25 66 47 30 385 286 223 224 Guyana
15 38 27 104 78 70 151 109 165 483 278 401 227 Haiti
18 23 12 45 31 20 58 37 24 248 237 166 134 Honduras
4 12 4 17 9 5 19 11 6 304 229 133 99 Hungary
2 3 1 5 3 2 6 4 2 112 65 69 43 Iceland
22 47 32 81 63 48 115 86 63 302 250 243 169 India
15 31 17 56 38 27 85 54 35 199 234 137 143 Indonesia
13 28 14 50 35 22 65 44 26 300 144 196 90 Iran (Islamic Republic of)
9 23 20 37 34 31 46 43 39 246 292 157 145 Iraq
3 5 2 8 6 3 9 7 4 133 97 81 57 Ireland
3 6 2 10 6 4 12 7 5 107 78 71 45 Israel
3 6 2 8 5 3 10 6 4 129 77 60 41 Italy
13 13 9 31 25 20 38 30 24 136 224 118 131 Jamaica
3 3 1 5 3 2 6 5 3 109 86 53 42 Japan
13 20 13 32 25 18 38 29 22 212 195 135 111 Jordan
5 26 17 48 38 29 57 44 33 318 432 150 185 Kazakhstan
22 31 28 64 69 55 99 111 85 288 358 218 282 Kenya
13 29 19 64 50 39 87 65 49 246 325 226 173 Kiribati
5 9 6 13 10 10 15 13 11 114 66 84 50 Kuwait
10 30 19 59 44 33 72 52 38 290 327 156 162 Kyrgyzstan
14 39 21 100 64 42 145 88 54 434 289 401 251 Lao People's Democratic Republic
4 12 5 16 14 8 21 17 10 311 284 118 105 Latvia
9 18 12 31 25 19 38 29 22 269 166 139 85 Lebanon
25 36 35 72 88 65 89 127 85 417 676 171 573 Lesotho
011010011001101001100110100110011010011001101001100110100110011010011010010110010111101010100101010100101100101111010101001010101001010010011010011001001101001100100110100110010011010011001001101001001010101001010101001010101001010101001010101001010101001010101001010101001010101001010101001010101001010101001010101001010101001101001100110100110011010011001101001100110100110011010011001101001101100010101100010101100010101100010101100010101100010101100010101011010011001101001100110100110011010011001101001100110100110011010010100101010010101011000100110100101010010101011000100110100101010010101010110001001101001101001011010100110001001101001101001011010100110001001100101111010010101001010010111101001010100101001011110100101010010100101011010011001101001100110100110011010011001101001100110100110011010010010100110100010100110100010100110100010100110100010100110100010100101101001100110100110011010011001101001100110100110011010011001101001111010010101001010111010010111101001010100101011101001011110100101010010101011010011001101001100110100110011010011001101001100110100110011010011001011110101010010110010111101010100101100101111010101001011001010110100110011010011001101001100110100110011010011001101001100110100101001011010000100101101000010010110100001001011010000100101101000010010101101001100110100110011010011001101001100110100110011010011001101001
0101011000100110100110100101101010101100010011010011010010110101010101101001100110100110011010011001101001100110100110011010011001101001101001011001011110101010010101010010110010111101010100101010100101001001101001100100110100110010011010011001001101001100100110100100101010100101010100101010100101010100101010100101010100101010100101010100101010100101010100101010100101010100101010100101010100110100110011010011001101001100110100110011010011001101001100110100110110001010110001010110001010110001010110001010110001010110001010101101001100110100110011010011001101001100110100110011010011001101001010010101001010101100010011010010101001010101100010011010010101001010101011000100110100110100101101010011000100110100110100101101010011000100110010111101001010100101001011110100101010010100101111010010101001010010101101001100110100110011010011001101001100110100110011010011001101001001010011010001010011010001010011010001010011010001010011010001010010110100110011010011001101001100110100110011010011001101001100110100111101001010100101011101001011110100101010010101110100101111010010101001010101101001100110100110011010011001101001100110100110011010011001101001100101111010101001011001011110101010010110010111101010100101100101
010010100110101010110010100101100101111010101001010100101010110001001

56
Member State Life expectancy at birth a (years)
Life expectancy at age 60 a (years)
Both sexes Male Female Both sexes Male Female
1990 2009 1990 2009 1990 2009 1990 2009 1990 2009 1990 2009
Liberia 37 56 30 54 49 57 13 15 11 14 15 16
Libya 69 73 67 70 72 75 17 18 16 17 19 20
Lithuania 71 73 66 68 76 79 19 20 16 16 21 22
Luxembourg 75 81 72 78 79 83 20 23 18 21 22 25
Madagascar 52 65 51 63 54 67 15 16 14 15 16 17
Malawi 48 47 46 44 50 51 15 14 14 12 16 16
Malaysia 71 73 68 71 73 76 17 18 16 17 19 19
Maldives 57 75 58 74 55 76 13 19 14 18 12 19
Mali 49 53 47 50 50 56 15 15 14 14 16 16
Malta 76 80 74 78 78 82 19 23 18 21 21 24
Marshall Islands 62 59 59 58 65 60 15 12 13 13 18 11
Mauritania 57 58 56 57 58 60 15 16 15 15 16 16
Mauritius 69 73 66 69 73 77 17 19 14 17 19 21
Mexico 71 76 68 73 74 78 21 21 19 20 22 23
Micronesia (Federated States of) 66 69 65 68 67 70 17 18 16 17 17 18
Monaco 77 82 74 78 81 85 22 25 20 23 25 28
Mongolia 63 69 59 65 66 74 17 19 14 17 19 21
Montenegro 76 75 73 72 79 77 21 19 19 18 23 20
Morocco 65 73 63 71 68 75 17 19 16 18 18 20
Mozambique 48 49 43 47 52 51 15 15 13 13 16 16
Myanmar 58 64 56 61 61 67 16 17 15 15 16 18
Namibia 60 57 55 53 65 62 15 16 14 13 17 18
Nauru 60 60 56 56 64 65 14 15 12 13 15 16
Nepal 55 67 55 65 55 69 15 17 14 16 16 18
Netherlands 77 81 74 78 80 83 21 23 18 21 23 25
New Zealand 75 81 72 79 78 83 20 24 18 23 22 25
Nicaragua 68 74 64 71 73 77 21 22 20 21 23 23
Niger 44 57 43 57 45 58 14 16 14 15 15 16
Nigeria 48 54 47 53 49 54 14 15 14 14 15 16
Niue 75 72 72 66 78 80 20 20 19 17 22 22
Norway 77 81 73 79 80 83 21 24 18 22 23 25
Oman 68 74 66 72 70 77 17 19 16 18 18 21
Pakistan 59 63 58 63 60 64 16 16 15 16 17 17
Palau 69 72 64 68 76 77 17 19 14 17 21 22
Panama 73 77 72 74 75 79 20 23 20 22 21 25
Papua New Guinea 58 63 57 62 60 65 15 16 14 15 16 17
Paraguay 73 75 71 72 76 77 21 21 19 20 22 23
Peru 69 76 67 74 72 77 21 21 20 20 22 22
Philippines 65 70 63 67 68 73 17 18 16 17 18 20
Poland 71 76 67 72 76 80 18 21 15 18 20 23
Portugal 74 79 71 76 78 82 20 23 18 21 21 25
Qatar 75 78 75 78 75 79 20 22 20 22 19 21
Republic of Korea 72 80 68 77 76 83 18 24 15 21 20 26
Republic of Moldova 68 69 64 65 71 73 17 17 15 15 18 18
Romania 70 73 67 70 73 77 18 19 16 17 19 21
Russian Federation 69 68 63 62 74 74 18 17 15 14 20 20
Rwanda 51 59 49 57 52 60 15 16 14 15 16 17
Saint Kitts and Nevis 68 75 65 71 71 78 17 21 16 19 19 22
1. Life expectancy and mortality

Tabl
e 1
57
MDG 4
Stillbirth rate b
(per 1000 total births)
Neonatal mortality rate c
(per 1000 live births)
Infant mortality rate c(probability of dying by age 1
per 1000 live births)
Under-five mortality rate c (probability of dying by age 5
per 1000 live births)
Adult mortality rate a (probability of dying between 15 and 60 years of age per 1000 population)
Member State
Both sexes Both sexes Both sexes Both sexes Male Female
2009 1990 2010 1990 2000 2010 1990 2000 2010 1990 2009 1990 2009
27 53 34 151 115 74 227 169 103 819 389 321 337 Liberia
10 22 10 33 22 13 45 27 17 207 175 133 101 Libya
4 10 3 14 9 5 17 12 7 287 274 107 95 Lithuania
3 4 1 7 4 2 8 5 3 160 95 79 57 Luxembourg
21 40 22 97 65 43 159 102 62 380 273 307 198 Madagascar
24 44 27 131 99 58 222 167 92 427 691 324 496 Malawi
6 9 3 15 9 5 18 11 6 209 175 128 95 Malaysia
13 37 9 74 37 14 102 47 15 281 97 346 70 Maldives
23 57 48 131 113 99 255 213 178 331 357 257 218 Mali
3 7 4 10 7 5 11 8 6 107 76 62 44 Malta
15 19 12 40 30 22 51 37 26 385 429 329 386 Marshall Islands
27 42 39 80 77 75 124 116 111 313 315 275 262 Mauritania
9 16 9 21 16 13 24 19 15 263 219 121 99 Mauritius
5 17 7 38 24 14 49 29 17 215 157 120 88 Mexico
14 22 18 44 39 34 56 49 42 231 183 196 161 Micronesia (Federated States of)
3 5 2 7 4 3 9 5 4 155 112 67 51 Monaco
11 27 12 76 47 26 107 61 32 261 305 192 141 Mongolia
3 11 5 16 11 7 18 13 8 164 161 73 85 Montenegro
20 36 19 67 46 30 86 55 36 195 126 133 87 Morocco
28 51 39 146 119 92 219 177 135 482 557 239 434 Mozambique
20 44 32 79 64 50 112 87 66 306 275 244 188 Myanmar
15 25 17 49 49 29 73 74 40 441 540 220 357 Namibia
17 22 22 32 32 32 40 40 40 567 448 399 303 Nauru
23 54 28 97 64 41 141 84 50 321 234 308 159 Nepal
3 5 3 7 5 4 8 6 4 116 75 67 56 Netherlands
4 4 3 9 6 5 11 7 6 143 86 93 57 New Zealand
14 25 12 52 34 23 68 43 27 272 210 136 122 Nicaragua
23 48 32 132 98 73 311 218 143 352 229 297 224 Niger
42 49 40 126 112 88 213 186 143 417 377 355 365 Nigeria
12 7 10 12 25 19 14 29 22 156 282 62 46 Niue
2 4 2 7 4 3 9 5 3 128 83 65 50 Norway
7 22 5 36 17 8 47 22 9 220 157 151 85 Oman
47 51 41 96 80 70 124 101 87 249 225 215 189 Pakistan
12 14 9 27 20 15 33 25 19 289 229 112 110 Palau
10 14 9 26 21 17 33 26 20 146 145 101 82 Panama
15 30 23 65 55 47 90 74 61 349 274 289 221 Papua New Guinea
19 24 14 40 29 21 50 35 25 138 168 99 98 Paraguay
10 27 9 55 31 15 78 41 19 165 123 123 96 Peru
16 23 14 42 30 23 59 40 29 281 240 167 130 Philippines
3 11 4 15 8 5 17 10 6 263 197 102 76 Poland
3 7 2 11 6 3 15 7 4 176 123 80 54 Portugal
8 10 4 17 11 7 21 13 8 94 69 82 48 Qatar
3 3 2 6 5 4 8 6 5 236 109 102 46 Republic of Korea
9 15 9 30 22 16 37 26 19 285 309 155 134 Republic of Moldova
4 15 8 29 22 11 37 27 14 239 219 114 90 Romania
10 12 6 22 18 9 27 23 12 318 391 117 144 Russian Federation
23 42 24 99 109 44 164 183 64 409 304 375 258 Rwanda
10 17 5 22 13 7 28 16 8 272 185 193 90 Saint Kitts and Nevis
011010011001101001100110100110011010011001101001100110100110011010011010010110010111101010100101010100101100101111010101001010101001010010011010011001001101001100100110100110010011010011001001101001001010101001010101001010101001010101001010101001010101001010101001010101001010101001010101001010101001010101001010101001010101001101001100110100110011010011001101001100110100110011010011001101001101100010101100010101100010101100010101100010101100010101100010101011010011001101001100110100110011010011001101001100110100110011010010100101010010101011000100110100101010010101011000100110100101010010101010110001001101001101001011010100110001001101001101001011010100110001001100101111010010101001010010111101001010100101001011110100101010010100101011010011001101001100110100110011010011001101001100110100110011010010010100110100010100110100010100110100010100110100010100110100010100101101001100110100110011010011001101001100110100110011010011001101001111010010101001010111010010111101001010100101011101001011110100101010010101011010011001101001100110100110011010011001101001100110100110011010011001011110101010010110010111101010100101100101111010101001011001010110100110011010011001101001100110100110011010011001101001100110100101001011010000100101101000010010110100001001011010000100101101000010010101101001100110100110011010011001101001100110100110011010011001101001
0101011000100110100110100101101010101100010011010011010010110101010101101001100110100110011010011001101001100110100110011010011001101001101001011001011110101010010101010010110010111101010100101010100101001001101001100100110100110010011010011001001101001100100110100100101010100101010100101010100101010100101010100101010100101010100101010100101010100101010100101010100101010100101010100101010100110100110011010011001101001100110100110011010011001101001100110100110110001010110001010110001010110001010110001010110001010110001010101101001100110100110011010011001101001100110100110011010011001101001010010101001010101100010011010010101001010101100010011010010101001010101011000100110100110100101101010011000100110100110100101101010011000100110010111101001010100101001011110100101010010100101111010010101001010010101101001100110100110011010011001101001100110100110011010011001101001001010011010001010011010001010011010001010011010001010011010001010010110100110011010011001101001100110100110011010011001101001100110100111101001010100101011101001011110100101010010101110100101111010010101001010101101001100110100110011010011001101001100110100110011010011001101001100101111010101001011001011110101010010110010111101010100101100101
010010100110101010110010100101100101111010101001010100101010110001001

58
Member State Life expectancy at birth a (years)
Life expectancy at age 60 a (years)
Both sexes Male Female Both sexes Male Female
1990 2009 1990 2009 1990 2009 1990 2009 1990 2009 1990 2009
Saint Lucia 71 75 69 71 74 78 19 21 18 19 20 23
Saint Vincent and the Grenadines 71 73 68 71 74 76 19 20 17 19 21 21
Samoa 63 70 62 68 64 72 16 18 15 16 16 19
San Marino 79 83 76 82 82 85 22 25 20 24 25 27
Sao Tome and Principe 65 68 63 66 66 70 17 18 16 17 18 19
Saudi Arabia 68 72 66 69 71 75 17 18 16 17 19 20
Senegal 57 62 54 60 59 63 15 16 14 15 17 17
Serbia 72 74 69 71 75 76 18 18 17 17 20 20
Seychelles 69 73 64 69 75 77 17 19 14 16 21 22
Sierra Leone 40 49 38 48 43 50 14 15 13 14 15 15
Singapore 75 82 73 79 77 84 20 24 18 22 21 26
Slovakia 71 75 67 71 76 79 18 20 15 17 20 22
Slovenia 74 79 70 76 78 82 19 23 17 20 21 24
Solomon Islands 67 71 65 69 69 72 16 18 16 17 18 19
Somalia 48 51 46 51 51 51 14 15 13 14 15 15
South Africa 63 55 59 54 68 55 16 17 14 15 17 18
Spain 77 82 73 79 80 85 21 24 19 22 23 27
Sri Lanka 68 71 63 65 74 77 19 19 18 17 21 21
Sudan 57 59 58 59 57 59 15 16 15 15 16 16
Suriname 66 72 64 68 69 75 17 20 16 17 19 22
Swaziland 61 49 60 47 63 50 16 15 15 13 17 16
Sweden 78 81 75 79 80 83 21 24 19 22 23 25
Switzerland 78 82 74 80 81 84 22 25 19 23 24 26
Syrian Arab Republic 67 74 65 71 70 76 17 19 15 17 18 21
Tajikistan 63 68 61 66 65 69 17 17 17 17 18 17
Thailand 68 70 65 66 72 74 17 18 16 17 18 20
The former Yugoslav Republic of Macedonia 72 74 70 72 74 76 19 18 17 17 20 20
Timor-Leste 51 67 48 64 53 69 15 17 14 16 15 18
Togo 55 59 52 57 57 61 15 16 14 15 16 17
Tonga 68 71 64 72 73 70 16 18 14 18 18 18
Trinidad and Tobago 69 70 66 66 71 75 17 19 16 16 19 21
Tunisia 70 75 69 73 72 77 18 20 18 19 19 21
Turkey 65 75 63 72 67 77 17 20 16 18 18 21
Turkmenistan 62 63 58 60 65 67 16 16 14 15 17 16
Tuvalu 62 64 61 64 63 63 14 14 13 14 15 15
Uganda 48 52 45 48 51 57 15 15 13 13 16 17
Ukraine 70 68 65 62 75 74 18 18 15 15 20 20
United Arab Emirates 73 78 71 77 76 80 19 21 18 20 20 22
United Kingdom 76 80 73 78 79 82 20 23 18 22 22 25
United Republic of Tanzania 53 55 52 53 54 58 15 16 14 14 16 17
United States of America 75 79 72 76 79 81 21 23 19 22 23 25
Uruguay 72 76 69 72 76 79 19 21 16 18 21 23
Uzbekistan 66 69 63 66 69 71 18 16 16 15 19 18
Vanuatu 65 71 64 69 66 72 16 17 15 16 17 19
Venezuela (Bolivarian Republic of) 72 75 70 71 74 79 19 22 18 21 20 23
Viet Nam 65 72 63 70 67 75 16 19 15 17 17 20
Yemen 58 65 57 63 58 67 15 17 15 16 16 18
Zambia 46 48 44 46 48 50 14 15 13 13 15 16
Zimbabwe 61 49 58 47 64 50 16 16 15 15 18 18
1. Life expectancy and mortality

Tabl
e 1
59
MDG 4
Stillbirth rate b
(per 1000 total births)
Neonatal mortality rate c
(per 1000 live births)
Infant mortality rate c(probability of dying by age 1
per 1000 live births)
Under-five mortality rate c (probability of dying by age 5
per 1000 live births)
Adult mortality rate a (probability of dying between 15 and 60 years of age per 1000 population)
Member State
Both sexes Both sexes Both sexes Both sexes Male Female
2009 1990 2010 1990 2000 2010 1990 2000 2010 1990 2009 1990 2009
15 13 10 18 15 14 23 18 16 204 188 147 90 Saint Lucia
10 16 13 21 19 19 27 22 21 217 204 140 110 Saint Vincent and the Grenadines
10 10 8 23 20 17 27 23 20 306 198 283 167 Samoa
3 5 1 11 5 2 12 5 2 80 57 40 48 San Marino
22 28 25 61 57 53 94 87 80 197 161 142 104 Sao Tome and Principe
8 20 10 36 22 15 45 26 18 217 186 139 102 Saudi Arabia
34 40 27 70 63 50 139 119 75 314 266 210 218 Senegal
5 16 4 25 11 6 29 13 7 184 184 94 90 Serbia
9 9 8 14 12 12 17 14 14 317 227 127 108 Seychelles
30 57 45 162 142 114 276 233 174 553 414 392 363 Sierra Leone
2 4 1 6 3 2 8 4 3 152 76 93 42 Singapore
4 12 4 15 10 7 18 12 8 269 184 103 74 Slovakia
3 5 2 9 5 2 10 5 3 207 131 81 54 Slovenia
15 18 12 36 28 23 45 35 27 250 170 188 119 Solomon Islands
30 52 52 108 108 108 180 180 180 504 382 359 350 Somalia
20 18 18 47 54 41 60 78 57 341 521 191 479 South Africa
3 6 3 9 5 4 11 7 5 146 94 60 43 Spain
17 18 10 26 19 14 32 23 17 326 275 127 82 Sri Lanka
24 39 35 78 72 66 125 114 103 289 291 290 275 Sudan
15 21 14 44 35 27 52 40 31 265 217 175 124 Suriname
18 24 21 70 77 55 96 114 78 288 674 227 560 Swaziland
3 3 2 6 3 2 7 4 3 114 74 66 47 Sweden
3 4 3 7 5 4 8 6 5 126 74 62 43 Switzerland
12 18 9 31 20 14 38 23 16 257 159 186 95 Syrian Arab Republic
12 37 25 91 75 52 116 93 63 217 183 180 160 Tajikistan
4 17 8 26 15 11 32 18 13 259 270 147 139 Thailand
6 17 8 34 14 10 39 16 12 153 144 87 79 The former Yugoslav Republic of Macedonia
14 48 24 127 82 46 169 104 55 402 233 329 154 Timor-Leste
25 40 32 87 76 66 147 124 103 355 338 288 278 Togo
9 11 8 21 17 13 25 20 16 313 135 128 233 Tonga
9 23 18 32 28 24 37 32 27 236 225 156 120 Trinidad and Tobago
10 23 9 39 24 14 49 28 16 146 129 103 70 Tunisia
11 32 8 66 33 12 80 42 13 217 134 151 73 Turkey
13 33 23 78 61 47 98 74 56 301 380 192 212 Turkmenistan
12 22 14 44 35 27 57 44 33 272 255 280 280 Tuvalu
25 36 26 106 88 63 175 144 99 509 539 386 348 Uganda
8 9 6 18 15 11 21 18 13 287 395 112 148 Ukraine
4 12 4 18 11 6 22 12 7 151 84 97 66 United Arab Emirates
4 5 3 8 6 5 9 7 5 129 95 78 58 United Kingdom
26 40 26 95 81 50 155 130 76 370 456 293 311 United Republic of Tanzania
3 6 4 9 7 7 11 9 8 172 134 91 78 United States of America
9 11 6 20 15 9 23 17 11 196 156 98 84 Uruguay
6 30 23 63 53 44 77 63 52 250 220 144 139 Uzbekistan
13 16 7 31 20 12 39 23 14 272 200 239 159 Vanuatu
11 17 10 28 21 16 33 25 18 178 196 117 92 Venezuela (Bolivarian Republic of)
13 23 12 37 27 19 51 35 23 277 173 201 107 Viet Nam
23 43 32 90 72 57 128 100 77 301 237 273 180 Yemen
26 40 30 109 94 69 183 157 111 543 580 467 477 Zambia
20 27 27 52 69 51 78 115 80 339 672 232 574 Zimbabwe
011010011001101001100110100110011010011001101001100110100110011010011010010110010111101010100101010100101100101111010101001010101001010010011010011001001101001100100110100110010011010011001001101001001010101001010101001010101001010101001010101001010101001010101001010101001010101001010101001010101001010101001010101001010101001101001100110100110011010011001101001100110100110011010011001101001101100010101100010101100010101100010101100010101100010101100010101011010011001101001100110100110011010011001101001100110100110011010010100101010010101011000100110100101010010101011000100110100101010010101010110001001101001101001011010100110001001101001101001011010100110001001100101111010010101001010010111101001010100101001011110100101010010100101011010011001101001100110100110011010011001101001100110100110011010010010100110100010100110100010100110100010100110100010100110100010100101101001100110100110011010011001101001100110100110011010011001101001111010010101001010111010010111101001010100101011101001011110100101010010101011010011001101001100110100110011010011001101001100110100110011010011001011110101010010110010111101010100101100101111010101001011001010110100110011010011001101001100110100110011010011001101001100110100101001011010000100101101000010010110100001001011010000100101101000010010101101001100110100110011010011001101001100110100110011010011001101001
0101011000100110100110100101101010101100010011010011010010110101010101101001100110100110011010011001101001100110100110011010011001101001101001011001011110101010010101010010110010111101010100101010100101001001101001100100110100110010011010011001001101001100100110100100101010100101010100101010100101010100101010100101010100101010100101010100101010100101010100101010100101010100101010100101010100110100110011010011001101001100110100110011010011001101001100110100110110001010110001010110001010110001010110001010110001010110001010101101001100110100110011010011001101001100110100110011010011001101001010010101001010101100010011010010101001010101100010011010010101001010101011000100110100110100101101010011000100110100110100101101010011000100110010111101001010100101001011110100101010010100101111010010101001010010101101001100110100110011010011001101001100110100110011010011001101001001010011010001010011010001010011010001010011010001010011010001010010110100110011010011001101001100110100110011010011001101001100110100111101001010100101011101001011110100101010010101110100101111010010101001010101101001100110100110011010011001101001100110100110011010011001101001100101111010101001011001011110101010010110010111101010100101100101
010010100110101010110010100101100101111010101001010100101010110001001

60
Member State Life expectancy at birth a (years)
Life expectancy at age 60 a (years)
Both sexes Male Female Both sexes Male Female
1990 2009 1990 2009 1990 2009 1990 2009 1990 2009 1990 2009
Ranges of country valuesMinimum 36 47 28 44 43 48 12 12 10 12 12 11Median 68 72 64 69 70 75 17 19 16 17 19 20Maximum 79 83 76 82 82 86 23 26 21 24 25 29
WHO regionAfrican Region 51 54 49 52 53 56 15 15 14 14 16 16Region of the Americas 71 76 68 73 75 79 20 22 18 21 22 24South-East Asia Region 59 65 58 64 59 67 15 17 14 16 16 18European Region 71 75 68 71 75 79 19 21 17 19 21 23Eastern Mediterranean Region 61 66 59 64 63 67 16 17 15 16 17 18Western Pacific Region 69 75 68 72 71 77 18 20 17 19 19 22
Income groupLow income 52 57 50 55 54 59 15 16 14 15 16 17Lower middle income 63 68 61 66 64 69 16 18 15 17 17 19Upper middle income 68 71 64 68 72 75 18 19 16 17 20 21High income 76 80 72 77 79 83 21 24 18 22 23 26
Global 64 68 62 66 66 71 18 19 16 18 19 21
a Mortality Data. Geneva, World Health Organization, 2011 (http://www.who.int/health-info/statistics/mortality/en/). Income-group aggregates are based on the 2010 World Bank list of economies.
b Cousens S et al. (2011). National, regional, and worldwide estimates of stillbirth rates in 2009 with trends since 1995: a systematic analysis. Lancet, Apr 16, 377(9774):1319–1330. Income-group aggregates are based on the 2010 World Bank list of economies.
c Mortality Data. Geneva, World Health Organization, 2011 (http://www.who.int/health-info/statistics/mortality/en/). The figures for Turkey and Rwanda are interim estimates that have been updated from previously published figures to incorporate new survey data, Turkish Infant and Under-five Child Mortality Survey 2006–2010 and Demograph-ic and Health Survey 2010, respectively.
1. Life expectancy and mortality

Tabl
e 1
61
MDG 4
Stillbirth rate b
(per 1000 total births)
Neonatal mortality rate c
(per 1000 live births)
Infant mortality rate c(probability of dying by age 1
per 1000 live births)
Under-five mortality rate c (probability of dying by age 5
per 1000 live births)
Adult mortality rate a (probability of dying between 15 and 60 years of age per 1000 population)
Member State
Both sexes Both sexes Both sexes Both sexes Male Female
2009 1990 2010 1990 2000 2010 1990 2000 2010 1990 2009 1990 2009
2 3 1 5 3 2 6 4 2 80 57 40 41 Minimum
12 21 11 37 27 18 47 33 20 257 217 148 119 Median
47 57 52 162 142 114 311 233 180 920 691 467 574 Maximum
28 42 34 104 94 75 172 154 119 420 420 311 347 African Region
7 18 9 34 23 14 42 28 18 207 161 115 89 Region of the Americas
22 45 29 78 58 44 111 80 57 289 248 231 167 South-East Asia Region
6 14 7 27 18 11 33 22 14 215 203 97 88 European Region
27 38 28 74 60 51 100 80 68 263 215 205 159 Eastern Mediterranean Region
10 22 11 37 26 16 48 33 19 192 144 138 86 Western Pacific Region
26 46 33 103 86 69 164 136 107 395 361 314 280 Low income
21 41 29 77 63 50 112 89 69 248 210 188 140 Lower middle income
9 23 11 39 27 16 49 33 19 262 239 132 128 Upper middle income
3 6 4 10 7 5 12 8 6 160 115 78 61 High income
19 32 23 61 51 40 88 73 57 244 212 167 139 Global
011010011001101001100110100110011010011001101001100110100110011010011010010110010111101010100101010100101100101111010101001010101001010010011010011001001101001100100110100110010011010011001001101001001010101001010101001010101001010101001010101001010101001010101001010101001010101001010101001010101001010101001010101001010101001101001100110100110011010011001101001100110100110011010011001101001101100010101100010101100010101100010101100010101100010101100010101011010011001101001100110100110011010011001101001100110100110011010010100101010010101011000100110100101010010101011000100110100101010010101010110001001101001101001011010100110001001101001101001011010100110001001100101111010010101001010010111101001010100101001011110100101010010100101011010011001101001100110100110011010011001101001100110100110011010010010100110100010100110100010100110100010100110100010100110100010100101101001100110100110011010011001101001100110100110011010011001101001111010010101001010111010010111101001010100101011101001011110100101010010101011010011001101001100110100110011010011001101001100110100110011010011001011110101010010110010111101010100101100101111010101001011001010110100110011010011001101001100110100110011010011001101001100110100101001011010000100101101000010010110100001001011010000100101101000010010101101001100110100110011010011001101001100110100110011010011001101001
0101011000100110100110100101101010101100010011010011010010110101010101101001100110100110011010011001101001100110100110011010011001101001101001011001011110101010010101010010110010111101010100101010100101001001101001100100110100110010011010011001001101001100100110100100101010100101010100101010100101010100101010100101010100101010100101010100101010100101010100101010100101010100101010100101010100110100110011010011001101001100110100110011010011001101001100110100110110001010110001010110001010110001010110001010110001010110001010101101001100110100110011010011001101001100110100110011010011001101001010010101001010101100010011010010101001010101100010011010010101001010101011000100110100110100101101010011000100110100110100101101010011000100110010111101001010100101001011110100101010010100101111010010101001010010101101001100110100110011010011001101001100110100110011010011001101001001010011010001010011010001010011010001010011010001010011010001010010110100110011010011001101001100110100110011010011001101001100110100111101001010100101011101001011110100101010010101110100101111010010101001010101101001100110100110011010011001101001100110100110011010011001101001100101111010101001011001011110101010010110010111101010100101100101
010010100110101010110010100101100101111010101001010100101010110001001

62
63
Tabl
e 2
2. Cause-specific mortality and morbidity
Table 2 brings together indicators on the levels and distribution of the broad categories and more-specific causes of deaths. The three broad categories shown are communicable and noncommunicable condi-tions, and deaths caused by injury. Estimates are also provided of the number of deaths among chil-dren under 5 years old, and the percentage distributions of the major causes of such deaths. These causes include: HIV/AIDS, diarrhoea; other major communicable diseases such measles, malaria and pneumonia; conditions arising in the perinatal period such as prematurity, birth asphyxia, neonatal sep-sis and congenital anomalies; and deaths caused by other diseases and by injury. Estimates are also given of age-standardized all-cause mortality rates among adults aged 30–70 years and of the num-bers of such deaths caused by cancer, cardiovascular disease and diabetes, and chronic respiratory conditions. Table 2 also includes point estimates for key MDG-related indicators, including maternal mortality; and mortality and morbidity caused by HIV/AIDS, malaria and tuberculosis.
The cause-specific indicators presented in Table 2 have been derived from a range of sources of mortality, incidence and prevalence data. These include: death-registration records; health-facility re-ports; household surveys; censuses; and special studies on deaths due to HIV and conflict. Estimat-ing cause-specific mortality is particularly difficult in developing countries where systems for counting deaths and accurately recording their causes are weak or non-existent. Due to resulting limitations in data availability, quality and timeliness, many of the indicators shown are associated with significant uncertainty, the margins of which are available on the Global Health Observatory web site (http://www.who.int/gho).
011010011001101001100110100110011010011001101001100110100110011010011010010110010111101010100101010100101100101111010101001010101001010010011010011001001101001100100110100110010011010011001001101001001010101001010101001010101001010101001010101001010101001010101001010101001010101001010101001010101001010101001010101001010101001101001100110100110011010011001101001100110100110011010011001101001101100010101100010101100010101100010101100010101100010101100010101011010011001101001100110100110011010011001101001100110100110011010010100101010010101011000100110100101010010101011000100110100101010010101010110001001101001101001011010100110001001101001101001011010100110001001100101111010010101001010010111101001010100101001011110100101010010100101011010011001101001100110100110011010011001101001100110100110011010010010100110100010100110100010100110100010100110100010100110100010100101101001100110100110011010011001101001100110100110011010011001101001111010010101001010111010010111101001010100101011101001011110100101010010101011010011001101001100110100110011010011001101001100110100110011010011001011110101010010110010111101010100101100101111010101001011001010110100110011010011001101001100110100110011010011001101001100110100101001011010000100101101000010010110100001001011010000100101101000010010101101001100110100110011010011001101001100110100110011010011001101001
0101011000100110100110100101101010101100010011010011010010110101010101101001100110100110011010011001101001100110100110011010011001101001101001011001011110101010010101010010110010111101010100101010100101001001101001100100110100110010011010011001001101001100100110100100101010100101010100101010100101010100101010100101010100101010100101010100101010100101010100101010100101010100101010100101010100110100110011010011001101001100110100110011010011001101001100110100110110001010110001010110001010110001010110001010110001010110001010101101001100110100110011010011001101001100110100110011010011001101001010010101001010101100010011010010101001010101100010011010010101001010101011000100110100110100101101010011000100110100110100101101010011000100110010111101001010100101001011110100101010010100101111010010101001010010101101001100110100110011010011001101001100110100110011010011001101001001010011010001010011010001010011010001010011010001010011010001010010110100110011010011001101001100110100110011010011001101001100110100111101001010100101011101001011110100101010010101110100101111010010101001010101101001100110100110011010011001101001100110100110011010011001101001100101111010101001011001011110101010010110010111101010100101100101
010010100110101010110010100101100101111010101001010100101010110001001

64
Mortality
Member State Age-standardized mortality rates by cause a
(per 100 000 population)
Number of deaths among
children aged <5 years b
(000s)
Distribution of causes of death among children aged <5 years b (%)
Com
mun
icab
le
Non-
co
mm
unic
able
Inju
ries
HIV/AIDS Diarrhoea Measles Malaria Pneumonia Prematurity
2008 2000 2010 2000 2010 2000 2010 2000 2010 2000 2010 2000 2010 2000 2010
Afghanistan 713 1117 149 161 191 0 0 17 16 9 2 0 0 25 25 15 14
Albania 46 716 46 2 1 0 0 3 1 0 0 0 0 17 11 14 19
Algeria 202 523 47 28 26 0 0 7 5 9 11 0 0 15 12 24 24
Andorra 16 338 27 0 0 0 0 0 0 0 0 0 0 5 4 18 17
Angola 819 842 112 131 121 2 2 20 15 1 0 10 10 20 17 11 13
Antigua and Barbuda 86 548 46 0 0 0 0 0 0 0 0 0 0 0 0 0 16
Argentina 87 501 48 14 10 0 0 2 2 0 0 0 0 7 10 26 24
Armenia 74 902 50 1 1 0 0 3 1 0 0 0 0 15 11 24 25
Australia 18 330 30 2 1 0 0 0 0 0 0 0 0 2 3 16 20
Austria 14 373 34 0 0 0 0 0 0 0 0 0 0 1 2 24 25
Azerbaijan 102 935 36 9 9 0 0 11 8 0 0 0 0 18 17 21 22
Bahamas 91 457 54 0 0 3 1 2 0 0 0 0 0 15 27 13 9
Bahrain 63 590 33 0 0 0 0 1 0 0 0 0 0 1 2 18 19
Bangladesh 344 702 91 300 140 0 0 11 6 5 1 0 1 19 14 19 29
Barbados 86 488 31 0 0 3 0 0 0 0 0 0 0 0 7 35 21
Belarus 30 749 125 1 1 0 0 2 1 0 0 0 0 14 9 16 19
Belgium 33 367 42 1 1 0 0 1 1 0 0 0 0 2 1 20 14
Belize 119 497 92 0 0 2 0 5 10 0 0 0 0 14 7 24 0
Benin 618 804 87 38 39 1 1 10 10 10 0 25 23 15 17 10 12
Bhutan 359 735 105 1 1 0 0 12 7 2 1 1 0 20 20 18 23
Bolivia (Plurinational State of) 253 644 64 21 14 0 0 14 9 0 0 0 0 17 15 17 21
Bosnia and Herzegovina 22 584 29 0 0 0 0 1 1 1 1 0 0 10 9 19 23
Botswana 739 606 107 5 2 48 15 4 6 1 0 1 0 8 13 13 19
Brazil 97 534 76 134 55 0 0 9 3 0 0 0 0 12 7 22 22
Brunei Darussalam 55 520 24 0 0 0 0 0 0 0 0 0 0 6 5 24 25
Bulgaria 31 693 42 1 1 0 0 1 1 0 0 0 0 22 24 13 21
Burkina Faso 801 810 108 101 120 2 1 13 12 10 3 25 24 17 18 8 9
Burundi 943 839 124 39 38 7 6 17 15 2 0 4 4 21 19 11 13
Cambodia 478 748 65 33 16 3 1 13 8 8 0 2 2 19 16 15 22
Cameroon 861 879 111 82 93 6 5 13 13 6 0 16 16 16 15 10 11
Canada 23 346 32 2 2 0 0 0 0 0 0 0 0 2 1 23 26
Cape Verde 213 538 71 1 0 0 0 15 8 4 0 0 0 21 19 16 15
Central African Republic 1060 870 151 25 23 9 3 11 11 8 0 22 26 15 16 9 11
Chad 1009 866 119 68 80 3 3 14 14 7 0 18 20 19 19 10 11
Chile 43 419 45 3 2 0 0 1 1 0 0 0 0 12 7 23 22
China 58 604 70 674 315 0 0 5 3 0 0 0 0 25 17 14 15
Colombia 64 404 97 24 18 0 0 5 4 0 0 0 0 11 10 25 21
Comoros 472 789 76 2 2 0 0 12 9 0 0 13 14 20 18 14 15
Congo 692 811 140 12 13 6 5 8 7 11 0 22 26 14 14 11 13
Cook Islands 109 455 31 0 0 0 0 1 1 0 0 0 0 7 5 15 18
Costa Rica 32 409 56 1 1 0 0 4 1 0 0 0 0 7 3 21 20
Côte d'Ivoire 904 942 172 88 80 9 3 10 9 6 0 21 25 15 15 11 13
Croatia 20 560 48 0 0 0 0 1 0 0 0 0 0 5 3 20 13
Cuba 47 468 48 1 1 0 0 2 2 0 0 0 0 11 11 10 10
Cyprus 17 371 31 0 0 0 0 0 0 0 0 0 0 5 3 24 25
Czech Republic 25 496 43 1 0 0 0 0 1 0 0 0 0 6 5 16 17
Democratic People's Republic of Korea 264 548 46 24 12 0 0 10 5 0 0 0 0 17 15 21 25
Democratic Republic of the Congo 932 837 155 415 465 1 1 15 13 4 0 20 18 18 19 11 10
Denmark 27 440 33 0 0 0 0 0 0 0 0 0 0 5 2 29 34
2. Cause-specific mortality and morbidity

65
Tabl
e 2
Mortailty
Distribution of causes of death among children aged <5 years b (%)
Age-standardized adult mortality rate by cause a
(ages 30-70 per 100 000 population)
Member State
All c
ause
s
Canc
er
Card
iova
scul
ar
diea
se a
nd
diab
etes
Chro
nic
resp
irato
ry
cond
ition
s
Birth asphyxia Neonatal sepsisCongenital anomalies Other diseases Injuries
2000 2010 2000 2010 2000 2010 2000 2010 2000 2010 2008
8 9 4 5 3 3 16 20 4 5 1663 131 634 69 Afghanistan
9 7 5 5 21 24 19 20 12 11 518 168 215 10 Albania
12 11 3 3 10 13 15 15 4 5 591 127 200 48 Algeria
6 6 1 1 32 33 26 27 11 11 310 126 80 16 Andorra
7 8 5 6 4 7 16 19 3 4 1685 130 459 110 Angola
40 32 0 0 23 9 37 31 0 12 682 164 306 19 Antigua and Barbuda
6 4 5 5 24 27 21 21 9 7 553 165 165 39 Argentina
10 8 8 6 17 22 16 18 8 9 864 239 378 34 Armenia
10 9 2 1 28 24 31 35 11 8 278 125 65 11 Australia
7 6 1 1 38 32 19 29 9 6 335 140 80 10 Austria
9 9 4 3 8 10 25 24 5 6 918 188 489 29 Azerbaijan
16 6 5 5 20 12 15 32 12 8 629 126 228 15 Bahamas
7 9 2 5 37 32 19 26 14 6 408 73 207 20 Bahrain
13 14 10 9 4 7 15 14 4 6 1210 183 421 97 Bangladesh
22 12 1 2 15 31 21 27 3 0 487 140 166 19 Barbados
8 8 4 3 28 34 19 18 10 7 1017 198 446 26 Belarus
10 8 2 3 27 27 30 37 8 8 369 151 85 19 Belgium
10 48 2 0 16 7 13 15 14 12 747 125 268 29 Belize
7 9 2 2 4 4 12 18 2 3 1528 161 413 102 Benin
11 12 7 4 4 7 17 20 8 7 1027 171 366 87 Bhutan
12 12 7 7 8 10 19 19 5 6 791 105 208 37 Bolivia (Plurinational State of)
9 10 5 5 31 31 17 16 7 5 498 137 266 13 Bosnia and Herzegovina
8 10 4 4 4 9 8 17 1 4 1633 66 293 70 Botswana
8 11 7 10 13 19 24 23 4 4 667 139 248 32 Brazil
5 4 6 4 26 29 19 22 13 11 480 107 219 26 Brunei Darussalam
8 10 3 2 27 18 19 19 6 5 687 196 339 16 Bulgaria
6 6 2 2 3 4 12 18 2 3 1497 143 377 94 Burkina Faso
8 9 7 8 2 3 17 20 4 5 1893 161 391 91 Burundi
10 11 7 6 3 6 16 20 4 7 1189 156 384 63 Cambodia
7 8 4 5 4 5 14 18 3 3 1846 122 473 115 Cameroon
10 11 4 2 25 23 29 31 7 6 320 138 82 11 Canada
6 6 8 6 13 16 8 24 8 5 772 144 235 55 Cape Verde
7 8 3 5 3 3 11 14 2 3 2275 121 483 116 Central African Republic
7 7 4 4 4 4 12 14 3 3 1841 130 461 111 Chad
4 3 3 3 34 36 15 20 8 8 414 125 114 17 Chile
18 16 2 1 7 11 19 25 9 10 568 179 199 49 China
9 8 6 7 15 21 21 23 6 6 493 112 152 21 Colombia
11 11 5 4 4 5 17 20 4 4 1194 140 393 92 Comoros
9 9 1 2 4 6 11 14 2 3 1468 113 391 95 Congo
16 13 4 4 26 29 16 18 16 13 559 63 275 38 Cook Islands
7 8 3 1 33 37 19 25 5 4 400 107 118 12 Costa Rica
9 10 5 5 4 4 10 13 2 3 2567 104 651 166 Côte d'Ivoire
6 3 4 6 35 29 23 37 6 8 531 203 179 8 Croatia
12 10 6 7 28 23 21 30 10 8 476 159 172 19 Cuba
7 6 1 1 32 34 23 23 7 6 243 75 99 7 Cyprus
13 14 3 6 22 22 32 28 8 7 501 191 164 13 Czech Republic
10 10 6 5 8 11 24 23 5 7 779 120 273 49 Democratic People's Republic of Korea
7 8 4 4 3 4 15 20 2 3 1765 138 399 95 Democratic Republic of the Congo
11 9 2 0 29 28 18 19 7 7 411 170 92 18 Denmark
011010011001101001100110100110011010011001101001100110100110011010011010010110010111101010100101010100101100101111010101001010101001010010011010011001001101001100100110100110010011010011001001101001001010101001010101001010101001010101001010101001010101001010101001010101001010101001010101001010101001010101001010101001010101001101001100110100110011010011001101001100110100110011010011001101001101100010101100010101100010101100010101100010101100010101100010101011010011001101001100110100110011010011001101001100110100110011010010100101010010101011000100110100101010010101011000100110100101010010101010110001001101001101001011010100110001001101001101001011010100110001001100101111010010101001010010111101001010100101001011110100101010010100101011010011001101001100110100110011010011001101001100110100110011010010010100110100010100110100010100110100010100110100010100110100010100101101001100110100110011010011001101001100110100110011010011001101001111010010101001010111010010111101001010100101011101001011110100101010010101011010011001101001100110100110011010011001101001100110100110011010011001011110101010010110010111101010100101100101111010101001011001010110100110011010011001101001100110100110011010011001101001100110100101001011010000100101101000010010110100001001011010000100101101000010010101101001100110100110011010011001101001100110100110011010011001101001
0101011000100110100110100101101010101100010011010011010010110101010101101001100110100110011010011001101001100110100110011010011001101001101001011001011110101010010101010010110010111101010100101010100101001001101001100100110100110010011010011001001101001100100110100100101010100101010100101010100101010100101010100101010100101010100101010100101010100101010100101010100101010100101010100101010100110100110011010011001101001100110100110011010011001101001100110100110110001010110001010110001010110001010110001010110001010110001010101101001100110100110011010011001101001100110100110011010011001101001010010101001010101100010011010010101001010101100010011010010101001010101011000100110100110100101101010011000100110100110100101101010011000100110010111101001010100101001011110100101010010100101111010010101001010010101101001100110100110011010011001101001100110100110011010011001101001001010011010001010011010001010011010001010011010001010011010001010010110100110011010011001101001100110100110011010011001101001100110100111101001010100101011101001011110100101010010101110100101111010010101001010101101001100110100110011010011001101001100110100110011010011001101001100101111010101001011001011110101010010110010111101010100101100101
010010100110101010110010100101100101111010101001010100101010110001001

66
Member State Mortailty
MDG 5 MDG 6Maternal mortality ratio c (per 100 000 live births)
Cause-specific mortality rate (per 100 000 population)
HIV/AIDS d Malaria e Tuberculosis among HIV-negative people f
1990 2000 2010 2000 2009 2008 2000 2010
Afghanistan 1 300 1 000 460 … … 0.3 52 38
Albania 48 39 27 … … 0.0 0.8 0.4
Algeria 220 140 97 0.6 2.2 0.0 12 12
Andorra … … … … … 0.0 1.5 0.7
Angola 1 200 890 450 60 62 89 43 34
Antigua and Barbuda … … … … … 0.0 4.9 0.4
Argentina 71 63 77 7.2 7.1 0.0 2.3 1.9
Armenia 46 38 30 1.6 3.2 0.0 10 11
Australia 10 9 7 0.5 0.5 0.0 0.2 0.2
Austria 10 5 4 0.4 0.1 0.0 1.2 0.3
Azerbaijan 56 65 43 0.7 2.1 0.0 13 10
Bahamas 52 56 47 170 119 0.0 2.5 0.9
Bahrain 23 22 20 … … 0.1 2.8 0.9
Bangladesh 800 400 240 0.0 0.1 1.8 56 43
Barbados 120 49 51 8.3 13 0.1 0.4 0.2
Belarus 37 31 4 1.2 6.3 0.0 8.5 11
Belgium 10 9 8 0.6 0.3 0.0 0.8 0.5
Belize 71 100 53 80 91 0.0 4.3 4.9
Benin 770 530 350 40 30 105 14 16
Bhutan 1 000 430 180 0.4 3.7 0.2 29 9.2
Bolivia (Plurinational State of) 450 280 190 8.7 9.1 0.0 i 26 20
Bosnia and Herzegovina 18 10 8 … … 0.0 3.2 3.0
Botswana 140 350 160 750 296 1.0 53 21
Brazil 120 81 56 … … 0.1 4.7 2.6
Brunei Darussalam 29 24 24 … … 0.0 4.9 2.7
Bulgaria 24 28 11 0.7 2.5 0.0 4.2 4.2
Burkina Faso 700 450 300 130 45 221 12 8.1
Burundi 1 100 1 000 800 210 175 39 23 14
Cambodia 830 510 250 60 21 3.7 105 61
Cameroon 670 730 690 170 188 121 25 14
Canada 6 7 12 1.5 1.4 0.0 0.3 0.2
Cape Verde 200 170 79 … … 0.2 35 28
Central African Republic 930 1 000 890 380 248 192 34 34
Chad 920 1 100 1100 90 99 235 50 47
Chile 56 29 25 … … 0.0 2.0 1.6
China 120 61 37 … … 0.0 i 8.7 4.1
Colombia 170 130 92 30 31 0.3 3.7 2.8
Comoros 440 340 280 0.5 1.3 58 11 7.3
Congo 420 540 560 190 139 121 42 49
Cook Islands … … … … … 0.0 1.0 0.3
Costa Rica 38 47 40 0.3 5.0 0.0 1.8 1.1
Côte d'Ivoire 710 590 400 280 172 116 24 11
Croatia 8 11 17 0.1 0.2 0.0 3.9 2.3
Cuba 63 63 73 0.9 0.5 0.0 0.4 0.3
Cyprus 17 15 10 … … 0.0 0.2 0.3
Czech Republic 15 7 5 0.0 0.0 0.0 1.2 0.4
Democratic People's Republic of Korea 97 120 81 … … 0.0 81 23
Democratic Republic of the Congo 930 770 540 … … 193 66 54
Denmark 13 8 12 0.2 0.5 0.0 0.4 0.3
2. Cause-specific mortality and morbidity (contd.)

67
Tabl
e 2
Morbidity Member State
MDG 6Incidence rate
(per 100 000 population)Prevalence
(per 100 000 population)
HIV/AIDS d Malaria g Tuberculosis h HIV/AIDS d Tuberculosis h
2000 2009 2009 2000 2010 2000 2009 2000 2010
… … 1452 189 189 … … 431 352 Afghanistan
… … … 23 14 … … 28 16 Albania
… … 0.0 i 87 90 18 50 135 136 Algeria
… … … 19 7.4 … … 26 9.8 Andorra
122 119 20 689 250 304 962 1 089 417 411 Angola
… … … 4.6 4.9 … … 6.6 3.1 Antigua and Barbuda
19 19 0.7 40 27 205 283 55 40 Argentina
5.9 8.3 0.0 71 73 43 62 112 114 Armenia
… … … 6.1 6.3 62 94 7.7 8.0 Australia
… … … 16 5.0 56 183 21 5.8 Austria
… … 1.0 110 110 14 41 189 166 Azerbaijan
… … … 28 11 1 939 1 921 31 9.2 Bahamas
… … … 34 23 … … 46 25 Bahrain
0.2 0.9 620 225 225 0.6 3.9 479 411 Bangladesh
… … … 2.4 1.7 284 827 3.5 1.9 Barbados
13 16 … 74 70 48 172 94 98 Belarus
… … … 14 8.7 115 134 18 11 Belgium
195 127 98 40 40 1 317 1 554 46 41 Belize
73 55 27 461 85 94 733 674 132 149 Benin
… … 308 253 151 13 142 357 181 Bhutan
… … 177 184 135 141 122 281 209 Bolivia (Plurinational State of)
… … … 63 50 … … 78 60 Bosnia and Herzegovina
1640 721 233 918 503 15 072 16 354 705 380 Botswana
… … 202 60 43 … … 78 47 Brazil
… … … 100 68 … … 136 91 Brunei Darussalam
… … … 46 40 19 50 52 54 Bulgaria
89 43 31 822 69 55 1 293 699 102 82 Burkina Faso
… … 8 932 178 129 2 687 2 139 239 162 Burundi
49 11 2 589 492 437 741 425 923 660 Cambodia
332 295 26 842 168 177 2 882 3 107 224 185 Cameroon
… … … 6.4 4.7 152 200 7.9 5.6 Canada
… … 69 160 147 … … 318 269 Cape Verde
405 117 33 957 302 319 5 014 2 861 326 376 Central African Republic
… … 37 881 262 276 1 561 1 846 429 417 Chad
… … … 26 19 138 238 36 25 Chile
… … 2.0 109 78 … … 170 108 China
… … 387 43 34 533 342 63 48 Colombia
… … 22 005 56 37 13 32 107 68 Comoros
241 176 32 006 353 372 2 240 2 078 493 545 Congo
… … … 12 3.5 … … 15 5.5 Cook Islands
… … 14 23 13 84 215 32 18 Costa Rica
290 83 38 557 198 139 3 708 2 124 245 156 Côte d'Ivoire
… … … 41 21 11 20 52 27 Croatia
… … … 13 9.3 20 64 18 13 Cuba
… … … 4.3 4.4 … … 5.3 5.5 Cyprus
… … … 16 6.8 12 19 21 8.4 Czech Republic
… … 938 344 345 … … 706 399 Democratic People's Republic of Korea
… … 28 298 327 327 … … 596 535 Democratic Republic of the Congo
… … … 12 6.0 57 97 16 7.4 Denmark
011010011001101001100110100110011010011001101001100110100110011010011010010110010111101010100101010100101100101111010101001010101001010010011010011001001101001100100110100110010011010011001001101001001010101001010101001010101001010101001010101001010101001010101001010101001010101001010101001010101001010101001010101001010101001101001100110100110011010011001101001100110100110011010011001101001101100010101100010101100010101100010101100010101100010101100010101011010011001101001100110100110011010011001101001100110100110011010010100101010010101011000100110100101010010101011000100110100101010010101010110001001101001101001011010100110001001101001101001011010100110001001100101111010010101001010010111101001010100101001011110100101010010100101011010011001101001100110100110011010011001101001100110100110011010010010100110100010100110100010100110100010100110100010100110100010100101101001100110100110011010011001101001100110100110011010011001101001111010010101001010111010010111101001010100101011101001011110100101010010101011010011001101001100110100110011010011001101001100110100110011010011001011110101010010110010111101010100101100101111010101001011001010110100110011010011001101001100110100110011010011001101001100110100101001011010000100101101000010010110100001001011010000100101101000010010101101001100110100110011010011001101001100110100110011010011001101001
0101011000100110100110100101101010101100010011010011010010110101010101101001100110100110011010011001101001100110100110011010011001101001101001011001011110101010010101010010110010111101010100101010100101001001101001100100110100110010011010011001001101001100100110100100101010100101010100101010100101010100101010100101010100101010100101010100101010100101010100101010100101010100101010100101010100110100110011010011001101001100110100110011010011001101001100110100110110001010110001010110001010110001010110001010110001010110001010101101001100110100110011010011001101001100110100110011010011001101001010010101001010101100010011010010101001010101100010011010010101001010101011000100110100110100101101010011000100110100110100101101010011000100110010111101001010100101001011110100101010010100101111010010101001010010101101001100110100110011010011001101001100110100110011010011001101001001010011010001010011010001010011010001010011010001010011010001010010110100110011010011001101001100110100110011010011001101001100110100111101001010100101011101001011110100101010010101110100101111010010101001010101101001100110100110011010011001101001100110100110011010011001101001100101111010101001011001011110101010010110010111101010100101100101
010010100110101010110010100101100101111010101001010100101010110001001

68
Mortality
Member State Age-standardized mortality rates by cause a
(per 100 000 population)
Number of deaths among
children aged <5 years b
(000s)
Distribution of causes of death among children aged <5 years b (%)
Com
mun
icab
le
Non-
co
mm
unic
able
Inju
ries
HIV/AIDS Diarrhoea Measles Malaria Pneumonia Prematurity
2008 2000 2010 2000 2010 2000 2010 2000 2010 2000 2010 2000 2010 2000 2010
Djibouti 470 809 80 2 2 5 4 13 11 10 1 1 1 20 20 14 16
Dominica 78 632 33 0 0 0 0 0 0 0 0 0 0 4 3 47 10
Dominican Republic 147 573 68 8 6 5 2 6 4 0 0 0 0 15 11 22 25
Ecuador 105 400 81 10 6 1 1 9 4 0 0 1 0 14 10 19 16
Egypt 76 749 34 83 41 0 0 11 7 2 0 0 0 13 11 22 30
El Salvador 127 523 121 5 2 2 4 9 5 0 0 0 0 18 11 14 15
Equatorial Guinea 720 854 117 3 3 2 8 11 7 9 0 23 21 14 14 11 13
Eritrea 303 670 92 12 11 3 2 12 11 11 2 1 1 21 19 12 14
Estonia 21 585 84 0 0 0 2 4 0 0 0 0 0 10 3 6 5
Ethiopia 721 903 139 371 271 3 2 18 14 4 4 2 2 23 21 12 15
Fiji 166 752 35 0 0 0 0 6 4 4 0 0 0 10 10 21 20
Finland 11 377 58 0 0 0 0 0 0 0 0 0 0 1 4 15 17
France 23 336 38 4 3 0 0 1 1 0 0 0 0 1 2 13 12
Gabon 545 660 82 3 3 11 8 7 7 8 3 16 15 12 11 14 16
Gambia 525 735 72 7 6 1 3 12 9 5 0 22 20 15 15 12 14
Georgia 72 670 46 2 1 0 0 2 1 0 0 0 0 10 11 27 24
Germany 21 394 25 5 3 0 0 0 0 0 0 0 0 2 2 25 26
Ghana 608 711 91 62 57 4 3 8 7 12 1 19 18 12 13 13 16
Greece 25 388 29 1 1 0 0 0 0 0 0 0 0 2 7 37 34
Grenada 86 580 43 0 0 0 0 0 0 0 0 0 0 5 0 27 6
Guatemala 225 471 130 19 14 1 2 11 7 0 0 0 0 19 15 19 22
Guinea 759 932 121 59 48 2 1 11 10 13 0 22 27 15 16 10 12
Guinea-Bissau 928 916 110 9 8 2 3 13 12 10 0 21 18 17 18 10 11
Guyana 194 677 114 1 0 5 1 80 3 0 0 3 7 0 4 0 25
Haiti 545 697 52 29 45 5 1 16 7 0 0 1 0 23 10 13 7
Honduras 152 729 61 7 5 3 2 6 5 0 0 0 0 13 11 18 22
Hungary 16 648 51 1 1 0 0 0 0 0 0 0 0 6 4 35 28
Iceland 18 332 33 0 0 0 0 0 0 0 0 0 0 0 0 32 41
India 363 685 99 2294 1696 0 0 14 13 3 3 0 0 24 24 18 20
Indonesia 244 647 70 240 151 0 0 8 5 9 5 1 2 15 14 22 25
Iran (Islamic Republic of) 82 599 90 56 34 0 0 8 4 0 0 0 0 16 13 24 28
Iraq 168 691 280 37 43 0 0 8 6 1 0 0 0 17 18 20 20
Ireland 29 385 33 0 0 0 0 0 0 1 0 0 0 3 1 25 18
Israel 31 337 24 1 1 0 0 1 0 0 0 0 0 1 2 24 21
Italy 16 342 25 3 2 0 0 0 0 0 0 0 0 2 1 33 23
Jamaica 159 518 87 2 1 6 3 7 4 0 0 0 0 14 13 17 16
Japan 40 273 36 5 3 0 0 1 2 0 0 0 0 7 6 8 8
Jordan 84 727 62 4 4 0 0 8 4 0 0 0 0 11 8 33 34
Kazakhstan 95 985 155 9 13 0 0 7 6 0 0 0 0 14 13 26 22
Kenya 624 681 116 127 122 16 7 12 9 3 0 3 3 16 17 12 15
Kiribati 263 703 23 0 0 0 0 11 9 0 0 0 0 24 20 17 23
Kuwait 53 399 28 0 1 0 0 1 1 0 0 0 0 6 6 25 27
Kyrgyzstan 112 913 86 6 5 0 0 9 6 0 0 0 0 18 14 19 20
Lao People's Democratic Republic 376 771 107 14 8 0 1 13 10 13 0 2 1 19 19 14 21
Latvia 30 666 87 0 0 0 0 0 0 0 0 0 0 5 9 7 5
Lebanon 47 597 61 2 2 1 1 6 4 0 0 0 0 11 8 27 29
Lesotho 1255 774 141 8 5 38 18 7 7 0 1 0 0 10 12 13 18
Liberia 782 766 63 19 15 3 2 11 9 15 10 22 18 14 14 9 12
Libya 69 655 60 3 2 0 0 2 1 0 0 0 0 4 3 26 27
2. Cause-specific mortality and morbidity

69
Tabl
e 2
Mortailty
Distribution of causes of death among children aged <5 years b (%)
Age-standardized adult mortality rate by cause a
(ages 30-70 per 100 000 population)
Member State
All c
ause
s
Canc
er
Card
iova
scul
ar
diea
se a
nd
diab
etes
Chro
nic
resp
irato
ry
cond
ition
s
Birth asphyxia Neonatal sepsisCongenital anomalies Other diseases Injuries
2000 2010 2000 2010 2000 2010 2000 2010 2000 2010 2008
10 10 4 1 7 8 13 23 3 4 1289 126 406 43 Djibouti
11 48 0 14 22 7 14 18 3 0 596 161 221 30 Dominica
13 13 4 5 15 18 16 15 4 5 708 126 270 27 Dominican Republic
7 13 6 5 16 25 14 19 12 9 515 125 142 10 Ecuador
9 11 3 2 12 21 27 15 1 3 805 130 303 20 Egypt
5 6 5 5 17 24 18 20 13 11 796 138 168 21 El Salvador
8 9 6 5 3 5 12 16 2 2 1466 120 443 108 Equatorial Guinea
9 10 5 5 4 6 18 22 5 8 952 119 306 73 Eritrea
4 19 9 8 25 24 22 20 19 19 718 181 269 13 Estonia
9 10 6 6 3 4 16 18 4 6 1863 132 473 115 Ethiopia
8 8 4 3 21 24 13 18 13 12 957 150 476 58 Fiji
9 9 2 2 41 36 26 28 6 3 395 113 112 8 Finland
11 12 3 4 28 26 31 38 11 7 360 169 65 8 France
10 10 4 5 6 8 10 13 2 3 1251 117 325 80 Gabon
9 10 4 4 5 6 13 15 3 4 1618 183 500 118 Gambia
12 11 9 7 15 21 15 17 8 7 750 143 450 8 Georgia
5 6 1 2 33 31 24 26 9 6 362 150 102 11 Germany
10 11 6 6 4 7 11 14 2 4 1452 151 359 93 Ghana
6 2 1 0 38 39 9 9 6 8 325 137 109 11 Greece
0 6 5 12 33 44 22 32 8 0 826 211 314 26 Grenada
14 14 7 7 6 9 17 17 7 8 815 146 170 14 Guatemala
7 9 4 5 4 4 11 14 2 3 1906 177 542 137 Guinea
7 8 3 5 3 5 12 16 2 3 2007 166 522 128 Guinea-Bissau
0 16 0 9 0 9 12 23 0 2 1417 133 683 23 Guyana
9 4 5 2 7 3 17 8 5 56 1190 89 342 25 Haiti
9 8 6 7 11 18 31 24 1 3 844 166 261 22 Honduras
5 5 0 3 23 28 23 28 7 4 753 262 252 29 Hungary
0 0 0 0 35 22 34 37 0 0 269 121 65 7 Iceland
10 11 8 8 5 7 13 11 3 3 1002 108 328 133 India
11 11 7 5 6 9 17 19 5 6 876 165 308 64 Indonesia
11 11 4 4 12 18 18 16 6 6 600 111 271 23 Iran (Islamic Republic of)
15 15 6 5 11 14 16 18 6 6 1162 134 359 35 Iraq
5 5 1 2 43 42 19 25 3 7 339 150 84 12 Ireland
4 4 2 2 25 38 35 29 7 4 289 125 72 12 Israel
9 8 2 2 33 28 17 32 4 4 273 132 66 6 Italy
5 5 5 4 17 21 17 20 11 12 680 155 184 26 Jamaica
5 4 2 2 39 40 26 27 13 10 281 119 68 6 Japan
12 12 4 3 18 21 8 11 6 7 783 153 418 24 Jordan
11 10 4 3 12 14 21 24 5 7 1394 221 650 41 Kazakhstan
9 11 7 7 3 6 15 20 4 5 1495 178 276 69 Kenya
11 11 1 3 7 8 23 20 6 8 952 68 394 47 Kiribati
6 7 1 1 40 43 11 5 10 10 466 81 272 10 Kuwait
10 10 4 4 9 13 26 26 6 7 1307 197 607 63 Kyrgyzstan
9 11 6 6 4 5 15 17 5 8 1221 173 394 99 Lao People's Democratic Republic
15 17 2 4 34 35 25 22 13 7 840 202 359 12 Latvia
11 11 4 3 18 21 14 17 8 7 614 183 224 22 Lebanon
9 11 9 9 2 4 10 15 2 4 2748 109 443 108 Lesotho
7 9 4 6 3 5 11 13 2 3 1760 149 378 89 Liberia
10 9 5 3 15 19 9 10 29 29 718 140 320 27 Libya
011010011001101001100110100110011010011001101001100110100110011010011010010110010111101010100101010100101100101111010101001010101001010010011010011001001101001100100110100110010011010011001001101001001010101001010101001010101001010101001010101001010101001010101001010101001010101001010101001010101001010101001010101001010101001101001100110100110011010011001101001100110100110011010011001101001101100010101100010101100010101100010101100010101100010101100010101011010011001101001100110100110011010011001101001100110100110011010010100101010010101011000100110100101010010101011000100110100101010010101010110001001101001101001011010100110001001101001101001011010100110001001100101111010010101001010010111101001010100101001011110100101010010100101011010011001101001100110100110011010011001101001100110100110011010010010100110100010100110100010100110100010100110100010100110100010100101101001100110100110011010011001101001100110100110011010011001101001111010010101001010111010010111101001010100101011101001011110100101010010101011010011001101001100110100110011010011001101001100110100110011010011001011110101010010110010111101010100101100101111010101001011001010110100110011010011001101001100110100110011010011001101001100110100101001011010000100101101000010010110100001001011010000100101101000010010101101001100110100110011010011001101001100110100110011010011001101001
0101011000100110100110100101101010101100010011010011010010110101010101101001100110100110011010011001101001100110100110011010011001101001101001011001011110101010010101010010110010111101010100101010100101001001101001100100110100110010011010011001001101001100100110100100101010100101010100101010100101010100101010100101010100101010100101010100101010100101010100101010100101010100101010100101010100110100110011010011001101001100110100110011010011001101001100110100110110001010110001010110001010110001010110001010110001010110001010101101001100110100110011010011001101001100110100110011010011001101001010010101001010101100010011010010101001010101100010011010010101001010101011000100110100110100101101010011000100110100110100101101010011000100110010111101001010100101001011110100101010010100101111010010101001010010101101001100110100110011010011001101001100110100110011010011001101001001010011010001010011010001010011010001010011010001010011010001010010110100110011010011001101001100110100110011010011001101001100110100111101001010100101011101001011110100101010010101110100101111010010101001010101101001100110100110011010011001101001100110100110011010011001101001100101111010101001011001011110101010010110010111101010100101100101
010010100110101010110010100101100101111010101001010100101010110001001

70
Member State Mortailty
MDG 5 MDG 6Maternal mortality ratio c (per 100 000 live births)
Cause-specific mortality rate (per 100 000 population)
HIV/AIDS d Malaria e Tuberculosis among HIV-negative people f
1990 2000 2010 2000 2009 2008 2000 2010
Djibouti 290 290 200 100 118 1.2 45 71
Dominica … … … … … 0.0 4.9 3.4
Dominican Republic 220 130 150 40 22 0.1 13 8.2
Ecuador 180 130 110 20 16 0.0 i 13 6.7
Egypt 230 100 66 0.2 0.6 0.2 1.7 0.8
El Salvador 150 110 81 8.4 23 0.0 2.6 0.9
Equatorial Guinea 1 200 450 240 30 141 98 6.8 5.5
Eritrea 880 390 240 40 33 0.7 4.7 12
Estonia 48 28 2 5.8 33 0.0 8.1 2.9
Ethiopia 950 700 350 … … 10 40 35
Fiji 32 31 26 0.7 2.1 0.0 3.2 3.6
Finland 7 5 5 0.2 0.1 0.0 i 1.6 0.7
France 13 10 8 3.0 2.8 0.0 i 1.2 0.7
Gabon 270 270 230 150 164 31 22 70
Gambia 700 520 360 10 43 93 36 49
Georgia 63 58 67 1.1 1.6 0.0 6.4 4.6
Germany 13 7 7 0.7 0.7 0.0 i 0.6 0.3
Ghana 580 550 350 70 74 48 25 8.7
Greece 6 5 3 2.8 1.8 0.0 i 0.8 0.7
Grenada 34 27 24 … … 0.0 1.3 0.3
Guatemala 160 130 120 10 18 0.1 5.0 3.9
Guinea 1 200 970 610 70 46 165 33 59
Guinea-Bissau 1 100 970 790 50 73 203 28 27
Guyana 180 220 280 120 26 5.0 22 13
Haiti 620 460 350 130 71 5.7 41 29
Honduras 220 160 100 60 33 0.1 13 5.2
Hungary 23 10 21 2.3 1.3 0.0 3.5 1.3
Iceland 8 7 5 0.4 0.6 0.0 0.4 0.4
India 600 390 200 10 14 1.9 a 38 26
Indonesia 600 340 220 0.0 3.6 3.2 50 27
Iran (Islamic Republic of) 120 48 21 2.5 8.6 0.0 i 5.2 1.8
Iraq 89 78 63 … … 0.0 9.0 12
Ireland 6 6 6 0.5 0.3 0.0 1.0 0.5
Israel 12 9 7 0.3 0.3 0.0 0.6 0.2
Italy 10 4 4 3.4 1.3 0.0 i 0.8 0.4
Jamaica 59 83 110 100 44 0.0 i 0.6 0.6
Japan 12 10 5 0.1 0.0 0.0 i 2.3 1.5
Jordan 110 79 63 … … 0.0 0.8 0.7
Kazakhstan 92 70 51 0.1 2.5 0.0 i 36 23
Kenya 400 490 360 380 201 12 18 17
Kiribati … … … … … 2.6 46 47
Kuwait 11 9 14 … … 0.0 i 0.8 1.2
Kyrgyzstan 73 82 71 0.3 4.4 0.0 17 26
Lao People's Democratic Republic 1 600 870 470 0.2 2.0 2.9 16 11
Latvia 57 43 34 5.5 23 0.0 13 3.3
Lebanon 52 38 25 4.8 7.0 0.0 1.1 2.1
Lesotho 520 690 620 660 680 0.1 16 13
Liberia 1 200 1 300 770 130 91 98 58 48
Libya 99 67 58 … … 0.0 5.2 4.0
2. Cause-specific mortality and morbidity (contd.)

71
Tabl
e 2
Morbidity Member State
MDG 6Incidence rate
(per 100 000 population)Prevalence
(per 100 000 population)
HIV/AIDS d Malaria g Tuberculosis h HIV/AIDS d Tuberculosis h
2000 2009 2009 2000 2010 2000 2009 2000 2010
181 152 3 588 619 620 1 614 1 604 708 839 Djibouti
… … … 14 13 … … 28 20 Dominica
55 36 42 100 67 602 568 137 90 Dominican Republic
… … 51 107 65 296 275 170 103 Ecuador
… … … 26 18 3.9 13 41 28 Egypt
… … 0.4 37 28 389 549 53 31 El Salvador
… … 28 183 100 135 838 2 945 117 121 Equatorial Guinea
70 27 588 85 100 682 490 120 128 Eritrea
… … … 64 25 266 736 82 26 Estonia
… … 2 996 235 261 … … 403 394 Ethiopia
… … … 28 27 20 67 39 40 Fiji
… … … 12 6.7 28 49 15 8.5 Finland
… … … 13 9.3 193 246 17 12 France
364 243 19 021 248 553 2 721 3 118 270 676 Gabon
… … 28 226 225 273 271 1 047 367 460 Gambia
3.9 14 0.2 107 107 23 81 137 118 Georgia
… … … 13 4.8 58 81 17 5.9 Germany
125 93 26 355 152 86 1 257 1 099 231 106 Ghana
… … … 7.6 4.6 73 79 9.8 5.7 Greece
… … … 4.4 4.1 … … 7.4 4.1 Grenada
… … 210 68 62 247 445 124 111 Guatemala
91 62 39 710 200 334 933 789 304 525 Guinea
179 128 34 447 192 233 975 1 346 284 303 Guinea-Bissau
… … 3 787 104 111 1 109 771 131 115 Guyana
116 88 2 580 271 230 1 578 1 226 388 314 Haiti
… … 368 116 51 726 520 155 65 Honduras
… … … 35 15 28 30 43 19 Hungary
… … … 4.4 5.0 110 172 5.0 5.2 Iceland
28 11 1 862 216 185 231 200 466 256 India
… … 1 375 189 189 2.8 133 418 289 Indonesia
… … 7.2 32 17 65 125 52 23 Iran (Islamic Republic of)
… … 0.0 64 64 … … 99 117 Iraq
… … … 12 8.1 109 152 15 9.7 Ireland
… … … 9.4 4.9 79 105 11 5.6 Israel
… … … 8.9 4.9 222 240 12 6.0 Italy
109 79 … 6.5 6.6 1 250 1 161 7.4 7.6 Jamaica
… … … 36 21 5.0 6.4 46 27 Japan
… … … 8.4 5.4 … … 11 8.0 Jordan
3.4 12 … 196 151 6.4 84 250 198 Kazakhstan
328 286 5 853 286 298 4 831 3 664 260 283 Kenya
… … … 372 370 … … 541 550 Kiribati
… … … 30 41 … … 39 51 Kuwait
3.8 47 0.1 151 159 12 178 195 243 Kyrgyzstan
… … 807 85 90 11 135 152 130 Lao People's Democratic Republic
37 31 … 92 39 167 385 113 43 Latvia
… … … 17 17 96 84 19 24 Lebanon
1390 1125 … 553 633 12 492 13 914 362 402 Lesotho
… … 29 414 242 293 1 827 937 487 476 Liberia
… … … 40 40 … … 59 53 Libya
011010011001101001100110100110011010011001101001100110100110011010011010010110010111101010100101010100101100101111010101001010101001010010011010011001001101001100100110100110010011010011001001101001001010101001010101001010101001010101001010101001010101001010101001010101001010101001010101001010101001010101001010101001010101001101001100110100110011010011001101001100110100110011010011001101001101100010101100010101100010101100010101100010101100010101100010101011010011001101001100110100110011010011001101001100110100110011010010100101010010101011000100110100101010010101011000100110100101010010101010110001001101001101001011010100110001001101001101001011010100110001001100101111010010101001010010111101001010100101001011110100101010010100101011010011001101001100110100110011010011001101001100110100110011010010010100110100010100110100010100110100010100110100010100110100010100101101001100110100110011010011001101001100110100110011010011001101001111010010101001010111010010111101001010100101011101001011110100101010010101011010011001101001100110100110011010011001101001100110100110011010011001011110101010010110010111101010100101100101111010101001011001010110100110011010011001101001100110100110011010011001101001100110100101001011010000100101101000010010110100001001011010000100101101000010010101101001100110100110011010011001101001100110100110011010011001101001
0101011000100110100110100101101010101100010011010011010010110101010101101001100110100110011010011001101001100110100110011010011001101001101001011001011110101010010101010010110010111101010100101010100101001001101001100100110100110010011010011001001101001100100110100100101010100101010100101010100101010100101010100101010100101010100101010100101010100101010100101010100101010100101010100101010100110100110011010011001101001100110100110011010011001101001100110100110110001010110001010110001010110001010110001010110001010110001010101101001100110100110011010011001101001100110100110011010011001101001010010101001010101100010011010010101001010101100010011010010101001010101011000100110100110100101101010011000100110100110100101101010011000100110010111101001010100101001011110100101010010100101111010010101001010010101101001100110100110011010011001101001100110100110011010011001101001001010011010001010011010001010011010001010011010001010011010001010010110100110011010011001101001100110100110011010011001101001100110100111101001010100101011101001011110100101010010101110100101111010010101001010101101001100110100110011010011001101001100110100110011010011001101001100101111010101001011001011110101010010110010111101010100101100101
010010100110101010110010100101100101111010101001010100101010110001001

72
Mortality
Member State Age-standardized mortality rates by cause a
(per 100 000 population)
Number of deaths among
children aged <5 years b
(000s)
Distribution of causes of death among children aged <5 years b (%)
Com
mun
icab
le
Non-
co
mm
unic
able
Inju
ries
HIV/AIDS Diarrhoea Measles Malaria Pneumonia Prematurity
2008 2000 2010 2000 2010 2000 2010 2000 2010 2000 2010 2000 2010 2000 2010
Lithuania 34 637 120 0 0 0 0 0 1 0 0 0 0 9 9 12 9
Luxembourg 25 362 37 0 0 0 0 0 0 0 0 0 0 0 0 14 19
Madagascar 408 706 55 62 44 0 0 13 10 8 1 7 6 20 18 13 16
Malawi 1156 999 189 77 56 16 13 11 7 0 2 18 13 15 14 9 13
Malaysia 185 526 51 6 3 0 0 4 2 0 0 0 0 9 6 23 24
Maldives 59 598 53 0 0 0 0 8 3 0 0 0 0 20 11 15 17
Mali 827 733 72 110 120 1 0 15 14 4 3 23 16 19 20 10 11
Malta 26 391 23 0 0 0 0 0 0 0 0 0 0 3 0 39 17
Marshall Islands 343 1289 66 0 0 0 0 9 6 1 0 0 0 20 19 19 20
Mauritania 575 746 88 11 13 0 0 15 11 1 7 7 6 22 17 14 14
Mauritius 52 664 42 0 0 0 1 2 0 0 0 0 0 2 9 43 27
Mexico 68 493 57 63 37 0 0 8 4 0 0 0 0 15 12 16 17
Micronesia (Federated States of) 203 704 35 0 0 0 0 8 6 1 1 0 0 21 20 18 19
Monaco 22 320 42 0 0 0 0 0 0 0 0 0 0 4 4 25 25
Mongolia 89 713 78 3 2 0 0 12 7 1 1 0 0 20 15 16 18
Montenegro 17 640 33 0 0 0 0 0 0 0 0 0 0 4 0 28 45
Morocco 104 597 37 35 23 0 0 10 6 0 0 0 0 18 15 24 28
Mozambique 957 908 153 133 114 7 10 11 9 4 1 23 19 16 15 9 11
Myanmar 461 667 347 83 56 1 1 12 8 2 1 1 1 18 17 20 24
Namibia 670 791 160 4 2 32 14 6 5 1 4 3 0 11 12 14 19
Nauru 240 1092 149 0 0 0 0 8 7 0 0 0 0 20 17 20 24
Nepal 338 620 58 67 35 0 0 11 6 2 0 0 0 19 16 26 32
Netherlands 28 377 22 1 1 0 0 0 0 0 0 0 0 2 3 19 17
New Zealand 15 369 37 0 0 0 0 0 0 0 0 0 0 6 8 20 20
Nicaragua 87 499 57 6 4 0 0 13 9 0 0 0 0 14 14 19 19
Niger 730 647 44 114 100 1 1 16 14 5 0 22 15 19 22 10 12
Nigeria 832 809 76 916 861 4 4 11 11 17 1 19 20 13 17 9 12
Niue 142 558 43 0 0 0 … 1 … 0 … 0 … 8 … 13 …
Norway 27 363 36 0 0 0 0 0 0 0 0 0 0 3 1 12 15
Oman 22 648 39 1 1 0 0 2 1 0 0 0 0 9 5 29 29
Pakistan 387 711 92 466 423 0 0 14 11 1 1 0 0 22 19 17 20
Palau 144 587 33 0 0 0 0 1 2 1 3 0 0 7 6 18 20
Panama 92 394 59 2 1 1 0 6 11 0 0 0 0 11 9 14 14
Papua New Guinea 373 748 87 14 12 1 2 9 8 9 0 11 10 17 17 16 18
Paraguay 93 470 60 5 4 1 0 8 5 0 0 0 0 14 11 24 25
Peru 173 387 52 25 11 1 1 5 4 0 0 0 0 11 10 18 20
Philippines 231 599 55 91 66 0 0 10 6 0 0 0 0 17 16 20 23
Poland 28 546 54 4 3 0 0 0 0 0 0 0 0 5 5 24 33
Portugal 46 394 28 1 0 0 0 0 0 0 0 0 0 4 1 22 17
Qatar 31 392 36 0 0 0 0 1 0 0 1 0 0 4 2 39 39
Republic of Korea 29 355 52 3 3 0 0 1 0 1 0 0 0 5 2 21 24
Republic of Moldova 59 831 90 1 1 0 0 3 0 0 0 0 0 29 21 4 7
Romania 38 643 52 7 3 0 0 3 0 0 0 0 0 35 29 8 14
Russian Federation 71 797 159 33 20 1 9 3 1 0 0 0 0 16 8 19 21
Rwanda 595 740 92 62 26 4 2 20 12 1 0 3 2 23 20 9 15
Saint Kitts and Nevis 61 640 73 0 0 0 0 5 0 0 0 0 0 5 0 43 21
Saint Lucia 81 517 53 0 0 0 0 0 3 0 0 0 0 0 0 36 44
Saint Vincent and the Grenadines 115 596 58 0 0 6 0 0 0 0 0 0 0 4 2 20 31
Samoa 194 683 35 0 0 0 0 5 3 0 0 0 0 11 8 18 17
2. Cause-specific mortality and morbidity

73
Tabl
e 2
Mortailty
Distribution of causes of death among children aged <5 years b (%)
Age-standardized adult mortality rate by cause a
(ages 30-70 per 100 000 population)
Member State
All c
ause
s
Canc
er
Card
iova
scul
ar
diea
se a
nd
diab
etes
Chro
nic
resp
irato
ry
cond
ition
s
Birth asphyxia Neonatal sepsisCongenital anomalies Other diseases Injuries
2000 2010 2000 2010 2000 2010 2000 2010 2000 2010 2008
8 7 2 8 37 30 15 19 16 16 908 204 312 14 Lithuania
21 10 0 5 7 5 42 33 15 28 362 138 98 16 Luxembourg
9 11 6 6 3 5 17 18 4 7 1058 154 289 69 Madagascar
7 9 4 5 2 4 14 16 2 4 3147 163 634 125 Malawi
8 8 6 5 27 31 17 20 5 4 663 141 217 36 Malaysia
15 15 4 4 16 30 18 14 3 6 499 59 229 74 Maldives
6 7 3 3 4 5 13 17 2 3 1262 171 292 71 Mali
3 0 5 0 16 48 35 35 0 0 300 123 100 11 Malta
12 13 1 1 9 10 22 21 7 9 2681 166 1427 195 Marshall Islands
10 10 5 6 5 6 17 18 4 4 1265 147 362 85 Mauritania
10 9 4 2 20 26 12 20 6 7 774 110 440 29 Mauritius
7 6 5 6 19 23 20 22 9 9 570 94 217 20 Mexico
11 11 1 1 11 11 23 23 7 7 800 110 389 51 Micronesia (Federated States of)
8 7 2 2 32 32 22 23 6 7 316 132 68 8 Monaco
7 8 3 3 8 13 26 25 6 9 995 284 401 22 Mongolia
26 39 1 2 14 2 24 12 3 0 575 170 296 21 Montenegro
12 13 6 3 9 12 16 16 5 6 535 127 214 23 Morocco
7 9 4 4 3 3 12 14 2 3 2167 143 498 125 Mozambique
10 10 8 7 4 5 19 20 5 5 1320 162 321 65 Myanmar
10 11 5 5 5 9 11 16 3 6 1889 73 524 84 Namibia
14 14 1 1 16 16 14 15 7 7 1633 231 867 100 Nauru
10 12 7 8 3 5 16 15 5 5 897 178 279 57 Nepal
11 10 3 5 33 33 27 28 5 4 323 165 77 12 Netherlands
6 6 2 3 28 24 26 21 12 17 312 137 91 14 New Zealand
7 7 7 6 11 18 28 23 2 4 680 124 230 21 Nicaragua
5 7 3 3 3 3 14 19 3 4 1057 129 246 57 Niger
7 8 5 6 3 4 9 14 2 3 1632 148 377 90 Nigeria
19 … 6 … 18 … 14 … 21 … 629 93 297 41 Niue
10 13 1 3 37 33 29 31 6 3 315 138 74 15 Norway
10 9 4 3 22 28 12 17 12 8 766 118 504 19 Oman
12 13 9 9 4 5 15 18 4 5 998 152 361 86 Pakistan
8 10 5 5 17 16 16 18 27 20 825 131 387 50 Palau
6 5 4 7 26 24 27 23 4 6 457 109 138 15 Panama
12 12 5 6 4 5 13 16 4 6 1090 168 390 80 Papua New Guinea
8 9 7 8 13 19 21 18 4 5 569 135 215 12 Paraguay
6 6 7 6 11 20 35 23 5 10 478 130 86 15 Peru
13 13 7 6 9 10 17 17 7 8 911 134 362 51 Philippines
9 6 6 3 36 34 15 13 6 5 632 219 219 14 Poland
15 6 4 4 20 21 24 42 11 8 381 161 87 11 Portugal
11 11 2 2 24 25 12 15 6 5 292 93 109 8 Qatar
6 6 6 5 23 19 19 30 18 13 348 133 85 8 Republic of Korea
8 8 4 3 22 29 14 18 16 13 1064 204 401 29 Republic of Moldova
4 4 0 0 19 25 21 20 10 7 700 202 280 17 Romania
7 7 4 4 22 25 19 18 10 7 1172 180 517 21 Russian Federation
6 10 6 6 4 5 20 23 4 6 1174 158 290 68 Rwanda
17 31 9 10 18 10 5 22 0 6 552 154 217 6 Saint Kitts and Nevis
12 38 7 0 25 12 16 3 5 0 628 141 267 23 Saint Lucia
7 4 3 13 12 2 41 28 6 21 705 141 245 21 Saint Vincent and the Grenadines
7 9 4 4 22 24 15 25 18 10 771 77 381 51 Samoa
011010011001101001100110100110011010011001101001100110100110011010011010010110010111101010100101010100101100101111010101001010101001010010011010011001001101001100100110100110010011010011001001101001001010101001010101001010101001010101001010101001010101001010101001010101001010101001010101001010101001010101001010101001010101001101001100110100110011010011001101001100110100110011010011001101001101100010101100010101100010101100010101100010101100010101100010101011010011001101001100110100110011010011001101001100110100110011010010100101010010101011000100110100101010010101011000100110100101010010101010110001001101001101001011010100110001001101001101001011010100110001001100101111010010101001010010111101001010100101001011110100101010010100101011010011001101001100110100110011010011001101001100110100110011010010010100110100010100110100010100110100010100110100010100110100010100101101001100110100110011010011001101001100110100110011010011001101001111010010101001010111010010111101001010100101011101001011110100101010010101011010011001101001100110100110011010011001101001100110100110011010011001011110101010010110010111101010100101100101111010101001011001010110100110011010011001101001100110100110011010011001101001100110100101001011010000100101101000010010110100001001011010000100101101000010010101101001100110100110011010011001101001100110100110011010011001101001
0101011000100110100110100101101010101100010011010011010010110101010101101001100110100110011010011001101001100110100110011010011001101001101001011001011110101010010101010010110010111101010100101010100101001001101001100100110100110010011010011001001101001100100110100100101010100101010100101010100101010100101010100101010100101010100101010100101010100101010100101010100101010100101010100101010100110100110011010011001101001100110100110011010011001101001100110100110110001010110001010110001010110001010110001010110001010110001010101101001100110100110011010011001101001100110100110011010011001101001010010101001010101100010011010010101001010101100010011010010101001010101011000100110100110100101101010011000100110100110100101101010011000100110010111101001010100101001011110100101010010100101111010010101001010010101101001100110100110011010011001101001100110100110011010011001101001001010011010001010011010001010011010001010011010001010011010001010010110100110011010011001101001100110100110011010011001101001100110100111101001010100101011101001011110100101010010101110100101111010010101001010101101001100110100110011010011001101001100110100110011010011001101001100101111010101001011001011110101010010110010111101010100101100101
010010100110101010110010100101100101111010101001010100101010110001001
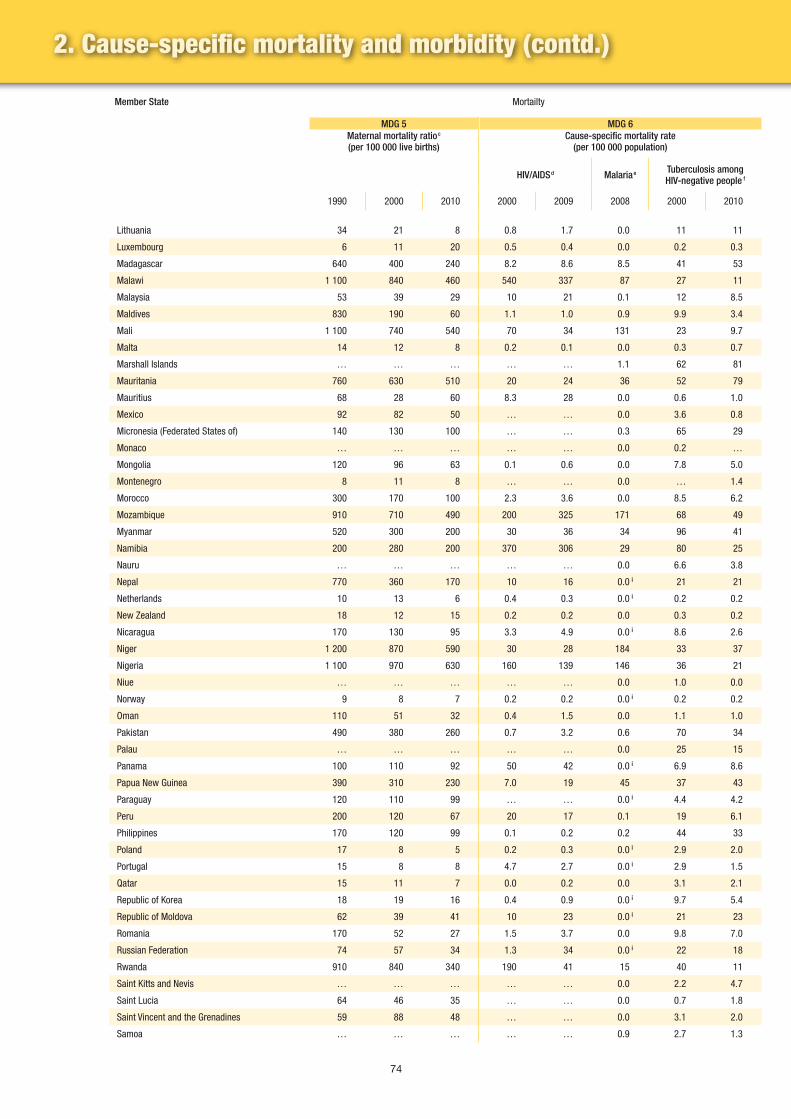
74
Member State Mortailty
MDG 5 MDG 6Maternal mortality ratio c (per 100 000 live births)
Cause-specific mortality rate (per 100 000 population)
HIV/AIDS d Malaria e Tuberculosis among HIV-negative people f
1990 2000 2010 2000 2009 2008 2000 2010
Lithuania 34 21 8 0.8 1.7 0.0 11 11
Luxembourg 6 11 20 0.5 0.4 0.0 0.2 0.3
Madagascar 640 400 240 8.2 8.6 8.5 41 53
Malawi 1 100 840 460 540 337 87 27 11
Malaysia 53 39 29 10 21 0.1 12 8.5
Maldives 830 190 60 1.1 1.0 0.9 9.9 3.4
Mali 1 100 740 540 70 34 131 23 9.7
Malta 14 12 8 0.2 0.1 0.0 0.3 0.7
Marshall Islands … … … … … 1.1 62 81
Mauritania 760 630 510 20 24 36 52 79
Mauritius 68 28 60 8.3 28 0.0 0.6 1.0
Mexico 92 82 50 … … 0.0 3.6 0.8
Micronesia (Federated States of) 140 130 100 … … 0.3 65 29
Monaco … … … … … 0.0 0.2 …
Mongolia 120 96 63 0.1 0.6 0.0 7.8 5.0
Montenegro 8 11 8 … … 0.0 … 1.4
Morocco 300 170 100 2.3 3.6 0.0 8.5 6.2
Mozambique 910 710 490 200 325 171 68 49
Myanmar 520 300 200 30 36 34 96 41
Namibia 200 280 200 370 306 29 80 25
Nauru … … … … … 0.0 6.6 3.8
Nepal 770 360 170 10 16 0.0 i 21 21
Netherlands 10 13 6 0.4 0.3 0.0 i 0.2 0.2
New Zealand 18 12 15 0.2 0.2 0.0 0.3 0.2
Nicaragua 170 130 95 3.3 4.9 0.0 i 8.6 2.6
Niger 1 200 870 590 30 28 184 33 37
Nigeria 1 100 970 630 160 139 146 36 21
Niue … … … … … 0.0 1.0 0.0
Norway 9 8 7 0.2 0.2 0.0 i 0.2 0.2
Oman 110 51 32 0.4 1.5 0.0 1.1 1.0
Pakistan 490 380 260 0.7 3.2 0.6 70 34
Palau … … … … … 0.0 25 15
Panama 100 110 92 50 42 0.0 i 6.9 8.6
Papua New Guinea 390 310 230 7.0 19 45 37 43
Paraguay 120 110 99 … … 0.0 i 4.4 4.2
Peru 200 120 67 20 17 0.1 19 6.1
Philippines 170 120 99 0.1 0.2 0.2 44 33
Poland 17 8 5 0.2 0.3 0.0 i 2.9 2.0
Portugal 15 8 8 4.7 2.7 0.0 i 2.9 1.5
Qatar 15 11 7 0.0 0.2 0.0 3.1 2.1
Republic of Korea 18 19 16 0.4 0.9 0.0 i 9.7 5.4
Republic of Moldova 62 39 41 10 23 0.0 i 21 23
Romania 170 52 27 1.5 3.7 0.0 9.8 7.0
Russian Federation 74 57 34 1.3 34 0.0 i 22 18
Rwanda 910 840 340 190 41 15 40 11
Saint Kitts and Nevis … … … … … 0.0 2.2 4.7
Saint Lucia 64 46 35 … … 0.0 0.7 1.8
Saint Vincent and the Grenadines 59 88 48 … … 0.0 3.1 2.0
Samoa … … … … … 0.9 2.7 1.3
2. Cause-specific mortality and morbidity (contd.)
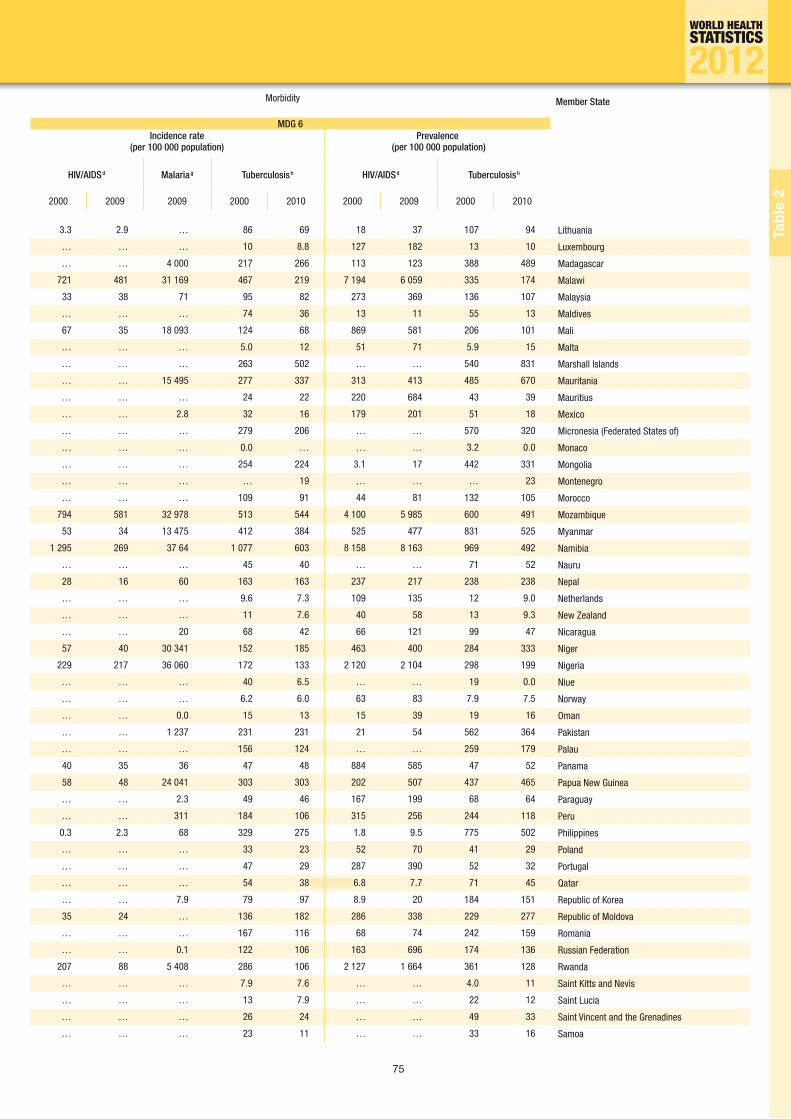
75
Tabl
e 2
Morbidity Member State
MDG 6Incidence rate
(per 100 000 population)Prevalence
(per 100 000 population)
HIV/AIDS d Malaria g Tuberculosis h HIV/AIDS d Tuberculosis h
2000 2009 2009 2000 2010 2000 2009 2000 2010
3.3 2.9 … 86 69 18 37 107 94 Lithuania
… … … 10 8.8 127 182 13 10 Luxembourg
… … 4 000 217 266 113 123 388 489 Madagascar
721 481 31 169 467 219 7 194 6 059 335 174 Malawi
33 38 71 95 82 273 369 136 107 Malaysia
… … … 74 36 13 11 55 13 Maldives
67 35 18 093 124 68 869 581 206 101 Mali
… … … 5.0 12 51 71 5.9 15 Malta
… … … 263 502 … … 540 831 Marshall Islands
… … 15 495 277 337 313 413 485 670 Mauritania
… … … 24 22 220 684 43 39 Mauritius
… … 2.8 32 16 179 201 51 18 Mexico
… … … 279 206 … … 570 320 Micronesia (Federated States of)
… … … 0.0 … … … 3.2 0.0 Monaco
… … … 254 224 3.1 17 442 331 Mongolia
… … … … 19 … … … 23 Montenegro
… … … 109 91 44 81 132 105 Morocco
794 581 32 978 513 544 4 100 5 985 600 491 Mozambique
53 34 13 475 412 384 525 477 831 525 Myanmar
1 295 269 37 64 1 077 603 8 158 8 163 969 492 Namibia
… … … 45 40 … … 71 52 Nauru
28 16 60 163 163 237 217 238 238 Nepal
… … … 9.6 7.3 109 135 12 9.0 Netherlands
… … … 11 7.6 40 58 13 9.3 New Zealand
… … 20 68 42 66 121 99 47 Nicaragua
57 40 30 341 152 185 463 400 284 333 Niger
229 217 36 060 172 133 2 120 2 104 298 199 Nigeria
… … … 40 6.5 … … 19 0.0 Niue
… … … 6.2 6.0 63 83 7.9 7.5 Norway
… … 0.0 15 13 15 39 19 16 Oman
… … 1 237 231 231 21 54 562 364 Pakistan
… … … 156 124 … … 259 179 Palau
40 35 36 47 48 884 585 47 52 Panama
58 48 24 041 303 303 202 507 437 465 Papua New Guinea
… … 2.3 49 46 167 199 68 64 Paraguay
… … 311 184 106 315 256 244 118 Peru
0.3 2.3 68 329 275 1.8 9.5 775 502 Philippines
… … … 33 23 52 70 41 29 Poland
… … … 47 29 287 390 52 32 Portugal
… … … 54 38 6.8 7.7 71 45 Qatar
… … 7.9 79 97 8.9 20 184 151 Republic of Korea
35 24 … 136 182 286 338 229 277 Republic of Moldova
… … … 167 116 68 74 242 159 Romania
… … 0.1 122 106 163 696 174 136 Russian Federation
207 88 5 408 286 106 2 127 1 664 361 128 Rwanda
… … … 7.9 7.6 … … 4.0 11 Saint Kitts and Nevis
… … … 13 7.9 … … 22 12 Saint Lucia
… … … 26 24 … … 49 33 Saint Vincent and the Grenadines
… … … 23 11 … … 33 16 Samoa
011010011001101001100110100110011010011001101001100110100110011010011010010110010111101010100101010100101100101111010101001010101001010010011010011001001101001100100110100110010011010011001001101001001010101001010101001010101001010101001010101001010101001010101001010101001010101001010101001010101001010101001010101001010101001101001100110100110011010011001101001100110100110011010011001101001101100010101100010101100010101100010101100010101100010101100010101011010011001101001100110100110011010011001101001100110100110011010010100101010010101011000100110100101010010101011000100110100101010010101010110001001101001101001011010100110001001101001101001011010100110001001100101111010010101001010010111101001010100101001011110100101010010100101011010011001101001100110100110011010011001101001100110100110011010010010100110100010100110100010100110100010100110100010100110100010100101101001100110100110011010011001101001100110100110011010011001101001111010010101001010111010010111101001010100101011101001011110100101010010101011010011001101001100110100110011010011001101001100110100110011010011001011110101010010110010111101010100101100101111010101001011001010110100110011010011001101001100110100110011010011001101001100110100101001011010000100101101000010010110100001001011010000100101101000010010101101001100110100110011010011001101001100110100110011010011001101001
0101011000100110100110100101101010101100010011010011010010110101010101101001100110100110011010011001101001100110100110011010011001101001101001011001011110101010010101010010110010111101010100101010100101001001101001100100110100110010011010011001001101001100100110100100101010100101010100101010100101010100101010100101010100101010100101010100101010100101010100101010100101010100101010100101010100110100110011010011001101001100110100110011010011001101001100110100110110001010110001010110001010110001010110001010110001010110001010101101001100110100110011010011001101001100110100110011010011001101001010010101001010101100010011010010101001010101100010011010010101001010101011000100110100110100101101010011000100110100110100101101010011000100110010111101001010100101001011110100101010010100101111010010101001010010101101001100110100110011010011001101001100110100110011010011001101001001010011010001010011010001010011010001010011010001010011010001010010110100110011010011001101001100110100110011010011001101001100110100111101001010100101011101001011110100101010010101110100101111010010101001010101101001100110100110011010011001101001100110100110011010011001101001100101111010101001011001011110101010010110010111101010100101100101
010010100110101010110010100101100101111010101001010100101010110001001
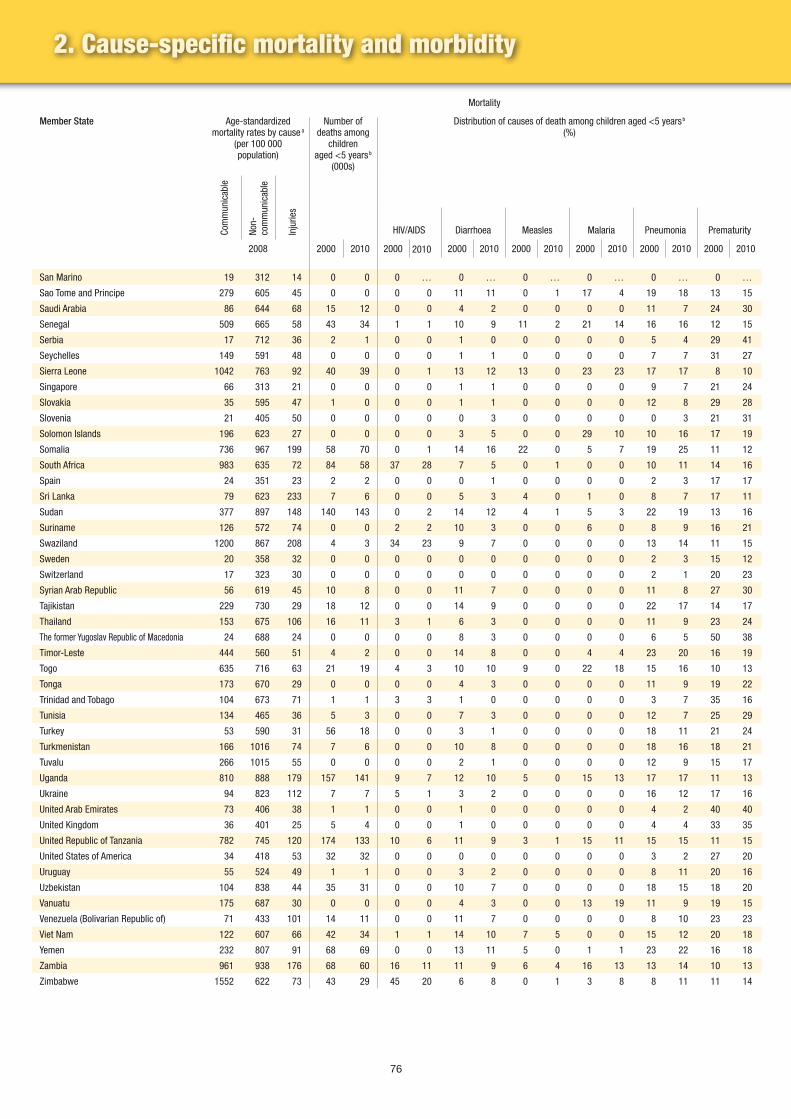
76
Mortality
Member State Age-standardized mortality rates by cause a
(per 100 000 population)
Number of deaths among
children aged <5 years b
(000s)
Distribution of causes of death among children aged <5 years b (%)
Com
mun
icab
le
Non-
co
mm
unic
able
Inju
ries
HIV/AIDS Diarrhoea Measles Malaria Pneumonia Prematurity
2008 2000 2010 2000 2010 2000 2010 2000 2010 2000 2010 2000 2010 2000 2010
San Marino 19 312 14 0 0 0 … 0 … 0 … 0 … 0 … 0 …
Sao Tome and Principe 279 605 45 0 0 0 0 11 11 0 1 17 4 19 18 13 15
Saudi Arabia 86 644 68 15 12 0 0 4 2 0 0 0 0 11 7 24 30
Senegal 509 665 58 43 34 1 1 10 9 11 2 21 14 16 16 12 15
Serbia 17 712 36 2 1 0 0 1 0 0 0 0 0 5 4 29 41
Seychelles 149 591 48 0 0 0 0 1 1 0 0 0 0 7 7 31 27
Sierra Leone 1042 763 92 40 39 0 1 13 12 13 0 23 23 17 17 8 10
Singapore 66 313 21 0 0 0 0 1 1 0 0 0 0 9 7 21 24
Slovakia 35 595 47 1 0 0 0 1 1 0 0 0 0 12 8 29 28
Slovenia 21 405 50 0 0 0 0 0 3 0 0 0 0 0 3 21 31
Solomon Islands 196 623 27 0 0 0 0 3 5 0 0 29 10 10 16 17 19
Somalia 736 967 199 58 70 0 1 14 16 22 0 5 7 19 25 11 12
South Africa 983 635 72 84 58 37 28 7 5 0 1 0 0 10 11 14 16
Spain 24 351 23 2 2 0 0 0 1 0 0 0 0 2 3 17 17
Sri Lanka 79 623 233 7 6 0 0 5 3 4 0 1 0 8 7 17 11
Sudan 377 897 148 140 143 0 2 14 12 4 1 5 3 22 19 13 16
Suriname 126 572 74 0 0 2 2 10 3 0 0 6 0 8 9 16 21
Swaziland 1200 867 208 4 3 34 23 9 7 0 0 0 0 13 14 11 15
Sweden 20 358 32 0 0 0 0 0 0 0 0 0 0 2 3 15 12
Switzerland 17 323 30 0 0 0 0 0 0 0 0 0 0 2 1 20 23
Syrian Arab Republic 56 619 45 10 8 0 0 11 7 0 0 0 0 11 8 27 30
Tajikistan 229 730 29 18 12 0 0 14 9 0 0 0 0 22 17 14 17
Thailand 153 675 106 16 11 3 1 6 3 0 0 0 0 11 9 23 24
The former Yugoslav Republic of Macedonia 24 688 24 0 0 0 0 8 3 0 0 0 0 6 5 50 38
Timor-Leste 444 560 51 4 2 0 0 14 8 0 0 4 4 23 20 16 19
Togo 635 716 63 21 19 4 3 10 10 9 0 22 18 15 16 10 13
Tonga 173 670 29 0 0 0 0 4 3 0 0 0 0 11 9 19 22
Trinidad and Tobago 104 673 71 1 1 3 3 1 0 0 0 0 0 3 7 35 16
Tunisia 134 465 36 5 3 0 0 7 3 0 0 0 0 12 7 25 29
Turkey 53 590 31 56 18 0 0 3 1 0 0 0 0 18 11 21 24
Turkmenistan 166 1016 74 7 6 0 0 10 8 0 0 0 0 18 16 18 21
Tuvalu 266 1015 55 0 0 0 0 2 1 0 0 0 0 12 9 15 17
Uganda 810 888 179 157 141 9 7 12 10 5 0 15 13 17 17 11 13
Ukraine 94 823 112 7 7 5 1 3 2 0 0 0 0 16 12 17 16
United Arab Emirates 73 406 38 1 1 0 0 1 0 0 0 0 0 4 2 40 40
United Kingdom 36 401 25 5 4 0 0 1 0 0 0 0 0 4 4 33 35
United Republic of Tanzania 782 745 120 174 133 10 6 11 9 3 1 15 11 15 15 11 15
United States of America 34 418 53 32 32 0 0 0 0 0 0 0 0 3 2 27 20
Uruguay 55 524 49 1 1 0 0 3 2 0 0 0 0 8 11 20 16
Uzbekistan 104 838 44 35 31 0 0 10 7 0 0 0 0 18 15 18 20
Vanuatu 175 687 30 0 0 0 0 4 3 0 0 13 19 11 9 19 15
Venezuela (Bolivarian Republic of) 71 433 101 14 11 0 0 11 7 0 0 0 0 8 10 23 23
Viet Nam 122 607 66 42 34 1 1 14 10 7 5 0 0 15 12 20 18
Yemen 232 807 91 68 69 0 0 13 11 5 0 1 1 23 22 16 18
Zambia 961 938 176 68 60 16 11 11 9 6 4 16 13 13 14 10 13
Zimbabwe 1552 622 73 43 29 45 20 6 8 0 1 3 8 8 11 11 14
2. Cause-specific mortality and morbidity

77
Tabl
e 2
Mortailty
Distribution of causes of death among children aged <5 years b (%)
Age-standardized adult mortality rate by cause a
(ages 30-70 per 100 000 population)
Member State
All c
ause
s
Canc
er
Card
iova
scul
ar
diea
se a
nd
diab
etes
Chro
nic
resp
irato
ry
cond
ition
s
Birth asphyxia Neonatal sepsisCongenital anomalies Other diseases Injuries
2000 2010 2000 2010 2000 2010 2000 2010 2000 2010 2008
0 … 0 … 0 … 100 … 0 … 220 108 86 2 San Marino
9 10 3 4 6 8 18 24 4 6 654 169 183 40 Sao Tome and Principe
12 8 5 2 21 23 13 15 10 13 664 81 401 15 Saudi Arabia
9 11 3 5 4 8 11 14 2 4 1133 152 307 73 Senegal
17 14 5 1 26 22 13 14 5 4 657 236 274 19 Serbia
9 8 5 4 26 25 19 25 3 4 867 199 265 32 Seychelles
6 7 3 5 4 5 11 16 2 3 1675 133 383 92 Sierra Leone
4 7 1 1 34 33 25 23 6 4 326 126 115 8 Singapore
5 5 1 1 27 32 19 18 6 7 622 200 224 13 Slovakia
8 9 4 3 41 25 18 18 8 8 412 176 96 6 Slovenia
13 13 5 3 9 10 11 16 3 8 685 124 308 42 Solomon Islands
8 9 4 5 4 5 11 17 2 3 1725 150 544 71 Somalia
8 8 3 3 5 8 13 15 3 4 2259 193 307 68 South Africa
7 9 5 5 34 27 29 34 6 5 305 140 68 14 Spain
17 27 5 3 22 30 11 14 9 6 804 130 214 47 Sri Lanka
10 11 3 8 4 5 21 18 4 5 1282 100 503 65 Sudan
6 10 9 7 11 15 22 25 10 8 746 102 332 14 Suriname
7 9 4 5 3 4 15 19 3 5 3109 117 551 136 Swaziland
10 10 6 4 43 30 22 39 3 2 293 121 79 9 Sweden
7 10 2 3 34 28 27 30 9 5 273 127 59 7 Switzerland
12 11 4 3 20 24 11 12 3 5 611 75 327 27 Syrian Arab Republic
9 10 5 4 5 7 26 28 5 6 904 126 427 31 Tajikistan
9 8 7 7 24 27 15 16 4 4 827 136 244 37 Thailand
9 9 4 2 22 22 0 18 0 3 561 177 284 16 The former Yugoslav Republic of Macedonia
9 13 6 7 3 5 19 17 5 6 960 141 260 53 Timor-Leste
8 9 3 4 4 6 11 17 2 4 1562 143 370 89 Togo
14 11 5 4 27 29 14 15 6 7 911 105 446 56 Tonga
25 12 3 3 12 24 15 30 3 6 781 128 378 18 Trinidad and Tobago
11 11 4 3 19 23 17 16 6 7 469 127 131 13 Tunisia
8 7 7 7 13 23 25 23 5 4 550 163 268 30 Turkey
10 10 4 4 8 10 26 26 5 5 1422 172 808 42 Turkmenistan
9 10 6 6 13 16 15 18 28 23 1321 188 626 79 Tuvalu
6 8 4 5 3 4 14 17 3 5 1959 191 421 111 Uganda
7 8 4 4 24 28 15 19 9 9 1188 170 500 24 Ukraine
10 9 3 1 25 27 13 16 5 4 434 78 211 12 United Arab Emirates
6 7 3 1 24 27 24 23 5 4 359 144 91 20 United Kingdom
9 11 6 7 3 5 14 17 3 5 1733 113 341 86 United Republic of Tanzania
5 3 3 3 25 22 27 26 10 22 460 143 137 24 United States of America
7 4 6 9 26 28 22 23 7 7 549 198 167 27 Uruguay
10 10 4 4 8 11 27 27 5 6 971 113 568 28 Uzbekistan
8 12 7 5 16 21 7 9 15 5 860 152 391 53 Vanuatu
8 9 9 8 15 19 18 13 7 9 532 112 200 14 Venezuela (Bolivarian Republic of)
8 10 6 7 14 22 13 13 3 3 685 168 232 38 Viet Nam
11 13 6 6 3 4 16 18 5 6 999 112 420 46 Yemen
7 9 5 6 2 4 12 15 2 4 2395 166 527 135 Zambia
8 10 6 6 3 5 8 14 1 4 3046 157 206 51 Zimbabwe
011010011001101001100110100110011010011001101001100110100110011010011010010110010111101010100101010100101100101111010101001010101001010010011010011001001101001100100110100110010011010011001001101001001010101001010101001010101001010101001010101001010101001010101001010101001010101001010101001010101001010101001010101001010101001101001100110100110011010011001101001100110100110011010011001101001101100010101100010101100010101100010101100010101100010101100010101011010011001101001100110100110011010011001101001100110100110011010010100101010010101011000100110100101010010101011000100110100101010010101010110001001101001101001011010100110001001101001101001011010100110001001100101111010010101001010010111101001010100101001011110100101010010100101011010011001101001100110100110011010011001101001100110100110011010010010100110100010100110100010100110100010100110100010100110100010100101101001100110100110011010011001101001100110100110011010011001101001111010010101001010111010010111101001010100101011101001011110100101010010101011010011001101001100110100110011010011001101001100110100110011010011001011110101010010110010111101010100101100101111010101001011001010110100110011010011001101001100110100110011010011001101001100110100101001011010000100101101000010010110100001001011010000100101101000010010101101001100110100110011010011001101001100110100110011010011001101001
0101011000100110100110100101101010101100010011010011010010110101010101101001100110100110011010011001101001100110100110011010011001101001101001011001011110101010010101010010110010111101010100101010100101001001101001100100110100110010011010011001001101001100100110100100101010100101010100101010100101010100101010100101010100101010100101010100101010100101010100101010100101010100101010100101010100110100110011010011001101001100110100110011010011001101001100110100110110001010110001010110001010110001010110001010110001010110001010101101001100110100110011010011001101001100110100110011010011001101001010010101001010101100010011010010101001010101100010011010010101001010101011000100110100110100101101010011000100110100110100101101010011000100110010111101001010100101001011110100101010010100101111010010101001010010101101001100110100110011010011001101001100110100110011010011001101001001010011010001010011010001010011010001010011010001010011010001010010110100110011010011001101001100110100110011010011001101001100110100111101001010100101011101001011110100101010010101110100101111010010101001010101101001100110100110011010011001101001100110100110011010011001101001100101111010101001011001011110101010010110010111101010100101100101
010010100110101010110010100101100101111010101001010100101010110001001

78
Member State Mortailty
MDG 5 MDG 6Maternal mortality ratio c (per 100 000 live births)
Cause-specific mortality rate (per 100 000 population)
HIV/AIDS d Malaria e Tuberculosis among HIV-negative people f
1990 2000 2010 2000 2009 2008 2000 2010
San Marino … … … … … 0.0 0.0 …
Sao Tome and Principe 150 110 70 … … 9.2 18 13
Saudi Arabia 44 27 24 … … 0.0 i 1.5 1.4
Senegal 670 500 370 20 21 76 50 62
Serbia 23 12 12 2.1 1.8 0.0 … 1.4
Seychelles … … … … … 0.0 1.8 1.7
Sierra Leone 1 300 1 300 890 20 49 239 87 146
Singapore 6 15 3 1.9 1.8 0.0 i 3.2 2.3
Slovakia 15 13 6 0.0 0.1 0.0 1.0 0.5
Slovenia 11 12 12 0.1 0.1 0.0 0.9 0.8
Solomon Islands 150 120 93 … … 30 40 17
Somalia 890 1 000 1 000 6.2 18 28 68 56
South Africa 250 330 300 390 627 0.2 43 50
Spain 7 5 6 4.9 3.5 0.0 i 1.0 0.7
Sri Lanka 85 58 35 0.1 0.7 0.0 i 10 9.1
Sudan 1 000 870 730 8.6 28 23 18 19
Suriname 84 130 130 40 37 2.5 1.4 2.8
Swaziland 300 360 320 530 594 0.3 30 32
Sweden 6 5 4 0.3 0.2 0.0 i 0.2 0.3
Switzerland 7 6 8 0.8 0.9 0.0 i 0.5 0.3
Syrian Arab Republic 240 120 70 … … 0.0 2.6 1.4
Tajikistan 94 120 65 2.6 6.3 0.0 i 27 41
Thailand 54 66 48 90 42 0.4 22 16
The former Yugoslav Republic of Macedonia 16 15 10 … … 0.0 5.9 2.0
Timor-Leste 1 000 610 300 … … 83 … 46
Togo 620 440 300 110 117 65 89 106
Tonga 67 87 110 … … 0.8 3.7 2.9
Trinidad and Tobago 86 59 46 40 41 0.0 2.2 2.8
Tunisia 130 84 56 0.3 0.7 0.1 2.0 2.2
Turkey 67 39 20 0.1 0.2 0.0 i 6.8 3.1
Turkmenistan 82 91 67 … … 0.0 27 20
Tuvalu … … … … … 0.0 71 33
Uganda 600 530 310 370 196 103 41 15
Ukraine 49 35 32 20 53 0.0 i 24 19
United Arab Emirates 24 14 12 … … 0.0 i 0.5 0.3
United Kingdom 10 12 12 0.4 0.8 0.0 i 0.6 0.6
United Republic of Tanzania 870 730 460 310 196 87 17 13
United States of America 12 14 21 6.3 5.4 0.0 i 0.3 0.2
Uruguay 39 35 29 … … 0.0 2.1 1.1
Uzbekistan 59 33 28 0.0 1.5 0.0 18 20
Vanuatu 220 120 110 … … 8.5 14 5.8
Venezuela (Bolivarian Republic of) 94 91 92 … … 0.1 2.6 2.8
Viet Nam 240 100 59 5.7 16 0.1 35 34
Yemen 610 380 200 … … 4.9 17 5.9
Zambia 470 540 440 630 351 104 34 20
Zimbabwe 450 640 570 1020 661 40 17 27
2. Cause-specific mortality and morbidity (contd.)

79
Tabl
e 2
Morbidity Member State
MDG 6Incidence rate
(per 100 000 population)Prevalence
(per 100 000 population)
HIV/AIDS d Malaria g Tuberculosis h HIV/AIDS d Tuberculosis h
2000 2009 2009 2000 2010 2000 2009 2000 2010
… … … 4.3 … … … 8.9 0.0 San Marino
… … 10 749 114 96 … … 189 141 Sao Tome and Principe
… … 0.3 20 18 … … 26 24 Saudi Arabia
52 48 29 332 237 288 300 472 446 542 Senegal
… … … … 18 18 50 … 22 Serbia
… … … 37 31 … … 56 48 Seychelles
118 83 32 096 377 682 490 860 748 1 282 Sierra Leone
… … … 50 35 68 72 63 44 Singapore
… … … 22 8.0 2.6 6.6 28 9.6 Slovakia
… … … 21 11 10.0 26 5.0 14 Slovenia
… … 10 824 185 108 … … 360 178 Solomon Islands
… … 9 727 285 286 125 373 589 513 Somalia
1 437 773 32 576 981 9 432 11 236 524 795 South Africa
… … … 23 16 282 294 28 18 Spain
1.6 1.6 15 66 66 5.7 14 108 101 Sri Lanka
… … 18 572 119 119 176 615 187 188 Sudan
67 38 567 80 145 680 717 133 238 Suriname
1 851 1184 89 803 1 287 11 362 15 605 508 704 Swaziland
… … … 5.5 6.8 69 88 6.9 8.8 Sweden
… … … 9.2 7.6 175 240 11 9.4 Switzerland
… … 0.0 35 20 … … 42 23 Syrian Arab Republic
11 20 3.8 125 206 58 131 243 382 Tajikistan
46 18 261 137 137 1 065 786 212 182 Thailand
… … … 41 21 … … 60 24 The former Yugoslav Republic of Macedonia
… … 27 942 … 498 … … … 643 Timor-Leste
230 156 25 894 374 455 1 894 1 884 720 865 Togo
… … … 28 17 … … 42 29 Tonga
… … … 18 19 766 1 085 18 21 Trinidad and Tobago
… … … 24 25 6.8 24 30 31 Tunisia
… … 0.1 46 28 2.3 6.1 45 24 Turkey
… … 0.0 92 66 … … 105 77 Turkmenistan
… … … 357 237 … … 666 366 Tuvalu
385 380 28 037 427 209 4 024 3 645 399 193 Uganda
… … … 84 101 549 766 106 132 Ukraine
… … … 5.5 3.1 … … 9.9 6.2 United Arab Emirates
… … … 12 13 66 137 15 15 United Kingdom
383 240 26 133 236 177 3 992 3 199 233 183 United Republic of Tanzania
17 17 … 6.7 4.1 314 391 8.0 4.8 United States of America
… … … 24 21 181 296 31 22 Uruguay
… … 0.0 i 128 128 1.9 103 229 227 Uzbekistan
… … 6 682 110 69 … … 161 78 Vanuatu
… … 302 34 33 … … 49 48 Venezuela (Bolivarian Republic of)
… … 58 205 199 138 316 345 334 Viet Nam
… … 3 234 116 49 … … 184 71 Yemen
857 589 22 100 713 462 7 763 7 557 520 345 Zambia
1 135 497 11 646 726 633 13 954 9 518 353 402 Zimbabwe
011010011001101001100110100110011010011001101001100110100110011010011010010110010111101010100101010100101100101111010101001010101001010010011010011001001101001100100110100110010011010011001001101001001010101001010101001010101001010101001010101001010101001010101001010101001010101001010101001010101001010101001010101001010101001101001100110100110011010011001101001100110100110011010011001101001101100010101100010101100010101100010101100010101100010101100010101011010011001101001100110100110011010011001101001100110100110011010010100101010010101011000100110100101010010101011000100110100101010010101010110001001101001101001011010100110001001101001101001011010100110001001100101111010010101001010010111101001010100101001011110100101010010100101011010011001101001100110100110011010011001101001100110100110011010010010100110100010100110100010100110100010100110100010100110100010100101101001100110100110011010011001101001100110100110011010011001101001111010010101001010111010010111101001010100101011101001011110100101010010101011010011001101001100110100110011010011001101001100110100110011010011001011110101010010110010111101010100101100101111010101001011001010110100110011010011001101001100110100110011010011001101001100110100101001011010000100101101000010010110100001001011010000100101101000010010101101001100110100110011010011001101001100110100110011010011001101001
0101011000100110100110100101101010101100010011010011010010110101010101101001100110100110011010011001101001100110100110011010011001101001101001011001011110101010010101010010110010111101010100101010100101001001101001100100110100110010011010011001001101001100100110100100101010100101010100101010100101010100101010100101010100101010100101010100101010100101010100101010100101010100101010100101010100110100110011010011001101001100110100110011010011001101001100110100110110001010110001010110001010110001010110001010110001010110001010101101001100110100110011010011001101001100110100110011010011001101001010010101001010101100010011010010101001010101100010011010010101001010101011000100110100110100101101010011000100110100110100101101010011000100110010111101001010100101001011110100101010010100101111010010101001010010101101001100110100110011010011001101001100110100110011010011001101001001010011010001010011010001010011010001010011010001010011010001010010110100110011010011001101001100110100110011010011001101001100110100111101001010100101011101001011110100101010010101110100101111010010101001010101101001100110100110011010011001101001100110100110011010011001101001100101111010101001011001011110101010010110010111101010100101100101
010010100110101010110010100101100101111010101001010100101010110001001

80
Mortality
Member State Age-standardized mortality rates by cause a
(per 100 000 population)
Number of deaths among
children aged <5 years b
(000s)
Distribution of causes of death among children aged <5 years b (%)
Com
mun
icab
le
Non-
co
mm
unic
able
Inju
ries
HIV/AIDS Diarrhoea Measles Malaria Pneumonia Prematurity
2008 2000 2010 2000 2010 2000 2010 2000 2010 2000 2010 2000 2010 2000 2010
Ranges of country valuesMinimum 11 273 14 0 0 0 0 0 0 0 0 0 0 0 0 0 0
Median 105 637 58 4 3 0 0 6 4 0 0 0 0 12 11 18 19
Maximum 1552 1289 347 2294 1696 48 28 80 16 22 11 29 27 35 29 50 45
WHO regionAfrican Region 798 779 107 3836 3508 6 4 13 11 8 1 16 15 16 17 11 12
Region of the Americas 72 455 63 430 284 1 1 8 4 0 0 0 0 13 9 20 19
South-East Asia Region 334 676 101 3042 2127 0 0 13 11 4 3 0 1 22 22 19 21
European Region 51 532 63 230 155 0 1 5 4 0 0 0 0 16 12 20 21
Eastern Mediterranean Region 254 706 91 1149 1070 0 0 13 11 4 1 1 1 21 20 17 19
Western Pacific Region 74 534 64 889 467 0 0 6 4 1 1 0 0 23 16 15 17
Income groupLow income 636 757 124 3065 2658 4 3 14 12 5 1 11 11 19 18 12 14
Lower middle income 233 658 82 5104 4180 2 2 13 11 6 2 6 6 20 19 16 18
Upper middle income 125 608 81 1315 691 3 3 6 4 0 1 0 0 19 14 17 19
High income 31 380 41 98 85 0 0 1 1 0 0 1 1 5 4 25 23
Global 230 573 78 9581 7614 3 2 12 10 5 1 7 7 19 18 15 17
2. Cause-specific mortality and morbidity

81
Tabl
e 2
Mortailty
Distribution of causes of death among children aged <5 years b (%)
Age-standardized adult mortality rate by cause a
(ages 30-70 per 100 000 population)
Member State
All c
ause
s
Canc
er
Card
iova
scul
ar
diea
se a
nd
diab
etes
Chro
nic
resp
irato
ry
cond
ition
s
Birth asphyxia Neonatal sepsisCongenital anomalies Other diseases Injuries
2000 2010 2000 2010 2000 2010 2000 2010 2000 2010 2008
0 0 0 0 0 2 0 3 0 0 220 59 59 2 Minimum
9 9 4 4 15 18 17 19 5 6 774 140 284 29 Median
40 48 10 14 43 48 100 42 29 56 3147 284 1427 195 Maximum
7 9 5 5 3 5 13 17 3 4 1716 147 382 92 African Region
8 8 6 6 15 17 23 20 6 17 532 136 169 24 Region of the Americas
10 11 8 8 5 7 14 12 3 4 987 125 322 109 South-East Asia Region
8 9 5 4 16 19 23 24 6 6 626 166 238 17 European Region
11 11 6 7 6 7 17 18 4 5 881 127 344 46 Eastern Mediterranean Region
16 14 3 3 8 12 18 22 8 9 545 168 184 41 Western Pacific Region
8 9 5 5 3 4 15 18 3 5 1354 154 375 77 Low income
10 10 7 7 5 6 14 14 3 4 808 150 273 73 Lower middle income
14 12 3 4 11 15 19 22 7 8 805 158 295 27 Upper middle income
8 6 3 3 26 25 22 25 9 14 376 141 104 14 High income
10 10 6 6 6 7 15 16 4 5 764 150 245 52 Global
011010011001101001100110100110011010011001101001100110100110011010011010010110010111101010100101010100101100101111010101001010101001010010011010011001001101001100100110100110010011010011001001101001001010101001010101001010101001010101001010101001010101001010101001010101001010101001010101001010101001010101001010101001010101001101001100110100110011010011001101001100110100110011010011001101001101100010101100010101100010101100010101100010101100010101100010101011010011001101001100110100110011010011001101001100110100110011010010100101010010101011000100110100101010010101011000100110100101010010101010110001001101001101001011010100110001001101001101001011010100110001001100101111010010101001010010111101001010100101001011110100101010010100101011010011001101001100110100110011010011001101001100110100110011010010010100110100010100110100010100110100010100110100010100110100010100101101001100110100110011010011001101001100110100110011010011001101001111010010101001010111010010111101001010100101011101001011110100101010010101011010011001101001100110100110011010011001101001100110100110011010011001011110101010010110010111101010100101100101111010101001011001010110100110011010011001101001100110100110011010011001101001100110100101001011010000100101101000010010110100001001011010000100101101000010010101101001100110100110011010011001101001100110100110011010011001101001
0101011000100110100110100101101010101100010011010011010010110101010101101001100110100110011010011001101001100110100110011010011001101001101001011001011110101010010101010010110010111101010100101010100101001001101001100100110100110010011010011001001101001100100110100100101010100101010100101010100101010100101010100101010100101010100101010100101010100101010100101010100101010100101010100101010100110100110011010011001101001100110100110011010011001101001100110100110110001010110001010110001010110001010110001010110001010110001010101101001100110100110011010011001101001100110100110011010011001101001010010101001010101100010011010010101001010101100010011010010101001010101011000100110100110100101101010011000100110100110100101101010011000100110010111101001010100101001011110100101010010100101111010010101001010010101101001100110100110011010011001101001100110100110011010011001101001001010011010001010011010001010011010001010011010001010011010001010010110100110011010011001101001100110100110011010011001101001100110100111101001010100101011101001011110100101010010101110100101111010010101001010101101001100110100110011010011001101001100110100110011010011001101001100101111010101001011001011110101010010110010111101010100101100101
010010100110101010110010100101100101111010101001010100101010110001001

82
Member State Mortailty
MDG 5 MDG 6Maternal mortality ratio c (per 100 000 live births)
Cause-specific mortality rate (per 100 000 population)
HIV/AIDS d Malaria e Tuberculosis among HIV-negative people f
1990 2000 2010 2000 2009 2008 2000 2010
Ranges of country valuesMinimum 6 4 2 0.0 0.0 0.0 0.0 0.0
Median 110 90 66 5.8 9.1 0.0 8.6 5.4
Maximum 1 600 1 300 1 100 1 020 680 239 105 146
WHO regionAfrican Region 820 720 480 200 160 94 36 30
Region of the Americas 100 80 63 10 10 0.1 3.8 2.2
South-East Asia Region 590 370 200 10 13 2.9 42 27
European Region 44 29 20 2.6 9.6 0.0 8.6 6.8
Eastern Mediterranean Region 430 360 250 2.1 6.5 2.5 29 16
Western Pacific Region 140 77 49 1.7 3.4 0.2 12 7.5
Income groupLow income 810 630 410 130 85 58 49 36
Lower middle income 560 420 260 20 17 9.0 37 24
Upper middle income 120 76 53 30 46 0.2 10 6.1
High income 16 13 14 2.9 2.6 0.0 1.4 0.9
Global 400 320 210 30 27 12 22 15
a Mortality estimates for WHO Member States in 2008. Geneva, World Health Organiza-tion, 2011 (http://www.who.int/entity/healthinfo/statistics/bodgbddeathdalyestimates.xls). Please refer to the web site for further information on methods, country-level in-formation used and margins of uncertainty. Communicable diseases include mater-
nal causes, conditions arising during the perinatal period and nutritional deficiencies. Rates are age-standardized to WHO’s world standard population. Ahmad OB et al. Age standardization of rates: a new WHO standard. Geneva, World Health Organization, 2001 (GPE Discussion Paper Series No. 31) (http://www.who.int/healthinfo/paper31.pdf). Income-group aggregates are based on the 2008 World Bank list of economies.
b Liu L et al. Global, regional, and national causes of child mortality in 2000–2010: an updated systematic analysis (forthcoming). Prepared on behalf of the Child Health Epi-demiology Reference Group of WHO and UNICEF. Individual percentages may not add up to 100% due to rounding.
c Trends in maternal mortality: 1990 to 2010. WHO, UNICEF, UNFPA and the World Bank estimates. Geneva, World Health Organization (forthcoming). For uncertainty ranges see the full report.
d Based on the 2010 report on the global AIDS epidemic. Geneva, UNAIDS and World Health Organization, 2010. See Annex 1: HIV and AIDS estimates and data, 2009 and 2001 (http://www.unaids.org/globalreport/Global_report.htm). Denominator (per 100 000 population) calculated using World population prospects: the 2008 revision. New York, Population Division, Department of Economic and Social Affairs, United Na-
tions Secretariat, 2009. Income-group aggregates are based on the 2010 World Bank list of economies. For uncertainty ranges see the full report.
e World malaria report 2009. Geneva, World Health Organization, 2009 (http://www.who.int/malaria/world_malaria_report_2009). Income-group aggregates are based on the 2008 World Bank list of economies. For uncertainty ranges see the full report.
f These are classified as deaths from tuberculosis (A15–A19, B90) according to the In-ternational Statistical Classification of Diseases and Related Health Problems, 10th Revision. Geneva, World Health Organization, 2008 (http://apps.who.int/classifica-tions/icd10/browse/2010/en). Global tuberculosis control 2011. Geneva, World Health Organization, 2011 (http://www.who.int/tb/publications/global_report/). WHO regional, income-group and global aggregates include territories. For uncertainty ranges see the full report.
g Cibulskis R, et al. (2011). Worldwide Incidence of Malaria in 2009: Estimates, Time Trends, and a Critique of Methods, PloS Med, 8(12): e1001142. Doi:10.1371/journal.pmed.1001142. For uncertainty ranges see the full report.
h Data are for all forms of tuberculosis including tuberculosis in people with HIV infection. Global tuberculosis control 2011. Geneva, World Health Organization, 2011 (http://www.who.int/tb/publications/global_report/). WHO regional, income-group and global aggregates include territories. For uncertainty ranges see the full report.
i The estimated number is less than 0.05 per 100 000 population.
2. Cause-specific mortality and morbidity (contd.)
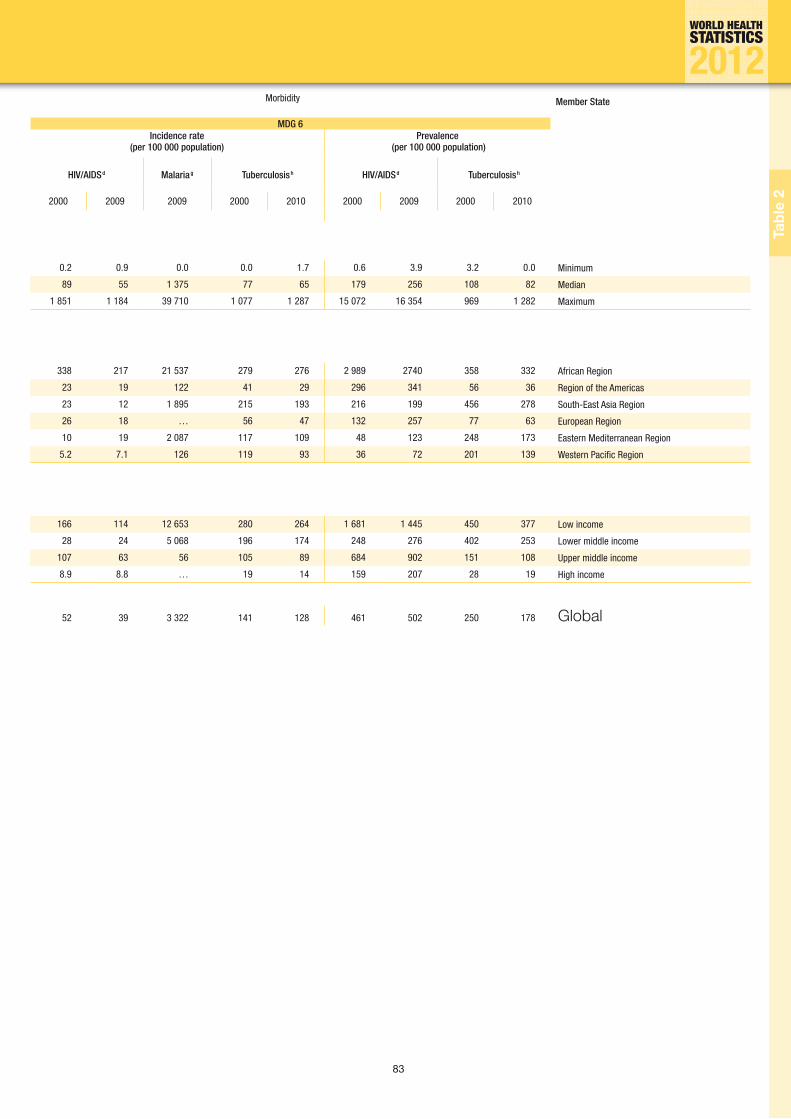
83
Tabl
e 2
Morbidity Member State
MDG 6Incidence rate
(per 100 000 population)Prevalence
(per 100 000 population)
HIV/AIDS d Malaria g Tuberculosis h HIV/AIDS d Tuberculosis h
2000 2009 2009 2000 2010 2000 2009 2000 2010
0.2 0.9 0.0 0.0 1.7 0.6 3.9 3.2 0.0 Minimum
89 55 1 375 77 65 179 256 108 82 Median
1 851 1 184 39 710 1 077 1 287 15 072 16 354 969 1 282 Maximum
338 217 21 537 279 276 2 989 2740 358 332 African Region
23 19 122 41 29 296 341 56 36 Region of the Americas
23 12 1 895 215 193 216 199 456 278 South-East Asia Region
26 18 … 56 47 132 257 77 63 European Region
10 19 2 087 117 109 48 123 248 173 Eastern Mediterranean Region
5.2 7.1 126 119 93 36 72 201 139 Western Pacific Region
166 114 12 653 280 264 1 681 1 445 450 377 Low income
28 24 5 068 196 174 248 276 402 253 Lower middle income
107 63 56 105 89 684 902 151 108 Upper middle income
8.9 8.8 … 19 14 159 207 28 19 High income
52 39 3 322 141 128 461 502 250 178 Global
011010011001101001100110100110011010011001101001100110100110011010011010010110010111101010100101010100101100101111010101001010101001010010011010011001001101001100100110100110010011010011001001101001001010101001010101001010101001010101001010101001010101001010101001010101001010101001010101001010101001010101001010101001010101001101001100110100110011010011001101001100110100110011010011001101001101100010101100010101100010101100010101100010101100010101100010101011010011001101001100110100110011010011001101001100110100110011010010100101010010101011000100110100101010010101011000100110100101010010101010110001001101001101001011010100110001001101001101001011010100110001001100101111010010101001010010111101001010100101001011110100101010010100101011010011001101001100110100110011010011001101001100110100110011010010010100110100010100110100010100110100010100110100010100110100010100101101001100110100110011010011001101001100110100110011010011001101001111010010101001010111010010111101001010100101011101001011110100101010010101011010011001101001100110100110011010011001101001100110100110011010011001011110101010010110010111101010100101100101111010101001011001010110100110011010011001101001100110100110011010011001101001100110100101001011010000100101101000010010110100001001011010000100101101000010010101101001100110100110011010011001101001100110100110011010011001101001
0101011000100110100110100101101010101100010011010011010010110101010101101001100110100110011010011001101001100110100110011010011001101001101001011001011110101010010101010010110010111101010100101010100101001001101001100100110100110010011010011001001101001100100110100100101010100101010100101010100101010100101010100101010100101010100101010100101010100101010100101010100101010100101010100101010100110100110011010011001101001100110100110011010011001101001100110100110110001010110001010110001010110001010110001010110001010110001010101101001100110100110011010011001101001100110100110011010011001101001010010101001010101100010011010010101001010101100010011010010101001010101011000100110100110100101101010011000100110100110100101101010011000100110010111101001010100101001011110100101010010100101111010010101001010010101101001100110100110011010011001101001100110100110011010011001101001001010011010001010011010001010011010001010011010001010011010001010010110100110011010011001101001100110100110011010011001101001100110100111101001010100101011101001011110100101010010101110100101111010010101001010101101001100110100110011010011001101001100110100110011010011001101001100101111010101001011001011110101010010110010111101010100101100101
010010100110101010110010100101100101111010101001010100101010110001001

84

85
Tabl
e 3
3. Selected infectious diseases
Table 3 has been compiled from official national reports of case numbers for selected infectious diseas-es. Decisions on which diseases to include have primarily been made on the basis of data availability. Where possible, a distinction is made between zero cases reported and no information available for a country. In isolation, the numbers shown provide no indication of the relative risk of disease, nor of the quality of disease reporting in different countries. However, the table does provide an indication of the current status of officially reported infectious disease data at the global level, and of the major reporting gaps. Given the variations in the methods used by countries to obtain these numbers, no attempt has been made to calculate incidence or prevalence.
To meaningfully interpret the figures provided, both epidemiological patterns and data-collection efforts in specific countries must be considered. Some diseases (for example, malaria and yellow fever) are endemic to certain geographical regions, but are extremely rare elsewhere. Diseases such as plague are liable to cause outbreaks that can cause case numbers to fluctuate widely over time. Because some diseases are best tackled with preventive measures such as mass drug treatment, reporting the number of cases is a lower priority than estimating the population at risk. For vaccine-preventable diseases, case numbers are affected by immunization rates. Diseases such as H5N1 influenza, Japa-nese encephalitis and malaria are difficult to identify without specialized laboratory tests that are often not available in developing countries. In many settings, cases of some diseases are identified through clinical signs and symptoms alone.
Despite ongoing efforts to enhance disease surveillance and response, many countries face chal-lenges in accurately identifying, diagnosing and reporting infectious diseases due to the remoteness of communities, lack of transport and communication infrastructures, and a shortage of skilled health-care workers and laboratory facilities to ensure accurate diagnosis. No inferences can be drawn from the figures shown concerning the efforts or progress that countries are making in controlling particular diseases.
Case numbers are also a poor indication of the burden of disease. Diseases such as H5N1 influenza and plague have high mortality rates, while diseases such as poliomyelitis and leprosy have low mor-tality rates but result in a heavy loss of healthy years of life. Some diseases with very small initial case numbers can potentially cause devastating epidemics, and so mandatory reporting is essential. For diseases that are considered eradicable (such as leprosy and poliomyelitis) case reporting is essential to ensure that eradication efforts are targeted to the affected areas.
Some diseases are reported under the International Health Regulations, while others are monitored by countries or by WHO in the context of specific control programmes. Further information on disease in-cidence and prevalence, as well as on immunization coverage rates for vaccine-preventable diseases, can be obtained from the relevant WHO programme.
011010011001101001100110100110011010011001101001100110100110011010011010010110010111101010100101010100101100101111010101001010101001010010011010011001001101001100100110100110010011010011001001101001001010101001010101001010101001010101001010101001010101001010101001010101001010101001010101001010101001010101001010101001010101001101001100110100110011010011001101001100110100110011010011001101001101100010101100010101100010101100010101100010101100010101100010101011010011001101001100110100110011010011001101001100110100110011010010100101010010101011000100110100101010010101011000100110100101010010101010110001001101001101001011010100110001001101001101001011010100110001001100101111010010101001010010111101001010100101001011110100101010010100101011010011001101001100110100110011010011001101001100110100110011010010010100110100010100110100010100110100010100110100010100110100010100101101001100110100110011010011001101001100110100110011010011001101001111010010101001010111010010111101001010100101011101001011110100101010010101011010011001101001100110100110011010011001101001100110100110011010011001011110101010010110010111101010100101100101111010101001011001010110100110011010011001101001100110100110011010011001101001100110100101001011010000100101101000010010110100001001011010000100101101000010010101101001100110100110011010011001101001100110100110011010011001101001
0101011000100110100110100101101010101100010011010011010010110101010101101001100110100110011010011001101001100110100110011010011001101001101001011001011110101010010101010010110010111101010100101010100101001001101001100100110100110010011010011001001101001100100110100100101010100101010100101010100101010100101010100101010100101010100101010100101010100101010100101010100101010100101010100101010100110100110011010011001101001100110100110011010011001101001100110100110110001010110001010110001010110001010110001010110001010110001010101101001100110100110011010011001101001100110100110011010011001101001010010101001010101100010011010010101001010101100010011010010101001010101011000100110100110100101101010011000100110100110100101101010011000100110010111101001010100101001011110100101010010100101111010010101001010010101101001100110100110011010011001101001100110100110011010011001101001001010011010001010011010001010011010001010011010001010011010001010010110100110011010011001101001100110100110011010011001101001100110100111101001010100101011101001011110100101010010101110100101111010010101001010101101001100110100110011010011001101001100110100110011010011001101001100101111010101001011001011110101010010110010111101010100101100101
010010100110101010110010100101100101111010101001010100101010110001001

86
Member State Number of reported cases
Chol
era a
Diph
ther
ia b
H5N1
in
fluen
za c
Japa
nese
en
ceph
aliti
s b
Lepr
osy d
Mal
aria
e
Mea
sles
b
Men
ingi
tis f
Mum
ps b
2010 2010 2011 2009 2010 2010 2010 2011 2010
Afghanistan 2 369 0 … 0 51 69 397 1 989 … 0
Albania … 0 … 0 … … 10 … 21
Algeria … 0 … 0 0 5 103 … 0
Andorra … 0 … … … … 0 … 0
Angola 1 484 … … … 1 076 1 682 870 1 190 … 0
Antigua and Barbuda … 0 … … … … 0 … 0
Argentina … 0 … … 354 72 17 … 5 083
Armenia … 0 … 0 … 0 2 … 38
Australia 3 k 0 … 0 9 … 70 … 89
Austria … 0 … 0 … … 52 … …
Azerbaijan … 0 … 0 … 50 0 … 125
Bahamas … 0 … … … 0 0 … 0
Bahrain … 0 … 0 3 … 0 … 46
Bangladesh … 27 2 15 3 848 91 227 788 … …
Barbados … 0 … … … … 0 … 0
Belarus … 1 … 0 … … 1 … 88
Belgium … 0 … 0 … … 40 … 31
Belize … 0 … … 0 150 0 … 0
Benin 983 … … … 227 … 392 233 l …
Bhutan … 0 … 0 14 436 97 … 218
Bolivia (Plurinational State of) … 5 … … 124 13 769 0 … 1 781
Bosnia and Herzegovina … 0 … … … … 45 … 209
Botswana … 0 … … 4 1 046 853 … …
Brazil … 32 … … 34 894 334 618 68 … 0
Brunei Darussalam … 0 … … 3 … 0 … 12
Bulgaria … 0 … 0 … … 22 004 … 317
Burkina Faso … 0 … … 320 804 539 2 511 3 604 l …
Burundi 333 0 … 0 546 1 763 447 495 … 0
Cambodia 588 3 8 41 262 49 356 1 156 … …
Cameroon 10 759 … … … 532 … 240 2 548 m …
Canada 2 n 0 … … … … 99 … 799
Cape Verde … 0 … 0 4 18 0 … 42
Central African Republic … 0 … … 174 … 2 361 o …
Chad 6 395 … … … 389 … 194 5 863 p …
Chile … 0 … … 0 … 0 … 891
China 157 q 0 1 2 541 1 324 4 990 38 159 … 298 932
Colombia … 0 … … 295 117 650 0 … 10 376
Comoros … 0 … … … 36 538 0 … 0
Congo … 0 … 0 … … 4 … 0
Cook Islands … 0 … 0 0 … 0 … 0
Costa Rica … 0 … … 7 114 0 … 17
Côte d'Ivoire 32 … … … … 62 726 441 126 r …
Croatia … 0 … 0 … … 7 … 37
Cuba … 0 … … 248 … 0 … 1
Cyprus … 0 … … … … 18 … 2
Czech Republic … 0 … 1 … … 0 … 1 068
Democratic People's Republic of Korea … … … … … 13 393 … … 131
Democratic Republic of the Congo 13 884 … … … 5 049 2 417 780 5 407 5 176 m …
3. Selected infectious diseases

87
Tabl
e 3
Number of reported cases Member State
Pertu
ssis
b
Plag
ue g
Polio
mye
litis
h
Cong
enita
l ru
bella
sy
ndro
me b
Rube
lla b
Neon
atal
teta
nus b
Tota
l tet
anus
b
Tube
rcul
osis
i
Yello
w fe
ver b
2010 2011 2011 2010 2010 2010 2010 2010 2010
0 … 77 j 0 46 23 23 28 029 0 Afghanistan
0 … 0 0 5 0 1 431 0 Albania
0 … 0 0 212 0 0 22 336 0 Algeria
0 … 0 0 0 0 0 7 0 Andorra
2 539 … 5 … 38 13 490 44 655 0 Angola
0 … 0 0 0 0 0 6 0 Antigua and Barbuda
804 … 0 0 0 0 5 7 287 0 Argentina
4 … 0 0 0 0 3 1 410 0 Armenia
34 285 0 0 0 42 0 2 1 187 0 Australia
414 … 0 … 2 … 0 358 0 Austria
15 … 0 0 1 0 0 6 390 0 Azerbaijan
0 … 0 0 0 0 0 31 0 Bahamas
0 … 0 0 6 0 0 246 0 Bahrain
17 … 0 … 12 963 117 710 153 892 … Bangladesh
0 … 0 0 0 0 0 6 0 Barbados
112 … 0 0 0 0 2 5 003 0 Belarus
133 … 0 0 … 0 0 814 0 Belgium
0 … 0 0 0 0 0 145 0 Belize
53 … 0 … 1 3 82 3 756 0 Benin
0 … 0 0 87 0 … 1 311 0 Bhutan
0 … 0 0 0 0 0 8 345 3 Bolivia (Plurinational State of)
30 … 0 … 2 784 0 2 1 321 … Bosnia and Herzegovina
0 … 0 … 13 0 0 7 013 … Botswana
477 … 0 0 0 6 308 74 395 2 Brazil
1 … 0 0 1 0 0 237 … Brunei Darussalam
54 … 0 0 39 0 2 2 412 0 Bulgaria
13 … 0 … … 2 74 4 800 7 Burkina Faso
0 … 0 0 247 2 2 7 611 0 Burundi
372 0 0 … 85 19 … 40 460 … Cambodia
… … 0 … 48 29 83 24 073 16 Cameroon
759 … 0 0 12 0 3 1 322 0 Canada
0 … 0 16 28 0 0 356 0 Cape Verde
1 … 4 … 15 20 20 6 643 6 Central African Republic
… … 130 … 3 279 … 9 452 79 Chad
794 … 0 0 0 0 9 2 376 0 Chile
1 764 1 21 … 43 117 1 057 … 908 399 … China
344 … 0 0 0 2 71 11 420 0 Colombia
0 … 0 … 0 2 2 … 0 Comoros
0 … 1 0 10 2 2 10 150 0 Congo
0 0 0 0 0 0 0 0 0 Cook Islands
71 … 0 0 0 0 0 490 0 Costa Rica
… … 36 … 31 3 … 22 708 49 Côte d'Ivoire
42 … 0 0 1 0 4 688 0 Croatia
0 … 0 0 0 0 1 827 0 Cuba
0 … 0 0 0 0 0 33 0 Cyprus
662 … 0 0 4 0 0 627 0 Czech Republic
80 … 0 … 5 … … 84 648 … Democratic People's Republic of Korea
2 157 … 94 j … 130 990 1 038 114 170 289 Democratic Republic of the Congo
011010011001101001100110100110011010011001101001100110100110011010011010010110010111101010100101010100101100101111010101001010101001010010011010011001001101001100100110100110010011010011001001101001001010101001010101001010101001010101001010101001010101001010101001010101001010101001010101001010101001010101001010101001010101001101001100110100110011010011001101001100110100110011010011001101001101100010101100010101100010101100010101100010101100010101100010101011010011001101001100110100110011010011001101001100110100110011010010100101010010101011000100110100101010010101011000100110100101010010101010110001001101001101001011010100110001001101001101001011010100110001001100101111010010101001010010111101001010100101001011110100101010010100101011010011001101001100110100110011010011001101001100110100110011010010010100110100010100110100010100110100010100110100010100110100010100101101001100110100110011010011001101001100110100110011010011001101001111010010101001010111010010111101001010100101011101001011110100101010010101011010011001101001100110100110011010011001101001100110100110011010011001011110101010010110010111101010100101100101111010101001011001010110100110011010011001101001100110100110011010011001101001100110100101001011010000100101101000010010110100001001011010000100101101000010010101101001100110100110011010011001101001100110100110011010011001101001
0101011000100110100110100101101010101100010011010011010010110101010101101001100110100110011010011001101001100110100110011010011001101001101001011001011110101010010101010010110010111101010100101010100101001001101001100100110100110010011010011001001101001100100110100100101010100101010100101010100101010100101010100101010100101010100101010100101010100101010100101010100101010100101010100101010100110100110011010011001101001100110100110011010011001101001100110100110110001010110001010110001010110001010110001010110001010110001010101101001100110100110011010011001101001100110100110011010011001101001010010101001010101100010011010010101001010101100010011010010101001010101011000100110100110100101101010011000100110100110100101101010011000100110010111101001010100101001011110100101010010100101111010010101001010010101101001100110100110011010011001101001100110100110011010011001101001001010011010001010011010001010011010001010011010001010011010001010010110100110011010011001101001100110100110011010011001101001100110100111101001010100101011101001011110100101010010101110100101111010010101001010101101001100110100110011010011001101001100110100110011010011001101001100101111010101001011001011110101010010110010111101010100101100101
010010100110101010110010100101100101111010101001010100101010110001001

88
Member State Number of reported cases
Chol
era a
Diph
ther
ia b
H5N1
in
fluen
za c
Japa
nese
en
ceph
aliti
s b
Lepr
osy d
Mal
aria
e
Mea
sles
b
Men
ingi
tis f
Mum
ps b
2010 2010 2011 2009 2010 2010 2010 2011 2010
Denmark … 0 … … … … 5 … 32
Djibouti 2 047 0 … 0 1 1 019 7 … …
Dominica … 0 … … 0 … 0 … 0
Dominican Republic 191 4 … … 144 3 414 0 … 0
Ecuador … 0 … … 134 1 888 0 … 1 331
Egypt … 0 39 … 680 0 16 … 26
El Salvador … 0 … … 1 24 0 … 369
Equatorial Guinea … … … … 27 … 0 … …
Eritrea … 3 … … 11 35 982 51 … 2 410
Estonia … 0 … 0 … … 0 … 13
Ethiopia 1 682 … … … 4 430 1 158 197 4 235 229 s …
Fiji … … … 0 2 … 0 … 0
Finland … 0 … 0 … … 5 … 4
France … … … … … … 5 048 … …
Gabon … … … … 40 8 566 1 … …
Gambia … 0 … 0 42 116 353 2 … 0
Georgia … 0 … 0 … 0 22 … 101
Germany 4 k 8 … … … … 780 … …
Ghana 438 47 … 0 … 1 071 637 641 754 l 3 780
Greece … 0 … 0 … … 149 … 2
Grenada … 0 … … … … 0 … 0
Guatemala … 0 … … 3 7 198 0 … 0
Guinea … 0 … 0 549 … 45 … 0
Guinea-Bissau … 0 … 0 … … 26 … 0
Guyana … 0 … … 26 22 935 0 … 0
Haiti 179 379 0 … … 26 84 153 24 … 0
Honduras … 0 … … 2 9 629 0 … 172
Hungary … 0 … 0 … … 0 … 0
Iceland … 0 … 0 … … 0 … 2
India 5 155 3 123 … 5 171 126 800 1 599 986 29 808 … …
Indonesia … 385 12 … 17 012 229 819 16 529 … …
Iran (Islamic Republic of) … 106 … … 46 1 847 538 … …
Iraq 2 2 … … 0 0 492 … 1 862
Ireland … 0 … 0 … … 443 … 308
Israel … 0 … … 3 … 23 … 4 923
Italy … 0 … … 5 … 372 … 530
Jamaica … 0 … … … … 0 … 1
Japan … 0 … 4 4 … 450 … 179 635
Jordan … 0 … 0 0 … 0 … 162
Kazakhstan … 0 … 0 … … 4 … 82
Kenya 3 188 … … … 126 898 531 95 … …
Kiribati … 0 … 0 182 … 0 … 0
Kuwait … 0 … 0 21 … 13 … 91
Kyrgyzstan … 0 … … … 3 0 … 396
Lao People's Democratic Republic 237 34 … 82 86 20 800 153 … …
Latvia … 2 … 0 … … 0 … 3
Lebanon … 0 … 0 0 … 12 … 28
Lesotho … 0 … 0 7 … 2 488 … 0
3. Selected infectious diseases

89
Tabl
e 3
Number of reported cases Member State
Pertu
ssis
b
Plag
ue g
Polio
mye
litis
h
Cong
enita
l ru
bella
sy
ndro
me b
Rube
lla b
Neon
atal
teta
nus b
Tota
l tet
anus
b
Tube
rcul
osis
i
Yello
w fe
ver b
2010 2011 2011 2010 2010 2010 2010 2010 2010
77 … 0 0 0 0 0 313 … Denmark
0 … 0 5 … 0 0 4 172 0 Djibouti
0 … 0 0 0 0 1 8 0 Dominica
37 … 0 0 0 0 50 3 964 0 Dominican Republic
0 … 0 0 0 2 2 4 832 0 Ecuador
0 … 0 … 461 20 … 9 260 … Egypt
2 … 0 0 0 2 2 1 700 0 El Salvador
… … 0 … … 0 0 820 0 Equatorial Guinea
11 … 0 … 163 0 16 2 870 … Eritrea
1 295 … 0 0 0 0 0 283 0 Estonia
… … 0 … 130 75 75 154 694 … Ethiopia
0 0 0 0 0 0 0 189 0 Fiji
336 … 0 … 0 … … 312 0 Finland
… … 0 … … … 14 2 752 … France
… … 1 … 2 3 3 3 473 0 Gabon
0 … 0 0 14 0 0 2 070 0 Gambia
49 … 0 0 59 0 7 4 674 0 Georgia
… … 0 0 … … … 3 524 0 Germany
63 … 0 … … 1 79 14 607 155 Ghana
64 … 0 0 0 0 5 356 0 Greece
0 … 0 0 0 0 0 4 0 Grenada
0 … 0 0 0 0 2 3 322 0 Guatemala
0 … 3 0 3 64 … 11 038 2 Guinea
0 … 0 0 0 … 1 2 183 0 Guinea-Bissau
0 … 0 0 0 0 0 712 0 Guyana
0 … 0 0 0 0 0 14 222 0 Haiti
135 … 0 0 0 1 16 2 876 0 Honduras
25 … 0 0 0 0 0 1 543 0 Hungary
0 … 0 0 0 0 0 22 0 Iceland
38 493 … 1 … … 373 1 574 1 339 866 … India
… … 0 … 1 308 137 137 300 659 0 Indonesia
464 … 0 0 24 2 14 10 362 … Iran (Islamic Republic of)
2 034 … 0 … 15 11 25 9 707 … Iraq
107 … 0 0 29 0 0 319 0 Ireland
1 244 … 0 0 1 0 0 340 0 Israel
187 … 0 0 47 0 57 1 693 … Italy
0 … 0 0 0 0 3 130 0 Jamaica
5 406 0 0 0 89 0 104 22 693 0 Japan
0 … 0 0 0 0 0 338 0 Jordan
35 … 0 0 3 0 0 19 703 0 Kazakhstan
… … 1 … 473 7 7 99 272 0 Kenya
0 0 0 0 0 0 0 286 0 Kiribati
41 … 0 … 26 0 0 957 0 Kuwait
109 … 0 0 2 0 0 5 652 … Kyrgyzstan
6 0 0 … 31 7 14 3 999 … Lao People's Democratic Republic
9 … 0 0 0 0 0 913 0 Latvia
19 … 0 0 5 0 2 513 0 Lebanon
0 … 0 0 … 0 0 11 674 0 Lesotho
011010011001101001100110100110011010011001101001100110100110011010011010010110010111101010100101010100101100101111010101001010101001010010011010011001001101001100100110100110010011010011001001101001001010101001010101001010101001010101001010101001010101001010101001010101001010101001010101001010101001010101001010101001010101001101001100110100110011010011001101001100110100110011010011001101001101100010101100010101100010101100010101100010101100010101100010101011010011001101001100110100110011010011001101001100110100110011010010100101010010101011000100110100101010010101011000100110100101010010101010110001001101001101001011010100110001001101001101001011010100110001001100101111010010101001010010111101001010100101001011110100101010010100101011010011001101001100110100110011010011001101001100110100110011010010010100110100010100110100010100110100010100110100010100110100010100101101001100110100110011010011001101001100110100110011010011001101001111010010101001010111010010111101001010100101011101001011110100101010010101011010011001101001100110100110011010011001101001100110100110011010011001011110101010010110010111101010100101100101111010101001011001010110100110011010011001101001100110100110011010011001101001100110100101001011010000100101101000010010110100001001011010000100101101000010010101101001100110100110011010011001101001100110100110011010011001101001
0101011000100110100110100101101010101100010011010011010010110101010101101001100110100110011010011001101001100110100110011010011001101001101001011001011110101010010101010010110010111101010100101010100101001001101001100100110100110010011010011001001101001100100110100100101010100101010100101010100101010100101010100101010100101010100101010100101010100101010100101010100101010100101010100101010100110100110011010011001101001100110100110011010011001101001100110100110110001010110001010110001010110001010110001010110001010110001010101101001100110100110011010011001101001100110100110011010011001101001010010101001010101100010011010010101001010101100010011010010101001010101011000100110100110100101101010011000100110100110100101101010011000100110010111101001010100101001011110100101010010100101111010010101001010010101101001100110100110011010011001101001100110100110011010011001101001001010011010001010011010001010011010001010011010001010011010001010010110100110011010011001101001100110100110011010011001101001100110100111101001010100101011101001011110100101010010101110100101111010010101001010101101001100110100110011010011001101001100110100110011010011001101001100101111010101001011001011110101010010110010111101010100101100101
010010100110101010110010100101100101111010101001010100101010110001001

90
Member State Number of reported cases
Chol
era a
Diph
ther
ia b
H5N1
in
fluen
za c
Japa
nese
en
ceph
aliti
s b
Lepr
osy d
Mal
aria
e
Mea
sles
b
Men
ingi
tis f
Mum
ps b
2010 2010 2011 2009 2010 2010 2010 2011 2010
Liberia 1 546 0 … … 482 922 173 2 200 … …
Libya … … … … 7 … … … …
Lithuania … 0 … … … … 2 … 87
Luxembourg … 0 … 0 … … 0 … 0
Madagascar … 0 … 0 1 520 202 450 1 … 0
Malawi 1 155 0 … … 321 … 118 712 … …
Malaysia 443 t 3 … 0 194 5 819 73 … …
Maldives … 0 … 0 7 … 0 … 50
Mali … … … … 363 227 482 1 719 406 l …
Malta … 0 … 0 … … 0 … 2
Marshall Islands … … … 0 110 … 0 … 1
Mauritania … … … … … 1 994 1 292 … …
Mauritius … 0 … 0 3 … 12 … 2
Mexico 1 0 … … 211 1 226 0 … 0
Micronesia (Federated States of) … … … 0 117 … … … 684
Monaco … … … … … … … … …
Mongolia … 0 … 0 0 … 7 … 524
Montenegro … 0 … … … … 5 … 13
Morocco … 0 … … 40 3 633 … …
Mozambique 7 430 … … … 1 207 1 522 577 2 321 … …
Myanmar … 4 … 18 2 936 420 808 190 … …
Namibia … 0 … 0 42 556 3 138 … 0
Nauru … 0 … … 2 … … … 0
Nepal 1 790 146 … 183 3 118 3 894 190 … 29 022
Netherlands … … … … … … 15 … 562
New Zealand … 0 … 0 3 … 43 … 14
Nicaragua … 0 … … … 692 0 … 52
Niger 1 154 0 … 0 447 620 058 372 1 212 l 0
Nigeria 44 456 … … … 3 913 551 187 8 491 1 117 l …
Niue … 0 … 0 0 … 0 … 1
Norway … 0 … 0 1 … 3 … 12
Oman … 0 … 0 2 24 3 … 575
Pakistan 164 37 … … 396 240 591 4 321 … …
Palau … 0 … 0 3 … 0 … 0
Panama … 0 … … 0 418 0 … 81
Papua New Guinea 8 997 0 … … 281 93 956 0 … …
Paraguay … 0 … … 392 27 0 … 132
Peru … 0 … … 13 26 847 0 … 0
Philippines 33 107 … 181 2 041 18 560 6 368 … …
Poland … 0 … 0 … … 13 … 2 754
Portugal … 0 … … 15 … 5 … 140
Qatar … 0 … 0 35 … 295 … 151
Republic of Korea 1 k 0 … 26 6 1 721 114 … 6 104
Republic of Moldova … 0 … 0 … … 0 … 144
Romania … 0 … 0 … … 193 … 286
Russian Federation 3 k 9 … … … 1 129 … 510
Rwanda … 0 … … 36 638 669 121 … …
Saint Kitts and Nevis … 0 … … 1 … 0 … 0
3. Selected infectious diseases

91
Tabl
e 3
Number of reported cases Member State
Pertu
ssis
b
Plag
ue g
Polio
mye
litis
h
Cong
enita
l ru
bella
sy
ndro
me b
Rube
lla b
Neon
atal
teta
nus b
Tota
l tet
anus
b
Tube
rcul
osis
i
Yello
w fe
ver b
2010 2011 2011 2010 2010 2010 2010 2010 2010
… … 0 … 0 4 4 6 597 1 Liberia
… … 0 … … … … … … Libya
19 … 0 0 2 0 2 1 750 … Lithuania
0 … 0 0 0 … 0 24 0 Luxembourg
0 … 0 0 157 6 6 24 432 0 Madagascar
0 … 0 … 28 4 4 21 092 … Malawi
41 … 0 0 104 10 28 18 517 0 Malaysia
0 … 0 0 4 0 0 95 0 Maldives
… … 7 … 64 7 86 5 291 3 Mali
2 … 0 0 0 0 0 20 0 Malta
0 0 0 0 0 0 0 190 0 Marshall Islands
… … 0 … … 1 1 2 461 … Mauritania
1 … 0 0 2 0 0 122 0 Mauritius
0 … 0 0 0 0 0 19 570 0 Mexico
… 0 0 … … … … 160 0 Micronesia (Federated States of)
… … 0 … … … … 1 … Monaco
0 1 0 0 11 0 0 4 458 0 Mongolia
1 … 0 … 3 0 0 110 … Montenegro
15 … 0 … 5 7 20 28 359 … Morocco
0 … 2 j … 70 72 … 43 558 … Mozambique
0 … 0 … 11 19 96 131 590 … Myanmar
0 … 0 0 22 10 13 11 281 0 Namibia
0 0 0 0 … 0 0 3 0 Nauru
2 293 … 0 … 510 13 547 35 114 … Nepal
2 912 … 0 … 0 … … 1 029 … Netherlands
462 0 0 0 2 0 6 301 0 New Zealand
24 … 0 0 0 0 1 2 448 0 Nicaragua
30 … 6 j 0 5 13 146 10 130 0 Niger
… … 80 j … 450 176 199 84 121 0 Nigeria
0 0 0 0 0 0 0 0 0 Niue
3 565 … 0 0 0 0 0 274 0 Norway
32 … 0 0 2 0 2 308 0 Oman
109 … 192 … … 508 559 261 199 … Pakistan
0 0 0 0 0 0 0 19 0 Palau
22 … 0 0 0 0 1 1 496 0 Panama
4 949 0 0 … 5 32 32 14 531 … Papua New Guinea
1 … 0 0 0 2 8 2 277 0 Paraguay
64 … 0 0 0 5 47 31 073 18 Peru
62 … 0 … … 126 1 140 166 323 … Philippines
1 266 … 0 1 4 196 0 16 7 002 0 Poland
14 … 0 0 0 0 3 2 487 … Portugal
11 … 0 0 23 0 0 580 0 Qatar
18 0 0 0 21 0 14 41 889 0 Republic of Korea
31 … 0 0 0 0 2 4 122 0 Republic of Moldova
29 … 0 0 350 0 9 18 379 0 Romania
4 795 … 0 1 547 … 13 118 641 … Russian Federation
0 … 0 … 36 0 0 6 703 … Rwanda
0 … 0 0 0 0 0 2 0 Saint Kitts and Nevis
011010011001101001100110100110011010011001101001100110100110011010011010010110010111101010100101010100101100101111010101001010101001010010011010011001001101001100100110100110010011010011001001101001001010101001010101001010101001010101001010101001010101001010101001010101001010101001010101001010101001010101001010101001010101001101001100110100110011010011001101001100110100110011010011001101001101100010101100010101100010101100010101100010101100010101100010101011010011001101001100110100110011010011001101001100110100110011010010100101010010101011000100110100101010010101011000100110100101010010101010110001001101001101001011010100110001001101001101001011010100110001001100101111010010101001010010111101001010100101001011110100101010010100101011010011001101001100110100110011010011001101001100110100110011010010010100110100010100110100010100110100010100110100010100110100010100101101001100110100110011010011001101001100110100110011010011001101001111010010101001010111010010111101001010100101011101001011110100101010010101011010011001101001100110100110011010011001101001100110100110011010011001011110101010010110010111101010100101100101111010101001011001010110100110011010011001101001100110100110011010011001101001100110100101001011010000100101101000010010110100001001011010000100101101000010010101101001100110100110011010011001101001100110100110011010011001101001
0101011000100110100110100101101010101100010011010011010010110101010101101001100110100110011010011001101001100110100110011010011001101001101001011001011110101010010101010010110010111101010100101010100101001001101001100100110100110010011010011001001101001100100110100100101010100101010100101010100101010100101010100101010100101010100101010100101010100101010100101010100101010100101010100101010100110100110011010011001101001100110100110011010011001101001100110100110110001010110001010110001010110001010110001010110001010110001010101101001100110100110011010011001101001100110100110011010011001101001010010101001010101100010011010010101001010101100010011010010101001010101011000100110100110100101101010011000100110100110100101101010011000100110010111101001010100101001011110100101010010100101111010010101001010010101101001100110100110011010011001101001100110100110011010011001101001001010011010001010011010001010011010001010011010001010011010001010010110100110011010011001101001100110100110011010011001101001100110100111101001010100101011101001011110100101010010101110100101111010010101001010101101001100110100110011010011001101001100110100110011010011001101001100101111010101001011001011110101010010110010111101010100101100101
010010100110101010110010100101100101111010101001010100101010110001001

92
Member State Number of reported cases
Chol
era a
Diph
ther
ia b
H5N1
in
fluen
za c
Japa
nese
en
ceph
aliti
s b
Lepr
osy d
Mal
aria
e
Mea
sles
b
Men
ingi
tis f
Mum
ps b
2010 2010 2011 2009 2010 2010 2010 2011 2010
Saint Lucia … 0 … … 4 … 0 … 0
Saint Vincent and the Grenadines … 0 … … … … 0 … 0
Samoa … 0 … 0 12 … 8 … 1
San Marino … 0 … 0 … … 0 … 2
Sao Tome and Principe … 0 … … 0 2 740 0 … …
Saudi Arabia … 0 … 0 5 29 334 … 610
Senegal 3 … … … … … 428 … …
Serbia … 0 … … … … 20 … 40
Seychelles … 0 … 0 1 … 0 … 0
Sierra Leone … … … … 382 934 028 1 089 … …
Singapore … 0 … 1 11 … 50 … 452
Slovakia … 0 … 0 … … 0 … 2
Slovenia … 0 … 0 … … 2 … 5
Solomon Islands … 0 … 0 14 40 682 0 … …
Somalia 3 510 … … … 47 24 553 115 … …
South Africa … … … … … 3 875 … … …
Spain … 0 … 0 10 … 302 … 2 516
Sri Lanka … 0 … 27 2 027 632 79 … 897
Sudan … 1 … … 2 394 1 620 840 680 … …
Suriname … 0 … … 28 791 0 … 0
Swaziland … 0 … … … 147 313 … 7 602
Sweden … 0 … 1 … … 6 … 24
Switzerland … 0 … … … … 77 … 1 300
Syrian Arab Republic … 0 … 0 1 0 26 … 145
Tajikistan … 0 … … … 111 0 … 1 558
Thailand 1 974 65 … 36 405 32 480 2 534 … 15 165
The former Yugoslav Republic of Macedonia … 0 … … … … 217 … 242
Timor-Leste … 0 … 0 87 48 137 50 … 0
Togo 72 0 … … … 617 101 120 371 u …
Tonga … 0 … 0 0 … 0 … 0
Trinidad and Tobago … 0 … … 17 … 0 … 0
Tunisia … 0 … … 2 … 1 … …
Turkey … 0 … … 5 9 7 … 1 525
Turkmenistan … 2 … … … 0 0 … 61
Tuvalu … 0 … … 0 … 0 … 0
Uganda 2 341 … … … 342 1 581 160 1 313 … …
Ukraine … 17 … … … … 39 … 951
United Arab Emirates … 1 … … 10 … 87 … 396
United Kingdom 8 k 0 … 0 2 … 443 … 4 527
United Republic of Tanzania 4 469 0 … … 2 349 … 167 … …
United States of America 15 k … … … 169 … … … …
Uruguay … 0 … … 11 … 0 … 169
Uzbekistan … 0 … 0 … 3 117 … 1 418
Vanuatu … 0 … … 3 8 169 0 … …
Venezuela (Bolivarian Republic of) … 0 … … 636 45 155 0 … 3 353
Viet Nam 606 6 … 140 359 17 515 2 809 … …
Yemen 300 7 … … 339 106 697 510 … 4 685
Zambia 6 794 0 … 0 374 … 15 754 … …
Zimbabwe 951 0 … … 10 249 379 9 696 … …
3. Selected infectious diseases

93
Tabl
e 3
Number of reported cases Member State
Pertu
ssis
b
Plag
ue g
Polio
mye
litis
h
Cong
enita
l ru
bella
sy
ndro
me b
Rube
lla b
Neon
atal
teta
nus b
Tota
l tet
anus
b
Tube
rcul
osis
i
Yello
w fe
ver b
2010 2011 2011 2010 2010 2010 2010 2010 2010
0 … 0 0 0 0 0 9 0 Saint Lucia
0 … 0 0 0 0 0 15 0 Saint Vincent and the Grenadines
22 0 0 0 0 0 0 14 0 Samoa
0 … 0 0 0 0 0 … 0 San Marino
0 … 0 … … 0 0 121 0 Sao Tome and Principe
0 … 0 0 35 4 10 4 422 0 Saudi Arabia
… … 0 … 50 12 21 11 061 1 Senegal
1 … 0 0 14 0 2 2 326 … Serbia
2 … 0 0 0 0 0 17 0 Seychelles
… … 0 … 2 5 … 12 859 0 Sierra Leone
8 … 0 0 158 0 0 1 560 0 Singapore
1 379 … 0 0 0 0 0 386 0 Slovakia
610 … 0 0 0 0 0 169 0 Slovenia
0 0 0 0 0 0 0 338 0 Solomon Islands
665 … 7 j … … 74 … 10 139 … Somalia
… … 0 … … … … 354 786 … South Africa
739 … 0 0 9 0 9 6 377 0 Spain
2 … 0 8 68 1 11 9 547 0 Sri Lanka
209 … 0 … 345 260 273 26 131 … Sudan
0 … 0 0 0 0 1 … 0 Suriname
6 … 0 0 93 0 1 10 101 … Swaziland
266 … 0 0 3 0 0 552 0 Sweden
3 800 … 0 0 12 … 1 323 … Switzerland
70 … 0 0 20 5 6 3 666 0 Syrian Arab Republic
12 … 0 0 6 0 4 6 297 … Tajikistan
6 … 0 0 388 4 172 66 397 0 Thailand
2 … 0 … 3 0 1 384 0 The former Yugoslav Republic of Macedonia
0 … 0 … … 7 9 … … Timor-Leste
53 … 0 … 80 28 28 2 791 0 Togo
0 0 0 0 0 0 0 11 0 Tonga
0 … 0 0 0 0 0 219 0 Trinidad and Tobago
4 … 0 … 164 0 3 2 368 … Tunisia
48 … 0 0 64 2 25 15 879 0 Turkey
0 … 0 0 0 … 0 3 230 … Turkmenistan
0 0 0 0 0 0 0 14 … Tuvalu
… … 0 … … 98 1 822 42 885 106 Uganda
1 067 … 0 … 2 333 … 13 33 857 … Ukraine
79 … 0 … 34 0 4 131 0 United Arab Emirates
518 … 0 0 31 0 9 7 219 0 United Kingdom
0 … 0 … 121 5 5 61 098 … United Republic of Tanzania
… … 0 … … … … 11 181 … United States of America
36 … 0 0 0 0 3 699 0 Uruguay
33 … 0 0 1 0 0 16 883 0 Uzbekistan
0 0 0 … … 0 0 116 … Vanuatu
0 … 0 0 0 2 13 6 335 0 Venezuela (Bolivarian Republic of)
81 … 0 … 2 300 35 196 94 867 … Viet Nam
2 534 … 5 j … 187 93 93 8 916 0 Yemen
0 … 0 0 13 0 0 44 154 0 Zambia
0 … 0 … … 1 1 44 209 … Zimbabwe
011010011001101001100110100110011010011001101001100110100110011010011010010110010111101010100101010100101100101111010101001010101001010010011010011001001101001100100110100110010011010011001001101001001010101001010101001010101001010101001010101001010101001010101001010101001010101001010101001010101001010101001010101001010101001101001100110100110011010011001101001100110100110011010011001101001101100010101100010101100010101100010101100010101100010101100010101011010011001101001100110100110011010011001101001100110100110011010010100101010010101011000100110100101010010101011000100110100101010010101010110001001101001101001011010100110001001101001101001011010100110001001100101111010010101001010010111101001010100101001011110100101010010100101011010011001101001100110100110011010011001101001100110100110011010010010100110100010100110100010100110100010100110100010100110100010100101101001100110100110011010011001101001100110100110011010011001101001111010010101001010111010010111101001010100101011101001011110100101010010101011010011001101001100110100110011010011001101001100110100110011010011001011110101010010110010111101010100101100101111010101001011001010110100110011010011001101001100110100110011010011001101001100110100101001011010000100101101000010010110100001001011010000100101101000010010101101001100110100110011010011001101001100110100110011010011001101001
0101011000100110100110100101101010101100010011010011010010110101010101101001100110100110011010011001101001100110100110011010011001101001101001011001011110101010010101010010110010111101010100101010100101001001101001100100110100110010011010011001001101001100100110100100101010100101010100101010100101010100101010100101010100101010100101010100101010100101010100101010100101010100101010100101010100110100110011010011001101001100110100110011010011001101001100110100110110001010110001010110001010110001010110001010110001010110001010101101001100110100110011010011001101001100110100110011010011001101001010010101001010101100010011010010101001010101100010011010010101001010101011000100110100110100101101010011000100110100110100101101010011000100110010111101001010100101001011110100101010010100101111010010101001010010101101001100110100110011010011001101001100110100110011010011001101001001010011010001010011010001010011010001010011010001010011010001010010110100110011010011001101001100110100110011010011001101001100110100111101001010100101011101001011110100101010010101110100101111010010101001010101101001100110100110011010011001101001100110100110011010011001101001100101111010101001011001011110101010010110010111101010100101100101
010010100110101010110010100101100101111010101001010100101010110001001

94
Member State Number of reported cases
Chol
era a
Diph
ther
ia b
H5N1
in
fluen
za c
Japa
nese
en
ceph
aliti
s b
Lepr
osy d
Mal
aria
e
Mea
sles
b
Men
ingi
tis f
Mum
ps b
2010 2010 2011 2009 2010 2010 2010 2011 2010
Ranges of country valuesMinimum 1 0 1 0 0 0 0 126 0
Median 951 0 8 0 32 11 511 14 754 35
Maximum 179 379 3 123 39 5 171 126 800 2 417 780 118 712 5 863 298 932
WHO regionAfrican Region 109 549 … … … 25 345 18 133 811 186 675 22 000 …
Region of the Americas 179 588 41 … … 37 740 670 770 208 … 24 608
South-East Asia Region 8 919 3 750 … 5 450 156 254 2 440 812 50 265 … …
European Region … 39 … … … … 30 625 … 27 013
Eastern Mediterranean Region … 154 … … 4 080 2 065 000 10 072 … …
Western Pacific Region 11 065 153 9 3 016 5 028 261 568 49 460 … 486 449
Income groupLow income 233 219 183 … … 29 610 15 503 339 155 738 … …
Lower middle income 81 507 3 773 … 5 601 159 452 7475588 94 055 … …
Upper middle income 2 769 222 1 2 577 39 065 591 437 68 146 … 339 191
High income 33 9 … … 361 … 9 366 … 207 772
Global 317 528 4 187 … 8 468 228 488 23 572 138 327 305 … 606 166
a Cholera annual report 2010. Weekly Epidemiological Record, No. 31, 2010, 86:325–340 (http://www.who.int/wer).
b Data provided by Member States through the WHO/UNICEF Joint Reporting Form and WHO regional offices. Geneva, World Health Organization, 2011 (http://www.who.int/immunization_monitoring/data/en/ – September 2011 update).
c Cumulative number of confirmed human cases of avian influenza A(H5N1) reported to WHO. Geneva, World Health Organization, 2012 (http://www.who.int/influenza/hu-man_animal_interface/H5N1_cumulative_table_archives/en/index.html – accessed 15 January 2012).
d Leprosy update 2011. Weekly Epidemiological Record, No. 36, 2011, 86:389–400 (http://www.who.int/wer).
e World malaria report 2011. Annex: 6B Malaria trends 1, 1990–2010. Geneva, World Health Organization, 2011 (http://www.who.int/malaria/world_malaria_report_2011/). Figures refer to confirmed malaria cases.
f Suspected meningitis cases reported to WHO Global Alert and Response (GAR) in African countries under enhanced surveillance up to 28 November 2011.
g Plague cases reported to WHO Global Alert and Response (GAR) as of January 2012.h Data from World Health Organization, Polio Eradication Initiative, as of 10 January 2012
(Updated information can be found at: http://www.who.int/immunization_monitoring/en/diseases/poliomyelitis/case_count.cfm). Afghanistan, India, Nigeria and Pakistan are currently endemic countries. For non-endemic countries, cases are the result of importation.
i The number of new and relapse tuberculosis cases diagnosed and treated in national tuberculosis control programmes and notified to WHO. Global tuberculosis control 2011. Geneva, World Health Organization, 2011 (http://www.who.int/tb/publications/global_report/). WHO regional, income-group and global aggregates include territories.
j Confirmed polio cases refer to any circulating polioviruses from cases of Acute Flaccid Paralysis (wild poliovirus and circulating Vaccine Derived Poliovirus – cVDPV). Figures include one cVDPV in Afghanistan and the Niger, two cVDPVs in the Democratic Re-public of the Congo and Mozambique, five cVDPVs in Yemen, seven cVDPVs in Soma-lia and 28 cVDPVs in Nigeria.
k All reported cases are imported.l Number of cases reported up to 27 November 2011.m Number of cases reported up to 10 July 2011.n One of two reported cases is imported.o Number of cases reported up to 4 September 2011.p Number of cases reported up to 2 October 2011.q Five of 157 reported cases are imported.r Number of cases reported up to 30 October 2011.s Number of cases reported up to 5 June 2011.t 227 of 443 reported cases are imported.u Number of cases reported up to 13 November 2011.
3. Selected infectious diseases

95
Tabl
e 3
Number of reported cases Member State
Pertu
ssis
b
Plag
ue g
Polio
mye
litis
h
Cong
enita
l ru
bella
sy
ndro
me b
Rube
lla b
Neon
atal
teta
nus b
Tota
l tet
anus
b
Tube
rcul
osis
i
Yello
w fe
ver b
2010 2011 2011 2010 2010 2010 2010 2010 2010
0 0 0 0 0 0 0 0 0 Minimum
9 0 0 0 3 0 2 3 053 0 Median
38 493 1 192 16 43 117 1 057 1 822 1 339 866 289 Maximum
… … 370 … 2 754 1 937 4 311 1 380 294 714 African Region
3 570 … 0 0 12 22 547 213 851 23 Region of the Americas
40 891 … 1 … … 671 3 256 2 123 119 … South-East Asia Region
26 112 … 0 2 10 551 2 206 300 355 0 European Region
6 286 … 281 … 1 398 1 007 1 034 409 834 … Eastern Mediterranean Region
47 477 2 21 … 45 966 1 286 … 1 326 291 … Western Pacific Region
5 866 … 331 … 15 370 1 952 4 799 1 210 247 … Low income
52 540 … 320 … … 1 864 5 019 2 654 563 … Lower middle income
10 100 1 22 … 47 872 1 105 … 1 764 620 … Upper middle income
60 759 … 0 1 4 786 4 263 124 303 0 High income
129 265 … 673 … 76 025 4 925 10 890 5 753 744 … Global
011010011001101001100110100110011010011001101001100110100110011010011010010110010111101010100101010100101100101111010101001010101001010010011010011001001101001100100110100110010011010011001001101001001010101001010101001010101001010101001010101001010101001010101001010101001010101001010101001010101001010101001010101001010101001101001100110100110011010011001101001100110100110011010011001101001101100010101100010101100010101100010101100010101100010101100010101011010011001101001100110100110011010011001101001100110100110011010010100101010010101011000100110100101010010101011000100110100101010010101010110001001101001101001011010100110001001101001101001011010100110001001100101111010010101001010010111101001010100101001011110100101010010100101011010011001101001100110100110011010011001101001100110100110011010010010100110100010100110100010100110100010100110100010100110100010100101101001100110100110011010011001101001100110100110011010011001101001111010010101001010111010010111101001010100101011101001011110100101010010101011010011001101001100110100110011010011001101001100110100110011010011001011110101010010110010111101010100101100101111010101001011001010110100110011010011001101001100110100110011010011001101001100110100101001011010000100101101000010010110100001001011010000100101101000010010101101001100110100110011010011001101001100110100110011010011001101001
0101011000100110100110100101101010101100010011010011010010110101010101101001100110100110011010011001101001100110100110011010011001101001101001011001011110101010010101010010110010111101010100101010100101001001101001100100110100110010011010011001001101001100100110100100101010100101010100101010100101010100101010100101010100101010100101010100101010100101010100101010100101010100101010100101010100110100110011010011001101001100110100110011010011001101001100110100110110001010110001010110001010110001010110001010110001010110001010101101001100110100110011010011001101001100110100110011010011001101001010010101001010101100010011010010101001010101100010011010010101001010101011000100110100110100101101010011000100110100110100101101010011000100110010111101001010100101001011110100101010010100101111010010101001010010101101001100110100110011010011001101001100110100110011010011001101001001010011010001010011010001010011010001010011010001010011010001010010110100110011010011001101001100110100110011010011001101001100110100111101001010100101011101001011110100101010010101110100101111010010101001010101101001100110100110011010011001101001100110100110011010011001101001100101111010101001011001011110101010010110010111101010100101100101
010010100110101010110010100101100101111010101001010100101010110001001

96
4. Health service coverage
Health service coverage indicators reflect the extent to which people in need actually receive important health interventions. Such interventions include reproductive-health services; the provision of skilled care to women during pregnancy and childbirth; immunization to prevent common childhood infec-tions; vitamin A supplementation in children; and the prevention and treatment of disease in children, adolescents and adults.
Table 4 presents data on the following related MDG indicators: unmet need for family planning; con-traceptive prevalence; antenatal care coverage; births attended by skilled health personnel; measles immunization coverage among 1-year-olds; children aged <5 years sleeping under insecticide-treated nets; children aged <5 years with fever who received treatment with any antimalarial; antiretroviral therapy coverage among people with advanced HIV infection; case-detection rate for all forms of tu-berculosis; and treatment-success rate for smear-positive tuberculosis.
Data are also presented on births by caesarean section; postnatal care coverage; neonates protected at birth against neonatal tetanus; 1-year-olds immunized against diphtheria, tetanus and pertussis, hepatitis B and Haemophilus influenzae type B; children aged 6–59 months who received vitamin A supplementation; children aged <5 years with acute respiratory infection (ARI) symptoms taken to a health facility; children aged <5 years with ARI symptoms receiving antibiotics; children aged <5 with diarrhoea receiving oral rehydration therapy (ORT); and coverage of antiretroviral therapy among preg-nant women with HIV to prevent mother-to-child transmission (MTCT).
Coverage indicators are typically calculated by dividing the number of people receiving a defined in-tervention by the population eligible for – or in need of – the intervention. For example, immunization coverage among 1-year-old children can be calculated from the number of children having received a specific vaccine divided by the total population of 1-year-old children in each country. For indicators on antenatal care, births attended by skilled health personnel and births by caesarean section, the denominator is the total number of live births in the defined population.
The main sources of data on health service coverage are household surveys and completed question-naires on health service use. The principal types of surveys used are the UNICEF Multiple Indicator Cluster Survey (MICS), the Demographic and Health Survey (DHS) and country health and economic surveys. Other sources of data include the administrative records of routine service provision, which provide data on the numerator. The denominator is estimated on the basis of census projections. It should be borne in mind that administrative records tend to overestimate coverage as a result of double counting in the numerator and uncertainty in the denominator. Although household surveys are generally considered to be more reliable, these are subject to respondent reporting errors as well as to margins of uncertainty due to sampling errors. In generating global estimates, it is good practice to reconcile data from multiple sources in order to maximize the accuracy of all estimates.

97
Tabl
e 4
Unavoidable terminology differences also exist between countries making standardization difficult. For example, there are significant variations across countries in the precise skills and training of health workers classified as “skilled birth attendants”. Indicator definitions may also change over time. As a re-sult of these and other issues, there may be limitations in the comparability of results across countries and over time. WHO regional aggregates are not available for several coverage indicators, reflecting both the limited availability of data for several indicators, and the fact that some conditions (such as malaria) are not of public health significance in all countries.
011010011001101001100110100110011010011001101001100110100110011010011010010110010111101010100101010100101100101111010101001010101001010010011010011001001101001100100110100110010011010011001001101001001010101001010101001010101001010101001010101001010101001010101001010101001010101001010101001010101001010101001010101001010101001101001100110100110011010011001101001100110100110011010011001101001101100010101100010101100010101100010101100010101100010101100010101011010011001101001100110100110011010011001101001100110100110011010010100101010010101011000100110100101010010101011000100110100101010010101010110001001101001101001011010100110001001101001101001011010100110001001100101111010010101001010010111101001010100101001011110100101010010100101011010011001101001100110100110011010011001101001100110100110011010010010100110100010100110100010100110100010100110100010100110100010100101101001100110100110011010011001101001100110100110011010011001101001111010010101001010111010010111101001010100101011101001011110100101010010101011010011001101001100110100110011010011001101001100110100110011010011001011110101010010110010111101010100101100101111010101001011001010110100110011010011001101001100110100110011010011001101001100110100101001011010000100101101000010010110100001001011010000100101101000010010101101001100110100110011010011001101001100110100110011010011001101001
0101011000100110100110100101101010101100010011010011010010110101010101101001100110100110011010011001101001100110100110011010011001101001101001011001011110101010010101010010110010111101010100101010100101001001101001100100110100110010011010011001001101001100100110100100101010100101010100101010100101010100101010100101010100101010100101010100101010100101010100101010100101010100101010100101010100110100110011010011001101001100110100110011010011001101001100110100110110001010110001010110001010110001010110001010110001010110001010101101001100110100110011010011001101001100110100110011010011001101001010010101001010101100010011010010101001010101100010011010010101001010101011000100110100110100101101010011000100110100110100101101010011000100110010111101001010100101001011110100101010010100101111010010101001010010101101001100110100110011010011001101001100110100110011010011001101001001010011010001010011010001010011010001010011010001010011010001010010110100110011010011001101001100110100110011010011001101001100110100111101001010100101011101001011110100101010010101110100101111010010101001010101101001100110100110011010011001101001100110100110011010011001101001100101111010101001011001011110101010010110010111101010100101100101
010010100110101010110010100101100101111010101001010100101010110001001
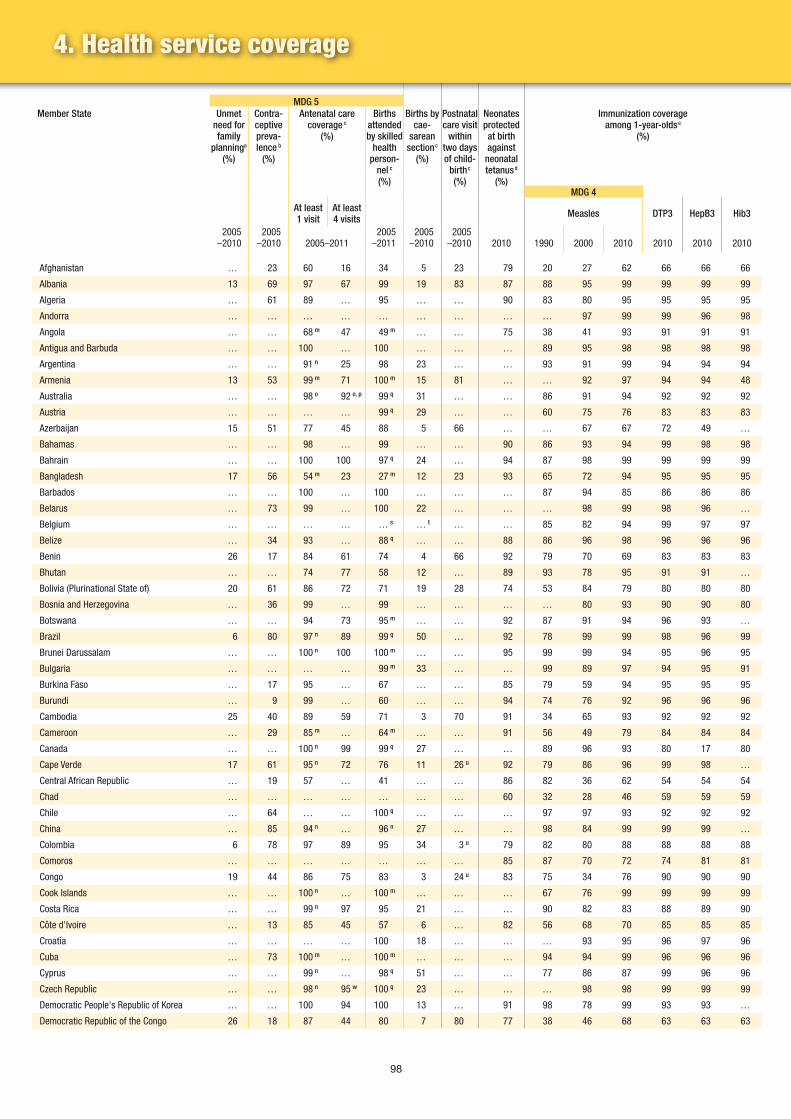
98
MDG 5Member State Unmet
need for family
planninga (%)
Contra-ceptive preva- lence b
(%)
Antenatal care coverage c
(%)
Births attended by skilled
health person-
nel c (%)
Births by cae-
sarean section c
(%)
Postnatal care visit
within two days of child-
birth c (%)
Neonates protected at birth against
neonatal tetanus d
(%)
Immunization coverage among 1-year-olds e
(%)
MDG 4
At least 1 visit
At least 4 visits Measles DTP3 HepB3 Hib3
2005 –2010
2005 –2010 2005–2011
2005 –2011
2005 –2010
2005 –2010 2010 1990 2000 2010 2010 2010 2010
Afghanistan … 23 60 16 34 5 23 79 20 27 62 66 66 66
Albania 13 69 97 67 99 19 83 87 88 95 99 99 99 99
Algeria … 61 89 … 95 … … 90 83 80 95 95 95 95
Andorra … … … … … … … … … 97 99 99 96 98
Angola … … 68 m 47 49 m … … 75 38 41 93 91 91 91
Antigua and Barbuda … … 100 … 100 … … … 89 95 98 98 98 98
Argentina … … 91 n 25 98 23 … … 93 91 99 94 94 94
Armenia 13 53 99 m 71 100 m 15 81 … … 92 97 94 94 48
Australia … … 98 o 92 o, p 99 q 31 … … 86 91 94 92 92 92
Austria … … … … 99 q 29 … … 60 75 76 83 83 83
Azerbaijan 15 51 77 45 88 5 66 … … 67 67 72 49 …
Bahamas … … 98 … 99 … … 90 86 93 94 99 98 98
Bahrain … … 100 100 97 q 24 … 94 87 98 99 99 99 99
Bangladesh 17 56 54 m 23 27 m 12 23 93 65 72 94 95 95 95
Barbados … … 100 … 100 … … … 87 94 85 86 86 86
Belarus … 73 99 … 100 22 … … … 98 99 98 96 …
Belgium … … … … … s … t … … 85 82 94 99 97 97
Belize … 34 93 … 88 q … … 88 86 96 98 96 96 96
Benin 26 17 84 61 74 4 66 92 79 70 69 83 83 83
Bhutan … … 74 77 58 12 … 89 93 78 95 91 91 …
Bolivia (Plurinational State of) 20 61 86 72 71 19 28 74 53 84 79 80 80 80
Bosnia and Herzegovina … 36 99 … 99 … … … … 80 93 90 90 80
Botswana … … 94 73 95 m … … 92 87 91 94 96 93 …
Brazil 6 80 97 n 89 99 q 50 … 92 78 99 99 98 96 99
Brunei Darussalam … … 100 n 100 100 m … … 95 99 99 94 95 96 95
Bulgaria … … … … 99 m 33 … … 99 89 97 94 95 91
Burkina Faso … 17 95 … 67 … … 85 79 59 94 95 95 95
Burundi … 9 99 … 60 … … 94 74 76 92 96 96 96
Cambodia 25 40 89 59 71 3 70 91 34 65 93 92 92 92
Cameroon … 29 85 m … 64 m … … 91 56 49 79 84 84 84
Canada … … 100 n 99 99 q 27 … … 89 96 93 80 17 80
Cape Verde 17 61 95 n 72 76 11 26 u 92 79 86 96 99 98 …
Central African Republic … 19 57 … 41 … … 86 82 36 62 54 54 54
Chad … … … … … … … 60 32 28 46 59 59 59
Chile … 64 … … 100 q … … … 97 97 93 92 92 92
China … 85 94 n … 96 n 27 … … 98 84 99 99 99 …
Colombia 6 78 97 89 95 34 3 u 79 82 80 88 88 88 88
Comoros … … … … … … … 85 87 70 72 74 81 81
Congo 19 44 86 75 83 3 24 u 83 75 34 76 90 90 90
Cook Islands … … 100 n … 100 m … … … 67 76 99 99 99 99
Costa Rica … … 99 n 97 95 21 … … 90 82 83 88 89 90
Côte d'Ivoire … 13 85 45 57 6 … 82 56 68 70 85 85 85
Croatia … … … … 100 18 … … … 93 95 96 97 96
Cuba … 73 100 m … 100 m … … … 94 94 99 96 96 96
Cyprus … … 99 n … 98 q 51 … … 77 86 87 99 96 96
Czech Republic … … 98 n 95 w 100 q 23 … … … 98 98 99 99 99
Democratic People's Republic of Korea … … 100 94 100 13 … 91 98 78 99 93 93 …
Democratic Republic of the Congo 26 18 87 44 80 7 80 77 38 46 68 63 63 63
4. Health service coverage

99
Tabl
e 4
MDG 6Children
aged 6–59 months who
received vitamin A
supplemen-tation f
(%)
Children aged <5 years (%)
MDG 6
Pregnant women with HIV receiving antiretro-virals to prevent MTCT i
(%)
Antiret-roviral
therapy coverage among people
with ad-vanced HIV infection j
(%)
Case-detection rate for all forms of
tuberculosis k (%)
Treatment-success rate for
smear-positive tuberculosis l
(%)
Member State
With ARI symptoms taken to a health facility f
With ARI symptoms receiving
anti biotics f
With diar-rhoea
receiving ORT
(ORS and/or RHF) f
Sleep-ing under
insecticide-treated nets g
With fever who
received treatment with any
antimalarial h
2005–10 2005–2011 2005–2009 2005–2010 2010 2010 2000 2010 2000 2009
… … … … 4 … … 3 16 47 85 86 Afghanistan
… 70 60 68 … … … … 87 97 … 89 Albania
… 53 59 27 … … … 32 70 70 87 91 Algeria
… … … … … … … … 95 110 50 100 Andorra
… … … … 18 29 20 33 46 77 68 72 Angola
… … … … … … … … 110 140 100 67 Antigua and Barbuda
… … … … … … … 79 79 66 47 46 Argentina
<1 32 11 42 … … … 30 61 62 87 73 Armenia
… … … … … … … … 89 84 72 80 Australia
… … … … … … … … 92 84 73 66 Austria
9 33 … 31 … … … 32 58 63 90 62 Azerbaijan
… … … … … … … … 99 79 … 81 Bahamas
… … … … … … … … 94 84 73 98 Bahrain
84 r 57 … 81 … … … 33 26 46 81 92 Bangladesh
… … … … … … … … 47 130 … 100 Barbados
… 90 67 85 … … … 51 91 74 … 64 Belarus
… … … … … … … … 87 … 66 … Belgium
24 71 44 61 … … … 53 110 120 78 … Belize
61 36 … 30 20 54 21 58 49 45 78 90 Benin
… 74 49 81 … … … 27 79 120 90 92 Bhutan
25 51 64 44 … … … 20 66 62 79 86 Bolivia (Plurinational State of)
… 91 73 65 … … … … 110 71 94 99 Bosnia and Herzegovina
… … … … … … >95 93 58 70 77 79 Botswana
… 52 … 52 … … … 70 74 88 71 72 Brazil
… … … … … … … … 94 88 63 71 Brunei Darussalam
… … … … … … … 24 91 79 … 85 Bulgaria
67 39 31 23 10 48 35 49 27 53 60 76 Burkina Faso
… 38 26 37 8 17 36 34 56 70 80 90 Burundi
71 64 39 34 4 0 … 92 31 65 91 95 Cambodia
… 30 … 22 13 58 53 38 20 69 77 78 Cameroon
… … … … … … … … 85 83 35 75 Canada
… 51 v … 100 … … … 43 … 49 64 … Cape Verde
60 32 39 34 15 57 24 24 … 47 58 53 Central African Republic
… … … … … 36 7 39 … 31 … 76 Chad
… … … … … … … 88 75 75 82 72 Chile
… … … … … … … 32 33 87 93 95 China
… 65 … 61 … … … 34 68 72 80 77 Colombia
… … … … … … … >95 38 … 93 … Comoros
69 48 … 27 6 48 16 42 83 68 69 78 Congo
… … … … … … … … 46 … … … Cook Islands
… … … … … … … 65 65 78 57 54 Costa Rica
55 35 19 33 6 36 66 37 46 83 57 79 Côte d'Ivoire
… … … … … … … 89 89 73 … 63 Croatia
… … … … … … … 95 83 79 93 90 Cuba
… … … … … … … … 81 … … … Cyprus
… … … … … … … … 85 … 70 … Czech Republic
98 80 88 92 … … … … 43 100 82 89 Democratic People's Republic of Korea
82 40 42 53 6 39 1 14 38 53 78 88 Democratic Republic of the Congo
011010011001101001100110100110011010011001101001100110100110011010011010010110010111101010100101010100101100101111010101001010101001010010011010011001001101001100100110100110010011010011001001101001001010101001010101001010101001010101001010101001010101001010101001010101001010101001010101001010101001010101001010101001010101001101001100110100110011010011001101001100110100110011010011001101001101100010101100010101100010101100010101100010101100010101100010101011010011001101001100110100110011010011001101001100110100110011010010100101010010101011000100110100101010010101011000100110100101010010101010110001001101001101001011010100110001001101001101001011010100110001001100101111010010101001010010111101001010100101001011110100101010010100101011010011001101001100110100110011010011001101001100110100110011010010010100110100010100110100010100110100010100110100010100110100010100101101001100110100110011010011001101001100110100110011010011001101001111010010101001010111010010111101001010100101011101001011110100101010010101011010011001101001100110100110011010011001101001100110100110011010011001011110101010010110010111101010100101100101111010101001011001010110100110011010011001101001100110100110011010011001101001100110100101001011010000100101101000010010110100001001011010000100101101000010010101101001100110100110011010011001101001100110100110011010011001101001
0101011000100110100110100101101010101100010011010011010010110101010101101001100110100110011010011001101001100110100110011010011001101001101001011001011110101010010101010010110010111101010100101010100101001001101001100100110100110010011010011001001101001100100110100100101010100101010100101010100101010100101010100101010100101010100101010100101010100101010100101010100101010100101010100101010100110100110011010011001101001100110100110011010011001101001100110100110110001010110001010110001010110001010110001010110001010110001010101101001100110100110011010011001101001100110100110011010011001101001010010101001010101100010011010010101001010101100010011010010101001010101011000100110100110100101101010011000100110100110100101101010011000100110010111101001010100101001011110100101010010100101111010010101001010010101101001100110100110011010011001101001100110100110011010011001101001001010011010001010011010001010011010001010011010001010011010001010010110100110011010011001101001100110100110011010011001101001100110100111101001010100101011101001011110100101010010101110100101111010010101001010101101001100110100110011010011001101001100110100110011010011001101001100101111010101001011001011110101010010110010111101010100101100101
010010100110101010110010100101100101111010101001010100101010110001001

100
MDG 5Member State Unmet
need for family
planninga (%)
Contra-ceptive preva- lence b
(%)
Antenatal care coverage c
(%)
Births attended by skilled
health person-
nel c (%)
Births by cae-
sarean section c
(%)
Postnatal care visit
within two days of child-
birth c (%)
Neonates protected at birth against
neonatal tetanus d
(%)
Immunization coverage among 1-year-olds e
(%)
MDG 4
At least 1 visit
At least 4 visits Measles DTP3 HepB3 Hib3
2005 –2010
2005 –2010 2005–2011
2005 –2011
2005 –2010
2005 –2010 2010 1990 2000 2010 2010 2010 2010
Denmark … … … … 98 q 21 … … 84 99 85 90 … 90
Djibouti … 18 81 … 78 … … 79 85 50 85 88 88 88
Dominica … … 100 … 94 q … … … 88 99 99 98 98 98
Dominican Republic 11 73 99 95 94 q 38 82 87 70 84 79 88 84 81
Ecuador … … … … 89 … … 74 60 99 98 99 98 99
Egypt 9 60 73 66 79 28 65 86 86 98 96 97 97 …
El Salvador … 73 94 n 78 p 85 q 25 … 88 98 97 92 92 92 92
Equatorial Guinea … … … … … … … 75 88 51 51 33 … …
Eritrea … … … … … … … 93 … 76 99 99 99 99
Estonia … … … … 99 q 21 … … … 93 95 94 94 94
Ethiopia 34 15 34 m 12 10 m 1 5 u 88 38 52 81 86 86 86
Fiji … … 100 n … 100 m … … 94 84 81 94 99 99 99
Finland … … … … 99 q 16 … … 97 96 98 99 … 98
France 2 77 100 n 99 98 q 21 … … 71 84 90 99 42 97
Gabon … … … … … … … 75 76 55 55 45 45 45
Gambia … … 85 … 52 … … 91 86 89 97 98 94 98
Georgia 16 47 96 71 100 q 29 38 x … … 73 94 91 95 67
Germany … … … … 99 q 31 … … 75 92 96 93 90 94
Ghana 35 24 90 78 55 7 68 86 61 98 93 94 94 94
Greece … … … … … … … … 76 89 99 99 95 83
Grenada … … 100 m … 100 m … … … 85 92 95 97 97 97
Guatemala … … 93 n … 51 16 26 y 85 68 86 93 94 94 94
Guinea 21 9 88 m 50 46 m 2 41 u,y 90 35 42 51 57 57 57
Guinea-Bissau … 14 93 m 70 44 m … … 78 53 71 61 76 76 76
Guyana … 43 86 79 87 13 79 97 73 86 95 95 95 95
Haiti 38 32 85 m 54 26 m 3 30 70 31 55 59 59 … …
Honduras 17 65 84 81 66 13 66 94 90 98 99 98 98 98
Hungary … … … … 100 m 29 … … 99 99 99 99 … 99
Iceland … … … … … 16 … … 99 91 93 96 … 96
India 13 56 75 n 50 w 58 q 9 48 87 56 55 74 72 37 …
Indonesia 9 61 93 m 82 77 m 7 70 u 85 58 74 89 83 83 …
Iran (Islamic Republic of) … … 99 n 94 99 m 40 … 95 85 99 99 99 99 …
Iraq … 50 84 … 80 … … 80 75 87 73 65 64 …
Ireland … 65 100 … 100 q 27 … … 78 79 90 94 94 94
Israel … … … … … 20 … … 91 97 98 96 96 93
Italy … … 98 n 85 100 q 38 … … 43 74 90 96 96 95
Jamaica … … 99 n 87 98 15 … 80 74 88 88 99 99 99
Japan … 54 … … 100 q … … … 73 96 94 98 … …
Jordan 11 59 99 94 99 19 40 87 87 94 98 98 98 98
Kazakhstan … 51 98 … 99 m 14 … … … 99 99 99 99 96
Kenya 26 46 92 47 44 6 42 78 78 75 86 83 83 83
Kiribati … … 100 n … 98 m … … … 75 80 89 91 91 91
Kuwait … … 93 n … 99 q 12 … 95 66 99 98 98 99 98
Kyrgyzstan … 48 97 … 97 6 … … … 98 99 96 96 96
Lao People's Democratic Republic 27 38 37 … 37 2 … 80 32 42 64 74 74 74
Latvia … … 97 n … 99 q 24 … … … 97 93 89 89 88
Lebanon … … … … … … … … 61 71 53 74 74 74
Lesotho 23 47 92 70 62 7 48 u 83 80 74 85 83 83 83
4. Health service coverage
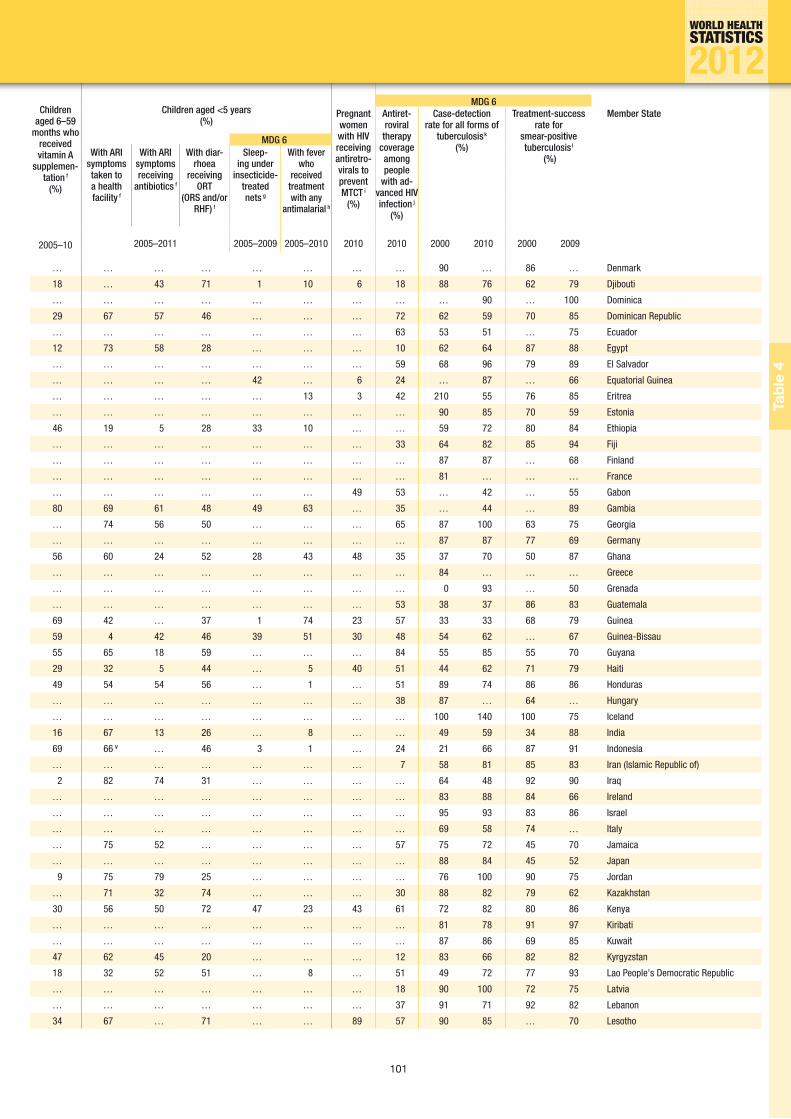
101
Tabl
e 4
MDG 6Children
aged 6–59 months who
received vitamin A
supplemen-tation f
(%)
Children aged <5 years (%)
MDG 6
Pregnant women with HIV receiving antiretro-virals to prevent MTCT i
(%)
Antiret-roviral
therapy coverage among people
with ad-vanced HIV infection j
(%)
Case-detection rate for all forms of
tuberculosis k (%)
Treatment-success rate for
smear-positive tuberculosis l
(%)
Member State
With ARI symptoms taken to a health facility f
With ARI symptoms receiving
anti biotics f
With diar-rhoea
receiving ORT
(ORS and/or RHF) f
Sleep-ing under
insecticide-treated nets g
With fever who
received treatment with any
antimalarial h
2005–10 2005–2011 2005–2009 2005–2010 2010 2010 2000 2010 2000 2009
… … … … … … … … 90 … 86 … Denmark
18 … 43 71 1 10 6 18 88 76 62 79 Djibouti
… … … … … … … … … 90 … 100 Dominica
29 67 57 46 … … … 72 62 59 70 85 Dominican Republic
… … … … … … … 63 53 51 … 75 Ecuador
12 73 58 28 … … … 10 62 64 87 88 Egypt
… … … … … … … 59 68 96 79 89 El Salvador
… … … … 42 … 6 24 … 87 … 66 Equatorial Guinea
… … … … … 13 3 42 210 55 76 85 Eritrea
… … … … … … … … 90 85 70 59 Estonia
46 19 5 28 33 10 … … 59 72 80 84 Ethiopia
… … … … … … … 33 64 82 85 94 Fiji
… … … … … … … … 87 87 … 68 Finland
… … … … … … … … 81 … … … France
… … … … … … 49 53 … 42 … 55 Gabon
80 69 61 48 49 63 … 35 … 44 … 89 Gambia
… 74 56 50 … … … 65 87 100 63 75 Georgia
… … … … … … … … 87 87 77 69 Germany
56 60 24 52 28 43 48 35 37 70 50 87 Ghana
… … … … … … … … 84 … … … Greece
… … … … … … … … 0 93 … 50 Grenada
… … … … … … … 53 38 37 86 83 Guatemala
69 42 … 37 1 74 23 57 33 33 68 79 Guinea
59 4 42 46 39 51 30 48 54 62 … 67 Guinea-Bissau
55 65 18 59 … … … 84 55 85 55 70 Guyana
29 32 5 44 … 5 40 51 44 62 71 79 Haiti
49 54 54 56 … 1 … 51 89 74 86 86 Honduras
… … … … … … … 38 87 … 64 … Hungary
… … … … … … … … 100 140 100 75 Iceland
16 67 13 26 … 8 … … 49 59 34 88 India
69 66 v … 46 3 1 … 24 21 66 87 91 Indonesia
… … … … … … … 7 58 81 85 83 Iran (Islamic Republic of)
2 82 74 31 … … … … 64 48 92 90 Iraq
… … … … … … … … 83 88 84 66 Ireland
… … … … … … … … 95 93 83 86 Israel
… … … … … … … … 69 58 74 … Italy
… 75 52 … … … … 57 75 72 45 70 Jamaica
… … … … … … … … 88 84 45 52 Japan
9 75 79 25 … … … … 76 100 90 75 Jordan
… 71 32 74 … … … 30 88 82 79 62 Kazakhstan
30 56 50 72 47 23 43 61 72 82 80 86 Kenya
… … … … … … … … 81 78 91 97 Kiribati
… … … … … … … … 87 86 69 85 Kuwait
47 62 45 20 … … … 12 83 66 82 82 Kyrgyzstan
18 32 52 51 … 8 … 51 49 72 77 93 Lao People's Democratic Republic
… … … … … … … 18 90 100 72 75 Latvia
… … … … … … … 37 91 71 92 82 Lebanon
34 67 … 71 … … 89 57 90 85 … 70 Lesotho
011010011001101001100110100110011010011001101001100110100110011010011010010110010111101010100101010100101100101111010101001010101001010010011010011001001101001100100110100110010011010011001001101001001010101001010101001010101001010101001010101001010101001010101001010101001010101001010101001010101001010101001010101001010101001101001100110100110011010011001101001100110100110011010011001101001101100010101100010101100010101100010101100010101100010101100010101011010011001101001100110100110011010011001101001100110100110011010010100101010010101011000100110100101010010101011000100110100101010010101010110001001101001101001011010100110001001101001101001011010100110001001100101111010010101001010010111101001010100101001011110100101010010100101011010011001101001100110100110011010011001101001100110100110011010010010100110100010100110100010100110100010100110100010100110100010100101101001100110100110011010011001101001100110100110011010011001101001111010010101001010111010010111101001010100101011101001011110100101010010101011010011001101001100110100110011010011001101001100110100110011010011001011110101010010110010111101010100101100101111010101001011001010110100110011010011001101001100110100110011010011001101001100110100101001011010000100101101000010010110100001001011010000100101101000010010101101001100110100110011010011001101001100110100110011010011001101001
0101011000100110100110100101101010101100010011010011010010110101010101101001100110100110011010011001101001100110100110011010011001101001101001011001011110101010010101010010110010111101010100101010100101001001101001100100110100110010011010011001001101001100100110100100101010100101010100101010100101010100101010100101010100101010100101010100101010100101010100101010100101010100101010100101010100110100110011010011001101001100110100110011010011001101001100110100110110001010110001010110001010110001010110001010110001010110001010101101001100110100110011010011001101001100110100110011010011001101001010010101001010101100010011010010101001010101100010011010010101001010101011000100110100110100101101010011000100110100110100101101010011000100110010111101001010100101001011110100101010010100101111010010101001010010101101001100110100110011010011001101001100110100110011010011001101001001010011010001010011010001010011010001010011010001010011010001010010110100110011010011001101001100110100110011010011001101001100110100111101001010100101011101001011110100101010010101110100101111010010101001010101101001100110100110011010011001101001100110100110011010011001101001100101111010101001011001011110101010010110010111101010100101100101
010010100110101010110010100101100101111010101001010100101010110001001
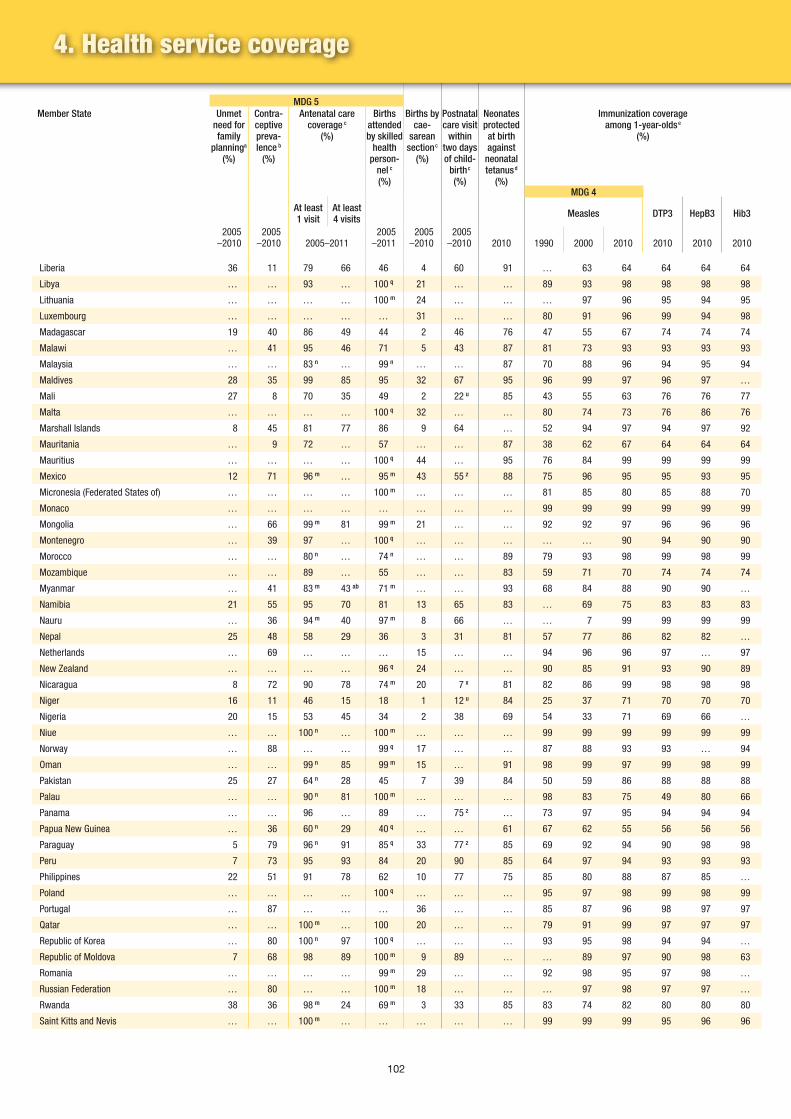
102
MDG 5Member State Unmet
need for family
planninga (%)
Contra-ceptive preva- lence b
(%)
Antenatal care coverage c
(%)
Births attended by skilled
health person-
nel c (%)
Births by cae-
sarean section c
(%)
Postnatal care visit
within two days of child-
birth c (%)
Neonates protected at birth against
neonatal tetanus d
(%)
Immunization coverage among 1-year-olds e
(%)
MDG 4
At least 1 visit
At least 4 visits Measles DTP3 HepB3 Hib3
2005 –2010
2005 –2010 2005–2011
2005 –2011
2005 –2010
2005 –2010 2010 1990 2000 2010 2010 2010 2010
Liberia 36 11 79 66 46 4 60 91 … 63 64 64 64 64
Libya … … 93 … 100 q 21 … … 89 93 98 98 98 98
Lithuania … … … … 100 m 24 … … … 97 96 95 94 95
Luxembourg … … … … … 31 … … 80 91 96 99 94 98
Madagascar 19 40 86 49 44 2 46 76 47 55 67 74 74 74
Malawi … 41 95 46 71 5 43 87 81 73 93 93 93 93
Malaysia … … 83 n … 99 n … … 87 70 88 96 94 95 94
Maldives 28 35 99 85 95 32 67 95 96 99 97 96 97 …
Mali 27 8 70 35 49 2 22 u 85 43 55 63 76 76 77
Malta … … … … 100 q 32 … … 80 74 73 76 86 76
Marshall Islands 8 45 81 77 86 9 64 … 52 94 97 94 97 92
Mauritania … 9 72 … 57 … … 87 38 62 67 64 64 64
Mauritius … … … … 100 q 44 … 95 76 84 99 99 99 99
Mexico 12 71 96 m … 95 m 43 55 z 88 75 96 95 95 93 95
Micronesia (Federated States of) … … … … 100 m … … … 81 85 80 85 88 70
Monaco … … … … … … … … 99 99 99 99 99 99
Mongolia … 66 99 m 81 99 m 21 … … 92 92 97 96 96 96
Montenegro … 39 97 … 100 q … … … … … 90 94 90 90
Morocco … … 80 n … 74 n … … 89 79 93 98 99 98 99
Mozambique … … 89 … 55 … … 83 59 71 70 74 74 74
Myanmar … 41 83 m 43 ab 71 m … … 93 68 84 88 90 90 …
Namibia 21 55 95 70 81 13 65 83 … 69 75 83 83 83
Nauru … 36 94 m 40 97 m 8 66 … … 7 99 99 99 99
Nepal 25 48 58 29 36 3 31 81 57 77 86 82 82 …
Netherlands … 69 … … … 15 … … 94 96 96 97 … 97
New Zealand … … … … 96 q 24 … … 90 85 91 93 90 89
Nicaragua 8 72 90 78 74 m 20 7 x 81 82 86 99 98 98 98
Niger 16 11 46 15 18 1 12 u 84 25 37 71 70 70 70
Nigeria 20 15 53 45 34 2 38 69 54 33 71 69 66 …
Niue … … 100 n … 100 m … … … 99 99 99 99 99 99
Norway … 88 … … 99 q 17 … … 87 88 93 93 … 94
Oman … … 99 n 85 99 m 15 … 91 98 99 97 99 98 99
Pakistan 25 27 64 n 28 45 7 39 84 50 59 86 88 88 88
Palau … … 90 n 81 100 m … … … 98 83 75 49 80 66
Panama … … 96 … 89 … 75 z … 73 97 95 94 94 94
Papua New Guinea … 36 60 n 29 40 q … … 61 67 62 55 56 56 56
Paraguay 5 79 96 n 91 85 q 33 77 z 85 69 92 94 90 98 98
Peru 7 73 95 93 84 20 90 85 64 97 94 93 93 93
Philippines 22 51 91 78 62 10 77 75 85 80 88 87 85 …
Poland … … … … 100 q … … … 95 97 98 99 98 99
Portugal … 87 … … … 36 … … 85 87 96 98 97 97
Qatar … … 100 m … 100 20 … … 79 91 99 97 97 97
Republic of Korea … 80 100 n 97 100 q … … … 93 95 98 94 94 …
Republic of Moldova 7 68 98 89 100 m 9 89 … … 89 97 90 98 63
Romania … … … … 99 m 29 … … 92 98 95 97 98 …
Russian Federation … 80 … … 100 m 18 … … … 97 98 97 97 …
Rwanda 38 36 98 m 24 69 m 3 33 85 83 74 82 80 80 80
Saint Kitts and Nevis … … 100 m … … … … … 99 99 99 95 96 96
4. Health service coverage

103
Tabl
e 4
MDG 6Children
aged 6–59 months who
received vitamin A
supplemen-tation f
(%)
Children aged <5 years (%)
MDG 6
Pregnant women with HIV receiving antiretro-virals to prevent MTCT i
(%)
Antiret-roviral
therapy coverage among people
with ad-vanced HIV infection j
(%)
Case-detection rate for all forms of
tuberculosis k (%)
Treatment-success rate for
smear-positive tuberculosis l
(%)
Member State
With ARI symptoms taken to a health facility f
With ARI symptoms receiving
anti biotics f
With diar-rhoea
receiving ORT
(ORS and/or RHF) f
Sleep-ing under
insecticide-treated nets g
With fever who
received treatment with any
antimalarial h
2005–10 2005–2011 2005–2009 2005–2010 2010 2010 2000 2010 2000 2009
43 62 49 58 3 67 38 27 22 56 80 83 Liberia
… … … … … … … … 64 … … … Libya
… … … … … … … 27 88 76 73 76 Lithuania
… … … … … … … … 100 54 … … Luxembourg
72 42 … 29 … 20 … 1 … 44 70 82 Madagascar
86 70 … 69 25 43 … … 45 65 73 88 Malawi
… … … … … … … 36 68 80 78 78 Malaysia
48 74 … 63 … … … 14 65 83 97 47 Maldives
72 38 … 24 27 32 … 46 30 51 … 78 Mali
… … … … … … … … 81 40 100 80 Malta
… … … … … … … … 25 70 91 84 Marshall Islands
56 45 24 31 … 21 … 22 42 21 … 63 Mauritania
… … … … … … … 16 55 44 93 88 Mauritius
… … … … … … … 78 58 110 76 86 Mexico
… … … … … … … … 30 70 93 88 Micronesia (Federated States of)
… … … … … … … … … … … … Monaco
61 87 72 56 aa … … … 26 51 72 87 88 Mongolia
… 89 57 98 … … … … … 92 … 86 Montenegro
… … … … … … … 30 92 97 89 84 Morocco
… … … … 7 37 52 40 23 34 75 85 Mozambique
56 69 34 66 … … … 24 17 71 82 85 Myanmar
52 72 … 69 … 20 >95 90 53 82 56 85 Namibia
… … … … … … … … 88 73 25 … Nauru
88 34 25 29 … 0 … 18 74 72 84 90 Nepal
… … … … … … … … 81 85 76 80 Netherlands
… … … … … … … … 83 90 30 76 New Zealand
… … … … … … … >95 70 100 82 85 Nicaragua
70 47 … 26 56 33 … 29 28 35 65 79 Niger
26 45 23 31 6 49 9 26 12 40 79 83 Nigeria
… … … … … … … … … … … … Niue
… … … … … … … … 80 … 70 … Norway
… … … … … … … 44 96 85 93 98 Oman
60 81 50 47 0 3 … 9 3 65 74 91 Pakistan
… … … … … … … … … 75 … 75 Palau
… … … … … … … 36 83 89 60 80 Panama
… … … … … … 16 54 65 70 63 72 Papua New Guinea
… … … … … … … 66 74 77 66 80 Paraguay
9 68 51 40 … … … 57 81 100 90 81 Peru
76 50 42 59 … 0 … 51 47 65 88 89 Philippines
… … … … … … … 34 87 80 72 67 Poland
… … … … … … … … 87 … 79 … Portugal
… … … … … … … … 87 87 66 80 Qatar
… … … … … … … … 60 90 83 83 Republic of Korea
… 60 … 35 … … … 25 52 63 63 53 Republic of Moldova
… … … … … … … 69 74 74 70 85 Romania
… … … … … … … … 79 78 68 55 Russian Federation
93 50 13 35 24 6 60 88 26 60 61 85 Rwanda
… … … … … … … … … 50 … 80 Saint Kitts and Nevis
011010011001101001100110100110011010011001101001100110100110011010011010010110010111101010100101010100101100101111010101001010101001010010011010011001001101001100100110100110010011010011001001101001001010101001010101001010101001010101001010101001010101001010101001010101001010101001010101001010101001010101001010101001010101001101001100110100110011010011001101001100110100110011010011001101001101100010101100010101100010101100010101100010101100010101100010101011010011001101001100110100110011010011001101001100110100110011010010100101010010101011000100110100101010010101011000100110100101010010101010110001001101001101001011010100110001001101001101001011010100110001001100101111010010101001010010111101001010100101001011110100101010010100101011010011001101001100110100110011010011001101001100110100110011010010010100110100010100110100010100110100010100110100010100110100010100101101001100110100110011010011001101001100110100110011010011001101001111010010101001010111010010111101001010100101011101001011110100101010010101011010011001101001100110100110011010011001101001100110100110011010011001011110101010010110010111101010100101100101111010101001011001010110100110011010011001101001100110100110011010011001101001100110100101001011010000100101101000010010110100001001011010000100101101000010010101101001100110100110011010011001101001100110100110011010011001101001
0101011000100110100110100101101010101100010011010011010010110101010101101001100110100110011010011001101001100110100110011010011001101001101001011001011110101010010101010010110010111101010100101010100101001001101001100100110100110010011010011001001101001100100110100100101010100101010100101010100101010100101010100101010100101010100101010100101010100101010100101010100101010100101010100101010100110100110011010011001101001100110100110011010011001101001100110100110110001010110001010110001010110001010110001010110001010110001010101101001100110100110011010011001101001100110100110011010011001101001010010101001010101100010011010010101001010101100010011010010101001010101011000100110100110100101101010011000100110100110100101101010011000100110010111101001010100101001011110100101010010100101111010010101001010010101101001100110100110011010011001101001100110100110011010011001101001001010011010001010011010001010011010001010011010001010011010001010010110100110011010011001101001100110100110011010011001101001100110100111101001010100101011101001011110100101010010101110100101111010010101001010101101001100110100110011010011001101001100110100110011010011001101001100101111010101001011001011110101010010110010111101010100101100101
010010100110101010110010100101100101111010101001010100101010110001001
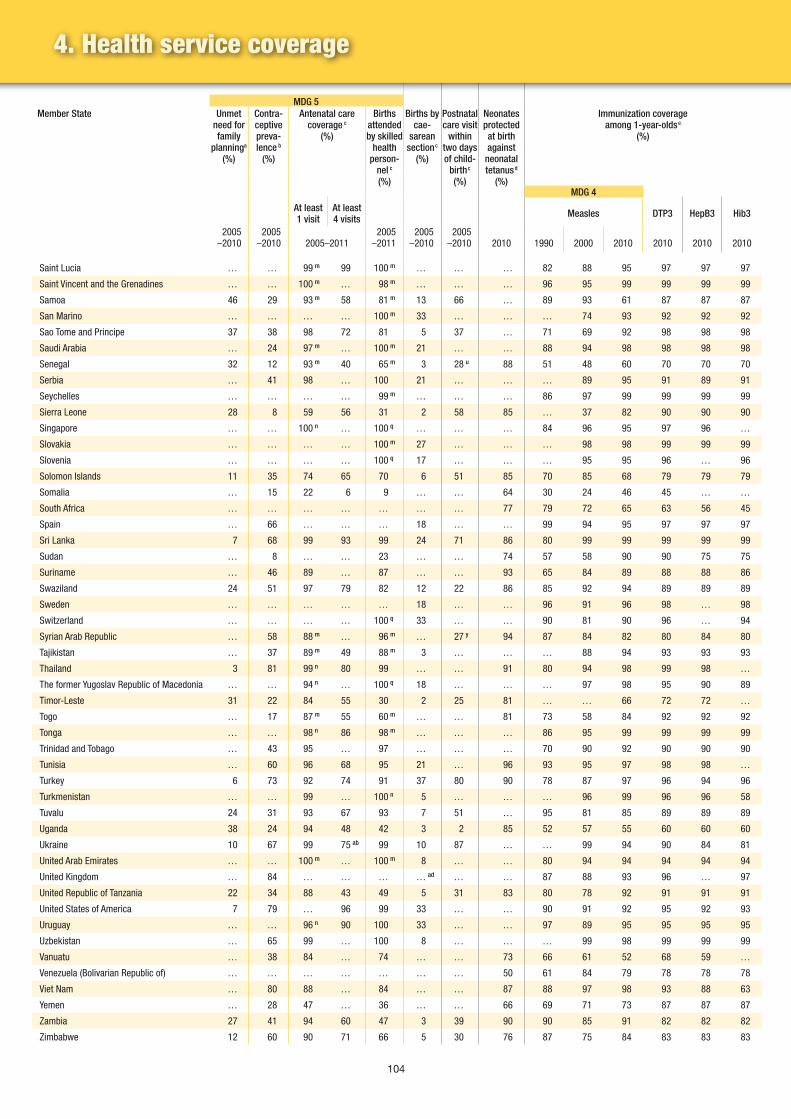
104
MDG 5Member State Unmet
need for family
planninga (%)
Contra-ceptive preva- lence b
(%)
Antenatal care coverage c
(%)
Births attended by skilled
health person-
nel c (%)
Births by cae-
sarean section c
(%)
Postnatal care visit
within two days of child-
birth c (%)
Neonates protected at birth against
neonatal tetanus d
(%)
Immunization coverage among 1-year-olds e
(%)
MDG 4
At least 1 visit
At least 4 visits Measles DTP3 HepB3 Hib3
2005 –2010
2005 –2010 2005–2011
2005 –2011
2005 –2010
2005 –2010 2010 1990 2000 2010 2010 2010 2010
Saint Lucia … … 99 m 99 100 m … … … 82 88 95 97 97 97
Saint Vincent and the Grenadines … … 100 m … 98 m … … … 96 95 99 99 99 99
Samoa 46 29 93 m 58 81 m 13 66 … 89 93 61 87 87 87
San Marino … … … … 100 m 33 … … … 74 93 92 92 92
Sao Tome and Principe 37 38 98 72 81 5 37 … 71 69 92 98 98 98
Saudi Arabia … 24 97 m … 100 m 21 … … 88 94 98 98 98 98
Senegal 32 12 93 m 40 65 m 3 28 u 88 51 48 60 70 70 70
Serbia … 41 98 … 100 21 … … … 89 95 91 89 91
Seychelles … … … … 99 m … … … 86 97 99 99 99 99
Sierra Leone 28 8 59 56 31 2 58 85 … 37 82 90 90 90
Singapore … … 100 n … 100 q … … … 84 96 95 97 96 …
Slovakia … … … … 100 m 27 … … … 98 98 99 99 99
Slovenia … … … … 100 q 17 … … … 95 95 96 … 96
Solomon Islands 11 35 74 65 70 6 51 85 70 85 68 79 79 79
Somalia … 15 22 6 9 … … 64 30 24 46 45 … …
South Africa … … … … … … … 77 79 72 65 63 56 45
Spain … 66 … … … 18 … … 99 94 95 97 97 97
Sri Lanka 7 68 99 93 99 24 71 86 80 99 99 99 99 99
Sudan … 8 … … 23 … … 74 57 58 90 90 75 75
Suriname … 46 89 … 87 … … 93 65 84 89 88 88 86
Swaziland 24 51 97 79 82 12 22 86 85 92 94 89 89 89
Sweden … … … … … 18 … … 96 91 96 98 … 98
Switzerland … … … … 100 q 33 … … 90 81 90 96 … 94
Syrian Arab Republic … 58 88 m … 96 m … 27 y 94 87 84 82 80 84 80
Tajikistan … 37 89 m 49 88 m 3 … … … 88 94 93 93 93
Thailand 3 81 99 n 80 99 … … 91 80 94 98 99 98 …
The former Yugoslav Republic of Macedonia … … 94 n … 100 q 18 … … … 97 98 95 90 89
Timor-Leste 31 22 84 55 30 2 25 81 … … 66 72 72 …
Togo … 17 87 m 55 60 m … … 81 73 58 84 92 92 92
Tonga … … 98 n 86 98 m … … … 86 95 99 99 99 99
Trinidad and Tobago … 43 95 … 97 … … … 70 90 92 90 90 90
Tunisia … 60 96 68 95 21 … 96 93 95 97 98 98 …
Turkey 6 73 92 74 91 37 80 90 78 87 97 96 94 96
Turkmenistan … … 99 … 100 n 5 … … … 96 99 96 96 58
Tuvalu 24 31 93 67 93 7 51 … 95 81 85 89 89 89
Uganda 38 24 94 48 42 3 2 85 52 57 55 60 60 60
Ukraine 10 67 99 75 ab 99 10 87 … … 99 94 90 84 81
United Arab Emirates … … 100 m … 100 m 8 … … 80 94 94 94 94 94
United Kingdom … 84 … … … … ad … … 87 88 93 96 … 97
United Republic of Tanzania 22 34 88 43 49 5 31 83 80 78 92 91 91 91
United States of America 7 79 … 96 99 33 … … 90 91 92 95 92 93
Uruguay … … 96 n 90 100 33 … … 97 89 95 95 95 95
Uzbekistan … 65 99 … 100 8 … … … 99 98 99 99 99
Vanuatu … 38 84 … 74 … … 73 66 61 52 68 59 …
Venezuela (Bolivarian Republic of) … … … … … … … 50 61 84 79 78 78 78
Viet Nam … 80 88 … 84 … … 87 88 97 98 93 88 63
Yemen … 28 47 … 36 … … 66 69 71 73 87 87 87
Zambia 27 41 94 60 47 3 39 90 90 85 91 82 82 82
Zimbabwe 12 60 90 71 66 5 30 76 87 75 84 83 83 83
4. Health service coverage

105
Tabl
e 4
MDG 6Children
aged 6–59 months who
received vitamin A
supplemen-tation f
(%)
Children aged <5 years (%)
MDG 6
Pregnant women with HIV receiving antiretro-virals to prevent MTCT i
(%)
Antiret-roviral
therapy coverage among people
with ad-vanced HIV infection j
(%)
Case-detection rate for all forms of
tuberculosis k (%)
Treatment-success rate for
smear-positive tuberculosis l
(%)
Member State
With ARI symptoms taken to a health facility f
With ARI symptoms receiving
anti biotics f
With diar-rhoea
receiving ORT
(ORS and/or RHF) f
Sleep-ing under
insecticide-treated nets g
With fever who
received treatment with any
antimalarial h
2005–10 2005–2011 2005–2009 2005–2010 2010 2010 2000 2010 2000 2009
… … … … … … … … 43 65 100 57 Saint Lucia
… … … … … … … … 57 56 100 0 Saint Vincent and the Grenadines
… 87 54 87 … … … … 100 71 92 90 Samoa
… … … … … … … … 87 … 0 … San Marino
48 75 60 57 54 8 … 34 60 76 78 98 Sao Tome and Principe
… … … … … … … … 87 88 73 65 Saudi Arabia
… 50 … 27 31 9 … 50 38 31 52 85 Senegal
… 93 57 94 … … … 34 … 130 … 85 Serbia
… … … … … … … … 70 64 82 64 Seychelles
26 46 27 73 26 30 62 31 24 32 77 79 Sierra Leone
… … … … … … … … 88 87 71 82 Singapore
… … … … … … … 81 85 88 82 82 Slovakia
… … … … … … … … 87 79 84 87 Slovenia
… … … … … 19 … … 40 58 81 88 Solomon Islands
24 13 32 21 9 8 … 3 27 38 83 85 Somalia
… … … … … … >95 55 59 72 63 73 South Africa
… … … … … … … … 87 87 … … Spain
… … … … … 0 … 25 68 69 79 86 Sri Lanka
… 56 66 52 aa 16 ac 54 ac 2 5 61 50 75 80 Sudan
… 2 … 44 … … … 45 24 … 68 … Suriname
81 72 24 89 … 1 >95 72 69 66 … 69 Swaziland
… … … … … … … … 85 87 79 85 Sweden
… … … … … … … … 83 55 … … Switzerland
3 77 71 68 … … … … 92 90 78 88 Syrian Arab Republic
47 64 41 58 1 2 … 16 36 44 77 81 Tajikistan
… 84 65 68 … … … 67 40 70 69 86 Thailand
… 93 74 81 … … … … 77 89 86 90 The former Yugoslav Republic of Macedonia
51 71 45 78 … 6 … … … … … … Timor-Leste
… … 41 24 aa 35 48 51 50 8 10 … 81 Togo
… … … … … … … … 88 63 93 83 Tonga
… … … … … … … … 87 87 68 69 Trinidad and Tobago
… 59 … 74 … … … 10 90 91 91 83 Tunisia
… … … … … … … 56 61 77 73 91 Turkey
… … … … … … … … 97 96 81 84 Turkmenistan
… … … … … … … … 48 60 86 88 Tuvalu
36 74 47 43 9 60 42 47 29 61 63 67 Uganda
… … … … … … … 13 80 73 … 60 Ukraine
… … … … … … … … 68 57 74 73 United Arab Emirates
… … … … … … … … 90 91 … … United Kingdom
61 31 … 59 16 59 59 42 68 77 78 88 United Republic of Tanzania
… … … … … … … … 86 88 83 60 United States of America
… … … … … … … 71 80 97 85 80 Uruguay
72 68 56 79 … … … 28 50 48 80 81 Uzbekistan
… 63 48 54 … … … … 75 70 88 96 Vanuatu
… … … … … … … 57 77 66 76 84 Venezuela (Bolivarian Republic of)
53 83 55 95 5 3 … 52 56 54 92 92 Viet Nam
… … 38 87 8 … … … 67 76 72 88 Yemen
63 68 47 67 41 34 75 72 68 73 67 90 Zambia
47 26 8 62 3 24 46 59 56 56 69 78 Zimbabwe
011010011001101001100110100110011010011001101001100110100110011010011010010110010111101010100101010100101100101111010101001010101001010010011010011001001101001100100110100110010011010011001001101001001010101001010101001010101001010101001010101001010101001010101001010101001010101001010101001010101001010101001010101001010101001101001100110100110011010011001101001100110100110011010011001101001101100010101100010101100010101100010101100010101100010101100010101011010011001101001100110100110011010011001101001100110100110011010010100101010010101011000100110100101010010101011000100110100101010010101010110001001101001101001011010100110001001101001101001011010100110001001100101111010010101001010010111101001010100101001011110100101010010100101011010011001101001100110100110011010011001101001100110100110011010010010100110100010100110100010100110100010100110100010100110100010100101101001100110100110011010011001101001100110100110011010011001101001111010010101001010111010010111101001010100101011101001011110100101010010101011010011001101001100110100110011010011001101001100110100110011010011001011110101010010110010111101010100101100101111010101001011001010110100110011010011001101001100110100110011010011001101001100110100101001011010000100101101000010010110100001001011010000100101101000010010101101001100110100110011010011001101001100110100110011010011001101001
0101011000100110100110100101101010101100010011010011010010110101010101101001100110100110011010011001101001100110100110011010011001101001101001011001011110101010010101010010110010111101010100101010100101001001101001100100110100110010011010011001001101001100100110100100101010100101010100101010100101010100101010100101010100101010100101010100101010100101010100101010100101010100101010100101010100110100110011010011001101001100110100110011010011001101001100110100110110001010110001010110001010110001010110001010110001010110001010101101001100110100110011010011001101001100110100110011010011001101001010010101001010101100010011010010101001010101100010011010010101001010101011000100110100110100101101010011000100110100110100101101010011000100110010111101001010100101001011110100101010010100101111010010101001010010101101001100110100110011010011001101001100110100110011010011001101001001010011010001010011010001010011010001010011010001010011010001010010110100110011010011001101001100110100110011010011001101001100110100111101001010100101011101001011110100101010010101110100101111010010101001010101101001100110100110011010011001101001100110100110011010011001101001100101111010101001011001011110101010010110010111101010100101100101
010010100110101010110010100101100101111010101001010100101010110001001

106
MDG 5Member State Unmet
need for family
planninga (%)
Contra-ceptive preva- lence b
(%)
Antenatal care coverage c
(%)
Births attended by skilled
health person-
nel c (%)
Births by cae-
sarean section c
(%)
Postnatal care visit
within two days of child-
birth c (%)
Neonates protected at birth against
neonatal tetanus d
(%)
Immunization coverage among 1-year-olds e
(%)
MDG 4
At least 1 visit
At least 4 visits Measles DTP3 HepB3 Hib3
2005 –2010
2005 –2010 2005–2011
2005 –2011
2005 –2010
2005 –2010 2010 1990 2000 2010 2010 2010 2010
Ranges of country valuesMinimum 2 8 22 6 9 1 2 50 20 7 46 33 17 0
Median 19 46 94 71 95 16 48 86 80 87 94 94 93 93
Maximum 46 88 100 100 100 51 90 97 99 99 99 99 99 99
WHO regionAfrican Region 25 24 74 43 48 4 37 80 58 56 76 77 76 62
Region of the Americas 9 75 95 87 93 35 … 84 80 92 93 93 89 92
South-East Asia Region 13 58 76 52 59 9 48 87 59 62 79 77 52 …
European Region … 71 … … 98 22 … … 83 91 95 96 78 75
Eastern Mediterranean Region 20 42 72 43 59 16 42 83 66 72 85 87 84 58
Western Pacific Region 4 80 93 … 91 24 … … 94 85 97 96 91 …
Income groupLow income 23 35 74 36 46 5 33 84 56 61 78 79 78 72
Lower middle income 14 52 76 53 58 9 50 83 61 62 80 79 62 …
Upper middle income 4 80 95 … 96 31 … … 90 88 96 96 95 …
High income … 71 … 96 99 28 … … 83 91 93 95 69 82
Global 11 63 81 55 69 16 46 84 73 72 85 85 75 42
a United Nations, Department of Economic and Social Affairs, Population Division (2011). 2011 Update for the MDG Database: Unmet Need for Family Planning (http://www.un.org/esa/population/publications/2011-mdgdatabase/2011_Update_MDG_UMN.xls). WHO regional, income-group and global figures refer to 2008. If country-level data were not available for 2008, linear interpolation between the closest data points on both sides of 2008 were used. In other cases, the closest data point is used.
b United Nations, Department of Economic and Social Affairs, Population Division (2011). 2011 Update for the MDG Database: Contraceptive Prevalence (http://www.un.org/esa/population/publications/2011-mdgdatabase/2011_Update_MDG_CP.xls). Any contraceptive method is reported. WHO regional, income-group and global figures refer to 2008. If country-level data were not available for 2008, linear interpolation between the closest data points on both sides of 2008 were used. In other cases, the closest data point is used.
c WHO global database on maternal health indicators, 2012 update. Geneva, World Health Organization (http://www.who.int/gho). Postnatal care was surveyed only for the mother.
d Proportion of neonates protected at birth against neonatal tetanus through maternal immunization with tetanus toxoid, based on a mathematical model taking into account the mother’s immunization in infancy, during pregnancy and in tetanus campaigns. The model is described in: Griffiths UK et al. (2004). Incremental cost-effectiveness of sup-plementary immunization activities to prevent neonatal tetanus in Pakistan. Bulletin of the World Health Organization, 2004, No. 9, 82:643–651. WHO/UNICEF estimates of national immunization coverage. Geneva, World Health Organization, 2011 (http://www.who.int/immunization_monitoring/routine/immunization_coverage/en/index4.html).
e Measles = measles-containing vaccine (MCV); DTP3 = 3 doses of diphtheria-tetanus-
pertussis vaccine; HepB3 = 3 doses of hepatitis B vaccine; Hib3 = 3 doses of Hae-mophilus influenzae type B vaccine. WHO/UNICEF estimates of national immunization coverage. Geneva, World Health Organization, 2011 (http://www.who.int/immuniza-tion_monitoring/routine/immunization_coverage/en/index4.html). Estimates based on data available up to July 2011. For countries recommending the first dose of measles vaccine in children older than 12 months of age, the indicator is calculated as the pro-portion of children less than 24 months of age receiving one dose of measles-containing vaccine. Complete coverage estimates available online at the above web site.
f Data compiled by WHO from Demographic and Health Surveys (DHS) and Multiple Indicator Cluster Surveys (MICS), January 2012 (http://www.measuredhs.com and http://www.unicef.org/statistics/index_24302.html). Vitamin A supplementation data refer to the six months preceding the survey; data on children receiving oral rehydration salts (ORS) and/or recommended home fluids (RHF) refer to the two weeks preced-ing the survey; and data on children who were ill with a cough accompanied by rapid breathing (ARI symptoms) and who were taken to a health facility and/or received anti-biotics refer to the two weeks preceding the survey.
g World malaria report 2011. Geneva, World Health Organization, 2011 (http://www.who.int/malaria/world_malaria_report_2011/). See Annex 5: Household surveys of mosquito nets ownership and usage, 2006–2010.
h The state of the world’s children, 2012: Children in an urban world. New York, UNICEF, 2012 (http://www.unicef.org/sowc/index_sowc.html).
i Progress report 2011: Global HIV/AIDS response. Epidemic update and health sector progress towards universal access. Geneva, World Health Organization, Joint United Nations Programme on HIV/AIDS, United Nations Children’s Fund (2011). See Annex 6. Income-group aggregates are based on the 2007 World Bank list of economies. These
4. Health service coverage

107
Tabl
e 4
MDG 6Children
aged 6–59 months who
received vitamin A
supplemen-tation f
(%)
Children aged <5 years (%)
MDG 6
Pregnant women with HIV receiving antiretro-virals to prevent MTCT i
(%)
Antiret-roviral
therapy coverage among people
with ad-vanced HIV infection j
(%)
Case-detection rate for all forms of
tuberculosis k (%)
Treatment-success rate for
smear-positive tuberculosis l
(%)
Member State
With ARI symptoms taken to a health facility f
With ARI symptoms receiving
anti biotics f
With diar-rhoea
receiving ORT
(ORS and/or RHF) f
Sleep-ing under
insecticide-treated nets g
With fever who
received treatment with any
antimalarial h
2005–10 2005–2011 2005–2009 2005–2010 2010 2010 2000 2010 2000 2009
0 2 5 20 0 0 1 1 0 10 0 0 Minimum
53 63 47 52 13 23 41 40 70 73 78 82 Median
98 93 88 100 56 74 >95 >95 210 140 100 100 Maximum
59 46 33 41 18 … 50 49 43 60 71 80 African Region
… … … … … … 59 63 70 80 76 76 Region of the Americas
42 83 63 68 … … 13 39 42 61 50 89 South-East Asia Region
… … … … … … 79 23 76 72 75 68 European Region
15 69 59 44 5 … 3 8 25 63 81 88 Eastern Mediterranean Region
… … … … … … 30 43 39 79 90 93 Western Pacific Region
63 43 29 44 19 … 34 43 37 58 78 86 Low income
34 63 42 45 … … 60 46 43 61 56 87 Lower middle income
… … … … … … 93 56 47 81 81 86 Upper middle income
… … … … … … … … 81 79 66 66 High income
46 78 … 64 … … 48 47 44 65 69 87 Global
estimates exclude single-dose Nevirapine and coverage figures published in previous reports should not be compared to those reported herein. For uncertainty ranges see the full report (http://whqlibdoc.who.int/publications/2011/9789241502986_eng.pdf).
j Progress report 2011: Global HIV/AIDS response. Epidemic update and health sector progress towards universal access. Geneva, World Health Organization, Joint United Nations Programme on HIV/AIDS, United Nations Children’s Fund (2011). See Annex 4. Income-group aggregates are based on the 2007 World Bank list of economies. Cover-age figures published in previous reports should not be compared to those reported herein. For uncertainty ranges see the full report. (http://whqlibdoc.who.int/publica-tions/2011/9789241502986_eng.pdf).
k The case-detection rate for all forms of tuberculosis is the number of new and relapse tuberculosis cases diagnosed and treated in national tuberculosis control programmes and notified to WHO, divided by WHO’s estimate of the number of incident tuberculosis cases for the same year, expressed as a percentage. For uncertainty ranges see the full report. Global tuberculosis control 2011. Geneva, World Health Organization, 2011 (http://www.who.int/tb/publications/global_report/). WHO regional, income-group and global aggregates include territories.
l The treatment-success rate for new pulmonary smear-positive tuberculosis cases is the proportion (expressed as a percentage) of new smear-positive tuberculosis cases registered under a national tuberculosis control programme in a given year that suc-cessfully completed treatment – with or without bacteriological evidence of success (“cured” and “treatment completed” respectively). Global tuberculosis control 2011. Geneva, World Health Organization, 2011 (http://www.who.int/tb/publications/global_report/). WHO regional, income-group and global aggregates include territories.
m Definition of skilled personnel differs from standard definition.
n Skilled personnel not defined.o Data only include information from Queensland, South Australia and the Northern Territory.p Five or more visits.q Institutional births.r Data only include children aged 9–59 months.s Separate surveys for Wallonie, Brussels and the Flemish region all report a figure above
99%.t Separate surveys for Wallonie, Brussels and the Flemish region report figures of 20.5,
18.8 and 19.4 respectively.u Data only include women who gave birth in a setting other than a health facility.v Data refer to children with ARI symptoms and/or fever.w Three or more visits.x Postnatal visit was 0–7 days postpartum.y No timing of postnatal visit was provided.z Postnatal visit was 1–15 days postpartum.aa Data include children receiving continued feeding.ab Six or more visits.ac Data for Sudan represent 15 northern states.ad Separate surveys for England, Wales, Scotland and Northern Ireland report figures of
24.8, 26.6, 25.4 and 27.6 respectively.
011010011001101001100110100110011010011001101001100110100110011010011010010110010111101010100101010100101100101111010101001010101001010010011010011001001101001100100110100110010011010011001001101001001010101001010101001010101001010101001010101001010101001010101001010101001010101001010101001010101001010101001010101001010101001101001100110100110011010011001101001100110100110011010011001101001101100010101100010101100010101100010101100010101100010101100010101011010011001101001100110100110011010011001101001100110100110011010010100101010010101011000100110100101010010101011000100110100101010010101010110001001101001101001011010100110001001101001101001011010100110001001100101111010010101001010010111101001010100101001011110100101010010100101011010011001101001100110100110011010011001101001100110100110011010010010100110100010100110100010100110100010100110100010100110100010100101101001100110100110011010011001101001100110100110011010011001101001111010010101001010111010010111101001010100101011101001011110100101010010101011010011001101001100110100110011010011001101001100110100110011010011001011110101010010110010111101010100101100101111010101001011001010110100110011010011001101001100110100110011010011001101001100110100101001011010000100101101000010010110100001001011010000100101101000010010101101001100110100110011010011001101001100110100110011010011001101001
0101011000100110100110100101101010101100010011010011010010110101010101101001100110100110011010011001101001100110100110011010011001101001101001011001011110101010010101010010110010111101010100101010100101001001101001100100110100110010011010011001001101001100100110100100101010100101010100101010100101010100101010100101010100101010100101010100101010100101010100101010100101010100101010100101010100110100110011010011001101001100110100110011010011001101001100110100110110001010110001010110001010110001010110001010110001010110001010101101001100110100110011010011001101001100110100110011010011001101001010010101001010101100010011010010101001010101100010011010010101001010101011000100110100110100101101010011000100110100110100101101010011000100110010111101001010100101001011110100101010010100101111010010101001010010101101001100110100110011010011001101001100110100110011010011001101001001010011010001010011010001010011010001010011010001010011010001010010110100110011010011001101001100110100110011010011001101001100110100111101001010100101011101001011110100101010010101110100101111010010101001010101101001100110100110011010011001101001100110100110011010011001101001100101111010101001011001011110101010010110010111101010100101100101
010010100110101010110010100101100101111010101001010100101010110001001

108
109
Tabl
e 5
5. Risk factors
Table 5 presents information on indicators for certain risk factors that are associated with increased mortal-ity and morbidity. These preventable risk factors include: unsafe water and lack of sanitation; use of solid fuels in households; low birth weight; poor infant-feeding practices; childhood under-nutrition and over-nutrition; diabetes; hypertension; obesity; harmful consumption of alcohol; use of tobacco; and unsafe sex.
Unsafe water supplies and inadequate levels of sanitation and hygiene increase the transmission of diar-rhoeal diseases (including cholera); trachoma; and hepatitis. The use of solid fuels in households is a proxy indicator for household air pollution. Using solid fuels such as wood, charcoal and crops is associated with increased mortality from pneumonia and other acute lower respiratory diseases among children, as well as increased mortality from chronic obstructive pulmonary disease, lung cancer (where coal is used) and other diseases among adults.
Low birth weight is an important predictor of the health and survival of the newborn, but in many settings (especially where deliveries occur away from health-care facilities) many infants are not weighed at birth.
Child growth is the most widely used measure of children’s nutritional status. Included in the estimates presented in Table 5 are the three indicators: “stunted”; “underweight” (which is an MDG indicator); and “overweight”. Stunting (i.e. low height-for-age) reflects the cumulative effects of under-nutrition and infec-tions since birth – and even before birth. Evidence of this condition indicates chronic malnutrition, which is likely to have serious and long-lasting impacts on health. Being underweight may reflect wasting (i.e. low weight-for-height) which indicates acute weight loss and/or stunting. Thus, it is a composite indicator that is more difficult to interpret. Fewer data are available on the number of overweight children, although it is known that many countries face a double burden of malnutrition (with high numbers of underweight or stunted children) in some population groups coupled with high numbers of overweight children in other groups.
In adults, diabetes, hypertension and being overweight or obese increase the risk of cardiovascular dis-ease and several types of cancer. These risks also contribute to non-fatal diseases such as arthritis and loss of vision due to diabetic retinopathy. Once considered a problem only in high-income countries, obe-sity is on the rise in low-income and middle-income countries, particularly in the WHO African Region and the WHO Region of the Americas. The prevalence of hypertension is highest in some low-income countries in Africa, whereas public health interventions have reduced its prevalence in many high-income countries.
The prevalence of current tobacco smoking is an important predictor of the future burden of tobacco-relat-ed diseases. Harmful use of alcohol can cause alcohol dependence, hepatic cirrhosis, cancer and injuries.
Data on risk factors and health-related behaviours are generally drawn from household surveys. It is impor-tant to note that the reliability of these estimates depends upon the overall quality of the sampling frames and methods used; on interviewer training, data-quality assurance procedures, and statistical data analy-ses; and on the ability and willingness of respondents to provide accurate responses. Where data from household surveys are not available, statistical techniques may be used to develop estimates.
011010011001101001100110100110011010011001101001100110100110011010011010010110010111101010100101010100101100101111010101001010101001010010011010011001001101001100100110100110010011010011001001101001001010101001010101001010101001010101001010101001010101001010101001010101001010101001010101001010101001010101001010101001010101001101001100110100110011010011001101001100110100110011010011001101001101100010101100010101100010101100010101100010101100010101100010101011010011001101001100110100110011010011001101001100110100110011010010100101010010101011000100110100101010010101011000100110100101010010101010110001001101001101001011010100110001001101001101001011010100110001001100101111010010101001010010111101001010100101001011110100101010010100101011010011001101001100110100110011010011001101001100110100110011010010010100110100010100110100010100110100010100110100010100110100010100101101001100110100110011010011001101001100110100110011010011001101001111010010101001010111010010111101001010100101011101001011110100101010010101011010011001101001100110100110011010011001101001100110100110011010011001011110101010010110010111101010100101100101111010101001011001010110100110011010011001101001100110100110011010011001101001100110100101001011010000100101101000010010110100001001011010000100101101000010010101101001100110100110011010011001101001100110100110011010011001101001
0101011000100110100110100101101010101100010011010011010010110101010101101001100110100110011010011001101001100110100110011010011001101001101001011001011110101010010101010010110010111101010100101010100101001001101001100100110100110010011010011001001101001100100110100100101010100101010100101010100101010100101010100101010100101010100101010100101010100101010100101010100101010100101010100101010100110100110011010011001101001100110100110011010011001101001100110100110110001010110001010110001010110001010110001010110001010110001010101101001100110100110011010011001101001100110100110011010011001101001010010101001010101100010011010010101001010101100010011010010101001010101011000100110100110100101101010011000100110100110100101101010011000100110010111101001010100101001011110100101010010100101111010010101001010010101101001100110100110011010011001101001100110100110011010011001101001001010011010001010011010001010011010001010011010001010011010001010010110100110011010011001101001100110100110011010011001101001100110100111101001010100101011101001011110100101010010101110100101111010010101001010101101001100110100110011010011001101001100110100110011010011001101001100101111010101001011001011110101010010110010111101010100101100101
010010100110101010110010100101100101111010101001010100101010110001001
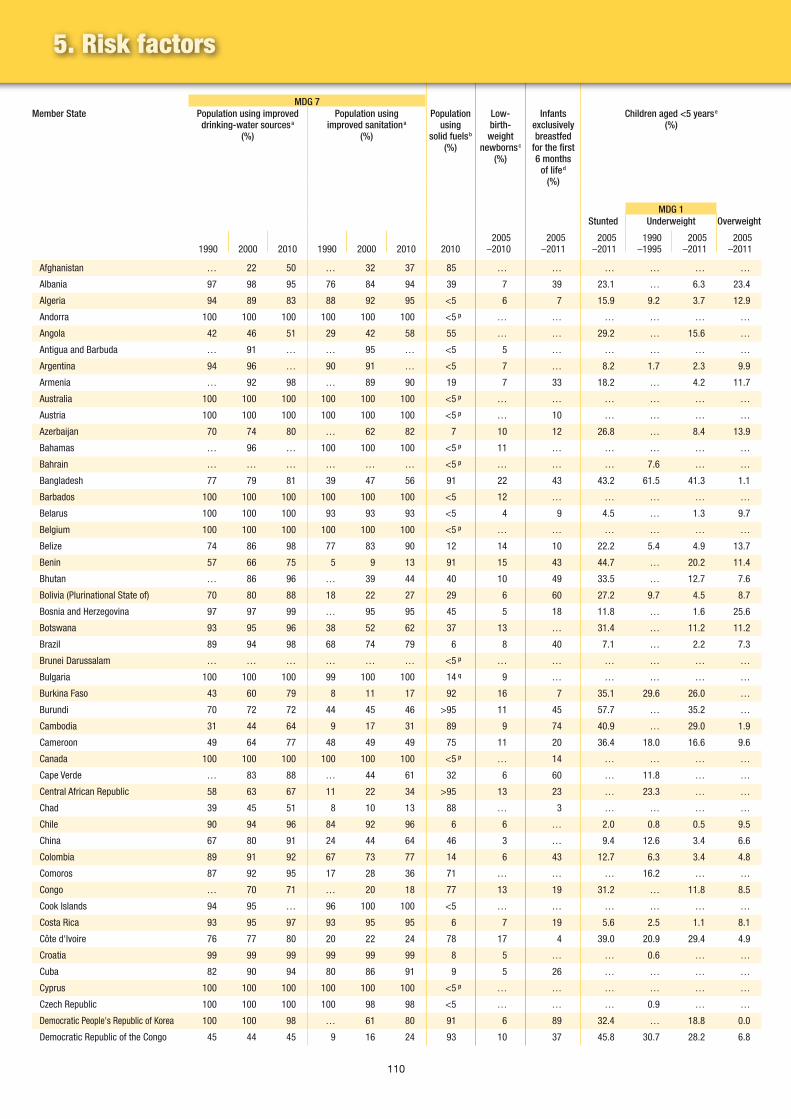
110
MDG 7Member State Population using improved
drinking-water sources a (%)
Population using improved sanitation a
(%)
Population using
solid fuels b (%)
Low- birth-
weight newborns c
(%)
Infants exclusively breastfed
for the first 6 months
of life d (%)
Children aged <5 years e
(%)
MDG 1Stunted Underweight Overweight
1990 2000 2010 1990 2000 2010 20102005
–20102005
–20112005
–20111990
–19952005
–20112005
–2011
Afghanistan … 22 50 … 32 37 85 … … … … … …
Albania 97 98 95 76 84 94 39 7 39 23.1 … 6.3 23.4
Algeria 94 89 83 88 92 95 <5 6 7 15.9 9.2 3.7 12.9
Andorra 100 100 100 100 100 100 <5 p … … … … … …
Angola 42 46 51 29 42 58 55 … … 29.2 … 15.6 …
Antigua and Barbuda … 91 … … 95 … <5 5 … … … … …
Argentina 94 96 … 90 91 … <5 7 … 8.2 1.7 2.3 9.9
Armenia … 92 98 … 89 90 19 7 33 18.2 … 4.2 11.7
Australia 100 100 100 100 100 100 <5 p … … … … … …
Austria 100 100 100 100 100 100 <5 p … 10 … … … …
Azerbaijan 70 74 80 … 62 82 7 10 12 26.8 … 8.4 13.9
Bahamas … 96 … 100 100 100 <5 p 11 … … … … …
Bahrain … … … … … … <5 p … … … 7.6 … …
Bangladesh 77 79 81 39 47 56 91 22 43 43.2 61.5 41.3 1.1
Barbados 100 100 100 100 100 100 <5 12 … … … … …
Belarus 100 100 100 93 93 93 <5 4 9 4.5 … 1.3 9.7
Belgium 100 100 100 100 100 100 <5 p … … … … … …
Belize 74 86 98 77 83 90 12 14 10 22.2 5.4 4.9 13.7
Benin 57 66 75 5 9 13 91 15 43 44.7 … 20.2 11.4
Bhutan … 86 96 … 39 44 40 10 49 33.5 … 12.7 7.6
Bolivia (Plurinational State of) 70 80 88 18 22 27 29 6 60 27.2 9.7 4.5 8.7
Bosnia and Herzegovina 97 97 99 … 95 95 45 5 18 11.8 … 1.6 25.6
Botswana 93 95 96 38 52 62 37 13 … 31.4 … 11.2 11.2
Brazil 89 94 98 68 74 79 6 8 40 7.1 … 2.2 7.3
Brunei Darussalam … … … … … … <5 p … … … … … …
Bulgaria 100 100 100 99 100 100 14 q 9 … … … … …
Burkina Faso 43 60 79 8 11 17 92 16 7 35.1 29.6 26.0 …
Burundi 70 72 72 44 45 46 >95 11 45 57.7 … 35.2 …
Cambodia 31 44 64 9 17 31 89 9 74 40.9 … 29.0 1.9
Cameroon 49 64 77 48 49 49 75 11 20 36.4 18.0 16.6 9.6
Canada 100 100 100 100 100 100 <5 p … 14 … … … …
Cape Verde … 83 88 … 44 61 32 6 60 … 11.8 … …
Central African Republic 58 63 67 11 22 34 >95 13 23 … 23.3 … …
Chad 39 45 51 8 10 13 88 … 3 … … … …
Chile 90 94 96 84 92 96 6 6 … 2.0 0.8 0.5 9.5
China 67 80 91 24 44 64 46 3 … 9.4 12.6 3.4 6.6
Colombia 89 91 92 67 73 77 14 6 43 12.7 6.3 3.4 4.8
Comoros 87 92 95 17 28 36 71 … … … 16.2 … …
Congo … 70 71 … 20 18 77 13 19 31.2 … 11.8 8.5
Cook Islands 94 95 … 96 100 100 <5 … … … … … …
Costa Rica 93 95 97 93 95 95 6 7 19 5.6 2.5 1.1 8.1
Côte d'Ivoire 76 77 80 20 22 24 78 17 4 39.0 20.9 29.4 4.9
Croatia 99 99 99 99 99 99 8 5 … … 0.6 … …
Cuba 82 90 94 80 86 91 9 5 26 … … … …
Cyprus 100 100 100 100 100 100 <5 p … … … … … …
Czech Republic 100 100 100 100 98 98 <5 … … … 0.9 … …
Democratic People's Republic of Korea 100 100 98 … 61 80 91 6 89 32.4 … 18.8 0.0
Democratic Republic of the Congo 45 44 45 9 16 24 93 10 37 45.8 30.7 28.2 6.8
5. Risk factors

111
Tabl
e 5
MDG 6Prevalence of raised fasting blood glucose among adults
aged ≥25 years f (%)
Prevalence of raised blood
pressure among adults aged ≥25 years g
(%)
Adults aged ≥20 years who
are obese h (%)
Alcohol consumption
among adults aged ≥15 years i(litres of
pure alcohol per person per year)
Prevalence of smoking any
tobacco product among adults
aged ≥15 years j (%)
Prevalence of current tobacco
use among adolescents aged
13–15 years k (%)
Prevalence of condom use
by adults aged 15–49 years
during higher-risk sex l
(%)
Population aged 15–24 years with
comprehensive correct
knowledge of HIV/AIDS m
(%)
Member State
Male Female Male Female Male Female Male Female Male Female Male Female Male Female
2008 2008 2008 2008 2009 2005–2010 2005–2009 2005–2009
8.9 n 9.5 n 27.2 n 27.9 n 1.5 n 3.3 n <0.1 … … … … … … … … Afghanistan
10.3 n 9.0 n 39.3 31.7 21.7 20.5 7.3 60 19 18 7 … … … … Albania
9.0 9.3 33.9 33.2 10.7 24.3 0.7 … … 26 o 6 o … … … … Algeria
10.4 n 7.0 n 29.2 n 17.5 n 25.7 n 22.6 n 10.2 38 32 … … … … … … Andorra
8.2 n 8.7 n 39.6 n 33.8 n 3.8 n 10.2 n 5.6 … … … … … … … … Angola
11.3 n 12.0 n 38.5 n 27.5 n 18.1 n 33.1 n 8.2 … … 24 16 … … … … Antigua and Barbuda
11.0 10.3 31.0 17.9 27.4 31.0 9.4 32 22 26 30 … … … … Argentina
11.5 n 11.5 n 42.1 37.0 14.4 30.2 13.7 51 2 11 4 58 … 15 23 Armenia
9.6 6.7 22.8 13.7 25.2 24.9 10.2 22 19 … … … … … … Australia
7.1 4.6 28.7 19.8 19.2 17.1 12.4 47 45 … … … … … … Austria
12.1 n 12.3 n 36.6 30.9 15.8 32.1 13.3 41 … … … 26 … 5 5 Azerbaijan
12.7 n 13.7 n 37.6 n 25.6 n 26.7 n 42.6 n 8.7 … … 18 15 … … … … Bahamas
13.5 12.1 34.5 32.9 28.9 38.2 4.2 34 8 … … … … … … Bahrain
9.2 9.9 27.4 n 27.9 n 1.0 1.3 0.2 46 2 9 5 … … … … Bangladesh
12.8 15.2 35.4 29.1 21.6 44.2 6.4 13 1 35 23 … … … … Barbados
10.4 n 10.0 n 44.3 32.9 19.7 n 26.4 n 18.9 49 9 … … … … … … Belarus
9.3 n 6.4 n 24.6 16.8 21.2 16.9 10.4 30 22 … … … … … … Belgium
8.7 12.7 30.2 22.4 24.4 45.4 5.9 23 3 22 15 … … … … Belize
6.7 6.5 38.1 34.1 3.5 9.5 2.1 15 1 … … 17 21 35 16 Benin
12.0 12.6 29.0 26.9 4.7 6.6 0.5 … … 28 12 … … … … Bhutan
8.9 n 10.2 n 30.7 n 23.5 n 10.0 27.1 5.8 42 18 … … 35 … 28 25 Bolivia (Plurinational State of)
11.4 n 10.4 n 38.7 38.4 22.7 25.3 9.6 47 36 16 11 … … … … Bosnia and Herzegovina
8.0 n 10.0 n 39.1 37.9 3.0 22.8 7.0 … … 27 21 … … … … Botswana
10.4 10.0 39.4 26.6 16.5 22.1 10.1 22 13 29 o 31 o … … … … Brazil
8.7 n 5.9 n 23.6 n 16.9 n 8.5 n 7.2 n 1.9 32 4 … … … … … … Brunei Darussalam
10.4 n 8.9 n 40.0 31.2 22.0 20.4 11.4 48 27 26 32 … … … … Bulgaria
8.9 n 8.7 n 36.7 n 35.2 n 1.7 3.0 7.3 18 8 23 o 12 o … … … … Burkina Faso
6.2 n 5.9 n 42.2 n 39.5 n 2.8 n 3.7 n 9.7 … … 21 17 … … … … Burundi
4.7 5.2 22.5 16.8 1.6 2.8 4.7 42 3 … … 41 8 45 50 Cambodia
9.5 10.4 35.6 29.8 7.0 15.1 7.9 14 2 14 o 8 o … … … … Cameroon
10.9 n 8.3 n 17.4 13.2 24.6 23.9 10.2 24 17 … … … … … … Canada
15.6 14.7 47.7 38.4 6.3 15.3 5.0 14 3 15 12 69 57 36 36 Cape Verde
7.3 n 8.0 n 39.1 n 34.5 n 2.0 5.3 3.2 … … 30 o 35 o … … 27 17 Central African Republic
8.8 n 8.7 n 35.5 31.3 2.4 3.8 4.4 22 3 21 14 … … … … Chad
11.2 9.5 39.4 27.4 24.5 33.6 8.8 38 33 30 o 40 o … … … … Chile
9.6 9.4 29.8 25.6 4.6 6.5 5.6 51 2 7 o 4 o … … … … China
6.7 6.1 34.3 26.5 11.9 23.7 6.6 … … 27 o 28 o … 36 … … Colombia
7.9 n 7.6 n 40.8 n 36.5 n 3.5 5.3 0.3 24 9 22 15 … … … … Comoros
7.8 n 8.5 n 40.3 36.1 2.8 7.5 4.5 10 … 28 20 28 29 22 8 Congo
20.5 21.1 40.1 28.1 59.7 68.5 3.2 43 31 34 36 … … … … Cook Islands
10.1 10.2 31.6 22.5 20.9 28.3 5.8 24 8 16 13 … … … … Costa Rica
9.2 n 9.7 n 41.6 35.7 3.9 9.7 6.5 17 4 26 11 38 41 28 18 Côte d'Ivoire
10.2 n 8.4 n 42.4 34.2 22.8 19.4 15.0 36 30 23 26 … … … … Croatia
11.3 12.0 33.2 n 28.7 n 13.3 27.5 5.1 … … 20 15 … … … … Cuba
10.2 n 6.8 n 28.9 18.5 24.8 21.9 8.8 … … 13 8 … … … … Cyprus
11.5 9.1 39.3 27.7 30.5 26.5 16.5 43 31 36 34 … … … … Czech Republic
7.7 n 7.5 n 26.7 n 23.7 n 3.7 n 3.9 n 4.3 … … … … … … … … Democratic People's Republic of Korea
6.6 n 7.8 n 38.5 33.3 0.7 3.0 3.4 10 2 37 o 29 o 16 8 21 15 Democratic Republic of the Congo
011010011001101001100110100110011010011001101001100110100110011010011010010110010111101010100101010100101100101111010101001010101001010010011010011001001101001100100110100110010011010011001001101001001010101001010101001010101001010101001010101001010101001010101001010101001010101001010101001010101001010101001010101001010101001101001100110100110011010011001101001100110100110011010011001101001101100010101100010101100010101100010101100010101100010101100010101011010011001101001100110100110011010011001101001100110100110011010010100101010010101011000100110100101010010101011000100110100101010010101010110001001101001101001011010100110001001101001101001011010100110001001100101111010010101001010010111101001010100101001011110100101010010100101011010011001101001100110100110011010011001101001100110100110011010010010100110100010100110100010100110100010100110100010100110100010100101101001100110100110011010011001101001100110100110011010011001101001111010010101001010111010010111101001010100101011101001011110100101010010101011010011001101001100110100110011010011001101001100110100110011010011001011110101010010110010111101010100101100101111010101001011001010110100110011010011001101001100110100110011010011001101001100110100101001011010000100101101000010010110100001001011010000100101101000010010101101001100110100110011010011001101001100110100110011010011001101001
0101011000100110100110100101101010101100010011010011010010110101010101101001100110100110011010011001101001100110100110011010011001101001101001011001011110101010010101010010110010111101010100101010100101001001101001100100110100110010011010011001001101001100100110100100101010100101010100101010100101010100101010100101010100101010100101010100101010100101010100101010100101010100101010100101010100110100110011010011001101001100110100110011010011001101001100110100110110001010110001010110001010110001010110001010110001010110001010101101001100110100110011010011001101001100110100110011010011001101001010010101001010101100010011010010101001010101100010011010010101001010101011000100110100110100101101010011000100110100110100101101010011000100110010111101001010100101001011110100101010010100101111010010101001010010101101001100110100110011010011001101001100110100110011010011001101001001010011010001010011010001010011010001010011010001010011010001010010110100110011010011001101001100110100110011010011001101001100110100111101001010100101011101001011110100101010010101110100101111010010101001010101101001100110100110011010011001101001100110100110011010011001101001100101111010101001011001011110101010010110010111101010100101100101
010010100110101010110010100101100101111010101001010100101010110001001
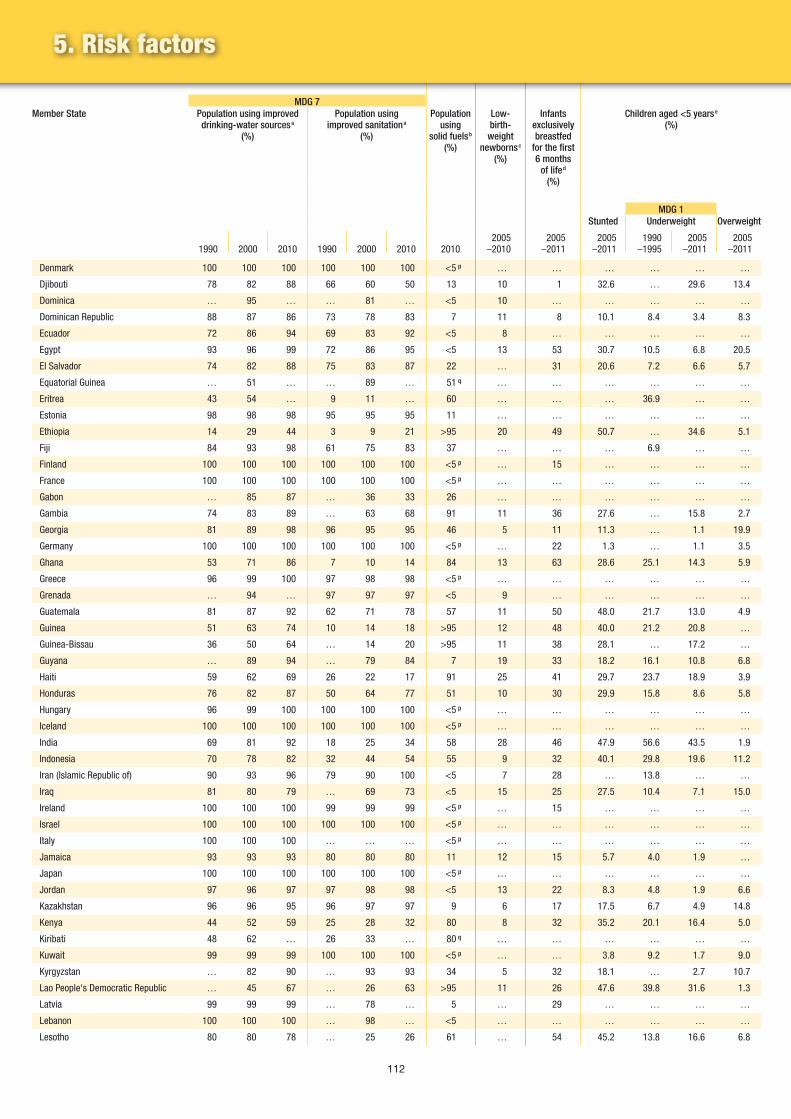
112
MDG 7Member State Population using improved
drinking-water sources a (%)
Population using improved sanitation a
(%)
Population using
solid fuels b (%)
Low- birth-
weight newborns c
(%)
Infants exclusively breastfed
for the first 6 months
of life d (%)
Children aged <5 years e
(%)
MDG 1Stunted Underweight Overweight
1990 2000 2010 1990 2000 2010 20102005
–20102005
–20112005
–20111990
–19952005
–20112005
–2011
Denmark 100 100 100 100 100 100 <5 p … … … … … …
Djibouti 78 82 88 66 60 50 13 10 1 32.6 … 29.6 13.4
Dominica … 95 … … 81 … <5 10 … … … … …
Dominican Republic 88 87 86 73 78 83 7 11 8 10.1 8.4 3.4 8.3
Ecuador 72 86 94 69 83 92 <5 8 … … … … …
Egypt 93 96 99 72 86 95 <5 13 53 30.7 10.5 6.8 20.5
El Salvador 74 82 88 75 83 87 22 … 31 20.6 7.2 6.6 5.7
Equatorial Guinea … 51 … … 89 … 51 q … … … … … …
Eritrea 43 54 … 9 11 … 60 … … … 36.9 … …
Estonia 98 98 98 95 95 95 11 … … … … … …
Ethiopia 14 29 44 3 9 21 >95 20 49 50.7 … 34.6 5.1
Fiji 84 93 98 61 75 83 37 … … … 6.9 … …
Finland 100 100 100 100 100 100 <5 p … 15 … … … …
France 100 100 100 100 100 100 <5 p … … … … … …
Gabon … 85 87 … 36 33 26 … … … … … …
Gambia 74 83 89 … 63 68 91 11 36 27.6 … 15.8 2.7
Georgia 81 89 98 96 95 95 46 5 11 11.3 … 1.1 19.9
Germany 100 100 100 100 100 100 <5 p … 22 1.3 … 1.1 3.5
Ghana 53 71 86 7 10 14 84 13 63 28.6 25.1 14.3 5.9
Greece 96 99 100 97 98 98 <5 p … … … … … …
Grenada … 94 … 97 97 97 <5 9 … … … … …
Guatemala 81 87 92 62 71 78 57 11 50 48.0 21.7 13.0 4.9
Guinea 51 63 74 10 14 18 >95 12 48 40.0 21.2 20.8 …
Guinea-Bissau 36 50 64 … 14 20 >95 11 38 28.1 … 17.2 …
Guyana … 89 94 … 79 84 7 19 33 18.2 16.1 10.8 6.8
Haiti 59 62 69 26 22 17 91 25 41 29.7 23.7 18.9 3.9
Honduras 76 82 87 50 64 77 51 10 30 29.9 15.8 8.6 5.8
Hungary 96 99 100 100 100 100 <5 p … … … … … …
Iceland 100 100 100 100 100 100 <5 p … … … … … …
India 69 81 92 18 25 34 58 28 46 47.9 56.6 43.5 1.9
Indonesia 70 78 82 32 44 54 55 9 32 40.1 29.8 19.6 11.2
Iran (Islamic Republic of) 90 93 96 79 90 100 <5 7 28 … 13.8 … …
Iraq 81 80 79 … 69 73 <5 15 25 27.5 10.4 7.1 15.0
Ireland 100 100 100 99 99 99 <5 p … 15 … … … …
Israel 100 100 100 100 100 100 <5 p … … … … … …
Italy 100 100 100 … … … <5 p … … … … … …
Jamaica 93 93 93 80 80 80 11 12 15 5.7 4.0 1.9 …
Japan 100 100 100 100 100 100 <5 p … … … … … …
Jordan 97 96 97 97 98 98 <5 13 22 8.3 4.8 1.9 6.6
Kazakhstan 96 96 95 96 97 97 9 6 17 17.5 6.7 4.9 14.8
Kenya 44 52 59 25 28 32 80 8 32 35.2 20.1 16.4 5.0
Kiribati 48 62 … 26 33 … 80 q … … … … … …
Kuwait 99 99 99 100 100 100 <5 p … … 3.8 9.2 1.7 9.0
Kyrgyzstan … 82 90 … 93 93 34 5 32 18.1 … 2.7 10.7
Lao People's Democratic Republic … 45 67 … 26 63 >95 11 26 47.6 39.8 31.6 1.3
Latvia 99 99 99 … 78 … 5 … 29 … … … …
Lebanon 100 100 100 … 98 … <5 … … … … … …
Lesotho 80 80 78 … 25 26 61 … 54 45.2 13.8 16.6 6.8
5. Risk factors

113
Tabl
e 5
MDG 6Prevalence of raised fasting blood glucose among adults
aged ≥25 years f (%)
Prevalence of raised blood
pressure among adults aged ≥25 years g
(%)
Adults aged ≥20 years who
are obese h (%)
Alcohol consumption
among adults aged ≥15 years i(litres of
pure alcohol per person per year)
Prevalence of smoking any
tobacco product among adults
aged ≥15 years j (%)
Prevalence of current tobacco
use among adolescents aged
13–15 years k (%)
Prevalence of condom use
by adults aged 15–49 years
during higher-risk sex l
(%)
Population aged 15–24 years with
comprehensive correct
knowledge of HIV/AIDS m
(%)
Member State
Male Female Male Female Male Female Male Female Male Female Male Female Male Female
2008 2008 2008 2008 2009 2005–2010 2005–2009 2005–2009
8.8 n 5.9 n 26.5 15.6 17.1 15.4 12.0 30 28 … … … … … … Denmark
9.7 n 9.4 n 38.8 n 32.5 n 6.7 n 13.8 n 1.9 … … 23 14 … … … … Djibouti
15.6 20.7 41.9 35.3 10.1 39.1 8.7 11 4 30 20 … … … … Dominica
8.0 9.0 35.6 29.5 14.4 29.3 6.3 17 13 … … 45 35 34 41 Dominican Republic
9.2 n 9.8 n 32.3 n 23.9 n 15.7 28.2 9.4 … … 31 o 26 o … … … … Ecuador
7.0 7.4 27.1 27.0 22.5 46.3 0.3 40 … 20 4 … … … … Egypt
11.3 10.7 27.8 20.7 20.2 32.9 4.0 … … 18 11 … … … … El Salvador
8.7 n 8.7 n 43.5 n 35.8 n 7.9 n 14.8 n 6.1 … … 25 17 … … … … Equatorial Guinea
7.8 n 7.3 n 32.2 28.1 1.3 2.3 1.6 10 2 8 5 … … … … Eritrea
9.0 7.8 47.3 33.2 20.2 17.6 17.2 46 23 34 28 … … … … Estonia
7.3 n 7.0 n 33.0 28.3 0.9 1.6 4.1 8 … … … 9 … … … Ethiopia
13.2 16.4 32.5 29.7 21.3 42.2 2.8 18 3 18 10 … … … … Fiji
10.3 6.3 34.9 22.7 21.0 18.6 13.1 28 22 … … … … … … Finland
7.2 4.3 29.1 16.2 16.8 14.6 12.5 36 27 … … … … … … France
9.1 n 9.9 n 40.0 33.0 8.4 21.5 9.5 19 3 … … … … … … Gabon
9.9 11.3 39.7 34.2 2.3 14.4 3.6 31 3 34 o 37 o … … … … Gambia
11.9 n 11.1 n 42.6 34.3 15.9 n 25.7 n 6.7 57 6 15 3 … … … … Georgia
9.8 6.3 31.1 20.7 23.1 19.2 12.1 33 25 … … … … … … Germany
9.9 10.3 32.7 31.6 4.4 11.7 3.1 11 3 14 11 26 18 34 28 Ghana
9.5 7.9 25.1 19.8 18.8 16.1 11.0 63 41 17 14 … … … … Greece
11.1 n 12.4 n 35.9 n 28.1 n 14.9 n 32.1 n 10.7 … … 25 17 … … … … Grenada
11.5 14.0 28.5 22.2 13.8 26.7 7.1 22 4 20 13 … … … … Guatemala
8.8 n 8.6 n 38.4 n 36.8 n 4.3 5.1 0.8 25 2 31 20 24 20 23 17 Guinea
8.6 n 9.1 n 37.6 n 35.3 n 2.6 n 8.1 n 3.9 … … 12 o 10 o … … … … Guinea-Bissau
10.8 n 13.1 n 32.1 n 28.0 n 8.3 n 27.1 n 8.7 27 6 25 16 65 48 47 53 Guyana
9.6 n 9.6 n 33.6 n 28.1 n 8.4 8.4 5.9 … … 22 o 24 o 34 21 40 34 Haiti
8.6 8.4 30.8 25.1 12.9 26.3 4.4 … 3 … … … 27 … 30 Honduras
10.6 n 8.5 n 42.7 31.3 26.2 22.9 16.1 43 33 28 27 … … … … Hungary
10.9 n 6.9 n 25.8 14.2 23.4 20.3 7.4 27 21 … … … … … … Iceland
11.1 10.8 23.1 22.6 1.3 2.5 2.7 26 4 19 8 23 12 36 20 India
6.6 7.1 32.5 29.3 2.5 6.9 0.6 61 5 41 6 … … … … Indonesia
9.3 10.5 30.9 26.9 13.6 29.5 1.0 26 2 33 20 … … … … Iran (Islamic Republic of)
12.7 12.5 30.1 n 28.7 n 22.3 36.2 0.5 31 4 18 o 15 o … … … … Iraq
8.4 5.6 34.9 20.7 25.7 23.3 14.9 … … … … … … … … Ireland
10.2 8.7 23.1 16.5 23.2 27.6 2.5 29 13 … … … … … … Israel
8.8 5.4 28.6 20.6 19.3 14.9 9.7 33 19 … … … … … … Italy
10.2 12.9 32.3 28.0 10.0 38.2 5.2 … … 31 25 … … … … Jamaica
7.2 4.7 26.4 16.7 5.5 3.5 7.8 42 12 … … … … … … Japan
17.2 18.1 26.0 20.3 27.3 41.7 0.7 47 6 34 19 … … … … Jordan
12.5 n 10.8 n 40.4 n 31.8 n 20.2 27.4 11.1 40 9 12 8 … … … … Kazakhstan
7.6 n 7.8 n 37.1 33.0 2.5 6.8 3.9 26 1 15 15 37 32 55 47 Kenya
23.6 24.9 31.2 21.6 37.7 53.6 2.7 71 43 43 32 … … … … Kiribati
17.0 14.8 29.0 23.7 37.2 52.4 0.1 35 4 25 11 … … … … Kuwait
11.1 n 10.4 n 38.5 n 33.4 n 11.7 21.6 4.7 45 2 10 4 … … … … Kyrgyzstan
7.1 n 7.6 n 28.1 24.0 1.7 4.1 7.0 51 4 8 o 4 o … … … … Lao People's Democratic Republic
10.4 n 9.0 n 44.5 n 32.7 n 21.5 21.8 13.5 50 22 42 34 … … … … Latvia
13.0 11.0 33.9 26.1 26.4 29.7 2.3 46 31 66 54 … … … … Lebanon
9.0 n 12.0 n 36.4 n 35.9 n 3.1 26.6 5.6 … … 26 22 … … … … Lesotho
011010011001101001100110100110011010011001101001100110100110011010011010010110010111101010100101010100101100101111010101001010101001010010011010011001001101001100100110100110010011010011001001101001001010101001010101001010101001010101001010101001010101001010101001010101001010101001010101001010101001010101001010101001010101001101001100110100110011010011001101001100110100110011010011001101001101100010101100010101100010101100010101100010101100010101100010101011010011001101001100110100110011010011001101001100110100110011010010100101010010101011000100110100101010010101011000100110100101010010101010110001001101001101001011010100110001001101001101001011010100110001001100101111010010101001010010111101001010100101001011110100101010010100101011010011001101001100110100110011010011001101001100110100110011010010010100110100010100110100010100110100010100110100010100110100010100101101001100110100110011010011001101001100110100110011010011001101001111010010101001010111010010111101001010100101011101001011110100101010010101011010011001101001100110100110011010011001101001100110100110011010011001011110101010010110010111101010100101100101111010101001011001010110100110011010011001101001100110100110011010011001101001100110100101001011010000100101101000010010110100001001011010000100101101000010010101101001100110100110011010011001101001100110100110011010011001101001
0101011000100110100110100101101010101100010011010011010010110101010101101001100110100110011010011001101001100110100110011010011001101001101001011001011110101010010101010010110010111101010100101010100101001001101001100100110100110010011010011001001101001100100110100100101010100101010100101010100101010100101010100101010100101010100101010100101010100101010100101010100101010100101010100101010100110100110011010011001101001100110100110011010011001101001100110100110110001010110001010110001010110001010110001010110001010110001010101101001100110100110011010011001101001100110100110011010011001101001010010101001010101100010011010010101001010101100010011010010101001010101011000100110100110100101101010011000100110100110100101101010011000100110010111101001010100101001011110100101010010100101111010010101001010010101101001100110100110011010011001101001100110100110011010011001101001001010011010001010011010001010011010001010011010001010011010001010010110100110011010011001101001100110100110011010011001101001100110100111101001010100101011101001011110100101010010101110100101111010010101001010101101001100110100110011010011001101001100110100110011010011001101001100101111010101001011001011110101010010110010111101010100101100101
010010100110101010110010100101100101111010101001010100101010110001001
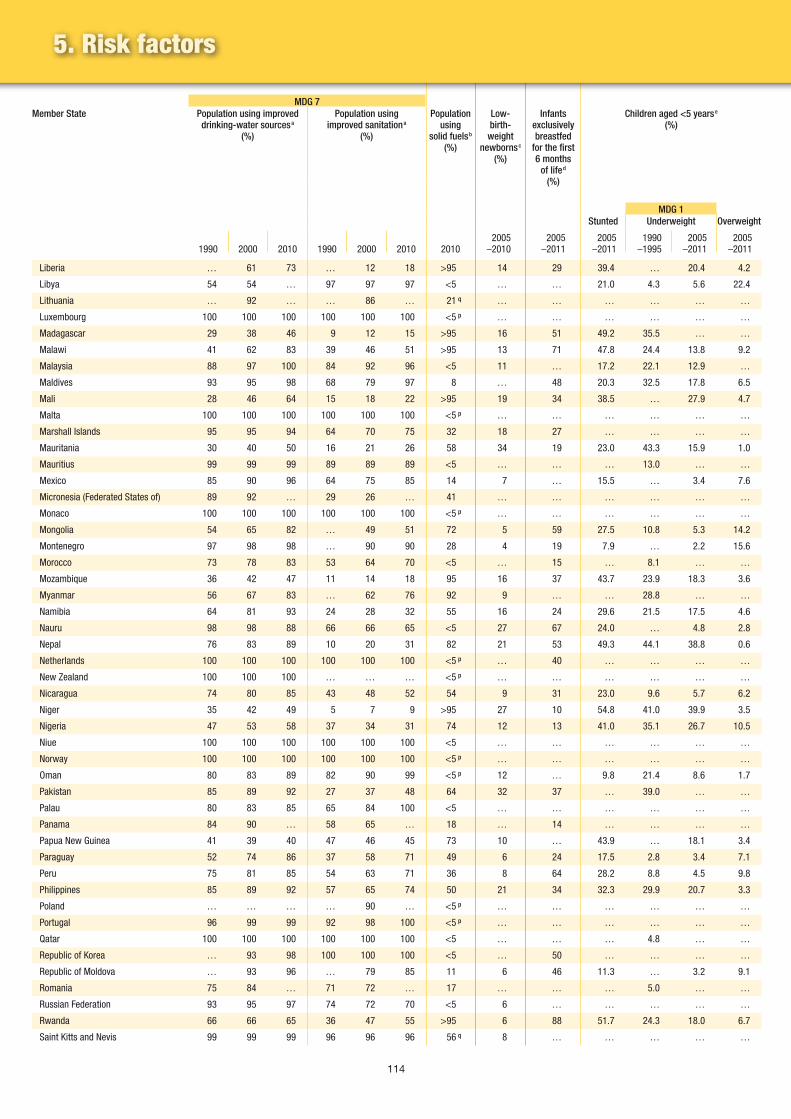
114
MDG 7Member State Population using improved
drinking-water sources a (%)
Population using improved sanitation a
(%)
Population using
solid fuels b (%)
Low- birth-
weight newborns c
(%)
Infants exclusively breastfed
for the first 6 months
of life d (%)
Children aged <5 years e
(%)
MDG 1Stunted Underweight Overweight
1990 2000 2010 1990 2000 2010 20102005
–20102005
–20112005
–20111990
–19952005
–20112005
–2011
Liberia … 61 73 … 12 18 >95 14 29 39.4 … 20.4 4.2
Libya 54 54 … 97 97 97 <5 … … 21.0 4.3 5.6 22.4
Lithuania … 92 … … 86 … 21 q … … … … … …
Luxembourg 100 100 100 100 100 100 <5 p … … … … … …
Madagascar 29 38 46 9 12 15 >95 16 51 49.2 35.5 … …
Malawi 41 62 83 39 46 51 >95 13 71 47.8 24.4 13.8 9.2
Malaysia 88 97 100 84 92 96 <5 11 … 17.2 22.1 12.9 …
Maldives 93 95 98 68 79 97 8 … 48 20.3 32.5 17.8 6.5
Mali 28 46 64 15 18 22 >95 19 34 38.5 … 27.9 4.7
Malta 100 100 100 100 100 100 <5 p … … … … … …
Marshall Islands 95 95 94 64 70 75 32 18 27 … … … …
Mauritania 30 40 50 16 21 26 58 34 19 23.0 43.3 15.9 1.0
Mauritius 99 99 99 89 89 89 <5 … … … 13.0 … …
Mexico 85 90 96 64 75 85 14 7 … 15.5 … 3.4 7.6
Micronesia (Federated States of) 89 92 … 29 26 … 41 … … … … … …
Monaco 100 100 100 100 100 100 <5 p … … … … … …
Mongolia 54 65 82 … 49 51 72 5 59 27.5 10.8 5.3 14.2
Montenegro 97 98 98 … 90 90 28 4 19 7.9 … 2.2 15.6
Morocco 73 78 83 53 64 70 <5 … 15 … 8.1 … …
Mozambique 36 42 47 11 14 18 95 16 37 43.7 23.9 18.3 3.6
Myanmar 56 67 83 … 62 76 92 9 … … 28.8 … …
Namibia 64 81 93 24 28 32 55 16 24 29.6 21.5 17.5 4.6
Nauru 98 98 88 66 66 65 <5 27 67 24.0 … 4.8 2.8
Nepal 76 83 89 10 20 31 82 21 53 49.3 44.1 38.8 0.6
Netherlands 100 100 100 100 100 100 <5 p … 40 … … … …
New Zealand 100 100 100 … … … <5 p … … … … … …
Nicaragua 74 80 85 43 48 52 54 9 31 23.0 9.6 5.7 6.2
Niger 35 42 49 5 7 9 >95 27 10 54.8 41.0 39.9 3.5
Nigeria 47 53 58 37 34 31 74 12 13 41.0 35.1 26.7 10.5
Niue 100 100 100 100 100 100 <5 … … … … … …
Norway 100 100 100 100 100 100 <5 p … … … … … …
Oman 80 83 89 82 90 99 <5 p 12 … 9.8 21.4 8.6 1.7
Pakistan 85 89 92 27 37 48 64 32 37 … 39.0 … …
Palau 80 83 85 65 84 100 <5 … … … … … …
Panama 84 90 … 58 65 … 18 … 14 … … … …
Papua New Guinea 41 39 40 47 46 45 73 10 … 43.9 … 18.1 3.4
Paraguay 52 74 86 37 58 71 49 6 24 17.5 2.8 3.4 7.1
Peru 75 81 85 54 63 71 36 8 64 28.2 8.8 4.5 9.8
Philippines 85 89 92 57 65 74 50 21 34 32.3 29.9 20.7 3.3
Poland … … … … 90 … <5 p … … … … … …
Portugal 96 99 99 92 98 100 <5 p … … … … … …
Qatar 100 100 100 100 100 100 <5 … … … 4.8 … …
Republic of Korea … 93 98 100 100 100 <5 … 50 … … … …
Republic of Moldova … 93 96 … 79 85 11 6 46 11.3 … 3.2 9.1
Romania 75 84 … 71 72 … 17 … … … 5.0 … …
Russian Federation 93 95 97 74 72 70 <5 6 … … … … …
Rwanda 66 66 65 36 47 55 >95 6 88 51.7 24.3 18.0 6.7
Saint Kitts and Nevis 99 99 99 96 96 96 56 q 8 … … … … …
5. Risk factors
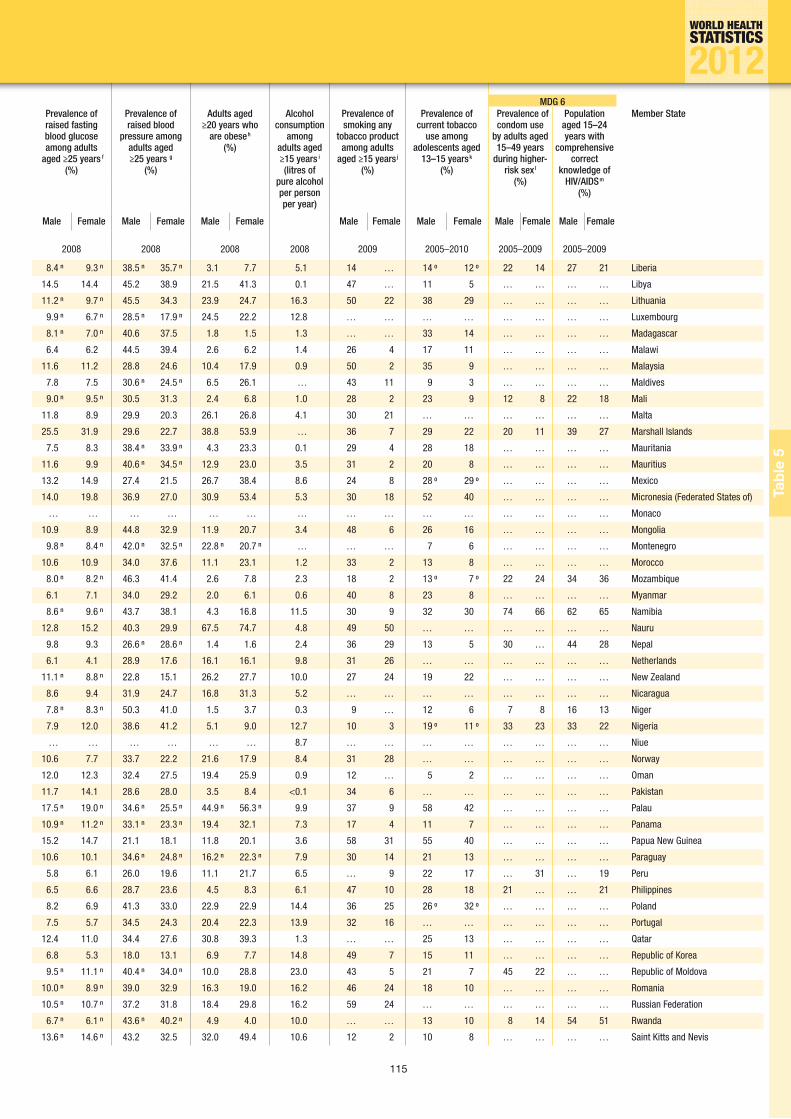
115
Tabl
e 5
MDG 6Prevalence of raised fasting blood glucose among adults
aged ≥25 years f (%)
Prevalence of raised blood
pressure among adults aged ≥25 years g
(%)
Adults aged ≥20 years who
are obese h (%)
Alcohol consumption
among adults aged ≥15 years i(litres of
pure alcohol per person per year)
Prevalence of smoking any
tobacco product among adults
aged ≥15 years j (%)
Prevalence of current tobacco
use among adolescents aged
13–15 years k (%)
Prevalence of condom use
by adults aged 15–49 years
during higher-risk sex l
(%)
Population aged 15–24 years with
comprehensive correct
knowledge of HIV/AIDS m
(%)
Member State
Male Female Male Female Male Female Male Female Male Female Male Female Male Female
2008 2008 2008 2008 2009 2005–2010 2005–2009 2005–2009
8.4 n 9.3 n 38.5 n 35.7 n 3.1 7.7 5.1 14 … 14 o 12 o 22 14 27 21 Liberia
14.5 14.4 45.2 38.9 21.5 41.3 0.1 47 … 11 5 … … … … Libya
11.2 n 9.7 n 45.5 34.3 23.9 24.7 16.3 50 22 38 29 … … … … Lithuania
9.9 n 6.7 n 28.5 n 17.9 n 24.5 22.2 12.8 … … … … … … … … Luxembourg
8.1 n 7.0 n 40.6 37.5 1.8 1.5 1.3 … … 33 14 … … … … Madagascar
6.4 6.2 44.5 39.4 2.6 6.2 1.4 26 4 17 11 … … … … Malawi
11.6 11.2 28.8 24.6 10.4 17.9 0.9 50 2 35 9 … … … … Malaysia
7.8 7.5 30.6 n 24.5 n 6.5 26.1 … 43 11 9 3 … … … … Maldives
9.0 n 9.5 n 30.5 31.3 2.4 6.8 1.0 28 2 23 9 12 8 22 18 Mali
11.8 8.9 29.9 20.3 26.1 26.8 4.1 30 21 … … … … … … Malta
25.5 31.9 29.6 22.7 38.8 53.9 … 36 7 29 22 20 11 39 27 Marshall Islands
7.5 8.3 38.4 n 33.9 n 4.3 23.3 0.1 29 4 28 18 … … … … Mauritania
11.6 9.9 40.6 n 34.5 n 12.9 23.0 3.5 31 2 20 8 … … … … Mauritius
13.2 14.9 27.4 21.5 26.7 38.4 8.6 24 8 28 o 29 o … … … … Mexico
14.0 19.8 36.9 27.0 30.9 53.4 5.3 30 18 52 40 … … … … Micronesia (Federated States of)
… … … … … … … … … … … … … … … Monaco
10.9 8.9 44.8 32.9 11.9 20.7 3.4 48 6 26 16 … … … … Mongolia
9.8 n 8.4 n 42.0 n 32.5 n 22.8 n 20.7 n … … … 7 6 … … … … Montenegro
10.6 10.9 34.0 37.6 11.1 23.1 1.2 33 2 13 8 … … … … Morocco
8.0 n 8.2 n 46.3 41.4 2.6 7.8 2.3 18 2 13 o 7 o 22 24 34 36 Mozambique
6.1 7.1 34.0 29.2 2.0 6.1 0.6 40 8 23 8 … … … … Myanmar
8.6 n 9.6 n 43.7 38.1 4.3 16.8 11.5 30 9 32 30 74 66 62 65 Namibia
12.8 15.2 40.3 29.9 67.5 74.7 4.8 49 50 … … … … … … Nauru
9.8 9.3 26.6 n 28.6 n 1.4 1.6 2.4 36 29 13 5 30 … 44 28 Nepal
6.1 4.1 28.9 17.6 16.1 16.1 9.8 31 26 … … … … … … Netherlands
11.1 n 8.8 n 22.8 15.1 26.2 27.7 10.0 27 24 19 22 … … … … New Zealand
8.6 9.4 31.9 24.7 16.8 31.3 5.2 … … … … … … … … Nicaragua
7.8 n 8.3 n 50.3 41.0 1.5 3.7 0.3 9 … 12 6 7 8 16 13 Niger
7.9 12.0 38.6 41.2 5.1 9.0 12.7 10 3 19 o 11 o 33 23 33 22 Nigeria
… … … … … … 8.7 … … … … … … … … Niue
10.6 7.7 33.7 22.2 21.6 17.9 8.4 31 28 … … … … … … Norway
12.0 12.3 32.4 27.5 19.4 25.9 0.9 12 … 5 2 … … … … Oman
11.7 14.1 28.6 28.0 3.5 8.4 <0.1 34 6 … … … … … … Pakistan
17.5 n 19.0 n 34.6 n 25.5 n 44.9 n 56.3 n 9.9 37 9 58 42 … … … … Palau
10.9 n 11.2 n 33.1 n 23.3 n 19.4 32.1 7.3 17 4 11 7 … … … … Panama
15.2 14.7 21.1 18.1 11.8 20.1 3.6 58 31 55 40 … … … … Papua New Guinea
10.6 10.1 34.6 n 24.8 n 16.2 n 22.3 n 7.9 30 14 21 13 … … … … Paraguay
5.8 6.1 26.0 19.6 11.1 21.7 6.5 … 9 22 17 … 31 … 19 Peru
6.5 6.6 28.7 23.6 4.5 8.3 6.1 47 10 28 18 21 … … 21 Philippines
8.2 6.9 41.3 33.0 22.9 22.9 14.4 36 25 26 o 32 o … … … … Poland
7.5 5.7 34.5 24.3 20.4 22.3 13.9 32 16 … … … … … … Portugal
12.4 11.0 34.4 27.6 30.8 39.3 1.3 … … 25 13 … … … … Qatar
6.8 5.3 18.0 13.1 6.9 7.7 14.8 49 7 15 11 … … … … Republic of Korea
9.5 n 11.1 n 40.4 n 34.0 n 10.0 28.8 23.0 43 5 21 7 45 22 … … Republic of Moldova
10.0 n 8.9 n 39.0 32.9 16.3 19.0 16.2 46 24 18 10 … … … … Romania
10.5 n 10.7 n 37.2 31.8 18.4 29.8 16.2 59 24 … … … … … … Russian Federation
6.7 n 6.1 n 43.6 n 40.2 n 4.9 4.0 10.0 … … 13 10 8 14 54 51 Rwanda
13.6 n 14.6 n 43.2 32.5 32.0 49.4 10.6 12 2 10 8 … … … … Saint Kitts and Nevis
011010011001101001100110100110011010011001101001100110100110011010011010010110010111101010100101010100101100101111010101001010101001010010011010011001001101001100100110100110010011010011001001101001001010101001010101001010101001010101001010101001010101001010101001010101001010101001010101001010101001010101001010101001010101001101001100110100110011010011001101001100110100110011010011001101001101100010101100010101100010101100010101100010101100010101100010101011010011001101001100110100110011010011001101001100110100110011010010100101010010101011000100110100101010010101011000100110100101010010101010110001001101001101001011010100110001001101001101001011010100110001001100101111010010101001010010111101001010100101001011110100101010010100101011010011001101001100110100110011010011001101001100110100110011010010010100110100010100110100010100110100010100110100010100110100010100101101001100110100110011010011001101001100110100110011010011001101001111010010101001010111010010111101001010100101011101001011110100101010010101011010011001101001100110100110011010011001101001100110100110011010011001011110101010010110010111101010100101100101111010101001011001010110100110011010011001101001100110100110011010011001101001100110100101001011010000100101101000010010110100001001011010000100101101000010010101101001100110100110011010011001101001100110100110011010011001101001
0101011000100110100110100101101010101100010011010011010010110101010101101001100110100110011010011001101001100110100110011010011001101001101001011001011110101010010101010010110010111101010100101010100101001001101001100100110100110010011010011001001101001100100110100100101010100101010100101010100101010100101010100101010100101010100101010100101010100101010100101010100101010100101010100101010100110100110011010011001101001100110100110011010011001101001100110100110110001010110001010110001010110001010110001010110001010110001010101101001100110100110011010011001101001100110100110011010011001101001010010101001010101100010011010010101001010101100010011010010101001010101011000100110100110100101101010011000100110100110100101101010011000100110010111101001010100101001011110100101010010100101111010010101001010010101101001100110100110011010011001101001100110100110011010011001101001001010011010001010011010001010011010001010011010001010011010001010010110100110011010011001101001100110100110011010011001101001100110100111101001010100101011101001011110100101010010101110100101111010010101001010101101001100110100110011010011001101001100110100110011010011001101001100101111010101001011001011110101010010110010111101010100101100101
010010100110101010110010100101100101111010101001010100101010110001001

116
MDG 7Member State Population using improved
drinking-water sources a (%)
Population using improved sanitation a
(%)
Population using
solid fuels b (%)
Low- birth-
weight newborns c
(%)
Infants exclusively breastfed
for the first 6 months
of life d (%)
Children aged <5 years e
(%)
MDG 1Stunted Underweight Overweight
1990 2000 2010 1990 2000 2010 20102005
–20102005
–20112005
–20111990
–19952005
–20112005
–2011
Saint Lucia 94 95 96 58 62 65 <5 11 … … … … …
Saint Vincent and the Grenadines … … … … … … <5 8 … … … … …
Samoa 89 92 96 99 98 98 53 10 51 … … … …
San Marino … … … … … … <5 p … … … … … …
Sao Tome and Principe … 79 89 … 21 26 71 8 51 31.6 … 14.4 11.6
Saudi Arabia 89 … … … … … <5 p … … 9.3 13.5 5.3 6.1
Senegal 61 66 72 38 45 52 51 19 34 20.1 19.0 14.5 2.4
Serbia 99 99 99 … 92 92 32 6 15 8.1 … 1.8 19.3
Seychelles … … … … … … <5 … … … … … …
Sierra Leone 38 46 55 11 11 13 >95 14 11 37.4 25.4 21.3 10.1
Singapore 100 100 100 99 100 100 <5 p … … … … … …
Slovakia 100 100 100 100 100 100 <5 … … … … … …
Slovenia 100 100 99 100 100 100 <5 … … … … … …
Solomon Islands … 70 … … 31 … 90 13 74 32.8 … 11.5 2.5
Somalia … 22 29 … 22 23 >95 … 5 42.1 … 32.8 4.7
South Africa 83 86 91 71 75 79 15 … … 23.9 8.0 8.7 …
Spain 100 100 100 100 100 100 <5 p … … … … … …
Sri Lanka 67 80 91 70 82 92 75 17 76 19.2 33.8 21.6 0.8
Sudan 65 62 58 27 27 26 79 … 41 37.9 31.8 31.7 5.3
Suriname … 89 92 … 81 83 12 … 2 10.7 … 7.5 4.0
Swaziland 39 52 71 48 52 57 55 9 44 40.4 … 7.3 …
Sweden 100 100 100 100 100 100 <5 p … … … … … …
Switzerland 100 100 100 100 100 100 <5 p … … … … … …
Syrian Arab Republic 86 87 90 85 88 95 <5 10 29 27.5 11.5 10.1 17.9
Tajikistan … 61 64 … 90 94 34 10 25 39.2 … 15.0 …
Thailand 86 92 96 84 94 96 26 7 15 15.7 16.3 7.0 8.0
The former Yugoslav Republic of Macedonia 100 100 100 … 88 88 33 6 16 11.5 … 1.8 16.2
Timor-Leste … 54 69 … 39 47 92 … 52 57.7 … 45.3 5.8
Togo 49 55 61 13 13 13 94 11 63 26.9 … 20.5 …
Tonga 100 100 100 96 96 96 43 … … … … … …
Trinidad and Tobago 88 91 94 93 92 92 <5 19 13 … … … …
Tunisia 81 90 … 74 81 … <5 5 6 9.0 8.1 3.3 8.8
Turkey 85 93 100 84 87 90 <5 11 42 … 8.7 … …
Turkmenistan … 83 … 98 98 98 <5 4 11 … … … …
Tuvalu 90 94 98 80 83 85 19 … 35 10.0 … 1.6 6.3
Uganda 43 58 72 27 30 34 >95 14 60 38.7 21.5 16.4 4.9
Ukraine … 97 98 … 95 94 <5 4 18 … … … …
United Arab Emirates 100 100 100 97 97 98 <5 6 … … … … …
United Kingdom 100 100 100 100 100 100 <5 p … <1 … … … …
United Republic of Tanzania 55 54 53 7 9 10 94 10 50 42.5 25.1 16.2 5.5
United States of America 99 99 99 100 100 100 <5 p … 13 … 0.9 … …
Uruguay 96 98 100 94 96 100 <5 9 57 … … … …
Uzbekistan 90 89 87 84 91 100 11 5 26 19.6 … 4.4 12.8
Vanuatu 62 76 90 … 41 57 84 10 40 25.9 … 11.7 4.7
Venezuela (Bolivarian Republic of) 90 92 … 82 89 … <5 8 12 15.6 6.7 3.7 6.1
Viet Nam 57 77 95 37 56 76 56 5 17 30.5 36.9 20.2 3.0
Yemen 67 60 55 24 39 53 33 … … … 29.6 … …
Zambia 49 54 61 46 47 48 83 11 61 45.8 21.2 14.9 8.4
Zimbabwe 79 80 80 41 40 40 66 11 6 35.8 11.7 14.0 9.1
5. Risk factors

117
Tabl
e 5
MDG 6Prevalence of raised fasting blood glucose among adults
aged ≥25 years f (%)
Prevalence of raised blood
pressure among adults aged ≥25 years g
(%)
Adults aged ≥20 years who
are obese h (%)
Alcohol consumption
among adults aged ≥15 years i(litres of
pure alcohol per person per year)
Prevalence of smoking any
tobacco product among adults
aged ≥15 years j (%)
Prevalence of current tobacco
use among adolescents aged
13–15 years k (%)
Prevalence of condom use
by adults aged 15–49 years
during higher-risk sex l
(%)
Population aged 15–24 years with
comprehensive correct
knowledge of HIV/AIDS m
(%)
Member State
Male Female Male Female Male Female Male Female Male Female Male Female Male Female
2008 2008 2008 2008 2009 2005–2010 2005–2009 2005–2009
10.3 n 11.8 n 37.1 n 27.4 n 11.9 31.9 12.1 28 12 22 15 … … … … Saint Lucia
11.1 n 12.5 n 35.4 n 27.5 n 16.4 n 33.5 n 5.0 18 6 22 17 … … … … Saint Vincent and the Grenadines
21.2 23.7 37.2 28.3 45.3 66.7 4.5 58 23 26 20 … … … … Samoa
… … … … … … … … … … … … … … … San Marino
9.3 n 10.3 n 46.3 42.4 6.4 15.4 8.5 9 2 … … 33 28 43 43 Sao Tome and Principe
22.0 21.7 32.9 28.7 29.5 43.5 0.3 24 1 21 9 … … … … Saudi Arabia
9.3 n 10.6 n 37.9 n 34.4 n 3.2 12.5 0.5 16 … 20 10 31 21 24 19 Senegal
10.3 n 8.2 n 42.5 33.6 25.5 20.3 12.2 38 27 11 10 … … … … Serbia
13.7 13.2 43.2 31.9 15.1 33.7 12.1 24 5 27 25 … … … … Seychelles
9.2 n 10.0 n 41.9 40.5 3.6 10.1 9.5 39 8 20 24 15 7 28 17 Sierra Leone
7.5 5.4 24.3 18.5 6.6 6.2 1.5 35 6 … … … … … … Singapore
10.6 n 9.2 n 42.1 n 32.5 n 24.9 n 24.3 n 13.3 39 19 29 25 … … … … Slovakia
10.7 n 8.8 n 43.3 n 32.8 n 28.1 n 25.9 n 14.9 30 22 17 24 … … … … Slovenia
17.1 18.3 26.5 25.9 25.3 39.2 1.4 46 19 44 37 … … … … Solomon Islands
7.9 n 7.7 n 39.9 n 35.7 n 3.4 n 7.1 n 0.5 … … 16 o 12 o … … … … Somalia
11.9 11.7 39.9 34.9 23.2 42.8 10.2 24 8 29 20 … … … … South Africa
11.0 8.8 27.7 18.6 24.9 23.0 11.8 36 27 … … … … … … Spain
9.3 8.6 31.0 26.2 2.6 7.3 0.8 27 … 12 6 … … … … Sri Lanka
8.6 n 8.1 n 39.9 n 33.5 n 4.1 n 8.9 n 2.6 24 2 10 4 … … … … Sudan
11.6 n 13.5 n 34.2 n 26.7 n 16.5 n 34.6 n 6.6 … … 21 17 … … … … Suriname
9.0 n 12.2 n 40.5 n 36.4 n 6.1 37.1 5.1 16 2 16 9 56 55 52 52 Swaziland
8.1 6.0 29.7 19.3 18.2 15.0 10.0 … … … … … … … … Sweden
9.3 5.3 27.4 14.9 18.3 11.6 11.4 31 21 … … … … … … Switzerland
12.9 n 12.8 n 31.8 n 29.6 n 23.8 39.0 1.5 42 … 32 19 … … … … Syrian Arab Republic
10.7 n 9.7 n 37.4 n 34.1 n 8.0 11.6 3.4 … … … … … … … … Tajikistan
7.3 7.1 24.6 20.2 4.9 11.8 7.1 45 3 24 8 … … … … Thailand
10.4 n 8.8 n 39.8 n 33.2 n 21.6 18.9 8.9 … … 12 12 … … … … The former Yugoslav Republic of Macedonia
6.4 n 6.9 n 28.2 n 24.7 n 1.5 n 4.3 n 0.7 … … 60 53 … … … … Timor-Leste
8.7 n 9.1 n 38.8 n 35.3 n 3.0 6.1 1.9 … … 18 8 … … … … Togo
17.0 19.3 34.1 27.0 49.1 70.3 3.9 44 13 … … … … … … Tonga
12.1 n 13.0 n 34.8 27.7 21.6 38.0 6.2 27 11 21 18 … … … … Trinidad and Tobago
12.0 12.7 32.4 31.6 13.9 33.4 1.1 58 5 20 4 … … … … Tunisia
10.1 9.8 24.0 24.9 22.8 35.6 3.0 47 15 14 7 … … … … Turkey
12.0 n 10.1 n 38.3 n 32.8 n 13.9 14.5 5.0 … … … … … … … … Turkmenistan
… … … … … … 2.1 51 20 42 33 … … … … Tuvalu
6.8 n 6.5 n 42.9 n 39.6 n 4.3 4.9 16.4 16 3 17 15 20 24 38 32 Uganda
10.2 n 10.2 n 45.8 35.4 15.5 23.6 17.5 50 13 30 22 46 48 43 45 Ukraine
15.3 15.8 30.4 21.2 30.2 43.0 0.5 19 2 25 13 … … … … United Arab Emirates
7.8 5.7 27.7 19.1 24.4 25.2 13.2 25 23 … … … … … … United Kingdom
8.3 8.5 36.2 33.9 4.0 6.8 7.9 21 3 12 o 9 o 22 21 42 39 United Republic of Tanzania
12.6 9.1 17.0 14.2 30.2 33.2 9.7 33 25 15 11 … … … … United States of America
10.7 10.0 37.5 25.4 20.7 26.0 9.0 31 22 21 25 … … … … Uruguay
12.6 10.9 30.5 26.3 14.5 19.8 3.6 22 3 3 o 2 o … … … … Uzbekistan
9.2 9.6 40.7 36.5 22.9 36.8 1.0 43 8 34 20 … … … … Vanuatu
11.1 10.9 37.1 25.4 26.6 34.8 7.6 … … 11 7 … … … … Venezuela (Bolivarian Republic of)
7.5 7.9 29.1 23.3 1.2 2.0 3.9 48 2 7 2 58 … 50 42 Viet Nam
11.1 n 11.0 n 32.2 n 29.3 n 10.5 n 22.7 n 0.2 35 11 15 11 … … … … Yemen
7.2 7.5 41.0 37.9 1.2 7.0 3.6 24 4 26 o 26 o 28 33 37 34 Zambia
8.7 n 9.9 n 36.9 36.4 2.8 13.8 5.0 30 4 15 o 8 o 36 41 46 44 Zimbabwe
011010011001101001100110100110011010011001101001100110100110011010011010010110010111101010100101010100101100101111010101001010101001010010011010011001001101001100100110100110010011010011001001101001001010101001010101001010101001010101001010101001010101001010101001010101001010101001010101001010101001010101001010101001010101001101001100110100110011010011001101001100110100110011010011001101001101100010101100010101100010101100010101100010101100010101100010101011010011001101001100110100110011010011001101001100110100110011010010100101010010101011000100110100101010010101011000100110100101010010101010110001001101001101001011010100110001001101001101001011010100110001001100101111010010101001010010111101001010100101001011110100101010010100101011010011001101001100110100110011010011001101001100110100110011010010010100110100010100110100010100110100010100110100010100110100010100101101001100110100110011010011001101001100110100110011010011001101001111010010101001010111010010111101001010100101011101001011110100101010010101011010011001101001100110100110011010011001101001100110100110011010011001011110101010010110010111101010100101100101111010101001011001010110100110011010011001101001100110100110011010011001101001100110100101001011010000100101101000010010110100001001011010000100101101000010010101101001100110100110011010011001101001100110100110011010011001101001
0101011000100110100110100101101010101100010011010011010010110101010101101001100110100110011010011001101001100110100110011010011001101001101001011001011110101010010101010010110010111101010100101010100101001001101001100100110100110010011010011001001101001100100110100100101010100101010100101010100101010100101010100101010100101010100101010100101010100101010100101010100101010100101010100101010100110100110011010011001101001100110100110011010011001101001100110100110110001010110001010110001010110001010110001010110001010110001010101101001100110100110011010011001101001100110100110011010011001101001010010101001010101100010011010010101001010101100010011010010101001010101011000100110100110100101101010011000100110100110100101101010011000100110010111101001010100101001011110100101010010100101111010010101001010010101101001100110100110011010011001101001100110100110011010011001101001001010011010001010011010001010011010001010011010001010011010001010010110100110011010011001101001100110100110011010011001101001100110100111101001010100101011101001011110100101010010101110100101111010010101001010101101001100110100110011010011001101001100110100110011010011001101001100101111010101001011001011110101010010110010111101010100101100101
010010100110101010110010100101100101111010101001010100101010110001001

118
MDG 7Member State Population using improved
drinking-water sources a (%)
Population using improved sanitation a
(%)
Population using
solid fuels b (%)
Low- birth-
weight newborns c
(%)
Infants exclusively breastfed
for the first 6 months
of life d (%)
Children aged <5 years e
(%)
MDG 1Stunted Underweight Overweight
1990 2000 2010 1990 2000 2010 20102005
–20102005
–20112005
–20111990
–19952005
–20112005
–2011
Ranges of country valuesMinimum 14 22 29 3 7 9 <5 3 1 1.3 0.6 0.5 0.0
Median 88 90 94 74 80 85 14 10 31 27.9 16.1 11.8 6.8
Maximum 100 100 100 100 100 100 >95 34 89 57.7 61.5 45.3 25.6
WHO regionAfrican Region 50 56 63 29 31 34 77 13 33 … … … …
Region of the Americas 91 94 96 80 84 87 10 8 29 … … … …
South-East Asia Region 71 81 90 25 34 43 61 24 45 … … … …
European Region 96 97 98 91 91 92 5 7 24 … … … …
Eastern Mediterranean Region 84 82 85 52 59 66 33 21 35 … … … …
Western Pacific Region 71 82 92 36 52 69 42 5 … … … … …
Income groupLow income 54 58 65 21 31 37 91 15 42 … … … …
Lower middle income 70 79 87 29 39 47 54 21 38 … … … …
Upper middle income 76 85 93 46 60 73 29 5 … … … … …
High income 99 99 100 100 99 100 <5 … 16 … … … …
Global 76 83 89 49 56 63 41 15 37 26.7 25.4 16.2 6.7
a Progress on drinking-water and sanitation: 2012 Update. New York, UNICEF and Geneva, World Health Organization, 2012 (http://whqlibdoc.who.int/publica-tions/2012/9789280646320_eng_full_text.pdf).
b These estimates are based on the WHO Household Energy database (available at: http://apps.who.int/ghodata/). This database contains compiled information on cook-ing fuel use and cooking practices from about 580 nationally representative data sources, including all Demographic and Health Surveys (Macro International), Multiple Indicator Cluster Surveys (UNICEF), World Health Surveys (WHO) and Living Standards Measurement Studies (World Bank) as well as national censuses/surveys and national energy statistics. Unless otherwise noted, where solid fuel use information is available for a country it was derived using a multilevel model approach which only accounts for regions, countries and time as a spline function, and estimates are restricted to values ranging from zero to one.
c The state of the world’s children, 2012: Children in an urban world. New York, UNICEF, 2012 (http://www.unicef.org/sowc/index_sowc.html).
d WHO global data bank on infant and young child feeding. Geneva, World Health Orga-nization, 2012 (http://www.who.int/nutrition/databases/infantfeeding).
e Global database on child growth and malnutrition. Geneva, World Health Organization, 2012 (http://www.who.int/nutgrowthdb/database/en). For the reference period 1990–1995, figures refer to the first available survey year in the period. For the reference period 2005–2011, figures refer to the latest available survey year in the period. Under-weight is calculated as the prevalence of weight-for-age less than -2 standard devia-tions; stunting is the prevalence of height-for-age less than -2 standard deviations; and overweight is the prevalence of weight-for-height above +2 standard deviations (using
the WHO Child Growth Standards median). Global estimates refer to 2010 for stunting and overweight, and 1990 and 2010 for underweight. For more information, please see the above database.
f Percentage of population aged 25 years and over with fasting glucose ≥126 mg/dl (7.0 mmol/l) or on medication for raised blood glucose. Global status report on noncommu-nicable diseases 2010. Geneva, World Health Organization, 2011 (http://www.who.int/nmh/publications/ncd_report2010). See Annex 4: Country estimates of NCD mortality and selected risk factors, 2008. Figures reported are age-standardized point estimates, and uncertainty ranges are available on the Global Health Observatory web site (http://www.who.int/gho). Income-group aggregates are based on the 2008 World Bank list of economies.
g Percentage of population aged 25 years and over with raised blood pressure (systolic blood pressure ≥140 or diastolic blood pressure ≥90). Global Health Observatory. Ge-neva, World Health Organization, 2011. Figures reported are age-standardized point estimates, and uncertainty ranges are available on the Global Health Observatory web site (http://www.who.int/gho). Income-group aggregates are based on the 2008 World Bank list of economies.
h Percentage of population aged 20 years and over with a body mass index ≥30.00 kg/ m2. Global status report on noncommunicable diseases 2010. Geneva, World Health Orga-nization, 2011 (http://www.who.int/nmh/publications/ncd_report2010). See Annex 4: Country estimates of NCD mortality and selected risk factors, 2008. Figures reported are age-standardized point estimates, and uncertainty ranges are available on the Glob-al Health Observatory web site (http://www.who.int/gho). Income-group aggregates are based on the 2008 World Bank list of economies.
5. Risk factors
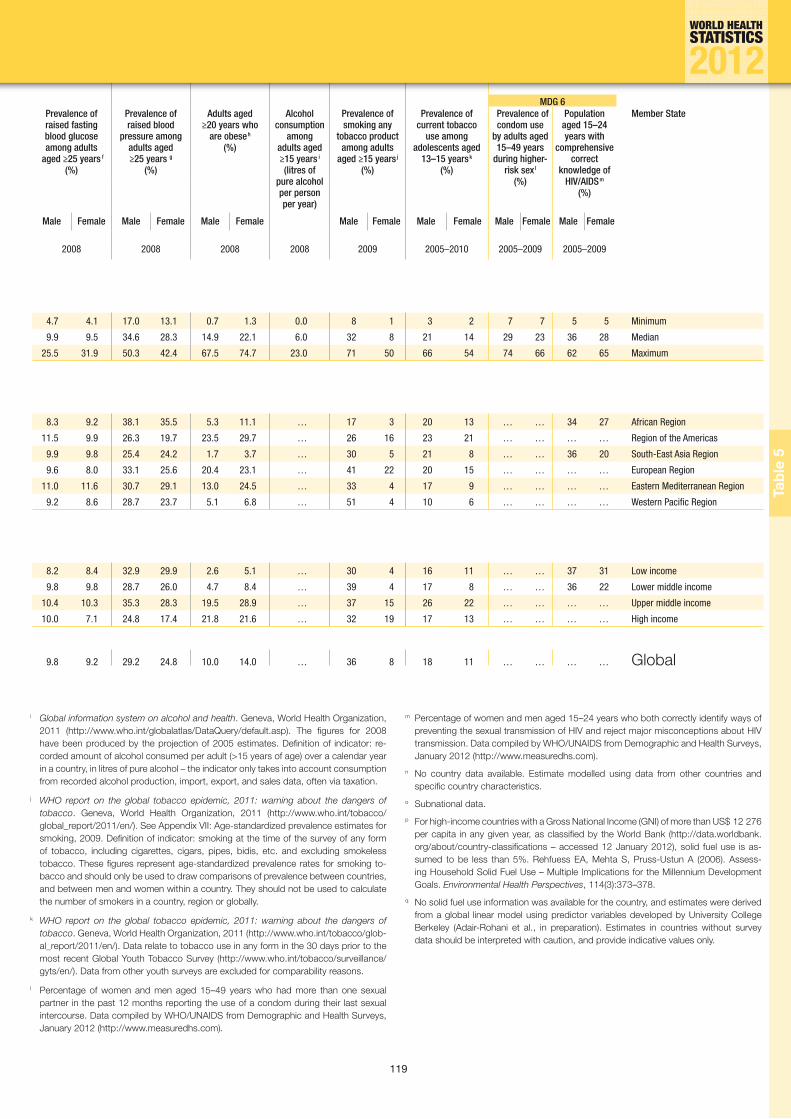
119
Tabl
e 5
MDG 6Prevalence of raised fasting blood glucose among adults
aged ≥25 years f (%)
Prevalence of raised blood
pressure among adults aged ≥25 years g
(%)
Adults aged ≥20 years who
are obese h (%)
Alcohol consumption
among adults aged ≥15 years i(litres of
pure alcohol per person per year)
Prevalence of smoking any
tobacco product among adults
aged ≥15 years j (%)
Prevalence of current tobacco
use among adolescents aged
13–15 years k (%)
Prevalence of condom use
by adults aged 15–49 years
during higher-risk sex l
(%)
Population aged 15–24 years with
comprehensive correct
knowledge of HIV/AIDS m
(%)
Member State
Male Female Male Female Male Female Male Female Male Female Male Female Male Female
2008 2008 2008 2008 2009 2005–2010 2005–2009 2005–2009
4.7 4.1 17.0 13.1 0.7 1.3 0.0 8 1 3 2 7 7 5 5 Minimum
9.9 9.5 34.6 28.3 14.9 22.1 6.0 32 8 21 14 29 23 36 28 Median
25.5 31.9 50.3 42.4 67.5 74.7 23.0 71 50 66 54 74 66 62 65 Maximum
8.3 9.2 38.1 35.5 5.3 11.1 … 17 3 20 13 … … 34 27 African Region
11.5 9.9 26.3 19.7 23.5 29.7 … 26 16 23 21 … … … … Region of the Americas
9.9 9.8 25.4 24.2 1.7 3.7 … 30 5 21 8 … … 36 20 South-East Asia Region
9.6 8.0 33.1 25.6 20.4 23.1 … 41 22 20 15 … … … … European Region
11.0 11.6 30.7 29.1 13.0 24.5 … 33 4 17 9 … … … … Eastern Mediterranean Region
9.2 8.6 28.7 23.7 5.1 6.8 … 51 4 10 6 … … … … Western Pacific Region
8.2 8.4 32.9 29.9 2.6 5.1 … 30 4 16 11 … … 37 31 Low income
9.8 9.8 28.7 26.0 4.7 8.4 … 39 4 17 8 … … 36 22 Lower middle income
10.4 10.3 35.3 28.3 19.5 28.9 … 37 15 26 22 … … … … Upper middle income
10.0 7.1 24.8 17.4 21.8 21.6 … 32 19 17 13 … … … … High income
9.8 9.2 29.2 24.8 10.0 14.0 … 36 8 18 11 … … … … Global
i Global information system on alcohol and health. Geneva, World Health Organization, 2011 (http://www.who.int/globalatlas/DataQuery/default.asp). The figures for 2008 have been produced by the projection of 2005 estimates. Definition of indicator: re-corded amount of alcohol consumed per adult (>15 years of age) over a calendar year in a country, in litres of pure alcohol – the indicator only takes into account consumption from recorded alcohol production, import, export, and sales data, often via taxation.
j WHO report on the global tobacco epidemic, 2011: warning about the dangers of tobacco. Geneva, World Health Organization, 2011 (http://www.who.int/tobacco/global_report/2011/en/). See Appendix VII: Age-standardized prevalence estimates for smoking, 2009. Definition of indicator: smoking at the time of the survey of any form of tobacco, including cigarettes, cigars, pipes, bidis, etc. and excluding smokeless tobacco. These figures represent age-standardized prevalence rates for smoking to-bacco and should only be used to draw comparisons of prevalence between countries, and between men and women within a country. They should not be used to calculate the number of smokers in a country, region or globally.
k WHO report on the global tobacco epidemic, 2011: warning about the dangers of tobacco. Geneva, World Health Organization, 2011 (http://www.who.int/tobacco/glob-al_report/2011/en/). Data relate to tobacco use in any form in the 30 days prior to the most recent Global Youth Tobacco Survey (http://www.who.int/tobacco/surveillance/gyts/en/). Data from other youth surveys are excluded for comparability reasons.
l Percentage of women and men aged 15–49 years who had more than one sexual partner in the past 12 months reporting the use of a condom during their last sexual intercourse. Data compiled by WHO/UNAIDS from Demographic and Health Surveys, January 2012 (http://www.measuredhs.com).
m Percentage of women and men aged 15–24 years who both correctly identify ways of preventing the sexual transmission of HIV and reject major misconceptions about HIV transmission. Data compiled by WHO/UNAIDS from Demographic and Health Surveys, January 2012 (http://www.measuredhs.com).
n No country data available. Estimate modelled using data from other countries and specific country characteristics.
o Subnational data.
p For high-income countries with a Gross National Income (GNI) of more than US$ 12 276 per capita in any given year, as classified by the World Bank (http://data.worldbank.org/about/country-classifications – accessed 12 January 2012), solid fuel use is as-sumed to be less than 5%. Rehfuess EA, Mehta S, Pruss-Ustun A (2006). Assess-ing Household Solid Fuel Use – Multiple Implications for the Millennium Development Goals. Environmental Health Perspectives, 114(3):373–378.
q No solid fuel use information was available for the country, and estimates were derived from a global linear model using predictor variables developed by University College Berkeley (Adair-Rohani et al., in preparation). Estimates in countries without survey data should be interpreted with caution, and provide indicative values only.
011010011001101001100110100110011010011001101001100110100110011010011010010110010111101010100101010100101100101111010101001010101001010010011010011001001101001100100110100110010011010011001001101001001010101001010101001010101001010101001010101001010101001010101001010101001010101001010101001010101001010101001010101001010101001101001100110100110011010011001101001100110100110011010011001101001101100010101100010101100010101100010101100010101100010101100010101011010011001101001100110100110011010011001101001100110100110011010010100101010010101011000100110100101010010101011000100110100101010010101010110001001101001101001011010100110001001101001101001011010100110001001100101111010010101001010010111101001010100101001011110100101010010100101011010011001101001100110100110011010011001101001100110100110011010010010100110100010100110100010100110100010100110100010100110100010100101101001100110100110011010011001101001100110100110011010011001101001111010010101001010111010010111101001010100101011101001011110100101010010101011010011001101001100110100110011010011001101001100110100110011010011001011110101010010110010111101010100101100101111010101001011001010110100110011010011001101001100110100110011010011001101001100110100101001011010000100101101000010010110100001001011010000100101101000010010101101001100110100110011010011001101001100110100110011010011001101001
0101011000100110100110100101101010101100010011010011010010110101010101101001100110100110011010011001101001100110100110011010011001101001101001011001011110101010010101010010110010111101010100101010100101001001101001100100110100110010011010011001001101001100100110100100101010100101010100101010100101010100101010100101010100101010100101010100101010100101010100101010100101010100101010100101010100110100110011010011001101001100110100110011010011001101001100110100110110001010110001010110001010110001010110001010110001010110001010101101001100110100110011010011001101001100110100110011010011001101001010010101001010101100010011010010101001010101100010011010010101001010101011000100110100110100101101010011000100110100110100101101010011000100110010111101001010100101001011110100101010010100101111010010101001010010101101001100110100110011010011001101001100110100110011010011001101001001010011010001010011010001010011010001010011010001010011010001010010110100110011010011001101001100110100110011010011001101001100110100111101001010100101011101001011110100101010010101110100101111010010101001010101101001100110100110011010011001101001100110100110011010011001101001100101111010101001011001011110101010010110010111101010100101100101
010010100110101010110010100101100101111010101001010100101010110001001

120
6. Health workforce, infrastructure and essential medicines
Table 6 presents data on the resources available to health systems, including physicians, nurses and midwives, other health-care workers, hospital and psychiatric beds, and radiotherapy units. The table also includes the MDG target indicator on access to essential medicines.30 Such data are essential in enabling governments to determine how best to meet the health-related needs of their populations. For example, mental health services depend primarily on trained human resources such as mental health specialists (for example, psychiatrists), psychosocial workers (for example, psychologists) and non-specialist health workers such as primary care staff. The number and density of psychiatrists are the most widely available and reliable indicators of the human resources available to mental health services, and provide a crude proxy of mental health system capacity.
Estimates of the numbers and densities of health personnel refer to the active health workforce – i.e. those currently participating in the health labour market. Data are derived from multiple sources, in-cluding national population censuses, labour-force and employment surveys, health-facility assess-ments and routine administrative information systems.31 Due to the wide diversity of available infor-mation sources, there is considerable variability in the coverage and quality of data. Figures may be under-estimated or over-estimated where it is not possible to determine whether or not they include health workers in the private sector, or to identify the double counting of health workers holding two or more jobs at different locations. In addition, health service providers may be working outside the health-care sector, working in unpaid and/or unregulated conditions, or not currently engaged in the national health labour market.
Even though outpatient care should be the preferred mode of service delivery, information on the den-sity of outpatient services is not available in many countries. The density of hospital beds can however be used to indicate the availability of inpatient services. Statistics on hospital-bed density are generally drawn from routine administrative records but in some settings only public-sector beds are included. The density of psychiatric beds provides an estimate of national capacity to treat serious mental disor-ders that require brief or extended inpatient care. The density of psychiatric beds in any country should be interpreted alongside other resources for mental health care, since beds very often account for a high proportion of all the resources allocated to mental health care.
Essential medical equipment for the safe and effective prevention, diagnosis and treatment of illness and disease is still not accessible everywhere. The density of computed tomography units shown in Table 6 reflects country-reported data and can be used to identify gaps in the availability of diagnostic imaging.
30. MDG 8; Target 8.E: In cooperation with pharmaceutical companies, provide access to affordable essential drugs in developing countries.
31. These include registries on public expenditure, staffing and payroll, as well as records of professional training, registra-tion and licensure.

121
Tabl
e 6
Data on the availability of medicines are poor in most developing countries. However, data on the avail-ability and consumer prices for selected generic medicines have been derived from surveys of medi-cine prices and availability conducted using WHO/Health Action International (HAI) standard methods between 2001 and 2009. In individual surveys, availability is reported as the percentage of medicine outlets in which a medicine was found on the day of data collection. As baskets of medicines differ by country, results are not strictly comparable across countries. The consumer price ratio is an expression of how much greater or less the local medicine price is than the international reference price.
011010011001101001100110100110011010011001101001100110100110011010011010010110010111101010100101010100101100101111010101001010101001010010011010011001001101001100100110100110010011010011001001101001001010101001010101001010101001010101001010101001010101001010101001010101001010101001010101001010101001010101001010101001010101001101001100110100110011010011001101001100110100110011010011001101001101100010101100010101100010101100010101100010101100010101100010101011010011001101001100110100110011010011001101001100110100110011010010100101010010101011000100110100101010010101011000100110100101010010101010110001001101001101001011010100110001001101001101001011010100110001001100101111010010101001010010111101001010100101001011110100101010010100101011010011001101001100110100110011010011001101001100110100110011010010010100110100010100110100010100110100010100110100010100110100010100101101001100110100110011010011001101001100110100110011010011001101001111010010101001010111010010111101001010100101011101001011110100101010010101011010011001101001100110100110011010011001101001100110100110011010011001011110101010010110010111101010100101100101111010101001011001010110100110011010011001101001100110100110011010011001101001100110100101001011010000100101101000010010110100001001011010000100101101000010010101101001100110100110011010011001101001100110100110011010011001101001
0101011000100110100110100101101010101100010011010011010010110101010101101001100110100110011010011001101001100110100110011010011001101001101001011001011110101010010101010010110010111101010100101010100101001001101001100100110100110010011010011001001101001100100110100100101010100101010100101010100101010100101010100101010100101010100101010100101010100101010100101010100101010100101010100101010100110100110011010011001101001100110100110011010011001101001100110100110110001010110001010110001010110001010110001010110001010110001010101101001100110100110011010011001101001100110100110011010011001101001010010101001010101100010011010010101001010101100010011010010101001010101011000100110100110100101101010011000100110100110100101101010011000100110010111101001010100101001011110100101010010100101111010010101001010010101101001100110100110011010011001101001100110100110011010011001101001001010011010001010011010001010011010001010011010001010011010001010010110100110011010011001101001100110100110011010011001101001100110100111101001010100101011101001011110100101010010101110100101111010010101001010101101001100110100110011010011001101001100110100110011010011001101001100101111010101001011001011110101010010110010111101010100101100101
010010100110101010110010100101100101111010101001010100101010110001001

122
Member State Health workforce
Physicians a Nursing and midwifery personnel a
Dentistry personnel a Pharmaceutical personnel a Environmental and public health workers a
Number
Density (per 10 000 population) Number
Density (per 10 000 population) Number
Density (per 10 000 population) Number
Density (per 10 000 population) Number
Density (per 10 000 population)
2005–2010
Afghanistan 7 248 2.1 17 257 5.0 1 035 0.3 1 035 0.3 … …
Albania 3 685 11.5 12 455 39.0 1 035 3.3 1 237 3.9 … …
Algeria 40 857 12.1 65 919 19.5 11 010 3.3 8 232 2.4 2 429 0.7
Andorra 266 39.1 311 45.7 51 7.5 78 11.5 … …
Angola … … … … … … … … … …
Antigua and Barbuda … … … … … … … … … …
Argentina … … … … … … … … … …
Armenia 11 234 37.6 14 386 48.2 1 943 6.5 204 0.7 … …
Australia 62 800 29.9 201 300 95.9 14 500 6.9 21 800 10.4 … …
Austria 40 026 48.5 64 910 78.8 4 685 5.7 5 579 6.8 … …
Azerbaijan 32 798 37.8 72 356 83.4 2 457 2.8 1 652 1.9 … …
Bahamas … … … … … … … … … …
Bahrain 1 103 14.4 2 856 37.3 273 3.6 186 2.4 … …
Bangladesh 43 315 3.0 39 992 2.7 2 742 0.2 9 411 0.6 6 091 0.4
Barbados 489 18.1 1 311 48.6 94 3.5 251 9.3 194 7.2
Belarus 49 380 51.8 125 032 131.1 5 182 5.4 3 053 3.2 … …
Belgium 31 578 30.1 5 637 5.4 7 655 7.3 12 450 11.9 … …
Belize 241 8.3 570 19.6 12 0.4 112 3.9 60 2.1
Benin 542 0.6 7 129 7.7 37 <0.05 20 <0.05 217 0.2
Bhutan 52 0.2 545 2.4 65 0.3 87 0.4 80 0.4
Bolivia (Plurinational State of) … … … … … … … … … …
Bosnia and Herzegovina 6 443 16.4 19 825 50.4 685 1.7 364 0.9 … …
Botswana 591 3.4 5 006 28.4 … … … … … …
Brazil 341 849 17.6 1 243 804 64.2 227 141 11.7 104 098 5.4 … …
Brunei Darussalam 564 14.2 1 941 48.8 82 2.1 45 1.1 … …
Bulgaria 27 988 37.3 35 250 47.0 6 493 8.7 … … … …
Burkina Faso 921 0.6 10 539 7.3 28 <0.05 347 0.2 36 <0.05
Burundi … … … … … … … … … …
Cambodia 3 393 2.3 11 736 7.9 258 0.2 569 0.4 … …
Cameroon … … … … … … … … … …
Canada 65 440 19.8 348 499 104.3 41 798 12.6 30 553 9.2 1 245 0.4
Cape Verde 310 5.7 714 13.2 … … … … … …
Central African Republic … … … … … … … … … …
Chad … … … … … … … … … …
Chile 17 411 10.3 2 443 1.4 15 <0.05 39 <0.05 … …
China 1 905 436 14.2 1 854 818 13.8 51 012 0.4 341 910 2.5 … …
Colombia 7 198 1.5 30 119 6.2 44 858 9.2 … … … …
Comoros … … … … … … … … … …
Congo 401 1.0 3 492 8.2 … … 63 0.2 19 <0.05
Cook Islands 52 28.9 116 64.4 19 10.6 8 4.4 1 0.6
Costa Rica … … … … … … … … … …
Côte d'Ivoire 2 746 1.4 9 231 4.8 274 0.1 413 0.2 1 419 0.7
Croatia 11 813 26.0 24 201 53.3 3 293 7.3 2 673 5.9 … …
Cuba 76 506 67.2 103 014 90.5 18 575 16.3 4 656 4.1 2 794 2.5
Cyprus 2 230 25.8 3 710 43.0 792 9.2 210 2.4 95 1.1
Czech Republic 37 351 36.7 88 874 87.4 7 092 7.0 5 915 5.8 … …
Democratic People's Republic of Korea … … … … … … … … … …
Democratic Republic of the Congo … … … … … … … … … …
6. Health workforce, infrastructure and essential medicines

123
Tabl
e 6
Health workforce Infrastructure Essential medicines Member State
Community health workers a
Psychiatrists b Hospital beds c
(per 10 000 popu-lation)
Psychiat-ric beds b
(per 10 000 popu-lation)
Computed tomography
units d
(per million
population)
MDG 8Median availability of selected generic
medicines e (%)
Median consumer price ratio of selected generic
medicines f
Number
Density (per 10 000 population) Number
Density (per 10 000 population) Public Private Public Private
2005–2010 2005–2011 2010 2001–2009
… … 2 <0.05 4 0.1 0.2 … … … … Afghanistan
… … 58 0.2 28 2.1 5.3 … … … … Albania
… … 549 0.2 … 1.4 … … … … … Algeria
… … 6 0.7 25 1.4 … … … … … Andorra
… … 4 <0.05 … … 0.5 … … … … Angola
… … 1 0.1 22 12.4 22.5 … … … … Antigua and Barbuda
… … … … 45 2.8 … … … … … Argentina
… … 125 0.4 37 4.8 2.9 … g … h … g 3.4 Armenia
1 012 0.5 2 745 1.3 38 3.9 … … … … … Australia
… … 1 653 2.0 77 4.0 28.8 i … … … … Austria
… … 454 0.5 75 4.3 1.1 i … … … … Azerbaijan
… … … … 31 … 14.6 … … … … Bahamas
… … 66 0.8 18 2.8 … … … … … Bahrain
48 692 3.3 120 <0.05 3 0.1 … … … … … Bangladesh
… … 11 0.4 68 21.2 7.3 i … … … … Barbados
… … 841 0.9 111 6.3 6.0 i … … … … Belarus
… … … … 65 … … … … … … Belgium
158 5.4 3 0.1 12 0.1 12.8 … … … … Belize
… … 13 <0.05 5 0.2 0.3 … … … … Benin
195 0.9 2 <0.05 18 … 1.4 … … … … Bhutan
… … 104 0.1 11 … … 31.9 86.7 3.5 4.5 Bolivia (Plurinational State of)
… … 186 0.5 34 2.4 13.8 … … … … Bosnia and Herzegovina
920 5.2 5 <0.05 18 2.2 1.0 i … … … … Botswana
… … 6 003 0.3 24 1.9 … 0.0 j 76.7 j … k 11.3 Brazil
… … 2 <0.05 26 1.0 7.5 … … … … Brunei Darussalam
… … 506 0.7 66 6.9 … … … … … Bulgaria
1 238 0.9 7 <0.05 4 … 0.2 87.1 72.1 2.2 2.9 Burkina Faso
… … 1 <0.05 19 … 0.2 … … … … Burundi
… … 35 <0.05 … <0.05 1.3 … … … … Cambodia
… … 5 <0.05 13 0.1 0.7 58.3 52.5 2.2 13.6 Cameroon
… … 4 272 1.3 32 … 14.2 … … … … Canada
… … 7 0.1 21 0.9 2.0 … … … … Cape Verde
… … 1 <0.05 10 0.1 0.0 … … … … Central African Republic
… … 1 <0.05 … 0.0 0.1 l 31.3 13.6 3.9 15.1 Chad
… … 1 000 0.6 21 0.5 13.0 … … … … Chile
1 113 331 8.3 17 204 0.1 42 1.4 … 18.1 m 21.5 m 1.3 m 1.3 China
… … … … 10 … … 86.7 n 87.9 … n 3.1 Colombia
… … 1 <0.05 … 0.0 1.4 … … … … Comoros
… … 1 <0.05 … … … 21.2 31.3 6.5 11.5 Congo
9 5.0 … … 63 … … … … … … Cook Islands
… … 108 0.2 12 2.3 3.0 … … … … Costa Rica
… … 35 <0.05 … … 0.7 … … … … Côte d'Ivoire
… … 452 1.0 54 9.6 14.5 … … … … Croatia
… … 1 216 1.1 59 6.8 4.8 i … … … … Cuba
… … 60 0.7 38 2.2 21.7 … … … … Cyprus
… … 1 234 1.2 71 10.5 13.2 … … … … Czech Republic
… … … … … … … … … … … Democratic People's Republic of Korea
… … 45 <0.05 … … 0.1 55.6 65.4 2.0 2.3 Democratic Republic of the Congo
011010011001101001100110100110011010011001101001100110100110011010011010010110010111101010100101010100101100101111010101001010101001010010011010011001001101001100100110100110010011010011001001101001001010101001010101001010101001010101001010101001010101001010101001010101001010101001010101001010101001010101001010101001010101001101001100110100110011010011001101001100110100110011010011001101001101100010101100010101100010101100010101100010101100010101100010101011010011001101001100110100110011010011001101001100110100110011010010100101010010101011000100110100101010010101011000100110100101010010101010110001001101001101001011010100110001001101001101001011010100110001001100101111010010101001010010111101001010100101001011110100101010010100101011010011001101001100110100110011010011001101001100110100110011010010010100110100010100110100010100110100010100110100010100110100010100101101001100110100110011010011001101001100110100110011010011001101001111010010101001010111010010111101001010100101011101001011110100101010010101011010011001101001100110100110011010011001101001100110100110011010011001011110101010010110010111101010100101100101111010101001011001010110100110011010011001101001100110100110011010011001101001100110100101001011010000100101101000010010110100001001011010000100101101000010010101101001100110100110011010011001101001100110100110011010011001101001
0101011000100110100110100101101010101100010011010011010010110101010101101001100110100110011010011001101001100110100110011010011001101001101001011001011110101010010101010010110010111101010100101010100101001001101001100100110100110010011010011001001101001100100110100100101010100101010100101010100101010100101010100101010100101010100101010100101010100101010100101010100101010100101010100101010100110100110011010011001101001100110100110011010011001101001100110100110110001010110001010110001010110001010110001010110001010110001010101101001100110100110011010011001101001100110100110011010011001101001010010101001010101100010011010010101001010101100010011010010101001010101011000100110100110100101101010011000100110100110100101101010011000100110010111101001010100101001011110100101010010100101111010010101001010010101101001100110100110011010011001101001100110100110011010011001101001001010011010001010011010001010011010001010011010001010011010001010010110100110011010011001101001100110100110011010011001101001100110100111101001010100101011101001011110100101010010101110100101111010010101001010101101001100110100110011010011001101001100110100110011010011001101001100101111010101001011001011110101010010110010111101010100101100101
010010100110101010110010100101100101111010101001010100101010110001001

124
Member State Health workforce
Physicians a Nursing and midwifery personnel a
Dentistry personnel a Pharmaceutical personnel a Environmental and public health workers a
Number
Density (per 10 000 population) Number
Density (per 10 000 population) Number
Density (per 10 000 population) Number
Density (per 10 000 population) Number
Density (per 10 000 population)
2005–2010
Denmark 18 797 34.2 88 335 160.9 4 438 8.1 2 593 4.8 … …
Djibouti 185 2.3 666 8.0 99 1.2 266 3.2 20 0.3
Dominica … … … … … … … … … …
Dominican Republic … … … … … … … … … …
Ecuador 23 614 16.9 27 764 19.8 3 363 2.4 664 0.5 … …
Egypt 225 565 28.3 280 561 35.2 33 476 4.2 133 107 16.7 … …
El Salvador 11 542 16.0 2 929 4.1 4 669 6.5 2 316 3.2 … …
Equatorial Guinea … … … … … … … … … …
Eritrea … … … … … … … … … …
Estonia 4 378 33.3 8 605 65.5 1 196 9.1 857 6.5 … …
Ethiopia 1 806 0.2 19 158 2.4 … … 1 201 0.2 1 109 0.1
Fiji 372 4.3 1 957 22.4 171 2.0 76 0.9 118 1.4
Finland 15 384 29.1 126 869 239.6 4 014 7.6 5 665 10.7 … …
France 212 132 34.5 18 835 3.1 41 876 6.8 73 298 11.9 … …
Gabon … … … … … … … … … …
Gambia 62 0.4 927 5.7 23 0.1 49 0.3 79 0.5
Georgia 20 609 47.6 13 925 32.2 1 219 2.8 249 0.6 … …
Germany 297 835 36.0 918 000 111.0 64 287 7.8 49 892 6.0 … …
Ghana 2 033 0.9 24 974 10.5 148 0.1 1 673 0.7 35 <0.05
Greece 69 030 61.7 2 626 2.4 14 774 13.2 9 837 8.8 … …
Grenada … … … … … … … … … …
Guatemala … … … … … … … … … …
Guinea 940 1.0 401 0.4 33 <0.05 199 0.2 67 0.1
Guinea-Bissau 78 0.5 953 5.5 6 <0.05 38 0.2 58 0.3
Guyana … … … … … … … … … …
Haiti … … … … … … … … … …
Honduras … … … … … … … … … …
Hungary 30 276 30.3 63 980 64.0 4 920 4.9 5 731 5.7 … …
Iceland 1 146 37.3 4 875 158.8 313 10.2 595 19.4 54 1.8
India 757 377 6.5 1 146 915 10.0 93 332 0.8 578 179 5.2 … …
Indonesia 65 722 2.9 465 662 20.4 13 709 0.6 31 242 1.4 … …
Iran (Islamic Republic of) 61 870 8.9 98 020 14.1 13 210 1.9 13 900 2.0 … …
Iraq 21 925 6.9 43 850 13.8 4 766 1.5 5 401 1.7 … …
Ireland 14 029 31.7 68 483 156.7 2 721 6.2 4 567 10.3 … …
Israel 26 700 36.5 37 898 51.8 6 400 8.8 4 900 6.7 … …
Italy 202 866 34.9 16 893 2.9 31 085 5.3 53 110 9.1 … …
Jamaica … … … … … … … … … …
Japan 274 992 21.4 531 210 41.4 94 882 7.4 174 890 13.6 … …
Jordan 15 226 24.5 25 046 40.3 4 536 7.3 8 763 14.1 … …
Kazakhstan 60 656 41.0 122 453 82.8 5 691 3.9 12 230 8.3 … …
Kenya … … … … … … … … … …
Kiribati 41 3.8 404 37.1 18 1.7 22 2.1 13 1.2
Kuwait 5 340 17.9 13 554 45.5 1 054 3.5 888 3.0 … …
Kyrgyzstan 12 395 23.0 30 495 56.6 1 021 1.9 86 0.2 … …
Lao People's Democratic Republic 1 614 2.7 5 724 9.7 … … … … … …
Latvia 6 753 29.9 10 929 48.4 1 510 6.7 1 340 5.9 … …
Lebanon 13 214 35.4 8 324 22.3 4 964 13.3 4 591 12.3 … …
Lesotho … … … … … … … … … …
6. Health workforce, infrastructure and essential medicines
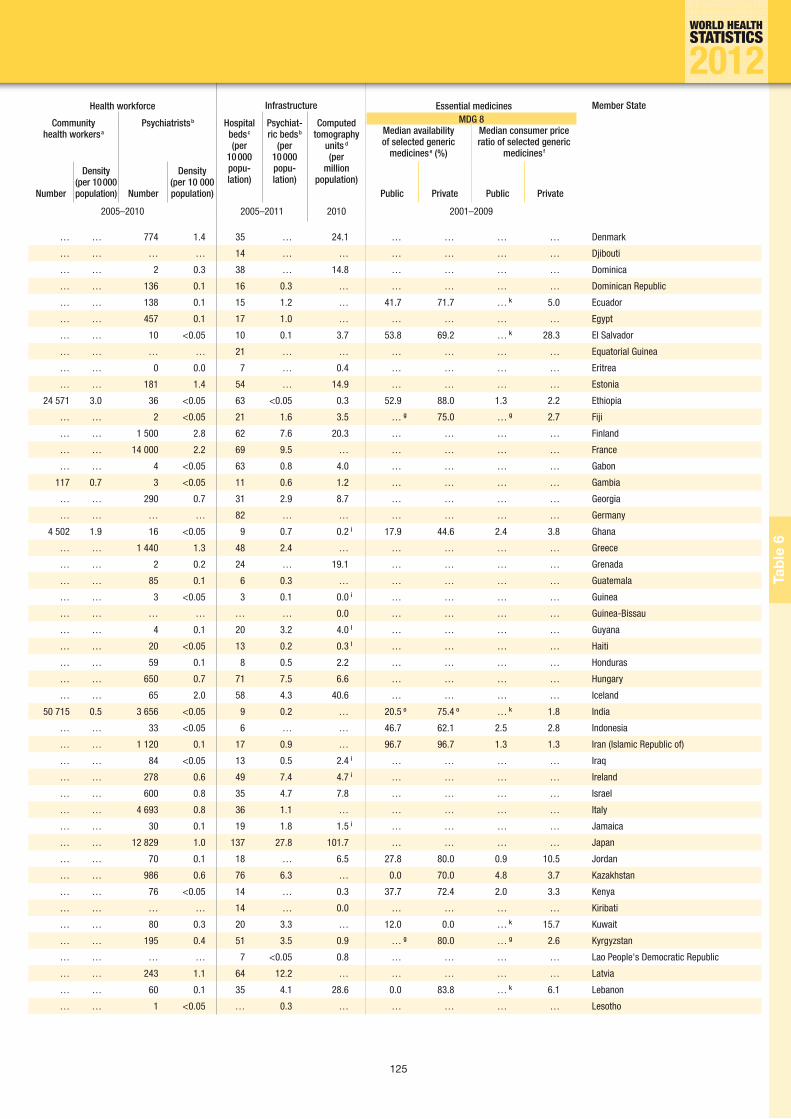
125
Tabl
e 6
Health workforce Infrastructure Essential medicines Member State
Community health workers a
Psychiatrists b Hospital beds c
(per 10 000 popu-lation)
Psychiat-ric beds b
(per 10 000 popu-lation)
Computed tomography
units d
(per million
population)
MDG 8Median availability of selected generic
medicines e (%)
Median consumer price ratio of selected generic
medicines f
Number
Density (per 10 000 population) Number
Density (per 10 000 population) Public Private Public Private
2005–2010 2005–2011 2010 2001–2009
… … 774 1.4 35 … 24.1 … … … … Denmark
… … … … 14 … … … … … … Djibouti
… … 2 0.3 38 … 14.8 … … … … Dominica
… … 136 0.1 16 0.3 … … … … … Dominican Republic
… … 138 0.1 15 1.2 … 41.7 71.7 … k 5.0 Ecuador
… … 457 0.1 17 1.0 … … … … … Egypt
… … 10 <0.05 10 0.1 3.7 53.8 69.2 … k 28.3 El Salvador
… … … … 21 … … … … … … Equatorial Guinea
… … 0 0.0 7 … 0.4 … … … … Eritrea
… … 181 1.4 54 … 14.9 … … … … Estonia
24 571 3.0 36 <0.05 63 <0.05 0.3 52.9 88.0 1.3 2.2 Ethiopia
… … 2 <0.05 21 1.6 3.5 … g 75.0 … g 2.7 Fiji
… … 1 500 2.8 62 7.6 20.3 … … … … Finland
… … 14 000 2.2 69 9.5 … … … … … France
… … 4 <0.05 63 0.8 4.0 … … … … Gabon
117 0.7 3 <0.05 11 0.6 1.2 … … … … Gambia
… … 290 0.7 31 2.9 8.7 … … … … Georgia
… … … … 82 … … … … … … Germany
4 502 1.9 16 <0.05 9 0.7 0.2 i 17.9 44.6 2.4 3.8 Ghana
… … 1 440 1.3 48 2.4 … … … … … Greece
… … 2 0.2 24 … 19.1 … … … … Grenada
… … 85 0.1 6 0.3 … … … … … Guatemala
… … 3 <0.05 3 0.1 0.0 i … … … … Guinea
… … … … … … 0.0 … … … … Guinea-Bissau
… … 4 0.1 20 3.2 4.0 l … … … … Guyana
… … 20 <0.05 13 0.2 0.3 l … … … … Haiti
… … 59 0.1 8 0.5 2.2 … … … … Honduras
… … 650 0.7 71 7.5 6.6 … … … … Hungary
… … 65 2.0 58 4.3 40.6 … … … … Iceland
50 715 0.5 3 656 <0.05 9 0.2 … 20.5 o 75.4 o … k 1.8 India
… … 33 <0.05 6 … … 46.7 62.1 2.5 2.8 Indonesia
… … 1 120 0.1 17 0.9 … 96.7 96.7 1.3 1.3 Iran (Islamic Republic of)
… … 84 <0.05 13 0.5 2.4 i … … … … Iraq
… … 278 0.6 49 7.4 4.7 i … … … … Ireland
… … 600 0.8 35 4.7 7.8 … … … … Israel
… … 4 693 0.8 36 1.1 … … … … … Italy
… … 30 0.1 19 1.8 1.5 i … … … … Jamaica
… … 12 829 1.0 137 27.8 101.7 … … … … Japan
… … 70 0.1 18 … 6.5 27.8 80.0 0.9 10.5 Jordan
… … 986 0.6 76 6.3 … 0.0 70.0 4.8 3.7 Kazakhstan
… … 76 <0.05 14 … 0.3 37.7 72.4 2.0 3.3 Kenya
… … … … 14 … 0.0 … … … … Kiribati
… … 80 0.3 20 3.3 … 12.0 0.0 … k 15.7 Kuwait
… … 195 0.4 51 3.5 0.9 … g 80.0 … g 2.6 Kyrgyzstan
… … … … 7 <0.05 0.8 … … … … Lao People's Democratic Republic
… … 243 1.1 64 12.2 … … … … … Latvia
… … 60 0.1 35 4.1 28.6 0.0 83.8 … k 6.1 Lebanon
… … 1 <0.05 … 0.3 … … … … … Lesotho
011010011001101001100110100110011010011001101001100110100110011010011010010110010111101010100101010100101100101111010101001010101001010010011010011001001101001100100110100110010011010011001001101001001010101001010101001010101001010101001010101001010101001010101001010101001010101001010101001010101001010101001010101001010101001101001100110100110011010011001101001100110100110011010011001101001101100010101100010101100010101100010101100010101100010101100010101011010011001101001100110100110011010011001101001100110100110011010010100101010010101011000100110100101010010101011000100110100101010010101010110001001101001101001011010100110001001101001101001011010100110001001100101111010010101001010010111101001010100101001011110100101010010100101011010011001101001100110100110011010011001101001100110100110011010010010100110100010100110100010100110100010100110100010100110100010100101101001100110100110011010011001101001100110100110011010011001101001111010010101001010111010010111101001010100101011101001011110100101010010101011010011001101001100110100110011010011001101001100110100110011010011001011110101010010110010111101010100101100101111010101001011001010110100110011010011001101001100110100110011010011001101001100110100101001011010000100101101000010010110100001001011010000100101101000010010101101001100110100110011010011001101001100110100110011010011001101001
0101011000100110100110100101101010101100010011010011010010110101010101101001100110100110011010011001101001100110100110011010011001101001101001011001011110101010010101010010110010111101010100101010100101001001101001100100110100110010011010011001001101001100100110100100101010100101010100101010100101010100101010100101010100101010100101010100101010100101010100101010100101010100101010100101010100110100110011010011001101001100110100110011010011001101001100110100110110001010110001010110001010110001010110001010110001010110001010101101001100110100110011010011001101001100110100110011010011001101001010010101001010101100010011010010101001010101100010011010010101001010101011000100110100110100101101010011000100110100110100101101010011000100110010111101001010100101001011110100101010010100101111010010101001010010101101001100110100110011010011001101001100110100110011010011001101001001010011010001010011010001010011010001010011010001010011010001010010110100110011010011001101001100110100110011010011001101001100110100111101001010100101011101001011110100101010010101110100101111010010101001010101101001100110100110011010011001101001100110100110011010011001101001100101111010101001011001011110101010010110010111101010100101100101
010010100110101010110010100101100101111010101001010100101010110001001
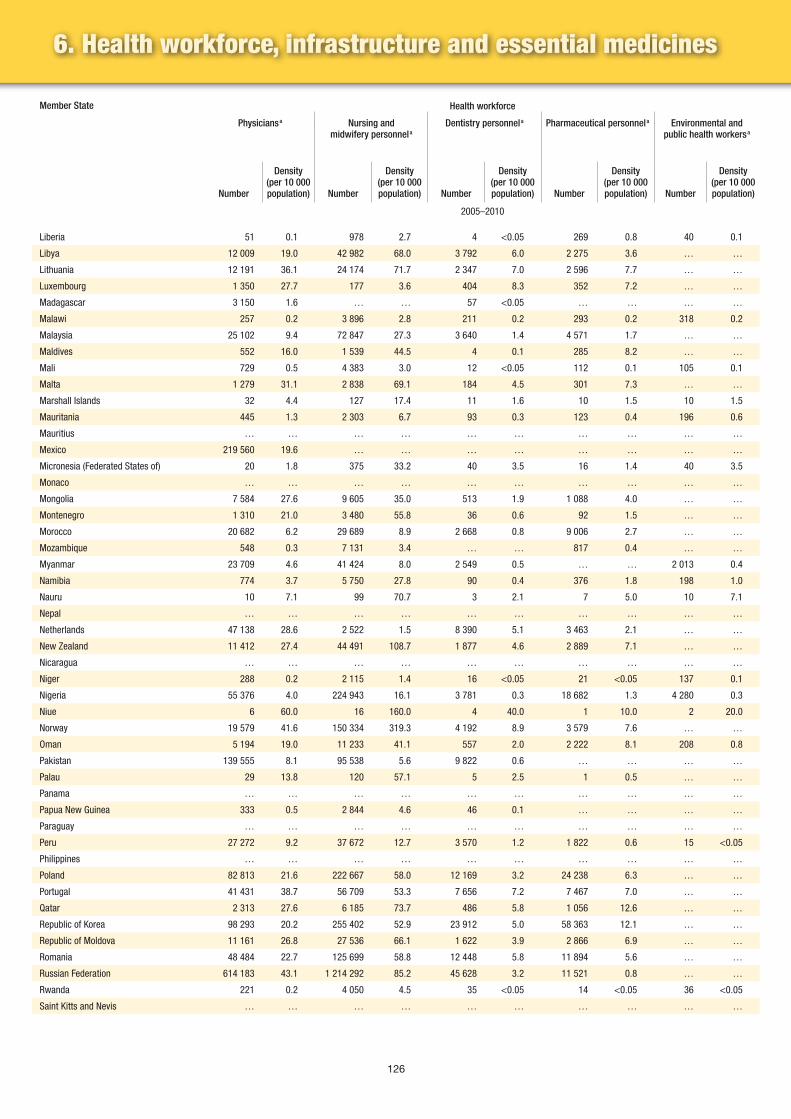
126
Member State Health workforce
Physicians a Nursing and midwifery personnel a
Dentistry personnel a Pharmaceutical personnel a Environmental and public health workers a
Number
Density (per 10 000 population) Number
Density (per 10 000 population) Number
Density (per 10 000 population) Number
Density (per 10 000 population) Number
Density (per 10 000 population)
2005–2010
Liberia 51 0.1 978 2.7 4 <0.05 269 0.8 40 0.1
Libya 12 009 19.0 42 982 68.0 3 792 6.0 2 275 3.6 … …
Lithuania 12 191 36.1 24 174 71.7 2 347 7.0 2 596 7.7 … …
Luxembourg 1 350 27.7 177 3.6 404 8.3 352 7.2 … …
Madagascar 3 150 1.6 … … 57 <0.05 … … … …
Malawi 257 0.2 3 896 2.8 211 0.2 293 0.2 318 0.2
Malaysia 25 102 9.4 72 847 27.3 3 640 1.4 4 571 1.7 … …
Maldives 552 16.0 1 539 44.5 4 0.1 285 8.2 … …
Mali 729 0.5 4 383 3.0 12 <0.05 112 0.1 105 0.1
Malta 1 279 31.1 2 838 69.1 184 4.5 301 7.3 … …
Marshall Islands 32 4.4 127 17.4 11 1.6 10 1.5 10 1.5
Mauritania 445 1.3 2 303 6.7 93 0.3 123 0.4 196 0.6
Mauritius … … … … … … … … … …
Mexico 219 560 19.6 … … … … … … … …
Micronesia (Federated States of) 20 1.8 375 33.2 40 3.5 16 1.4 40 3.5
Monaco … … … … … … … … … …
Mongolia 7 584 27.6 9 605 35.0 513 1.9 1 088 4.0 … …
Montenegro 1 310 21.0 3 480 55.8 36 0.6 92 1.5 … …
Morocco 20 682 6.2 29 689 8.9 2 668 0.8 9 006 2.7 … …
Mozambique 548 0.3 7 131 3.4 … … 817 0.4 … …
Myanmar 23 709 4.6 41 424 8.0 2 549 0.5 … … 2 013 0.4
Namibia 774 3.7 5 750 27.8 90 0.4 376 1.8 198 1.0
Nauru 10 7.1 99 70.7 3 2.1 7 5.0 10 7.1
Nepal … … … … … … … … … …
Netherlands 47 138 28.6 2 522 1.5 8 390 5.1 3 463 2.1 … …
New Zealand 11 412 27.4 44 491 108.7 1 877 4.6 2 889 7.1 … …
Nicaragua … … … … … … … … … …
Niger 288 0.2 2 115 1.4 16 <0.05 21 <0.05 137 0.1
Nigeria 55 376 4.0 224 943 16.1 3 781 0.3 18 682 1.3 4 280 0.3
Niue 6 60.0 16 160.0 4 40.0 1 10.0 2 20.0
Norway 19 579 41.6 150 334 319.3 4 192 8.9 3 579 7.6 … …
Oman 5 194 19.0 11 233 41.1 557 2.0 2 222 8.1 208 0.8
Pakistan 139 555 8.1 95 538 5.6 9 822 0.6 … … … …
Palau 29 13.8 120 57.1 5 2.5 1 0.5 … …
Panama … … … … … … … … … …
Papua New Guinea 333 0.5 2 844 4.6 46 0.1 … … … …
Paraguay … … … … … … … … … …
Peru 27 272 9.2 37 672 12.7 3 570 1.2 1 822 0.6 15 <0.05
Philippines … … … … … … … … … …
Poland 82 813 21.6 222 667 58.0 12 169 3.2 24 238 6.3 … …
Portugal 41 431 38.7 56 709 53.3 7 656 7.2 7 467 7.0 … …
Qatar 2 313 27.6 6 185 73.7 486 5.8 1 056 12.6 … …
Republic of Korea 98 293 20.2 255 402 52.9 23 912 5.0 58 363 12.1 … …
Republic of Moldova 11 161 26.8 27 536 66.1 1 622 3.9 2 866 6.9 … …
Romania 48 484 22.7 125 699 58.8 12 448 5.8 11 894 5.6 … …
Russian Federation 614 183 43.1 1 214 292 85.2 45 628 3.2 11 521 0.8 … …
Rwanda 221 0.2 4 050 4.5 35 <0.05 14 <0.05 36 <0.05
Saint Kitts and Nevis … … … … … … … … … …
6. Health workforce, infrastructure and essential medicines

127
Tabl
e 6
Health workforce Infrastructure Essential medicines Member State
Community health workers a
Psychiatrists b Hospital beds c
(per 10 000 popu-lation)
Psychiat-ric beds b
(per 10 000 popu-lation)
Computed tomography
units d
(per million
population)
MDG 8Median availability of selected generic
medicines e (%)
Median consumer price ratio of selected generic
medicines f
Number
Density (per 10 000 population) Number
Density (per 10 000 population) Public Private Public Private
2005–2010 2005–2011 2010 2001–2009
… … 1 <0.05 8 … … … … … … Liberia
… … … … 37 … 9.4 … … … … Libya
… … 578 1.8 68 … 18.1 … … … … Lithuania
… … 104 2.1 56 9.0 19.7 … … … … Luxembourg
… … 11 <0.05 2 0.1 0.1 … … … … Madagascar
10 055 7.3 2 <0.05 13 … … … … … … Malawi
… … 233 0.1 18 1.8 6.7 25.0 43.8 … k 6.6 Malaysia
478 13.8 5 0.2 43 0.0 6.3 … … … … Maldives
… … 5 <0.05 1 0.1 0.2 i 81.0 70.0 1.8 5.4 Mali
… … 13 0.3 45 14.5 9.6 … … … … Malta
… … 1 0.2 27 0.0 18.5 … … … … Marshall Islands
… … 3 <0.05 … … 1.7 … … … … Mauritania
… … 21 0.2 34 5.5 6.2 … … … … Mauritius
… … 1 740 0.2 16 0.4 3.9 … … … … Mexico
31 2.7 1 0.1 32 0.0 0.0 … … … … Micronesia (Federated States of)
… … 12 3.6 … 17.3 141.2 … … … … Monaco
61 0.2 14 0.1 58 … 8.3 100.0 80.0 2.6 4.2 Mongolia
… … 44 0.7 39 5.8 9.5 … … … … Montenegro
… … 292 0.1 11 0.7 1.3 i 0.0 52.5 … k 11.1 Morocco
… … 9 <0.05 7 0.2 … … … … … Mozambique
3 247 0.6 44 <0.05 6 … 0.1 i … … … … Myanmar
… … 5 <0.05 … 0.8 4.8 … … … … Namibia
3 2.1 0 0.0 50 2.0 … … … … … Nauru
… … 53 <0.05 50 0.2 … … … … … Nepal
… … 3 126 1.9 47 13.1 12.3 … … … … Netherlands
… … 420 1.0 23 2.1 15.8 … … … … New Zealand
… … 51 0.1 8 … 0.5 i 50.0 87.1 … k 5.7 Nicaragua
… … 4 <0.05 … 0.1 0.2 … … … … Niger
19 268 1.4 100 <0.05 … … … 26.2 36.4 3.5 4.3 Nigeria
… … 0 0.0 52 0.0 … … … … … Niue
… … 1 494 3.1 33 … … … … … … Norway
… … 67 0.2 18 0.3 8.6 96.7 70.3 … k 7.4 Oman
10 731 0.6 342 <0.05 6 0.3 0.4 3.3 31.3 … k 2.3 Pakistan
… … 1 0.5 48 3.9 … … … … … Palau
… … … … 22 … 10.5 … … … … Panama
3 883 6.2 7 <0.05 … 0.2 0.4 … … … … Papua New Guinea
… … 54 0.1 13 0.5 1.1 … … … … Paraguay
… … 168 0.1 15 … … 61.5 60.9 1.4 5.6 Peru
… … 352 <0.05 5 … 1.1 15.4 26.5 6.4 5.6 Philippines
… … 1 952 0.5 67 5.4 10.6 i … … … … Poland
… … … … 33 … 27.3 … … … … Portugal
… … 25 0.2 12 0.4 10.2 … … … … Qatar
… … 2 483 0.5 103 19.1 … … … … … Republic of Korea
… … 180 0.5 62 5.9 2.2 i … … … … Republic of Moldova
… … 1 367 0.6 66 7.5 5.5 … … … … Romania
… … 16 299 1.2 97 11.1 … … … … … Russian Federation
… … 5 <0.05 … 0.4 … … … … … Rwanda
… … 1 0.2 48 2.3 19.1 … … … … Saint Kitts and Nevis
011010011001101001100110100110011010011001101001100110100110011010011010010110010111101010100101010100101100101111010101001010101001010010011010011001001101001100100110100110010011010011001001101001001010101001010101001010101001010101001010101001010101001010101001010101001010101001010101001010101001010101001010101001010101001101001100110100110011010011001101001100110100110011010011001101001101100010101100010101100010101100010101100010101100010101100010101011010011001101001100110100110011010011001101001100110100110011010010100101010010101011000100110100101010010101011000100110100101010010101010110001001101001101001011010100110001001101001101001011010100110001001100101111010010101001010010111101001010100101001011110100101010010100101011010011001101001100110100110011010011001101001100110100110011010010010100110100010100110100010100110100010100110100010100110100010100101101001100110100110011010011001101001100110100110011010011001101001111010010101001010111010010111101001010100101011101001011110100101010010101011010011001101001100110100110011010011001101001100110100110011010011001011110101010010110010111101010100101100101111010101001011001010110100110011010011001101001100110100110011010011001101001100110100101001011010000100101101000010010110100001001011010000100101101000010010101101001100110100110011010011001101001100110100110011010011001101001
0101011000100110100110100101101010101100010011010011010010110101010101101001100110100110011010011001101001100110100110011010011001101001101001011001011110101010010101010010110010111101010100101010100101001001101001100100110100110010011010011001001101001100100110100100101010100101010100101010100101010100101010100101010100101010100101010100101010100101010100101010100101010100101010100101010100110100110011010011001101001100110100110011010011001101001100110100110110001010110001010110001010110001010110001010110001010110001010101101001100110100110011010011001101001100110100110011010011001101001010010101001010101100010011010010101001010101100010011010010101001010101011000100110100110100101101010011000100110100110100101101010011000100110010111101001010100101001011110100101010010100101111010010101001010010101101001100110100110011010011001101001100110100110011010011001101001001010011010001010011010001010011010001010011010001010011010001010010110100110011010011001101001100110100110011010011001101001100110100111101001010100101011101001011110100101010010101110100101111010010101001010101101001100110100110011010011001101001100110100110011010011001101001100101111010101001011001011110101010010110010111101010100101100101
010010100110101010110010100101100101111010101001010100101010110001001

128
Member State Health workforce
Physicians a Nursing and midwifery personnel a
Dentistry personnel a Pharmaceutical personnel a Environmental and public health workers a
Number
Density (per 10 000 population) Number
Density (per 10 000 population) Number
Density (per 10 000 population) Number
Density (per 10 000 population) Number
Density (per 10 000 population)
2005–2010
Saint Lucia … … … … … … … … … …
Saint Vincent and the Grenadines … … … … … … … … … …
Samoa 90 4.8 348 18.5 63 3.4 59 3.1 23 1.2
San Marino … … … … … … … … … …
Sao Tome and Principe … … … … … … … … … …
Saudi Arabia 24 802 9.4 55 429 21.0 6 049 2.3 1 529 0.6 … …
Senegal 741 0.6 5 254 4.2 105 0.1 127 0.1 1 212 1.0
Serbia 20 806 21.1 44 807 45.5 2 282 2.3 2 042 2.1 … …
Seychelles … … … … … … … … … …
Sierra Leone 95 0.2 991 1.7 24 <0.05 192 0.3 135 0.2
Singapore 8 323 18.3 26 792 59.0 1 463 3.2 1 658 3.7 … …
Slovakia 16 201 30.0 1 769 3.3 2 697 5.0 2 517 4.7 … …
Slovenia 4 915 25.1 16 460 83.9 1 236 6.3 1 066 5.4 … …
Solomon Islands 118 2.2 1 080 20.5 52 1.0 53 1.0 … …
Somalia 300 0.4 965 1.1 … … 50 0.1 41 0.1
South Africa … … … … … … … … … …
Spain 174 100 39.6 224 800 51.1 26 725 6.1 37 000 8.4 … …
Sri Lanka 10 279 4.9 40 678 19.3 1 743 0.8 886 0.4 2 411 1.1
Sudan 10 813 2.8 32 439 8.4 772 0.2 386 0.1 2 897 0.8
Suriname … … … … … … … … … …
Swaziland … … … … … … … … … …
Sweden 34 383 37.7 108 163 118.6 7 541 8.3 6 605 7.3 … …
Switzerland 29 680 40.7 120 013 164.6 4 030 5.5 4 249 5.8 … …
Syrian Arab Republic 30 702 15.0 38 070 18.6 16 169 7.9 16 579 8.1 … …
Tajikistan 14 459 21.0 36 490 53.0 1 150 1.7 … … … …
Thailand … … … … … … … … … …
The former Yugoslav Republic of Macedonia 5 364 26.3 1 250 6.1 1 381 6.8 1 022 5.0 … …
Timor-Leste … … … … … … … … … …
Togo 349 0.5 1 816 2.7 19 <0.05 11 <0.05 68 0.1
Tonga 58 5.6 400 38.8 37 3.6 15 1.5 25 2.4
Trinidad and Tobago 1 543 11.8 4 677 35.6 294 2.2 641 4.9 … …
Tunisia 12 535 11.9 34 551 32.8 2 528 2.4 2 106 2.0 … …
Turkey 118 641 15.4 49 357 6.4 20 589 2.7 25 201 3.3 19 304 2.5
Turkmenistan 12 176 23.9 22 551 44.2 702 1.4 953 1.9 … …
Tuvalu 12 10.9 64 58.2 2 1.8 1 0.9 12 10.9
Uganda 3 361 1.2 37 625 13.1 440 0.2 762 0.3 … …
Ukraine 144 714 32.5 383 130 85.9 19 367 4.3 22 257 4.8 … …
United Arab Emirates 9 215 19.3 19 529 40.9 2 053 4.3 2 817 5.9 … …
United Kingdom 166 006 27.4 613 201 101.3 32 189 5.3 39 715 6.6 … …
United Republic of Tanzania 300 0.1 9 440 2.4 230 0.1 81 <0.05 … …
United States of America 749 566 24.2 2 927 000 98.2 … … … … … …
Uruguay 13 197 37.4 19 595 55.5 2 476 7.0 1 877 5.3 … …
Uzbekistan 72 144 25.6 314 079 111.5 4 991 1.8 992 0.4 … …
Vanuatu 26 1.2 380 17.0 3 0.1 2 0.1 10 0.5
Venezuela (Bolivarian Republic of) … … … … … … … … … …
Viet Nam 107 131 12.2 88 025 10.1 … … 28 370 3.2 … …
Yemen 7 127 3.0 … … 2 375 1.0 … … … …
Zambia 649 0.6 8 369 7.1 56 0.1 108 0.1 803 0.7
Zimbabwe … … … … … … … … … …
6. Health workforce, infrastructure and essential medicines

129
Tabl
e 6
Health workforce Infrastructure Essential medicines Member State
Community health workers a
Psychiatrists b Hospital beds c
(per 10 000 popu-lation)
Psychiat-ric beds b
(per 10 000 popu-lation)
Computed tomography
units d
(per million
population)
MDG 8Median availability of selected generic
medicines e (%)
Median consumer price ratio of selected generic
medicines f
Number
Density (per 10 000 population) Number
Density (per 10 000 population) Public Private Public Private
2005–2010 2005–2011 2010 2001–2009
… … 3 0.2 15 … 11.5 … … … … Saint Lucia
… … 2 0.2 26 … 0.0 … … … … Saint Vincent and the Grenadines
… … 1 0.1 10 0.0 5.5 … … … … Samoa
… … 5 1.6 … … 31.7 … … … … San Marino
… … 1 0.1 29 3.6 … 56.3 22.2 2.4 13.8 Sao Tome and Principe
… … 765 0.3 22 1.2 4.0 i … … … … Saudi Arabia
… … 42 <0.05 … 0.3 0.4 i … … … … Senegal
… … 947 1.0 54 … 13.2 … … … … Serbia
… … 2 0.2 36 … 11.6 … … … … Seychelles
132 0.2 1 <0.05 … 0.3 0.3 … … … … Sierra Leone
… … 136 0.3 31 4.2 9.4 … … … … Singapore
… … 621 1.1 65 6.9 … … … … … Slovakia
… … 143 0.7 46 7.7 12.3 i … … … … Slovenia
… … … … … … … … … … … Solomon Islands
… … 4 <0.05 … 0.6 … … … … … Somalia
… … 136 <0.05 … 2.2 1.0 i … g 71.7 p … g 6.5 South Africa
… … 3 894 0.9 32 4.3 14.1 … … … … Spain
… … 60 <0.05 … 0.9 1.2 … … … … Sri Lanka
… … 28 <0.05 7 0.1 1.0 51.7 q 77.1 q 4.4 q 4.7 Sudan
… … 6 0.1 26 5.7 7.6 … … … … Suriname
… … 2 <0.05 21 1.3 2.5 … … … … Swaziland
… … 330 0.4 28 3.5 … … … … … Sweden
… … 3 146 4.1 52 … … … … … … Switzerland
… … 70 <0.05 15 0.6 … … g 98.2 … g 2.5 Syrian Arab Republic
… … 96 0.1 52 2.1 … 75.0 85.0 2.4 2.3 Tajikistan
… … 302 <0.05 21 1.3 5.8 75.0 28.6 2.6 3.3 Thailand
… … 204 1.0 45 6.4 … … … … … The former Yugoslav Republic of Macedonia
… … 2 <0.05 59 … … … … … … Timor-Leste
… … 2 <0.05 7 0.2 0.8 … … … … Togo
… … 2 0.2 26 2.1 0.0 … … … … Tonga
… … 23 0.2 26 7.7 3.0 i … … … … Trinidad and Tobago
… … 205 0.2 21 0.9 9.4 64.3 95.1 … k 6.8 Tunisia
… … 1 616 0.2 25 1.0 15.0 … … … … Turkey
… … … … 40 … … … … … … Turkmenistan
… … … … … … … … … … … Tuvalu
… … 31 <0.05 5 0.3 0.3 20.0 80.0 … k 2.6 Uganda
… … 4 592 1.0 87 9.4 … 100.0 90.7 4.0 3.7 Ukraine
… … 14 <0.05 19 0.2 … 61.1 73.9 … k 13.8 United Arab Emirates
… … 9 220 1.5 33 5.0 … … … … … United Kingdom
… … 17 <0.05 7 0.3 0.1 23.4 47.9 1.3 2.7 United Republic of Tanzania
… … 24 758 0.8 30 3.4 … … … … … United States of America
… … 581 1.7 12 4.6 13.1 … … … … Uruguay
… … 937 0.3 46 1.8 … … g 82.5 … g 2.0 Uzbekistan
212 9.5 0 0.0 17 0.2 0.0 … … … … Vanuatu
… … … … 11 … … … … … … Venezuela (Bolivarian Republic of)
… … 900 0.1 31 1.8 … … … … … Viet Nam
… … … … 7 … 2.1 5.0 90.0 1.1 3.5 Yemen
… … 4 <0.05 20 0.3 0.2 … … … … Zambia
… … 7 <0.05 17 1.0 0.5 … … … … Zimbabwe
011010011001101001100110100110011010011001101001100110100110011010011010010110010111101010100101010100101100101111010101001010101001010010011010011001001101001100100110100110010011010011001001101001001010101001010101001010101001010101001010101001010101001010101001010101001010101001010101001010101001010101001010101001010101001101001100110100110011010011001101001100110100110011010011001101001101100010101100010101100010101100010101100010101100010101100010101011010011001101001100110100110011010011001101001100110100110011010010100101010010101011000100110100101010010101011000100110100101010010101010110001001101001101001011010100110001001101001101001011010100110001001100101111010010101001010010111101001010100101001011110100101010010100101011010011001101001100110100110011010011001101001100110100110011010010010100110100010100110100010100110100010100110100010100110100010100101101001100110100110011010011001101001100110100110011010011001101001111010010101001010111010010111101001010100101011101001011110100101010010101011010011001101001100110100110011010011001101001100110100110011010011001011110101010010110010111101010100101100101111010101001011001010110100110011010011001101001100110100110011010011001101001100110100101001011010000100101101000010010110100001001011010000100101101000010010101101001100110100110011010011001101001100110100110011010011001101001
0101011000100110100110100101101010101100010011010011010010110101010101101001100110100110011010011001101001100110100110011010011001101001101001011001011110101010010101010010110010111101010100101010100101001001101001100100110100110010011010011001001101001100100110100100101010100101010100101010100101010100101010100101010100101010100101010100101010100101010100101010100101010100101010100101010100110100110011010011001101001100110100110011010011001101001100110100110110001010110001010110001010110001010110001010110001010110001010101101001100110100110011010011001101001100110100110011010011001101001010010101001010101100010011010010101001010101100010011010010101001010101011000100110100110100101101010011000100110100110100101101010011000100110010111101001010100101001011110100101010010100101111010010101001010010101101001100110100110011010011001101001100110100110011010011001101001001010011010001010011010001010011010001010011010001010011010001010010110100110011010011001101001100110100110011010011001101001100110100111101001010100101011101001011110100101010010101110100101111010010101001010101101001100110100110011010011001101001100110100110011010011001101001100101111010101001011001011110101010010110010111101010100101100101
010010100110101010110010100101100101111010101001010100101010110001001
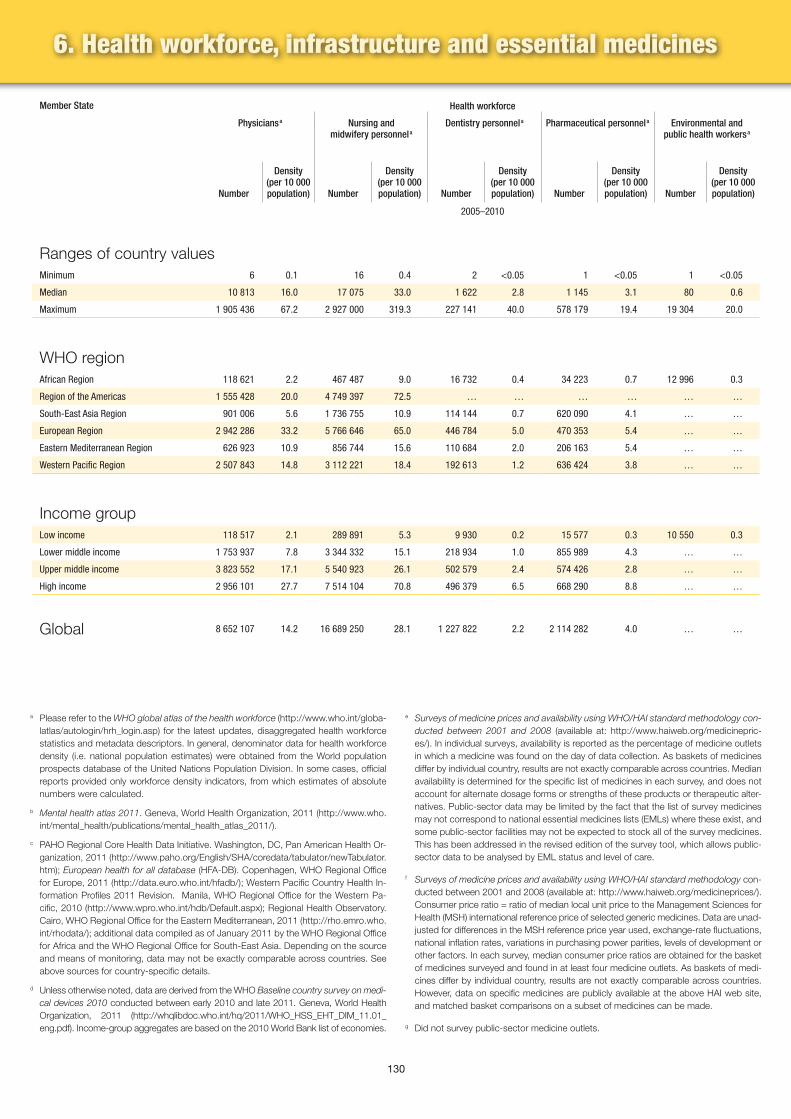
130
Member State Health workforce
Physicians a Nursing and midwifery personnel a
Dentistry personnel a Pharmaceutical personnel a Environmental and public health workers a
Number
Density (per 10 000 population) Number
Density (per 10 000 population) Number
Density (per 10 000 population) Number
Density (per 10 000 population) Number
Density (per 10 000 population)
2005–2010
Ranges of country valuesMinimum 6 0.1 16 0.4 2 <0.05 1 <0.05 1 <0.05
Median 10 813 16.0 17 075 33.0 1 622 2.8 1 145 3.1 80 0.6
Maximum 1 905 436 67.2 2 927 000 319.3 227 141 40.0 578 179 19.4 19 304 20.0
WHO regionAfrican Region 118 621 2.2 467 487 9.0 16 732 0.4 34 223 0.7 12 996 0.3
Region of the Americas 1 555 428 20.0 4 749 397 72.5 … … … … … …
South-East Asia Region 901 006 5.6 1 736 755 10.9 114 144 0.7 620 090 4.1 … …
European Region 2 942 286 33.2 5 766 646 65.0 446 784 5.0 470 353 5.4 … …
Eastern Mediterranean Region 626 923 10.9 856 744 15.6 110 684 2.0 206 163 5.4 … …
Western Pacific Region 2 507 843 14.8 3 112 221 18.4 192 613 1.2 636 424 3.8 … …
Income groupLow income 118 517 2.1 289 891 5.3 9 930 0.2 15 577 0.3 10 550 0.3
Lower middle income 1 753 937 7.8 3 344 332 15.1 218 934 1.0 855 989 4.3 … …
Upper middle income 3 823 552 17.1 5 540 923 26.1 502 579 2.4 574 426 2.8 … …
High income 2 956 101 27.7 7 514 104 70.8 496 379 6.5 668 290 8.8 … …
Global 8 652 107 14.2 16 689 250 28.1 1 227 822 2.2 2 114 282 4.0 … …
a Please refer to the WHO global atlas of the health workforce (http://www.who.int/globa-latlas/autologin/hrh_login.asp) for the latest updates, disaggregated health workforce statistics and metadata descriptors. In general, denominator data for health workforce density (i.e. national population estimates) were obtained from the World population prospects database of the United Nations Population Division. In some cases, official reports provided only workforce density indicators, from which estimates of absolute numbers were calculated.
b Mental health atlas 2011. Geneva, World Health Organization, 2011 (http://www.who.int/mental_health/publications/mental_health_atlas_2011/).
c PAHO Regional Core Health Data Initiative. Washington, DC, Pan American Health Or-ganization, 2011 (http://www.paho.org/English/SHA/coredata/tabulator/newTabulator.htm); European health for all database (HFA-DB). Copenhagen, WHO Regional Office for Europe, 2011 (http://data.euro.who.int/hfadb/); Western Pacific Country Health In-formation Profiles 2011 Revision. Manila, WHO Regional Office for the Western Pa-cific, 2010 (http://www.wpro.who.int/hdb/Default.aspx); Regional Health Observatory. Cairo, WHO Regional Office for the Eastern Mediterranean, 2011 (http://rho.emro.who.int/rhodata/); additional data compiled as of January 2011 by the WHO Regional Office for Africa and the WHO Regional Office for South-East Asia. Depending on the source and means of monitoring, data may not be exactly comparable across countries. See above sources for country-specific details.
d Unless otherwise noted, data are derived from the WHO Baseline country survey on medi-cal devices 2010 conducted between early 2010 and late 2011. Geneva, World Health Organization, 2011 (http://whqlibdoc.who.int/hq/2011/WHO_HSS_EHT_DIM_11.01_eng.pdf). Income-group aggregates are based on the 2010 World Bank list of economies.
e Surveys of medicine prices and availability using WHO/HAI standard methodology con-ducted between 2001 and 2008 (available at: http://www.haiweb.org/medicinepric-es/). In individual surveys, availability is reported as the percentage of medicine outlets in which a medicine was found on the day of data collection. As baskets of medicines differ by individual country, results are not exactly comparable across countries. Median availability is determined for the specific list of medicines in each survey, and does not account for alternate dosage forms or strengths of these products or therapeutic alter-natives. Public-sector data may be limited by the fact that the list of survey medicines may not correspond to national essential medicines lists (EMLs) where these exist, and some public-sector facilities may not be expected to stock all of the survey medicines. This has been addressed in the revised edition of the survey tool, which allows public-sector data to be analysed by EML status and level of care.
f Surveys of medicine prices and availability using WHO/HAI standard methodology con-ducted between 2001 and 2008 (available at: http://www.haiweb.org/medicineprices/). Consumer price ratio = ratio of median local unit price to the Management Sciences for Health (MSH) international reference price of selected generic medicines. Data are unad-justed for differences in the MSH reference price year used, exchange-rate fluctuations, national inflation rates, variations in purchasing power parities, levels of development or other factors. In each survey, median consumer price ratios are obtained for the basket of medicines surveyed and found in at least four medicine outlets. As baskets of medi-cines differ by individual country, results are not exactly comparable across countries. However, data on specific medicines are publicly available at the above HAI web site, and matched basket comparisons on a subset of medicines can be made.
g Did not survey public-sector medicine outlets.
6. Health workforce, infrastructure and essential medicines

131
Tabl
e 6
Health workforce Infrastructure Essential medicines Member State
Community health workers a
Psychiatrists b Hospital beds c
(per 10 000 popu-lation)
Psychiat-ric beds b
(per 10 000 popu-lation)
Computed tomography
units d
(per million
population)
MDG 8Median availability of selected generic
medicines e (%)
Median consumer price ratio of selected generic
medicines f
Number
Density (per 10 000 population) Number
Density (per 10 000 population) Public Private Public Private
2005–2010 2005–2011 2010 2001–2009
3 0.2 0 0.0 1 0.0 0.0 0.0 0.0 0.9 1.3 Minimum
1 012 2.1 59 0.1 26 1.5 4.0 41.7 71.9 2.4 4.2 Median
1 113 331 13.8 24 758 4.1 137 27.8 141.2 100.0 98.2 6.5 28.3 Maximum
… … 1 225 <0.05 … 0.6 0.4 … … … … African Region
… … 40 591 0.5 24 2.3 … … … … … Region of the Americas
103 327 0.8 4 277 <0.05 9 0.3 … … … … … South-East Asia Region
… … 82 390 1.1 61 6.3 … … … … … European Region
… … 3 751 0.1 12 0.6 1.9 … … … … Eastern Mediterranean Region
1 118 542 8.1 37 368 0.2 47 3.9 … … … … … Western Pacific Region
… … 851 <0.05 17 0.2 0.2 … … … … Low income
89 756 0.6 13 021 0.1 12 0.6 … … … … … Lower middle income
1 114 741 8.3 55 388 0.2 39 2.2 … … … … … Upper middle income
… … 100 342 1.0 56 8.3 … … … … … High income
… … 169 602 0.3 30 2.5 … … … … … Global
h Availability data were excluded as they were assessed using different methods to those used in the current WHO/HAI methodology.
i Refers to the public sector only.j Based on a survey of medicine prices and availability in Rio Grande do Sul State, Brazil.k Medicines are provided free to patients in the public sector.l Refers to the private sector only.m Simple average of three surveys of medicine prices and availability in China (Shaanxi,
Shandong and Shanghai provinces).n Restricted to reimbursed medicines available through public-sector outlets.o Simple average of seven surveys of medicine prices and availability in India (Chennai,
Haryana, Karnataka, Maharashtra (12 districts); Maharashtra (4 regions); Rajasthan; and West Bengal).
p Based on a survey of medicine prices and availability in Gauteng province, South Af-rica.
q Simple average of four surveys of medicine prices and availability in Sudan (Gadarif, Khartoum, North Kordofan and Northern states).
011010011001101001100110100110011010011001101001100110100110011010011010010110010111101010100101010100101100101111010101001010101001010010011010011001001101001100100110100110010011010011001001101001001010101001010101001010101001010101001010101001010101001010101001010101001010101001010101001010101001010101001010101001010101001101001100110100110011010011001101001100110100110011010011001101001101100010101100010101100010101100010101100010101100010101100010101011010011001101001100110100110011010011001101001100110100110011010010100101010010101011000100110100101010010101011000100110100101010010101010110001001101001101001011010100110001001101001101001011010100110001001100101111010010101001010010111101001010100101001011110100101010010100101011010011001101001100110100110011010011001101001100110100110011010010010100110100010100110100010100110100010100110100010100110100010100101101001100110100110011010011001101001100110100110011010011001101001111010010101001010111010010111101001010100101011101001011110100101010010101011010011001101001100110100110011010011001101001100110100110011010011001011110101010010110010111101010100101100101111010101001011001010110100110011010011001101001100110100110011010011001101001100110100101001011010000100101101000010010110100001001011010000100101101000010010101101001100110100110011010011001101001100110100110011010011001101001
0101011000100110100110100101101010101100010011010011010010110101010101101001100110100110011010011001101001100110100110011010011001101001101001011001011110101010010101010010110010111101010100101010100101001001101001100100110100110010011010011001001101001100100110100100101010100101010100101010100101010100101010100101010100101010100101010100101010100101010100101010100101010100101010100101010100110100110011010011001101001100110100110011010011001101001100110100110110001010110001010110001010110001010110001010110001010110001010101101001100110100110011010011001101001100110100110011010011001101001010010101001010101100010011010010101001010101100010011010010101001010101011000100110100110100101101010011000100110100110100101101010011000100110010111101001010100101001011110100101010010100101111010010101001010010101101001100110100110011010011001101001100110100110011010011001101001001010011010001010011010001010011010001010011010001010011010001010010110100110011010011001101001100110100110011010011001101001100110100111101001010100101011101001011110100101010010101110100101111010010101001010101101001100110100110011010011001101001100110100110011010011001101001100101111010101001011001011110101010010110010111101010100101100101
010010100110101010110010100101100101111010101001010100101010110001001

132

133
Tabl
e 7
7. Health expenditure
Table 7 presents data on government, private, external, social security and out-of-pocket expenditures on health. These data are generated from information that has been collected by WHO since 1999. The most comprehensive and consistent data on health financing are generated from national health accounts (NHAs) that collect expenditure information within an internationally recognized framework. NHAs trace financing as it flows from funding sources to decision-makers (who decide upon the use of the funds) and then to the providers and beneficiaries of health services. Not all countries maintain or update NHAs – in such cases, data are obtained through technical contacts in the country or from publicly available documents and reports. Missing values are estimated using various accounting tech-niques depending upon the data available for each country.32 WHO sends all such estimates to the respective ministries of health every year for validation.
32. To obtain the latest updates, a full series or more-disaggregated health expenditures including metadata and sources, please see: http://www.who.int/nha/
011010011001101001100110100110011010011001101001100110100110011010011010010110010111101010100101010100101100101111010101001010101001010010011010011001001101001100100110100110010011010011001001101001001010101001010101001010101001010101001010101001010101001010101001010101001010101001010101001010101001010101001010101001010101001101001100110100110011010011001101001100110100110011010011001101001101100010101100010101100010101100010101100010101100010101100010101011010011001101001100110100110011010011001101001100110100110011010010100101010010101011000100110100101010010101011000100110100101010010101010110001001101001101001011010100110001001101001101001011010100110001001100101111010010101001010010111101001010100101001011110100101010010100101011010011001101001100110100110011010011001101001100110100110011010010010100110100010100110100010100110100010100110100010100110100010100101101001100110100110011010011001101001100110100110011010011001101001111010010101001010111010010111101001010100101011101001011110100101010010101011010011001101001100110100110011010011001101001100110100110011010011001011110101010010110010111101010100101100101111010101001011001010110100110011010011001101001100110100110011010011001101001100110100101001011010000100101101000010010110100001001011010000100101101000010010101101001100110100110011010011001101001100110100110011010011001101001
0101011000100110100110100101101010101100010011010011010010110101010101101001100110100110011010011001101001100110100110011010011001101001101001011001011110101010010101010010110010111101010100101010100101001001101001100100110100110010011010011001001101001100100110100100101010100101010100101010100101010100101010100101010100101010100101010100101010100101010100101010100101010100101010100101010100110100110011010011001101001100110100110011010011001101001100110100110110001010110001010110001010110001010110001010110001010110001010101101001100110100110011010011001101001100110100110011010011001101001010010101001010101100010011010010101001010101100010011010010101001010101011000100110100110100101101010011000100110100110100101101010011000100110010111101001010100101001011110100101010010100101111010010101001010010101101001100110100110011010011001101001100110100110011010011001101001001010011010001010011010001010011010001010011010001010011010001010010110100110011010011001101001100110100110011010011001101001100110100111101001010100101011101001011110100101010010101110100101111010010101001010101101001100110100110011010011001101001100110100110011010011001101001100101111010101001011001011110101010010110010111101010100101100101
010010100110101010110010100101100101111010101001010100101010110001001

134
Member State Health expenditure ratios a
Total expenditure on health as % of gross
domestic product
General government expenditure on health
as % of total expenditure on health b
Private expenditure on health
as % of total expenditure on health b
General government expenditure on health as % of
total government expenditure
External resources for health as % of total
expenditure on health c
Social security expenditure on health as % of
general government expenditure on health
2000 2009 2000 2009 2000 2009 2000 2009 2000 2009 2000 2009
Afghanistan e,f … 7.6 … 11.6 … 88.4 … 1.6 … 24.3 … 0
Albania 6.4 6.9 36.1 41.2 63.9 58.8 7.0 8.4 6.0 2.7 20.4 70.9
Algeria 3.5 4.6 73.3 79.3 26.7 20.7 9.0 8.6 0.1 0.1 35.5 31.1
Andorra 7.6 7.5 64.8 70.1 35.2 29.9 19.1 21.3 0 0 88.1 88.0
Angola g 2.4 4.9 79.2 89.9 20.8 10.1 3.3 10.1 3.6 2.8 0 0
Antigua and Barbuda e 4.8 4.8 69.0 67.1 31.0 32.9 12.1 8.0 0 0 0 0
Argentina 9.0 9.5 55.4 66.4 44.6 33.6 14.7 22.2 0 0.1 59.5 59.4
Armenia 6.3 4.6 18.1 43.5 81.9 56.5 4.6 6.6 8.7 8.4 0 0
Australia h 8.0 8.7 66.8 68.0 33.2 32.0 15.1 16.8 0 0 0 0
Austria 9.9 11.0 76.8 77.7 23.2 22.3 14.6 16.2 0 0 58.8 57.4
Azerbaijan i 4.7 5.8 18.5 23.1 81.5 76.9 5.4 4.5 4.0 0.7 0 0
Bahamas e 5.9 8.3 47.6 46.8 52.4 53.2 14.5 15.2 0 0 1.8 3.1
Bahrain 3.9 4.7 67.5 70.1 32.5 29.9 10.2 11.4 0 0 0.4 1.3
Bangladesh 2.8 3.4 39.0 33.0 61.0 67.0 7.6 7.4 6.9 7.9 0 0
Barbados 6.3 5.9 65.8 58.6 34.2 41.4 11.7 7.8 4.0 2.2 0 0.3
Belarus 6.1 6.1 75.5 64.0 24.5 36.0 10.1 8.4 0.1 0.2 0 0
Belgium j 8.1 10.8 74.6 75.1 25.4 24.9 12.3 15.1 0 0 85.4 84.9
Belize e 4.0 5.5 52.8 63.8 47.2 36.2 6.5 11.8 2.1 0.7 0 3.3
Benin 4.3 4.3 44.2 53.8 55.8 46.2 10.0 9.2 17.0 26.6 0.5 0.5
Bhutan e 6.9 5.1 79.3 86.5 20.7 13.5 12.2 12.1 21.3 8.1 0 0
Bolivia (Plurinational State of) 6.1 5.1 60.1 64.6 39.9 35.4 9.8 7.3 6.0 7.0 62.0 38.3
Bosnia and Herzegovina 7.0 10.9 57.6 61.3 42.4 38.7 11.4 15.1 9.2 1.6 97.7 94.7
Botswana 4.7 10.0 62.2 76.0 37.8 24.0 7.6 17.0 0.5 19.5 0 0
Brazil 7.2 8.8 40.3 43.6 59.7 56.4 4.1 5.9 0.5 0 0 0
Brunei Darussalam 4.2 3.0 86.5 85.2 13.5 14.8 6.3 7.5 … … … …
Bulgaria 6.2 7.2 60.9 55.4 39.1 44.6 9.1 9.8 1.9 0 12.0 64.6
Burkina Faso e 5.1 6.6 39.6 49.7 60.4 50.3 8.8 13.6 13.9 26.0 0.8 0.5
Burundi e,g 6.3 11.4 28.6 36.0 71.4 64.0 7.5 8.1 18.6 45.4 25.1 23.0
Cambodia e 6.3 5.3 20.4 36.6 79.6 63.4 8.7 9.8 8.6 22.0 … …
Cameroon e,g 4.5 4.9 20.8 25.9 79.2 74.1 6.1 7.3 4.2 10.9 3.9 5.2
Canada 8.8 11.4 70.4 70.6 29.6 29.4 15.1 18.3 0 0 2.0 1.9
Cape Verde 4.6 3.9 73.5 74.1 26.5 25.9 9.6 9.7 13.5 7.4 36.1 27.5
Central African Republic 3.8 4.0 41.4 34.2 58.6 65.8 10.1 8.5 20.3 10.1 0 0
Chad 6.3 4.6 42.5 19.7 57.5 80.3 13.1 3.3 24.9 10.4 0 0
Chile 8.3 8.4 41.6 47.6 58.4 52.4 14.1 16.2 0 0 15.0 14.2
China e,k 4.6 5.1 38.3 52.5 61.7 47.5 10.9 12.1 0.1 0.1 57.2 64.7
Colombia e 7.3 7.6 70.7 71.1 29.3 28.9 21.4 19.3 0.3 0.1 60.2 48.6
Comoros g 2.9 3.2 52.8 53.2 47.2 46.8 9.3 7.3 25.7 18.2 0 0
Congo 2.1 2.8 57.7 47.5 42.3 52.5 4.8 5.3 4.6 7.0 0 0
Cook Islands e,l,m 3.4 4.3 90.5 93.8 9.5 6.2 9.9 11.6 2.2 3.8 0 0
Costa Rica 6.5 10.5 76.8 67.4 23.2 32.6 21.7 30.6 1.0 0.2 89.6 85.6
Côte d'Ivoire 5.1 5.2 26.3 20.9 73.7 79.1 7.2 5.1 5.4 10.5 0 0
Croatia 7.8 7.8 86.1 84.9 13.9 15.1 14.5 17.7 0.4 0 97.6 91.0
Cuba 6.1 12.1 90.1 92.7 9.9 7.3 10.8 14.9 0.2 0.1 0 0
Cyprus 5.8 6.1 41.7 41.5 58.3 58.5 6.5 5.5 0 0 0 0.3
Czech Republic 6.3 8.0 90.3 84.0 9.7 16.0 13.7 14.9 0 0 89.5 90.2
Democratic People's Republic of Korea … … … … … … … … … … … …
Democratic Republic of the Congo e 4.9 9.6 4.1 44.7 95.9 55.3 1.8 12.5 2.8 34.3 0 0
Denmark 8.7 11.5 83.9 85.0 16.1 15.0 13.6 16.8 0 0 0 0
7. Health expenditure

135
Tabl
e 7
Health expenditure ratios a Per capita health expenditures a Member State
Out-of-pocket expenditure as % of
private expenditure on health
Private prepaid plans as % of private expenditure on health
Per capita total expenditure on health at average exchange
rate (US$)
Per capita total expenditure on health d
(PPP int. $)
Per capita government expenditure on health at average exchange
rate (US$)
Per capita government expenditure on health d
(PPP int. $)
2000 2009 2000 2009 2000 2009 2000 2009 2000 2009 2000 2009
… 94.0 … 0 … 34 … 46 … 4 … 5 Afghanistan e,f
99.9 99.8 0 0 75 260 266 591 27 107 96 244 Albania
96.7 94.7 3.1 5.1 63 181 188 365 46 143 138 289 Algeria
75.5 74.7 22.3 23.1 1330 3364 1967 3403 862 2358 1275 2385 Andorra
100 100 0 0 16 201 56 297 13 181 45 267 Angola g
86.8 88.9 13.2 11.1 408 601 585 873 281 403 403 585 Antigua and Barbuda e
63.3 59.2 32.6 32.8 689 734 816 1386 382 488 452 921 Argentina
94.2 92.9 0 0.5 39 129 128 245 7 56 23 106 Armenia
59.7 61.0 21.8 25.2 1713 3945 2253 3484 1145 2683 1505 2369 Australia h
66.1 64.7 20.7 19.6 2374 5035 2862 4288 1824 3910 2199 3330 Austria
77.6 90.1 0.3 0.7 30 283 102 554 6 65 19 128 Azerbaijan i
40.2 54.0 58.6 45.1 1098 1741 1365 2086 523 815 650 977 Bahamas e
68.7 57.2 25.4 26.7 497 771 815 1083 335 540 551 759 Bahrain
95.1 96.5 0.1 0.3 10 21 24 53 4 7 9 18 Bangladesh
77.3 80.6 22.7 19.4 601 843 791 1179 396 494 520 690 Barbados
57.1 74.8 0.1 0.1 63 311 319 782 48 199 241 501 Belarus
80.9 80.1 15.4 19.1 1844 4749 2246 3948 1376 3567 1676 2965 Belgium j
83.0 74.3 2.6 12.4 132 242 197 393 69 154 104 251 Belize e
99.9 92.7 0.1 7.3 16 34 53 69 7 18 23 37 Benin
100 96.3 0 0 52 91 165 254 41 78 131 220 Bhutan e
81.6 77.2 8.1 19.1 61 90 192 237 37 58 115 153 Bolivia (Plurinational State of)
100 100 0 0 106 495 315 934 61 303 182 573 Bosnia and Herzegovina
36.7 29.5 4.1 5.6 152 581 400 1296 94 442 249 985 Botswana
63.6 57.2 34.3 41.0 265 734 502 921 107 320 202 401 Brazil
98.8 98.9 0.6 0.5 551 833 1284 1516 477 710 1111 1291 Brunei Darussalam
100 97.1 0 1.0 98 463 385 995 60 256 235 551 Bulgaria
94.4 73.8 1.0 3.7 11 39 39 89 4 19 16 44 Burkina Faso e
70.6 61.5 0.3 0.2 7 19 20 45 2 7 6 16 Burundi e,g
89.5 66.8 0 0 19 41 58 110 4 15 12 40 Cambodia e
94.4 94.5 0 0 27 60 74 117 6 16 15 30 Cameroon e,g
53.7 49.6 38.8 43.2 2089 4519 2519 4314 1470 3191 1772 3047 Canada
99.6 99.7 0.4 0.3 57 150 95 174 42 111 70 129 Cape Verde
95.0 95.0 0 0 10 18 26 30 4 6 11 10 Central African Republic
96.2 96.7 0.4 0.2 11 28 42 60 4 6 18 12 Chad
62.2 64.6 37.8 35.4 405 802 768 1209 169 382 320 576 Chile
95.6 78.9 1.0 6.9 43 191 108 347 17 100 41 182 China e,k
76.7 74.8 23.3 25.2 184 392 429 687 130 278 303 488 Colombia e
100 100 0 0 10 24 27 34 5 13 14 18 Comoros g
100 100 0 0 22 67 58 108 13 32 34 52 Congo
100 100 0 0 175 435 241 382 158 408 218 358 Cook Islands e,l,m
88.2 87.6 2.3 7.4 266 667 471 1155 204 449 362 778 Costa Rica
98.1 98.8 1.9 1.2 32 61 81 95 8 13 21 20 Côte d'Ivoire
100 95.9 0 4.1 377 1112 847 1556 325 944 730 1320 Croatia
91.9 100 0 0 168 672 148 478 151 623 134 443 Cuba
95.7 83.5 4.3 9.4 744 1794 1107 1874 310 745 461 778 Cyprus
100 90.0 0 1.3 361 1495 981 2107 326 1255 886 1769 Czech Republic
… … … … … … … … … … … … Democratic People's Republic of Korea
75.4 64.8 0 0.2 13 17 11 31 <1 7 <1 14 Democratic Republic of the Congo e
90.9 88.1 8.7 11.5 2609 6452 2507 4345 2188 5487 2103 3695 Denmark
011010011001101001100110100110011010011001101001100110100110011010011010010110010111101010100101010100101100101111010101001010101001010010011010011001001101001100100110100110010011010011001001101001001010101001010101001010101001010101001010101001010101001010101001010101001010101001010101001010101001010101001010101001010101001101001100110100110011010011001101001100110100110011010011001101001101100010101100010101100010101100010101100010101100010101100010101011010011001101001100110100110011010011001101001100110100110011010010100101010010101011000100110100101010010101011000100110100101010010101010110001001101001101001011010100110001001101001101001011010100110001001100101111010010101001010010111101001010100101001011110100101010010100101011010011001101001100110100110011010011001101001100110100110011010010010100110100010100110100010100110100010100110100010100110100010100101101001100110100110011010011001101001100110100110011010011001101001111010010101001010111010010111101001010100101011101001011110100101010010101011010011001101001100110100110011010011001101001100110100110011010011001011110101010010110010111101010100101100101111010101001011001010110100110011010011001101001100110100110011010011001101001100110100101001011010000100101101000010010110100001001011010000100101101000010010101101001100110100110011010011001101001100110100110011010011001101001
0101011000100110100110100101101010101100010011010011010010110101010101101001100110100110011010011001101001100110100110011010011001101001101001011001011110101010010101010010110010111101010100101010100101001001101001100100110100110010011010011001001101001100100110100100101010100101010100101010100101010100101010100101010100101010100101010100101010100101010100101010100101010100101010100101010100110100110011010011001101001100110100110011010011001101001100110100110110001010110001010110001010110001010110001010110001010110001010101101001100110100110011010011001101001100110100110011010011001101001010010101001010101100010011010010101001010101100010011010010101001010101011000100110100110100101101010011000100110100110100101101010011000100110010111101001010100101001011110100101010010100101111010010101001010010101101001100110100110011010011001101001100110100110011010011001101001001010011010001010011010001010011010001010011010001010011010001010010110100110011010011001101001100110100110011010011001101001100110100111101001010100101011101001011110100101010010101110100101111010010101001010101101001100110100110011010011001101001100110100110011010011001101001100101111010101001011001011110101010010110010111101010100101100101
010010100110101010110010100101100101111010101001010100101010110001001

136
Member State Health expenditure ratios a
Total expenditure on health as % of gross
domestic product
General government expenditure on health
as % of total expenditure on health b
Private expenditure on health
as % of total expenditure on health b
General government expenditure on health as % of
total government expenditure
External resources for health as % of total
expenditure on health c
Social security expenditure on health as % of
general government expenditure on health
2000 2009 2000 2009 2000 2009 2000 2009 2000 2009 2000 2009
Djibouti 5.8 7.8 67.8 69.3 32.2 30.7 12.0 14.1 32.6 26.3 11.3 9.6
Dominica 5.9 6.2 69.0 65.2 31.0 34.8 6.6 8.3 3.7 3.1 0 0
Dominican Republic 6.3 5.9 34.5 41.4 65.5 58.6 15.9 12.4 2.0 0.8 17.0 24.4
Ecuador e 4.2 8.8 31.2 34.9 68.8 65.1 6.4 7.7 4.1 0.7 28.0 38.3
Egypt 5.4 4.8 40.5 39.5 59.5 60.5 7.3 5.6 1.0 1.5 24.3 23.1
El Salvador 8.0 6.8 45.2 60.3 54.8 39.7 14.3 12.3 0.9 7.5 44.2 37.5
Equatorial Guinea g,n 1.9 4.5 46.3 76.0 53.7 24.0 7.8 7.0 8.8 2.8 0 0
Eritrea g 5.3 2.8 47.6 47.7 52.4 52.3 3.7 3.6 25.7 61.9 0 0
Estonia 6.0 6.7 67.8 78.4 32.2 21.6 11.3 11.7 0.8 63.1 86.0 86.4
Ethiopia e 4.3 4.4 53.6 53.6 46.4 46.4 8.5 13.3 16.5 38.0 0 0
Fiji e,m 3.8 4.9 84.1 69.4 15.9 30.6 11.3 10.1 7.5 6.1 0 0
Finland 7.2 9.0 71.3 74.7 28.7 25.3 10.6 12.1 0 0 19.5 19.9
France 10.1 11.9 79.4 77.9 20.6 22.1 15.5 16.3 0 0 94.3 90.5
Gabon g 2.5 3.6 42.0 47.9 58.0 52.1 4.8 6.6 2.6 1.7 5.7 24.9
Gambia 5.8 6.1 33.8 53.4 66.2 46.6 8.8 11.3 22.2 25.4 0 0
Georgia o 6.9 10.2 17.0 22.3 83.0 77.7 6.9 6.1 5.4 5.5 46.0 82.5
Germany 10.4 11.7 79.5 76.9 20.5 23.1 18.3 18.7 0 0 87.3 88.7
Ghana 4.7 5.0 48.7 56.7 51.3 43.3 8.3 12.4 14.5 14.4 0 27.1
Greece 7.9 10.6 60.0 61.7 40.0 38.3 10.1 12.1 0 0 45.9 51.8
Grenada e 6.6 6.2 52.0 49.2 48.0 50.8 13.2 9.5 0 3.8 0 0.2
Guatemala 5.5 6.9 39.8 37.0 60.2 63.0 16.7 17.0 3.4 2.3 52.3 45.0
Guinea 5.7 5.3 18.7 8.2 81.3 91.8 6.4 1.8 13.4 5.3 1.1 3.8
Guinea-Bissau g 6.2 8.6 16.2 10.6 83.8 89.4 2.3 4.1 46.5 17.4 5.4 2.7
Guyana e 5.6 5.6 82.4 54.9 17.6 45.1 10.0 10.0 4.1 35.6 7.7 0
Haiti 6.1 6.1 27.7 21.8 72.3 78.2 16.0 6.0 9.4 40.8 0 0
Honduras e 5.4 7.0 66.8 66.3 33.2 33.7 18.1 17.7 3.1 6.9 13.7 25.3
Hungary 7.2 7.6 70.7 69.7 29.3 30.3 10.6 10.3 0 0 83.9 84.3
Iceland 9.7 9.8 81.5 82.2 18.5 17.8 18.9 15.7 0 0 32.4 35.2
India 4.4 4.2 26.0 30.3 74.0 69.7 3.6 3.7 0.5 1.1 18.3 17.4
Indonesia e 2.0 2.5 36.1 46.1 63.9 53.9 4.5 6.8 0 1.4 6.3 15.1
Iran (Islamic Republic of) e,p 4.6 5.7 41.6 41.1 58.4 58.9 8.4 10.5 0 0 57.8 55.6
Iraq g,q 2.8 8.4 1.1 78.1 98.9 21.9 0.1 7.0 12.9 1.5 0 0
Ireland 6.1 9.4 75.1 75.0 24.9 25.0 14.7 14.5 0 0 1.2 0.9
Israel 7.3 7.6 64.0 60.3 36.0 39.7 9.7 10.4 0 0 67.0 64.1
Italy 8.0 9.4 72.5 77.9 27.5 22.1 12.7 14.2 0 0 0.1 0.2
Jamaica 5.5 4.9 52.6 55.4 47.4 44.6 6.6 5.4 1.8 1.9 0 0
Japan 7.7 9.5 80.8 82.3 19.2 17.7 15.9 18.4 0 0 84.9 87.7
Jordan e 9.7 9.6 48.0 70.3 52.0 29.7 10.9 18.6 4.5 4.2 9.7 26.5
Kazakhstan 4.2 4.5 50.9 59.2 49.1 40.8 9.2 11.3 7.3 0.3 0 0
Kenya 4.7 4.8 46.3 43.3 53.7 56.7 10.3 7.3 8.0 34.0 10.9 10.8
Kiribati e 7.9 13.0 94.6 84.7 5.4 15.3 8.7 13.0 28.4 36.2 0 0
Kuwait e 2.5 3.8 76.0 85.4 24.0 14.6 5.5 5.6 0 0 0 0
Kyrgyzstan 4.7 6.4 44.3 53.0 55.7 47.0 12.0 11.7 9.9 12.6 10.0 70.1
Lao People's Democratic Republic e 3.3 4.3 35.1 28.3 64.9 71.7 5.8 5.9 29.2 18.8 1.2 5.0
Latvia 6.0 6.6 54.4 61.6 45.6 38.4 8.7 9.2 0.5 0 0 0
Lebanon r 9.9 7.4 32.6 41.9 67.4 58.1 7.9 9.5 2.3 1.2 49.0 59.7
Lesotho 7.0 9.4 51.2 74.3 48.8 25.7 6.5 10.3 3.1 27.3 0 0
Liberia 5.1 12.2 26.4 34.5 73.6 65.5 9.0 13.8 10.1 47.0 0 0
Libya e,g 3.3 3.9 57.2 66.1 42.8 33.9 6.0 5.5 0 1.0 … …
7. Health expenditure

137
Tabl
e 7
Health expenditure ratios a Per capita health expenditures a Member State
Out-of-pocket expenditure as % of
private expenditure on health
Private prepaid plans as % of private expenditure on health
Per capita total expenditure on health at average exchange
rate (US$)
Per capita total expenditure on health d
(PPP int. $)
Per capita government expenditure on health at average exchange
rate (US$)
Per capita government expenditure on health d
(PPP int. $)
2000 2009 2000 2009 2000 2009 2000 2009 2000 2009 2000 2009
98.4 99.1 1.6 0.9 44 94 90 180 30 65 61 124 Djibouti
88.9 84.2 11.1 15.8 231 342 378 592 159 223 261 386 Dominica
71.9 65.7 18.7 22.5 175 279 326 507 60 115 112 210 Dominican Republic
85.3 75.4 4.8 12.0 54 321 201 692 17 112 63 241 Ecuador e
97.4 97.7 0.4 1.7 79 114 196 286 32 45 79 113 Egypt
94.6 87.9 5.4 12.1 177 228 367 439 80 137 166 265 El Salvador
90.9 92.1 0 0 46 804 148 1560 21 612 69 1186 Equatorial Guinea g,n
100 100 0 0 9 11 30 16 4 5 14 8 Eritrea g
54.1 97.4 0 1.1 250 967 596 1338 169 758 404 1049 Estonia
79.2 79.9 0.5 1.5 5 16 20 42 3 8 11 23 Ethiopia e
63.5 72.2 26.2 19.3 80 144 133 194 67 100 111 135 Fiji e,m
77.7 75.3 8.8 8.5 1699 4078 1853 3226 1210 3047 1320 2410 Finland
34.4 33.1 61.6 60.1 2203 4840 2546 3969 1749 3772 2021 3093 France
100 100 0 0 102 266 293 511 43 127 123 245 Gabon g
53.8 48.4 2.3 3.1 19 27 59 83 6 14 20 45 Gambia
99.4 85.6 0.6 5.3 45 251 143 487 8 56 24 108 Georgia o
55.6 56.6 40.3 40.3 2387 4723 2679 4219 1898 3630 2130 3243 Germany
64.4 66.6 10.6 6.2 12 54 45 77 6 31 22 43 Ghana
94.5 94.5 5.5 5.5 917 3015 1451 3054 550 1859 871 1883 Greece
100 97.8 0 0 339 462 514 639 177 227 267 314 Grenada e
89.7 84.3 4.2 4.8 95 184 194 322 38 68 77 119 Guatemala
99.5 99.4 0 0 21 25 44 60 4 2 8 5 Guinea
61.4 73.9 0 0 11 48 63 91 2 5 10 10 Guinea-Bissau g
76.5 17.9 0 0 54 152 123 166 45 83 102 91 Guyana e
69.7 47.8 0 0 26 40 61 71 7 9 17 15 Haiti
91.4 89.4 8.6 10.6 62 134 138 268 42 89 92 178 Honduras e
89.8 78.3 0.6 8.9 326 957 853 1510 231 667 603 1053 Hungary
100 92.3 0 0 3034 3698 2829 3577 2473 3039 2306 2940 Iceland
91.8 86.4 1.1 4.6 20 44 67 124 5 13 17 38 India
72.9 75.2 6.4 3.1 15 56 45 100 5 26 16 46 Indonesia e
96.2 96.6 3.6 3.2 231 287 306 728 96 118 127 299 Iran (Islamic Republic of) e,p
100 100 … … 34 200 77 342 <1 156 <1 267 Iraq g,q
60.8 49.1 30.9 44.2 1561 4719 1762 3761 1172 3531 1322 2814 Ireland
68.5 73.5 8.7 16.6 1457 2004 1726 2111 932 1209 1105 1274 Israel
89.1 88.8 3.2 4.5 1554 3323 2064 3071 1127 2588 1496 2392 Italy
65.0 71.0 30.0 25.6 189 228 317 379 100 126 167 210 Jamaica
80.1 82.1 12.7 12.7 2834 3754 1974 3045 2290 3090 1595 2507 Japan
74.9 77.0 5.3 18.2 169 373 305 493 81 262 147 347 Jordan e
98.6 98.8 0.2 0.2 51 326 199 514 26 193 101 305 Kazakhstan
80.4 76.7 6.6 9.3 19 36 53 75 9 15 25 33 Kenya
1.7 0.6 0 0 64 159 166 294 61 134 157 249 Kiribati e
93.2 90.6 6.8 9.4 488 1579 705 1671 370 1349 535 1428 Kuwait e
89.3 88.5 0 0 13 57 62 148 6 30 27 78 Kyrgyzstan
91.8 70.7 0 0.5 11 39 40 92 4 11 14 26 Lao People's Democratic Republic e
96.8 97.3 3.2 2.1 197 756 479 1066 107 466 261 657 Latvia
77.8 73.5 19.3 22.1 455 617 754 965 148 259 246 404 Lebanon r
74.0 69.0 0 0 27 75 68 139 14 56 35 103 Lesotho
49.4 52.2 0 0 10 28 21 50 3 10 6 17 Liberia
100 100 0 0 216 427 374 722 124 282 214 478 Libya e,g
011010011001101001100110100110011010011001101001100110100110011010011010010110010111101010100101010100101100101111010101001010101001010010011010011001001101001100100110100110010011010011001001101001001010101001010101001010101001010101001010101001010101001010101001010101001010101001010101001010101001010101001010101001010101001101001100110100110011010011001101001100110100110011010011001101001101100010101100010101100010101100010101100010101100010101100010101011010011001101001100110100110011010011001101001100110100110011010010100101010010101011000100110100101010010101011000100110100101010010101010110001001101001101001011010100110001001101001101001011010100110001001100101111010010101001010010111101001010100101001011110100101010010100101011010011001101001100110100110011010011001101001100110100110011010010010100110100010100110100010100110100010100110100010100110100010100101101001100110100110011010011001101001100110100110011010011001101001111010010101001010111010010111101001010100101011101001011110100101010010101011010011001101001100110100110011010011001101001100110100110011010011001011110101010010110010111101010100101100101111010101001011001010110100110011010011001101001100110100110011010011001101001100110100101001011010000100101101000010010110100001001011010000100101101000010010101101001100110100110011010011001101001100110100110011010011001101001
0101011000100110100110100101101010101100010011010011010010110101010101101001100110100110011010011001101001100110100110011010011001101001101001011001011110101010010101010010110010111101010100101010100101001001101001100100110100110010011010011001001101001100100110100100101010100101010100101010100101010100101010100101010100101010100101010100101010100101010100101010100101010100101010100101010100110100110011010011001101001100110100110011010011001101001100110100110110001010110001010110001010110001010110001010110001010110001010101101001100110100110011010011001101001100110100110011010011001101001010010101001010101100010011010010101001010101100010011010010101001010101011000100110100110100101101010011000100110100110100101101010011000100110010111101001010100101001011110100101010010100101111010010101001010010101101001100110100110011010011001101001100110100110011010011001101001001010011010001010011010001010011010001010011010001010011010001010010110100110011010011001101001100110100110011010011001101001100110100111101001010100101011101001011110100101010010101110100101111010010101001010101101001100110100110011010011001101001100110100110011010011001101001100101111010101001011001011110101010010110010111101010100101100101
010010100110101010110010100101100101111010101001010100101010110001001

138
Member State Health expenditure ratios a
Total expenditure on health as % of gross
domestic product
General government expenditure on health
as % of total expenditure on health b
Private expenditure on health
as % of total expenditure on health b
General government expenditure on health as % of
total government expenditure
External resources for health as % of total
expenditure on health c
Social security expenditure on health as % of
general government expenditure on health
2000 2009 2000 2009 2000 2009 2000 2009 2000 2009 2000 2009
Lithuania 6.5 7.5 69.7 73.4 30.3 26.6 11.6 12.6 1.7 1.1 88.3 82.9
Luxembourg 7.5 7.9 85.1 84.0 14.9 16.0 16.9 15.4 0 0 71.0 81.0
Madagascar e 3.7 4.2 66.5 64.5 33.5 35.5 15.5 14.7 20.1 15.1 0 0
Malawi 6.1 6.7 45.8 65.2 54.2 34.8 9.0 14.2 26.9 80.0 0 0
Malaysia e 3.1 4.6 59.0 55.7 41.0 44.3 8.0 8.4 0.7 0 0.7 0.8
Maldives e 7.1 6.4 58.5 60.7 41.5 39.3 11.3 7.9 2.7 1.1 0 1.1
Mali 6.3 5.5 32.9 47.2 67.1 52.8 8.9 10.0 7.8 26.3 0 0
Malta 6.7 8.5 72.5 64.8 27.5 35.2 12.1 12.7 0 0 0 0
Marshall Islands 22.6 18.9 88.0 84.0 12.0 16.0 21.1 19.5 33.1 51.4 35.0 9.8
Mauritania e 6.0 4.2 66.5 52.8 33.5 47.2 12.8 7.3 11.2 14.4 8.7 15.3
Mauritius 3.7 5.6 52.0 37.1 48.0 62.9 8.7 8.3 1.4 1.6 0 0
Mexico 5.1 6.5 46.6 48.3 53.4 51.6 16.6 11.9 1.0 0 67.6 54.6
Micronesia (Federated States of) e 8.1 13.4 93.9 90.7 6.1 9.3 10.9 18.9 71.5 68.9 21.4 17.6
Monaco g 3.2 4.2 87.1 88.0 12.9 12.0 14.2 18.5 0 0 98.1 98.7
Mongolia 5.5 5.7 81.9 54.8 18.1 45.2 10.7 8.8 28.1 4.0 24.5 37.1
Montenegro s 7.9 9.4 69.1 71.3 30.9 28.7 16.9 13.6 0 1.1 99.0 97.9
Morocco 4.2 5.2 29.4 38.8 70.6 61.2 4.0 7.2 0.5 0.2 0 22.9
Mozambique 6.0 5.4 72.4 73.1 27.6 26.9 17.0 12.2 26.2 33.6 0.3 0.4
Myanmar e,t 2.1 2.1 13.4 11.3 86.6 88.7 1.2 1.0 1.1 9.2 3.1 1.3
Namibia e 6.1 7.2 68.9 55.0 31.1 45.0 13.1 12.1 3.8 12.6 1.8 2.6
Nauru 12.3 11.2 81.5 68.5 18.5 31.5 11.2 9.2 10.9 39.2 0 0
Nepal e 5.2 5.5 21.7 32.0 78.3 68.0 6.5 7.7 15.9 16.4 0 4.6
Netherlands 8.0 12.0 63.1 79.0 36.9 14.3 11.4 18.4 0 0 93.9 89.7
New Zealand 7.6 10.0 78.0 83.0 22.0 17.0 15.6 19.8 0 0 0 11.7
Nicaragua 7.0 9.6 53.5 54.8 46.5 45.2 13.1 18.1 7.8 13.6 27.0 22.6
Niger 3.4 5.4 43.8 50.3 56.2 49.7 8.4 11.1 39.8 19.9 3.3 1.3
Nigeria g 4.6 6.1 33.5 35.1 66.5 64.9 4.2 5.9 16.2 5.1 0 0
Niue 7.9 17.5 98.5 99.3 1.5 0.7 6.5 15.8 4.5 60.7 0 0
Norway 8.4 9.7 82.5 84.1 17.4 15.9 16.4 17.4 0 0 17.1 14.1
Oman 3.1 3.0 81.8 78.8 18.2 21.2 7.1 5.8 0 0 0 0
Pakistan 3.0 2.2 21.2 34.8 78.8 65.2 2.3 3.3 0.8 4.4 5.8 4.1
Palau e 12.8 10.6 66.3 78.0 33.7 22.0 12.0 14.3 29.0 39.7 0 0
Panama 7.8 8.1 68.1 74.8 31.9 25.2 21.3 14.7 1.0 0.1 50.0 35.6
Papua New Guinea e,m 4.0 3.7 81.7 70.6 18.3 29.4 9.9 8.5 23.8 21.5 0 0
Paraguay e 9.4 6.6 39.9 39.0 60.1 61.0 17.7 10.4 2.8 2.6 52.4 57.0
Peru 4.7 5.3 58.7 57.7 41.3 42.3 14.9 15.9 1.1 1.0 49.5 44.5
Philippines e 3.2 3.6 47.6 35.1 52.4 64.9 8.4 7.1 3.5 1.0 14.7 27.5
Poland 5.5 7.4 70.0 72.3 30.0 27.7 9.4 11.9 0 0.1 82.6 83.7
Portugal 9.3 10.7 66.0 67.8 34.0 32.2 15.0 14.6 0 0 1.7 1.7
Qatar e 2.3 2.6 68.8 78.4 31.2 21.6 5.0 6.4 0 0 0 0
Republic of Korea 4.5 6.9 48.6 58.2 51.4 41.8 9.7 12.2 0 0 77.3 76.9
Republic of Moldova u 6.7 12.5 48.5 48.5 51.5 51.5 9.5 13.4 14.7 7.0 0 86.3
Romania 5.2 5.6 67.7 79.0 32.3 21.0 9.1 10.8 5.7 0 0 80.7
Russian Federation 5.4 5.6 59.9 63.4 40.1 36.6 12.7 8.5 0.2 0 40.3 38.7
Rwanda 4.2 10.1 39.2 48.6 60.8 51.4 8.2 20.1 52.0 49.0 6.4 3.8
Saint Kitts and Nevis e 5.5 5.1 60.3 49.0 39.7 51.0 9.5 5.4 5.4 1.7 0.5 0.5
Saint Lucia e 5.1 8.4 61.9 63.0 38.1 37.0 11.7 14.8 0.4 1.9 4.9 2.2
Saint Vincent and the Grenadines e 3.7 4.6 82.2 84.3 17.8 15.7 10.8 11.5 0.3 2.7 0 0
Samoa e,m 6.0 5.4 76.7 85.3 23.3 14.7 21.4 18.3 16.2 11.3 0.3 0.8
7. Health expenditure
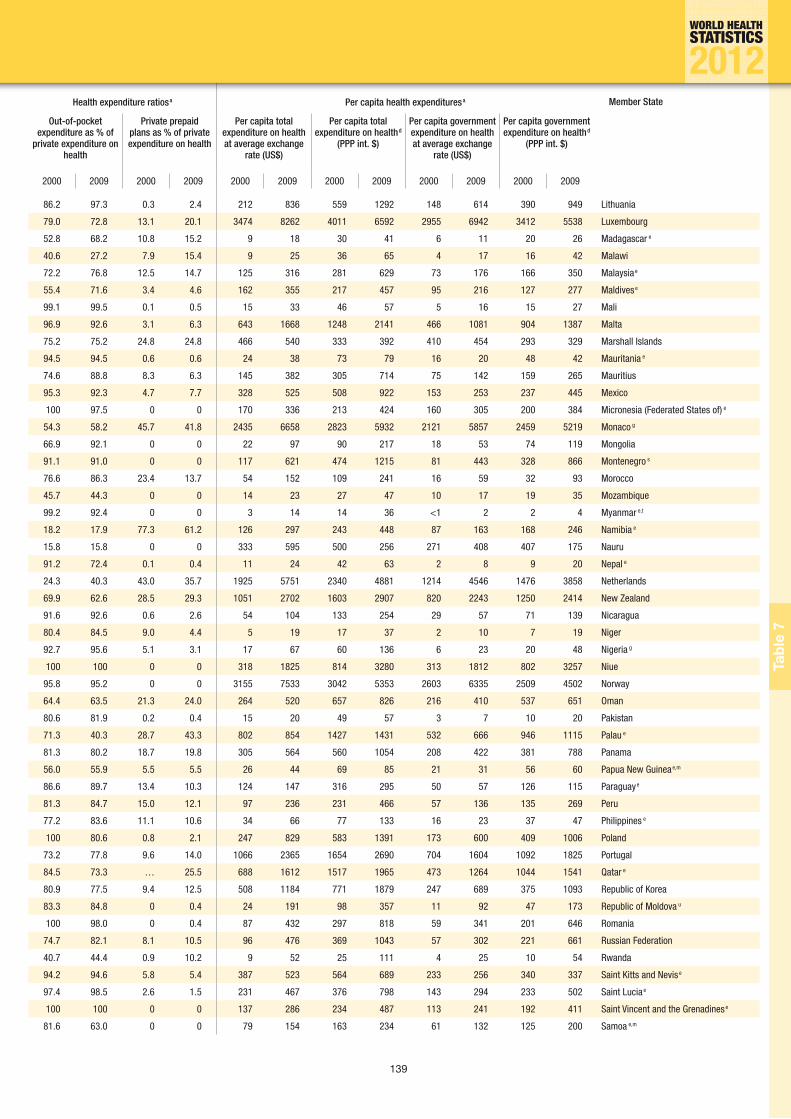
139
Tabl
e 7
Health expenditure ratios a Per capita health expenditures a Member State
Out-of-pocket expenditure as % of
private expenditure on health
Private prepaid plans as % of private expenditure on health
Per capita total expenditure on health at average exchange
rate (US$)
Per capita total expenditure on health d
(PPP int. $)
Per capita government expenditure on health at average exchange
rate (US$)
Per capita government expenditure on health d
(PPP int. $)
2000 2009 2000 2009 2000 2009 2000 2009 2000 2009 2000 2009
86.2 97.3 0.3 2.4 212 836 559 1292 148 614 390 949 Lithuania
79.0 72.8 13.1 20.1 3474 8262 4011 6592 2955 6942 3412 5538 Luxembourg
52.8 68.2 10.8 15.2 9 18 30 41 6 11 20 26 Madagascar e
40.6 27.2 7.9 15.4 9 25 36 65 4 17 16 42 Malawi
72.2 76.8 12.5 14.7 125 316 281 629 73 176 166 350 Malaysia e
55.4 71.6 3.4 4.6 162 355 217 457 95 216 127 277 Maldives e
99.1 99.5 0.1 0.5 15 33 46 57 5 16 15 27 Mali
96.9 92.6 3.1 6.3 643 1668 1248 2141 466 1081 904 1387 Malta
75.2 75.2 24.8 24.8 466 540 333 392 410 454 293 329 Marshall Islands
94.5 94.5 0.6 0.6 24 38 73 79 16 20 48 42 Mauritania e
74.6 88.8 8.3 6.3 145 382 305 714 75 142 159 265 Mauritius
95.3 92.3 4.7 7.7 328 525 508 922 153 253 237 445 Mexico
100 97.5 0 0 170 336 213 424 160 305 200 384 Micronesia (Federated States of) e
54.3 58.2 45.7 41.8 2435 6658 2823 5932 2121 5857 2459 5219 Monaco g
66.9 92.1 0 0 22 97 90 217 18 53 74 119 Mongolia
91.1 91.0 0 0 117 621 474 1215 81 443 328 866 Montenegro s
76.6 86.3 23.4 13.7 54 152 109 241 16 59 32 93 Morocco
45.7 44.3 0 0 14 23 27 47 10 17 19 35 Mozambique
99.2 92.4 0 0 3 14 14 36 <1 2 2 4 Myanmar e,t
18.2 17.9 77.3 61.2 126 297 243 448 87 163 168 246 Namibia e
15.8 15.8 0 0 333 595 500 256 271 408 407 175 Nauru
91.2 72.4 0.1 0.4 11 24 42 63 2 8 9 20 Nepal e
24.3 40.3 43.0 35.7 1925 5751 2340 4881 1214 4546 1476 3858 Netherlands
69.9 62.6 28.5 29.3 1051 2702 1603 2907 820 2243 1250 2414 New Zealand
91.6 92.6 0.6 2.6 54 104 133 254 29 57 71 139 Nicaragua
80.4 84.5 9.0 4.4 5 19 17 37 2 10 7 19 Niger
92.7 95.6 5.1 3.1 17 67 60 136 6 23 20 48 Nigeria g
100 100 0 0 318 1825 814 3280 313 1812 802 3257 Niue
95.8 95.2 0 0 3155 7533 3042 5353 2603 6335 2509 4502 Norway
64.4 63.5 21.3 24.0 264 520 657 826 216 410 537 651 Oman
80.6 81.9 0.2 0.4 15 20 49 57 3 7 10 20 Pakistan
71.3 40.3 28.7 43.3 802 854 1427 1431 532 666 946 1115 Palau e
81.3 80.2 18.7 19.8 305 564 560 1054 208 422 381 788 Panama
56.0 55.9 5.5 5.5 26 44 69 85 21 31 56 60 Papua New Guinea e,m
86.6 89.7 13.4 10.3 124 147 316 295 50 57 126 115 Paraguay e
81.3 84.7 15.0 12.1 97 236 231 466 57 136 135 269 Peru
77.2 83.6 11.1 10.6 34 66 77 133 16 23 37 47 Philippines e
100 80.6 0.8 2.1 247 829 583 1391 173 600 409 1006 Poland
73.2 77.8 9.6 14.0 1066 2365 1654 2690 704 1604 1092 1825 Portugal
84.5 73.3 … 25.5 688 1612 1517 1965 473 1264 1044 1541 Qatar e
80.9 77.5 9.4 12.5 508 1184 771 1879 247 689 375 1093 Republic of Korea
83.3 84.8 0 0.4 24 191 98 357 11 92 47 173 Republic of Moldova u
100 98.0 0 0.4 87 432 297 818 59 341 201 646 Romania
74.7 82.1 8.1 10.5 96 476 369 1043 57 302 221 661 Russian Federation
40.7 44.4 0.9 10.2 9 52 25 111 4 25 10 54 Rwanda
94.2 94.6 5.8 5.4 387 523 564 689 233 256 340 337 Saint Kitts and Nevis e
97.4 98.5 2.6 1.5 231 467 376 798 143 294 233 502 Saint Lucia e
100 100 0 0 137 286 234 487 113 241 192 411 Saint Vincent and the Grenadines e
81.6 63.0 0 0 79 154 163 234 61 132 125 200 Samoa e,m
011010011001101001100110100110011010011001101001100110100110011010011010010110010111101010100101010100101100101111010101001010101001010010011010011001001101001100100110100110010011010011001001101001001010101001010101001010101001010101001010101001010101001010101001010101001010101001010101001010101001010101001010101001010101001101001100110100110011010011001101001100110100110011010011001101001101100010101100010101100010101100010101100010101100010101100010101011010011001101001100110100110011010011001101001100110100110011010010100101010010101011000100110100101010010101011000100110100101010010101010110001001101001101001011010100110001001101001101001011010100110001001100101111010010101001010010111101001010100101001011110100101010010100101011010011001101001100110100110011010011001101001100110100110011010010010100110100010100110100010100110100010100110100010100110100010100101101001100110100110011010011001101001100110100110011010011001101001111010010101001010111010010111101001010100101011101001011110100101010010101011010011001101001100110100110011010011001101001100110100110011010011001011110101010010110010111101010100101100101111010101001011001010110100110011010011001101001100110100110011010011001101001100110100101001011010000100101101000010010110100001001011010000100101101000010010101101001100110100110011010011001101001100110100110011010011001101001
0101011000100110100110100101101010101100010011010011010010110101010101101001100110100110011010011001101001100110100110011010011001101001101001011001011110101010010101010010110010111101010100101010100101001001101001100100110100110010011010011001001101001100100110100100101010100101010100101010100101010100101010100101010100101010100101010100101010100101010100101010100101010100101010100101010100110100110011010011001101001100110100110011010011001101001100110100110110001010110001010110001010110001010110001010110001010110001010101101001100110100110011010011001101001100110100110011010011001101001010010101001010101100010011010010101001010101100010011010010101001010101011000100110100110100101101010011000100110100110100101101010011000100110010111101001010100101001011110100101010010100101111010010101001010010101101001100110100110011010011001101001100110100110011010011001101001001010011010001010011010001010011010001010011010001010011010001010010110100110011010011001101001100110100110011010011001101001100110100111101001010100101011101001011110100101010010101110100101111010010101001010101101001100110100110011010011001101001100110100110011010011001101001100101111010101001011001011110101010010110010111101010100101100101
010010100110101010110010100101100101111010101001010100101010110001001

140
Member State Health expenditure ratios a
Total expenditure on health as % of gross
domestic product
General government expenditure on health
as % of total expenditure on health b
Private expenditure on health
as % of total expenditure on health b
General government expenditure on health as % of
total government expenditure
External resources for health as % of total
expenditure on health c
Social security expenditure on health as % of
general government expenditure on health
2000 2009 2000 2009 2000 2009 2000 2009 2000 2009 2000 2009
San Marino 7.5 7.1 86.0 85.2 14.0 14.6 20.4 13.6 0 0 100 85.8
Sao Tome and Principe 9.5 7.2 38.1 40.1 61.9 59.9 9.0 13.2 30.7 37.9 0 0
Saudi Arabia 4.3 4.4 71.6 62.4 28.4 37.6 9.2 6.4 0 0 0 0
Senegal 4.3 5.7 36.8 54.5 63.2 45.5 8.5 11.6 17.4 14.5 8.8 4.1
Serbia s,v 7.4 10.5 70.0 61.9 30.0 38.1 13.5 13.9 1.1 1.6 92.5 93.5
Seychelles e 4.8 3.3 82.7 92.7 17.3 7.3 7.3 9.0 6.1 6.2 5.0 1.2
Sierra Leone e 15.6 13.9 13.2 10.5 86.8 89.5 7.4 6.4 6.2 20.1 0 0
Singapore e 2.4 4.1 51.4 36.1 48.6 63.9 6.2 8.3 0 0 4.8 16.1
Slovakia 5.5 9.1 89.4 65.7 10.6 34.3 9.4 14.5 0.9 0 98.2 89.7
Slovenia 8.3 9.3 74.0 73.4 26.0 26.6 13.1 13.8 0.2 0 93.7 89.9
Solomon Islands e,m 6.9 8.7 94.6 93.5 5.4 6.5 20.7 23.7 13.1 29.4 0 0
Somalia … … … … … … … … … … … …
South Africa e 8.5 9.2 40.5 43.8 59.5 56.2 10.9 11.4 0.3 1.8 3.3 2.5
Spain 7.2 9.6 71.6 73.6 28.4 26.4 13.2 15.2 0 0 9.6 6.0
Sri Lanka 3.7 3.2 48.8 46.2 51.2 53.8 6.8 5.9 0.3 2.5 0.3 0.1
Sudan e 3.4 7.3 27.3 27.5 72.7 72.5 8.3 9.9 4.4 3.8 8.1 11.6
Suriname e 8.0 7.5 48.8 51.0 51.2 49.0 9.7 11.9 10.9 3.0 40.7 41.7
Swaziland 5.4 6.7 56.3 66.5 43.7 33.5 10.5 10.1 5.8 11.4 0 0
Sweden 8.2 10.0 84.9 81.5 15.1 18.5 12.6 14.8 0 0 0 0
Switzerland 10.2 11.4 55.4 59.7 44.6 40.3 16.0 19.9 0 0 72.8 68.4
Syrian Arab Republic w 4.9 3.5 40.4 46.0 59.6 54.0 6.5 6.0 0.1 0.8 … …
Tajikistan 4.6 5.9 20.4 24.9 79.6 75.1 6.5 5.4 2.3 8.5 0 0
Thailand e 3.4 4.2 56.1 74.6 43.9 25.4 9.9 13.3 0 0.3 9.4 10.1
The former Yugoslav Republic of Macedonia 8.8 6.9 57.5 66.5 42.5 33.5 14.8 12.5 2.8 1.4 97.4 92.9
Timor-Leste x 8.4 11.9 74.9 66.1 25.1 33.9 12.7 7.8 55.6 36.0 0 0
Togo 4.7 7.4 31.1 43.0 68.9 57.0 8.5 15.4 6.5 13.6 11.7 6.5
Tonga e,l,m 6.1 4.6 70.7 79.3 29.3 20.7 13.3 11.4 22.3 11.6 0 0
Trinidad and Tobago 3.9 5.8 43.0 60.6 57.0 39.4 5.8 9.6 6.8 0.3 0 0
Tunisia e 6.0 6.4 54.9 54.9 45.1 45.1 8.1 10.7 0.9 1.2 28.9 48.4
Turkey 4.9 6.7 62.9 75.1 37.1 24.9 9.8 12.8 0.1 0 55.5 60.1
Turkmenistan g,y 4.0 2.5 79.6 59.2 20.4 40.8 13.7 9.9 1.4 0.2 6.5 6.5
Tuvalu e,m 10.9 14.3 99.8 84.7 0.2 0.1 5.0 10.0 44.0 15.2 0 0
Uganda e 6.6 8.5 26.8 21.8 73.2 78.2 7.3 13.6 28.3 20.4 0 0
Ukraine 5.6 7.8 51.8 55.0 48.2 45.0 8.4 8.9 0.5 0.5 0 0.5
United Arab Emirates 2.6 4.4 65.1 76.9 34.9 23.1 7.6 8.8 0 0 0 0
United Kingdom 7.0 9.8 79.2 84.1 20.8 15.9 15.1 16.0 0 0 0 0
United Republic of Tanzania e 3.4 5.5 43.4 66.1 56.6 33.9 10.2 12.9 27.8 53.4 0 3.3
United States of America 13.4 17.6 43.2 47.7 56.8 52.3 17.1 19.6 0 0 33.5 86.4
Uruguay 8.5 8.4 72.3 65.3 27.7 34.7 20.5 20.2 0 0 27.4 57.9
Uzbekistan 5.7 5.9 44.1 45.3 55.9 54.7 6.0 8.0 6.2 0.9 0 0
Vanuatu e,m 3.6 4.9 76.6 89.8 23.4 10.2 10.5 16.4 2.5 23.3 0 0
Venezuela (Bolivarian Republic of) 5.7 6.0 41.5 40.0 58.5 60.0 8.0 8.6 0.7 0 34.6 30.8
Viet Nam 5.3 6.9 30.9 37.5 69.1 62.5 6.6 7.8 2.6 3.0 19.7 36.0
Yemen e 4.5 5.5 53.8 26.5 46.2 73.5 8.3 4.3 8.0 5.3 0 0
Zambia 5.7 6.2 51.3 58.6 48.7 41.4 9.4 15.7 17.8 38.5 0 0
Zimbabwe … … … … … … … … … … … …
7. Health expenditure
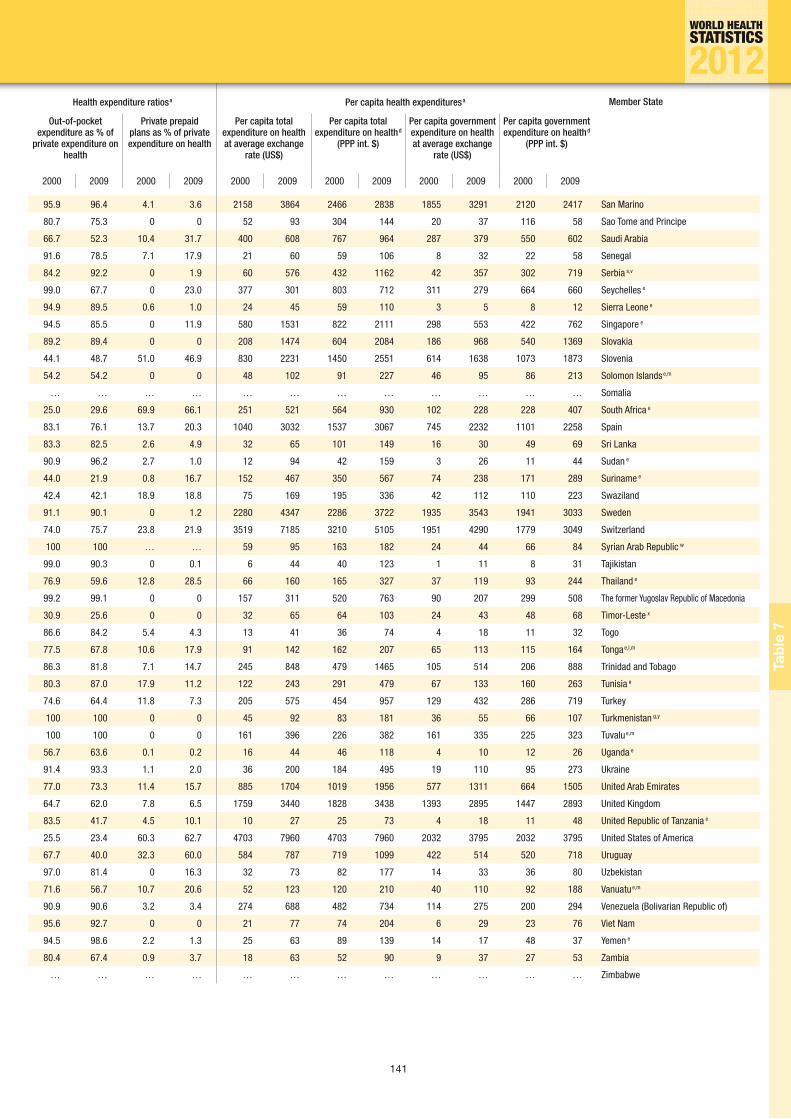
141
Tabl
e 7
Health expenditure ratios a Per capita health expenditures a Member State
Out-of-pocket expenditure as % of
private expenditure on health
Private prepaid plans as % of private expenditure on health
Per capita total expenditure on health at average exchange
rate (US$)
Per capita total expenditure on health d
(PPP int. $)
Per capita government expenditure on health at average exchange
rate (US$)
Per capita government expenditure on health d
(PPP int. $)
2000 2009 2000 2009 2000 2009 2000 2009 2000 2009 2000 2009
95.9 96.4 4.1 3.6 2158 3864 2466 2838 1855 3291 2120 2417 San Marino
80.7 75.3 0 0 52 93 304 144 20 37 116 58 Sao Tome and Principe
66.7 52.3 10.4 31.7 400 608 767 964 287 379 550 602 Saudi Arabia
91.6 78.5 7.1 17.9 21 60 59 106 8 32 22 58 Senegal
84.2 92.2 0 1.9 60 576 432 1162 42 357 302 719 Serbia s,v
99.0 67.7 0 23.0 377 301 803 712 311 279 664 660 Seychelles e
94.9 89.5 0.6 1.0 24 45 59 110 3 5 8 12 Sierra Leone e
94.5 85.5 0 11.9 580 1531 822 2111 298 553 422 762 Singapore e
89.2 89.4 0 0 208 1474 604 2084 186 968 540 1369 Slovakia
44.1 48.7 51.0 46.9 830 2231 1450 2551 614 1638 1073 1873 Slovenia
54.2 54.2 0 0 48 102 91 227 46 95 86 213 Solomon Islands e,m
… … … … … … … … … … … … Somalia
25.0 29.6 69.9 66.1 251 521 564 930 102 228 228 407 South Africa e
83.1 76.1 13.7 20.3 1040 3032 1537 3067 745 2232 1101 2258 Spain
83.3 82.5 2.6 4.9 32 65 101 149 16 30 49 69 Sri Lanka
90.9 96.2 2.7 1.0 12 94 42 159 3 26 11 44 Sudan e
44.0 21.9 0.8 16.7 152 467 350 567 74 238 171 289 Suriname e
42.4 42.1 18.9 18.8 75 169 195 336 42 112 110 223 Swaziland
91.1 90.1 0 1.2 2280 4347 2286 3722 1935 3543 1941 3033 Sweden
74.0 75.7 23.8 21.9 3519 7185 3210 5105 1951 4290 1779 3049 Switzerland
100 100 … … 59 95 163 182 24 44 66 84 Syrian Arab Republic w
99.0 90.3 0 0.1 6 44 40 123 1 11 8 31 Tajikistan
76.9 59.6 12.8 28.5 66 160 165 327 37 119 93 244 Thailand e
99.2 99.1 0 0 157 311 520 763 90 207 299 508 The former Yugoslav Republic of Macedonia
30.9 25.6 0 0 32 65 64 103 24 43 48 68 Timor-Leste x
86.6 84.2 5.4 4.3 13 41 36 74 4 18 11 32 Togo
77.5 67.8 10.6 17.9 91 142 162 207 65 113 115 164 Tonga e,l,m
86.3 81.8 7.1 14.7 245 848 479 1465 105 514 206 888 Trinidad and Tobago
80.3 87.0 17.9 11.2 122 243 291 479 67 133 160 263 Tunisia e
74.6 64.4 11.8 7.3 205 575 454 957 129 432 286 719 Turkey
100 100 0 0 45 92 83 181 36 55 66 107 Turkmenistan g,y
100 100 0 0 161 396 226 382 161 335 225 323 Tuvalu e,m
56.7 63.6 0.1 0.2 16 44 46 118 4 10 12 26 Uganda e
91.4 93.3 1.1 2.0 36 200 184 495 19 110 95 273 Ukraine
77.0 73.3 11.4 15.7 885 1704 1019 1956 577 1311 664 1505 United Arab Emirates
64.7 62.0 7.8 6.5 1759 3440 1828 3438 1393 2895 1447 2893 United Kingdom
83.5 41.7 4.5 10.1 10 27 25 73 4 18 11 48 United Republic of Tanzania e
25.5 23.4 60.3 62.7 4703 7960 4703 7960 2032 3795 2032 3795 United States of America
67.7 40.0 32.3 60.0 584 787 719 1099 422 514 520 718 Uruguay
97.0 81.4 0 16.3 32 73 82 177 14 33 36 80 Uzbekistan
71.6 56.7 10.7 20.6 52 123 120 210 40 110 92 188 Vanuatu e,m
90.9 90.6 3.2 3.4 274 688 482 734 114 275 200 294 Venezuela (Bolivarian Republic of)
95.6 92.7 0 0 21 77 74 204 6 29 23 76 Viet Nam
94.5 98.6 2.2 1.3 25 63 89 139 14 17 48 37 Yemen e
80.4 67.4 0.9 3.7 18 63 52 90 9 37 27 53 Zambia
… … … … … … … … … … … … Zimbabwe
011010011001101001100110100110011010011001101001100110100110011010011010010110010111101010100101010100101100101111010101001010101001010010011010011001001101001100100110100110010011010011001001101001001010101001010101001010101001010101001010101001010101001010101001010101001010101001010101001010101001010101001010101001010101001101001100110100110011010011001101001100110100110011010011001101001101100010101100010101100010101100010101100010101100010101100010101011010011001101001100110100110011010011001101001100110100110011010010100101010010101011000100110100101010010101011000100110100101010010101010110001001101001101001011010100110001001101001101001011010100110001001100101111010010101001010010111101001010100101001011110100101010010100101011010011001101001100110100110011010011001101001100110100110011010010010100110100010100110100010100110100010100110100010100110100010100101101001100110100110011010011001101001100110100110011010011001101001111010010101001010111010010111101001010100101011101001011110100101010010101011010011001101001100110100110011010011001101001100110100110011010011001011110101010010110010111101010100101100101111010101001011001010110100110011010011001101001100110100110011010011001101001100110100101001011010000100101101000010010110100001001011010000100101101000010010101101001100110100110011010011001101001100110100110011010011001101001
0101011000100110100110100101101010101100010011010011010010110101010101101001100110100110011010011001101001100110100110011010011001101001101001011001011110101010010101010010110010111101010100101010100101001001101001100100110100110010011010011001001101001100100110100100101010100101010100101010100101010100101010100101010100101010100101010100101010100101010100101010100101010100101010100101010100110100110011010011001101001100110100110011010011001101001100110100110110001010110001010110001010110001010110001010110001010110001010101101001100110100110011010011001101001100110100110011010011001101001010010101001010101100010011010010101001010101100010011010010101001010101011000100110100110100101101010011000100110100110100101101010011000100110010111101001010100101001011110100101010010100101111010010101001010010101101001100110100110011010011001101001100110100110011010011001101001001010011010001010011010001010011010001010011010001010011010001010010110100110011010011001101001100110100110011010011001101001100110100111101001010100101011101001011110100101010010101110100101111010010101001010101101001100110100110011010011001101001100110100110011010011001101001100101111010101001011001011110101010010110010111101010100101100101
010010100110101010110010100101100101111010101001010100101010110001001

142
Member State Health expenditure ratios a
Total expenditure on health as % of gross
domestic product
General government expenditure on health
as % of total expenditure on health b
Private expenditure on health
as % of total expenditure on health b
General government expenditure on health as % of
total government expenditure
External resources for health as % of total
expenditure on health c
Social security expenditure on health as % of
general government expenditure on health
2000 2009 2000 2009 2000 2009 2000 2009 2000 2009 2000 2009
Ranges of country valuesMinimum 1.9 2.1 1.1 8.2 0.2 0.1 0.1 1 0 0 0 0
Median 5.8 6.6 57.6 61 42.4 39 9.9 11.4 5.4 7 24.8 26.8
Maximum 22.6 18.9 99.8 99.3 98.9 91.8 21.7 30.6 71.5 80 100 98.7
WHO regionAfrican Region 5.5 6.5 43.9 49.3 56.1 50.7 8.2 9.6 6.5 10.2 7.9 7.0
Region of the Americas 11.4 14.4 45.1 49.3 54.9 50.7 14.5 16.9 0.1 0.1 31.7 72.0
South-East Asia Region 3.7 3.8 31.9 37.1 68.9 62.9 4.4 4.9 0.9 1.6 13.3 14.4
European Region 8.0 9.3 73.9 74.9 26.1 24.8 14.0 14.6 0.1 0.1 52.2 49.5
Eastern Mediterranean Region 4.2 4.7 47.2 50.9 52.8 49.1 6.9 7.1 1.0 1.1 18.4 19.4
Western Pacific Region 6.0 6.5 63.9 64.4 36.1 35.6 13.8 14.4 0.2 0.2 68.1 68.6
Income groupLow income 4.2 4.9 36.2 38.9 63.8 61.1 8.0 8.5 14.1 25.7 2.1 3.6
Lower middle income 4.2 4.4 33.6 39.0 66.4 61.0 4.9 5.5 2.5 2.4 14.7 15.0
Upper middle income 5.5 6.1 48.1 54.8 51.9 45.1 9.3 10.5 0.5 0.2 39.9 45.7
High income 9.9 12.5 59.5 61.9 40.5 38.0 15.3 17.1 0.0 0.0 47.1 65.2
Global 8.2 9.4 56.3 59.1 43.7 40.8 13.3 14.3 0.3 0.4 45.1 59.5
a Global health expenditure database. Geneva, World Health Organization, February 2012 (latest updates are available at: http://www.who.int/nha/country/en/index.html). All the indicators refer to expenditures by financing agent except “external resources for health” which is a financing source. WHO regional, income-group and global ag-gregates are calculated using Purchasing Power Parity (PPP) terms. When the number is smaller than 0.05% the percentage may appear as zero. For per capita expenditure indicators, this is represented as <1. In countries where the fiscal year begins in July, expenditure data have been allocated to the later calendar year (for example, 2008 data will cover the fiscal year 2007–08), unless otherwise stated for the country. Ab-solute values of expenditures are expressed in nominal terms (current prices). National currency unit per US$ is calculated using the average exchange rates for the year. For 2008, the use of yearly average exchange rates (compared to year-end exchange rates) may not fully reflect the impact of the global financial crisis.
b In some cases, the sum of general government and private expenditures on health may not add up to 100% because of rounding.
c Care needs to be taken in interpreting external resource figures. Most are taken from the OECD DAC/CRS database except where a reliable full national health account study has been conducted. The figures show disbursements to recipient countries as reported by donors, with a lag of one year to account for the delay between disburse-ment and expenditure. Prior to 2002, disbursement data are not available and commit-ments are used instead.
d For each country, the PPP value resulting from the 2005 International comparison proj-ect estimated by the World Bank has been used. For countries where this is not avail-able, PPP values have been estimated by WHO.
e A new basis for these estimates was provided by new NHA reports, surveys, National Accounts series, accessed information and/or country consultations.
f Non-profit institutions – such as nongovernmental organizations (NGOs) – that provide support to households are accounted for in “external assistance” and recorded under government expenditure. Gross domestic product (GDP) includes both licit and illicit GDPs (for example, opium). Government expenditures include external assistance (ex-ternal budget).
g Some estimates should be viewed with caution as these are derived from scarce data.
h About 30% of the expenditure in residential facilities for care of the aged has a health purpose, but this is difficult to estimate routinely, and is thus not included under health at present. Such health-purpose expenditure was about US$ 2.1 billion in 2005–06 or 0.2% of GDP. The data for 2007 correspond to the fiscal year 2007–08 starting on 1 July 2007. All 2008 entries are WHO estimates unless otherwise specified.
i Adjustments for currency change (from old to new manat) were made for the entire Azerbaijan series starting from World Health Statistics 2008.
j From 2003 onwards, the basic information used changed from national accounts to NHA.
k A huge increase in external-resource health expenditure has been reported by national sources.
l Fiscal year starts in July and expenditure data have been allocated to the later calendar year (i.e. 2008 data cover the fiscal year 2007–08).
m Assumption made that all external funding was channelled through government.
7. Health expenditure
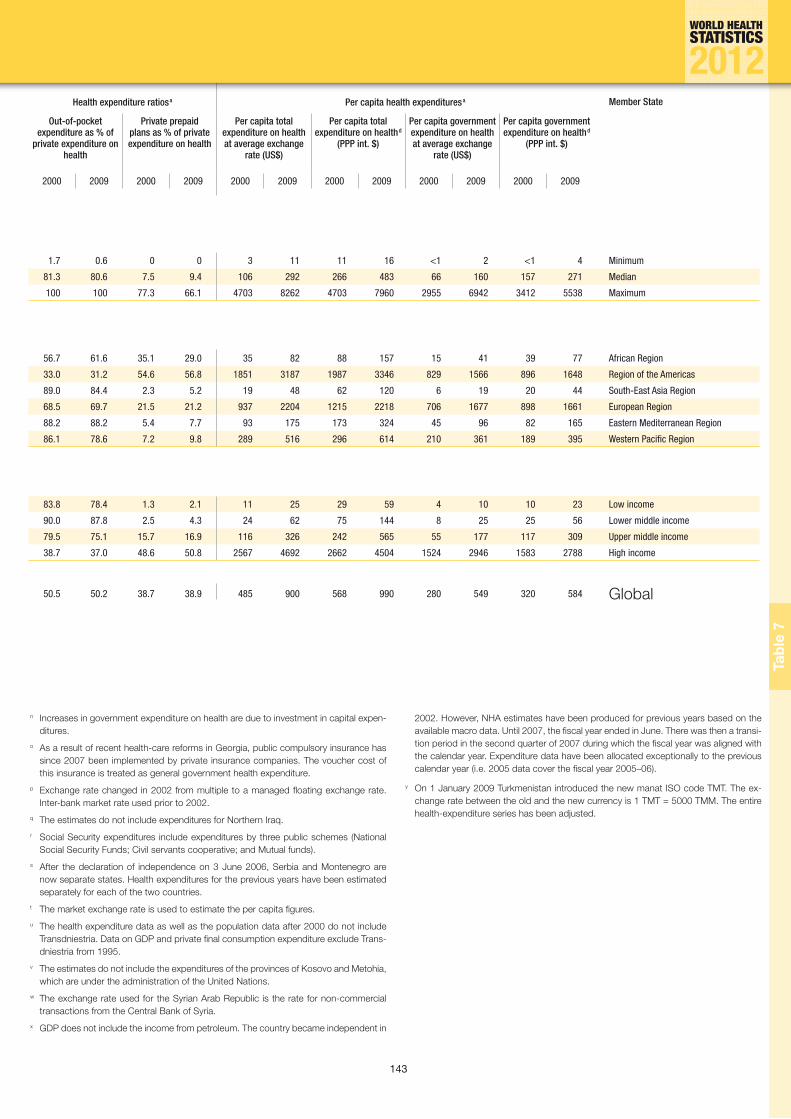
143
Tabl
e 7
Health expenditure ratios a Per capita health expenditures a Member State
Out-of-pocket expenditure as % of
private expenditure on health
Private prepaid plans as % of private expenditure on health
Per capita total expenditure on health at average exchange
rate (US$)
Per capita total expenditure on health d
(PPP int. $)
Per capita government expenditure on health at average exchange
rate (US$)
Per capita government expenditure on health d
(PPP int. $)
2000 2009 2000 2009 2000 2009 2000 2009 2000 2009 2000 2009
1.7 0.6 0 0 3 11 11 16 <1 2 <1 4 Minimum
81.3 80.6 7.5 9.4 106 292 266 483 66 160 157 271 Median
100 100 77.3 66.1 4703 8262 4703 7960 2955 6942 3412 5538 Maximum
56.7 61.6 35.1 29.0 35 82 88 157 15 41 39 77 African Region
33.0 31.2 54.6 56.8 1851 3187 1987 3346 829 1566 896 1648 Region of the Americas
89.0 84.4 2.3 5.2 19 48 62 120 6 19 20 44 South-East Asia Region
68.5 69.7 21.5 21.2 937 2204 1215 2218 706 1677 898 1661 European Region
88.2 88.2 5.4 7.7 93 175 173 324 45 96 82 165 Eastern Mediterranean Region
86.1 78.6 7.2 9.8 289 516 296 614 210 361 189 395 Western Pacific Region
83.8 78.4 1.3 2.1 11 25 29 59 4 10 10 23 Low income
90.0 87.8 2.5 4.3 24 62 75 144 8 25 25 56 Lower middle income
79.5 75.1 15.7 16.9 116 326 242 565 55 177 117 309 Upper middle income
38.7 37.0 48.6 50.8 2567 4692 2662 4504 1524 2946 1583 2788 High income
50.5 50.2 38.7 38.9 485 900 568 990 280 549 320 584 Global
n Increases in government expenditure on health are due to investment in capital expen-ditures.
o As a result of recent health-care reforms in Georgia, public compulsory insurance has since 2007 been implemented by private insurance companies. The voucher cost of this insurance is treated as general government health expenditure.
p Exchange rate changed in 2002 from multiple to a managed floating exchange rate. Inter-bank market rate used prior to 2002.
q The estimates do not include expenditures for Northern Iraq.r Social Security expenditures include expenditures by three public schemes (National
Social Security Funds; Civil servants cooperative; and Mutual funds).s After the declaration of independence on 3 June 2006, Serbia and Montenegro are
now separate states. Health expenditures for the previous years have been estimated separately for each of the two countries.
t The market exchange rate is used to estimate the per capita figures.u The health expenditure data as well as the population data after 2000 do not include
Transdniestria. Data on GDP and private final consumption expenditure exclude Trans-dniestria from 1995.
v The estimates do not include the expenditures of the provinces of Kosovo and Metohia, which are under the administration of the United Nations.
w The exchange rate used for the Syrian Arab Republic is the rate for non-commercial transactions from the Central Bank of Syria.
x GDP does not include the income from petroleum. The country became independent in
2002. However, NHA estimates have been produced for previous years based on the available macro data. Until 2007, the fiscal year ended in June. There was then a transi-tion period in the second quarter of 2007 during which the fiscal year was aligned with the calendar year. Expenditure data have been allocated exceptionally to the previous calendar year (i.e. 2005 data cover the fiscal year 2005–06).
y On 1 January 2009 Turkmenistan introduced the new manat ISO code TMT. The ex-change rate between the old and the new currency is 1 TMT = 5000 TMM. The entire health-expenditure series has been adjusted.
011010011001101001100110100110011010011001101001100110100110011010011010010110010111101010100101010100101100101111010101001010101001010010011010011001001101001100100110100110010011010011001001101001001010101001010101001010101001010101001010101001010101001010101001010101001010101001010101001010101001010101001010101001010101001101001100110100110011010011001101001100110100110011010011001101001101100010101100010101100010101100010101100010101100010101100010101011010011001101001100110100110011010011001101001100110100110011010010100101010010101011000100110100101010010101011000100110100101010010101010110001001101001101001011010100110001001101001101001011010100110001001100101111010010101001010010111101001010100101001011110100101010010100101011010011001101001100110100110011010011001101001100110100110011010010010100110100010100110100010100110100010100110100010100110100010100101101001100110100110011010011001101001100110100110011010011001101001111010010101001010111010010111101001010100101011101001011110100101010010101011010011001101001100110100110011010011001101001100110100110011010011001011110101010010110010111101010100101100101111010101001011001010110100110011010011001101001100110100110011010011001101001100110100101001011010000100101101000010010110100001001011010000100101101000010010101101001100110100110011010011001101001100110100110011010011001101001
0101011000100110100110100101101010101100010011010011010010110101010101101001100110100110011010011001101001100110100110011010011001101001101001011001011110101010010101010010110010111101010100101010100101001001101001100100110100110010011010011001001101001100100110100100101010100101010100101010100101010100101010100101010100101010100101010100101010100101010100101010100101010100101010100101010100110100110011010011001101001100110100110011010011001101001100110100110110001010110001010110001010110001010110001010110001010110001010101101001100110100110011010011001101001100110100110011010011001101001010010101001010101100010011010010101001010101100010011010010101001010101011000100110100110100101101010011000100110100110100101101010011000100110010111101001010100101001011110100101010010100101111010010101001010010101101001100110100110011010011001101001100110100110011010011001101001001010011010001010011010001010011010001010011010001010011010001010010110100110011010011001101001100110100110011010011001101001100110100111101001010100101011101001011110100101010010101110100101111010010101001010101101001100110100110011010011001101001100110100110011010011001101001100101111010101001011001011110101010010110010111101010100101100101
010010100110101010110010100101100101111010101001010100101010110001001

144

145
Tabl
e 8
8. Health inequities
In general, the global reporting of health indicators focuses on national averages. However, data on the distribution of health and health services within countries and between population subgroups are equally important. Such data help to identify health inequities – unfair and avoidable differences in health and health service provision – that arise for example from socioeconomic factors, such as level of education, occupation, and household wealth or income, from geographical location, and from ethnicity and gender.
Table 8 presents data from 86 countries using six health indicators – contraceptive prevalence, ante-natal care coverage; births attended by skilled health personnel; DTP3 immunization coverage among 1-year-olds; children under 5 years of age who are stunted; and under-five mortality rate – disaggre-gated according to urban or rural residence, household wealth and maternal educational level.
The main sources of data are the Demographic and Health Surveys (DHS) and Multiple Indicator Cluster Surveys (MICS) conducted between 2000 and 2010. For disaggregation by household wealth, the total population is classified into wealth quintiles based on relative differences in household wealth within the country rather than on an absolute wealth criterion. Although the estimates are subject to normal sample variability (which are usually indicated by confidence intervals), only the point estimates for the most-advantaged and least-advantaged groups are shown in Table 8.
011010011001101001100110100110011010011001101001100110100110011010011010010110010111101010100101010100101100101111010101001010101001010010011010011001001101001100100110100110010011010011001001101001001010101001010101001010101001010101001010101001010101001010101001010101001010101001010101001010101001010101001010101001010101001101001100110100110011010011001101001100110100110011010011001101001101100010101100010101100010101100010101100010101100010101100010101011010011001101001100110100110011010011001101001100110100110011010010100101010010101011000100110100101010010101011000100110100101010010101010110001001101001101001011010100110001001101001101001011010100110001001100101111010010101001010010111101001010100101001011110100101010010100101011010011001101001100110100110011010011001101001100110100110011010010010100110100010100110100010100110100010100110100010100110100010100101101001100110100110011010011001101001100110100110011010011001101001111010010101001010111010010111101001010100101011101001011110100101010010101011010011001101001100110100110011010011001101001100110100110011010011001011110101010010110010111101010100101100101111010101001011001010110100110011010011001101001100110100110011010011001101001100110100101001011010000100101101000010010110100001001011010000100101101000010010101101001100110100110011010011001101001100110100110011010011001101001
0101011000100110100110100101101010101100010011010011010010110101010101101001100110100110011010011001101001100110100110011010011001101001101001011001011110101010010101010010110010111101010100101010100101001001101001100100110100110010011010011001001101001100100110100100101010100101010100101010100101010100101010100101010100101010100101010100101010100101010100101010100101010100101010100101010100110100110011010011001101001100110100110011010011001101001100110100110110001010110001010110001010110001010110001010110001010110001010101101001100110100110011010011001101001100110100110011010011001101001010010101001010101100010011010010101001010101100010011010010101001010101011000100110100110100101101010011000100110100110100101101010011000100110010111101001010100101001011110100101010010100101111010010101001010010101101001100110100110011010011001101001100110100110011010011001101001001010011010001010011010001010011010001010011010001010011010001010010110100110011010011001101001100110100110011010011001101001100110100111101001010100101011101001011110100101010010101110100101111010010101001010101101001100110100110011010011001101001100110100110011010011001101001100101111010101001011001011110101010010110010111101010100101100101
010010100110101010110010100101100101111010101001010100101010110001001

146
MDG 5
Member State Source Contraceptive prevalence a (%)
Antenatal care coverage: at least 4 visits a,b (%)
Births attended by skilled health personnel a,c (%)
Place of residence
Wealth quintile
Educational level
of mother
Place of residence
Wealth quintile
Educational level
of mother
Place of residence
Wealth quintile
Educational level
of mother
Rura
l
Urba
n
Low
est
High
est
None
Seco
ndar
y or
hig
her
Rura
l
Urba
n
Low
est
High
est
None
Seco
ndar
y or
hig
her
Rura
l
Urba
n
Low
est
High
est
None
Seco
ndar
y or
hig
her
Afghanistan … … … … … … … … … … … … … … … … … …
Albania DHS 2008–2009 10 12 10 14 … 13 57 82 49 91 … 80 99 100 98 100 … 100
Algeria … … … … … … … … … … … … … … … … … …
Andorra … … … … … … … … … … … … … … … … … …
Angola … … … … … … … … … … … … … … … … … …
Antigua and Barbuda … … … … … … … … … … … … … … … … … …
Argentina … … … … … … … … … … … … … … … … … …
Armenia DHS 2005 16 22 12 29 … 19 56 82 51 88 … 72 98 99 96 100 … 98
Australia … … … … … … … … … … … … … … … … … …
Austria … … … … … … … … … … … … … … … … … …
Azerbaijan DHS 2006 10 17 11 21 6 14 31 64 21 82 … 49 81 97 78 100 83 e 89
Bahamas … … … … … … … … … … … … … … … … … …
Bahrain … … … … … … … … … … … … … … … … … …
Bangladesh DHS 2007 46 52 47 49 46 48 14 37 7 47 6 33 13 37 5 51 4 33
Barbados … … … … … … … … … … … … … … … … … …
Belarus MICS 2005 52 59 49 59 … 58 … … … … … … 100 100 100 100 … 100
Belgium … … … … … … … … … … … … … … … … … …
Belize MICS 2006 … … … … … … … … … … … … 93 99 84 98 e … 99
Benin DHS 2006 5 9 2 13 4 16 55 72 40 88 55 87 74 86 56 97 72 98
Bhutan … … … … … … … … … … … … … … … … … …
Bolivia (Plurinational State of) DHS 2008 26 40 23 47 22 43 60 81 50 91 49 85 51 88 38 99 40 91
Bosnia and Herzegovina MICS 2006 9 16 4 20 3 e 14 … … … … … … 100 100 99 100 … 100
Botswana … … … … … … … … … … … … … … … … … …
Brazil … … … … … … … … … … … … … … … … … …
Brunei Darussalam … … … … … … … … … … … … … … … … … …
Bulgaria … … … … … … … … … … … … … … … … … …
Burkina Faso MICS 2006 8 32 6 36 10 38 … … … … … … 51 66 56 65 54 60
Burundi MICS 2005 7 16 5 12 5 26 … … … … … … 32 75 25 55 30 84
Cambodia DHS 2010 36 31 35 31 34 34 55 80 43 82 40 78 67 95 49 97 47 91
Cameroon MICS 2006 6 19 2 25 1 24 … … … … … … 42 82 19 96 21 90
Canada … … … … … … … … … … … … … … … … … …
Cape Verde … … … … … … … … … … … … … … … … … …
Central African Republic MICS 2006 2 17 0 23 2 29 … … … … … … 35 83 27 89 34 88
Chad DHS 2004 0 7 0 7 1 18 13 45 3 46 14 57 12 58 4 55 13 74
Chile … … … … … … … … … … … … … … … … … …
China … … … … … … … … … … … … … … … … … …
Colombia DHS 2010 72 73 68 75 63 73 81 91 78 96 61 92 86 98 84 99 71 98
Comoros … … … … … … … … … … … … … … … … … …
Congo DHS 2005 9 16 9 18 6 16 66 83 60 92 55 82 74 97 66 98 62 93
Cook Islands … … … … … … … … … … … … … … … … … …
Costa Rica … … … … … … … … … … … … … … … … … …
Côte d'Ivoire MICS 2006 6 15 4 19 6 22 … … … … … … 40 84 28 95 47 87
Croatia … … … … … … … … … … … … … … … … … …
Cuba … … … … … … … … … … … … … … … … … …
Cyprus … … … … … … … … … … … … … … … … … …
Czech Republic … … … … … … … … … … … … … … … … … …
Democratic People's Republic of Korea … … … … … … … … … … … … … … … … … …
Democratic Republic of the Congo DHS 2007 3 10 3 15 2 10 45 55 46 64 39 60 63 91 59 98 59 89
8. Health inequities

147
Tabl
e 8
MDG 4
DTP3 immunization coverage among 1-year-olds a (%)
Children aged <5 years who are stunted a (%)
Under-five mortality rate a,d (probability of dying by age 5 per 1000 live births)
Member State
Place of residence Wealth quintile
Educational level
of mother
Place of residence Wealth quintile
Educational level
of mother
Place of residence Wealth quintile
Educational level
of mother
Rura
l
Urba
n
Low
est
High
est
None
Seco
ndar
y or
hig
her
Rura
l
Urba
n
Low
est
High
est
None
Seco
ndar
y or
hig
her
Rura
l
Urba
n
Low
est
High
est
None
Seco
ndar
y or
hig
her
… … … … … … … … … … … … … … … … … … Afghanistan
100 98 99 97 … 99 19 20 27 13 … 17 28 13 34 13 … 19 Albania
… … … … … … … … … … … … … … … … … … Algeria
… … … … … … … … … … … … … … … … … … Andorra
… … … … … … … … … … … … … … … … … … Angola
… … … … … … … … … … … … … … … … … … Antigua and Barbuda
… … … … … … … … … … … … … … … … … … Argentina
68 70 65 63 e … 69 17 19 20 19 … 17 41 26 51 23 … 33 Armenia
… … … … … … … … … … … … … … … … … … Australia
… … … … … … … … … … … … … … … … … … Austria
21 38 21 56 … 29 30 20 33 15 … 25 63 51 63 38 69 57 Azerbaijan
… … … … … … … … … … … … … … … … … … Bahamas
… … … … … … … … … … … … … … … … … … Bahrain
91 92 92 95 85 95 45 36 54 26 51 33 76 62 85 43 91 52 Bangladesh
… … … … … … … … … … … … … … … … … … Barbados
100 99 100 99 … 99 8 3 10 2 … 4 … … … … … … Belarus
… … … … … … … … … … … … … … … … … … Belgium
73 78 68 e … … 77 28 15 37 8 … 15 … … … … … … Belize
62 77 50 87 62 91 47 36 50 29 47 27 145 115 151 83 143 79 Benin
… … … … … … … … … … … … … … … … … … Bhutan
86 84 85 85 85 88 39 17 45 6 50 15 98 54 116 31 134 43 Bolivia (Plurinational State of)
96 88 92 89 … 93 12 11 18 8 … 11 … … … … … … Bosnia and Herzegovina
… … … … … … … … … … … … … … … … … … Botswana
… … … … … … … … … … … … … … … … … … Brazil
… … … … … … … … … … … … … … … … … … Brunei Darussalam
… … … … … … … … … … … … … … … … … … Bulgaria
75 90 73 93 77 90 e 43 28 48 23 42 18 … … … … … … Burkina Faso
61 67 57 62 54 64 … … … … … … … … … … … … Burundi
84 90 73 93 67 92 41 27 49 22 46 31 75 29 91 30 86 35 Cambodia
70 78 63 83 61 86 45 27 51 17 46 24 … … … … … … Cameroon
… … … … … … … … … … … … … … … … … … Canada
… … … … … … … … … … … … … … … … … … Cape Verde
29 55 22 63 25 63 47 38 49 31 47 36 … … … … … … Central African Republic
15 42 5 43 15 53 … … … … … … 208 178 176 185 200 145 Chad
… … … … … … … … … … … … … … … … … … Chile
… … … … … … … … … … … … … … … … … … China
88 91 85 92 79 91 17 12 19 7 31 11 24 21 29 13 53 18 Colombia
… … … … … … … … … … … … … … … … … … Comoros
55 83 43 91 37 79 33 26 37 24 40 25 136 108 134 83 201 102 Congo
… … … … … … … … … … … … … … … … … … Cook Islands
… … … … … … … … … … … … … … … … … … Costa Rica
72 90 62 96 74 87 46 32 47 27 43 31 … … … … … … Côte d'Ivoire
… … … … … … … … … … … … … … … … … … Croatia
… … … … … … … … … … … … … … … … … … Cuba
… … … … … … … … … … … … … … … … … … Cyprus
… … … … … … … … … … … … … … … … … … Czech Republic
… … … … … … … … … … … … … … … … … … Democratic People's Republic of Korea
36 60 28 74 34 59 50 36 46 25 51 35 176 121 182 96 207 113 Democratic Republic of the Congo
011010011001101001100110100110011010011001101001100110100110011010011010010110010111101010100101010100101100101111010101001010101001010010011010011001001101001100100110100110010011010011001001101001001010101001010101001010101001010101001010101001010101001010101001010101001010101001010101001010101001010101001010101001010101001101001100110100110011010011001101001100110100110011010011001101001101100010101100010101100010101100010101100010101100010101100010101011010011001101001100110100110011010011001101001100110100110011010010100101010010101011000100110100101010010101011000100110100101010010101010110001001101001101001011010100110001001101001101001011010100110001001100101111010010101001010010111101001010100101001011110100101010010100101011010011001101001100110100110011010011001101001100110100110011010010010100110100010100110100010100110100010100110100010100110100010100101101001100110100110011010011001101001100110100110011010011001101001111010010101001010111010010111101001010100101011101001011110100101010010101011010011001101001100110100110011010011001101001100110100110011010011001011110101010010110010111101010100101100101111010101001011001010110100110011010011001101001100110100110011010011001101001100110100101001011010000100101101000010010110100001001011010000100101101000010010101101001100110100110011010011001101001100110100110011010011001101001
0101011000100110100110100101101010101100010011010011010010110101010101101001100110100110011010011001101001100110100110011010011001101001101001011001011110101010010101010010110010111101010100101010100101001001101001100100110100110010011010011001001101001100100110100100101010100101010100101010100101010100101010100101010100101010100101010100101010100101010100101010100101010100101010100101010100110100110011010011001101001100110100110011010011001101001100110100110110001010110001010110001010110001010110001010110001010110001010101101001100110100110011010011001101001100110100110011010011001101001010010101001010101100010011010010101001010101100010011010010101001010101011000100110100110100101101010011000100110100110100101101010011000100110010111101001010100101001011110100101010010100101111010010101001010010101101001100110100110011010011001101001100110100110011010011001101001001010011010001010011010001010011010001010011010001010011010001010010110100110011010011001101001100110100110011010011001101001100110100111101001010100101011101001011110100101010010101110100101111010010101001010101101001100110100110011010011001101001100110100110011010011001101001100101111010101001011001011110101010010110010111101010100101100101
010010100110101010110010100101100101111010101001010100101010110001001

148
MDG 5
Member State Source Contraceptive prevalence a (%)
Antenatal care coverage: at least 4 visits a,b (%)
Births attended by skilled health personnel a,c (%)
Place of residence
Wealth quintile
Educational level
of mother
Place of residence
Wealth quintile
Educational level
of mother
Place of residence
Wealth quintile
Educational level
of mother
Rura
l
Urba
n
Low
est
High
est
None
Seco
ndar
y or
hig
her
Rura
l
Urba
n
Low
est
High
est
None
Seco
ndar
y or
hig
her
Rura
l
Urba
n
Low
est
High
est
None
Seco
ndar
y or
hig
her
Denmark … … … … … … … … … … … … … … … … … …
Djibouti MICS 2006 3 18 … … 12 33 … … … … … … 40 95 … … 92 96
Dominica … … … … … … … … … … … … … … … … … …
Dominican Republic DHS 2007 72 69 66 69 68 67 88 93 83 97 77 95 93 95 89 98 86 97
Ecuador … … … … … … … … … … … … … … … … … …
Egypt DHS 2008 55 62 52 62 56 58 59 81 42 90 46 77 72 90 55 97 60 87
El Salvador … … … … … … … … … … … … … … … … … …
Equatorial Guinea … … … … … … … … … … … … … … … … … …
Eritrea … … … … … … … … … … … … … … … … … …
Estonia … … … … … … … … … … … … … … … … … …
Ethiopia DHS 2005 11 42 4 34 10 46 8 55 4 40 8 64 3 45 1 27 2 58
Fiji … … … … … … … … … … … … … … … … … …
Finland … … … … … … … … … … … … … … … … … …
France … … … … … … … … … … … … … … … … … …
Gabon DHS 2000 7 15 8 19 6 18 45 71 42 82 66 71 69 93 67 97 84 93
Gambia MICS 2005 … … … … … … … … … … … … 43 83 28 89 51 84
Georgia MICS 2005 16 24 12 28 … 20 … … … … … … 98 99 95 98 … 99
Germany … … … … … … … … … … … … … … … … … …
Ghana DHS 2008 15 19 12 21 11 19 73 90 66 96 71 89 43 84 24 95 36 78
Greece … … … … … … … … … … … … … … … … … …
Grenada … … … … … … … … … … … … … … … … … …
Guatemala … … … … … … … … … … … … … … … … … …
Guinea DHS 2005 4 11 3 13 4 18 47 74 38 81 50 72 26 81 15 87 33 84
Guinea-Bissau MICS 2006 2 15 1 19 3 25 … … … … … … 27 69 19 79 28 80
Guyana MICS 2006–2007 33 32 29 32 … 33 … … … … … … 82 89 64 93 … 85
Haiti DHS 2005 22 28 15 29 18 31 46 67 32 82 35 79 15 47 6 67 9 60
Honduras DHS 2005 51 62 41 65 46 62 76 87 69 96 62 93 50 90 33 99 37 96
Hungary … … … … … … … … … … … … … … … … … …
Iceland … … … … … … … … … … … … … … … … … …
India DHS 2005 45 56 35 58 46 50 28 63 12 78 16 64 37 73 19 89 26 75
Indonesia DHS 2007 58 57 50 58 40 59 74 90 58 96 39 90 63 88 44 95 31 87
Iran (Islamic Republic of) … … … … … … … … … … … … … … … … … …
Iraq MICS 2006 27 36 … … 29 39 … … … … … … 78 95 … … 79 96
Ireland … … … … … … … … … … … … … … … … … …
Israel … … … … … … … … … … … … … … … … … …
Italy … … … … … … … … … … … … … … … … … …
Jamaica MICS 2005 … … … … … … … … … … … … 94 98 … … … 97
Japan … … … … … … … … … … … … … … … … … …
Jordan DHS 2007 36 43 35 47 36 42 91 95 90 98 77 95 99 99 98 100 94 99
Kazakhstan MICS 2006 44 52 40 57 … 49 … … … … … … 100 100 100 100 … 100
Kenya DHS 2008–2009 37 47 17 48 12 52 44 60 36 63 35 64 37 75 20 81 19 72
Kiribati … … … … … … … … … … … … … … … … … …
Kuwait … … … … … … … … … … … … … … … … … …
Kyrgyzstan MICS 2005 45 47 47 48 … 46 … … … … … … 96 100 93 100 … 97
Lao People's Democratic Republic MICS 2006 … … … … … … … … … … … … 11 68 3 81 3 63
Latvia … … … … … … … … … … … … … … … … … …
Lebanon … … … … … … … … … … … … … … … … … …
8. Health inequities

149
Tabl
e 8
MDG 4
DTP3 immunization coverage among 1-year-olds a (%)
Children aged <5 years who are stunted a (%)
Under-five mortality rate a,d (probability of dying by age 5 per 1000 live births)
Member State
Place of residence Wealth quintile
Educational level
of mother
Place of residence Wealth quintile
Educational level
of mother
Place of residence Wealth quintile
Educational level
of mother
Rura
l
Urba
n
Low
est
High
est
None
Seco
ndar
y or
hig
her
Rura
l
Urba
n
Low
est
High
est
None
Seco
ndar
y or
hig
her
Rura
l
Urba
n
Low
est
High
est
None
Seco
ndar
y or
hig
her
… … … … … … … … … … … … … … … … … … Denmark
45 e 61 … … 58 67 40 33 … … 33 37 … … … … … … Djibouti
… … … … … … … … … … … … … … … … … … Dominica
71 74 68 82 56 77 13 8 16 4 14 8 37 37 53 27 56 29 Dominican Republic
… … … … … … … … … … … … … … … … … … Ecuador
97 99 97 99 97 99 30 27 30 27 30 28 36 29 48 19 44 26 Egypt
… … … … … … … … … … … … … … … … … … El Salvador
… … … … … … … … … … … … … … … … … … Equatorial Guinea
… … … … … … … … … … … … … … … … … … Eritrea
… … … … … … … … … … … … … … … … … … Estonia
30 67 26 49 29 66 52 36 53 40 53 30 135 99 130 92 140 55 Ethiopia
… … … … … … … … … … … … … … … … … … Fiji
… … … … … … … … … … … … … … … … … … Finland
… … … … … … … … … … … … … … … … … … France
21 42 18 49 43 e 43 36 21 41 14 24 19 100 88 93 55 111 87 Gabon
87 87 89 90 86 88 32 19 36 15 29 19 … … … … … … Gambia
61 64 63 67 … 63 17 12 22 8 … 15 … … … … … … Georgia
… … … … … … … … … … … … … … … … … … Germany
91 87 89 93 85 91 32 20 33 14 30 24 90 75 102 60 102 67 Ghana
… … … … … … … … … … … … … … … … … … Greece
… … … … … … … … … … … … … … … … … … Grenada
… … … … … … … … … … … … … … … … … … Guatemala
49 59 39 61 49 71 42 28 44 25 41 23 203 133 215 113 193 89 Guinea
62 72 57 78 61 78 51 41 49 37 51 36 … … … … … … Guinea-Bissau
83 85 86 85 e … 84 18 18 28 14 … 17 … … … … … … Guyana
50 61 46 72 48 69 34 19 40 7 39 12 114 77 124 55 122 65 Haiti
94 92 94 88 89 93 38 17 50 7 53 9 43 29 50 20 53 19 Honduras
… … … … … … … … … … … … … … … … … … Hungary
… … … … … … … … … … … … … … … … … … Iceland
51 69 34 82 37 77 51 40 60 26 57 36 93 60 116 39 106 49 India
61 75 45 82 29 76 … … … … … … 60 38 77 31 93 37 Indonesia
… … … … … … … … … … … … … … … … … … Iran (Islamic Republic of)
49 67 … … 44 74 31 25 … … 30 23 … … … … … … Iraq
… … … … … … … … … … … … … … … … … … Ireland
… … … … … … … … … … … … … … … … … … Israel
… … … … … … … … … … … … … … … … … … Italy
79 79 … … … 78 … … … … … … … … … … … … Jamaica
… … … … … … … … … … … … … … … … … … Japan
97 98 97 98 89 98 17 14 18 9 26 14 27 21 30 27 27 21 Jordan
96 98 97 99 … 97 20 15 21 12 … 17 … … … … … … Kazakhstan
86 88 78 90 82 92 37 27 44 25 39 25 85 75 97 69 86 58 Kenya
… … … … … … … … … … … … … … … … … … Kiribati
… … … … … … … … … … … … … … … … … … Kuwait
37 64 25 72 … 48 20 15 20 14 … 18 … … … … … … Kyrgyzstan
39 56 29 59 30 57 50 32 58 23 55 31 … … … … … … Lao People's Democratic Republic
… … … … … … … … … … … … … … … … … … Latvia
… … … … … … … … … … … … … … … … … … Lebanon
011010011001101001100110100110011010011001101001100110100110011010011010010110010111101010100101010100101100101111010101001010101001010010011010011001001101001100100110100110010011010011001001101001001010101001010101001010101001010101001010101001010101001010101001010101001010101001010101001010101001010101001010101001010101001101001100110100110011010011001101001100110100110011010011001101001101100010101100010101100010101100010101100010101100010101100010101011010011001101001100110100110011010011001101001100110100110011010010100101010010101011000100110100101010010101011000100110100101010010101010110001001101001101001011010100110001001101001101001011010100110001001100101111010010101001010010111101001010100101001011110100101010010100101011010011001101001100110100110011010011001101001100110100110011010010010100110100010100110100010100110100010100110100010100110100010100101101001100110100110011010011001101001100110100110011010011001101001111010010101001010111010010111101001010100101011101001011110100101010010101011010011001101001100110100110011010011001101001100110100110011010011001011110101010010110010111101010100101100101111010101001011001010110100110011010011001101001100110100110011010011001101001100110100101001011010000100101101000010010110100001001011010000100101101000010010101101001100110100110011010011001101001100110100110011010011001101001
0101011000100110100110100101101010101100010011010011010010110101010101101001100110100110011010011001101001100110100110011010011001101001101001011001011110101010010101010010110010111101010100101010100101001001101001100100110100110010011010011001001101001100100110100100101010100101010100101010100101010100101010100101010100101010100101010100101010100101010100101010100101010100101010100101010100110100110011010011001101001100110100110011010011001101001100110100110110001010110001010110001010110001010110001010110001010110001010101101001100110100110011010011001101001100110100110011010011001101001010010101001010101100010011010010101001010101100010011010010101001010101011000100110100110100101101010011000100110100110100101101010011000100110010111101001010100101001011110100101010010100101111010010101001010010101101001100110100110011010011001101001100110100110011010011001101001001010011010001010011010001010011010001010011010001010011010001010010110100110011010011001101001100110100110011010011001101001100110100111101001010100101011101001011110100101010010101110100101111010010101001010101101001100110100110011010011001101001100110100110011010011001101001100101111010101001011001011110101010010110010111101010100101100101
010010100110101010110010100101100101111010101001010100101010110001001

150
MDG 5
Member State Source Contraceptive prevalence a (%)
Antenatal care coverage: at least 4 visits a,b (%)
Births attended by skilled health personnel a,c (%)
Place of residence
Wealth quintile
Educational level
of mother
Place of residence
Wealth quintile
Educational level
of mother
Place of residence
Wealth quintile
Educational level
of mother
Rura
l
Urba
n
Low
est
High
est
None
Seco
ndar
y or
hig
her
Rura
l
Urba
n
Low
est
High
est
None
Seco
ndar
y or
hig
her
Rura
l
Urba
n
Low
est
High
est
None
Seco
ndar
y or
hig
her
Lesotho DHS 2009 41 57 29 61 28 55 66 82 58 85 67 79 54 88 35 90 40 80
Liberia DHS 2007 7 16 3 17 7 18 58 88 49 91 61 86 32 79 26 81 36 76
Libya … … … … … … … … … … … … … … … … … …
Lithuania … … … … … … … … … … … … … … … … … …
Luxembourg … … … … … … … … … … … … … … … … … …
Madagascar DHS 2008–2009 28 36 18 36 18 34 46 70 35 75 37 67 39 82 22 90 23 76
Malawi DHS 2010 41 50 35 48 37 48 45 49 41 51 44 52 69 84 63 89 61 88
Malaysia … … … … … … … … … … … … … … … … … …
Maldives DHS 2009 28 26 29 26 36 20 87 80 88 80 83 86 93 99 89 99 85 99
Mali DHS 2006 4 13 3 16 5 23 12 49 9 60 18 66 12 67 9 75 21 78
Malta … … … … … … … … … … … … … … … … … …
Marshall Islands … … … … … … … … … … … … … … … … … …
Mauritania MICS 2007 3 14 1 16 4 19 … … … … … … 39 90 21 95 45 92
Mauritius … … … … … … … … … … … … … … … … … …
Mexico … … … … … … … … … … … … … … … … … …
Micronesia (Federated States of) … … … … … … … … … … … … … … … … … …
Monaco … … … … … … … … … … … … … … … … … …
Mongolia MICS 2005 64 57 65 53 54 61 … … … … … … 99 99 98 100 96 100
Montenegro MICS 2005 15 18 8 23 … 19 … … … … … … 98 100 98 100 … 99
Morocco DHS 2003–2004 53 56 51 57 54 56 15 44 11 61 20 59 39 85 29 95 49 94
Mozambique DHS 2003 18 28 14 37 15 49 46 72 37 78 43 86 34 81 25 89 31 95
Myanmar … … … … … … … … … … … … … … … … … …
Namibia DHS 2006 43 64 30 68 32 63 76 84 73 87 59 84 72 94 60 98 50 92
Nauru … … … … … … … … … … … … … … … … … …
Nepal DHS 2006 42 54 30 54 46 40 26 52 11 60 16 57 19 52 8 61 11 53
Netherlands … … … … … … … … … … … … … … … … … …
New Zealand … … … … … … … … … … … … … … … … … …
Nicaragua DHS 2001 60 71 50 71 50 69 60 83 49 90 46 88 83 96 77 99 77 98
Niger DHS 2006 3 18 2 16 3 29 11 35 9 34 12 54 8 71 5 59 13 81
Nigeria DHS 2008 6 17 3 22 3 19 38 76 15 90 23 81 28 65 8 86 12 77
Niue … … … … … … … … … … … … … … … … … …
Norway … … … … … … … … … … … … … … … … … …
Oman … … … … … … … … … … … … … … … … … …
Pakistan DHS 2006 18 30 12 32 19 28 20 48 11 64 17 61 30 60 16 77 27 74
Palau … … … … … … … … … … … … … … … … … …
Panama … … … … … … … … … … … … … … … … … …
Papua New Guinea … … … … … … … … … … … … … … … … … …
Paraguay … … … … … … … … … … … … … … … … … …
Peru DHS 2004–2008 40 53 34 54 34 53 79 93 70 97 75 93 54 94 38 99 46 92
Philippines DHS 2008 33 35 26 33 9 36 73 83 61 93 32 84 48 77 26 94 11 73
Poland … … … … … … … … … … … … … … … … … …
Portugal … … … … … … … … … … … … … … … … … …
Qatar … … … … … … … … … … … … … … … … … …
Republic of Korea … … … … … … … … … … … … … … … … … …
Republic of Moldova DHS 2005 41 48 37 51 … 44 93 93 90 95 … 93 99 100 99 100 … 100
Romania … … … … … … … … … … … … … … … … … …
Russian Federation … … … … … … … … … … … … … … … … … …
Rwanda DHS 2005 9 21 6 22 6 29 13 18 11 21 13 26 35 63 27 66 27 73
Saint Kitts and Nevis … … … … … … … … … … … … … … … … … …
8. Health inequities

151
Tabl
e 8
MDG 4
DTP3 immunization coverage among 1-year-olds a (%)
Children aged <5 years who are stunted a (%)
Under-five mortality rate a,d (probability of dying by age 5 per 1000 live births)
Member State
Place of residence Wealth quintile
Educational level
of mother
Place of residence Wealth quintile
Educational level
of mother
Place of residence Wealth quintile
Educational level
of mother
Rura
l
Urba
n
Low
est
High
est
None
Seco
ndar
y or
hig
her
Rura
l
Urba
n
Low
est
High
est
None
Seco
ndar
y or
hig
her
Rura
l
Urba
n
Low
est
High
est
None
Seco
ndar
y or
hig
her
82 91 73 88 … 88 40 29 45 28 41 e 31 111 89 107 81 77 89 Lesotho
41 70 30 72 47 70 41 29 43 25 40 28 144 129 137 115 149 116 Liberia
… … … … … … … … … … … … … … … … … … Libya
… … … … … … … … … … … … … … … … … … Lithuania
… … … … … … … … … … … … … … … … … … Luxembourg
71 89 54 93 49 89 51 43 48 43 49 46 84 63 106 48 97 54 Madagascar
93 94 91 94 89 97 48 40 56 35 53 38 128 113 131 105 136 94 Malawi
… … … … … … … … … … … … … … … … … … Malaysia
98 98 98 97 98 97 19 15 21 14 23 15 28 23 28 21 47 12 Maldives
65 77 65 78 66 86 42 27 44 22 40 19 234 156 233 123 223 102 Mali
… … … … … … … … … … … … … … … … … … Malta
… … … … … … … … … … … … … … … … … … Marshall Islands
60 53 54 61 52 64 32 24 34 20 31 18 … … … … … … Mauritania
… … … … … … … … … … … … … … … … … … Mauritius
… … … … … … … … … … … … … … … … … … Mexico
… … … … … … … … … … … … … … … … … … Micronesia (Federated States of)
… … … … … … … … … … … … … … … … … … Monaco
89 91 86 92 94 e 90 30 25 32 20 38 27 … … … … … … Mongolia
79 82 81 e 73 e … 80 9 7 14 5 … 6 … … … … … … Montenegro
92 97 89 98 93 98 29 16 35 13 27 13 69 38 78 26 63 27 Morocco
66 87 53 96 59 99 51 35 54 25 53 19 192 143 196 107 200 84 Mozambique
… … … … … … … … … … … … … … … … … … Myanmar
81 86 75 94 62 89 31 24 38 12 38 23 75 60 90 30 78 54 Namibia
… … … … … … … … … … … … … … … … … … Nauru
88 93 75 96 82 99 51 35 61 30 58 29 83 47 97 47 92 32 Nepal
… … … … … … … … … … … … … … … … … … Netherlands
… … … … … … … … … … … … … … … … … … New Zealand
80 88 72 88 72 89 35 15 42 6 42 11 55 33 64 18 71 24 Nicaragua
35 63 31 63 35 66 58 35 57 40 56 24 229 139 204 154 221 90 Niger
27 55 9 77 11 69 45 31 52 24 51 27 190 122 217 88 209 107 Nigeria
… … … … … … … … … … … … … … … … … … Niue
… … … … … … … … … … … … … … … … … … Norway
… … … … … … … … … … … … … … … … … … Oman
54 68 35 78 48 85 … … … … … … 100 78 120 59 102 62 Pakistan
… … … … … … … … … … … … … … … … … … Palau
… … … … … … … … … … … … … … … … … … Panama
… … … … … … … … … … … … … … … … … … Papua New Guinea
… … … … … … … … … … … … … … … … … … Paraguay
77 83 74 86 82 83 45 15 55 7 62 16 55 31 64 4 51 30 Peru
83 88 72 94 36 e 90 … … … … … … 46 28 59 17 135 30 Philippines
… … … … … … … … … … … … … … … … … … Poland
… … … … … … … … … … … … … … … … … … Portugal
… … … … … … … … … … … … … … … … … … Qatar
… … … … … … … … … … … … … … … … … … Republic of Korea
57 61 57 e 63 … 59 11 9 15 7 … 10 29 21 28 17 … 27 Republic of Moldova
… … … … … … … … … … … … … … … … … … Romania
… … … … … … … … … … … … … … … … … … Russian Federation
88 86 86 86 85 86 53 37 60 35 55 38 191 120 211 120 209 94 Rwanda
… … … … … … … … … … … … … … … … … … Saint Kitts and Nevis
011010011001101001100110100110011010011001101001100110100110011010011010010110010111101010100101010100101100101111010101001010101001010010011010011001001101001100100110100110010011010011001001101001001010101001010101001010101001010101001010101001010101001010101001010101001010101001010101001010101001010101001010101001010101001101001100110100110011010011001101001100110100110011010011001101001101100010101100010101100010101100010101100010101100010101100010101011010011001101001100110100110011010011001101001100110100110011010010100101010010101011000100110100101010010101011000100110100101010010101010110001001101001101001011010100110001001101001101001011010100110001001100101111010010101001010010111101001010100101001011110100101010010100101011010011001101001100110100110011010011001101001100110100110011010010010100110100010100110100010100110100010100110100010100110100010100101101001100110100110011010011001101001100110100110011010011001101001111010010101001010111010010111101001010100101011101001011110100101010010101011010011001101001100110100110011010011001101001100110100110011010011001011110101010010110010111101010100101100101111010101001011001010110100110011010011001101001100110100110011010011001101001100110100101001011010000100101101000010010110100001001011010000100101101000010010101101001100110100110011010011001101001100110100110011010011001101001
0101011000100110100110100101101010101100010011010011010010110101010101101001100110100110011010011001101001100110100110011010011001101001101001011001011110101010010101010010110010111101010100101010100101001001101001100100110100110010011010011001001101001100100110100100101010100101010100101010100101010100101010100101010100101010100101010100101010100101010100101010100101010100101010100101010100110100110011010011001101001100110100110011010011001101001100110100110110001010110001010110001010110001010110001010110001010110001010101101001100110100110011010011001101001100110100110011010011001101001010010101001010101100010011010010101001010101100010011010010101001010101011000100110100110100101101010011000100110100110100101101010011000100110010111101001010100101001011110100101010010100101111010010101001010010101101001100110100110011010011001101001100110100110011010011001101001001010011010001010011010001010011010001010011010001010011010001010010110100110011010011001101001100110100110011010011001101001100110100111101001010100101011101001011110100101010010101110100101111010010101001010101101001100110100110011010011001101001100110100110011010011001101001100101111010101001011001011110101010010110010111101010100101100101
010010100110101010110010100101100101111010101001010100101010110001001

152
MDG 5
Member State Source Contraceptive prevalence a (%)
Antenatal care coverage: at least 4 visits a,b (%)
Births attended by skilled health personnel a,c (%)
Place of residence
Wealth quintile
Educational level
of mother
Place of residence
Wealth quintile
Educational level
of mother
Place of residence
Wealth quintile
Educational level
of mother
Rura
l
Urba
n
Low
est
High
est
None
Seco
ndar
y or
hig
her
Rura
l
Urba
n
Low
est
High
est
None
Seco
ndar
y or
hig
her
Rura
l
Urba
n
Low
est
High
est
None
Seco
ndar
y or
hig
her
Saint Lucia … … … … … … … … … … … … … … … … … …
Saint Vincent and the Grenadines … … … … … … … … … … … … … … … … … …
Samoa … … … … … … … … … … … … … … … … … …
San Marino … … … … … … … … … … … … … … … … … …
Sao Tome and Principe DHS 2008–2009 40 28 31 37 15 32 69 76 58 91 53 82 75 89 74 93 73 88
Saudi Arabia … … … … … … … … … … … … … … … … … …
Senegal DHS 2005 5 18 3 22 5 30 32 51 27 61 36 62 33 85 20 89 42 88
Serbia MICS 2005 15 22 10 30 … 22 … … … … … … 99 99 98 100 … 99
Seychelles … … … … … … … … … … … … … … … … … …
Sierra Leone DHS 2008 4 14 3 18 4 20 64 81 61 86 65 85 33 67 28 71 36 73
Singapore … … … … … … … … … … … … … … … … … …
Slovakia … … … … … … … … … … … … … … … … … …
Slovenia … … … … … … … … … … … … … … … … … …
Solomon Islands … … … … … … … … … … … … … … … … … …
Somalia MICS 2006 0 3 0 4 1 7 … … … … … … 15 65 11 77 25 73
South Africa … … … … … … … … … … … … … … … … … …
Spain … … … … … … … … … … … … … … … … … …
Sri Lanka … … … … … … … … … … … … … … … … … …
Sudan … … … … … … … … … … … … … … … … … …
Suriname MICS 2006 41 47 29 51 14 51 … … … … … … 82 95 81 96 75 95
Swaziland DHS 2006 45 56 36 59 26 57 81 86 76 88 79 83 70 88 51 92 57 84
Sweden … … … … … … … … … … … … … … … … … …
Switzerland … … … … … … … … … … … … … … … … … …
Syrian Arab Republic MICS 2006 35 48 29 52 34 46 … … … … … … 88 98 78 99 77 98
Tajikistan MICS 2005 31 38 26 39 7 34 … … … … … … 81 89 70 91 … 84
Thailand MICS 2005 76 72 79 70 63 71 … … … … … … 96 99 93 100 81 99
The former Yugoslav Republic of Macedonia MICS 2005 10 10 8 17 3 14 … … … … … … 98 98 95 100 89 100
Timor-Leste DHS 2009–2010 19 28 14 32 15 25 53 63 41 68 44 65 21 59 11 69 14 50
Togo MICS 2006 9 14 6 16 7 21 … … … … … … 32 85 24 89 36 79
Tonga … … … … … … … … … … … … … … … … … …
Trinidad and Tobago MICS 2006 … … 37 44 … 39 … … … … … … … … 98 100 … 98
Tunisia … … … … … … … … … … … … … … … … … …
Turkey DHS 2003 34 46 30 52 30 52 33 65 20 88 18 84 69 90 58 99 51 97
Turkmenistan … … … … … … … … … … … … … … … … … …
Tuvalu … … … … … … … … … … … … … … … … … …
Uganda DHS 2006 15 36 7 38 9 35 45 62 45 66 41 64 38 80 29 77 26 76
Ukraine DHS 2007 42 50 36 53 … 48 96 98 94 98 … 97 98 99 97 99 … 99
United Arab Emirates … … … … … … … … … … … … … … … … … …
United Kingdom … … … … … … … … … … … … … … … … … …
United Republic of Tanzania DHS 2010 25 34 19 38 18 35 39 55 37 59 35 65 42 83 33 90 34 86
United States of America … … … … … … … … … … … … … … … … … …
Uruguay … … … … … … … … … … … … … … … … … …
Uzbekistan MICS 2006 60 57 61 57 … 59 … … … … … … 100 100 100 100 … 100
Vanuatu MICS 2007 36 41 28 44 20 41 … … … … … … 72 87 55 90 51 86
Venezuela (Bolivarian Republic of) … … … … … … … … … … … … … … … … … …
Viet Nam MICS 2006 62 56 66 56 58 62 … … … … … … 85 98 53 99 60 97
Yemen MICS 2006 13 34 5 35 16 30 … … … … … … 26 62 17 74 27 61
Zambia DHS 2007 28 42 31 48 27 44 58 61 56 64 54 64 31 83 27 91 23 73
Zimbabwe DHS 2005 53 68 45 71 30 65 69 77 64 82 61 76 58 94 46 95 35 81
8. Health inequities

153
Tabl
e 8
MDG 4
DTP3 immunization coverage among 1-year-olds a (%)
Children aged <5 years who are stunted a (%)
Under-five mortality rate a,d (probability of dying by age 5 per 1000 live births)
Member State
Place of residence Wealth quintile
Educational level
of mother
Place of residence Wealth quintile
Educational level
of mother
Place of residence Wealth quintile
Educational level
of mother
Rura
l
Urba
n
Low
est
High
est
None
Seco
ndar
y or
hig
her
Rura
l
Urba
n
Low
est
High
est
None
Seco
ndar
y or
hig
her
Rura
l
Urba
n
Low
est
High
est
None
Seco
ndar
y or
hig
her
… … … … … … … … … … … … … … … … … … Saint Lucia
… … … … … … … … … … … … … … … … … … Saint Vincent and the Grenadines
… … … … … … … … … … … … … … … … … … Samoa
… … … … … … … … … … … … … … … … … … San Marino
86 89 86 91 … 88 28 30 37 19 27 25 67 74 86 28 138 46 Sao Tome and Principe
… … … … … … … … … … … … … … … … … … Saudi Arabia
78 80 73 85 76 95 24 11 30 8 22 8 159 90 182 65 151 60 Senegal
85 86 84 88 … 86 8 8 12 6 … 7 … … … … … … Serbia
… … … … … … … … … … … … … … … … … … Seychelles
58 70 56 73 57 76 38 28 35 22 38 23 168 167 212 144 170 132 Sierra Leone
… … … … … … … … … … … … … … … … … … Singapore
… … … … … … … … … … … … … … … … … … Slovakia
… … … … … … … … … … … … … … … … … … Slovenia
… … … … … … … … … … … … … … … … … … Solomon Islands
7 26 5 29 11 25 e 47 32 51 25 45 26 … … … … … … Somalia
… … … … … … … … … … … … … … … … … … South Africa
… … … … … … … … … … … … … … … … … … Spain
… … … … … … … … … … … … … … … … … … Sri Lanka
… … … … … … … … … … … … … … … … … … Sudan
86 88 85 95 80 90 14 8 17 4 23 7 … … … … … … Suriname
92 91 92 89 91 e 93 29 23 37 17 39 22 106 108 120 102 151 96 Swaziland
… … … … … … … … … … … … … … … … … … Sweden
… … … … … … … … … … … … … … … … … … Switzerland
74 76 62 80 54 81 29 28 36 26 36 24 … … … … … … Syrian Arab Republic
82 87 81 84 … 84 34 31 38 25 45 e 33 … … … … … … Tajikistan
95 93 95 93 94 95 17 12 21 9 20 13 … … … … … … Thailand
81 81 73 77 58 88 12 11 15 6 23 8 … … … … … … The former Yugoslav Republic of Macedonia
65 71 55 73 57 75 60 49 63 47 63 52 86 59 87 52 89 66 Timor-Leste
59 71 58 75 51 79 35 22 37 19 34 22 … … … … … … Togo
… … … … … … … … … … … … … … … … … … Tonga
… … 67 e 62 e … 72 … … … … … … … … … … … … Trinidad and Tobago
… … … … … … … … … … … … … … … … … … Tunisia
48 73 38 81 33 78 … … … … … … 63 38 80 22 78 24 Turkey
… … … … … … … … … … … … … … … … … … Turkmenistan
… … … … … … … … … … … … … … … … … … Tuvalu
64 67 64 65 58 74 39 26 43 25 41 23 148 117 165 111 165 92 Uganda
… … … … … … … … … … … … 19 18 23 9 … 19 Ukraine
… … … … … … … … … … … … … … … … … … United Arab Emirates
… … … … … … … … … … … … … … … … … … United Kingdom
86 97 84 97 79 96 44 31 48 27 45 22 91 95 104 84 96 74 United Republic of Tanzania
… … … … … … … … … … … … … … … … … … United States of America
… … … … … … … … … … … … … … … … … … Uruguay
95 88 92 89 … 93 20 19 21 16 … 20 … … … … … … Uzbekistan
62 69 46 67 37 e 71 26 26 28 24 28 25 … … … … … … Vanuatu
… … … … … … … … … … … … … … … … … … Venezuela (Bolivarian Republic of)
75 95 56 95 46 85 … … … … … … … … … … … … Viet Nam
47 69 35 86 46 77 … … … … … … … … … … … … Yemen
77 90 78 95 70 90 48 39 48 34 45 37 138 131 124 108 145 104 Zambia
61 69 58 70 47 e 66 36 27 34 26 35 33 72 63 73 57 71 68 Zimbabwe
011010011001101001100110100110011010011001101001100110100110011010011010010110010111101010100101010100101100101111010101001010101001010010011010011001001101001100100110100110010011010011001001101001001010101001010101001010101001010101001010101001010101001010101001010101001010101001010101001010101001010101001010101001010101001101001100110100110011010011001101001100110100110011010011001101001101100010101100010101100010101100010101100010101100010101100010101011010011001101001100110100110011010011001101001100110100110011010010100101010010101011000100110100101010010101011000100110100101010010101010110001001101001101001011010100110001001101001101001011010100110001001100101111010010101001010010111101001010100101001011110100101010010100101011010011001101001100110100110011010011001101001100110100110011010010010100110100010100110100010100110100010100110100010100110100010100101101001100110100110011010011001101001100110100110011010011001101001111010010101001010111010010111101001010100101011101001011110100101010010101011010011001101001100110100110011010011001101001100110100110011010011001011110101010010110010111101010100101100101111010101001011001010110100110011010011001101001100110100110011010011001101001100110100101001011010000100101101000010010110100001001011010000100101101000010010101101001100110100110011010011001101001100110100110011010011001101001
0101011000100110100110100101101010101100010011010011010010110101010101101001100110100110011010011001101001100110100110011010011001101001101001011001011110101010010101010010110010111101010100101010100101001001101001100100110100110010011010011001001101001100100110100100101010100101010100101010100101010100101010100101010100101010100101010100101010100101010100101010100101010100101010100101010100110100110011010011001101001100110100110011010011001101001100110100110110001010110001010110001010110001010110001010110001010110001010101101001100110100110011010011001101001100110100110011010011001101001010010101001010101100010011010010101001010101100010011010010101001010101011000100110100110100101101010011000100110100110100101101010011000100110010111101001010100101001011110100101010010100101111010010101001010010101101001100110100110011010011001101001100110100110011010011001101001001010011010001010011010001010011010001010011010001010011010001010010110100110011010011001101001100110100110011010011001101001100110100111101001010100101011101001011110100101010010101110100101111010010101001010101101001100110100110011010011001101001100110100110011010011001101001100101111010101001011001011110101010010110010111101010100101100101
010010100110101010110010100101100101111010101001010100101010110001001

154
MDG 5
Member State Source Contraceptive prevalence a (%)
Antenatal care coverage: at least 4 visits a,b (%)
Births attended by skilled health personnel a,c (%)
Place of residence
Wealth quintile
Educational level
of mother
Place of residence
Wealth quintile
Educational level
of mother
Place of residence
Wealth quintile
Educational level
of mother
Rura
l
Urba
n
Low
est
High
est
None
Seco
ndar
y or
hig
her
Rura
l
Urba
n
Low
est
High
est
None
Seco
ndar
y or
hig
her
Rura
l
Urba
n
Low
est
High
est
None
Seco
ndar
y or
hig
her
Ranges of country valuesMinimum 0 3 0 4 1 7 8 18 3 21 6 26 3 37 1 27 2 33
Median 26 34 19 36 15 35 55 75 44 82 44 79 58 88 46 95 39 89
Maximum 76 73 79 75 68 73 96 98 94 98 83 97 100 100 100 100 96 100
a Data are derived from the re-analysis of publicly available Demographic and Health Sur-veys (DHS) and Multiple Indicator Cluster Surveys (MICS) micro-data, using the stan-dard indicator definitions as published in DHS or UNICEF documentation. The analysis was carried out by the International Center for Analysis and Monitoring of Equity in Health and Nutrition based in the Federal University of Pelotas, Brazil, and updated in December 2011. In some cases there may be slight differences between these results and those reported in DHS or MICS country reports due to differences in the calculation of indicator numerators and/or denominators.
b Data derived from DHS relate to the most recent live births occurring in the five years preceding the survey.
c Data derived from DHS relate to births occurring in the five years preceding the survey. Data derived from MICS relate to births occurring in the two years preceding the survey.
d The under-five mortality rate relates to the decade preceding the survey.e The figure is based on a small number of cases (25–49 unweighted cases).
8. Health inequities

155
Tabl
e 8
MDG 4
DTP3 immunization coverage among 1-year-olds a (%)
Children aged <5 years who are stunted a (%)
Under-five mortality rate a,d (probability of dying by age 5 per 1000 live births)
Member State
Place of residence Wealth quintile
Educational level
of mother
Place of residence Wealth quintile
Educational level
of mother
Place of residence Wealth quintile
Educational level
of mother
Rura
l
Urba
n
Low
est
High
est
None
Seco
ndar
y or
hig
her
Rura
l
Urba
n
Low
est
High
est
None
Seco
ndar
y or
hig
her
Rura
l
Urba
n
Low
est
High
est
None
Seco
ndar
y or
hig
her
7 26 5 29 11 29 8 3 10 2 14 4 19 13 23 4 27 12 Minimum
74 82 67 86 59 85 35 26 38 20 40 23 88 69 100 54 104 58 Median
100 99 100 99 98 99 60 49 63 47 63 52 234 178 233 185 223 145 Maximum
011010011001101001100110100110011010011001101001100110100110011010011010010110010111101010100101010100101100101111010101001010101001010010011010011001001101001100100110100110010011010011001001101001001010101001010101001010101001010101001010101001010101001010101001010101001010101001010101001010101001010101001010101001010101001101001100110100110011010011001101001100110100110011010011001101001101100010101100010101100010101100010101100010101100010101100010101011010011001101001100110100110011010011001101001100110100110011010010100101010010101011000100110100101010010101011000100110100101010010101010110001001101001101001011010100110001001101001101001011010100110001001100101111010010101001010010111101001010100101001011110100101010010100101011010011001101001100110100110011010011001101001100110100110011010010010100110100010100110100010100110100010100110100010100110100010100101101001100110100110011010011001101001100110100110011010011001101001111010010101001010111010010111101001010100101011101001011110100101010010101011010011001101001100110100110011010011001101001100110100110011010011001011110101010010110010111101010100101100101111010101001011001010110100110011010011001101001100110100110011010011001101001100110100101001011010000100101101000010010110100001001011010000100101101000010010101101001100110100110011010011001101001100110100110011010011001101001
0101011000100110100110100101101010101100010011010011010010110101010101101001100110100110011010011001101001100110100110011010011001101001101001011001011110101010010101010010110010111101010100101010100101001001101001100100110100110010011010011001001101001100100110100100101010100101010100101010100101010100101010100101010100101010100101010100101010100101010100101010100101010100101010100101010100110100110011010011001101001100110100110011010011001101001100110100110110001010110001010110001010110001010110001010110001010110001010101101001100110100110011010011001101001100110100110011010011001101001010010101001010101100010011010010101001010101100010011010010101001010101011000100110100110100101101010011000100110100110100101101010011000100110010111101001010100101001011110100101010010100101111010010101001010010101101001100110100110011010011001101001100110100110011010011001101001001010011010001010011010001010011010001010011010001010011010001010010110100110011010011001101001100110100110011010011001101001100110100111101001010100101011101001011110100101010010101110100101111010010101001010101101001100110100110011010011001101001100110100110011010011001101001100101111010101001011001011110101010010110010111101010100101100101
010010100110101010110010100101100101111010101001010100101010110001001

156

157
Tabl
e 9
9. Demographic and socioeconomic statistics
Table 9 presents data on demographic and socioeconomic factors that are major determinants of health. The table includes four MDG-related indicators – adolescent fertility; primary school enrolment; population living in poverty; and cellular phone subscriber rates. The table also includes data on de-mographics (such as population size, growth and degree of urbanization); crude birth and death rates; adult literacy; and per capita gross national income. In addition to their intrinsic value, such data are also important in making other statistics comparable across countries. For example, data on disease incidence, prevalence and mortality rates – and on the availability of health-system resources – all re-quire reliable population-based denominators.
These demographic and socioeconomic statistics have been derived from data produced by a range of national and international organizations. The latter include the United Nations International Telecom-munication Union (ITU), the United Nations Department of Economic and Social Affairs (UNDESA), the United Nations Educational, Scientific and Cultural Organization (UNESCO), the United Nations Children’s Fund (UNICEF) and the World Bank. Estimates are based on a combination of administrative records, population-based surveys, censuses and civil-registration data, and on statistical modelling to adjust for missing values. For more information on the sources and methods used for a particular indicator, please refer to the relevant footnotes below and to the web site of the relevant organization.
011010011001101001100110100110011010011001101001100110100110011010011010010110010111101010100101010100101100101111010101001010101001010010011010011001001101001100100110100110010011010011001001101001001010101001010101001010101001010101001010101001010101001010101001010101001010101001010101001010101001010101001010101001010101001101001100110100110011010011001101001100110100110011010011001101001101100010101100010101100010101100010101100010101100010101100010101011010011001101001100110100110011010011001101001100110100110011010010100101010010101011000100110100101010010101011000100110100101010010101010110001001101001101001011010100110001001101001101001011010100110001001100101111010010101001010010111101001010100101001011110100101010010100101011010011001101001100110100110011010011001101001100110100110011010010010100110100010100110100010100110100010100110100010100110100010100101101001100110100110011010011001101001100110100110011010011001101001111010010101001010111010010111101001010100101011101001011110100101010010101011010011001101001100110100110011010011001101001100110100110011010011001011110101010010110010111101010100101100101111010101001011001010110100110011010011001101001100110100110011010011001101001100110100101001011010000100101101000010010110100001001011010000100101101000010010101101001100110100110011010011001101001100110100110011010011001101001
0101011000100110100110100101101010101100010011010011010010110101010101101001100110100110011010011001101001100110100110011010011001101001101001011001011110101010010101010010110010111101010100101010100101001001101001100100110100110010011010011001001101001100100110100100101010100101010100101010100101010100101010100101010100101010100101010100101010100101010100101010100101010100101010100101010100110100110011010011001101001100110100110011010011001101001100110100110110001010110001010110001010110001010110001010110001010110001010101101001100110100110011010011001101001100110100110011010011001101001010010101001010101100010011010010101001010101100010011010010101001010101011000100110100110100101101010011000100110100110100101101010011000100110010111101001010100101001011110100101010010100101111010010101001010010101101001100110100110011010011001101001100110100110011010011001101001001010011010001010011010001010011010001010011010001010011010001010010110100110011010011001101001100110100110011010011001101001100110100111101001010100101011101001011110100101010010101110100101111010010101001010101101001100110100110011010011001101001100110100110011010011001101001100101111010101001011001011110101010010110010111101010100101100101
010010100110101010110010100101100101111010101001010100101010110001001

158
Member State Population a Crude birth rate a
(per 1000 population)
Crude death rate b
(per 1000 population)
Total (000s)
Median age
(years)
Aged under 15
(%)
Aged over 60
(%)
Annual growth rate (%)
Living in urban areas
(%)
2010 2010 2010 2010 2000–2010 2010 2010 2009
Afghanistan 31 412 17 46 4 3.2 23 43.6 15.8
Albania 3 204 30 23 13 0.4 52 12.8 8.8
Algeria 35 468 26 27 7 1.5 66 20.2 5.0
Andorra 85 … 15 22 2.7 88 10.0 h 8.0
Angola 19 082 17 47 4 3.1 59 41.6 13.2
Antigua and Barbuda 89 … 24 10 1.3 30 16.0 h 6.6
Argentina 40 412 30 25 15 0.9 92 17.2 7.9
Armenia 3 092 32 20 15 0.1 64 15.3 14.0
Australia 22 268 37 19 19 1.5 89 13.7 6.5
Austria 8 394 42 15 23 0.5 68 8.8 9.2
Azerbaijan 9 188 30 21 9 1.2 52 19.8 9.1
Bahamas 343 31 23 10 1.4 84 15.5 5.3
Bahrain 1 262 30 20 3 6.8 89 19.5 2.9
Bangladesh 148 692 24 31 7 1.4 28 20.3 7.7
Barbados 273 37 17 16 0.2 44 10.9 8.8
Belarus 9 595 38 15 18 –0.5 75 11.1 14.1
Belgium 10 712 41 17 23 0.5 97 11.5 9.5
Belize 312 22 35 6 2.2 52 24.5 4.5
Benin 8 850 18 44 5 3.1 42 39.6 10.9
Bhutan 726 25 29 7 2.4 35 20.4 8.4
Bolivia (Plurinational State of) 9 930 22 36 7 1.8 67 26.5 6.5
Bosnia and Herzegovina 3 760 39 15 19 0.2 49 8.5 9.8
Botswana 2 007 23 33 6 1.3 61 23.6 9.1
Brazil 194 946 29 25 10 1.1 87 15.5 6.3
Brunei Darussalam 399 29 26 6 2.0 76 19.2 3.5
Bulgaria 7 494 42 14 24 –0.7 71 10.1 14.4
Burkina Faso 16 469 17 45 4 2.9 26 43.2 13.1
Burundi 8 383 20 38 5 2.7 11 34.0 14.0
Cambodia 14 138 23 32 6 1.3 20 22.5 8.6
Cameroon 19 599 19 41 5 2.2 58 36.2 14.4
Canada 34 017 40 16 20 1.0 81 11.3 7.1
Cape Verde 496 23 32 7 1.3 61 20.7 6.3
Central African Republic 4 401 19 40 6 1.7 39 35.0 16.2
Chad 11 227 17 45 5 3.1 28 44.7 16.9
Chile 17 114 32 22 13 1.0 89 14.3 5.6
China 1 348 932 35 19 12 0.6 47 12.3 7.1
Colombia 46 295 27 29 9 1.5 75 19.7 4.4
Comoros 735 19 43 4 2.7 28 37.5 9.1
Congo 4 043 20 41 6 2.5 62 35.3 12.5
Cook Islands 20 … 32 9 1.3 75 16.0 h 4.5
Costa Rica 4 659 28 25 10 1.7 64 15.7 4.2
Côte d'Ivoire 19 738 19 41 6 1.7 51 34.0 14.6
Croatia 4 403 42 15 23 –0.2 58 9.7 12.2
Cuba 11 258 38 17 17 0.1 75 9.9 8.2
Cyprus 1 104 34 18 16 1.6 70 11.7 5.9
Czech Republic 10 493 39 14 22 0.2 74 11.0 10.1
Democratic People's Republic of Korea 24 346 33 23 14 0.6 60 14.3 8.6
Democratic Republic of the Congo 65 966 17 46 4 2.8 35 43.5 15.9
9. Demographic and socioeconomic statistics

159
Tabl
e 9
MDG 5 MDG 2 MDG 1 MDG 8
Total fertility rate a
(per woman)
Adolescent fertility rate c
(per 1000 girls aged 15–19
years)
Literacy rate among adults
aged ≥ 15 years d
(%)
Net primary school enrolment rate d
(%)
Gross national income per
capita e (PPP int. $)
Population living on <$1
(PPP int. $) a day f
(%)
Cellular subscribers g
(per 100 population)
Member State
Male Female
2010 2005–2010 2005–2010 2005–2010 2010 2005–2009 2010
6.3 … … … … 1 060 … 41 Afghanistan
1.5 20 96 80 80 8 740 <2.0 142 Albania
2.3 4 73 98 96 8 180 … 92 Algeria
1.3 h … … 78 79 … … 77 Andorra
5.4 165 70 93 i 78 i 5 410 … 47 Angola
2.1 h … 99 j 91 84 20 240 … 189 Antigua and Barbuda
2.2 65 98 … … 15 570 <2.0 142 Argentina
1.7 27 100 95 98 5 660 <2.0 125 Armenia
1.9 17 … 97 98 … … 101 Australia
1.4 10 … … … 39 790 … 146 Austria
2.2 41 100 85 i 84 i 9 280 <2.0 99 Azerbaijan
1.9 39 … 94 96 … … 125 Bahamas
2.5 13 91 99 100 … … 124 Bahrain
2.2 133 56 … … 1 810 49.6 46 Bangladesh
1.6 51 … 90 97 … … 128 Barbados
1.4 22 100 91 i 89 i 13 590 <2.0 108 Belarus
1.8 11 … 99 99 38 260 … 113 Belgium
2.8 … … 100 i 91 6 210 … 62 Belize
5.3 … 42 … … 1 590 … 80 Benin
2.4 46 53 88 91 4 990 … 54 Bhutan
3.3 89 91 95 96 4 640 13.6 72 Bolivia (Plurinational State of)
1.1 15 98 86 88 8 810 <2.0 83 Bosnia and Herzegovina
2.8 51 84 85 87 13 700 … 118 Botswana
1.8 77 90 96 94 11 000 3.8 104 Brazil
2.0 17 95 … … … … 109 Brunei Darussalam
1.5 44 98 99 100 13 290 <2.0 136 Bulgaria
5.9 128 29 61 56 1 250 … 35 Burkina Faso
4.3 … 67 91 i 89 i 400 81.3 14 Burundi
2.6 … 78 96 95 2 080 28.3 58 Cambodia
4.5 … 71 … … 2 270 9.6 44 Cameroon
1.7 14 … … … 38 310 … 71 Canada
2.4 … 85 95 92 3 820 … 75 Cape Verde
4.6 … 55 81 i 61 i 790 62.8 22 Central African Republic
6.0 … 34 … … 1 220 … 24 Chad
1.9 53 99 94 94 14 590 <2.0 116 Chile
1.6 6 94 … … 7 640 15.9 64 China
2.4 84 93 92 91 9 060 16.0 96 Colombia
4.9 … 74 81 75 1 090 … 22 Comoros
4.5 … … 92 k 89 k 3 220 54.1 94 Congo
2.4 h … … 98 k 99 k … … 38 Cook Islands
1.8 67 96 … … 11 270 <2.0 65 Costa Rica
4.4 111 55 67 56 1 810 23.8 76 Côte d'Ivoire
1.5 14 99 93 93 18 860 <2.0 144 Croatia
1.5 50 100 100 100 … … 9 Cuba
1.5 6 98 99 k 99 k 30 300 … 94 Cyprus
1.5 12 … … … 23 620 … 137 Czech Republic
2.0 1 100 … … … … 2 Democratic People's Republic of Korea
5.8 135 67 … … 320 59.2 18 Democratic Republic of the Congo
011010011001101001100110100110011010011001101001100110100110011010011010010110010111101010100101010100101100101111010101001010101001010010011010011001001101001100100110100110010011010011001001101001001010101001010101001010101001010101001010101001010101001010101001010101001010101001010101001010101001010101001010101001010101001101001100110100110011010011001101001100110100110011010011001101001101100010101100010101100010101100010101100010101100010101100010101011010011001101001100110100110011010011001101001100110100110011010010100101010010101011000100110100101010010101011000100110100101010010101010110001001101001101001011010100110001001101001101001011010100110001001100101111010010101001010010111101001010100101001011110100101010010100101011010011001101001100110100110011010011001101001100110100110011010010010100110100010100110100010100110100010100110100010100110100010100101101001100110100110011010011001101001100110100110011010011001101001111010010101001010111010010111101001010100101011101001011110100101010010101011010011001101001100110100110011010011001101001100110100110011010011001011110101010010110010111101010100101100101111010101001011001010110100110011010011001101001100110100110011010011001101001100110100101001011010000100101101000010010110100001001011010000100101101000010010101101001100110100110011010011001101001100110100110011010011001101001
0101011000100110100110100101101010101100010011010011010010110101010101101001100110100110011010011001101001100110100110011010011001101001101001011001011110101010010101010010110010111101010100101010100101001001101001100100110100110010011010011001001101001100100110100100101010100101010100101010100101010100101010100101010100101010100101010100101010100101010100101010100101010100101010100101010100110100110011010011001101001100110100110011010011001101001100110100110110001010110001010110001010110001010110001010110001010110001010101101001100110100110011010011001101001100110100110011010011001101001010010101001010101100010011010010101001010101100010011010010101001010101011000100110100110100101101010011000100110100110100101101010011000100110010111101001010100101001011110100101010010100101111010010101001010010101101001100110100110011010011001101001100110100110011010011001101001001010011010001010011010001010011010001010011010001010011010001010010110100110011010011001101001100110100110011010011001101001100110100111101001010100101011101001011110100101010010101110100101111010010101001010101101001100110100110011010011001101001100110100110011010011001101001100101111010101001011001011110101010010110010111101010100101100101
010010100110101010110010100101100101111010101001010100101010110001001

160
Member State Population a Crude birth rate a
(per 1000 population)
Crude death rate b
(per 1000 population)
Total (000s)
Median age
(years)
Aged under 15
(%)
Aged over 60
(%)
Annual growth rate (%)
Living in urban areas
(%)
2010 2010 2010 2010 2000–2010 2010 2010 2009
Denmark 5 550 41 18 23 0.4 87 11.5 9.8
Djibouti 889 21 36 5 1.9 76 28.9 9.1
Dominica 68 … 24 10 –0.3 67 16.0 h 7.1
Dominican Republic 9 927 25 31 9 1.4 69 21.8 6.9
Ecuador 14 465 26 30 9 1.6 67 20.7 4.9
Egypt 81 121 24 32 8 1.8 43 23.2 5.9
El Salvador 6 193 23 32 10 0.4 64 20.3 6.7
Equatorial Guinea 700 20 39 4 3.0 40 36.7 13.3
Eritrea 5 254 19 42 4 3.6 22 36.2 5.8
Estonia 1 341 40 15 23 –0.2 69 12.1 12.2
Ethiopia 82 950 19 41 5 2.3 17 31.4 11.7
Fiji 861 26 29 8 0.6 52 21.6 6.6
Finland 5 365 42 17 25 0.4 85 11.3 9.2
France 62 787 40 18 23 0.6 85 12.6 8.4
Gabon 1 505 22 35 6 2.0 86 27.1 9.3
Gambia 1 728 18 44 3 2.9 58 38.1 8.5
Georgia 4 352 37 17 19 –0.9 53 11.9 12.3
Germany 82 302 44 13 26 0.0 74 8.5 10.1
Ghana 24 392 20 39 6 2.4 51 31.5 9.5
Greece 11 359 41 15 24 0.3 61 10.4 9.8
Grenada 104 25 28 10 0.3 39 19.4 6.5
Guatemala 14 389 19 41 6 2.5 49 32.3 5.8
Guinea 9 982 18 43 5 1.8 35 38.8 13.9
Guinea-Bissau 1 515 19 41 5 2.0 30 38.3 16.0
Guyana 754 24 34 6 0.3 29 18.1 6.6
Haiti 9 993 22 36 7 1.4 52 26.6 8.8
Honduras 7 601 21 37 6 2.0 52 26.7 6.1
Hungary 9 984 40 15 23 –0.2 68 9.9 13.2
Iceland 320 35 21 17 1.3 93 14.8 6.1
India 1 224 614 25 31 8 1.5 30 22.2 8.4
Indonesia 239 871 28 27 8 1.2 44 18.2 7.1
Iran (Islamic Republic of) 73 974 27 23 7 1.2 71 17.1 5.5
Iraq 31 672 18 43 5 2.8 66 35.4 6.4
Ireland 4 470 35 21 16 1.6 62 16.2 6.8
Israel 7 418 30 27 15 2.1 92 20.9 5.3
Italy 60 551 43 14 27 0.6 68 9.3 9.5
Jamaica 2 741 27 29 11 0.6 52 18.4 7.9
Japan 126 536 45 13 30 0.1 67 8.5 8.8
Jordan 6 187 21 38 6 2.5 79 25.0 4.7
Kazakhstan 16 026 29 24 10 0.7 59 21.5 11.6
Kenya 40 513 19 42 4 2.6 22 37.6 8.8
Kiribati 99 … 30 7 1.7 44 23.0 h 6.9
Kuwait 2 737 28 27 4 3.4 98 18.2 2.2
Kyrgyzstan 5 334 24 30 6 0.7 35 24.4 8.0
Lao People's Democratic Republic 6 201 21 35 6 1.5 33 22.8 7.9
Latvia 2 252 40 14 23 –0.6 68 10.7 14.6
Lebanon 4 228 29 25 10 1.2 87 15.4 6.1
Lesotho 2 171 20 37 6 1.0 27 27.8 15.4
9. Demographic and socioeconomic statistics

161
Tabl
e 9
MDG 5 MDG 2 MDG 1 MDG 8
Total fertility rate a
(per woman)
Adolescent fertility rate c
(per 1000 girls aged 15–19
years)
Literacy rate among adults
aged ≥ 15 years d
(%)
Net primary school enrolment rate d
(%)
Gross national income per
capita e (PPP int. $)
Population living on <$1
(PPP int. $) a day f
(%)
Cellular subscribers g
(per 100 population)
Member State
Male Female
2010 2005–2010 2005–2010 2005–2010 2010 2005–2009 2010
1.9 6 … 95 97 40 230 … 125 Denmark
3.8 … … 47 i 42 i … … 19 Djibouti
2.1 h 47 … 95 96 11 990 … 156 Dominica
2.6 98 88 96 90 9 030 4.3 90 Dominican Republic
2.5 … 84 … … 7 880 4.4 102 Ecuador
2.7 50 66 100 i 96 i 6 060 <2.0 87 Egypt
2.3 68 84 95 95 6 550 5.1 124 El Salvador
5.2 … 93 57 56 23 750 … 57 Equatorial Guinea
4.5 … 67 37 33 540 … 4 Eritrea
1.7 24 100 96 96 19 760 … 123 Estonia
4.2 … 30 85 80 1 040 39.0 8 Ethiopia
2.7 … … 99 99 4 510 … 81 Fiji
1.9 9 … 98 98 37 290 … 156 Finland
2.0 11 … 99 99 34 440 … 101 France
3.3 … 88 … … 13 170 4.8 107 Gabon
4.9 … 46 68 i 70 i 1 300 … 86 Gambia
1.6 44 100 96 94 4 990 15.3 91 Georgia
1.4 10 … … … 37 950 … 127 Germany
4.2 70 67 77 77 1 660 30.0 71 Ghana
1.5 12 97 98 99 27 050 … 108 Greece
2.2 … … 96 99 9 890 … 117 Grenada
4.0 92 74 100 98 4 650 11.7 126 Guatemala
5.2 … 39 83 70 1 020 43.3 40 Guinea
5.1 … 52 77 73 1 180 … 39 Guinea-Bissau
2.3 101 … 82 86 3 450 … 74 Guyana
3.3 … 49 … … … … 40 Haiti
3.1 … 84 96 i 98 i 3 770 23.3 125 Honduras
1.4 20 99 98 98 19 050 <2.0 120 Hungary
2.1 15 … 99 100 27 680 … 107 Iceland
2.6 45 63 98 i 94 i 3 550 41.6 61 India
2.1 52 92 97 i 93 i 4 200 18.7 92 Indonesia
1.7 31 85 98 i 96 i … <2.0 91 Iran (Islamic Republic of)
4.7 68 78 94 i 84 i 3 370 4.0 76 Iraq
2.1 17 … … … 33 370 … 105 Ireland
2.9 15 … 97 97 27 630 … 133 Israel
1.4 7 99 100 99 31 130 … 150 Italy
2.3 60 86 83 81 7 310 … 116 Jamaica
1.4 5 … … … 34 640 … 95 Japan
3.1 32 92 93 i 95 i 5 800 <2.0 107 Jordan
2.6 31 100 99 100 10 770 <2.0 121 Kazakhstan
4.7 106 87 84 i 85 i 1 680 19.7 62 Kenya
2.9 h 39 … … … 3 530 … 10 Kiribati
2.3 12 94 97 100 … … 161 Kuwait
2.7 30 99 95 95 2 100 <2.0 99 Kyrgyzstan
2.7 110 73 91 i 87 i 2 460 33.9 65 Lao People's Democratic Republic
1.5 15 100 95 97 16 350 … 102 Latvia
1.8 … 90 94 93 14 080 … 68 Lebanon
3.2 92 90 72 75 1 960 … 45 Lesotho
011010011001101001100110100110011010011001101001100110100110011010011010010110010111101010100101010100101100101111010101001010101001010010011010011001001101001100100110100110010011010011001001101001001010101001010101001010101001010101001010101001010101001010101001010101001010101001010101001010101001010101001010101001010101001101001100110100110011010011001101001100110100110011010011001101001101100010101100010101100010101100010101100010101100010101100010101011010011001101001100110100110011010011001101001100110100110011010010100101010010101011000100110100101010010101011000100110100101010010101010110001001101001101001011010100110001001101001101001011010100110001001100101111010010101001010010111101001010100101001011110100101010010100101011010011001101001100110100110011010011001101001100110100110011010010010100110100010100110100010100110100010100110100010100110100010100101101001100110100110011010011001101001100110100110011010011001101001111010010101001010111010010111101001010100101011101001011110100101010010101011010011001101001100110100110011010011001101001100110100110011010011001011110101010010110010111101010100101100101111010101001011001010110100110011010011001101001100110100110011010011001101001100110100101001011010000100101101000010010110100001001011010000100101101000010010101101001100110100110011010011001101001100110100110011010011001101001
0101011000100110100110100101101010101100010011010011010010110101010101101001100110100110011010011001101001100110100110011010011001101001101001011001011110101010010101010010110010111101010100101010100101001001101001100100110100110010011010011001001101001100100110100100101010100101010100101010100101010100101010100101010100101010100101010100101010100101010100101010100101010100101010100101010100110100110011010011001101001100110100110011010011001101001100110100110110001010110001010110001010110001010110001010110001010110001010101101001100110100110011010011001101001100110100110011010011001101001010010101001010101100010011010010101001010101100010011010010101001010101011000100110100110100101101010011000100110100110100101101010011000100110010111101001010100101001011110100101010010100101111010010101001010010101101001100110100110011010011001101001100110100110011010011001101001001010011010001010011010001010011010001010011010001010011010001010010110100110011010011001101001100110100110011010011001101001100110100111101001010100101011101001011110100101010010101110100101111010010101001010101101001100110100110011010011001101001100110100110011010011001101001100101111010101001011001011110101010010110010111101010100101100101
010010100110101010110010100101100101111010101001010100101010110001001

162
Member State Population a Crude birth rate a
(per 1000 population)
Crude death rate b
(per 1000 population)
Total (000s)
Median age
(years)
Aged under 15
(%)
Aged over 60
(%)
Annual growth rate (%)
Living in urban areas
(%)
2010 2010 2010 2010 2000–2010 2010 2010 2009
Liberia 3 994 18 43 4 3.4 48 39.1 11.2
Libya 6 355 26 30 6 1.9 78 23.1 4.7
Lithuania 3 324 39 15 21 –0.5 67 10.5 12.5
Luxembourg 507 39 18 19 1.5 85 11.5 7.3
Madagascar 20 714 18 43 5 3.0 30 35.3 7.0
Malawi 14 901 17 46 5 2.8 20 44.3 16.0
Malaysia 28 401 26 30 8 1.9 72 20.3 4.8
Maldives 316 25 27 7 1.5 40 16.8 4.1
Mali 15 370 16 47 4 3.1 36 46.4 13.5
Malta 417 39 15 21 0.5 95 9.2 7.4
Marshall Islands 54 … 30 7 0.4 72 30.0 h 12.2
Mauritania 3 460 20 40 4 2.7 41 33.8 9.6
Mauritius 1 299 32 22 11 0.8 42 12.8 7.0
Mexico 113 423 27 29 9 1.3 78 19.5 5.0
Micronesia (Federated States of) 111 21 37 6 0.4 23 24.7 5.9
Monaco 35 … 18 23 0.1 100 7.0 h 8.1
Mongolia 2 756 25 28 6 1.3 62 23.5 5.9
Montenegro 631 36 19 18 0.0 61 12.3 10.1
Morocco 31 951 26 28 8 1.0 58 19.5 5.3
Mozambique 23 391 18 44 5 2.5 38 37.7 15.3
Myanmar 47 963 28 26 8 0.6 34 17.3 8.9
Namibia 2 283 21 36 6 1.9 38 26.3 10.7
Nauru 10 … 30 7 0.2 100 28.0 h 10.8
Nepal 29 959 21 36 6 2.1 19 24.1 6.2
Netherlands 16 613 41 18 22 0.5 83 11.0 8.1
New Zealand 4 368 37 20 18 1.2 86 14.7 6.7
Nicaragua 5 788 22 34 6 1.3 57 23.8 4.4
Niger 15 512 15 49 4 3.5 17 48.5 11.5
Nigeria 158 423 18 43 5 2.5 50 39.9 13.0
Niue 1 … 32 9 –2.6 38 … 5.9
Norway 4 883 39 19 21 0.8 79 12.4 8.5
Oman 2 782 25 27 4 2.1 73 17.9 3.3
Pakistan 173 593 22 35 6 1.8 36 27.3 8.4
Palau 20 … 30 7 0.7 83 11.0 h 5.0
Panama 3 517 27 29 10 1.7 75 19.9 4.6
Papua New Guinea 6 858 20 39 5 2.4 13 30.2 7.2
Paraguay 6 455 23 34 8 1.9 61 24.2 4.6
Peru 29 077 26 30 9 1.2 77 20.4 4.7
Philippines 93 261 22 35 6 1.9 49 25.1 5.2
Poland 38 277 38 15 19 0.0 61 10.6 10.2
Portugal 10 676 41 15 24 0.3 61 9.2 9.9
Qatar 1 759 32 13 2 10.9 96 12.7 1.4
Republic of Korea 48 184 38 16 16 0.5 83 9.9 5.3
Republic of Moldova 3 573 35 17 16 –1.4 47 12.3 12.9
Romania 21 486 38 15 20 –0.3 57 10.3 12.0
Russian Federation 142 958 38 15 18 –0.3 73 11.8 14.9
Rwanda 10 624 19 43 4 2.7 19 41.0 9.8
Saint Kitts and Nevis 52 … 24 10 1.3 32 14.0 h 6.5
9. Demographic and socioeconomic statistics

163
Tabl
e 9
MDG 5 MDG 2 MDG 1 MDG 8
Total fertility rate a
(per woman)
Adolescent fertility rate c
(per 1000 girls aged 15–19
years)
Literacy rate among adults
aged ≥ 15 years d
(%)
Net primary school enrolment rate d
(%)
Gross national income per
capita e (PPP int. $)
Population living on <$1
(PPP int. $) a day f
(%)
Cellular subscribers g
(per 100 population)
Member State
Male Female
2010 2005–2010 2005–2010 2005–2010 2010 2005–2009 2010
5.2 … 59 … … 340 83.7 39 Liberia
2.6 … 89 … … … … 172 Libya
1.5 20 100 97 97 17 870 <2.0 147 Lithuania
1.6 9 … 96 98 61 790 … 143 Luxembourg
4.7 147 64 … … 960 67.8 37 Madagascar
6.0 177 74 91 98 850 … 20 Malawi
2.6 12 92 96 96 14 220 <2.0 119 Malaysia
1.8 15 98 97 97 8 110 … 157 Maldives
6.3 … 26 71 61 1 030 51.4 48 Mali
1.3 20 92 88 89 24 840 … 109 Malta
3.5 h 88 … … … … … 7 Marshall Islands
4.5 … 57 73 i 76 i 1 960 … 79 Mauritania
1.6 34 88 92 94 13 960 … 92 Mauritius
2.3 90 93 99 100 14 290 <2.0 81 Mexico
3.5 … … … … 3 490 … 25 Micronesia (Federated States of)
1.5 h … … … … … … 74 Monaco
2.5 20 97 99 i 98 i 3 670 22.4 91 Mongolia
1.7 17 … … … 12 930 <2.0 185 Montenegro
2.3 18 56 95 93 4 600 2.5 100 Morocco
4.9 … 55 95 89 930 59.6 31 Mozambique
2.0 … 92 … … 1 950 … 1 Myanmar
3.2 … 89 84 89 6 420 … 67 Namibia
3.1 h 84 … … … … … 60 Nauru
2.7 … 59 … … 1 210 … 31 Nepal
1.8 5 … 100 99 41 900 … 115 Netherlands
2.2 34 … 99 100 … … 115 New Zealand
2.6 109 78 93 95 2 790 15.8 65 Nicaragua
7.1 … 29 64 i 52 i 720 43.1 25 Niger
5.5 123 61 65 i 59 i 2 170 … 55 Nigeria
… … … … … … … 0 Niue
1.9 9 … 99 99 56 830 … 116 Norway
2.3 14 87 100 97 … … 166 Oman
3.4 16 56 81 k 67 k 2 790 22.6 57 Pakistan
1.7 h 29 … … … 11 000 … 71 Palau
2.5 87 94 99 98 12 770 2.4 185 Panama
4.0 … 60 … … 2 420 … 28 Papua New Guinea
3.0 … 95 86 86 5 050 5.1 92 Paraguay
2.5 69 90 97 97 8 930 5.9 100 Peru
3.1 53 95 88 90 3 980 22.6 86 Philippines
1.4 16 100 96 96 19 060 <2.0 123 Poland
1.3 16 95 99 100 24 760 … 142 Portugal
2.3 15 95 96 97 … … 132 Qatar
1.3 2 … 100 i 99 i 29 010 … 105 Republic of Korea
1.5 24 98 90 k 90 k 3 360 <2.0 89 Republic of Moldova
1.4 39 98 92 93 14 060 <2.0 115 Romania
1.5 30 100 95 96 19 190 <2.0 166 Russian Federation
5.4 43 71 89 i 92 i 1 150 76.8 33 Rwanda
1.8 h … … 86 k 86 k 15 850 … 153 Saint Kitts and Nevis
011010011001101001100110100110011010011001101001100110100110011010011010010110010111101010100101010100101100101111010101001010101001010010011010011001001101001100100110100110010011010011001001101001001010101001010101001010101001010101001010101001010101001010101001010101001010101001010101001010101001010101001010101001010101001101001100110100110011010011001101001100110100110011010011001101001101100010101100010101100010101100010101100010101100010101100010101011010011001101001100110100110011010011001101001100110100110011010010100101010010101011000100110100101010010101011000100110100101010010101010110001001101001101001011010100110001001101001101001011010100110001001100101111010010101001010010111101001010100101001011110100101010010100101011010011001101001100110100110011010011001101001100110100110011010010010100110100010100110100010100110100010100110100010100110100010100101101001100110100110011010011001101001100110100110011010011001101001111010010101001010111010010111101001010100101011101001011110100101010010101011010011001101001100110100110011010011001101001100110100110011010011001011110101010010110010111101010100101100101111010101001011001010110100110011010011001101001100110100110011010011001101001100110100101001011010000100101101000010010110100001001011010000100101101000010010101101001100110100110011010011001101001100110100110011010011001101001
0101011000100110100110100101101010101100010011010011010010110101010101101001100110100110011010011001101001100110100110011010011001101001101001011001011110101010010101010010110010111101010100101010100101001001101001100100110100110010011010011001001101001100100110100100101010100101010100101010100101010100101010100101010100101010100101010100101010100101010100101010100101010100101010100101010100110100110011010011001101001100110100110011010011001101001100110100110110001010110001010110001010110001010110001010110001010110001010101101001100110100110011010011001101001100110100110011010011001101001010010101001010101100010011010010101001010101100010011010010101001010101011000100110100110100101101010011000100110100110100101101010011000100110010111101001010100101001011110100101010010100101111010010101001010010101101001100110100110011010011001101001100110100110011010011001101001001010011010001010011010001010011010001010011010001010011010001010010110100110011010011001101001100110100110011010011001101001100110100111101001010100101011101001011110100101010010101110100101111010010101001010101101001100110100110011010011001101001100110100110011010011001101001100101111010101001011001011110101010010110010111101010100101100101
010010100110101010110010100101100101111010101001010100101010110001001

164
Member State Population a Crude birth rate a
(per 1000 population)
Crude death rate b
(per 1000 population)
Total (000s)
Median age
(years)
Aged under 15
(%)
Aged over 60
(%)
Annual growth rate (%)
Living in urban areas
(%)
2010 2010 2010 2010 2000–2010 2010 2010 2009
Saint Lucia 174 27 26 9 1.0 28 17.6 6.0
Saint Vincent and the Grenadines 109 28 26 10 0.1 49 17.1 6.8
Samoa 183 21 38 7 0.4 20 24.6 6.4
San Marino 32 … 14 27 1.6 94 9.0 h 8.8
Sao Tome and Principe 165 19 40 5 1.6 62 31.2 6.5
Saudi Arabia 27 448 26 30 4 3.1 82 21.6 4.4
Senegal 12 434 18 44 4 2.7 42 37.4 7.7
Serbia 9 856 38 18 20 –0.3 56 11.3 12.9
Seychelles 87 … 23 11 0.9 55 16.0 h 8.2
Sierra Leone 5 868 18 43 4 3.5 38 38.6 14.7
Singapore 5 086 38 17 14 2.6 100 9.1 4.3
Slovakia 5 462 37 15 17 0.1 55 10.4 9.8
Slovenia 2 030 42 14 22 0.2 50 10.0 9.4
Solomon Islands 538 20 40 5 2.8 19 31.9 4.6
Somalia 9 331 18 45 4 2.3 37 43.5 15.0
South Africa 50 133 25 30 7 1.1 62 21.2 13.3
Spain 46 077 40 15 22 1.3 77 10.9 8.3
Sri Lanka 20 860 31 25 12 1.1 14 18.2 8.6
Sudan 43 552 20 40 6 2.4 40 32.8 10.0
Suriname 525 28 29 9 1.2 69 18.4 6.4
Swaziland 1 186 19 38 5 1.1 21 29.4 14.3
Sweden 9 380 41 17 25 0.6 85 12.0 9.6
Switzerland 7 664 41 15 23 0.7 74 9.9 8.0
Syrian Arab Republic 20 411 21 37 6 2.4 56 22.8 4.1
Tajikistan 6 879 20 37 5 1.1 26 27.9 6.0
Thailand 69 122 34 21 13 0.9 34 12.1 10.2
The former Yugoslav Republic of Macedonia 2 061 36 18 17 0.3 59 10.8 10.1
Timor-Leste 1 124 17 46 5 3.0 28 38.5 6.2
Togo 6 028 20 40 5 2.3 43 32.0 9.6
Tonga 104 21 37 8 0.6 23 27.2 6.7
Trinidad and Tobago 1 341 31 21 11 0.4 14 14.7 7.7
Tunisia 10 481 29 23 10 1.0 67 17.1 5.4
Turkey 72 752 28 26 9 1.3 70 17.9 4.9
Turkmenistan 5 042 25 29 6 1.1 50 21.6 8.7
Tuvalu 10 … 32 9 0.4 50 23.0 h 10.5
Uganda 33 425 16 48 4 3.2 13 45.2 13.1
Ukraine 45 448 39 14 21 –0.7 69 10.8 16.6
United Arab Emirates 7 512 30 17 1 9.1 84 13.1 1.2
United Kingdom 62 036 40 17 23 0.5 80 12.2 9.1
United Republic of Tanzania 44 841 18 45 5 2.8 26 41.4 11.6
United States of America 310 384 37 20 18 0.9 82 13.9 8.1
Uruguay 3 369 34 23 18 0.1 92 14.8 9.9
Uzbekistan 27 445 24 29 6 1.0 36 21.4 6.6
Vanuatu 240 21 38 5 2.6 26 29.5 4.7
Venezuela (Bolivarian Republic of) 28 980 26 29 9 1.7 93 20.6 4.8
Viet Nam 87 848 28 24 8 1.1 30 16.7 6.6
Yemen 24 053 17 44 4 3.1 32 38.1 6.5
Zambia 13 089 17 46 5 2.5 36 45.6 15.7
Zimbabwe 12 571 19 39 6 0.0 38 29.2 13.9
9. Demographic and socioeconomic statistics

165
Tabl
e 9
MDG 5 MDG 2 MDG 1 MDG 8
Total fertility rate a
(per woman)
Adolescent fertility rate c
(per 1000 girls aged 15–19
years)
Literacy rate among adults
aged ≥ 15 years d
(%)
Net primary school enrolment rate d
(%)
Gross national income per
capita e (PPP int. $)
Population living on <$1
(PPP int. $) a day f
(%)
Cellular subscribers g
(per 100 population)
Member State
Male Female
2010 2005–2010 2005–2010 2005–2010 2010 2005–2009 2010
2.0 … … 90 i 89 i 10 520 … 114 Saint Lucia
2.1 … … 100 97 10 830 … 121 Saint Vincent and the Grenadines
3.9 29 99 … … 4 270 … 91 Samoa
1.5 h … … 91 k 93 k … … 76 San Marino
3.7 110 89 97 98 1 920 … 62 Sao Tome and Principe
2.8 7 86 90 89 … … 188 Saudi Arabia
4.8 96 50 76 80 1 910 33.5 67 Senegal
1.6 22 … 95 k 94 k 11 020 <2.0 129 Serbia
1.9 h 59 92 j 96 94 21 210 <2.0 136 Seychelles
5.0 143 41 … … 830 … 34 Sierra Leone
1.3 5 95 … … 55 790 … 145 Singapore
1.3 22 … … … 23 100 … 108 Slovakia
1.4 5 100 97 97 26 660 … 105 Slovenia
4.2 … … 83 81 2 210 … 6 Solomon Islands
6.3 123 … … … … … 7 Somalia
2.5 54 89 89 i 91 i 10 360 17.4 100 South Africa
1.5 13 98 l 100 100 31 640 … 112 Spain
2.3 23 91 94 94 5 010 7.0 83 Sri Lanka
4.4 … 70 … … 2 030 … 41 Sudan
2.3 66 95 91 91 … … 170 Suriname
3.4 … 87 86 85 4 840 … 62 Swaziland
1.9 6 … 100 99 39 730 … 116 Sweden
1.5 4 … 99 99 50 170 … 124 Switzerland
2.9 … 84 100 98 5 120 … 58 Syrian Arab Republic
3.3 27 100 99 96 2 140 … 86 Tajikistan
1.6 43 94 90 89 8 190 … 104 Thailand
1.4 20 97 93 95 10 920 <2.0 105 The former Yugoslav Republic of Macedonia
6.2 54 51 m 86 86 3 600 37.4 53 Timor-Leste
4.1 … 57 … … 890 38.7 41 Togo
3.9 16 99 … … 4 580 … 52 Tonga
1.6 … 99 97 97 24 040 … 141 Trinidad and Tobago
2.0 6 78 … … 9 060 … 106 Tunisia
2.1 … 91 98 97 15 170 2.7 85 Turkey
2.4 21 100 … … 7 490 … 63 Turkmenistan
3.1 h 23 … … … … … 25 Tuvalu
6.1 … 73 90 92 1 250 37.7 38 Uganda
1.4 30 100 91 k 91 k 6 620 <2.0 119 Ukraine
1.7 … 90 94 98 … … 145 United Arab Emirates
1.9 26 … 100 100 36 410 … 131 United Kingdom
5.5 116 73 98 98 1 430 67.9 47 United Republic of Tanzania
2.1 40 … 95 96 47 360 … 90 United States of America
2.1 60 98 100 99 13 990 <2.0 132 Uruguay
2.4 26 99 93 91 3 120 … 76 Uzbekistan
3.9 … 82 … … 4 320 … 119 Vanuatu
2.5 101 95 95 95 12 150 3.0 96 Venezuela (Bolivarian Republic of)
1.8 35 93 … … 3 070 13.1 175 Viet Nam
5.2 80 62 86 70 … … 46 Yemen
6.3 151 71 91 i 94 i 1 380 … 42 Zambia
3.3 … 92 … … … … 61 Zimbabwe
011010011001101001100110100110011010011001101001100110100110011010011010010110010111101010100101010100101100101111010101001010101001010010011010011001001101001100100110100110010011010011001001101001001010101001010101001010101001010101001010101001010101001010101001010101001010101001010101001010101001010101001010101001010101001101001100110100110011010011001101001100110100110011010011001101001101100010101100010101100010101100010101100010101100010101100010101011010011001101001100110100110011010011001101001100110100110011010010100101010010101011000100110100101010010101011000100110100101010010101010110001001101001101001011010100110001001101001101001011010100110001001100101111010010101001010010111101001010100101001011110100101010010100101011010011001101001100110100110011010011001101001100110100110011010010010100110100010100110100010100110100010100110100010100110100010100101101001100110100110011010011001101001100110100110011010011001101001111010010101001010111010010111101001010100101011101001011110100101010010101011010011001101001100110100110011010011001101001100110100110011010011001011110101010010110010111101010100101100101111010101001011001010110100110011010011001101001100110100110011010011001101001100110100101001011010000100101101000010010110100001001011010000100101101000010010101101001100110100110011010011001101001100110100110011010011001101001
0101011000100110100110100101101010101100010011010011010010110101010101101001100110100110011010011001101001100110100110011010011001101001101001011001011110101010010101010010110010111101010100101010100101001001101001100100110100110010011010011001001101001100100110100100101010100101010100101010100101010100101010100101010100101010100101010100101010100101010100101010100101010100101010100101010100110100110011010011001101001100110100110011010011001101001100110100110110001010110001010110001010110001010110001010110001010110001010101101001100110100110011010011001101001100110100110011010011001101001010010101001010101100010011010010101001010101100010011010010101001010101011000100110100110100101101010011000100110100110100101101010011000100110010111101001010100101001011110100101010010100101111010010101001010010101101001100110100110011010011001101001100110100110011010011001101001001010011010001010011010001010011010001010011010001010011010001010010110100110011010011001101001100110100110011010011001101001100110100111101001010100101011101001011110100101010010101110100101111010010101001010101101001100110100110011010011001101001100110100110011010011001101001100101111010101001011001011110101010010110010111101010100101100101
010010100110101010110010100101100101111010101001010100101010110001001

166
Member State Population a Crude birth rate a
(per 1000 population)
Crude death rate b
(per 1000 population)
Total (000s)
Median age
(years)
Aged under 15
(%)
Aged over 60
(%)
Annual growth rate (%)
Living in urban areas
(%)
2010 2010 2010 2010 2000–2010 2010 2010 2009
Ranges of country valuesMinimum 1 15 13 1 –2.6 11 7.0 1.2
Median 7 418 26 29 8 1.3 58 19.9 8.2
Maximum 1 348 932 45 49 30 10.9 100 48.5 16.9
WHO regionAfrican Region 836 970 19 42 5 2.4 38 38.3 12.3
Region of the Americas 929 077 31 25 13 1.1 80 17.6 6.6
South-East Asia Region 1 807 594 26 30 8 1.4 32 21.2 8.2
European Region 896 480 38 17 20 0.3 70 13.6 10.4
Eastern Mediterranean Region 592 708 23 34 6 2.1 50 28.5 7.3
Western Pacific Region 1 797 489 34 20 13 0.7 50 14.2 7.0
Income groupLow income 793 257 20 39 6 2.1 28 35.8 11.0
Lower middle income 2 512 212 24 32 7 1.6 38 25.9 8.5
Upper middle income 2 466 724 32 22 12 0.7 59 15.0 7.5
High income 1 088 126 39 17 21 0.7 77 12.5 8.3
Global 6 860 318 29 27 11 1.2 50 23.7 8.4
a World population prospects: the 2010 revision. New York, Population Division, Depart-ment of Economic and Social Affairs, United Nations Secretariat, 2011.
b Mortality data. Geneva, World Health Organization, 2011 (http://www.who.int/health-info/statistics/mortality/en/).
c 2011 Update for the MDG database: Adolescent birth rate. Population Division, De-partment of Economic and Social Affairs, United Nations, 2011 (http://www.un.org/esa/population/publications/2011-mdgdatabase/2011_Update_MDG_ABR.xls). WHO regional, income-group and global figures refer to 2008. If country-level data were not available for 2008, linear interpolation between the closest data points on both sides of 2008 were used. In other cases, the closest data point is used.
d Data centre. Montreal, UNESCO Institute for Statistics, February 2012 update (http://www.uis.unesco.org/Pages/DataCentre.aspx). WHO regional and income-group ag-gregates were calculated using World population prospects: the 2008 revision. New York, Population Division, Department of Economic and Social Affairs, United Nations Secretariat, 2009.
e PPP int. $ = Purchasing Power Parity at international dollar rate. World development indicators database. Washington, DC, World Bank, 2012 (http://data.worldbank.org/ – December 2011 update figures used). The income-group aggregates relate only to WHO Member States and therefore may differ from those reported in the World devel-opment indicators database.
f World development indicators database. Washington, DC, World Bank, 2012 (http://data.worldbank.org/ – December 2011 update figures used). These figures reflect the World Bank default poverty line.
g World telecommunication/ICT indicators database 2011. Geneva, International Tele-communication Union, 15th Edition (sectional download at http://www.itu.int/ITU-D/ict/ or available for purchase in its entirety at: http://www.itu.int/ITU-D/ict/publications/world/world.html).
h International data base. Washington, DC, United States Census Bureau, 2010 (http://www.census.gov/population/international/data/idb/informationGateway.php, accessed 8 November 2011).
i National estimation.j Literacy rates are estimates for current decade based on survey or census data from
previous decade.k Figure estimated by the UNESCO Institute for Statistics (UIS).l Literacy rates refer to the population aged ≥16 years.m Literacy rates refer to the population aged ≥18 years.
9. Demographic and socioeconomic statistics

167
Tabl
e 9
MDG 5 MDG 2 MDG 1 MDG 8
Total fertility rate a
(per woman)
Adolescent fertility rate c
(per 1000 girls aged 15–19
years)
Literacy rate among adults
aged ≥ 15 years d
(%)
Net primary school enrolment rate d
(%)
Gross national income per
capita e (PPP int. $)
Population living on <$1
(PPP int. $) a day f
(%)
Cellular subscribers g
(per 100 population)
Member State
Male Female
2010 2005–2010 2005–2010 2005–2010 2010 2005–2009 2010
1.1 1 26 37 33 320 <2.0 0 Minimum
2.3 30 90 95 94 6 965 21.1 91 Median
7.1 177 100 100 100 61 790 83.7 189 Maximum
4.8 117 63 80 76 2 437 42.6 48 African Region
2.2 68 94 94 95 24 619 4.8 95 Region of the Americas
2.5 54 69 … … 3 608 38.4 63 South-East Asia Region
1.7 24 99 97 96 24 196 … 124 European Region
3.2 40 67 82 74 3 788 11.0 77 Eastern Mediterranean Region
1.7 13 94 … … 9 882 16.0 75 Western Pacific Region
4.1 117 61 82 80 1 285 48.8 33 Low income
2.9 54 71 … … 3 592 30.2 72 Lower middle income
1.8 30 93 95 95 9 831 10.7 84 Upper middle income
1.8 21 98 95 96 37 734 … 110 High income
2.5 50 84 91 89 10 822 22.7 78 Global
011010011001101001100110100110011010011001101001100110100110011010011010010110010111101010100101010100101100101111010101001010101001010010011010011001001101001100100110100110010011010011001001101001001010101001010101001010101001010101001010101001010101001010101001010101001010101001010101001010101001010101001010101001010101001101001100110100110011010011001101001100110100110011010011001101001101100010101100010101100010101100010101100010101100010101100010101011010011001101001100110100110011010011001101001100110100110011010010100101010010101011000100110100101010010101011000100110100101010010101010110001001101001101001011010100110001001101001101001011010100110001001100101111010010101001010010111101001010100101001011110100101010010100101011010011001101001100110100110011010011001101001100110100110011010010010100110100010100110100010100110100010100110100010100110100010100101101001100110100110011010011001101001100110100110011010011001101001111010010101001010111010010111101001010100101011101001011110100101010010101011010011001101001100110100110011010011001101001100110100110011010011001011110101010010110010111101010100101100101111010101001011001010110100110011010011001101001100110100110011010011001101001100110100101001011010000100101101000010010110100001001011010000100101101000010010101101001100110100110011010011001101001100110100110011010011001101001
0101011000100110100110100101101010101100010011010011010010110101010101101001100110100110011010011001101001100110100110011010011001101001101001011001011110101010010101010010110010111101010100101010100101001001101001100100110100110010011010011001001101001100100110100100101010100101010100101010100101010100101010100101010100101010100101010100101010100101010100101010100101010100101010100101010100110100110011010011001101001100110100110011010011001101001100110100110110001010110001010110001010110001010110001010110001010110001010101101001100110100110011010011001101001100110100110011010011001101001010010101001010101100010011010010101001010101100010011010010101001010101011000100110100110100101101010011000100110100110100101101010011000100110010111101001010100101001011110100101010010100101111010010101001010010101101001100110100110011010011001101001100110100110011010011001101001001010011010001010011010001010011010001010011010001010011010001010010110100110011010011001101001100110100110011010011001101001100110100111101001010100101011101001011110100101010010101110100101111010010101001010101101001100110100110011010011001101001100110100110011010011001101001100101111010101001011001011110101010010110010111101010100101100101
010010100110101010110010100101100101111010101001010100101010110001001

168

169
Tabl
e 10
10. Health information systems and data availability
National censuses and complete civil registration systems provide information on vital events occurring in the whole population. Civil registration can be defined as the continuous, compulsory and universal recording of the occurrence and characteristics of vital events, such as births and deaths, as stipulated by decree or through regulation, and is considered to be the optimal source of fertility and mortality statistics. However, almost one half of low- and middle-income countries have either weak and incom-plete civil registration systems or no civil registration system at all.
In many low- and middle-income countries, household surveys based on representative sampling are the single most important source of population health information. The majority of the 22 health-related MDG indicators reported in previous sections are primarily derived in this way.
Table 10 summarizes the coverage of civil registration systems for births and deaths, and the number of completed population-level surveys in the areas of child growth, child mortality, maternal mortality, HIV prevalence, and adult health status (evaluated in terms of adult growth characteristics and blood pressure). Data on the “Most recent census (year)” and coverage of civil registration of birth refer to the latest available year in the range. For the indicators shown under the subheading “Cause-of-death registration”, information on the number of years for which this has been available relates to the refer-ence period shown (1950–2010). For the indicators on “Coverage (%)”, “Ill-defined causes” and “ICD”, the figures correspond to the most-recent year shown under the heading “Year”. For indicators shown under the subheading “Number of national population surveys”, the figures correspond to the refer-ence period shown. Only national population surveys known to WHO are included. An individual survey that covered multiple areas may appear in more than one of the indicators shown under the heading.
011010011001101001100110100110011010011001101001100110100110011010011010010110010111101010100101010100101100101111010101001010101001010010011010011001001101001100100110100110010011010011001001101001001010101001010101001010101001010101001010101001010101001010101001010101001010101001010101001010101001010101001010101001010101001101001100110100110011010011001101001100110100110011010011001101001101100010101100010101100010101100010101100010101100010101100010101011010011001101001100110100110011010011001101001100110100110011010010100101010010101011000100110100101010010101011000100110100101010010101010110001001101001101001011010100110001001101001101001011010100110001001100101111010010101001010010111101001010100101001011110100101010010100101011010011001101001100110100110011010011001101001100110100110011010010010100110100010100110100010100110100010100110100010100110100010100101101001100110100110011010011001101001100110100110011010011001101001111010010101001010111010010111101001010100101011101001011110100101010010101011010011001101001100110100110011010011001101001100110100110011010011001011110101010010110010111101010100101100101111010101001011001010110100110011010011001101001100110100110011010011001101001100110100101001011010000100101101000010010110100001001011010000100101101000010010101101001100110100110011010011001101001100110100110011010011001101001
0101011000100110100110100101101010101100010011010011010010110101010101101001100110100110011010011001101001100110100110011010011001101001101001011001011110101010010101010010110010111101010100101010100101001001101001100100110100110010011010011001001101001100100110100100101010100101010100101010100101010100101010100101010100101010100101010100101010100101010100101010100101010100101010100101010100110100110011010011001101001100110100110011010011001101001100110100110110001010110001010110001010110001010110001010110001010110001010101101001100110100110011010011001101001100110100110011010011001101001010010101001010101100010011010010101001010101100010011010010101001010101011000100110100110100101101010011000100110100110100101101010011000100110010111101001010100101001011110100101010010100101111010010101001010010101101001100110100110011010011001101001100110100110011010011001101001001010011010001010011010001010011010001010011010001010011010001010010110100110011010011001101001100110100110011010011001101001100110100111101001010100101011101001011110100101010010101110100101111010010101001010101101001100110100110011010011001101001100110100110011010011001101001100101111010101001011001011110101010010110010111101010100101100101
010010100110101010110010100101100101111010101001010100101010110001001

170
Member State
Mos
t rec
ent
cens
us a (y
ear)
Civi
l reg
istra
tion
cove
rage
of b
irths
b
(%)
Cause-of-death registration c Number of national population surveys
Most recent year reported
Number of years available
Year Coverage (%)
Ill-defined causes
(%)
ICD Child anthro-
pometry d
Child mortality e
Maternal mortality f
HIV preva-lence g
Adult health h
1990 –2011
2005 –2010
1950 –2010 2000–2010
2005 –2011 2000–2011
2000 –2010
Afghanistan 2011 … 0 … … … … 0 5 2 0 0
Albania 2011 99 i 16 2004 68 19 9 1 4 0 0 0
Algeria 2008 >90 0 … … … … 0 3 1 0 0
Andorra 2011 >90 1 2010 >80 2 j 10 0 0 0 0 0
Angola … … 0 … … … … 1 3 0 0 0
Antigua and Barbuda 2011 >90 39 2009 85 7 10 0 0 0 0 0
Argentina 2010 >90 38 2009 99 22 10 0 0 0 0 0
Armenia 2011 >90 24 2009 66 3 j 10 1 3 0 0 2
Australia 2011 >90 58 2007 98 5 10 0 0 0 0 3
Austria 2011 >90 56 2010 100 9 10 0 0 0 0 0
Azerbaijan 2009 >90 23 2007 69 34 10 1 3 0 0 2
Bahamas 2010 … 30 2008 99 6 10 0 0 0 0 0
Bahrain 2010 >90 16 2009 100 31 10 0 0 0 0 0
Bangladesh 2011 10 i 0 … … … … 1 4 2 0 3
Barbados 2010 >90 50 2008 100 9 10 0 0 0 0 1
Belarus 2009 >90 27 2009 100 12 j 10 0 1 0 0 0
Belgium 2011 >90 49 2006 100 12 10 0 0 0 0 0
Belize 2010 94 i 43 2009 96 10 10 1 1 0 0 2
Benin 2002 60 i 0 … … … … 1 2 1 1 3
Bhutan 2005 100 i 0 … … … … 2 2 0 0 0
Bolivia (Plurinational State of) 2001 … 0 … … … … 1 2 3 0 2
Bosnia and Herzegovina 1991 >90 8 … … … … 1 0 0 0 1
Botswana 2011 72 i 0 … … … … 1 3 0 0 1
Brazil 2010 91 i,k 33 2009 89 13 10 1 5 0 0 2
Brunei Darussalam 2011 >90 15 2010 95 6 j 10 0 0 0 0 0
Bulgaria 2011 >90 47 2010 100 24 10 0 0 0 0 1
Burkina Faso 2006 64 i 0 … … … … 3 2 0 1 1
Burundi 2008 60 i 0 … … … … 1 3 0 0 0
Cambodia 2008 66 i 0 … … … … 3 3 3 1 4
Cameroon 2005 70 i 0 … … … … 2 2 1 1 1
Canada 2011 >90 55 2004 100 7 10 0 0 0 0 2
Cape Verde 2010 91 i 1 … … … … 0 1 0 1 1
Central African Republic 2003 49 i 0 … … … … 1 2 0 0 0
Chad 2009 … 0 … … … … 0 3 1 0 1
Chile 2002 99 i 56 2009 95 6 10 2 0 0 0 1
China 2010 … 23 2010 4 1 j 10 1 1 0 0 4
Colombia 2005 97 i 50 2008 94 6 10 1 3 0 0 3
Comoros 2003 … 0 … … … … 0 1 0 0 0
Congo 2007 81 i,k 0 … … … … 0 1 1 1 0
Cook Islands 2011 >90 16 2010 86 5 j 10 0 0 0 0 1
Costa Rica 2011 >90 54 2009 87 6 10 1 0 0 0 1
Côte d'Ivoire 1998 55 i 0 … … … … 2 1 1 1 0
Croatia 2011 >90 26 2010 98 10 10 0 0 0 0 0
Cuba 2002 >90 45 2009 97 6 10 0 0 0 0 1
Cyprus 2011 >90 13 2009 89 17 10 0 0 0 0 1
Czech Republic 2011 >90 25 2010 100 11 10 0 0 0 0 1
Democratic People's Republic of Korea 2008 100 i 0 … … … … 1 0 0 0 0
Democratic Republic of the Congo … 28 i 0 … … … … 2 3 1 1 1
Denmark 2011 >90 56 2006 100 12 10 0 0 0 0 0
Djibouti 2009 89 i 0 … … … … 1 2 0 0 0
Dominica 2011 >90 46 2010 100 8 10 0 0 0 0 1
Dominican Republic 2010 78 i 48 2005 54 18 10 2 3 2 3 0
Ecuador 2010 90 i 47 2009 82 16 10 0 1 1 0 1
Egypt 2006 >90 51 2010 100 39 10 1 4 0 0 5
El Salvador 2007 99 i 48 2009 75 24 10 1 2 1 0 2
10. Health information systems and data availability

171
Tabl
e 10
Member State
Mos
t rec
ent
cens
us a (y
ear)
Civi
l reg
istra
tion
cove
rage
of b
irths
b
(%)
Cause-of-death registration c Number of national population surveys
Most recent year reported
Number of years available
Year Coverage (%)
Ill-defined causes
(%)
ICD Child anthro-
pometry d
Child mortality e
Maternal mortality f
HIV preva-lence g
Adult health h
1990 –2011
2005 –2010
1950 –2010 2000–2010
2005 –2011 2000–2011
2000 –2010
Equatorial Guinea 2002 … 0 … … … … 0 0 0 0 0
Eritrea … … 0 … … … … 0 1 0 0 2
Estonia 2011 >90 28 2010 99 6 10 0 0 0 0 0
Ethiopia 2007 7 i 0 … … … … 1 2 2 1 2
Fiji 2007 >90 10 2009 100 17 10 0 0 0 0 1
Finland 2010 >90 59 2010 100 3 10 0 0 0 0 2
France 2006 >90 59 2008 100 15 10 0 0 0 0 1
Gabon 2003 … 0 … … … … 0 1 1 0 1
Gambia 2003 55 i 0 … … … … 1 2 0 0 0
Georgia 2002 >90 24 2010 92 40 10 1 3 1 0 0
Germany 2011 >90 42 2010 100 12 10 0 0 0 0 0
Ghana 2010 71 i 0 … … … … 2 4 1 1 3
Greece 2011 >90 54 2009 100 24 9 0 0 0 0 0
Grenada 2011 … 26 2009 94 12 10 0 0 0 0 0
Guatemala 2002 >90 47 2009 82 16 10 1 3 0 0 1
Guinea 1996 43 i 0 … … … … 1 1 1 1 1
Guinea-Bissau 2009 24 i 0 … … … … 2 3 0 0 0
Guyana 2002 93 i 26 2008 63 7 10 2 4 0 0 0
Haiti 2003 81 i 8 2003 10 38 10 1 2 2 1 2
Honduras 2001 94 i 21 … … … … 1 2 0 0 1
Hungary 2011 >90 56 2010 100 5 10 0 0 0 0 0
Iceland 2011 >90 59 2009 100 6 10 0 0 0 0 0
India 2011 41 i 2 2006 7 14 l 10 1 1 3 1 2
Indonesia 2010 53 i 0 … … … … 1 2 2 0 1
Iran (Islamic Republic of) 2011 >90 16 2006 62 11 10 0 1 0 0 4
Iraq 1997 95 i 1 2008 50 28 10 1 2 1 0 1
Ireland 2011 >90 61 2010 98 5 10 0 0 0 0 2
Israel 2008 >90 60 2009 100 10 10 0 0 0 0 3
Italy 2011 >90 56 2008 99 9 10 0 0 0 0 2
Jamaica 2011 >90 24 2006 68 8 10 2 2 0 0 1
Japan 2010 >90 61 2010 100 12 10 0 0 0 0 10
Jordan 2004 >90 19 2008 48 10 10 2 3 1 0 5
Kazakhstan 2009 >90 27 2009 84 6 j 10 1 1 0 0 0
Kenya 2009 60 i 0 … … … … 2 3 2 2 2
Kiribati 2010 92 i 12 2002 87 34 10 0 0 0 0 1
Kuwait 2010 >90 31 2009 100 12 10 4 0 0 0 1
Kyrgyzstan 2009 >90 27 2009 82 3 10 1 1 0 0 0
Lao People's Democratic Republic 2005 72 i 0 … … … … 1 2 0 0 1
Latvia 2011 >90 30 2009 98 10 10 0 0 0 0 0
Lebanon … >90 3 … … … … 0 2 1 0 1
Lesotho 2006 45 i 0 … … … … 1 3 2 2 1
Liberia 2008 4 i,k 0 … … … … 1 2 1 1 1
Libya 2006 … 0 … … … … 1 1 0 0 1
Lithuania 2011 >90 27 2009 99 5 10 0 0 0 0 0
Luxembourg 2011 >90 53 2009 100 15 10 0 0 0 0 0
Madagascar 1993 80 i 0 … … … … 1 3 2 0 2
Malawi 2008 … 0 … … … … 3 4 3 2 3
Malaysia 2010 >90 17 2006 53 23 10 1 0 0 0 3
Maldives 2011 93 i 8 2008 90 25 10 1 1 0 0 1
Mali 2009 81 i 0 … … … … 1 2 2 2 2
Malta 2011 >90 56 2010 98 6 10 0 0 0 0 0
Marshall Islands 2011 96 i 0 … … … … 0 1 0 0 1
Mauritania 2000 56 i 0 … … … … 2 2 1 0 1
Mauritius 2011 >90 54 2010 98 8 10 0 0 0 0 0
Mexico 2010 … 55 2009 95 5 10 1 2 1 0 2
011010011001101001100110100110011010011001101001100110100110011010011010010110010111101010100101010100101100101111010101001010101001010010011010011001001101001100100110100110010011010011001001101001001010101001010101001010101001010101001010101001010101001010101001010101001010101001010101001010101001010101001010101001010101001101001100110100110011010011001101001100110100110011010011001101001101100010101100010101100010101100010101100010101100010101100010101011010011001101001100110100110011010011001101001100110100110011010010100101010010101011000100110100101010010101011000100110100101010010101010110001001101001101001011010100110001001101001101001011010100110001001100101111010010101001010010111101001010100101001011110100101010010100101011010011001101001100110100110011010011001101001100110100110011010010010100110100010100110100010100110100010100110100010100110100010100101101001100110100110011010011001101001100110100110011010011001101001111010010101001010111010010111101001010100101011101001011110100101010010101011010011001101001100110100110011010011001101001100110100110011010011001011110101010010110010111101010100101100101111010101001011001010110100110011010011001101001100110100110011010011001101001100110100101001011010000100101101000010010110100001001011010000100101101000010010101101001100110100110011010011001101001100110100110011010011001101001
0101011000100110100110100101101010101100010011010011010010110101010101101001100110100110011010011001101001100110100110011010011001101001101001011001011110101010010101010010110010111101010100101010100101001001101001100100110100110010011010011001001101001100100110100100101010100101010100101010100101010100101010100101010100101010100101010100101010100101010100101010100101010100101010100101010100110100110011010011001101001100110100110011010011001101001100110100110110001010110001010110001010110001010110001010110001010110001010101101001100110100110011010011001101001100110100110011010011001101001010010101001010101100010011010010101001010101100010011010010101001010101011000100110100110100101101010011000100110100110100101101010011000100110010111101001010100101001011110100101010010100101111010010101001010010101101001100110100110011010011001101001100110100110011010011001101001001010011010001010011010001010011010001010011010001010011010001010010110100110011010011001101001100110100110011010011001101001100110100111101001010100101011101001011110100101010010101110100101111010010101001010101101001100110100110011010011001101001100110100110011010011001101001100101111010101001011001011110101010010110010111101010100101100101
010010100110101010110010100101100101111010101001010100101010110001001

172
Member State
Mos
t rec
ent
cens
us a (y
ear)
Civi
l reg
istra
tion
cove
rage
of b
irths
b
(%)
Cause-of-death registration c Number of national population surveys
Most recent year reported
Number of years available
Year Coverage (%)
Ill-defined causes
(%)
ICD Child anthro-
pometry d
Child mortality e
Maternal mortality f
HIV preva-lence g
Adult health h
1990 –2011
2005 –2010
1950 –2010 2000–2010
2005 –2011 2000–2011
2000 –2010
Micronesia (Federated States of) 2010 … 0 … … … … 0 0 0 0 0
Monaco 2008 … 3 2010 >80 14 10 0 0 0 0 0
Mongolia 2010 >90 15 2008 98 1 10 0 4 0 0 3
Montenegro 2011 >90 10 2009 92 25 10 0 0 0 0 0
Morocco 2004 … 9 2008 29 50 10 0 2 2 0 2
Mozambique 2007 31 i 0 … … … … 1 2 1 1 2
Myanmar … 72 i 0 … … … … 0 3 1 0 1
Namibia 2011 67 i 0 … … … … 1 2 2 0 2
Nauru 2002 83 i 3 … … … … 0 1 0 0 1
Nepal 2011 35 i 0 … … … … 2 3 2 0 2
Netherlands 2011 >90 61 2010 100 13 10 0 0 0 0 2
New Zealand 2006 >90 59 2008 100 3 10 0 0 0 0 1
Nicaragua 2005 … 36 2010 73 6 10 1 2 0 0 3
Niger 2001 32 i,k 0 … … … … 1 3 1 1 2
Nigeria 2006 30 i 0 … … … … 2 3 1 0 2
Niue 2011 >90 6 2000 100 0 10 0 0 0 0 0
Norway 2011 >90 60 2010 100 12 10 0 0 0 0 0
Oman 2010 … 7 2010 75 34 j 10 1 0 0 0 2
Pakistan 1998 27 i 0 … … … … 0 3 1 0 0
Palau 2005 >90 0 … … … … 0 0 0 0 0
Panama 2010 >90 50 2009 93 9 10 0 0 0 0 1
Papua New Guinea 2011 … 2 … … … … 0 1 0 0 1
Paraguay 2002 … 46 2009 82 19 10 0 2 0 0 0
Peru 2007 93 i 35 2007 65 7 10 3 5 2 0 3
Philippines 2010 >90 31 2008 91 10 10 1 3 1 0 1
Poland 2011 >90 51 2009 100 27 10 0 0 0 0 2
Portugal 2011 >90 56 2010 100 18 10 0 0 0 0 2
Qatar 2010 >90 10 2010 98 29 10 0 0 0 0 1
Republic of Korea 2010 >90 24 2010 97 16 10 3 0 0 0 3
Republic of Moldova 2004 >90 28 2010 95 2 10 0 1 0 0 1
Romania 2011 >90 51 2010 100 8 10 0 0 0 0 0
Russian Federation 2010 >90 30 2009 99 4 j 10 1 0 0 0 6
Rwanda 2002 82 i 0 … … … … 1 4 2 1 2
Saint Kitts and Nevis 2011 … 46 2008 87 8 10 0 0 0 0 0
Saint Lucia 2010 … 38 2006 100 16 10 0 0 0 0 0
Saint Vincent and the Grenadines 2011 >90 29 2009 94 7 10 0 0 0 0 0
Samoa 2011 48 i 0 … … … … 0 2 0 0 1
San Marino 2010 >90 12 2007 >80 35 10 0 0 0 0 0
Sao Tome and Principe 2001 75 i 3 … … … … 2 3 1 1 1
Saudi Arabia 2010 … 1 2009 42 48 10 0 0 0 0 1
Senegal 2002 55 i 0 … … … … 1 3 1 1 1
Serbia 2011 >90 13 2010 83 13 10 1 0 0 0 2
Seychelles 2010 >90 19 2010 100 4 j 10 0 0 0 0 1
Sierra Leone 2004 51 i 0 … … … … 1 3 1 1 2
Singapore 2010 >90 56 2010 74 3 9 0 0 0 0 2
Slovakia 2011 >90 18 2009 99 9 10 0 0 0 0 0
Slovenia 2011 >90 25 2009 100 10 10 0 0 0 0 0
Solomon Islands 2009 80 i 0 … … … … 1 1 0 0 0
Somalia … 3 i 0 … … … … 1 1 0 0 0
South Africa 2011 92 i,k 23 2008 91 21 10 1 2 1 0 1
Spain 2011 >90 59 2009 100 11 10 0 0 0 0 3
Sri Lanka 2001 >90 42 2006 76 28 10 2 3 0 0 1
Sudan 2008 33 i 0 … … … … 2 2 1 0 0
Suriname 2004 >90 38 2009 87 13 10 1 2 0 0 0
Swaziland 2007 30 i 0 … … … … 3 3 1 1 1
10. Health information systems and data availability

173
Tabl
e 10
Member State
Mos
t rec
ent
cens
us a (y
ear)
Civi
l reg
istra
tion
cove
rage
of b
irths
b
(%)
Cause-of-death registration c Number of national population surveys
Most recent year reported
Number of years available
Year Coverage (%)
Ill-defined causes
(%)
ICD Child anthro-
pometry d
Child mortality e
Maternal mortality f
HIV preva-lence g
Adult health h
1990 –2011
2005 –2010
1950 –2010 2000–2010
2005 –2011 2000–2011
2000 –2010
Sweden 2011 >90 60 2010 100 11 10 0 0 0 0 0
Switzerland 2010 >90 57 2007 99 5 10 0 0 0 0 0
Syrian Arab Republic 2004 95 i 22 2009 80 10 j 10 2 5 1 0 1
Tajikistan 2010 88 i 23 2005 64 4 9 1 6 0 0 1
Thailand 2010 99 i 48 2006 70 45 10 1 2 0 0 4
The former Yugoslav Republic of Macedonia 2011 94 i 13 2003 99 12 9 0 1 0 0 0
Timor-Leste 2010 55 i 0 … … … … 0 4 1 0 0
Togo 2010 78 i 0 … … … … 3 0 0 0 0
Tonga 2011 >90 1 … … … … 0 0 0 0 1
Trinidad and Tobago 2011 96 i 57 2007 93 5 10 0 2 0 0 0
Tunisia 2004 >90 0 … … … … 1 1 0 0 0
Turkey 2011 94 i 28 2008 57 11 l 8 0 3 1 0 4
Turkmenistan 1995 96 i 16 … … … … 0 2 0 0 1
Tuvalu 2002 50 i 9 2000 98 27 j … 0 1 0 0 0
Uganda 2002 21 i 0 … … … … 1 3 2 1 2
Ukraine 2001 >90 27 2010 96 3 j 10 0 2 0 0 2
United Arab Emirates 2010 … 2 2006 65 26 j 10 0 0 0 0 1
United Kingdom 2011 … 61 2010 96 6 10 0 0 0 0 0
United Republic of Tanzania 2002 16 i 0 … … … … 1 3 2 2 1
United States of America 2010 >90 58 2007 95 7 10 2 0 0 0 5
Uruguay 2011 >90 47 2009 95 17 10 0 0 0 0 1
Uzbekistan … 100 i 23 2005 79 6 10 1 3 0 0 1
Vanuatu 2009 26 i 0 … … … … 1 1 0 0 0
Venezuela (Bolivarian Republic of) 2011 >90 50 2007 96 8 10 0 0 0 0 0
Viet Nam 2009 >90 0 … … … … 4 6 0 1 2
Yemen … 22 i 0 … … … … 1 2 1 0 0
Zambia 2010 14 i 0 … … … … 1 2 2 2 2
Zimbabwe 2002 38 i 10 2002 33 19 9 2 2 2 1 2
Ranges of country valuesMinimum 1991 3 0 2000 4 0 … 0 0 0 0 0
Median 2010 >90 16 2009 96 10 … 0 1 0 0 1
Maximum 2011 100 61 2010 100 50 … 4 6 3 3 10
a 2010 World population and housing census programme. Census dates for all coun-tries as of 2 December 2011. New York, Population Division, Department of Economic and Social Affairs, United Nations Secretariat, 2011 (http://unstats.un.org/unsd/de-mographic/sources/census/censusdates.htm). Includes only censuses completed by 2011 based on status as of January 2012.
b Demographic yearbook 2008–2009. New York, United Nations Statistics Division, 2010 (http://unstats.un.org/unsd/Demographic/Products/dyb/dyb2009-2010.htm – accessed 14 January 2012).
c WHO Mortality Database: Tables. Geneva, World Health Organization, 2012 (http://www.who.int/healthinfo/morttables).
d Global database on child growth and malnutrition. Geneva, World Health Organization, 2012 (http://www.who.int/nutgrowthdb/database/en).
e Child mortality estimates. Inter-agency Group for Child Mortality Estimation, 11 Sep-tember 2011 (http://www.childmortality.org).
f Trends in maternal mortality: 1990 to 2010. WHO, UNICEF, UNFPA and the World Bank estimates. Geneva, World Health Organization (forthcoming).
g Demographic and Health Surveys (http://www.measuredhs.com/topics/HIV-Corner/hiv-prev/survey.cfm – accessed 30 January 2012). Includes only completed surveys.
h Finucane MM et al. (2011). On behalf of the Global Burden of Metabolic Risk Factors of Chronic Diseases Collaborating Group (Body Mass Index). National, regional, and
global trends in body-mass index since 1980: systematic analysis of health examina-tion surveys and epidemiological studies with 960 country-years and 9.1 million par-ticipants. Lancet, 377(9765):557–567; Goodarz Danaei MD et al. (2011). On behalf of the Global Burden of Metabolic Risk Factors of Chronic Diseases Collaborating Group (Blood Pressure). National, regional, and global trends in systolic blood pressure since 1980: systematic analysis of health examination surveys and epidemiological studies with 786 country-years and 5·4 million participants. Lancet, 377(9765):568–577. Na-tional surveys only.
i The standard definition includes the percentage of children under 5 years of age who were registered at the moment of the survey. The numerator of this indicator includes children whose birth certificate was seen by the interviewer, or whose mother or carer said the birth had been registered. The state of the world’s children, 2012: Children in an urban world. New York, UNICEF, 2012 (http://www.unicef.org/sowc/index_sowc.html).
j These countries include only data coded to the ICD chapter on symptoms, signs and abnormal clinical and laboratory findings not elsewhere classified.
k Data differ from the standard definition or refer to only part of a country.l These countries include only data coded to the ICD chapter on symptoms, signs and
abnormal clinical and laboratory findings not elsewhere classified, and to ill-defined injuries.
011010011001101001100110100110011010011001101001100110100110011010011010010110010111101010100101010100101100101111010101001010101001010010011010011001001101001100100110100110010011010011001001101001001010101001010101001010101001010101001010101001010101001010101001010101001010101001010101001010101001010101001010101001010101001101001100110100110011010011001101001100110100110011010011001101001101100010101100010101100010101100010101100010101100010101100010101011010011001101001100110100110011010011001101001100110100110011010010100101010010101011000100110100101010010101011000100110100101010010101010110001001101001101001011010100110001001101001101001011010100110001001100101111010010101001010010111101001010100101001011110100101010010100101011010011001101001100110100110011010011001101001100110100110011010010010100110100010100110100010100110100010100110100010100110100010100101101001100110100110011010011001101001100110100110011010011001101001111010010101001010111010010111101001010100101011101001011110100101010010101011010011001101001100110100110011010011001101001100110100110011010011001011110101010010110010111101010100101100101111010101001011001010110100110011010011001101001100110100110011010011001101001100110100101001011010000100101101000010010110100001001011010000100101101000010010101101001100110100110011010011001101001100110100110011010011001101001
0101011000100110100110100101101010101100010011010011010010110101010101101001100110100110011010011001101001100110100110011010011001101001101001011001011110101010010101010010110010111101010100101010100101001001101001100100110100110010011010011001001101001100100110100100101010100101010100101010100101010100101010100101010100101010100101010100101010100101010100101010100101010100101010100101010100110100110011010011001101001100110100110011010011001101001100110100110110001010110001010110001010110001010110001010110001010110001010101101001100110100110011010011001101001100110100110011010011001101001010010101001010101100010011010010101001010101100010011010010101001010101011000100110100110100101101010011000100110100110100101101010011000100110010111101001010100101001011110100101010010100101111010010101001010010101101001100110100110011010011001101001100110100110011010011001101001001010011010001010011010001010011010001010011010001010011010001010010110100110011010011001101001100110100110011010011001101001100110100111101001010100101011101001011110100101010010101110100101111010010101001010101101001100110100110011010011001101001100110100110011010011001101001100101111010101001011001011110101010010110010111101010100101100101
010010100110101010110010100101100101111010101001010100101010110001001

174
Annex 1. Regional and income groupings
WHO regional groupings1
WHO African Region: Algeria, Angola, Benin, Botswana, Burkina Faso, Burundi, Cameroon, Cape Verde, Central African Republic, Chad, Comoros, Congo, Côte d’Ivoire, Democratic Re-public of the Congo, Equatorial Guinea, Eritrea*, Ethiopia, Gabon, Gambia, Ghana, Guinea, Guinea-Bissau, Kenya, Lesotho, Liberia, Madagascar, Malawi, Mali, Mauritania, Mauritius, Mozambique, Namibia, Niger, Nigeria, Rwanda, Sao Tome and Principe, Senegal, Seychelles, Sierra Leone, South Africa, Swaziland, Togo, Uganda, United Republic of Tanzania, Zambia, Zimbabwe.
WHO Region of the Americas: Antigua and Barbuda, Argentina, Bahamas, Barbados, Belize, Bolivia (Plurinational State of), Brazil, Canada, Chile, Colombia, Costa Rica, Cuba, Dominica, Dominican Republic, Ecuador, El Salvador, Grenada, Guatemala, Guyana, Haiti, Honduras, Ja-maica, Mexico, Nicaragua, Panama, Paraguay, Peru, Saint Kitts and Nevis, Saint Lucia, Saint Vincent and the Grenadines, Suriname, Trinidad and Tobago, United States of America, Uru-guay, Venezuela (Bolivarian Republic of).
WHO South-East Asia Region: Bangladesh, Bhutan, Democratic People’s Republic of Korea, India, Indonesia, Maldives, Myanmar, Nepal, Sri Lanka, Thailand, Timor-Leste*.
WHO European Region: Albania, Andorra*, Armenia*, Austria, Azerbaijan*, Belarus, Belgium, Bosnia and Herzegovina*, Bulgaria, Croatia*, Cyprus, Czech Republic*, Denmark, Estonia*, Fin-land, France, Georgia*, Germany, Greece, Hungary, Iceland, Ireland, Israel, Italy, Kazakhstan*, Kyrgyzstan*, Latvia*, Lithuania*, Luxembourg, Malta, Monaco, Montenegro*, Netherlands, Nor-way, Poland, Portugal, Republic of Moldova*, Romania, Russian Federation, San Marino, Ser-bia*, Slovakia*, Slovenia*, Spain, Sweden, Switzerland, Tajikistan*, The former Yugoslav Repub-lic of Macedonia*, Turkey, Turkmenistan*, Ukraine, United Kingdom, Uzbekistan*.
WHO Eastern Mediterranean Region: Afghanistan, Bahrain, Djibouti, Egypt, Iran (Islamic Republic of), Iraq, Jordan, Kuwait, Lebanon, Libya, Morocco, Oman, Pakistan, Qatar, Saudi Arabia, Somalia, Sudan, Syrian Arab Republic, Tunisia, United Arab Emirates, Yemen.
WHO Western Pacific Region: Australia, Brunei Darussalam, Cambodia, China, Cook Is-lands, Fiji, Japan, Kiribati, Lao People’s Democratic Republic, Malaysia, Marshall Islands*, Mi-cronesia (Federated States of)*, Mongolia, Nauru*, New Zealand, Niue*, Palau*, Papua New Guinea, Philippines, Republic of Korea, Samoa, Singapore, Solomon Islands, Tonga, Tuvalu*, Vanuatu, Viet Nam.
1. Member States indicated with an * may have data for periods prior to their official membership of WHO.

175
Income groupings2,3
Low income: Afghanistan, Bangladesh, Benin, Burkina Faso, Burundi, Cambodia, Central Afri-can Republic, Chad, Comoros, Democratic People’s Republic of Korea, Democratic Republic of the Congo, Eritrea, Ethiopia, Gambia, Guinea, Guinea-Bissau, Haiti, Kenya, Kyrgyzstan, Liberia, Madagascar, Malawi, Mali, Mozambique, Myanmar, Nepal, Niger, Rwanda, Sierra Leone, Soma-lia, Tajikistan, Togo, Uganda, United Republic of Tanzania, Zimbabwe.
Lower middle income: Angola, Armenia, Belize, Bhutan, Bolivia (Plurinational State of), Cam-eroon, Cape Verde, Congo, Côte d’Ivoire, Djibouti, Egypt, El Salvador, Fiji, Georgia, Ghana, Guatemala, Guyana, Honduras, India, Indonesia, Iraq, Kiribati, Lao People’s Democratic Repub-lic, Lesotho, Marshall Islands, Mauritania, Micronesia (Federated States of), Mongolia, Morocco, Nicaragua, Nigeria, Pakistan, Papua New Guinea, Paraguay, Philippines, Republic of Moldova, Samoa, Sao Tome and Principe, Senegal, Solomon Islands, Sri Lanka, Sudan, Swaziland, Syr-ian Arab Republic, Timor-Leste, Tonga, Turkmenistan, Tuvalu, Ukraine, Uzbekistan, Vanuatu, Viet Nam, Yemen, Zambia.
Upper middle income: Albania, Algeria, Antigua and Barbuda, Argentina, Azerbaijan, Belarus, Bosnia and Herzegovina, Botswana, Brazil, Bulgaria, Chile, China, Colombia, Cook Islands**, Costa Rica, Cuba, Dominica, Dominican Republic, Ecuador, Gabon, Grenada, Iran (Islamic Re-public of), Jamaica, Jordan, Kazakhstan, Latvia, Lebanon, Libya, Lithuania, Malaysia, Maldives, Mauritius, Mexico, Montenegro, Namibia, Nauru**, Niue**, Palau, Panama, Peru, Romania, Rus-sian Federation, Saint Kitts and Nevis, Saint Lucia, Saint Vincent and the Grenadines, Serbia, Seychelles, South Africa, Suriname, Thailand, The former Yugoslav Republic of Macedonia, Tunisia, Turkey, Uruguay, Venezuela (Bolivarian Republic of).
High income: Andorra, Australia, Austria, Bahamas, Bahrain, Barbados, Belgium, Brunei Da-russalam, Canada, Croatia, Cyprus, Czech Republic, Denmark, Equatorial Guinea, Estonia, Finland, France, Germany, Greece, Hungary, Iceland, Ireland, Israel, Italy, Japan, Kuwait, Lux-embourg, Malta, Monaco, Netherlands, New Zealand, Norway, Oman, Poland, Portugal, Qatar, Republic of Korea, San Marino, Saudi Arabia, Singapore, Slovakia, Slovenia, Spain, Sweden, Switzerland, Trinidad and Tobago, United Arab Emirates, United Kingdom, United States of America.
2. World Bank list of economies (November 2011). Washington, DC, World Bank, 2011 (http://siteresources.worldbank.org/DATASTATISTICS/Resources/CLASS.XLS).
3. Member States marked with an ** have been classified into income groups using gross domestic product.
011010011001101001100110100110011010011001101001100110100110011010011010010110010111101010100101010100101100101111010101001010101001010010011010011001001101001100100110100110010011010011001001101001001010101001010101001010101001010101001010101001010101001010101001010101001010101001010101001010101001010101001010101001010101001101001100110100110011010011001101001100110100110011010011001101001101100010101100010101100010101100010101100010101100010101100010101011010011001101001100110100110011010011001101001100110100110011010010100101010010101011000100110100101010010101011000100110100101010010101010110001001101001101001011010100110001001101001101001011010100110001001100101111010010101001010010111101001010100101001011110100101010010100101011010011001101001100110100110011010011001101001100110100110011010010010100110100010100110100010100110100010100110100010100110100010100101101001100110100110011010011001101001100110100110011010011001101001111010010101001010111010010111101001010100101011101001011110100101010010101011010011001101001100110100110011010011001101001100110100110011010011001011110101010010110010111101010100101100101111010101001011001010110100110011010011001101001100110100110011010011001101001100110100101001011010000100101101000010010110100001001011010000100101101000010010101101001100110100110011010011001101001100110100110011010011001101001
0101011000100110100110100101101010101100010011010011010010110101010101101001100110100110011010011001101001100110100110011010011001101001101001011001011110101010010101010010110010111101010100101010100101001001101001100100110100110010011010011001001101001100100110100100101010100101010100101010100101010100101010100101010100101010100101010100101010100101010100101010100101010100101010100101010100110100110011010011001101001100110100110011010011001101001100110100110110001010110001010110001010110001010110001010110001010110001010101101001100110100110011010011001101001100110100110011010011001101001010010101001010101100010011010010101001010101100010011010010101001010101011000100110100110100101101010011000100110100110100101101010011000100110010111101001010100101001011110100101010010100101111010010101001010010101101001100110100110011010011001101001100110100110011010011001101001001010011010001010011010001010011010001010011010001010011010001010010110100110011010011001101001100110100110011010011001101001100110100111101001010100101011101001011110100101010010101110100101111010010101001010101101001100110100110011010011001101001100110100110011010011001101001100101111010101001011001011110101010010110010111101010100101100101
010010100110101010110010100101100101111010101001010100101010110001001

176


![[2] DISKUSI KETUJUH](https://img.dokumen.tips/doc/110x75/577cc2fe1a28aba71194f055/2-diskusi-ketujuh.jpg)