Embed Size (px)
Citation preview
STUDY OF FATIGUE IN WELDED JOINTS AND STRESS NOTCHES OF WAGON SERIES S(g)mmns WITH METHODS OF UIC AND DVS 1612
Assoc. Prof. Dr. Eng. Stoilov V., Ass. Prof. Eng. Slavchev S., Ass. Prof. Eng. Purgic S.
Technical University of Sofia, Faculty of Transport;
Abstract: This paper contains the results of the fatigue analysis of the wagon body, series S(g)mmns. The theoretical research has been performed using the Finite Elements Method. The software product SolidWorks has been used.
Sophisticated three-dimensional calculation models have been developed describing precisely the body geometry. In the process of creating the models the similarity of the results has been analyzed. This allows the development of the most suitable schemes with regard to visualization of the object geometry, input of the applied loads and reactions and obtaining precise enough results concerning the distribution of deformations, displacements and stresses.
Keywords: WAGON, STRENGTH, CALCULATIONS, FATIGUE
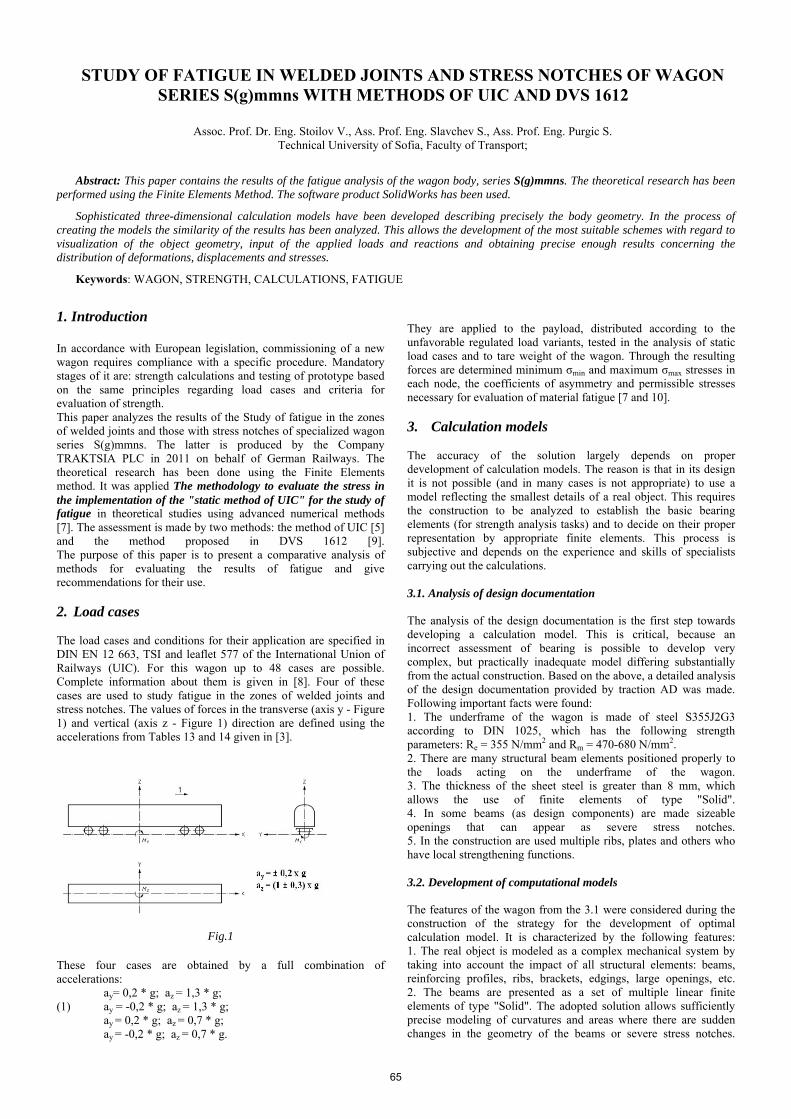
1. Introduction In accordance with European legislation, commissioning of a new wagon requires compliance with a specific procedure. Mandatory stages of it are: strength calculations and testing of prototype based on the same principles regarding load cases and criteria for evaluation of strength. This paper analyzes the results of the Study of fatigue in the zones of welded joints and those with stress notches of specialized wagon series S(g)mmns. The latter is produced by the Company TRAKTSIA PLC in 2011 on behalf of German Railways. The theoretical research has been done using the Finite Elements method. It was applied The methodology to evaluate the stress in the implementation of the "static method of UIC" for the study of fatigue in theoretical studies using advanced numerical methods [7]. The assessment is made by two methods: the method of UIC [5] and the method proposed in DVS 1612 [9]. The purpose of this paper is to present a comparative analysis of methods for evaluating the results of fatigue and give recommendations for their use. 2. Load cases The load cases and conditions for their application are specified in DIN EN 12 663, TSI and leaflet 577 of the International Union of Railways (UIC). For this wagon up to 48 cases are possible. Complete information about them is given in [8]. Four of these cases are used to study fatigue in the zones of welded joints and stress notches. The values of forces in the transverse (axis y - Figure 1) and vertical (axis z - Figure 1) direction are defined using the accelerations from Tables 13 and 14 given in [3].
Fig.1
These four cases are obtained by a full combination of accelerations:
ay= 0,2 * g; az = 1,3 * g; (1) ay = -0,2 * g; az = 1,3 * g;
ay = 0,2 * g; az = 0,7 * g; ay = -0,2 * g; az = 0,7 * g.
They are applied to the payload, distributed according to the unfavorable regulated load variants, tested in the analysis of static load cases and to tare weight of the wagon. Through the resulting forces are determined minimum σmin and maximum σmax stresses in each node, the coefficients of asymmetry and permissible stresses necessary for evaluation of material fatigue [7 and 10]. 3. Calculation models The accuracy of the solution largely depends on proper development of calculation models. The reason is that in its design it is not possible (and in many cases is not appropriate) to use a model reflecting the smallest details of a real object. This requires the construction to be analyzed to establish the basic bearing elements (for strength analysis tasks) and to decide on their proper representation by appropriate finite elements. This process is subjective and depends on the experience and skills of specialists carrying out the calculations. 3.1. Analysis of design documentation The analysis of the design documentation is the first step towards developing a calculation model. This is critical, because an incorrect assessment of bearing is possible to develop very complex, but practically inadequate model differing substantially from the actual construction. Based on the above, a detailed analysis of the design documentation provided by traction AD was made. Following important facts were found: 1. The underframe of the wagon is made of steel S355J2G3 according to DIN 1025, which has the following strength parameters: Re = 355 N/mm2 and Rm = 470-680 N/mm2. 2. There are many structural beam elements positioned properly to the loads acting on the underframe of the wagon. 3. The thickness of the sheet steel is greater than 8 mm, which allows the use of finite elements of type "Solid". 4. In some beams (as design components) are made sizeable openings that can appear as severe stress notches. 5. In the construction are used multiple ribs, plates and others who have local strengthening functions. 3.2. Development of computational models The features of the wagon from the 3.1 were considered during the construction of the strategy for the development of optimal calculation model. It is characterized by the following features: 1. The real object is modeled as a complex mechanical system by taking into account the impact of all structural elements: beams, reinforcing profiles, ribs, brackets, edgings, large openings, etc. 2. The beams are presented as a set of multiple linear finite elements of type "Solid". The adopted solution allows sufficiently precise modeling of curvatures and areas where there are sudden changes in the geometry of the beams or severe stress notches.
65

3. Sheet steel, ribs and reinforcement plates are modeled using finite elements such as "Solid". The reason for this is that their thickness is relatively large and in the presence of a relatively dense network it is possible to use 3D-finite elements. This approach does not contradict the theory of FEM and allows taking into account the carrying capacity of sheet steel in the perception of all internal efforts, typical for wagon structures. In order to optimize the calculation model, i.e. to assess to what extent should be increased the number of nodes and elements to obtain the most accurate results for stresses and deformations of the structure, convergence of the solution was studied. For this purpose the geometry of the underframe of the wagon was established, meeting the above characteristics. An initial network of finite elements was formed. The main parameters of the initial model are: number of finite elements 45 775 and number of nodes 84 438. To study convergence of solutions was developed second - complicated calculation model. Its network of finite elements was thickened and their number has increased about 7 times compared to the first network (577 176 nodes and 291 672 finite elements). Thus, the maximum linear dimension of the finite element does not exceed 52.6 mm, which reveals a great density of the analyzed variables. A detailed model is presented in [8]. After performing the calculations it was found, that the difference between the stresses in identical nodes of the two models is less than 1.54%, while the deformations it is up 1.01%. This gives grounds to conclude that the solution not converge and that both models are suitable for strength analysis of the underframeof specialized wagon. Based on the above conclusion was decided to use a more complex model, since it allows to obtain a more complete and accurate information on the distribution of stresses, displacements and deformations, as well as to study the influence of stress notches established using a simple model. In Figure 2 is shown a complex calculation model to analyze the strength of the underframe at the load cases from 2.
Fig. 2
To build a complete picture of the calculation model is appropriate to provide the necessary information for modeling the boundary conditions. In load cases for testing the fatigue, the forces acting on the wagon structure are the force from tare mass of the vehicle and the force from the payload. In modeling the tare mass there are two possible approaches: to set the tare mass as evenly distributed load acting on the entire surface of the underframe of the wagon or use the material characteristics. In this case, the first method was used to set the force from tare mass. When entering the force from the payload, the most difficult of vertical load cases was used, defined according to criteria maximum stresses and maximum displacements in the lower part of the frame. This load has been modeled (fig. 3) as an evenly distributed load, acting on the surface of the transom b-b, taken from the table of dimensions for distribution of the load on the underframe.
Transom b-b
Fig. 3
Limitations of the displacements are set in the area of centre pivots. Displacements along axes z and y are restricted (i.e., are equal to zero) for both centre pivots and along the longitudinal axis x are limited to one centre pivot - Fig.1. 4. Results of calculations Theoretical study of stresses was made with the Finite Element Method. In order to obtain the most accurate and comprehensive information and avoid subjectivity in selecting the assessed areas, Methodology for assessing stress in the implementation of the "static method of UIC" for the study of fatigue in theoretical studies using advanced numerical methods [7] was applied. The assessment was done by two methods:
- Method of UIC [5] - The method proposed in DVS 1612 [9].
The reason is that the German railways, for which the wagon is designed, have greater confidence in their own standard [9] and traditionally insist the evaluation to be done on it. The analysis of the calculation results is made depending on stress distribution in the individual beams under the most unfavorable combinations of load cases from 1. Solebar The evaluation is performed for all nodes of the solebar. Ten nodes with the lowest values of safety factor are shown in Table 1.
Fig. 4
66

Table 1 N
ode
+0.
2y ;0
.7z
-0.2
y ;0
.7z
+0.
2y ;1
.3z
-0.2
y ;1
.3z
Ϭm
in
Ϭm
ax
S=
Ϭm
in/Ϭ
max
Ϭzu
l DV
S 1
612,
Lin
e E
1,N
o 3.
3
Ks=
Ϭzu
l/Ϭ
max
Ϭzu
l ER
RI
B12
/RP
17
App
endi
x H
3
Ks=
Ϭzu
l/Ϭ
max
№ (MPa) (MPa) (MPa) (MPa) (MPa) (MPa) - (MPa) - (MPa) -
169018 124.6 114.4 213.9 203.7 114.4 213.9 0.53 216 1.01 217 1.01
181797 124.2 110.2 212 198 110.2 212.0 0.52 216 1.02 217 1.02
168317 121.7 118.8 211.7 208.8 118.8 211.7 0.56 216 1.02 217 1.02
154872 121.4 116 210.3 205 116.0 210.3 0.55 216 1.03 217 1.03
149720 121.8 112.9 209.6 200.7 112.9 209.6 0.54 216 1.03 217 1.03
181579 119.7 117.3 208.9 206.6 117.3 208.9 0.56 216 1.03 217 1.03
181894 117.9 119.1 207.3 208.5 117.9 208.5 0.57 216 1.04 217 1.04
177184 119.8 116.3 208.1 204.7 116.3 208.1 0.56 216 1.04 217 1.04
181516 119.2 116.3 207.8 204.9 116.3 207.8 0.56 216 1.04 217 1.04
166139 120.2 113.2 207.7 200.6 113.2 207.7 0.55 216 1.04 217 1.04
The lowest safety factor is obtained in node 169018. Maximum stresses in node are 213.9 MPa (Fig. 4 and Table 1) and minimum 114.4 MPa. Body bolster The evaluation is performed for all nodes of the body bolster. Ten nodes with the lowest values of safety factor are shown in Table 2. Table 2
Nod
e
+0.
2y ;0
.7z
-0.2
y ;0
.7z
+0.
2y ;1
.3z
-0.2
y ;1
.3z
Ϭm
in
Ϭm
ax
S=
Ϭm
in/Ϭ
max
Ϭzu
l D
VS
161
2,
L
ine
E1,
No
3.3
Ks=
Ϭzu
l/Ϭ
max
Ϭzu
l ER
RI
B12
/RP
17
App
endi
x H
3
Ks=
Ϭzu
l/Ϭ
max
Nr. (MPa) (MPa) (MPa) (MPa) (MPa) (MPa) - (MPa) - (MPa) -
287532 148.5 121.7 240.4 213.7 121.7 240.4 0.51 240 1.00 243 1.01
280678 143.2 139.1 239.6 235.4 139.1 239.6 0.58 240 1.00 243 1.01
287427 146.7 119.9 237.6 210.8 119.9 237.6 0.50 240 1.01 243 1.02
279228 142 136.9 237.4 232.3 136.9 237.4 0.58 240 1.01 243 1.02
280470 140.2 140.3 231.7 231.7 140.2 231.7 0.61 240 1.04 243 1.05
280699 138.4 128.6 229.6 219.7 128.6 229.6 0.56 240 1.05 243 1.06
287433 140.8 115.2 228.1 202.6 115.2 228.1 0.51 240 1.05 243 1.07
280702 137.4 127.5 227.9 218 127.5 227.9 0.56 240 1.05 243 1.07
280643 136.7 137.3 225.8 226.3 136.7 226.3 0.60 240 1.06 243 1.07
280745 135.5 128.6 225.6 218.8 128.6 225.6 0.57 240 1.06 243 1.08
The lowest safety factor is obtained in node 287532. Maximum stresses in node are 240.4 MPa (Fig. 5 and Table 2), and minimum 121.7 MPa.
Fig. 5
Transom а-а The evaluation is performed for all nodes of the transom а-а. Ten nodes with the lowest values of safety factor are shown in Table 3. Table 3
Nod
e
+0.
2y ;0
.7z
-0.2
y ;0
.7z
+0.
2y ;1
.3z
-0.2
y ;1
.3z
Ϭm
in
Ϭm
ax
S=
Ϭm
in/Ϭ
max
Ϭzu
l D
VS
161
2,
L
ine
E1,
No
3.3
Ks=
Ϭzu
l/Ϭ
max
Ϭzu
l ER
RI
B12
/RP
17
App
endi
x H
3
Ks=
Ϭzu
l/Ϭ
max
Nr. (MPa) (MPa) (MPa) (MPa) (MPa) (MPa) - (MPa) - (MPa) -
23247 79.8 95.6 148.6 164.4 79.8 164.4 0.49 216 1.31 217 1.32
23351 92.2 77.4 157.7 142.9 77.4 157.7 0.49 216 1.37 217 1.38
23215 77.2 90.5 142.5 155.8 77.2 155.8 0.50 216 1.39 217 1.3923219 75.7 90.5 140.9 155.8 75.7 155.8 0.49 216 1.39 217 1.3923246 75.1 88.5 138.9 152.3 75.1 152.3 0.49 216 1.42 217 1.4223214 74.1 88 137.6 151.4 74.1 151.4 0.49 216 1.43 217 1.4323373 88.6 73.8 151.4 136.7 73.8 151.4 0.49 216 1.43 217 1.4323347 84.9 70.3 144.9 130.3 70.3 144.9 0.49 216 1.49 217 1.5014865 72.9 73.4 130.3 130.8 72.9 130.8 0.56 216 1.65 217 1.6623272 62.2 74.8 115.9 128.5 62.2 128.5 0.48 216 1.68 217 1.69 The lowest safety factor is obtained in node 23247. Maximum stresses in node are 164.4 MPa (Fig. 6 and Table 3), and minimum 79.9 MPa.
Fig. 6
Transom b-b The evaluation is performed for all nodes of the transom b-b. Ten nodes with the lowest values of safety factor are shown in Table 4.
67

Table 4 N
ode
+0.
2y ;0
.7z
-0.2
y ;0
.7z
+0.
2y ;1
.3z
-0.2
y ;1
.3z
Ϭm
in
Ϭm
ax
S=
Ϭm
in/Ϭ
max
Ϭzu
l D
VS
161
2,
L
ine
E1,
No
3.3
Ks=
Ϭzu
l/Ϭ
max
Ϭzu
l ER
RI
B12
/RP
17
App
endi
x H
3
Ks=
Ϭzu
l/Ϭ
max
Nr. (MPa) (MPa) (MPa) (MPa) (MPa) (MPa) - (MPa) - (MPa) - 3781 90.7 65.6 152.6 127.4 65.6 152.6 0.43 203.60 1.33 180 1,183790 88 61.9 147.2 121.1 61.9 147.2 0.42 200.96 1.37 180 1,223777 82.6 55.7 137 110 55.7 137 0.41 197.17 1.44 180 1,3114784 73.3 80.5 134.9 142.1 73.3 142.1 0.52 216.00 1.52 217 1,5323243 68 25.7 106.4 64 25.7 106.4 0.24 162.97 1.53 150 1,4115695 68.6 80.5 128.6 140.5 68.6 140.5 0.49 216.00 1.54 217 1,5423714 74.6 73.3 130.4 128.7 73.3 130.4 0.56 216.00 1.66 217 1,666304 72.1 50.8 120.1 98.8 50.8 120.1 0.42 201.65 1.68 180 1,5023639 65.4 74.7 117.3 126.5 65.4 126.5 0.52 216.00 1.71 217 1,7223222 60.9 22.7 95 56.7 22.7 95 0.24 162.55 1.71 150 1,58 The lowest safety factor is obtained in node 3781. Maximum stresses in node are 152.6 MPa (Fig. 7 and Table 4), and minimum 65.6 MPa.
Fig. 7
Transom с-с The evaluation is performed for all nodes of the transom c-c. Ten nodes with the lowest values of safety factor are shown in Table 5. Table 5
Nod
e
+0.
2y ;0
.7z
-0.2
y ;0
.7z
+0.
2y ;1
.3z
-0.2
y ;1
.3z
Ϭm
in
Ϭm
ax
S=
Ϭm
in/Ϭ
max
Ϭzu
l
DV
S 1
612,
Lin
e E
1,N
o 3.
3
Ks=
Ϭzu
l/Ϭ
max
Ϭzu
l ER
RI
B12
/RP
17
App
endi
x H
3
Ks=
Ϭzu
l/Ϭ
max
Nr. (MPa) (MPa) (MPa) (MPa) (MPa) (MPa) - (MPa) - (MPa) - 6449 26.6 69.5 60.8 104.1 26.6 104.1 0.26 165.28 1.59 150 1,446300 28.1 64.4 61.8 98.2 28.1 98.2 0.29 170.66 1.74 150 1,536301 26.6 60 56.4 90.5 26.6 90.5 0.29 172.10 1.90 150 1,664484 13.2 54.7 5.5 72.9 5.5 72.9 0.08 140.88 1.93 130 1,784469 11.1 56.9 11.2 76.8 11.1 76.8 0.14 149.02 1.94 135 1,764473 16.6 52.3 2.9 68.6 2.9 68.6 0.04 137.38 2.00 130 1,907975 15.8 48.2 39.9 72.4 15.8 72.4 0.22 159.30 2.2 145 2,007671 42.2 6.8 61.3 25.3 6.8 61.3 0.11 144.90 2.36 135 2,2018123 57.2 35.4 84.2 57.8 35.4 84.2 0.42 200.93 2.39 180 2,147843 40.8 5.4 59.2 23.7 5.4 59.2 0.09 142.63 2.41 135 2,28
The lowest safety factor is obtained in node 6449. Maximum stresses in node are 104.1 MPa (Fig. 8 and Table 5), and minimum 26.6 MPa.
Fig. 8
Transom d-d The evaluation is performed for all nodes of the transom d-d. Ten nodes with the lowest values of safety factor are shown in Table 6. Table 6
Nod
e
+0.
2y ;0
.7z
-0.2
y ;0
.7z
+0.
2y ;1
.3z
-0.2
y ;1
.3z
Ϭm
in
Ϭm
ax
S=
Ϭm
in/Ϭ
max
Ϭzu
l D
VS
161
2,
Lin
e E
1,N
o 3.
3
Ks=
Ϭzu
l/Ϭ
max
Ϭzu
l ER
RI
B12
/RP
17
App
endi
x H
3
Ks=
Ϭzu
l/Ϭ
max
Nr. (MPa) (MPa) (MPa) (MPa) (MPa) (MPa) - (MPa) - (MPa) -
7643 11.6 65 37.7 92.2 11.6 92.2 0.13 146.69 1.59 135 1,46
7798 14.1 62.7 39.9 89.8 14.1 89.8 0.16 150.64 1.68 135 1,50
4007 59.6 19.8 75.2 8.5 8.5 75.2 0.11 145.15 1.93 135 1,80
7647 16.6 55.9 40.1 80.8 16.6 80.8 0.21 157.38 1.95 145 1,79
4031 57.3 19.1 72.3 7.5 7.5 72.3 0.10 144.06 1.99 135 1,87
2445 16.1 57.4 7.4 70.4 7.4 70.4 0.11 144.22 2.05 135 1,92
2449 12 55.4 6.6 69.2 6.6 69.2 0.10 143.10 2.07 135 1,95
9025 51.5 20.7 77.9 46.4 20.7 77.9 0.27 167.02 2.14 150 1,93
4002 52.5 17 66.6 7.4 7.4 66.6 0.11 144.92 2.18 135 2,03
2440 7.8 52 9.3 66.3 7.8 66.3 0.12 145.70 2.20 135 2,04
The lowest safety factor is obtained in node 7643. Maximum stresses in node are 92.2 MPa (Fig. 9 and Table 6), and minimum 11.6 MPa.
Fig. 9
68

5. Conclusion Summarizing the overall work on this study, the following conclusions can be made: 1. Accurate calculation models for strength analysis of bearing structure of specialized wagon Series S(g)mmns has been developed. 2. Convergence of the solution was studied and theoretically was found that the proposed models are suitable for testing underframe of wagons in this series. An optimal balance between a relatively small number of finite elements and the accuracy of the results for testing the distribution of stresses and displacements in the structure was achieved. 3. Safety factors for all nodes of the flat wagons underframe are larger than 1. Therefore, in them is not expected the occurrence of the phenomenon of fatigue, including areas of welds. 4. The comparative analysis of data from theoretical research with methodologies of UIC and DVS 1612 for fatigue testing, confirms the very good results matching for safety factors. Further analysis of the data from Tables 1-6 allows you to identify areas of applicability of the two methods. They depend on the values of the asymmetry factor S = Ϭ min / Ϭ max:
- For values of S ≥ 0.48 safety factors Ks = Ϭ zul / Ϭ max, determined by both methods practically coincide. This allows the study of fatigue to be performed with equal success in both methods. The application of one or the other method depends on the experience and tradition of the team conducting the study. - For values of S <0.48 safety factors Ks = Ϭ zul / Ϭ max, defined with DVS-method are higher than those obtained with the method of UIC with up to 5.7% - 14.5%. The reason for this is that in the DVS-method 17 curves are used (with analytical solution - 17 functional dependencies) for determining permissible fatigue stresses, depending on the specific design solution, type of welded joints and their control.
On the other hand in UIC-method are used only three consolidated curves (functional dependencies). This decreases the values of permissible fatigue stresses and excessive resizes wagon design.
Finally, it can be concluded, that for the fatigue study of new designed wagons is appropriate to use the methodology proposed in the German standard DVS 1612.
BIBLIOGRAPHY
[1] DIN EN 12663:2000. [2] DIN EN 12663-1:2010 [3] DIN EN 12663-2:2010 [4] TSI–Rolling stock - freight wagons, 28.06.2006. [5] ERRI B12/ RP17 8th Edition of April 1996 [6] Dimitrov Zh., Reliability of railway vehicles, Sofia, 1988. [7] Slavchev S., V. Stoilov. Methods for evaluation of stresses in
the implementation of the "static method of UIC" for the study of fatigue with use of numerical methods. Sozopol, BULTRANS-2011
[8] Report on Contract 3/2011. Strength analysis of wagon S(g) mmns. TU-Sofia, 2011.
[9] DVS 1612:2009. [10] Slavchev S., V. Stoilov. Application of the methodology for
evaluation of stresses using numerical method. Sozopol, BULTRANS-2011.
[11] Kralov, Iv., G. Polihronov, D. Atanasov. Influence of boundary conditions on the eigenfrequencies of thin ribbed membranes, TRANS & MOTAUTO `06, Varna, 2006.
[12] Nedelchev, K., G. Polihronov, Iv. Kralov. Synthesis of mass and inertial parameters of the additional mass to maximize amending of certain eigenfrequencies of thin plates. TRANS & MOTAUTO `08, Sozopol, 2008.
69


![IIW-Recommendations for Fatigue Design of Welded Joints and Components[1]](https://img.dokumen.tips/doc/110x75/5571ff7949795991699d5428/iiw-recommendations-for-fatigue-design-of-welded-joints-and-components1.jpg)