Embed Size (px)
Citation preview
Fatigue failure analysis of fillet welded joints used in offshore structures Master’s Thesis in the International Master’s Programme Naval Architecture and Ocean Engineering
DJAN EIRIK DJAVIT AND ERIK STRANDE Department of Shipping and Marine Technology Division of Marine Design, Research Group Marine Structures CHALMERS UNIVERSITY OF TECHNOLOGY Göteborg, Sweden 2013 Master’s Thesis X-13/294

MASTER’S THESIS IN THE INTERNATIONAL MASTER’S PROGRAMME IN NAVAL ARCHITECTURE AND OCEAN ENGINEERING
Fatigue failure analysis of fillet welded joints used in offshore structures
DJAN EIRIK DJAVIT AND ERIK STRANDE
Department of Shipping and Marine Technology Division of Marine Design
Research Group Marine Structures CHALMERS UNIVERSITY OF TECHNOLOGY
Göteborg, Sweden 2013
Fatigue failure analysis of fillet welded joints used in offshore structures DJAN EIRIK DJAVIT AND ERIK STRANDE
© DJAN EIRIK DJAVIT AND ERIK STRANDE 2013
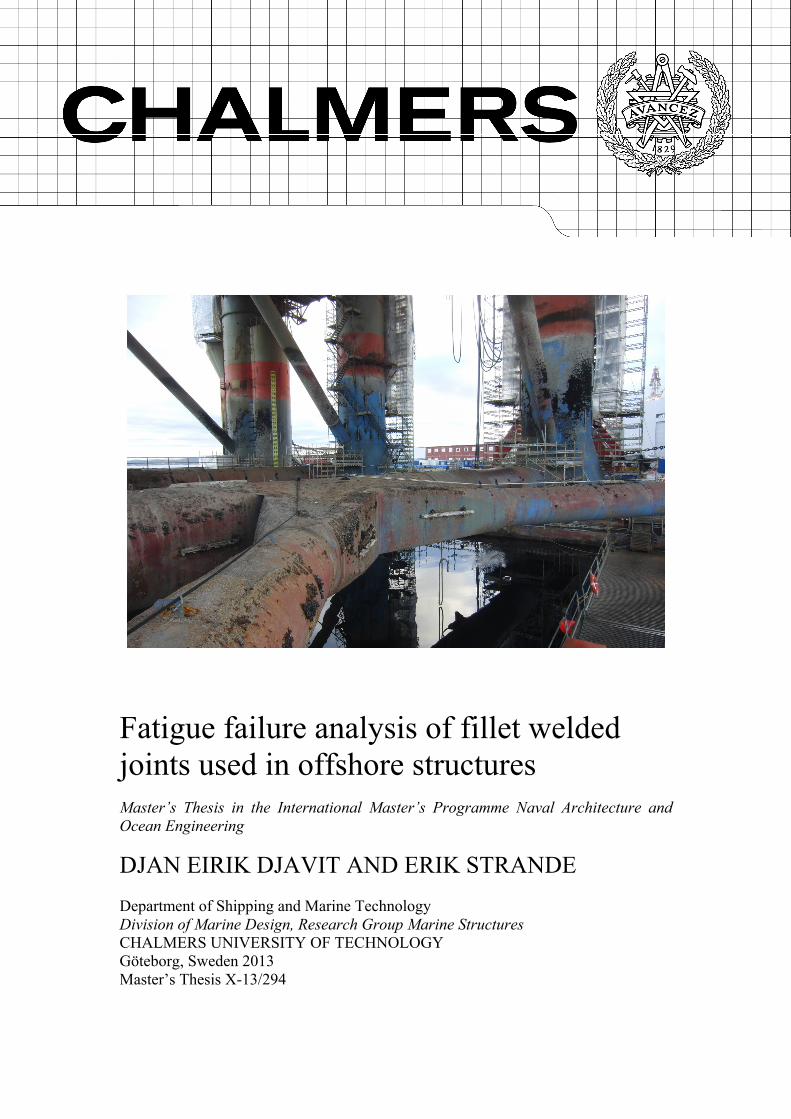
Master’s Thesis X-13/294 ISSN 1652-8557 Department of Shipping and Marine Technology Division of Marine Design Research Group Marine Structures Chalmers University of Technology SE-412 96 Göteborg Sweden Telephone: + 46 (0)31-772 1000 Cover: K-joint from Songa Trym Printed by Chalmers Reproservice Göteborg, Sweden 2013
CHALMERS, Shipping and Marine Technology, Master’s Thesis X-13/294 I
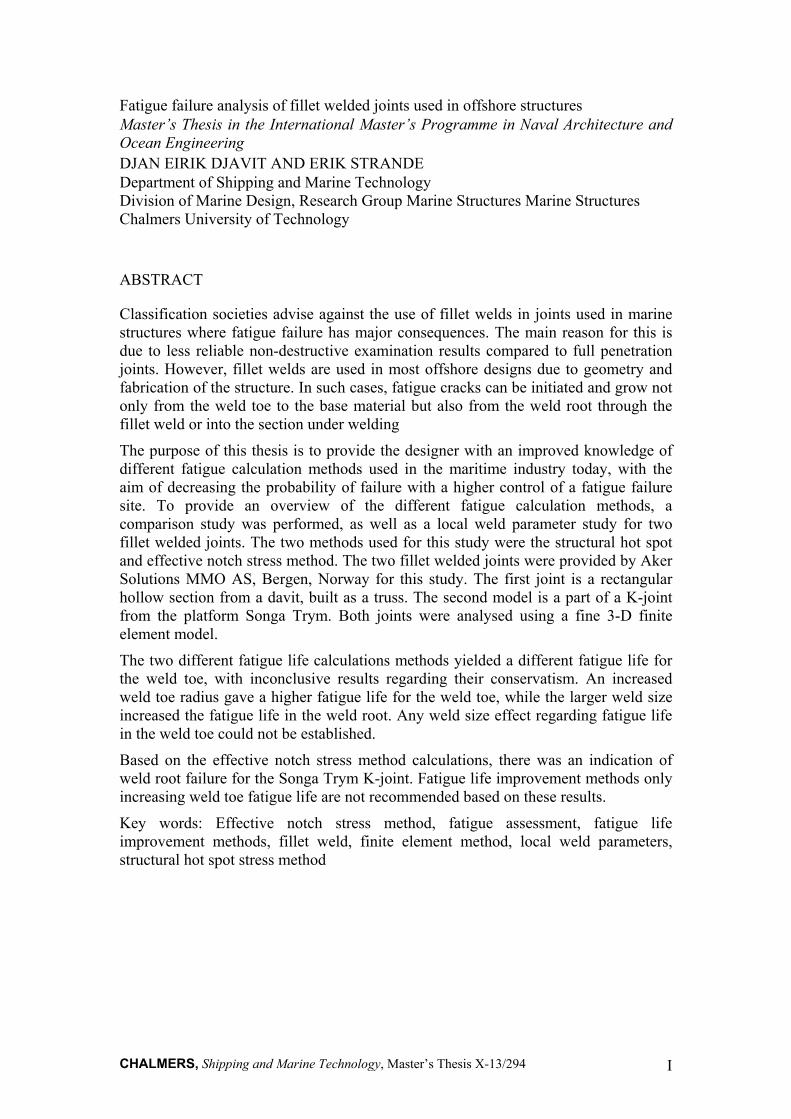
Fatigue failure analysis of fillet welded joints used in offshore structures Master’s Thesis in the International Master’s Programme in Naval Architecture and Ocean Engineering DJAN EIRIK DJAVIT AND ERIK STRANDE Department of Shipping and Marine Technology Division of Marine Design, Research Group Marine Structures Marine Structures Chalmers University of Technology
ABSTRACT
Classification societies advise against the use of fillet welds in joints used in marine structures where fatigue failure has major consequences. The main reason for this is due to less reliable non-destructive examination results compared to full penetration joints. However, fillet welds are used in most offshore designs due to geometry and fabrication of the structure. In such cases, fatigue cracks can be initiated and grow not only from the weld toe to the base material but also from the weld root through the fillet weld or into the section under welding
The purpose of this thesis is to provide the designer with an improved knowledge of different fatigue calculation methods used in the maritime industry today, with the aim of decreasing the probability of failure with a higher control of a fatigue failure site. To provide an overview of the different fatigue calculation methods, a comparison study was performed, as well as a local weld parameter study for two fillet welded joints. The two methods used for this study were the structural hot spot and effective notch stress method. The two fillet welded joints were provided by Aker Solutions MMO AS, Bergen, Norway for this study. The first joint is a rectangular hollow section from a davit, built as a truss. The second model is a part of a K-joint from the platform Songa Trym. Both joints were analysed using a fine 3-D finite element model.
The two different fatigue life calculations methods yielded a different fatigue life for the weld toe, with inconclusive results regarding their conservatism. An increased weld toe radius gave a higher fatigue life for the weld toe, while the larger weld size increased the fatigue life in the weld root. Any weld size effect regarding fatigue life in the weld toe could not be established.
Based on the effective notch stress method calculations, there was an indication of weld root failure for the Songa Trym K-joint. Fatigue life improvement methods only increasing weld toe fatigue life are not recommended based on these results.
Key words: Effective notch stress method, fatigue assessment, fatigue life improvement methods, fillet weld, finite element method, local weld parameters, structural hot spot stress method

CHALMERS, Shipping and Marine Technology, Master’s Thesis X-13/294 II
CHALMERS, Shipping and Marine Technology, Master’s Thesis X-13/294 III
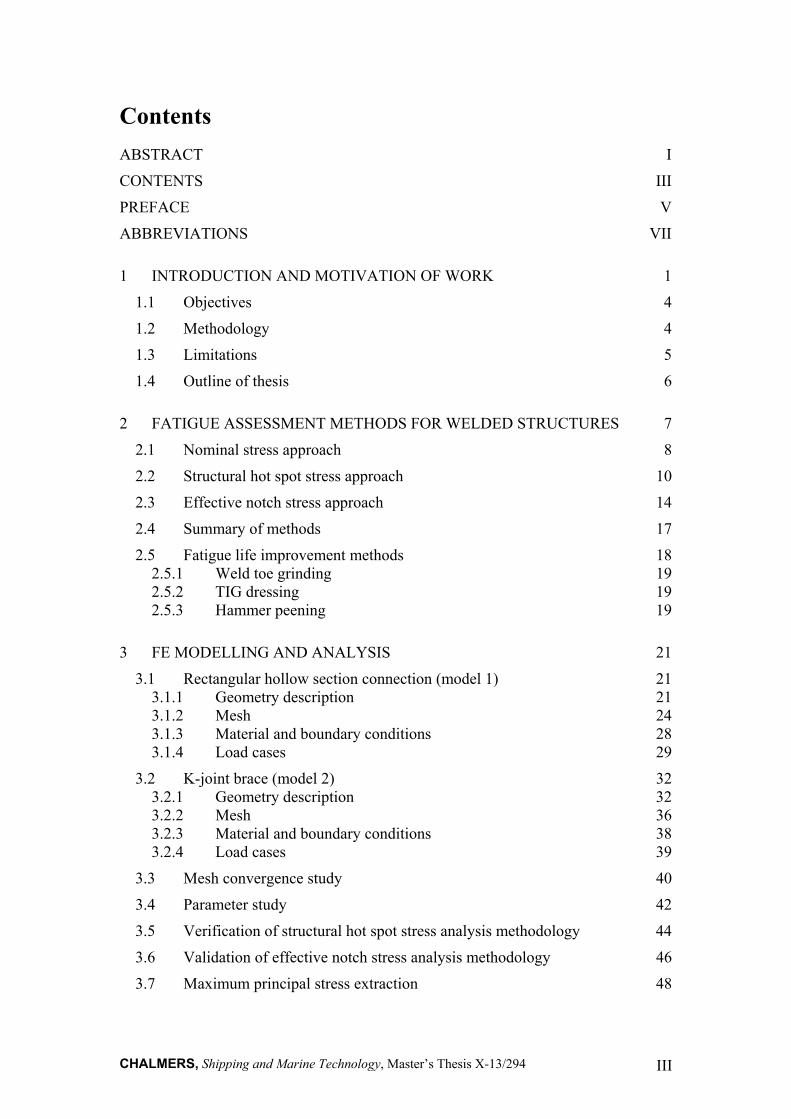
Contents
ABSTRACT I
CONTENTS III
PREFACE V
ABBREVIATIONS VII
1 INTRODUCTION AND MOTIVATION OF WORK 1
1.1 Objectives 4
1.2 Methodology 4
1.3 Limitations 5
1.4 Outline of thesis 6
2 FATIGUE ASSESSMENT METHODS FOR WELDED STRUCTURES 7
2.1 Nominal stress approach 8
2.2 Structural hot spot stress approach 10
2.3 Effective notch stress approach 14
2.4 Summary of methods 17
2.5 Fatigue life improvement methods 18 2.5.1 Weld toe grinding 19 2.5.2 TIG dressing 19 2.5.3 Hammer peening 19
3 FE MODELLING AND ANALYSIS 21
3.1 Rectangular hollow section connection (model 1) 21 3.1.1 Geometry description 21 3.1.2 Mesh 24 3.1.3 Material and boundary conditions 28 3.1.4 Load cases 29
3.2 K-joint brace (model 2) 32 3.2.1 Geometry description 32 3.2.2 Mesh 36 3.2.3 Material and boundary conditions 38 3.2.4 Load cases 39
3.3 Mesh convergence study 40
3.4 Parameter study 42
3.5 Verification of structural hot spot stress analysis methodology 44
3.6 Validation of effective notch stress analysis methodology 46
3.7 Maximum principal stress extraction 48
CHALMERS, Shipping and Marine Technology, Master’s Thesis X-13/294 IV
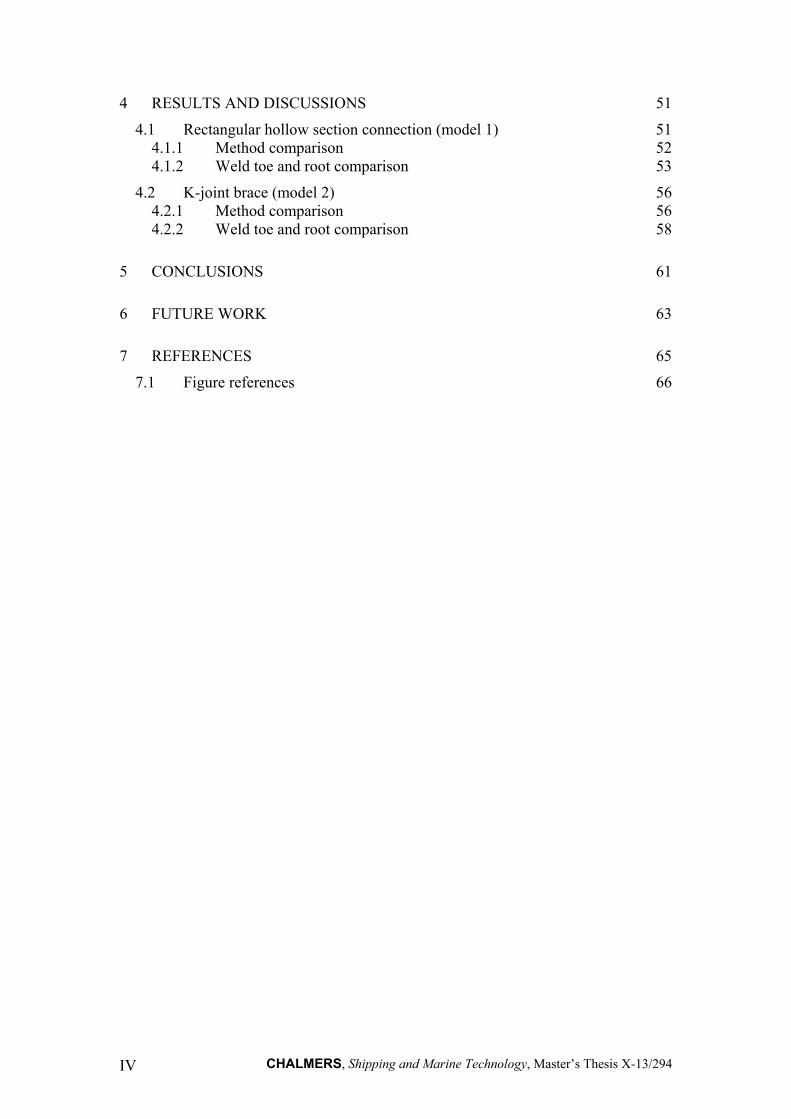
4 RESULTS AND DISCUSSIONS 51
4.1 Rectangular hollow section connection (model 1) 51 4.1.1 Method comparison 52 4.1.2 Weld toe and root comparison 53
4.2 K-joint brace (model 2) 56 4.2.1 Method comparison 56 4.2.2 Weld toe and root comparison 58
5 CONCLUSIONS 61
6 FUTURE WORK 63
7 REFERENCES 65
7.1 Figure references 66

CHALMERS, Shipping and Marine Technology, Master’s Thesis X-13/294 V
Preface
This thesis is a part of the requirements for the master’s degree in Naval Architecture and Ocean Engineering at Chalmers University of Technology, Göteborg, Sweden, and has been carried out at the Division of Marine Design, Department of Shipping and Marine Technology, Chalmers University of Technology between January and June of 2013.
We would like to acknowledge and thank our examiner and supervisor, Professor Jonas Ringsberg at the Department of Shipping and Marine Technology and Dr. Majid Anvari at Aker Solutions MMO AS, Bergen, Norway, for their excellent guidance and support throughout the work with this thesis. We would also like to thank Roger Hilmarsen Rong at Aker Solutions MMO AS, Bergen, for all his help with all practical matters during our work, and PhD student Zhiyuan Li for his contribution to the report.
Göteborg, June, 2013
Djan Eirik Djavit and Erik Strande

CHALMERS, Shipping and Marine Technology, Master’s Thesis X-13/294 VI
CHALMERS, Shipping and Marine Technology, Master’s Thesis X-13/294 VII
Abbreviations
CAD – Computer-aided design
DNV – Det Norske Veritas
FE – Finite Element
FEA – Finite Element Analysis
FEM – Finite Element Method
IIW – International Institute of Welding
LC1 – Load case 1
LC2 – Load case 2
LC3 – Load case 3
LSE – Linear Surface Extrapolation
N – Number of cycles to failure
SHSS – Structural Hot Spot Stress
RC – Real case
RHS – Rectangular hollow section
S – Stress range
TTWT – Through Thickness at Weld Toe
CHALMERS, Shipping and Marine Technology, Master’s Thesis X-13/294 VIII
Nomenclature
Symbol Unit Definition
A mm2 Cross section area
F N Force
FAT MPa Fatigue strength at 6102 cycles
yf - Characteristic yield strength
fK - Stress concentration
m - Slope exponent of S-N curve, normally 3 for steel
N - Number of cycles until failure
R - Stress ratio,
max
min
s - Factor for stress multiaxiality and strength criterion
t mm Thickness
w mm Longitudinal attachment thickness
x mm Distance from plate surface
mm Real notch radius
mm Substitute micro-structural length
f mm Fictitious radius
bending MPa Bending stress
hotspot MPa Hot spot stress
membrane MPa Membrane stress
n MPa Nominal stress
nlp MPa Non-linear stress peak
maxk MPa Maximum notch stress
CHALMERS, Shipping and Marine Technology, Master’s Thesis X-13/294 1
1 Introduction and motivation of work
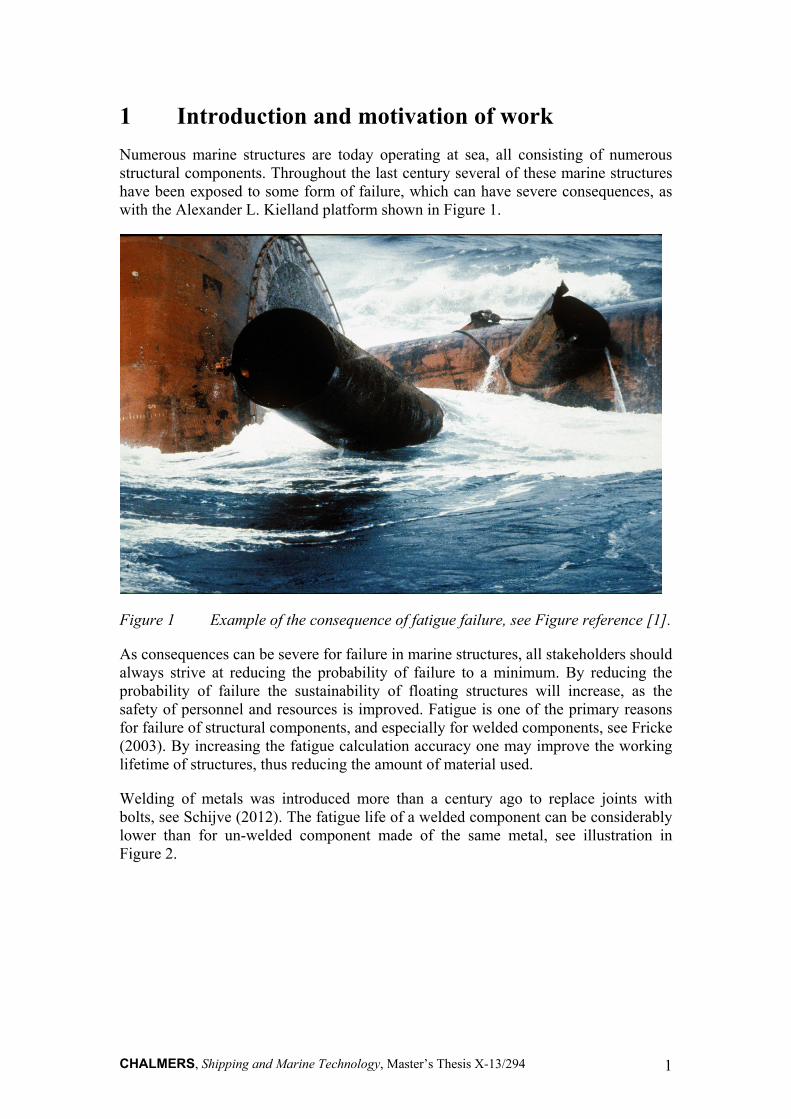
Numerous marine structures are today operating at sea, all consisting of numerous structural components. Throughout the last century several of these marine structures have been exposed to some form of failure, which can have severe consequences, as with the Alexander L. Kielland platform shown in Figure 1.
Figure 1 Example of the consequence of fatigue failure, see Figure reference [1].
As consequences can be severe for failure in marine structures, all stakeholders should always strive at reducing the probability of failure to a minimum. By reducing the probability of failure the sustainability of floating structures will increase, as the safety of personnel and resources is improved. Fatigue is one of the primary reasons for failure of structural components, and especially for welded components, see Fricke (2003). By increasing the fatigue calculation accuracy one may improve the working lifetime of structures, thus reducing the amount of material used.
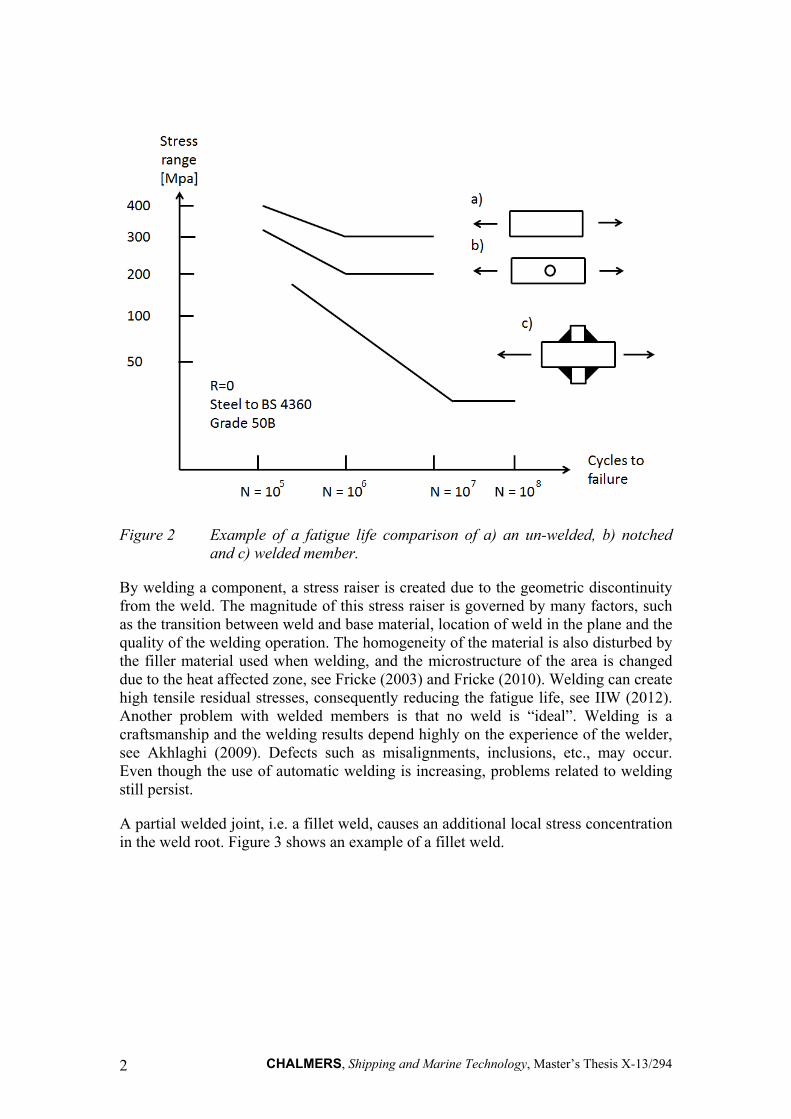
Welding of metals was introduced more than a century ago to replace joints with bolts, see Schijve (2012). The fatigue life of a welded component can be considerably lower than for un-welded component made of the same metal, see illustration in Figure 2.
CHALMERS, Shipping and Marine Technology, Master’s Thesis X-13/294 2
Figure 2 Example of a fatigue life comparison of a) an un-welded, b) notched and c) welded member.
By welding a component, a stress raiser is created due to the geometric discontinuity from the weld. The magnitude of this stress raiser is governed by many factors, such as the transition between weld and base material, location of weld in the plane and the quality of the welding operation. The homogeneity of the material is also disturbed by the filler material used when welding, and the microstructure of the area is changed due to the heat affected zone, see Fricke (2003) and Fricke (2010). Welding can create high tensile residual stresses, consequently reducing the fatigue life, see IIW (2012). Another problem with welded members is that no weld is “ideal”. Welding is a craftsmanship and the welding results depend highly on the experience of the welder, see Akhlaghi (2009). Defects such as misalignments, inclusions, etc., may occur. Even though the use of automatic welding is increasing, problems related to welding still persist.
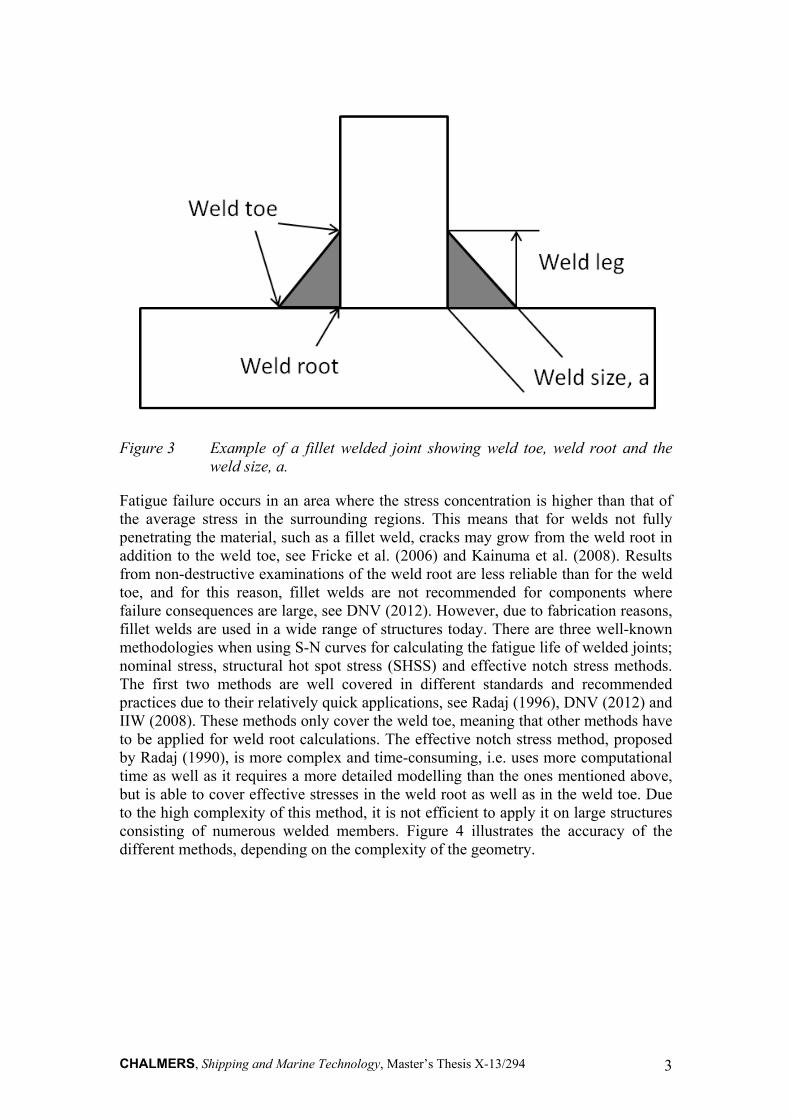
A partial welded joint, i.e. a fillet weld, causes an additional local stress concentration in the weld root. Figure 3 shows an example of a fillet weld.
CHALMERS, Shipping and Marine Technology, Master’s Thesis X-13/294 3
Figure 3 Example of a fillet welded joint showing weld toe, weld root and the weld size, a.
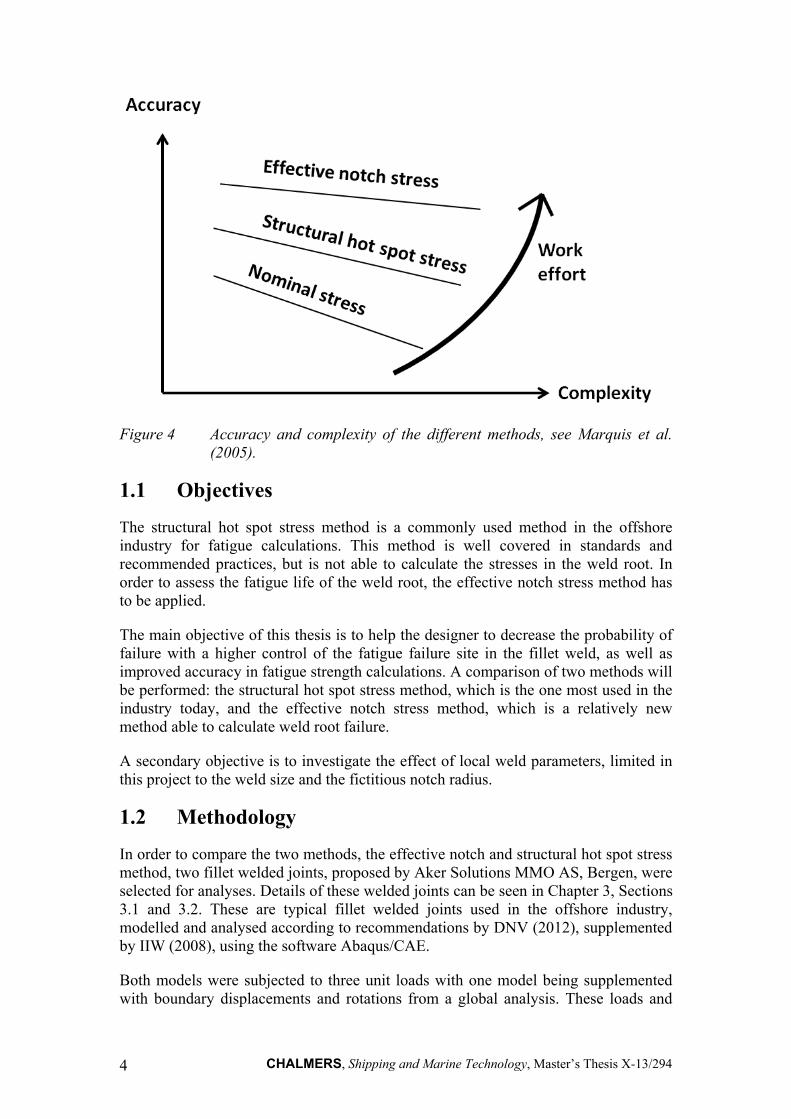
Fatigue failure occurs in an area where the stress concentration is higher than that of the average stress in the surrounding regions. This means that for welds not fully penetrating the material, such as a fillet weld, cracks may grow from the weld root in addition to the weld toe, see Fricke et al. (2006) and Kainuma et al. (2008). Results from non-destructive examinations of the weld root are less reliable than for the weld toe, and for this reason, fillet welds are not recommended for components where failure consequences are large, see DNV (2012). However, due to fabrication reasons, fillet welds are used in a wide range of structures today. There are three well-known methodologies when using S-N curves for calculating the fatigue life of welded joints; nominal stress, structural hot spot stress (SHSS) and effective notch stress methods. The first two methods are well covered in different standards and recommended practices due to their relatively quick applications, see Radaj (1996), DNV (2012) and IIW (2008). These methods only cover the weld toe, meaning that other methods have to be applied for weld root calculations. The effective notch stress method, proposed by Radaj (1990), is more complex and time-consuming, i.e. uses more computational time as well as it requires a more detailed modelling than the ones mentioned above, but is able to cover effective stresses in the weld root as well as in the weld toe. Due to the high complexity of this method, it is not efficient to apply it on large structures consisting of numerous welded members. Figure 4 illustrates the accuracy of the different methods, depending on the complexity of the geometry.
CHALMERS, Shipping and Marine Technology, Master’s Thesis X-13/294 4
Figure 4 Accuracy and complexity of the different methods, see Marquis et al. (2005).
1.1 Objectives
The structural hot spot stress method is a commonly used method in the offshore industry for fatigue calculations. This method is well covered in standards and recommended practices, but is not able to calculate the stresses in the weld root. In order to assess the fatigue life of the weld root, the effective notch stress method has to be applied.
The main objective of this thesis is to help the designer to decrease the probability of failure with a higher control of the fatigue failure site in the fillet weld, as well as improved accuracy in fatigue strength calculations. A comparison of two methods will be performed: the structural hot spot stress method, which is the one most used in the industry today, and the effective notch stress method, which is a relatively new method able to calculate weld root failure.
A secondary objective is to investigate the effect of local weld parameters, limited in this project to the weld size and the fictitious notch radius.
1.2 Methodology
In order to compare the two methods, the effective notch and structural hot spot stress method, two fillet welded joints, proposed by Aker Solutions MMO AS, Bergen, were selected for analyses. Details of these welded joints can be seen in Chapter 3, Sections 3.1 and 3.2. These are typical fillet welded joints used in the offshore industry, modelled and analysed according to recommendations by DNV (2012), supplemented by IIW (2008), using the software Abaqus/CAE.
Both models were subjected to three unit loads with one model being supplemented with boundary displacements and rotations from a global analysis. These loads and
CHALMERS, Shipping and Marine Technology, Master’s Thesis X-13/294 5
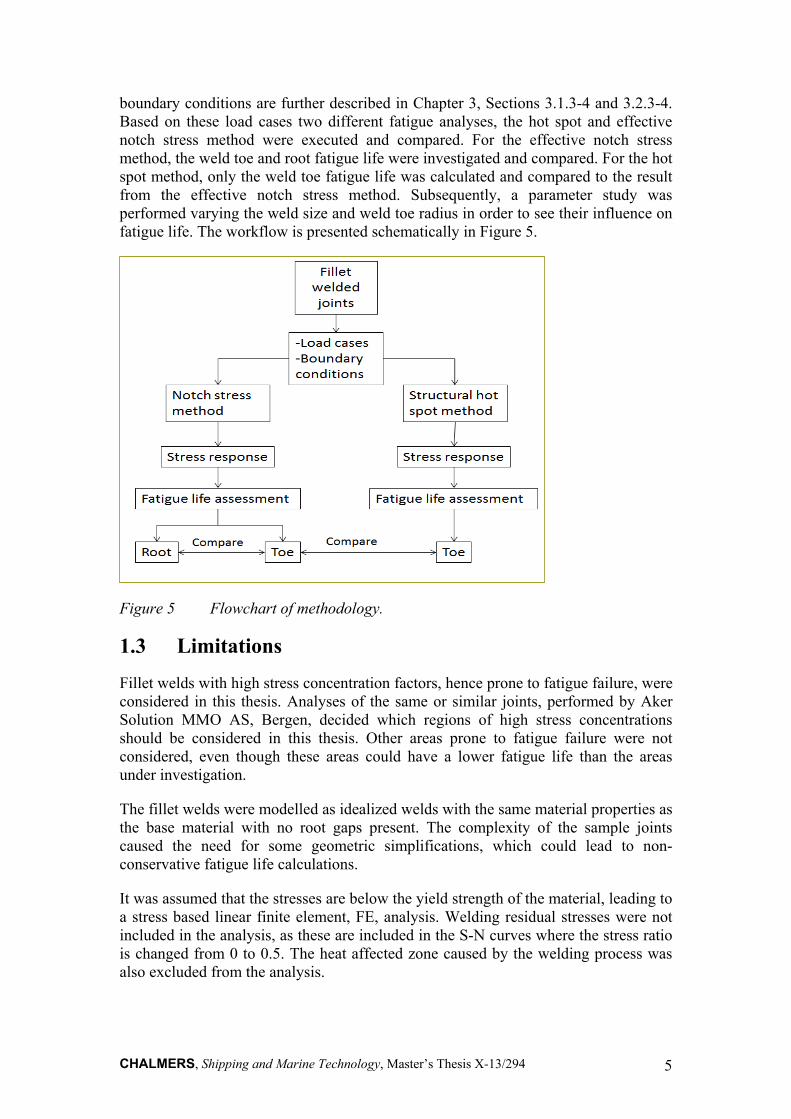
boundary conditions are further described in Chapter 3, Sections 3.1.3-4 and 3.2.3-4. Based on these load cases two different fatigue analyses, the hot spot and effective notch stress method were executed and compared. For the effective notch stress method, the weld toe and root fatigue life were investigated and compared. For the hot spot method, only the weld toe fatigue life was calculated and compared to the result from the effective notch stress method. Subsequently, a parameter study was performed varying the weld size and weld toe radius in order to see their influence on fatigue life. The workflow is presented schematically in Figure 5.
Figure 5 Flowchart of methodology.
1.3 Limitations
Fillet welds with high stress concentration factors, hence prone to fatigue failure, were considered in this thesis. Analyses of the same or similar joints, performed by Aker Solution MMO AS, Bergen, decided which regions of high stress concentrations should be considered in this thesis. Other areas prone to fatigue failure were not considered, even though these areas could have a lower fatigue life than the areas under investigation.
The fillet welds were modelled as idealized welds with the same material properties as the base material with no root gaps present. The complexity of the sample joints caused the need for some geometric simplifications, which could lead to non-conservative fatigue life calculations.
It was assumed that the stresses are below the yield strength of the material, leading to a stress based linear finite element, FE, analysis. Welding residual stresses were not included in the analysis, as these are included in the S-N curves where the stress ratio is changed from 0 to 0.5. The heat affected zone caused by the welding process was also excluded from the analysis.
CHALMERS, Shipping and Marine Technology, Master’s Thesis X-13/294 6
The introduction of the fictitious radius of 1mm can increase the net section stress in the material and could lead to an over-estimate of the notch stress in the weld root. Radaj et al. (2006) proposed a reduction factor, but this has not been included in the calculations, giving more conservative results.
Mesh construction for the structural hot spot method was based on recommendations made by IIW (2008). Moreover, for the effective notch stress method the mesh construction was based on the guidelines given by Fricke et al. (2006). Hexagonal non-linear elements were used in the regions of interest. The number of elements was limited by computer memory (RAM). The lack of RAM forced the mesh to be coarse in the areas that are not of interest.
Fatigue life calculations were performed by following recommendations by DNV (2012), IIW (2008) and Fricke et al. (2006).
1.4 Outline of thesis
The outline of the thesis is as follows;
Firstly, in chapter 2, the theory behind and application of three commonly used fatigue calculation methods are presented. A short summary of the methods and three fatigue life improvement methods are presented in Chapter 2. Chapter 3 describes the geometry of the models as well as a description of the method for meshing and how the boundary conditions and load cases are defined. This chapter also includes some verification and validation of methods, as well as some information on how the results are pre-processed. The results and some discussions are presented in Chapter 4, followed by the conclusions and future work in Chapters 5 and 6, respectively.
CHALMERS, Shipping and Marine Technology, Master’s Thesis X-13/294 7
2 Fatigue assessment methods for welded structures
This chapter presents three different fatigue calculation methods, the nominal, structural hot spot and effective notch stress method, separately, followed by a short summary. Some fatigue life improvements are also presented in this chapter.
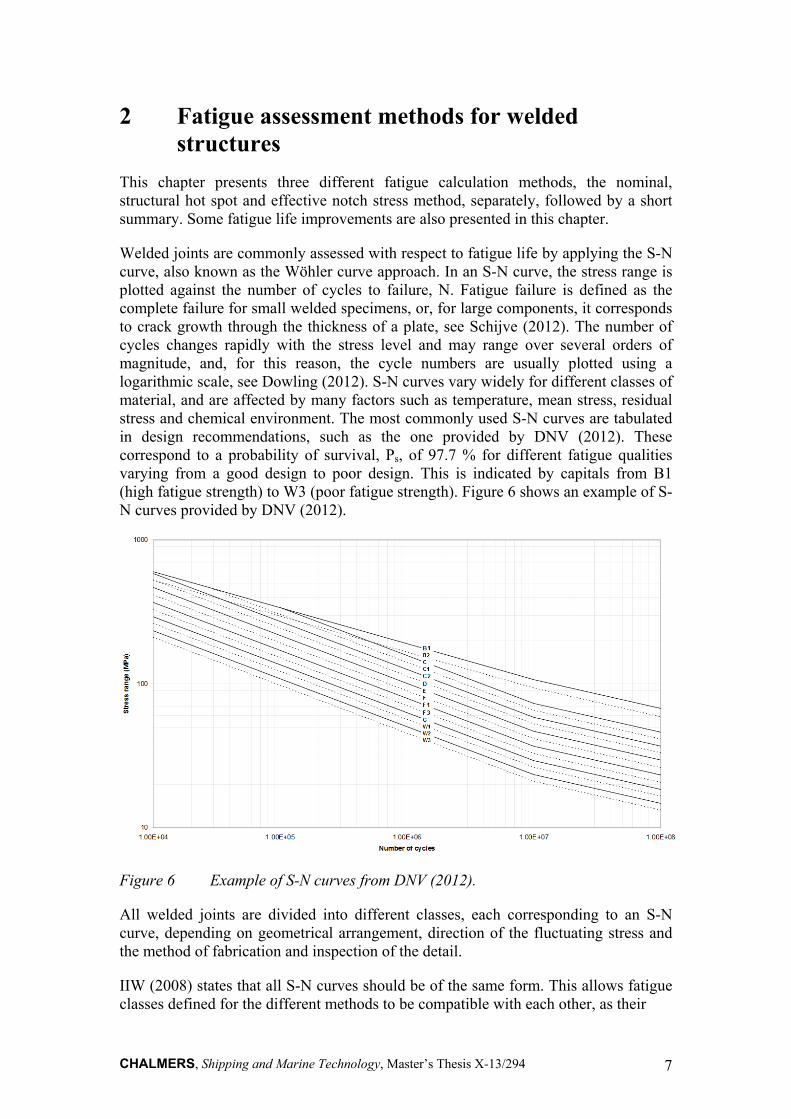
Welded joints are commonly assessed with respect to fatigue life by applying the S-N curve, also known as the Wöhler curve approach. In an S-N curve, the stress range is plotted against the number of cycles to failure, N. Fatigue failure is defined as the complete failure for small welded specimens, or, for large components, it corresponds to crack growth through the thickness of a plate, see Schijve (2012). The number of cycles changes rapidly with the stress level and may range over several orders of magnitude, and, for this reason, the cycle numbers are usually plotted using a logarithmic scale, see Dowling (2012). S-N curves vary widely for different classes of material, and are affected by many factors such as temperature, mean stress, residual stress and chemical environment. The most commonly used S-N curves are tabulated in design recommendations, such as the one provided by DNV (2012). These correspond to a probability of survival, Ps, of 97.7 % for different fatigue qualities varying from a good design to poor design. This is indicated by capitals from B1 (high fatigue strength) to W3 (poor fatigue strength). Figure 6 shows an example of S-N curves provided by DNV (2012).
Figure 6 Example of S-N curves from DNV (2012).
All welded joints are divided into different classes, each corresponding to an S-N curve, depending on geometrical arrangement, direction of the fluctuating stress and the method of fabrication and inspection of the detail.
IIW (2008) states that all S-N curves should be of the same form. This allows fatigue classes defined for the different methods to be compatible with each other, as their
CHALMERS, Shipping and Marine Technology, Master’s Thesis X-13/294 8
S-N curves have the same slope, Fricke (2010). Equation (1) can be applied for calculating the number of cycles to fatigue failure for a given S-N curve, regardless of fatigue calculation method:
mFAT
N
6102 (1)
where N is the number of cycles to failure, m is material property (normally 3 for steel), FAT is the fatigue strength at 210^6 cycles, and is the calculated stress range.
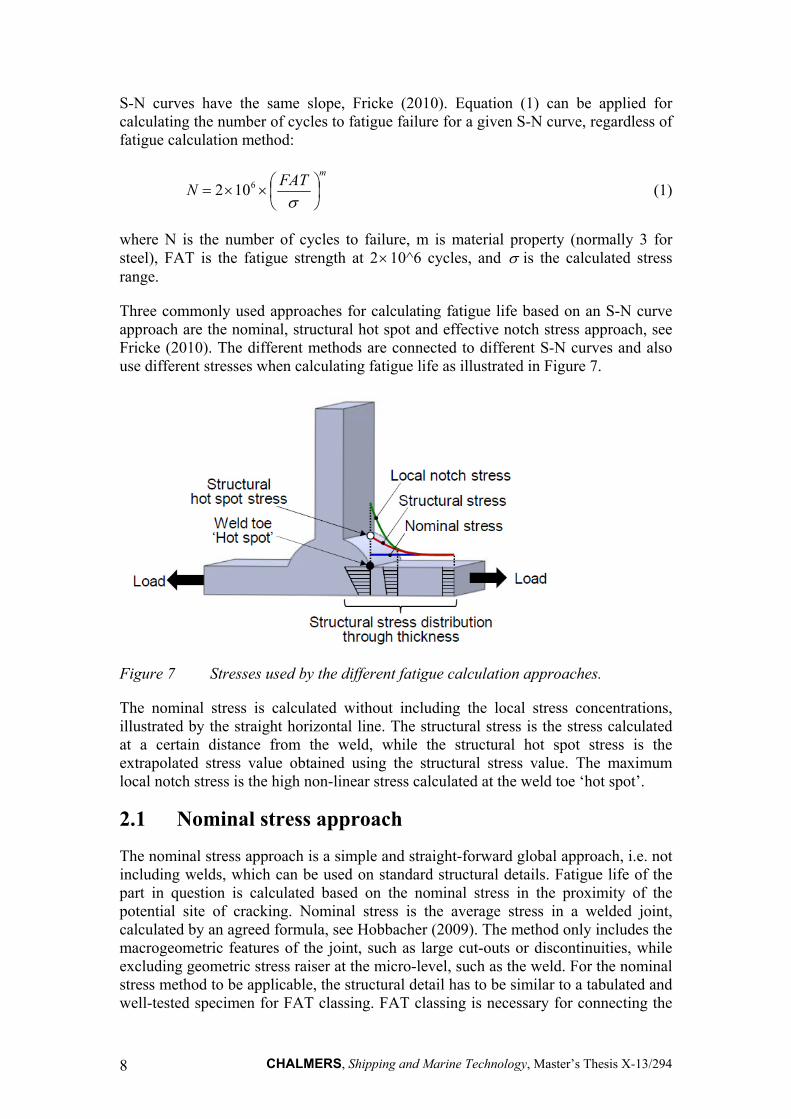
Three commonly used approaches for calculating fatigue life based on an S-N curve approach are the nominal, structural hot spot and effective notch stress approach, see Fricke (2010). The different methods are connected to different S-N curves and also use different stresses when calculating fatigue life as illustrated in Figure 7.
Figure 7 Stresses used by the different fatigue calculation approaches.
The nominal stress is calculated without including the local stress concentrations, illustrated by the straight horizontal line. The structural stress is the stress calculated at a certain distance from the weld, while the structural hot spot stress is the extrapolated stress value obtained using the structural stress value. The maximum local notch stress is the high non-linear stress calculated at the weld toe ‘hot spot’.
2.1 Nominal stress approach
The nominal stress approach is a simple and straight-forward global approach, i.e. not including welds, which can be used on standard structural details. Fatigue life of the part in question is calculated based on the nominal stress in the proximity of the potential site of cracking. Nominal stress is the average stress in a welded joint, calculated by an agreed formula, see Hobbacher (2009). The method only includes the macrogeometric features of the joint, such as large cut-outs or discontinuities, while excluding geometric stress raiser at the micro-level, such as the weld. For the nominal stress method to be applicable, the structural detail has to be similar to a tabulated and well-tested specimen for FAT classing. FAT classing is necessary for connecting the
CHALMERS, Shipping and Marine Technology, Master’s Thesis X-13/294 9
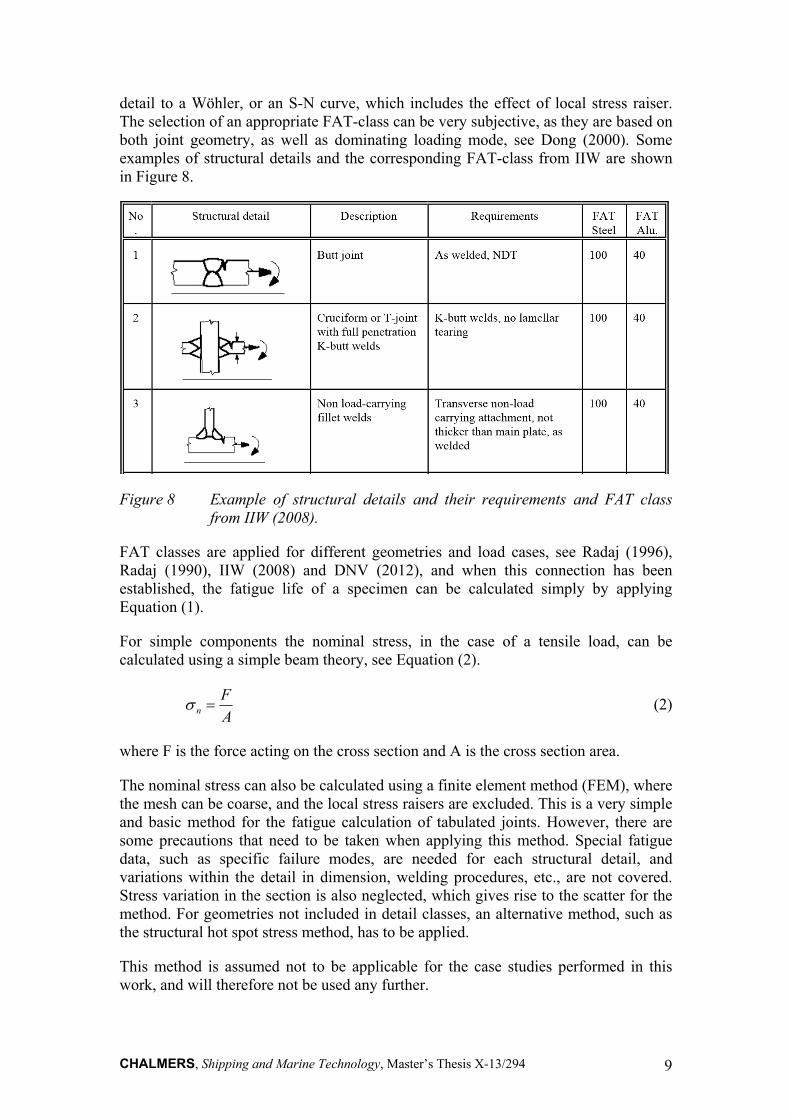
detail to a Wöhler, or an S-N curve, which includes the effect of local stress raiser. The selection of an appropriate FAT-class can be very subjective, as they are based on both joint geometry, as well as dominating loading mode, see Dong (2000). Some examples of structural details and the corresponding FAT-class from IIW are shown in Figure 8.
Figure 8 Example of structural details and their requirements and FAT class from IIW (2008).
FAT classes are applied for different geometries and load cases, see Radaj (1996), Radaj (1990), IIW (2008) and DNV (2012), and when this connection has been established, the fatigue life of a specimen can be calculated simply by applying Equation (1).
For simple components the nominal stress, in the case of a tensile load, can be calculated using a simple beam theory, see Equation (2).
A
Fn (2)
where F is the force acting on the cross section and A is the cross section area.
The nominal stress can also be calculated using a finite element method (FEM), where the mesh can be coarse, and the local stress raisers are excluded. This is a very simple and basic method for the fatigue calculation of tabulated joints. However, there are some precautions that need to be taken when applying this method. Special fatigue data, such as specific failure modes, are needed for each structural detail, and variations within the detail in dimension, welding procedures, etc., are not covered. Stress variation in the section is also neglected, which gives rise to the scatter for the method. For geometries not included in detail classes, an alternative method, such as the structural hot spot stress method, has to be applied.
This method is assumed not to be applicable for the case studies performed in this work, and will therefore not be used any further.
CHALMERS, Shipping and Marine Technology, Master’s Thesis X-13/294 10
2.2 Structural hot spot stress approach
The structural hot spot stress method was developed in the 1970’s, as a method for calculating the fatigue life of welded tubular joints in the offshore industry, see Radaj et al. (2006). Later, corresponding design recommendations were adopted to other welded joints and published by classification societies and other authorities, such as IIW (2008) and DNV (2012). The structural hot spot stress is calculated as the structural or also called geometrical stress, in the region of high stress concentrations. This area is called a hot spot, hence the name of the method.
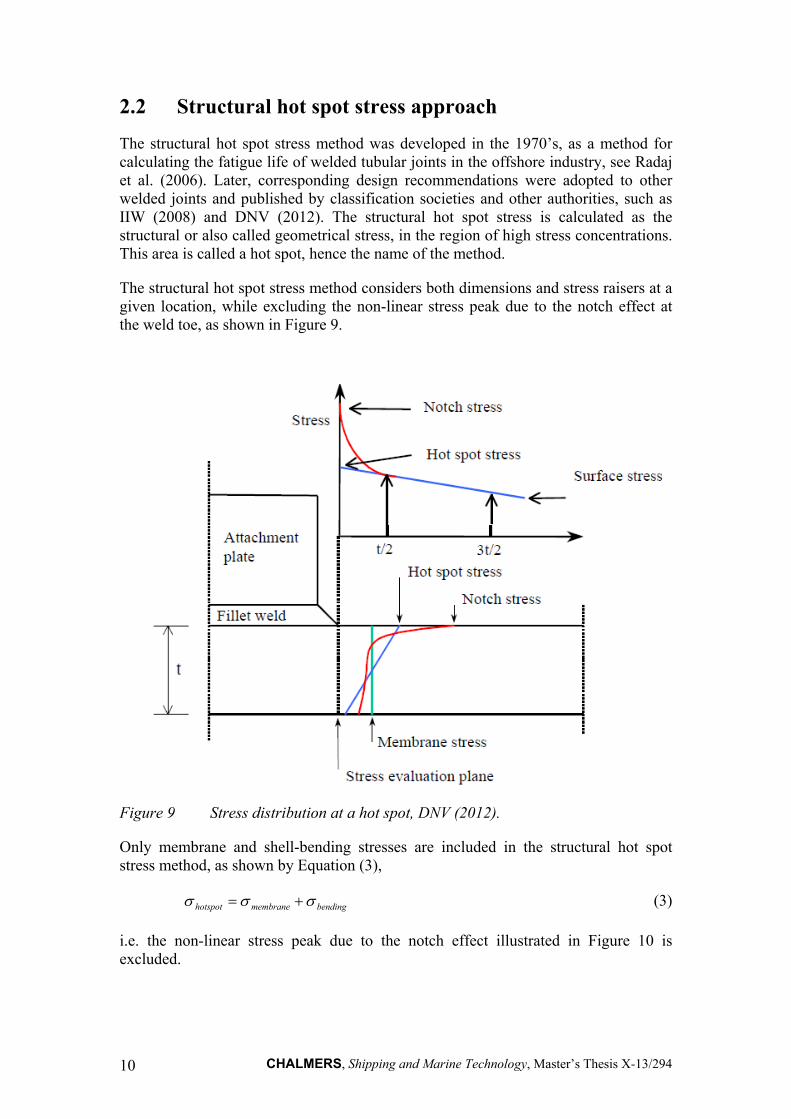
The structural hot spot stress method considers both dimensions and stress raisers at a given location, while excluding the non-linear stress peak due to the notch effect at the weld toe, as shown in Figure 9.
Figure 9 Stress distribution at a hot spot, DNV (2012).
Only membrane and shell-bending stresses are included in the structural hot spot stress method, as shown by Equation (3),
bendingmembranehotspot (3)
i.e. the non-linear stress peak due to the notch effect illustrated in Figure 10 is excluded.
CHALMERS, Shipping and Marine Technology, Master’s Thesis X-13/294 11
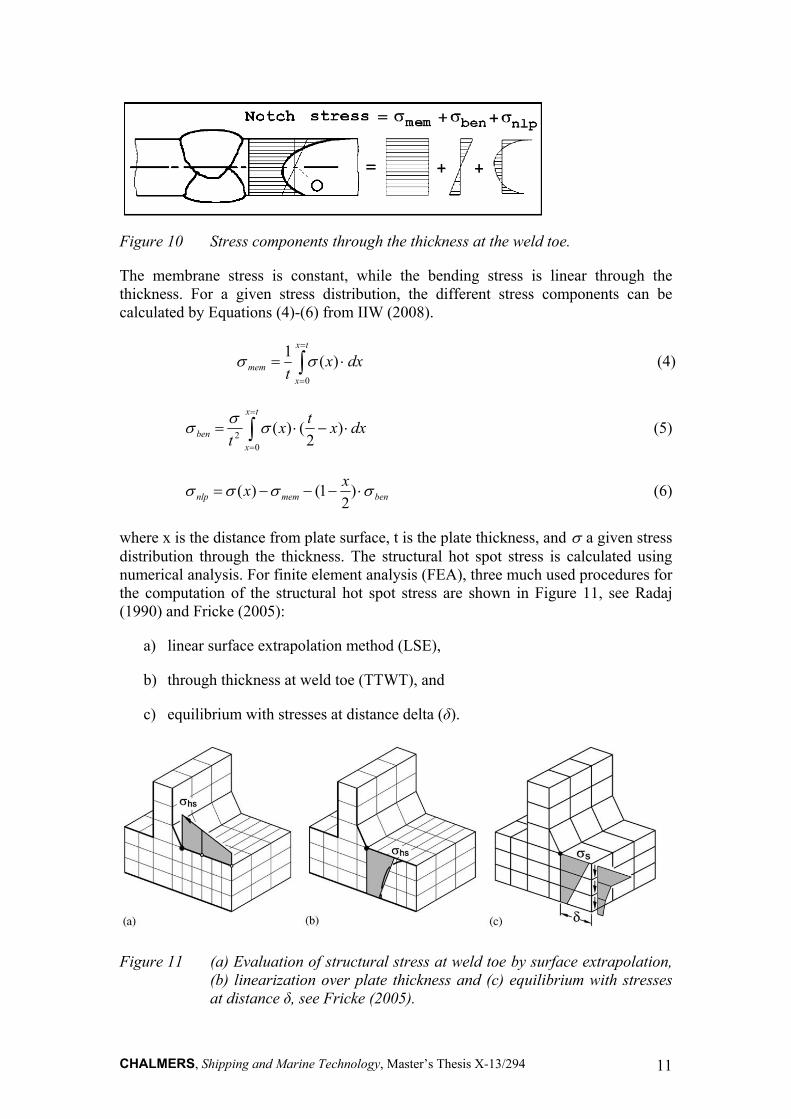
Figure 10 Stress components through the thickness at the weld toe.
The membrane stress is constant, while the bending stress is linear through the thickness. For a given stress distribution, the different stress components can be calculated by Equations (4)-(6) from IIW (2008).
tx
x
mem dxxt 0
)(1 (4)
tx
x
ben dxxt
xt 0
2)
2()( (5)
benmemnlp
xx )
21()( (6)
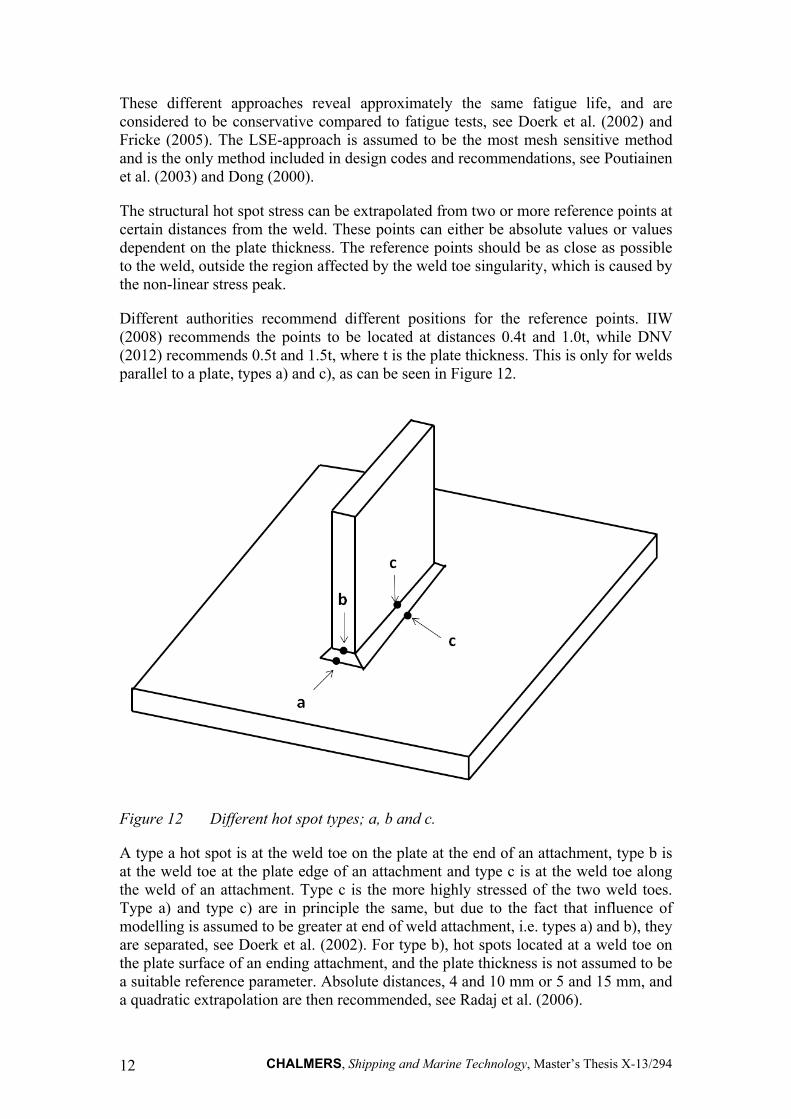
where x is the distance from plate surface, t is the plate thickness, and a given stress distribution through the thickness. The structural hot spot stress is calculated using numerical analysis. For finite element analysis (FEA), three much used procedures for the computation of the structural hot spot stress are shown in Figure 11, see Radaj (1990) and Fricke (2005):
a) linear surface extrapolation method (LSE),
b) through thickness at weld toe (TTWT), and
c) equilibrium with stresses at distance delta (δ).
Figure 11 (a) Evaluation of structural stress at weld toe by surface extrapolation, (b) linearization over plate thickness and (c) equilibrium with stresses at distance δ, see Fricke (2005).
CHALMERS, Shipping and Marine Technology, Master’s Thesis X-13/294 12
These different approaches reveal approximately the same fatigue life, and are considered to be conservative compared to fatigue tests, see Doerk et al. (2002) and Fricke (2005). The LSE-approach is assumed to be the most mesh sensitive method and is the only method included in design codes and recommendations, see Poutiainen et al. (2003) and Dong (2000).
The structural hot spot stress can be extrapolated from two or more reference points at certain distances from the weld. These points can either be absolute values or values dependent on the plate thickness. The reference points should be as close as possible to the weld, outside the region affected by the weld toe singularity, which is caused by the non-linear stress peak.
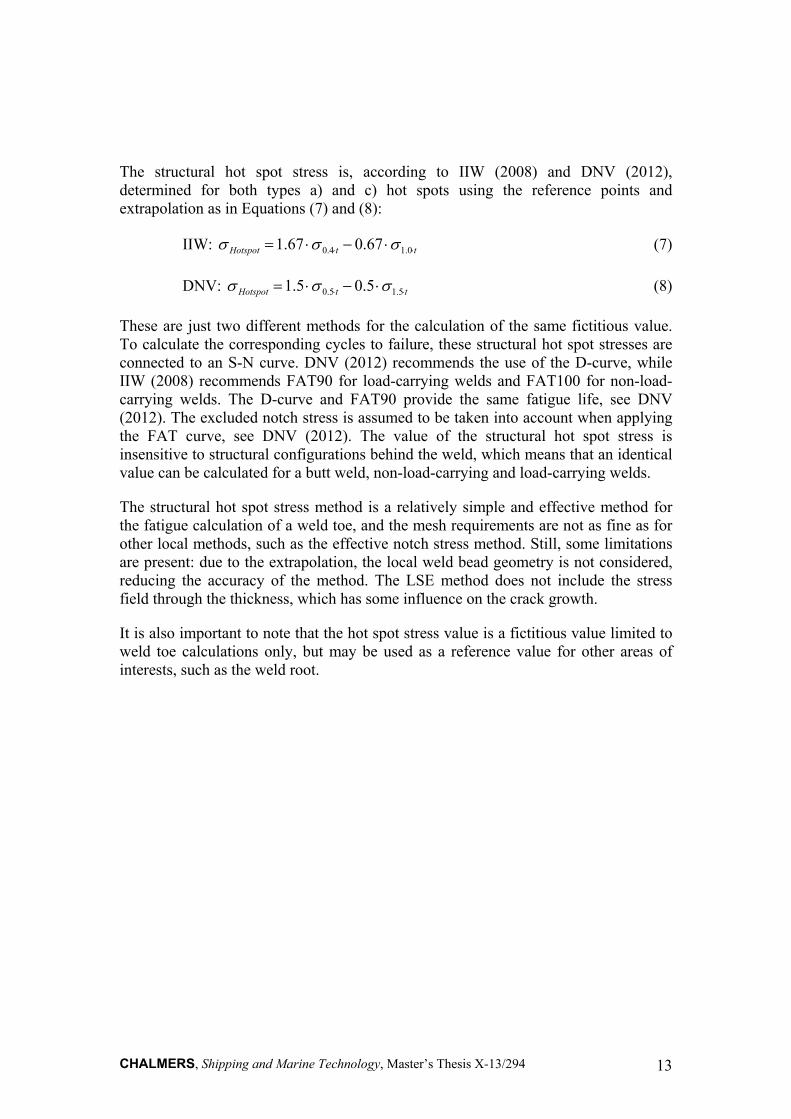
Different authorities recommend different positions for the reference points. IIW (2008) recommends the points to be located at distances 0.4t and 1.0t, while DNV (2012) recommends 0.5t and 1.5t, where t is the plate thickness. This is only for welds parallel to a plate, types a) and c), as can be seen in Figure 12.
Figure 12 Different hot spot types; a, b and c.
A type a hot spot is at the weld toe on the plate at the end of an attachment, type b is at the weld toe at the plate edge of an attachment and type c is at the weld toe along the weld of an attachment. Type c is the more highly stressed of the two weld toes. Type a) and type c) are in principle the same, but due to the fact that influence of modelling is assumed to be greater at end of weld attachment, i.e. types a) and b), they are separated, see Doerk et al. (2002). For type b), hot spots located at a weld toe on the plate surface of an ending attachment, and the plate thickness is not assumed to be a suitable reference parameter. Absolute distances, 4 and 10 mm or 5 and 15 mm, and a quadratic extrapolation are then recommended, see Radaj et al. (2006).
CHALMERS, Shipping and Marine Technology, Master’s Thesis X-13/294 13
The structural hot spot stress is, according to IIW (2008) and DNV (2012), determined for both types a) and c) hot spots using the reference points and extrapolation as in Equations (7) and (8):
IIW: ttHotspot 0.14.0 67.067.1 (7)
DNV: ttHotspot 5.15.0 5.05.1 (8)
These are just two different methods for the calculation of the same fictitious value. To calculate the corresponding cycles to failure, these structural hot spot stresses are connected to an S-N curve. DNV (2012) recommends the use of the D-curve, while IIW (2008) recommends FAT90 for load-carrying welds and FAT100 for non-load- carrying welds. The D-curve and FAT90 provide the same fatigue life, see DNV (2012). The excluded notch stress is assumed to be taken into account when applying the FAT curve, see DNV (2012). The value of the structural hot spot stress is insensitive to structural configurations behind the weld, which means that an identical value can be calculated for a butt weld, non-load-carrying and load-carrying welds.
The structural hot spot stress method is a relatively simple and effective method for the fatigue calculation of a weld toe, and the mesh requirements are not as fine as for other local methods, such as the effective notch stress method. Still, some limitations are present: due to the extrapolation, the local weld bead geometry is not considered, reducing the accuracy of the method. The LSE method does not include the stress field through the thickness, which has some influence on the crack growth.
It is also important to note that the hot spot stress value is a fictitious value limited to weld toe calculations only, but may be used as a reference value for other areas of interests, such as the weld root.
CHALMERS, Shipping and Marine Technology, Master’s Thesis X-13/294 14
2.3 Effective notch stress approach
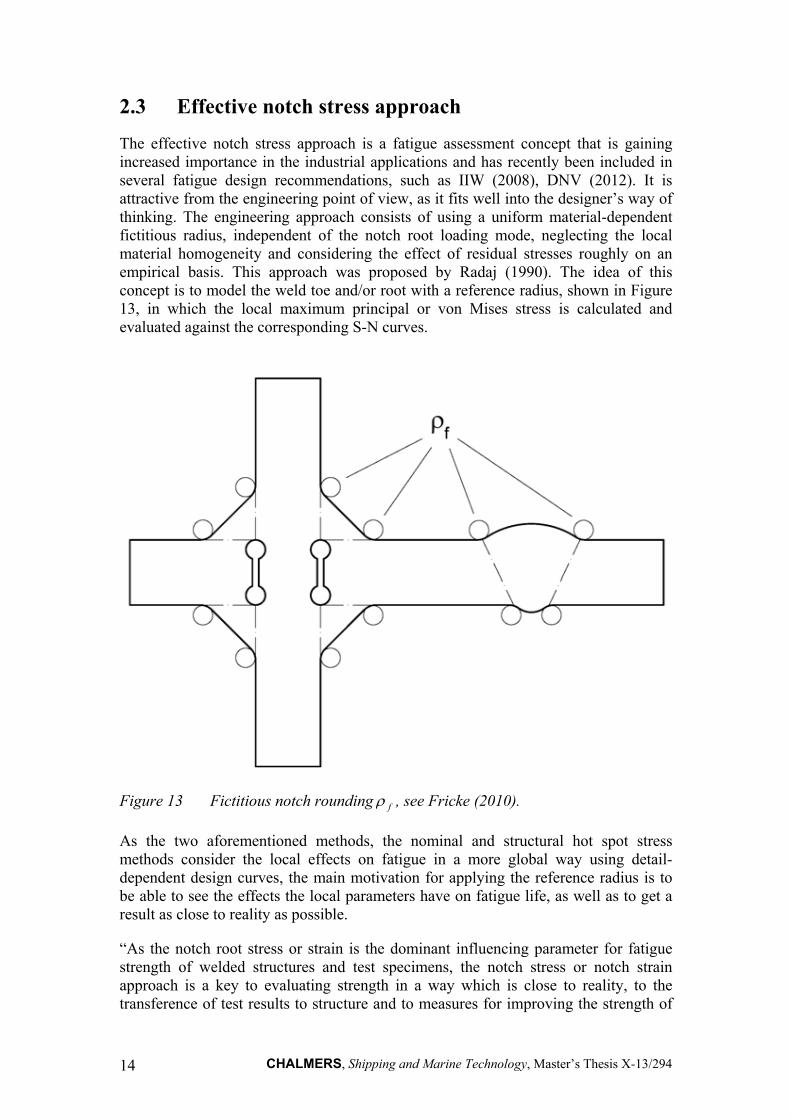
The effective notch stress approach is a fatigue assessment concept that is gaining increased importance in the industrial applications and has recently been included in several fatigue design recommendations, such as IIW (2008), DNV (2012). It is attractive from the engineering point of view, as it fits well into the designer’s way of thinking. The engineering approach consists of using a uniform material-dependent fictitious radius, independent of the notch root loading mode, neglecting the local material homogeneity and considering the effect of residual stresses roughly on an empirical basis. This approach was proposed by Radaj (1990). The idea of this concept is to model the weld toe and/or root with a reference radius, shown in Figure 13, in which the local maximum principal or von Mises stress is calculated and evaluated against the corresponding S-N curves.
Figure 13 Fictitious notch rounding f , see Fricke (2010).
As the two aforementioned methods, the nominal and structural hot spot stress methods consider the local effects on fatigue in a more global way using detail-dependent design curves, the main motivation for applying the reference radius is to be able to see the effects the local parameters have on fatigue life, as well as to get a result as close to reality as possible.
“As the notch root stress or strain is the dominant influencing parameter for fatigue strength of welded structures and test specimens, the notch stress or notch strain approach is a key to evaluating strength in a way which is close to reality, to the transference of test results to structure and to measures for improving the strength of
CHALMERS, Shipping and Marine Technology, Master’s Thesis X-13/294 15
structures. A disadvantage of the approach is the much greater amount of measuring, testing and calculation required compared with the nominal stress approach.” – Radaj (1996)
The idea behind the fictitious rounding of the weld toe and weld root was first applied in 1969, by the use of a photo-elastic notch stress analysis, see Radaj (1969). It has since been used within both a finite element notch stress analysis and a boundary element notch stress analysis. The reference radius of 1 mm, given by Radaj (1990), is based on the fictitious radius f = 1 mm, which is derived from the micro-support
hypothesis shown in Equation (9).
sf (9)
where is the real notch radius, s is the factor for stress multiaxiality and strength
criterion and * is the, material constant, substitute micro-structural length. The worst-case scenario assumes the real radius, , to be 0 mm and the factor s to be 2.5 for plane strain conditions at the roots of sharp notches. The value for the substitute micro-structural length, * , vary depending on material. Considering typical welds in
steel, the choice of * = 0.4 mm is appropriate, see Fricke (2010). This gives a
fictitious radius of f = 1 mm. The reason for applying the fictitious radius, rather
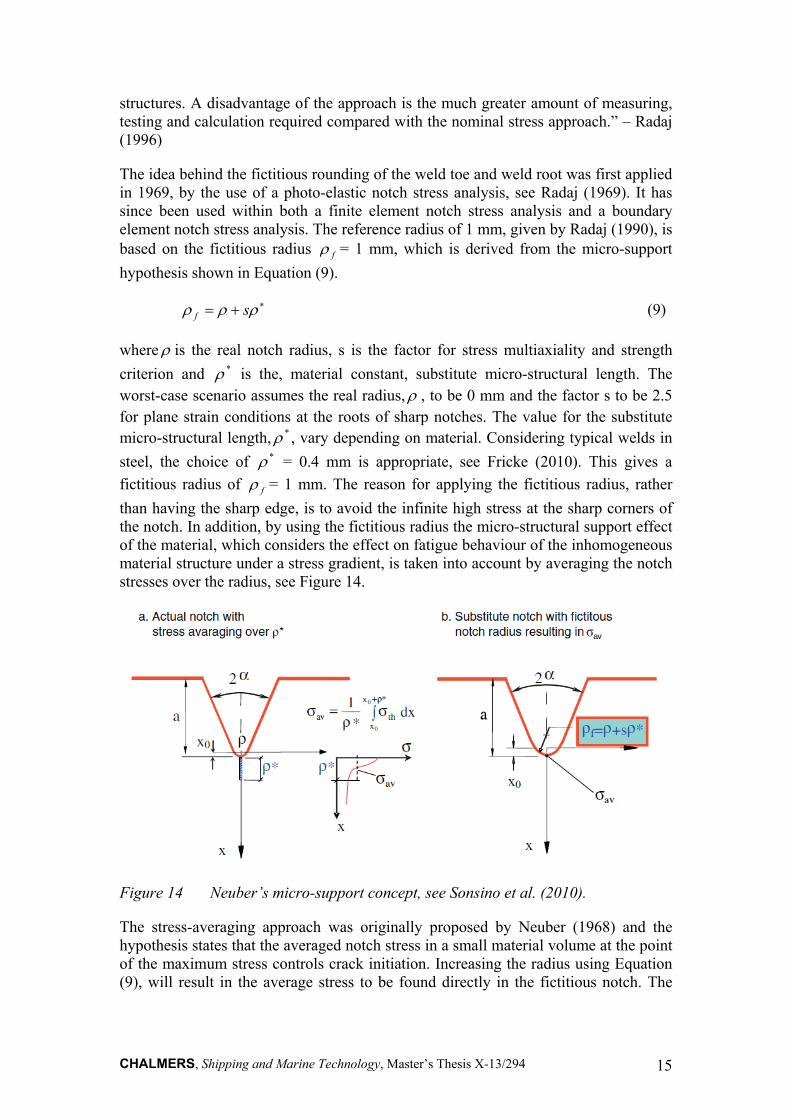
than having the sharp edge, is to avoid the infinite high stress at the sharp corners of the notch. In addition, by using the fictitious radius the micro-structural support effect of the material, which considers the effect on fatigue behaviour of the inhomogeneous material structure under a stress gradient, is taken into account by averaging the notch stresses over the radius, see Figure 14.
Figure 14 Neuber’s micro-support concept, see Sonsino et al. (2010).
The stress-averaging approach was originally proposed by Neuber (1968) and the hypothesis states that the averaged notch stress in a small material volume at the point of the maximum stress controls crack initiation. Increasing the radius using Equation (9), will result in the average stress to be found directly in the fictitious notch. The
CHALMERS, Shipping and Marine Technology, Master’s Thesis X-13/294 16
decisive material parameter for describing this effect is the microstructural length over which the stresses are averaged.
Notch stress is usually computed numerically using a finite element or boundary element method. The objective of the numerical analysis is to compute the maximum stress concentration in the weld toe and/or root under the load case.
For a basic case with the maximum notch stress at the fictitiously rounded notch,
maxk , a tensile nominal stress, n , is determined on the cross section area, A,
subjected to a tensile force, F, the stress concentration is given as shown in Equations (10) and (11):
n
k
fK
max (10)
A
F n (12)
A major benefit of using this approach is that only one S-N curve is applied, regardless of the geometric detail. IIW (2008) proposes the maximum principal stresses to be linked to the FAT 225 curve when applying this method on steel- welded joints. This curve accounts for high tensile residual stresses by implementing a stress ratio R=0.5 instead of R=0.
Radaj et al. (2006) state that the potential of local approaches lies in the support they give the development of structural design. The local parameters have a decisive influence on fatigue strength of welded joints and only local approaches, such as the effective notch stress method, separate these parameters.
A downside to this method is the high computational time, due to demanding mesh requirements as well as requirements for detailed modelling compared to the nominal and structural hot spot stress method.
CHALMERS, Shipping and Marine Technology, Master’s Thesis X-13/294 17
2.4 Summary of methods
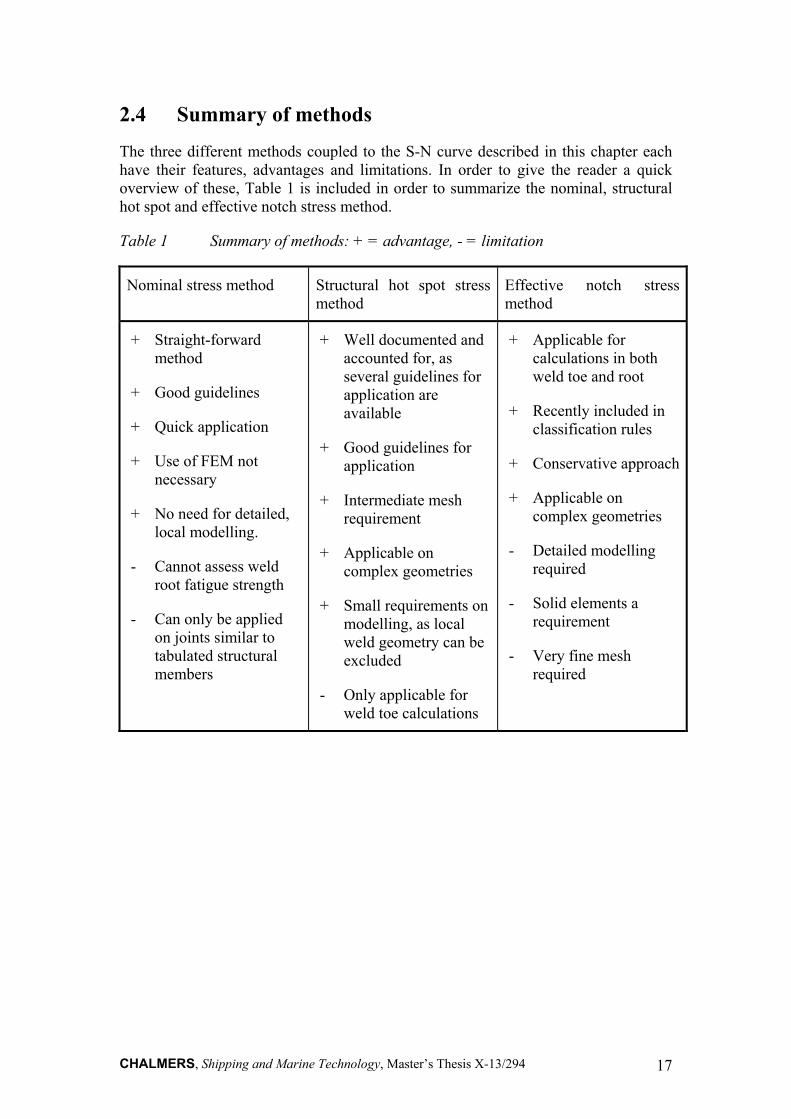
The three different methods coupled to the S-N curve described in this chapter each have their features, advantages and limitations. In order to give the reader a quick overview of these, Table 1 is included in order to summarize the nominal, structural hot spot and effective notch stress method.
Table 1 Summary of methods: + = advantage, - = limitation
Nominal stress method Structural hot spot stress method
Effective notch stress method
+ Straight-forward method
+ Good guidelines
+ Quick application
+ Use of FEM not necessary
+ No need for detailed, local modelling.
- Cannot assess weld root fatigue strength
- Can only be applied on joints similar to tabulated structural members
+ Well documented and accounted for, as several guidelines for application are available
+ Good guidelines for application
+ Intermediate mesh requirement
+ Applicable on complex geometries
+ Small requirements on modelling, as local weld geometry can be excluded
- Only applicable for weld toe calculations
+ Applicable for calculations in both weld toe and root
+ Recently included in classification rules
+ Conservative approach
+ Applicable on complex geometries
- Detailed modelling required
- Solid elements a requirement
- Very fine mesh required
CHALMERS, Shipping and Marine Technology, Master’s Thesis X-13/294 18
2.5 Fatigue life improvement methods
Within the offshore industry, fatigue life improvement methods are often used for extending the working life of offshore structures. When performed correctly, fatigue life improvement methods can provide a significant increase in fatigue life. But care has to be taken, as some methods only increase the life in the weld toe, meaning that fatigue improvement methods can increase the probability of weld root failure. In this section, some methods included in DNV (2012) will be described.
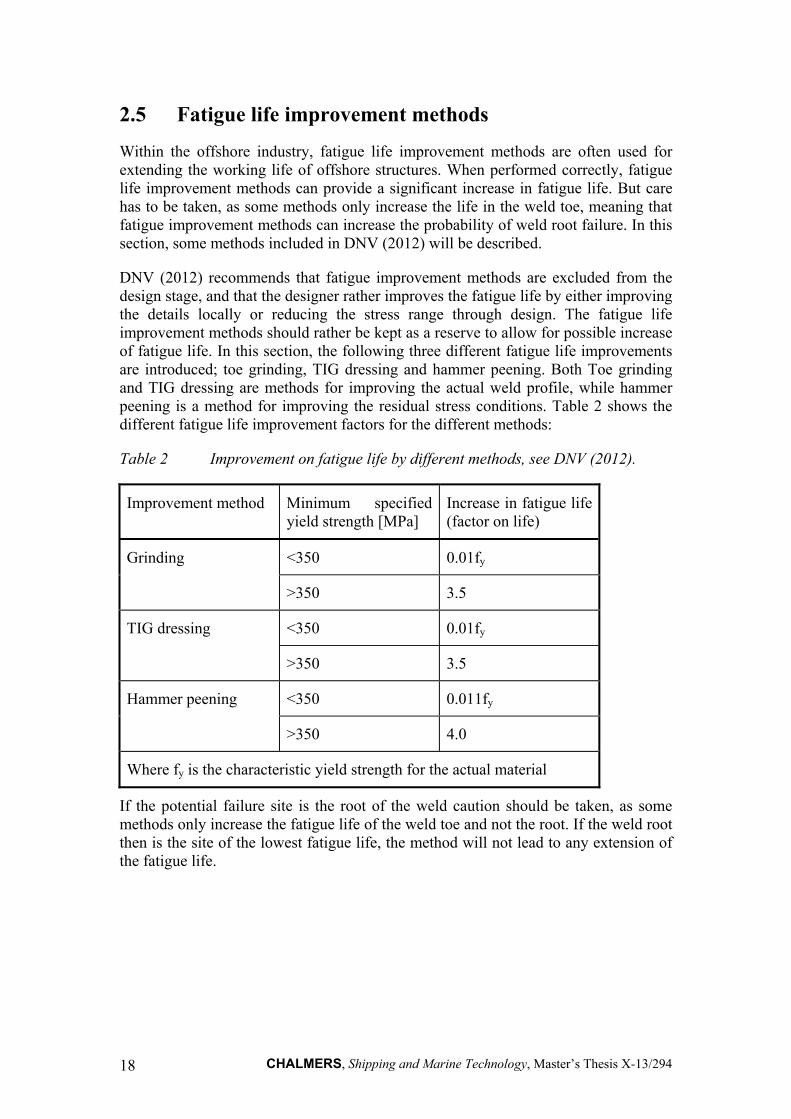
DNV (2012) recommends that fatigue improvement methods are excluded from the design stage, and that the designer rather improves the fatigue life by either improving the details locally or reducing the stress range through design. The fatigue life improvement methods should rather be kept as a reserve to allow for possible increase of fatigue life. In this section, the following three different fatigue life improvements are introduced; toe grinding, TIG dressing and hammer peening. Both Toe grinding and TIG dressing are methods for improving the actual weld profile, while hammer peening is a method for improving the residual stress conditions. Table 2 shows the different fatigue life improvement factors for the different methods:
Table 2 Improvement on fatigue life by different methods, see DNV (2012).
Improvement method Minimum specified yield strength [MPa]
Increase in fatigue life (factor on life)
Grinding <350 0.01fy
>350 3.5
TIG dressing <350 0.01fy
>350 3.5
Hammer peening <350 0.011fy
>350 4.0
Where fy is the characteristic yield strength for the actual material
If the potential failure site is the root of the weld caution should be taken, as some methods only increase the fatigue life of the weld toe and not the root. If the weld root then is the site of the lowest fatigue life, the method will not lead to any extension of the fatigue life.
CHALMERS, Shipping and Marine Technology, Master’s Thesis X-13/294 19
2.5.1 Weld toe grinding
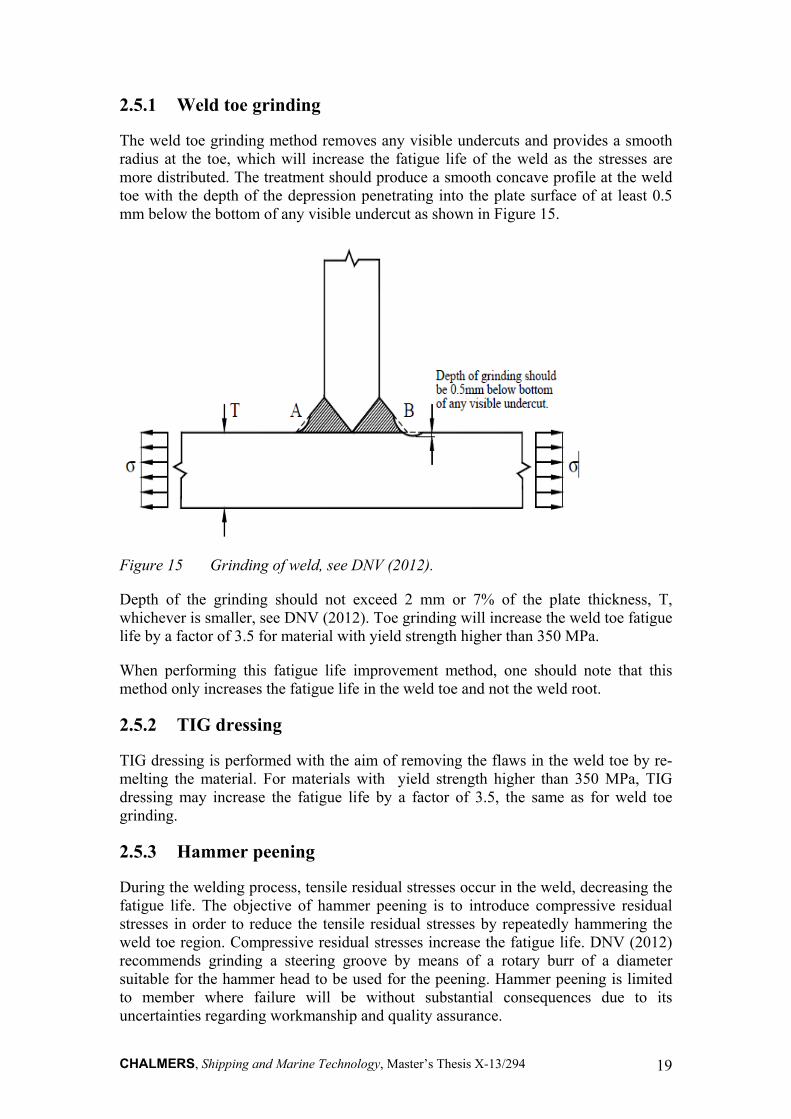
The weld toe grinding method removes any visible undercuts and provides a smooth radius at the toe, which will increase the fatigue life of the weld as the stresses are more distributed. The treatment should produce a smooth concave profile at the weld toe with the depth of the depression penetrating into the plate surface of at least 0.5 mm below the bottom of any visible undercut as shown in Figure 15.
Figure 15 Grinding of weld, see DNV (2012).
Depth of the grinding should not exceed 2 mm or 7% of the plate thickness, T, whichever is smaller, see DNV (2012). Toe grinding will increase the weld toe fatigue life by a factor of 3.5 for material with yield strength higher than 350 MPa.
When performing this fatigue life improvement method, one should note that this method only increases the fatigue life in the weld toe and not the weld root.
2.5.2 TIG dressing
TIG dressing is performed with the aim of removing the flaws in the weld toe by re-melting the material. For materials with yield strength higher than 350 MPa, TIG dressing may increase the fatigue life by a factor of 3.5, the same as for weld toe grinding.
2.5.3 Hammer peening
During the welding process, tensile residual stresses occur in the weld, decreasing the fatigue life. The objective of hammer peening is to introduce compressive residual stresses in order to reduce the tensile residual stresses by repeatedly hammering the weld toe region. Compressive residual stresses increase the fatigue life. DNV (2012) recommends grinding a steering groove by means of a rotary burr of a diameter suitable for the hammer head to be used for the peening. Hammer peening is limited to member where failure will be without substantial consequences due to its uncertainties regarding workmanship and quality assurance.

CHALMERS, Shipping and Marine Technology, Master’s Thesis X-13/294 20
CHALMERS, Shipping and Marine Technology, Master’s Thesis X-13/294 21
3 FE modelling and analysis
In this chapter, the two different joints investigated will first be described separately: Firstly, the geometry is presented and illustrated, followed by the meshing methodology and material assigned for representation of the joints. Furthermore, the boundary and load conditions applied for the analysis are presented. Moreover, the mesh convergence, parameter study, verification and validation are presented jointly for both models. Finally, the post-processing is described. These joints were chosen by Aker Solutions MMO AS, Bergen, Norway, as they were shown to have fatigue problems in areas containing fillet welds.
3.1 Rectangular hollow section connection (model 1)
This model is a rectangular hollow section from a davit, built as a truss, designed by Aker Solutions MMO AS, Bergen.
A global model has been analysed by Aker Solutions MMO AS, Bergen, to decide upon the most critical load case for the fillet weld with regards to fatigue life. A local model has been built of this area for further analysis of the critical location.
3.1.1 Geometry description
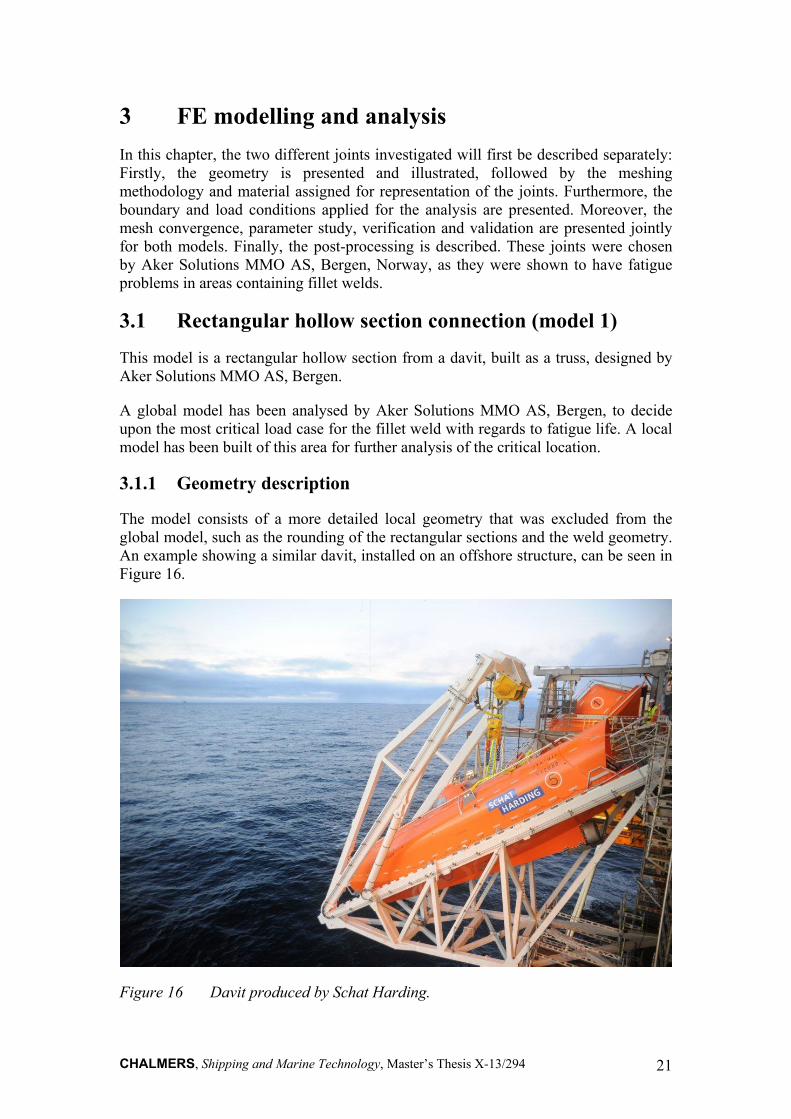
The model consists of a more detailed local geometry that was excluded from the global model, such as the rounding of the rectangular sections and the weld geometry. An example showing a similar davit, installed on an offshore structure, can be seen in Figure 16.
Figure 16 Davit produced by Schat Harding.
CHALMERS, Shipping and Marine Technology, Master’s Thesis X-13/294 22
The global and the local model can be seen together in Figure 17, with the former on the left and the latter on the right.
Figure 17 Global and local model of davit.
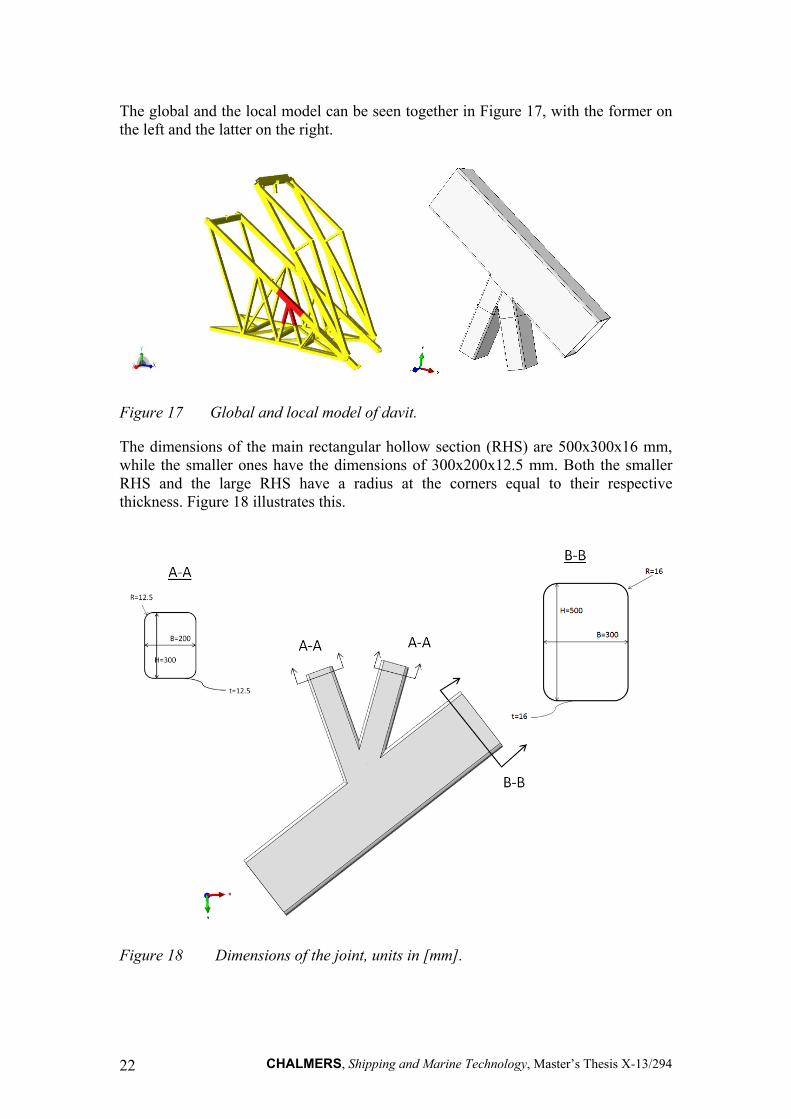
The dimensions of the main rectangular hollow section (RHS) are 500x300x16 mm, while the smaller ones have the dimensions of 300x200x12.5 mm. Both the smaller RHS and the large RHS have a radius at the corners equal to their respective thickness. Figure 18 illustrates this.
Figure 18 Dimensions of the joint, units in [mm].
CHALMERS, Shipping and Marine Technology, Master’s Thesis X-13/294 23
The two smaller RHS members are connected with a fillet weld with weld size, a, 25 mm. It is assumed that no gaps are present and that the misalignment is equal to zero.
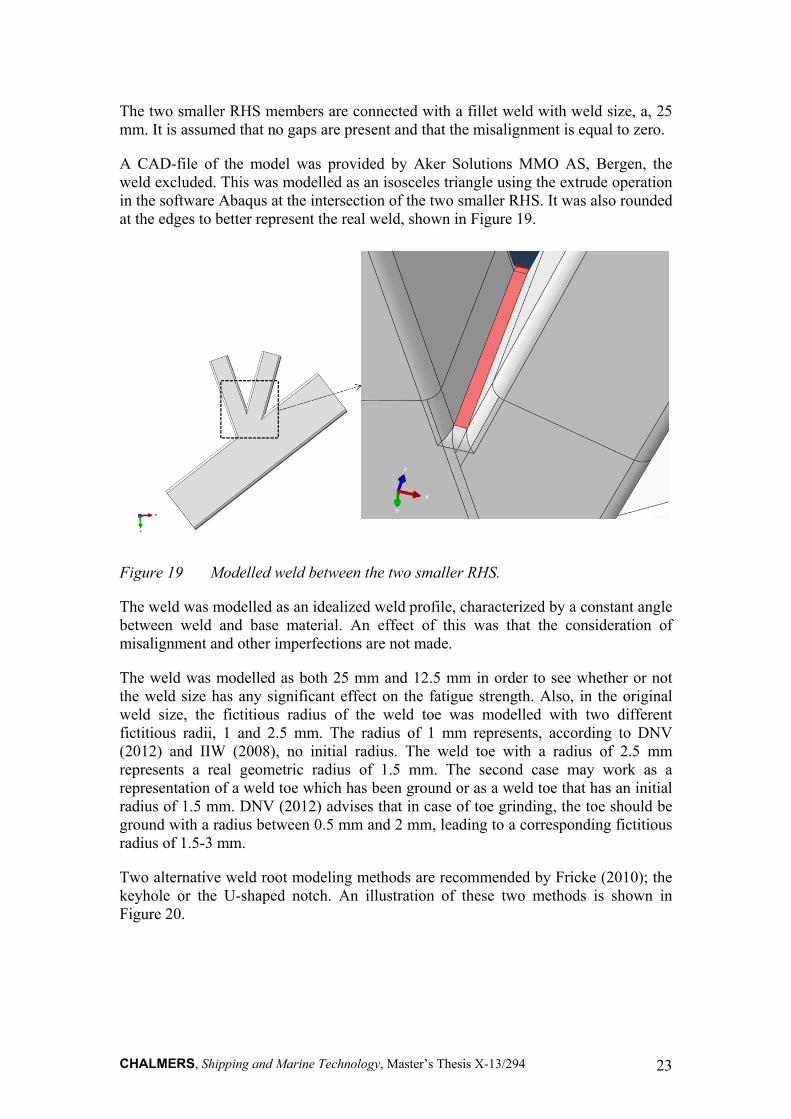
A CAD-file of the model was provided by Aker Solutions MMO AS, Bergen, the weld excluded. This was modelled as an isosceles triangle using the extrude operation in the software Abaqus at the intersection of the two smaller RHS. It was also rounded at the edges to better represent the real weld, shown in Figure 19.
Figure 19 Modelled weld between the two smaller RHS.
The weld was modelled as an idealized weld profile, characterized by a constant angle between weld and base material. An effect of this was that the consideration of misalignment and other imperfections are not made.
The weld was modelled as both 25 mm and 12.5 mm in order to see whether or not the weld size has any significant effect on the fatigue strength. Also, in the original weld size, the fictitious radius of the weld toe was modelled with two different fictitious radii, 1 and 2.5 mm. The radius of 1 mm represents, according to DNV (2012) and IIW (2008), no initial radius. The weld toe with a radius of 2.5 mm represents a real geometric radius of 1.5 mm. The second case may work as a representation of a weld toe which has been ground or as a weld toe that has an initial radius of 1.5 mm. DNV (2012) advises that in case of toe grinding, the toe should be ground with a radius between 0.5 mm and 2 mm, leading to a corresponding fictitious radius of 1.5-3 mm.
Two alternative weld root modeling methods are recommended by Fricke (2010); the keyhole or the U-shaped notch. An illustration of these two methods is shown in Figure 20.
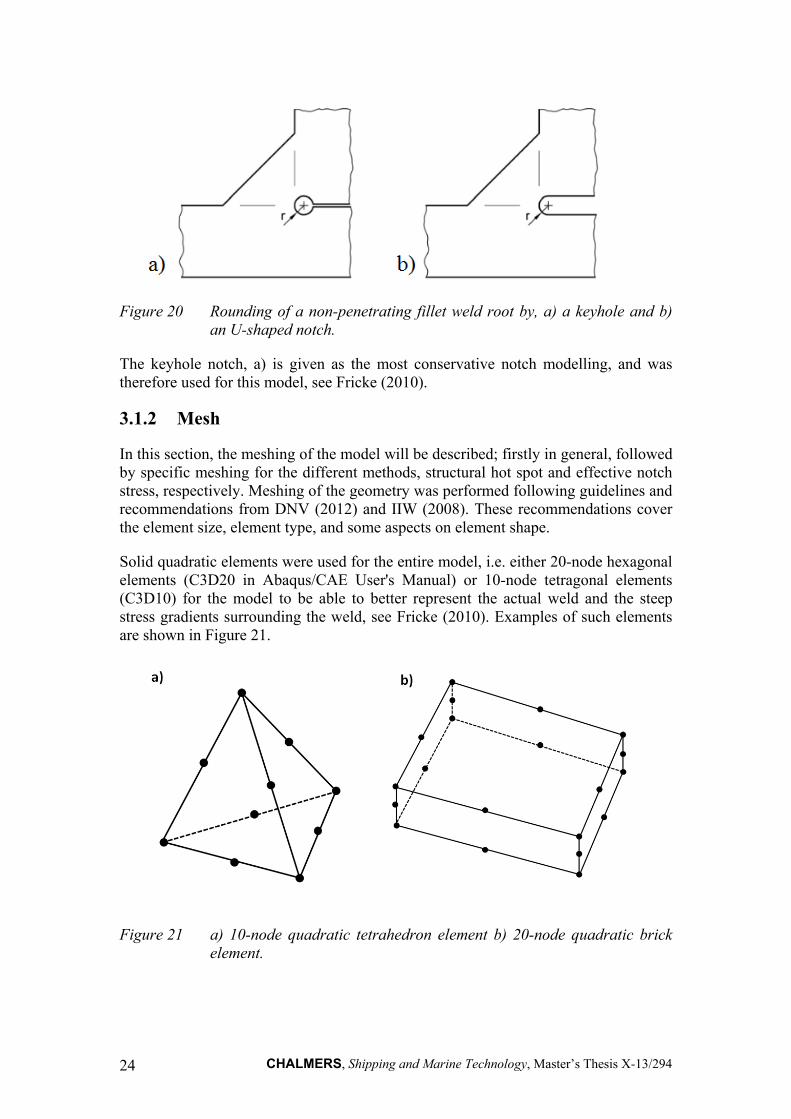
CHALMERS, Shipping and Marine Technology, Master’s Thesis X-13/294 24
Figure 20 Rounding of a non-penetrating fillet weld root by, a) a keyhole and b) an U-shaped notch.
The keyhole notch, a) is given as the most conservative notch modelling, and was therefore used for this model, see Fricke (2010).
3.1.2 Mesh
In this section, the meshing of the model will be described; firstly in general, followed by specific meshing for the different methods, structural hot spot and effective notch stress, respectively. Meshing of the geometry was performed following guidelines and recommendations from DNV (2012) and IIW (2008). These recommendations cover the element size, element type, and some aspects on element shape.
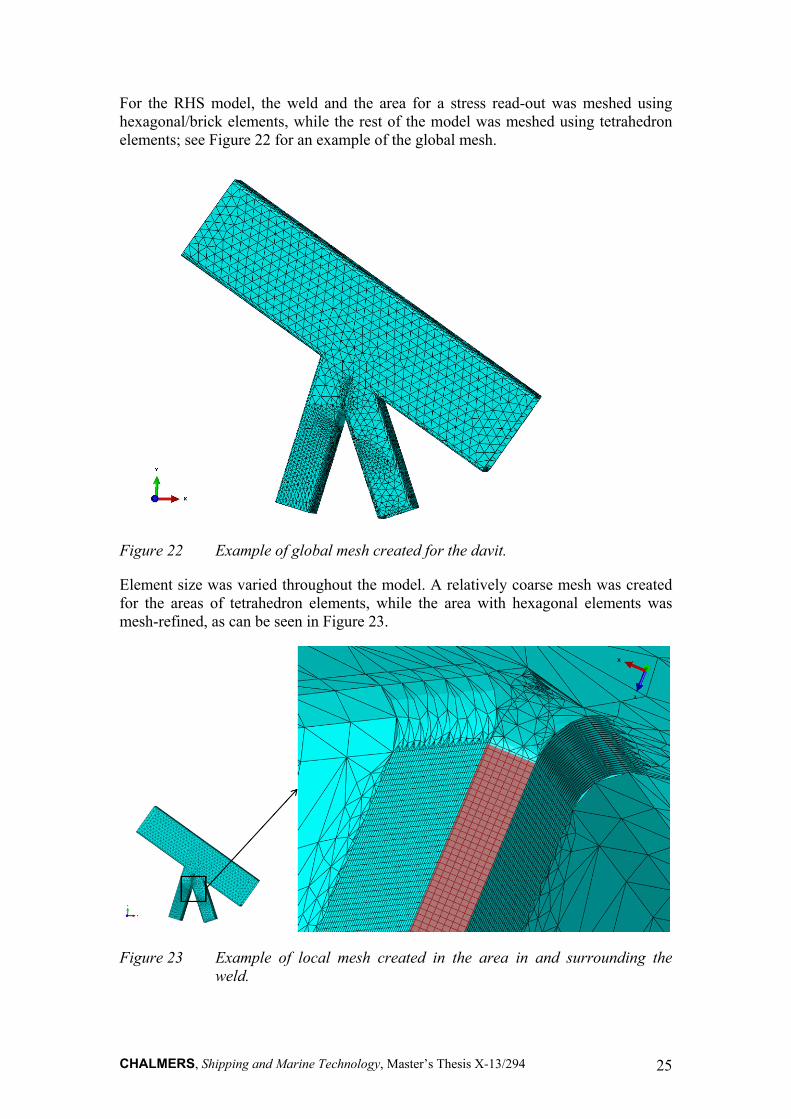
Solid quadratic elements were used for the entire model, i.e. either 20-node hexagonal elements (C3D20 in Abaqus/CAE User's Manual) or 10-node tetragonal elements (C3D10) for the model to be able to better represent the actual weld and the steep stress gradients surrounding the weld, see Fricke (2010). Examples of such elements are shown in Figure 21.
Figure 21 a) 10-node quadratic tetrahedron element b) 20-node quadratic brick element.
CHALMERS, Shipping and Marine Technology, Master’s Thesis X-13/294 25
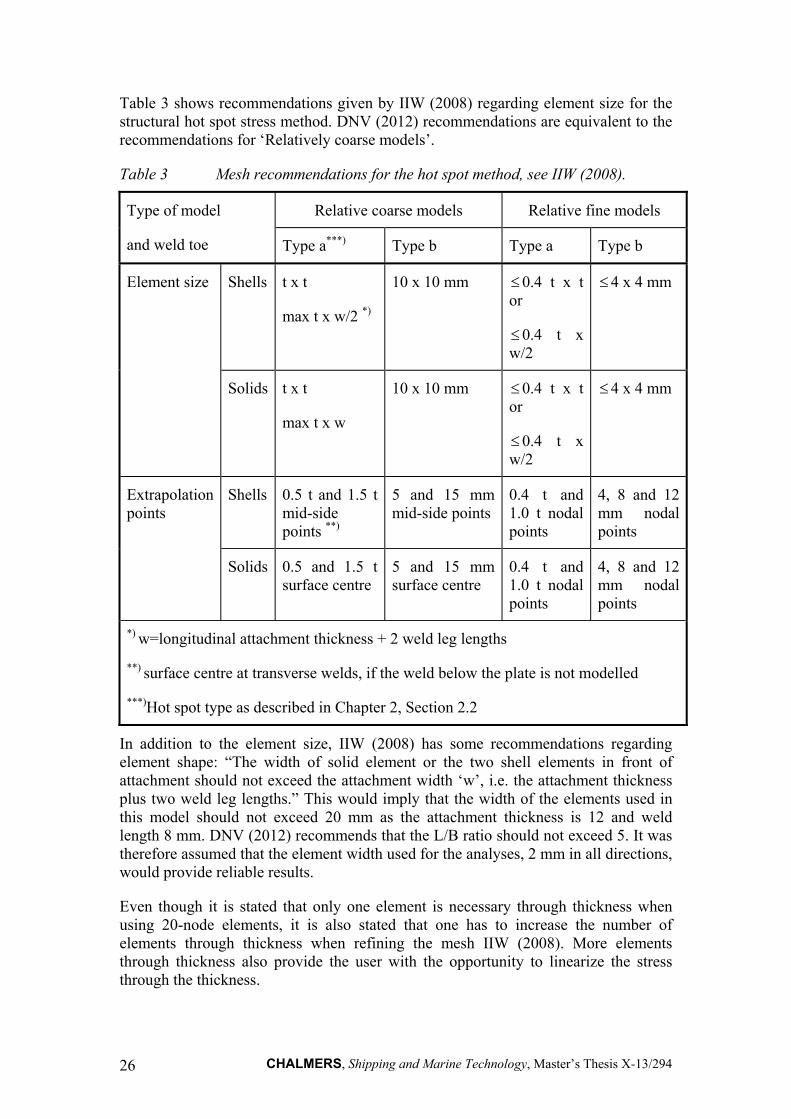
For the RHS model, the weld and the area for a stress read-out was meshed using hexagonal/brick elements, while the rest of the model was meshed using tetrahedron elements; see Figure 22 for an example of the global mesh.
Figure 22 Example of global mesh created for the davit.
Element size was varied throughout the model. A relatively coarse mesh was created for the areas of tetrahedron elements, while the area with hexagonal elements was mesh-refined, as can be seen in Figure 23.
Figure 23 Example of local mesh created in the area in and surrounding the weld.
CHALMERS, Shipping and Marine Technology, Master’s Thesis X-13/294 26
Table 3 shows recommendations given by IIW (2008) regarding element size for the structural hot spot stress method. DNV (2012) recommendations are equivalent to the recommendations for ‘Relatively coarse models’.
Table 3 Mesh recommendations for the hot spot method, see IIW (2008).
Type of model
and weld toe
Relative coarse models Relative fine models
Type a***) Type b Type a Type b
Element size Shells t x t
max t x w/2 *)
10 x 10 mm 0.4 t x t or
0.4 t x w/2
4 x 4 mm
Solids t x t
max t x w
10 x 10 mm 0.4 t x t or
0.4 t x w/2
4 x 4 mm
Extrapolation points
Shells 0.5 t and 1.5 t mid-side points **)
5 and 15 mm mid-side points
0.4 t and 1.0 t nodal points
4, 8 and 12 mm nodal points
Solids 0.5 and 1.5 t surface centre
5 and 15 mm surface centre
0.4 t and 1.0 t nodal points
4, 8 and 12 mm nodal points
*) w=longitudinal attachment thickness + 2 weld leg lengths
**) surface centre at transverse welds, if the weld below the plate is not modelled
***)Hot spot type as described in Chapter 2, Section 2.2
In addition to the element size, IIW (2008) has some recommendations regarding element shape: “The width of solid element or the two shell elements in front of attachment should not exceed the attachment width ‘w’, i.e. the attachment thickness plus two weld leg lengths.” This would imply that the width of the elements used in this model should not exceed 20 mm as the attachment thickness is 12 and weld length 8 mm. DNV (2012) recommends that the L/B ratio should not exceed 5. It was therefore assumed that the element width used for the analyses, 2 mm in all directions, would provide reliable results.
Even though it is stated that only one element is necessary through thickness when using 20-node elements, it is also stated that one has to increase the number of elements through thickness when refining the mesh IIW (2008). More elements through thickness also provide the user with the opportunity to linearize the stress through the thickness.
CHALMERS, Shipping and Marine Technology, Master’s Thesis X-13/294 27
For the effective notch stress method, the same methodology was used for creating the mesh regarding the element type and shape. For the mesh size, the recommendation by IIW (2008) and Fricke (2010), shown in Table 4, was followed.
Table 4 Recommendations for element size, see Fricke (2010).
Element type
Relative size
Size for r = 1mm
No. of elements over 45 deg arc
No. of elements over 360 degree arc
Quadratic r/4 0.25 mm 3 24
Linear r/6 0.15 mm 5 40
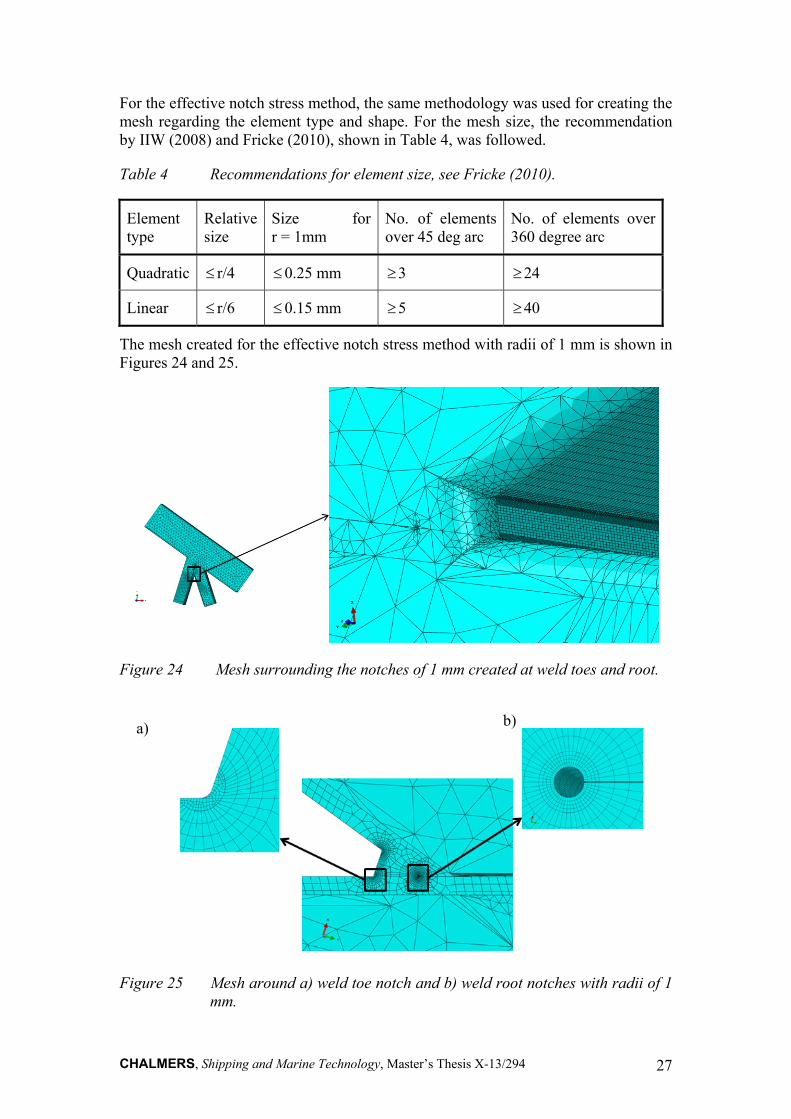
The mesh created for the effective notch stress method with radii of 1 mm is shown in Figures 24 and 25.
Figure 24 Mesh surrounding the notches of 1 mm created at weld toes and root.
Figure 25 Mesh around a) weld toe notch and b) weld root notches with radii of 1 mm.
a) b)
CHALMERS, Shipping and Marine Technology, Master’s Thesis X-13/294 28
3.1.3 Material and boundary conditions
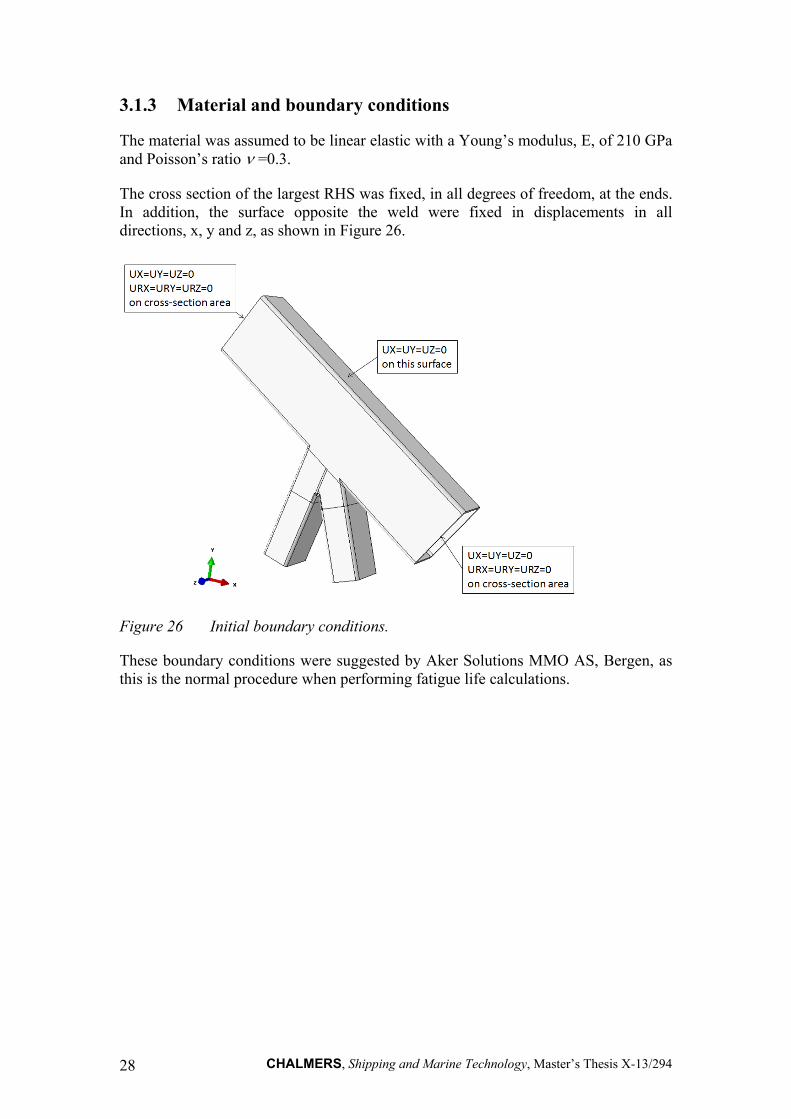
The material was assumed to be linear elastic with a Young’s modulus, E, of 210 GPa and Poisson’s ratio =0.3.
The cross section of the largest RHS was fixed, in all degrees of freedom, at the ends. In addition, the surface opposite the weld were fixed in displacements in all directions, x, y and z, as shown in Figure 26.
Figure 26 Initial boundary conditions.
These boundary conditions were suggested by Aker Solutions MMO AS, Bergen, as this is the normal procedure when performing fatigue life calculations.
CHALMERS, Shipping and Marine Technology, Master’s Thesis X-13/294 29
3.1.4 Load cases
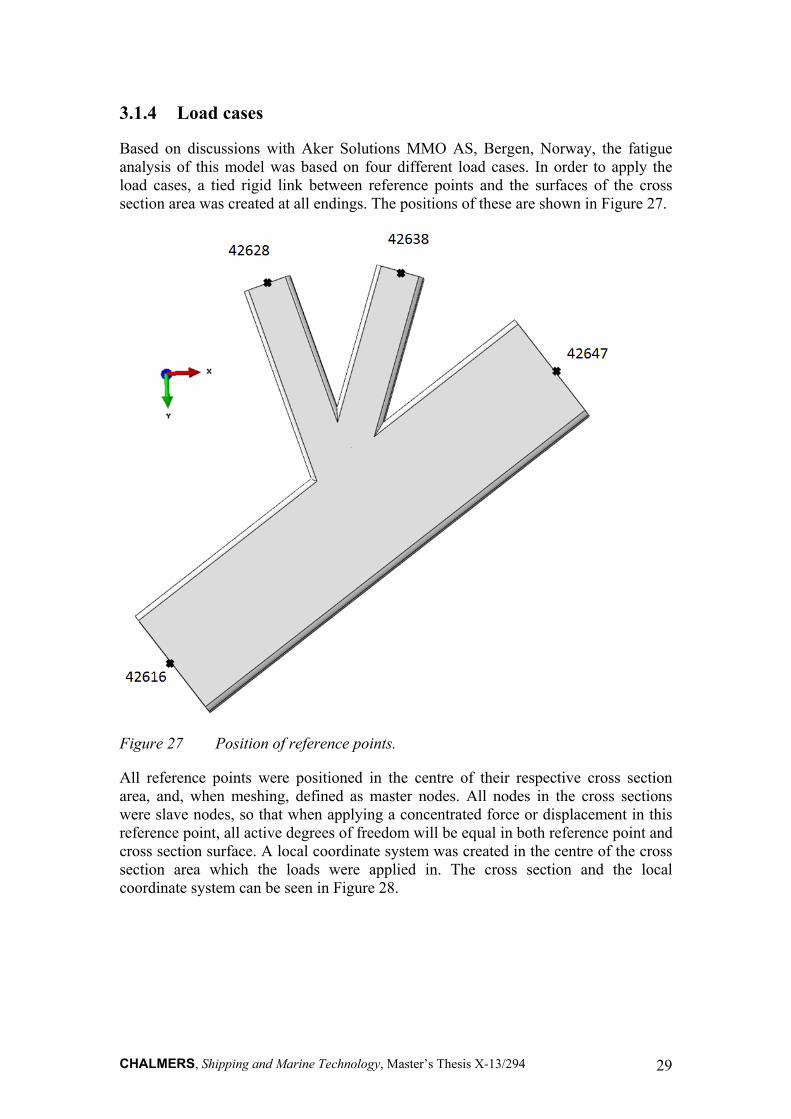
Based on discussions with Aker Solutions MMO AS, Bergen, Norway, the fatigue analysis of this model was based on four different load cases. In order to apply the load cases, a tied rigid link between reference points and the surfaces of the cross section area was created at all endings. The positions of these are shown in Figure 27.
Figure 27 Position of reference points.
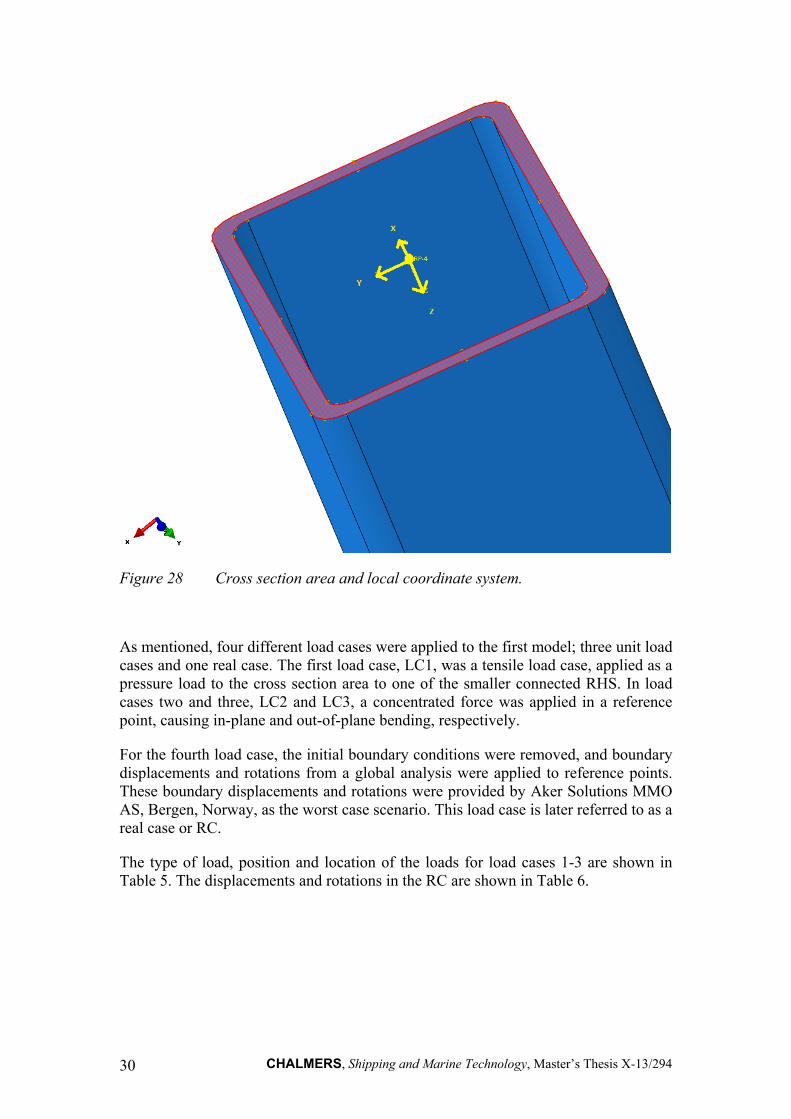
All reference points were positioned in the centre of their respective cross section area, and, when meshing, defined as master nodes. All nodes in the cross sections were slave nodes, so that when applying a concentrated force or displacement in this reference point, all active degrees of freedom will be equal in both reference point and cross section surface. A local coordinate system was created in the centre of the cross section area which the loads were applied in. The cross section and the local coordinate system can be seen in Figure 28.
CHALMERS, Shipping and Marine Technology, Master’s Thesis X-13/294 30
Figure 28 Cross section area and local coordinate system.
As mentioned, four different load cases were applied to the first model; three unit load cases and one real case. The first load case, LC1, was a tensile load case, applied as a pressure load to the cross section area to one of the smaller connected RHS. In load cases two and three, LC2 and LC3, a concentrated force was applied in a reference point, causing in-plane and out-of-plane bending, respectively.
For the fourth load case, the initial boundary conditions were removed, and boundary displacements and rotations from a global analysis were applied to reference points. These boundary displacements and rotations were provided by Aker Solutions MMO AS, Bergen, Norway, as the worst case scenario. This load case is later referred to as a real case or RC.
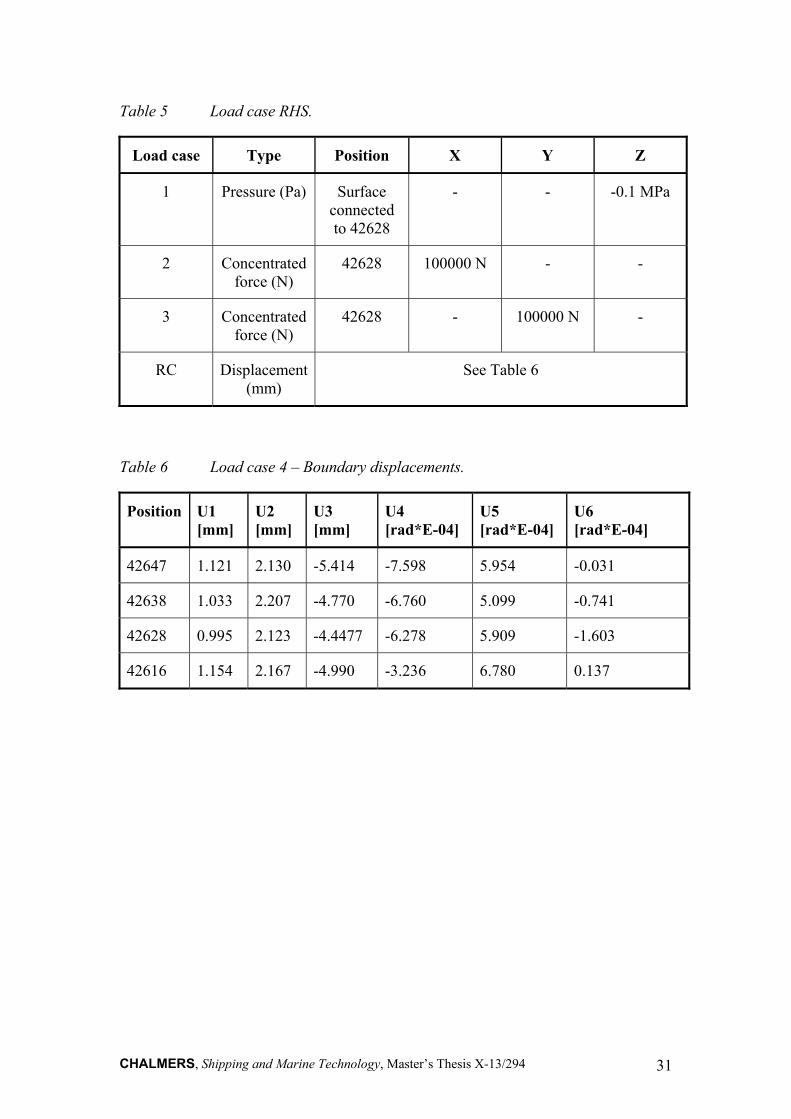
The type of load, position and location of the loads for load cases 1-3 are shown in Table 5. The displacements and rotations in the RC are shown in Table 6.
CHALMERS, Shipping and Marine Technology, Master’s Thesis X-13/294 31
Table 5 Load case RHS.
Load case Type Position X Y Z
1 Pressure (Pa) Surface connected to 42628
- - -0.1 MPa
2 Concentrated force (N)
42628 100000 N - -
3 Concentrated force (N)
42628 - 100000 N -
RC Displacement (mm)
See Table 6
Table 6 Load case 4 – Boundary displacements.
Position U1 [mm]
U2 [mm]
U3 [mm]
U4 [rad*E-04]
U5 [rad*E-04]
U6 [rad*E-04]
42647 1.121 2.130 -5.414 -7.598 5.954 -0.031
42638 1.033 2.207 -4.770 -6.760 5.099 -0.741
42628 0.995 2.123 -4.4477 -6.278 5.909 -1.603
42616 1.154 2.167 -4.990 -3.236 6.780 0.137
CHALMERS, Shipping and Marine Technology, Master’s Thesis X-13/294 32
3.2 K-joint brace (model 2)
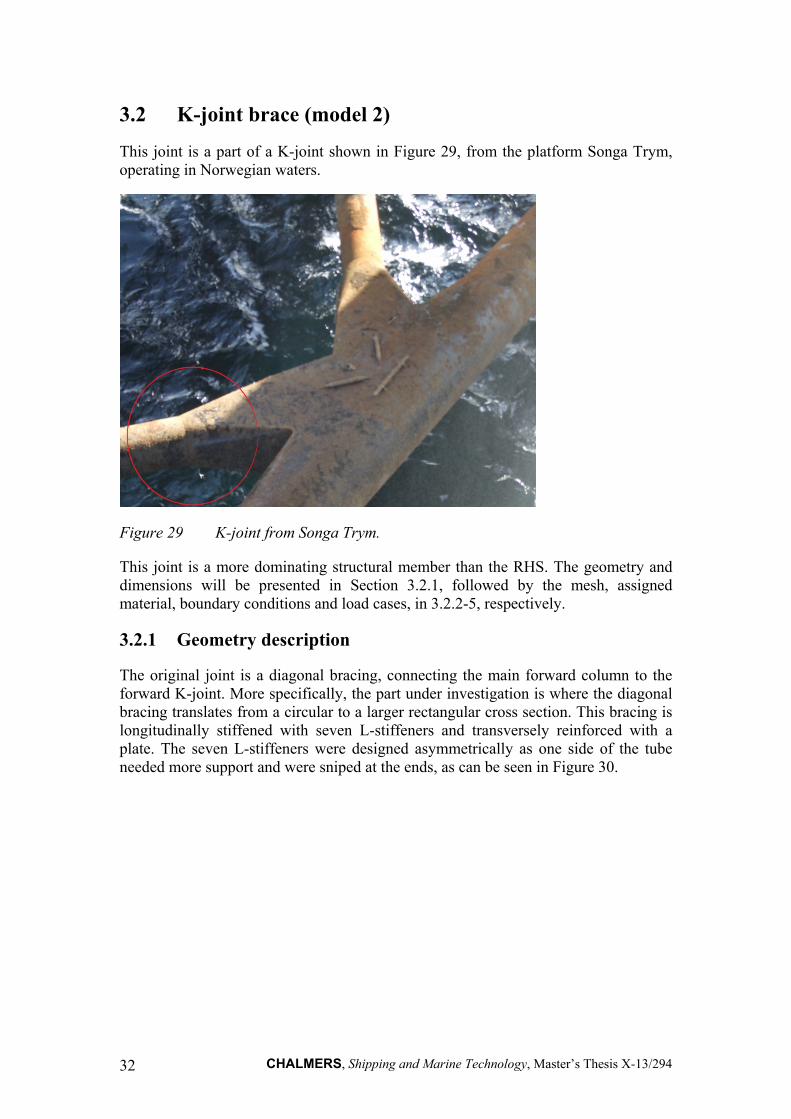
This joint is a part of a K-joint shown in Figure 29, from the platform Songa Trym, operating in Norwegian waters.
Figure 29 K-joint from Songa Trym.
This joint is a more dominating structural member than the RHS. The geometry and dimensions will be presented in Section 3.2.1, followed by the mesh, assigned material, boundary conditions and load cases, in 3.2.2-5, respectively.
3.2.1 Geometry description
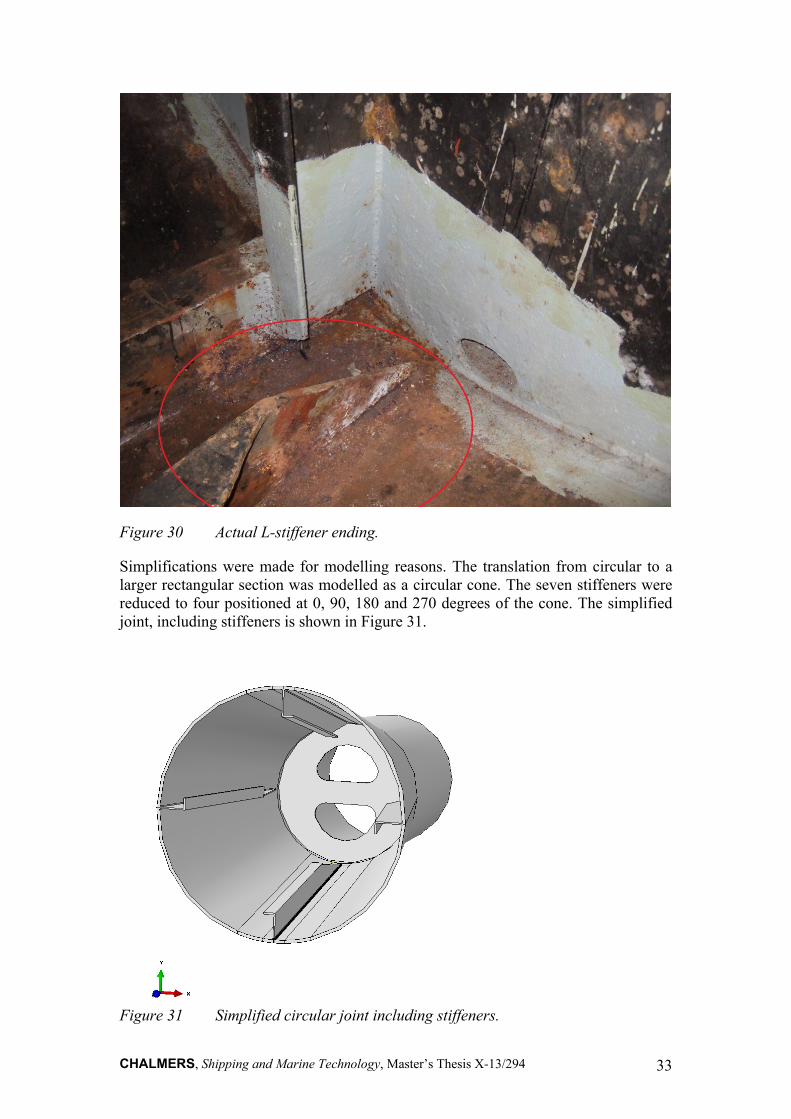
The original joint is a diagonal bracing, connecting the main forward column to the forward K-joint. More specifically, the part under investigation is where the diagonal bracing translates from a circular to a larger rectangular cross section. This bracing is longitudinally stiffened with seven L-stiffeners and transversely reinforced with a plate. The seven L-stiffeners were designed asymmetrically as one side of the tube needed more support and were sniped at the ends, as can be seen in Figure 30.
CHALMERS, Shipping and Marine Technology, Master’s Thesis X-13/294 33
Figure 30 Actual L-stiffener ending.
Simplifications were made for modelling reasons. The translation from circular to a larger rectangular section was modelled as a circular cone. The seven stiffeners were reduced to four positioned at 0, 90, 180 and 270 degrees of the cone. The simplified joint, including stiffeners is shown in Figure 31.
Figure 31 Simplified circular joint including stiffeners.
CHALMERS, Shipping and Marine Technology, Master’s Thesis X-13/294 34
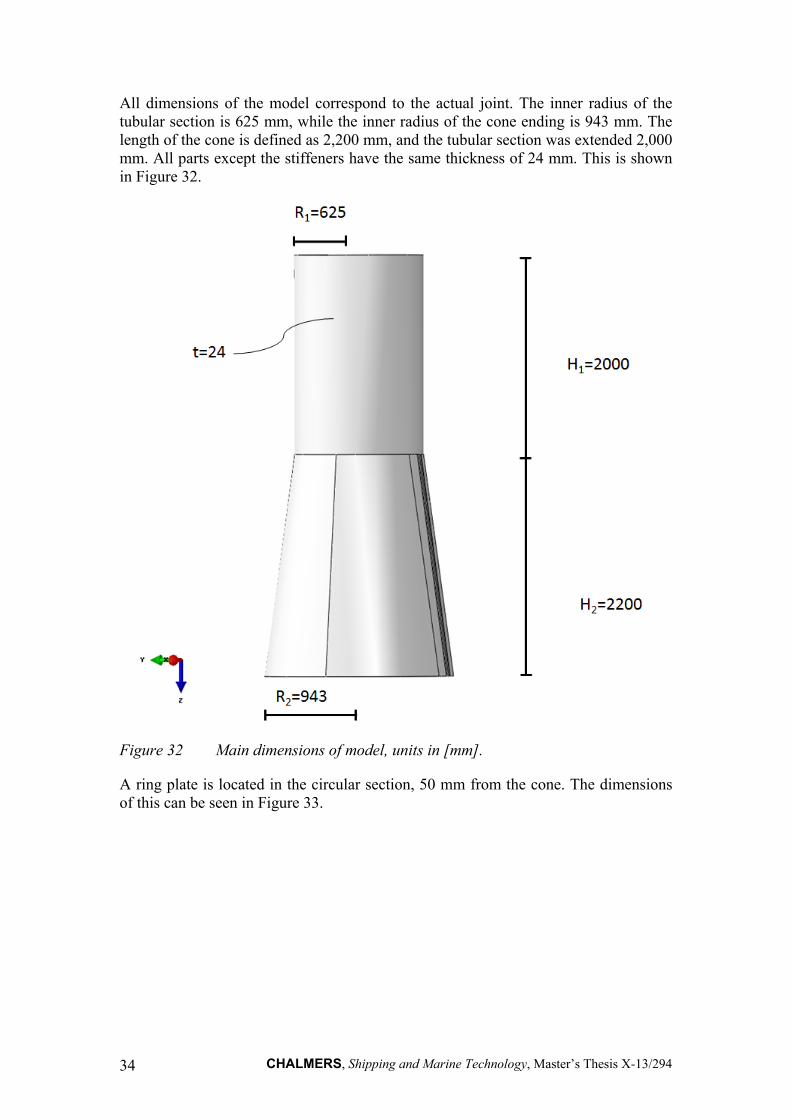
All dimensions of the model correspond to the actual joint. The inner radius of the tubular section is 625 mm, while the inner radius of the cone ending is 943 mm. The length of the cone is defined as 2,200 mm, and the tubular section was extended 2,000 mm. All parts except the stiffeners have the same thickness of 24 mm. This is shown in Figure 32.
Figure 32 Main dimensions of model, units in [mm].
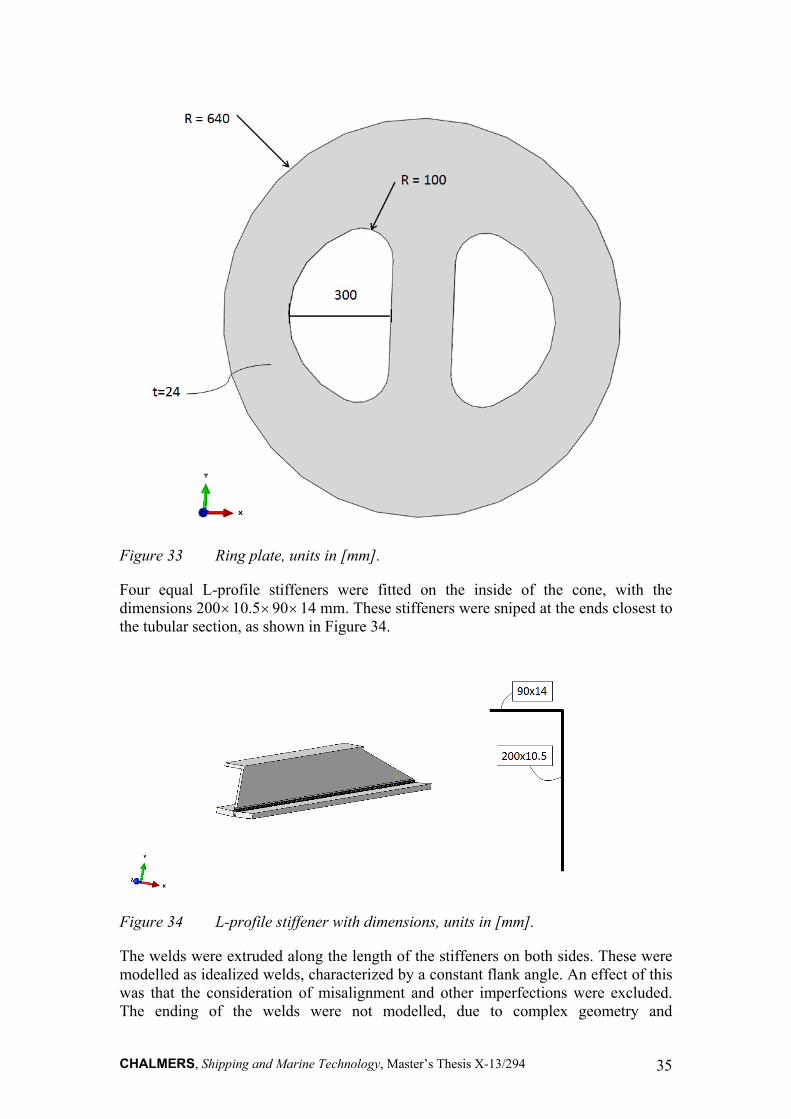
A ring plate is located in the circular section, 50 mm from the cone. The dimensions of this can be seen in Figure 33.
CHALMERS, Shipping and Marine Technology, Master’s Thesis X-13/294 35
Figure 33 Ring plate, units in [mm].
Four equal L-profile stiffeners were fitted on the inside of the cone, with the dimensions 20010.59014 mm. These stiffeners were sniped at the ends closest to the tubular section, as shown in Figure 34.
Figure 34 L-profile stiffener with dimensions, units in [mm].
The welds were extruded along the length of the stiffeners on both sides. These were modelled as idealized welds, characterized by a constant flank angle. An effect of this was that the consideration of misalignment and other imperfections were excluded. The ending of the welds were not modelled, due to complex geometry and
CHALMERS, Shipping and Marine Technology, Master’s Thesis X-13/294 36
uncertainties in the drawings. The largest problems occurred when attempting to model the root in the weld ending for the effective notch stress method. The simplified modelling procedure was agreed upon after consultation with a supervisor at Aker Solutions MMO AS, Bergen.
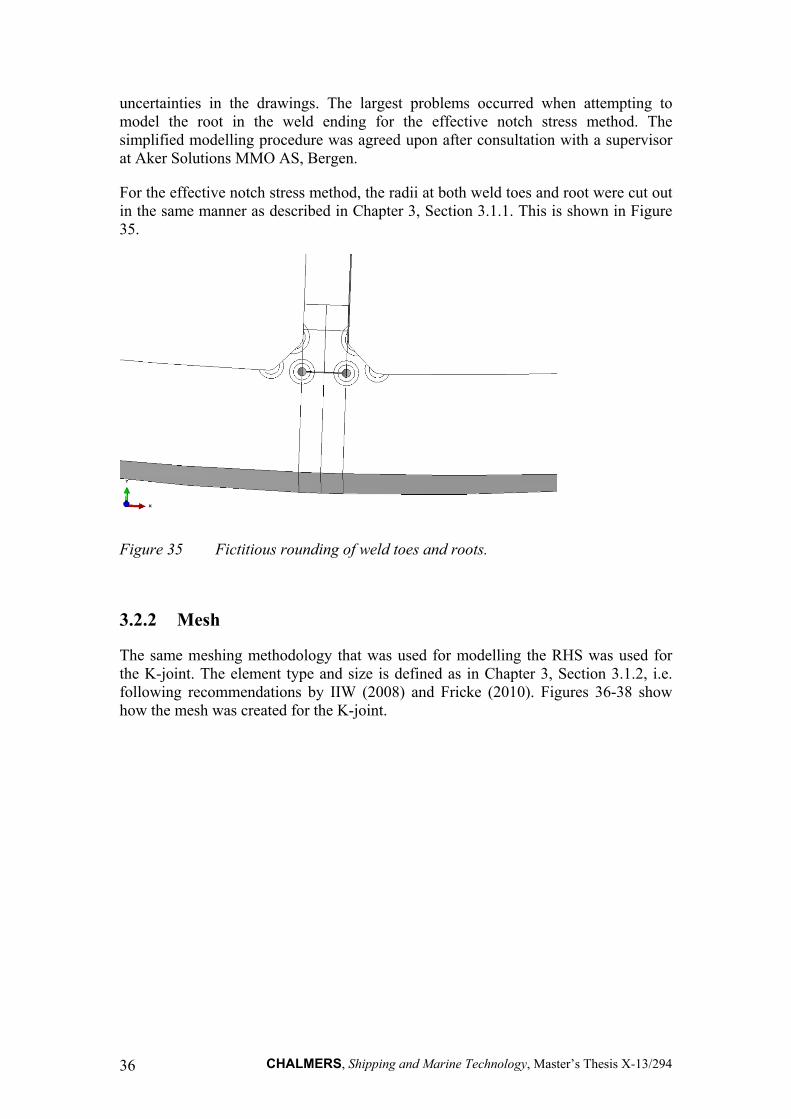
For the effective notch stress method, the radii at both weld toes and root were cut out in the same manner as described in Chapter 3, Section 3.1.1. This is shown in Figure 35.
Figure 35 Fictitious rounding of weld toes and roots.
3.2.2 Mesh
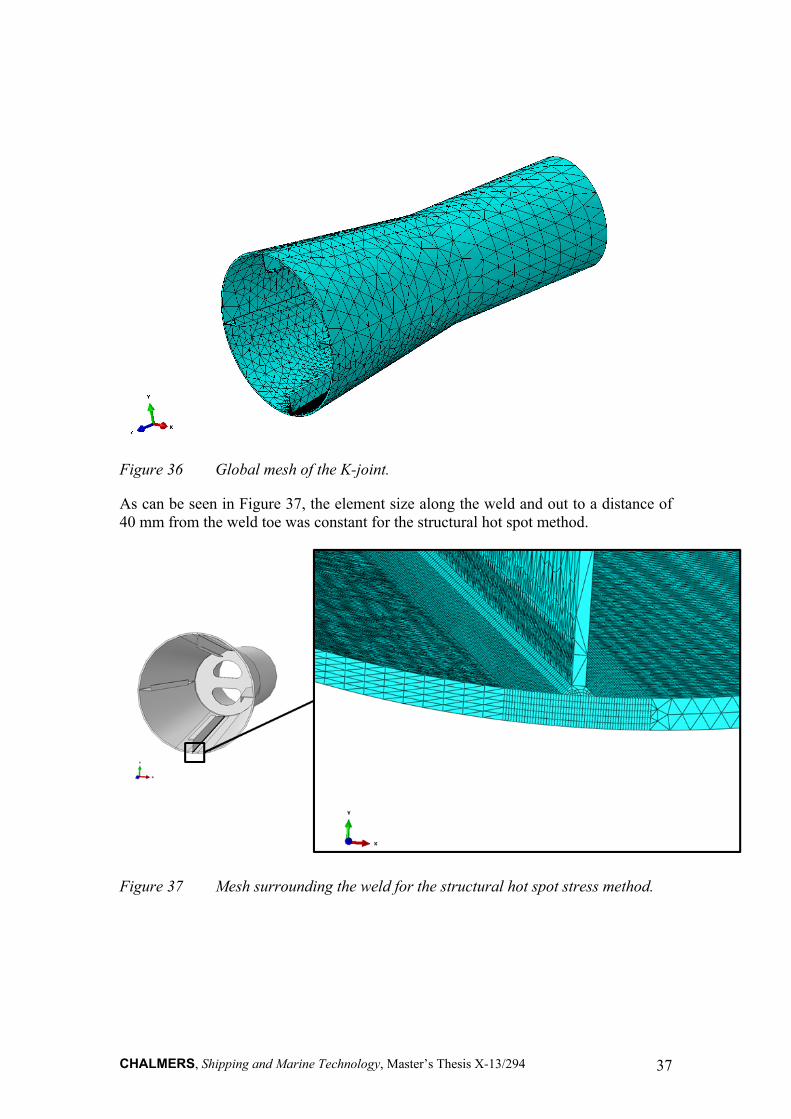
The same meshing methodology that was used for modelling the RHS was used for the K-joint. The element type and size is defined as in Chapter 3, Section 3.1.2, i.e. following recommendations by IIW (2008) and Fricke (2010). Figures 36-38 show how the mesh was created for the K-joint.
CHALMERS, Shipping and Marine Technology, Master’s Thesis X-13/294 37
Figure 36 Global mesh of the K-joint.
As can be seen in Figure 37, the element size along the weld and out to a distance of 40 mm from the weld toe was constant for the structural hot spot method.
Figure 37 Mesh surrounding the weld for the structural hot spot stress method.
CHALMERS, Shipping and Marine Technology, Master’s Thesis X-13/294 38
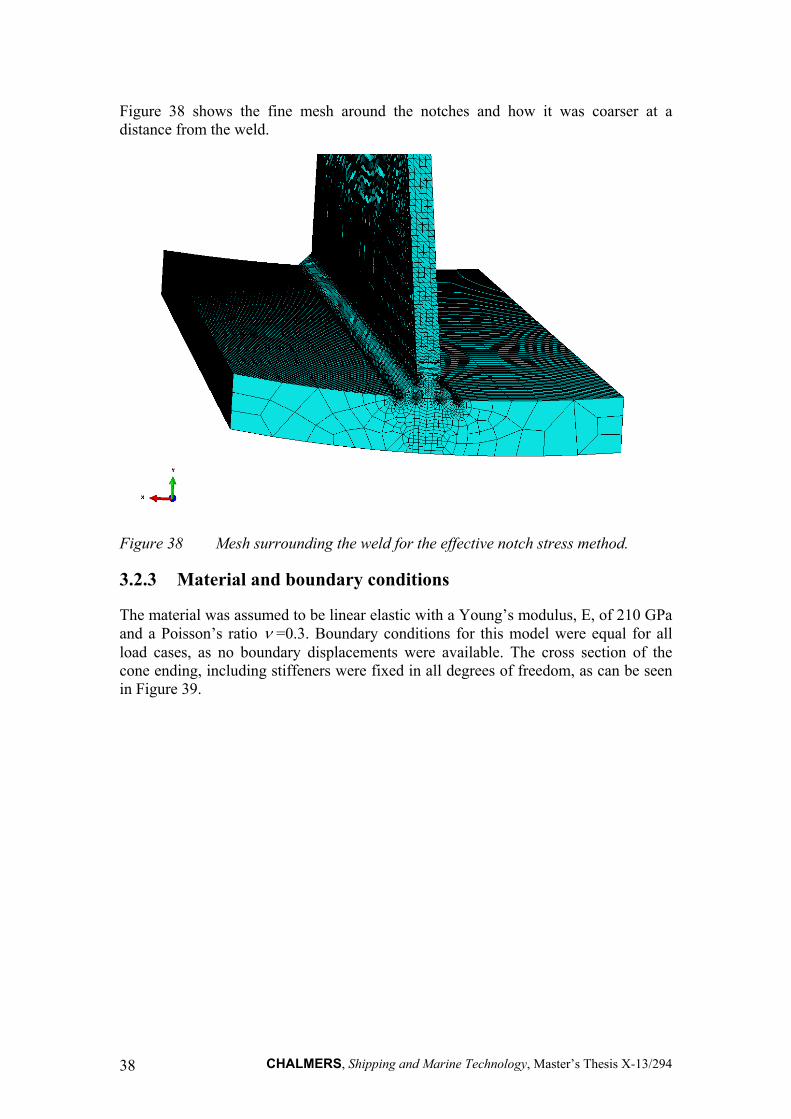
Figure 38 shows the fine mesh around the notches and how it was coarser at a distance from the weld.
Figure 38 Mesh surrounding the weld for the effective notch stress method.
3.2.3 Material and boundary conditions
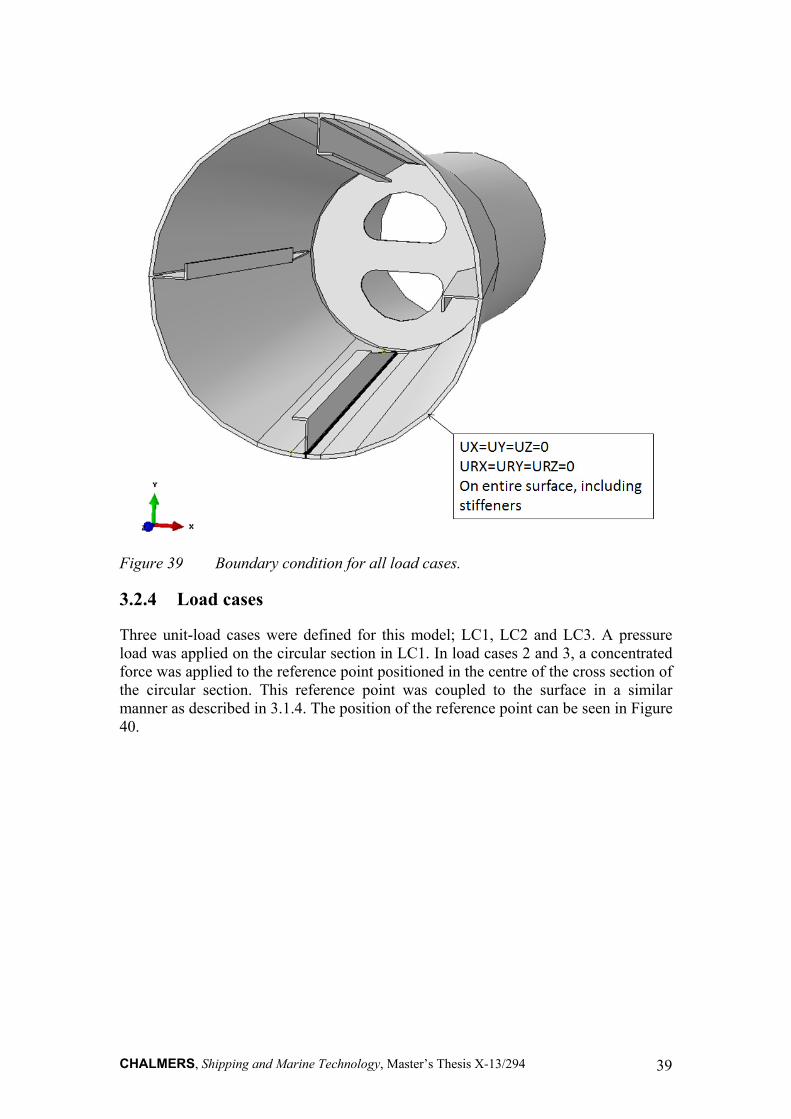
The material was assumed to be linear elastic with a Young’s modulus, E, of 210 GPa and a Poisson’s ratio =0.3. Boundary conditions for this model were equal for all load cases, as no boundary displacements were available. The cross section of the cone ending, including stiffeners were fixed in all degrees of freedom, as can be seen in Figure 39.
CHALMERS, Shipping and Marine Technology, Master’s Thesis X-13/294 39
Figure 39 Boundary condition for all load cases.
3.2.4 Load cases
Three unit-load cases were defined for this model; LC1, LC2 and LC3. A pressure load was applied on the circular section in LC1. In load cases 2 and 3, a concentrated force was applied to the reference point positioned in the centre of the cross section of the circular section. This reference point was coupled to the surface in a similar manner as described in 3.1.4. The position of the reference point can be seen in Figure 40.

CHALMERS, Shipping and Marine Technology, Master’s Thesis X-13/294 40
Figure 40 Reference point on the K-joint.
In this model no real case studies were available, meaning that all the load cases were unit loads. Values and type of load can be seen in Table 7.
Table 7 Load cases the K-joint.
LC Type Unit X Y Z
1 Pressure Pa -1 000 000
2 Concentrated force N 1 000 000
3 Concentrated force N 1 000 000
3.3 Mesh convergence study
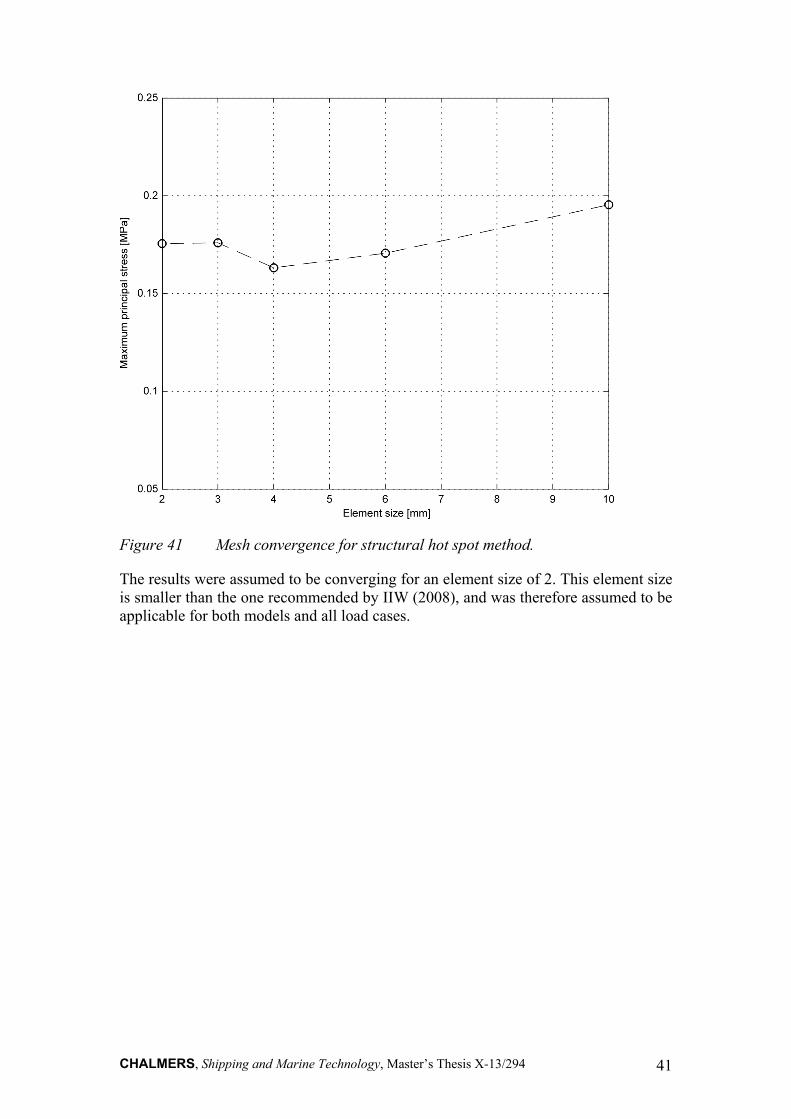
A mesh convergence study was performed for the structural hot spot method to ensure that the element size was not too coarse. The boundary conditions described in Chapter 3, Section 3.1.3 and load case 1 described in Chapter 3, Section 3.1.4 were used for the convergence analysis. Analyses were performed for the RHS with element sizes varying from 10 to 2 mm. Nodal stresses were extracted with a distance of 0.5t, where t was the plate thickness from the weld toe. The reason for this was to avoid the increasingly high stresses at the sharp weld toe when the element size was decreased. Figure 41 shows maximum principle stresses extracted from the surface node of the first element from the weld edge, plotted against element sizes.
CHALMERS, Shipping and Marine Technology, Master’s Thesis X-13/294 41
Figure 41 Mesh convergence for structural hot spot method.
The results were assumed to be converging for an element size of 2. This element size is smaller than the one recommended by IIW (2008), and was therefore assumed to be applicable for both models and all load cases.
CHALMERS, Shipping and Marine Technology, Master’s Thesis X-13/294 42
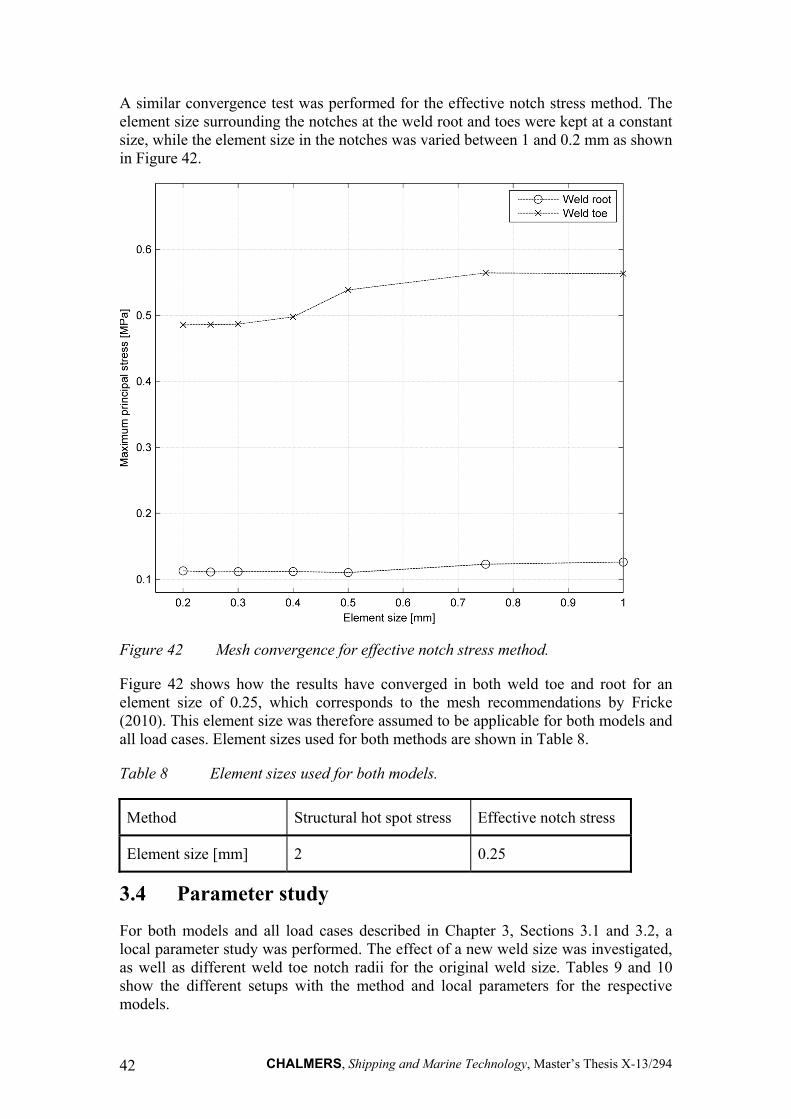
A similar convergence test was performed for the effective notch stress method. The element size surrounding the notches at the weld root and toes were kept at a constant size, while the element size in the notches was varied between 1 and 0.2 mm as shown in Figure 42.
Figure 42 Mesh convergence for effective notch stress method.
Figure 42 shows how the results have converged in both weld toe and root for an element size of 0.25, which corresponds to the mesh recommendations by Fricke (2010). This element size was therefore assumed to be applicable for both models and all load cases. Element sizes used for both methods are shown in Table 8.
Table 8 Element sizes used for both models.
Method Structural hot spot stress Effective notch stress
Element size [mm] 2 0.25
3.4 Parameter study
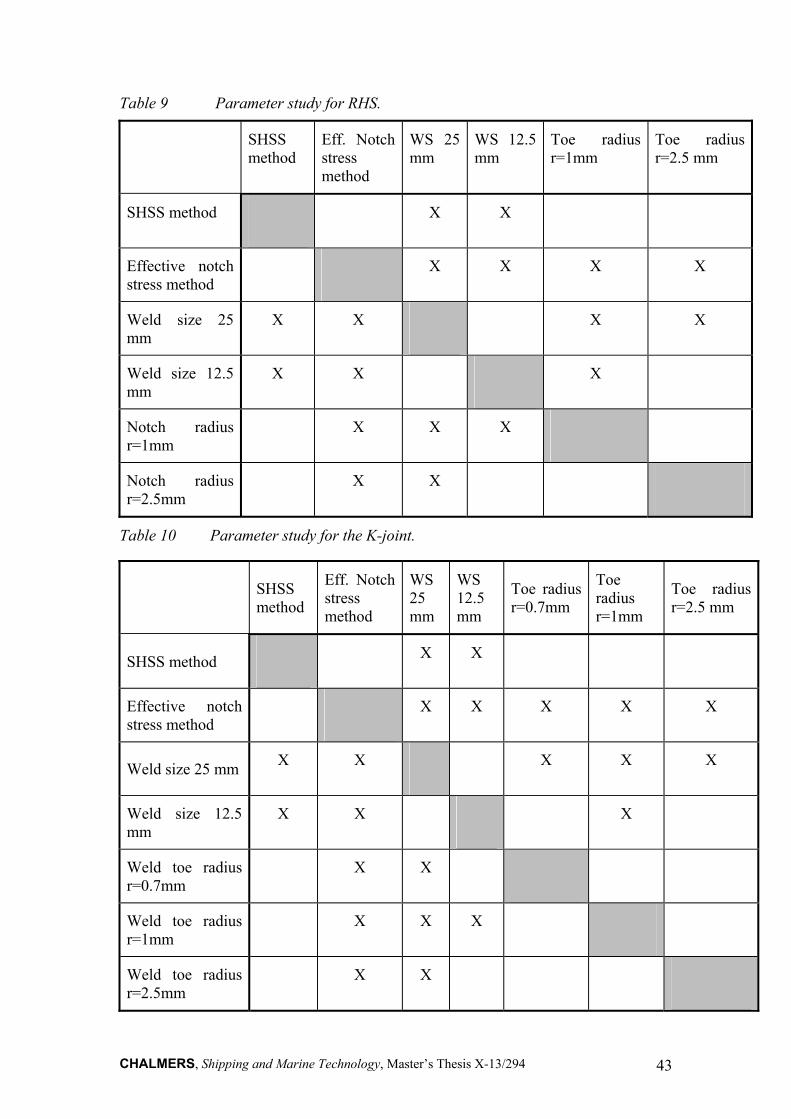
For both models and all load cases described in Chapter 3, Sections 3.1 and 3.2, a local parameter study was performed. The effect of a new weld size was investigated, as well as different weld toe notch radii for the original weld size. Tables 9 and 10 show the different setups with the method and local parameters for the respective models.
CHALMERS, Shipping and Marine Technology, Master’s Thesis X-13/294 43
Table 9 Parameter study for RHS.
SHSS method
Eff. Notch stress method
WS 25 mm
WS 12.5 mm
Toe radius r=1mm
Toe radius r=2.5 mm
SHSS method X X
Effective notch stress method
X X X X
Weld size 25 mm
X X X X
Weld size 12.5 mm
X X X
Notch radius r=1mm
X X X
Notch radius r=2.5mm
X X
Table 10 Parameter study for the K-joint.
SHSS method
Eff. Notch stress method
WS 25 mm
WS 12.5 mm
Toe radius r=0.7mm
Toe radius r=1mm
Toe radius r=2.5 mm
SHSS method X X
Effective notch stress method
X X X X X
Weld size 25 mm X X X X X
Weld size 12.5 mm
X X X
Weld toe radius r=0.7mm
X X
Weld toe radius r=1mm
X X X
Weld toe radius r=2.5mm
X X
CHALMERS, Shipping and Marine Technology, Master’s Thesis X-13/294 44
3.5 Verification of structural hot spot stress analysis methodology
A verification of the structural hot spot stress method was performed according to DNV (2012) to ensure that the calculation method and corresponding results were reliable. Analyses were performed on thoroughly tested specimens to compare results and to calculate a correction factor by using Equation (12).
calculatedHotspot
ettHotspotf
arg (12)
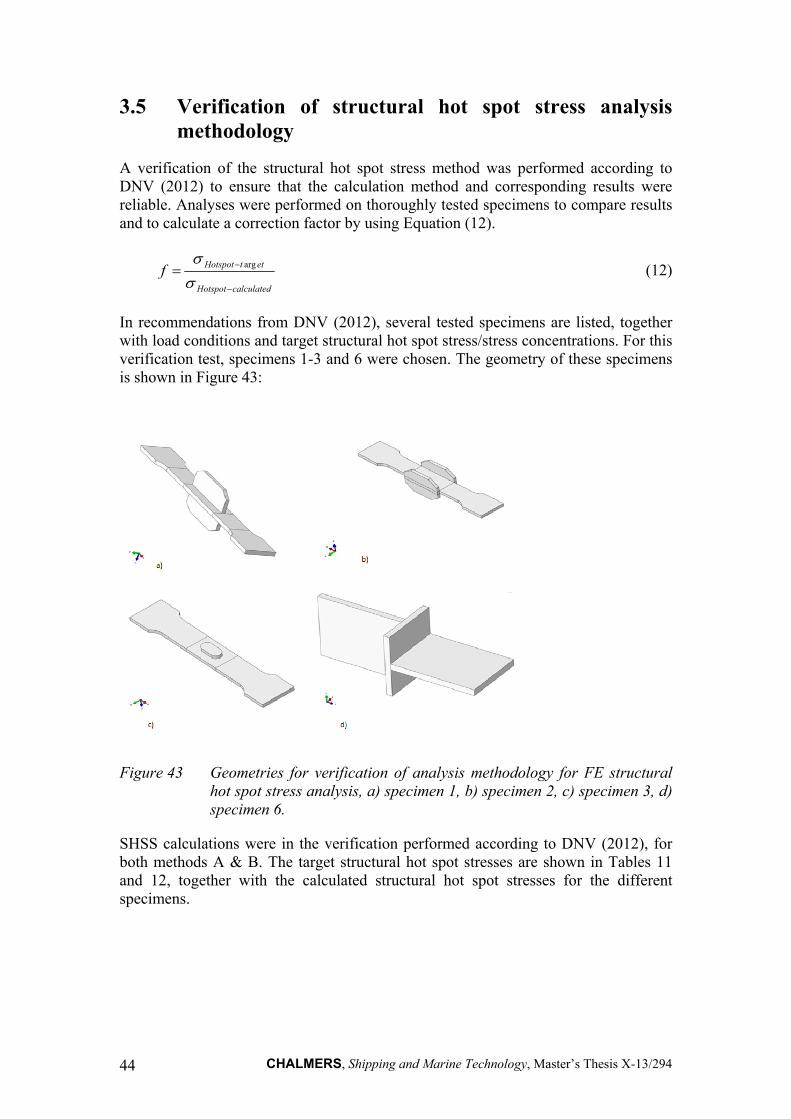
In recommendations from DNV (2012), several tested specimens are listed, together with load conditions and target structural hot spot stress/stress concentrations. For this verification test, specimens 1-3 and 6 were chosen. The geometry of these specimens is shown in Figure 43:
Figure 43 Geometries for verification of analysis methodology for FE structural hot spot stress analysis, a) specimen 1, b) specimen 2, c) specimen 3, d) specimen 6.
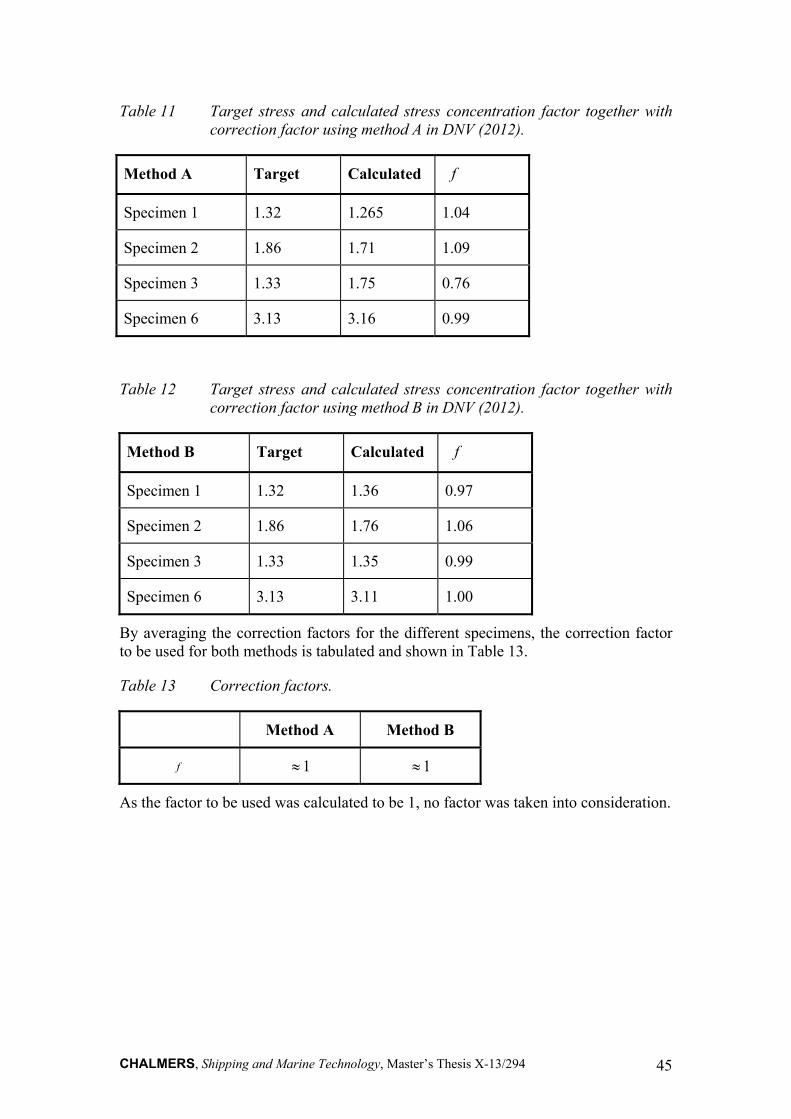
SHSS calculations were in the verification performed according to DNV (2012), for both methods A & B. The target structural hot spot stresses are shown in Tables 11 and 12, together with the calculated structural hot spot stresses for the different specimens.
CHALMERS, Shipping and Marine Technology, Master’s Thesis X-13/294 45
Table 11 Target stress and calculated stress concentration factor together with correction factor using method A in DNV (2012).
Method A Target Calculated f
Specimen 1 1.32 1.265 1.04
Specimen 2 1.86 1.71 1.09
Specimen 3 1.33 1.75 0.76
Specimen 6 3.13 3.16 0.99
Table 12 Target stress and calculated stress concentration factor together with correction factor using method B in DNV (2012).
Method B Target Calculated f
Specimen 1 1.32 1.36 0.97
Specimen 2 1.86 1.76 1.06
Specimen 3 1.33 1.35 0.99
Specimen 6 3.13 3.11 1.00
By averaging the correction factors for the different specimens, the correction factor to be used for both methods is tabulated and shown in Table 13.
Table 13 Correction factors.
Method A Method B
f 1 1
As the factor to be used was calculated to be 1, no factor was taken into consideration.
CHALMERS, Shipping and Marine Technology, Master’s Thesis X-13/294 46
3.6 Validation of effective notch stress analysis methodology
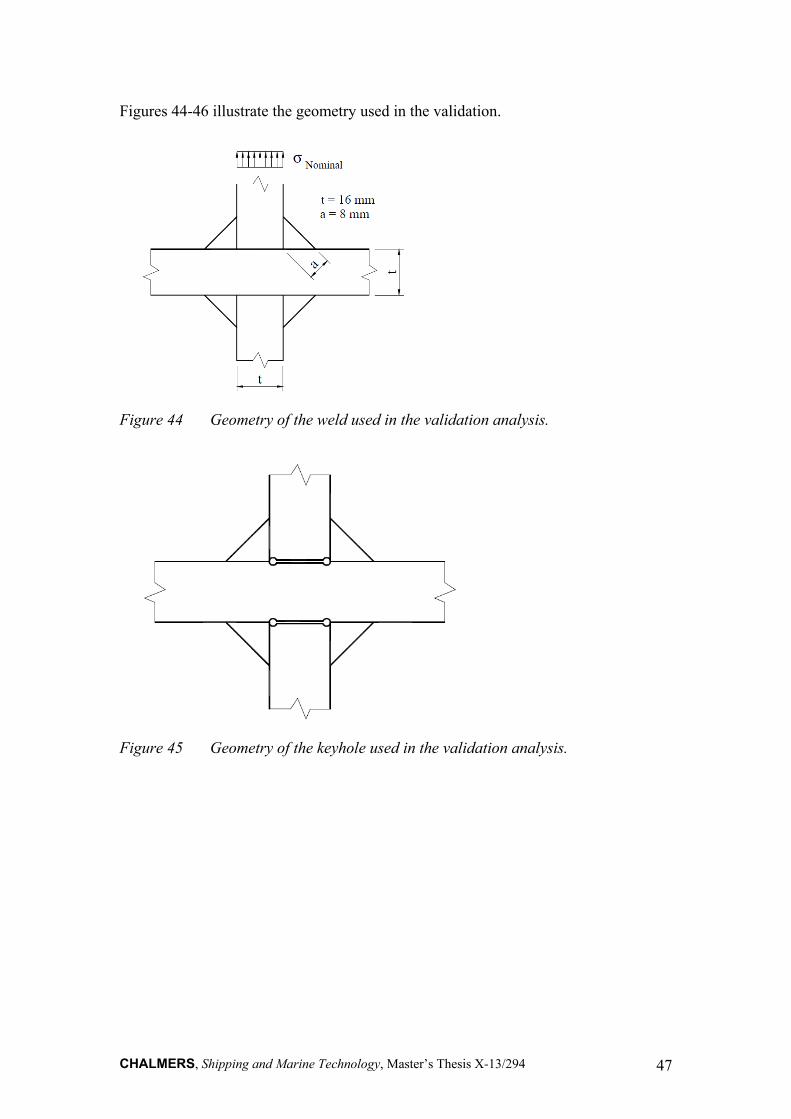
Validation of the analysis methodology was performed, according DNV (2012), for the effective notch stress method. This was done by using a cruciform joint shown in Figure 44. By performing an analysis of this joint and checking the notch stress obtained in both the weld root and the toe, one could see the precision of the modelling/meshing, etc. The target notch stress at the weld root was found to be 3.17 times the nominal stress in the plate, while the target notch stress in the weld root was found to be 6.25 times the nominal stress in the fillet weld. The nominal stress in the weld is given as:
at
nomW 2
[MPa] (13)
where t is the thickness of the member and a is the throat thickness of the weld.
If the stresses obtained differed much from the target values, the accuracy of the methodology would have to be reconsidered. Sources of error could be element types, mesh size and the extraction of notch surface stress.
Several methods of meshing, element types and read out points were tested in order to find the optimum combination. Quadratic elements with an element length of 0.25 mm gave pleasing results for the weld root. Maximum principal stresses were found to be 6.26 times the nominal stress in the fillet weld, which was very close to the target value of 6.25.
Linear element types seemed to underestimate the notch stresses in the weld root, leading to non-conservative results. This was therefore avoided by using quadratic elements.
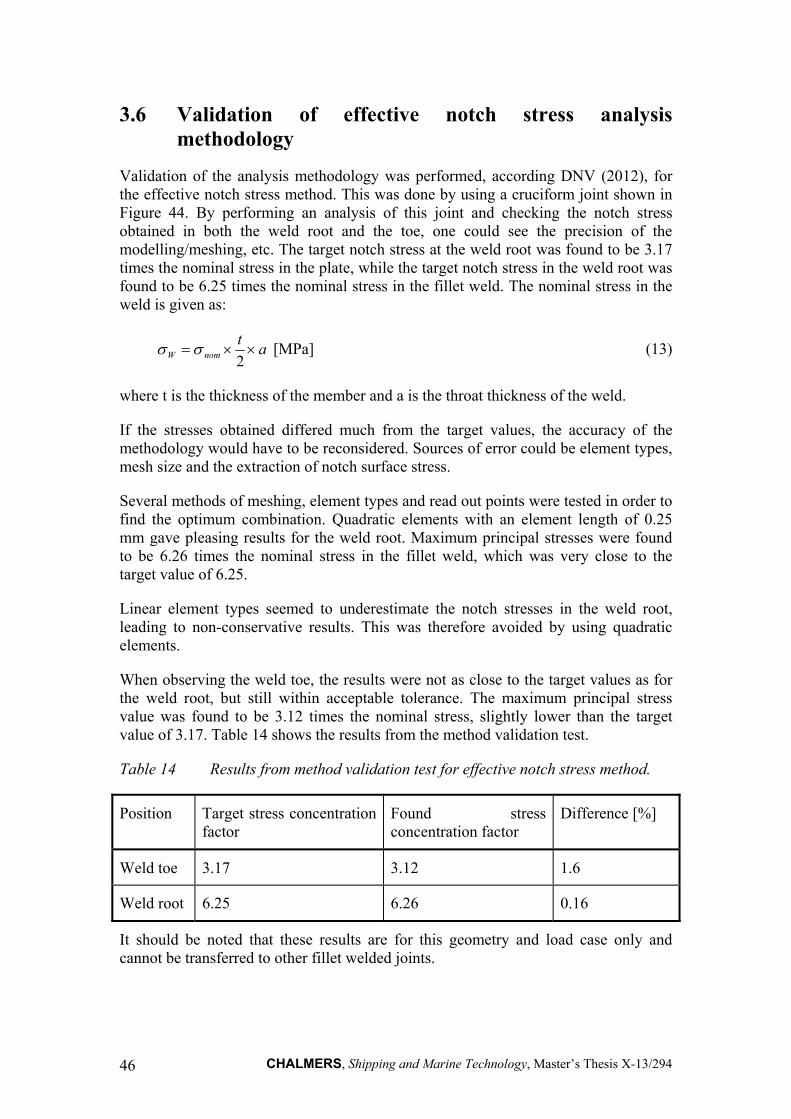
When observing the weld toe, the results were not as close to the target values as for the weld root, but still within acceptable tolerance. The maximum principal stress value was found to be 3.12 times the nominal stress, slightly lower than the target value of 3.17. Table 14 shows the results from the method validation test.
Table 14 Results from method validation test for effective notch stress method.
Position Target stress concentration factor
Found stress concentration factor
Difference [%]
Weld toe 3.17 3.12 1.6
Weld root 6.25 6.26 0.16
It should be noted that these results are for this geometry and load case only and cannot be transferred to other fillet welded joints.
CHALMERS, Shipping and Marine Technology, Master’s Thesis X-13/294 47
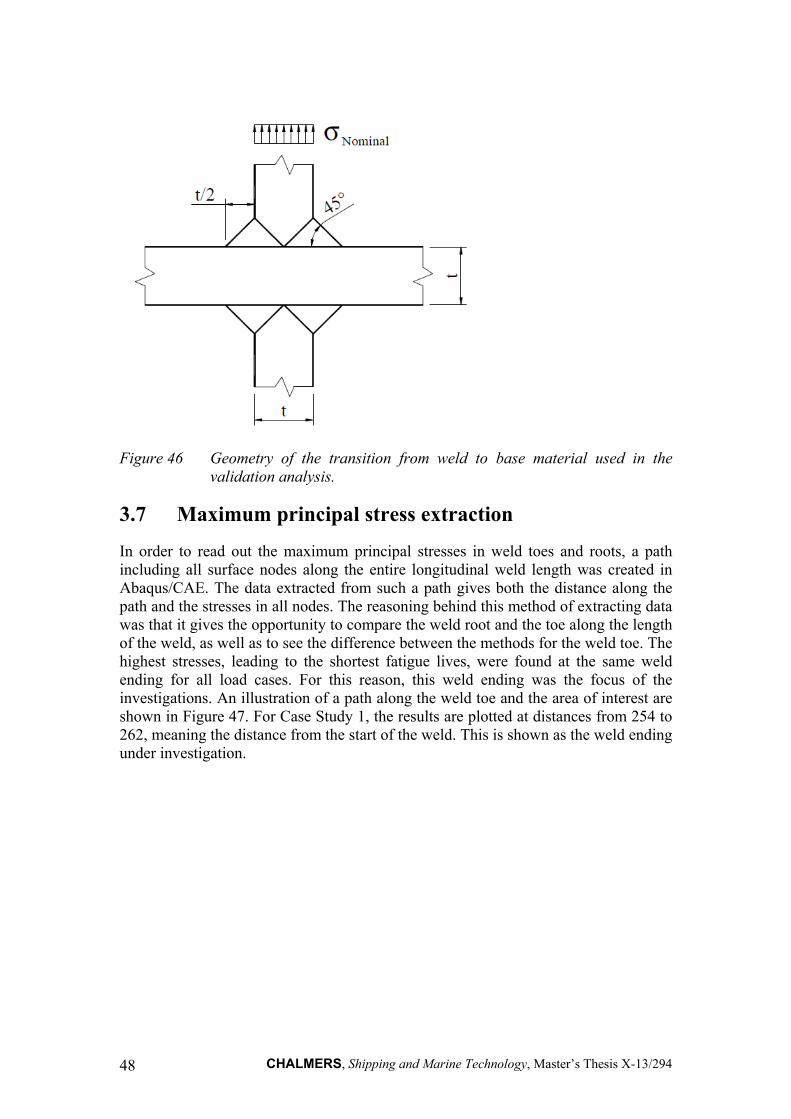
Figures 44-46 illustrate the geometry used in the validation.
Figure 44 Geometry of the weld used in the validation analysis.
Figure 45 Geometry of the keyhole used in the validation analysis.
CHALMERS, Shipping and Marine Technology, Master’s Thesis X-13/294 48
Figure 46 Geometry of the transition from weld to base material used in the validation analysis.
3.7 Maximum principal stress extraction
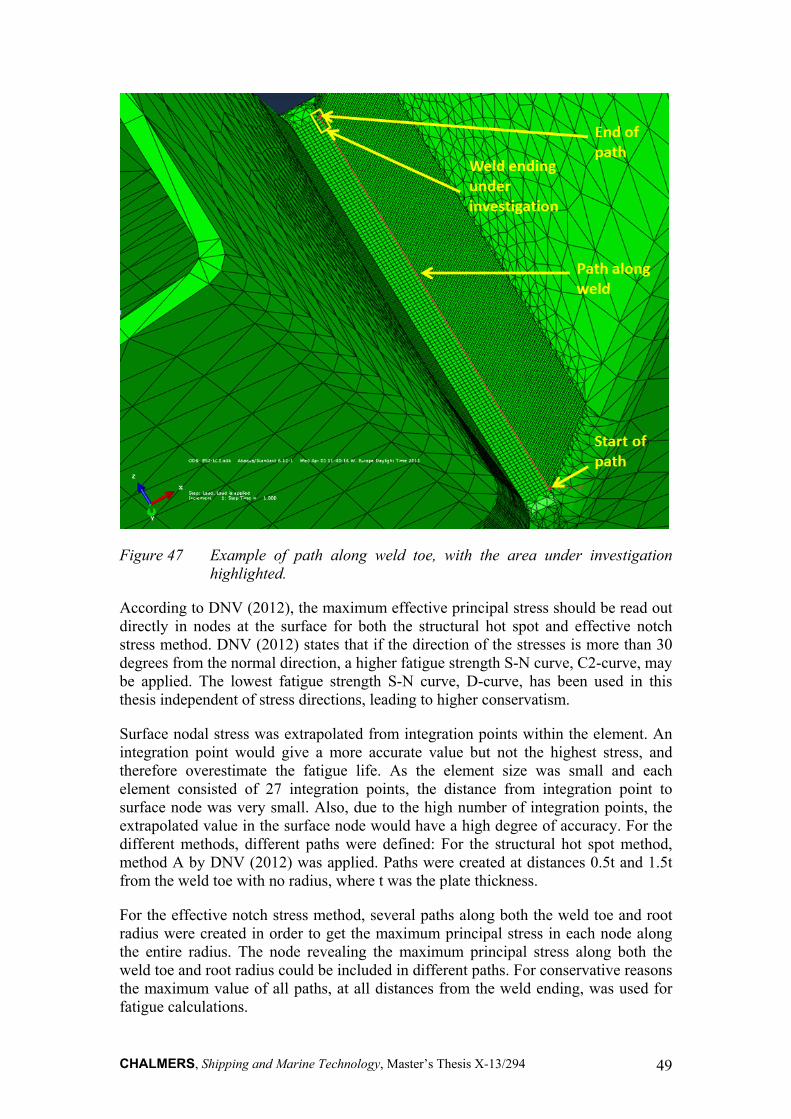
In order to read out the maximum principal stresses in weld toes and roots, a path including all surface nodes along the entire longitudinal weld length was created in Abaqus/CAE. The data extracted from such a path gives both the distance along the path and the stresses in all nodes. The reasoning behind this method of extracting data was that it gives the opportunity to compare the weld root and the toe along the length of the weld, as well as to see the difference between the methods for the weld toe. The highest stresses, leading to the shortest fatigue lives, were found at the same weld ending for all load cases. For this reason, this weld ending was the focus of the investigations. An illustration of a path along the weld toe and the area of interest are shown in Figure 47. For Case Study 1, the results are plotted at distances from 254 to 262, meaning the distance from the start of the weld. This is shown as the weld ending under investigation.
CHALMERS, Shipping and Marine Technology, Master’s Thesis X-13/294 49
Figure 47 Example of path along weld toe, with the area under investigation highlighted.
According to DNV (2012), the maximum effective principal stress should be read out directly in nodes at the surface for both the structural hot spot and effective notch stress method. DNV (2012) states that if the direction of the stresses is more than 30 degrees from the normal direction, a higher fatigue strength S-N curve, C2-curve, may be applied. The lowest fatigue strength S-N curve, D-curve, has been used in this thesis independent of stress directions, leading to higher conservatism.
Surface nodal stress was extrapolated from integration points within the element. An integration point would give a more accurate value but not the highest stress, and therefore overestimate the fatigue life. As the element size was small and each element consisted of 27 integration points, the distance from integration point to surface node was very small. Also, due to the high number of integration points, the extrapolated value in the surface node would have a high degree of accuracy. For the different methods, different paths were defined: For the structural hot spot method, method A by DNV (2012) was applied. Paths were created at distances 0.5t and 1.5t from the weld toe with no radius, where t was the plate thickness.
For the effective notch stress method, several paths along both the weld toe and root radius were created in order to get the maximum principal stress in each node along the entire radius. The node revealing the maximum principal stress along both the weld toe and root radius could be included in different paths. For conservative reasons the maximum value of all paths, at all distances from the weld ending, was used for fatigue calculations.

CHALMERS, Shipping and Marine Technology, Master’s Thesis X-13/294 50
CHALMERS, Shipping and Marine Technology, Master’s Thesis X-13/294 51
4 Results and discussions
This chapter presents and discusses the results for the two different models, the rectangular hollow section and the Songa Trym K-joint. The chapter is divided into two sections, describing each model separately. The outline is as follows for each section:
Firstly, a comparison of methods is shown and discussed. In this chapter the results from the different methods, structural hot spot and effective notch stress method are presented and compared. The reason for this is to see whether or not there are any consistencies between the methods applied. In Sections, 4.1.1 and 4.2.1, all results taken from the effective notch stress method are taken from the weld toe.
Secondly, the fatigue lives in the weld toe and weld root are compared and discussed. In Sections, 4.1.2 and 4.2.2, the different local weld parameters, weld toe radius and weld size, are varied to see their effect on fatigue life.
It should be noted that the number of cycles to fatigue failure is not the real fatigue life of the structural members, but, rather, the number of cycles to failure calculated for comparison reasons only.
4.1 Rectangular hollow section connection (model 1)
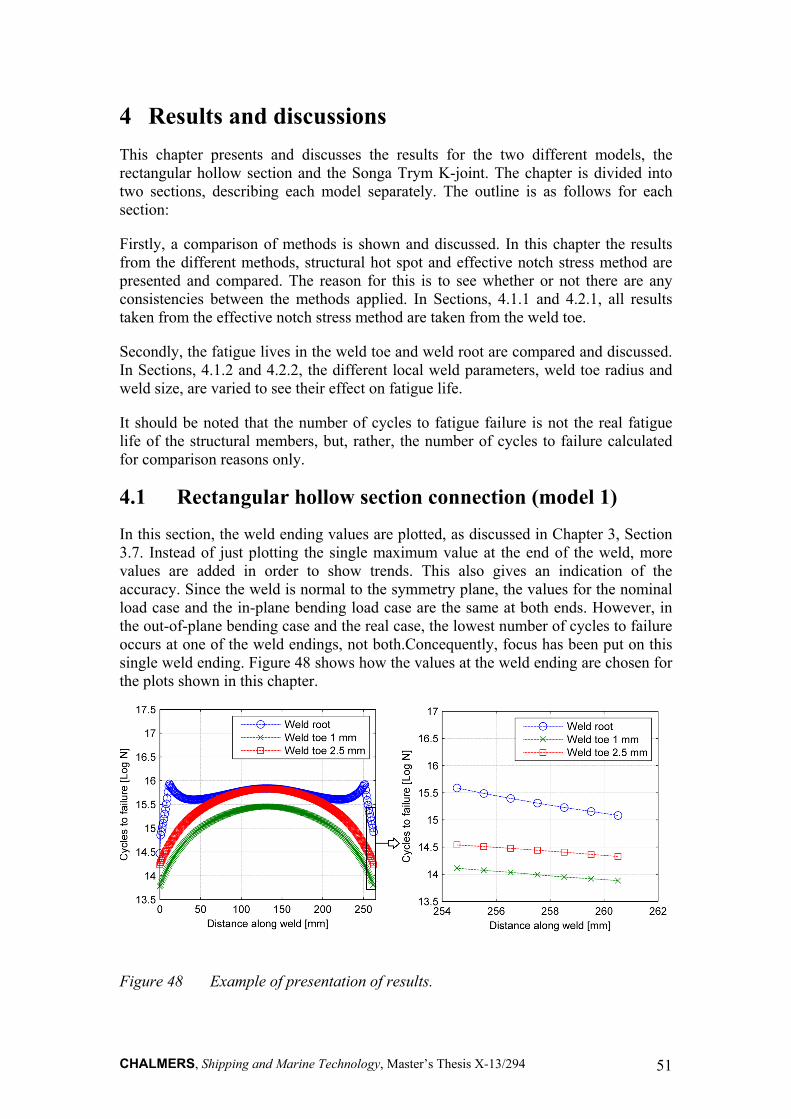
In this section, the weld ending values are plotted, as discussed in Chapter 3, Section 3.7. Instead of just plotting the single maximum value at the end of the weld, more values are added in order to show trends. This also gives an indication of the accuracy. Since the weld is normal to the symmetry plane, the values for the nominal load case and the in-plane bending load case are the same at both ends. However, in the out-of-plane bending case and the real case, the lowest number of cycles to failure occurs at one of the weld endings, not both.Concequently, focus has been put on this single weld ending. Figure 48 shows how the values at the weld ending are chosen for the plots shown in this chapter.
Figure 48 Example of presentation of results.
CHALMERS, Shipping and Marine Technology, Master’s Thesis X-13/294 52
4.1.1 Method comparison
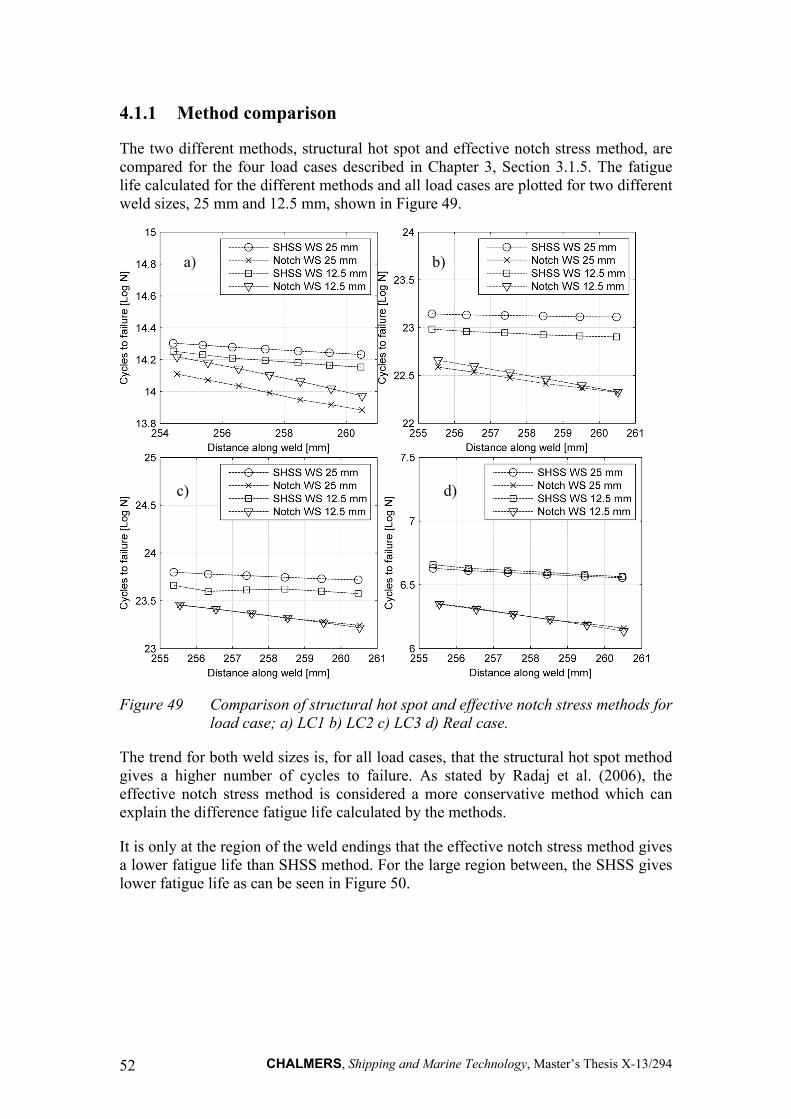
The two different methods, structural hot spot and effective notch stress method, are compared for the four load cases described in Chapter 3, Section 3.1.5. The fatigue life calculated for the different methods and all load cases are plotted for two different weld sizes, 25 mm and 12.5 mm, shown in Figure 49.
Figure 49 Comparison of structural hot spot and effective notch stress methods for load case; a) LC1 b) LC2 c) LC3 d) Real case.
The trend for both weld sizes is, for all load cases, that the structural hot spot method gives a higher number of cycles to failure. As stated by Radaj et al. (2006), the effective notch stress method is considered a more conservative method which can explain the difference fatigue life calculated by the methods.
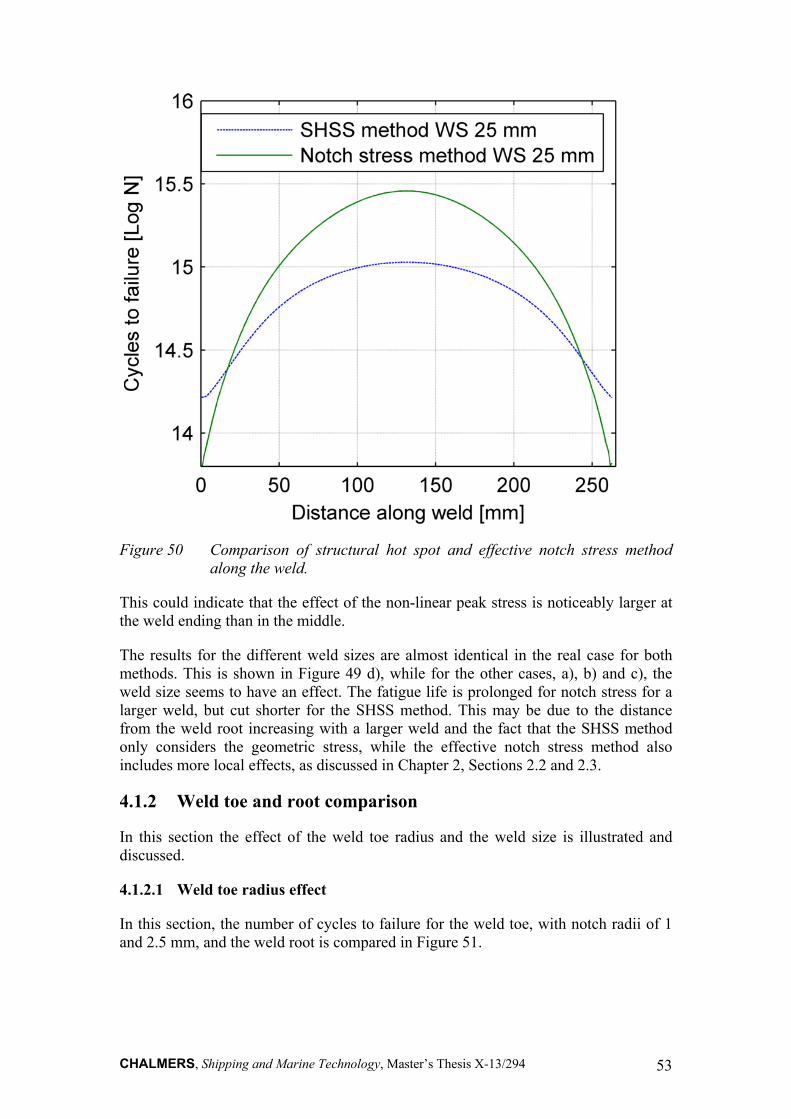
It is only at the region of the weld endings that the effective notch stress method gives a lower fatigue life than SHSS method. For the large region between, the SHSS gives lower fatigue life as can be seen in Figure 50.
a) b)
c) d)
CHALMERS, Shipping and Marine Technology, Master’s Thesis X-13/294 53
Figure 50 Comparison of structural hot spot and effective notch stress method along the weld.
This could indicate that the effect of the non-linear peak stress is noticeably larger at the weld ending than in the middle.
The results for the different weld sizes are almost identical in the real case for both methods. This is shown in Figure 49 d), while for the other cases, a), b) and c), the weld size seems to have an effect. The fatigue life is prolonged for notch stress for a larger weld, but cut shorter for the SHSS method. This may be due to the distance from the weld root increasing with a larger weld and the fact that the SHSS method only considers the geometric stress, while the effective notch stress method also includes more local effects, as discussed in Chapter 2, Sections 2.2 and 2.3.
4.1.2 Weld toe and root comparison
In this section the effect of the weld toe radius and the weld size is illustrated and discussed.
4.1.2.1 Weld toe radius effect
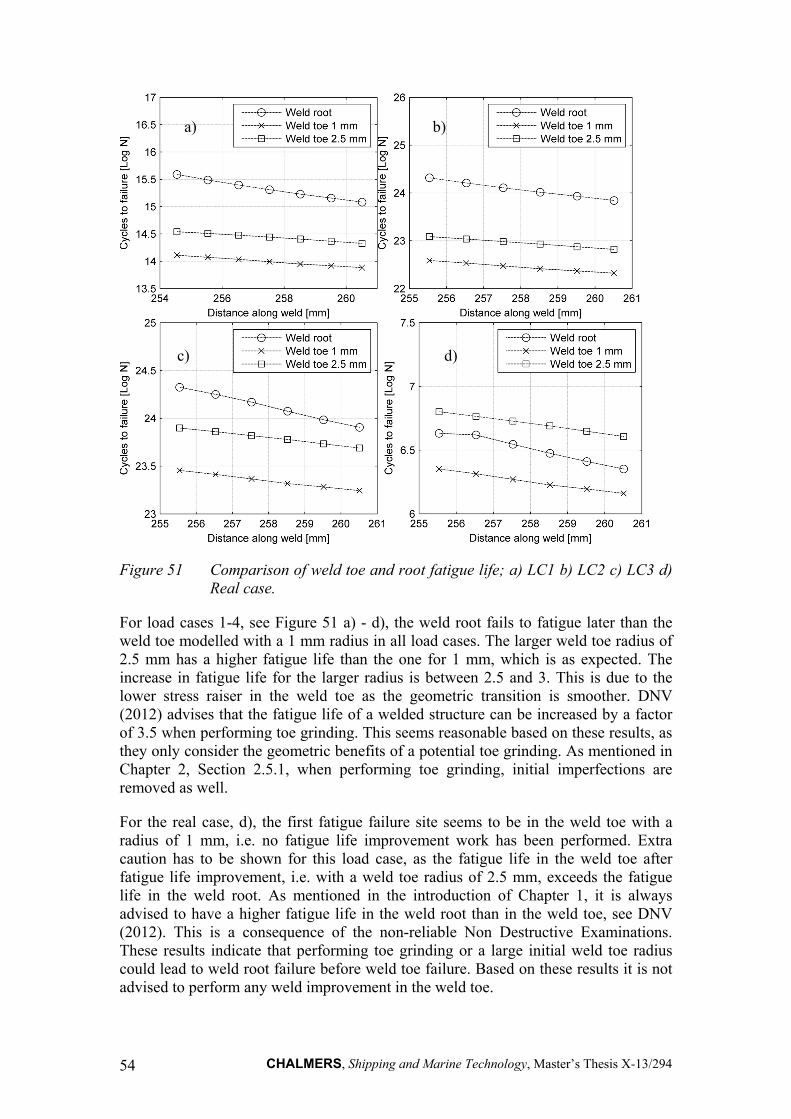
In this section, the number of cycles to failure for the weld toe, with notch radii of 1 and 2.5 mm, and the weld root is compared in Figure 51.
CHALMERS, Shipping and Marine Technology, Master’s Thesis X-13/294 54
Figure 51 Comparison of weld toe and root fatigue life; a) LC1 b) LC2 c) LC3 d) Real case.
For load cases 1-4, see Figure 51 a) - d), the weld root fails to fatigue later than the weld toe modelled with a 1 mm radius in all load cases. The larger weld toe radius of 2.5 mm has a higher fatigue life than the one for 1 mm, which is as expected. The increase in fatigue life for the larger radius is between 2.5 and 3. This is due to the lower stress raiser in the weld toe as the geometric transition is smoother. DNV (2012) advises that the fatigue life of a welded structure can be increased by a factor of 3.5 when performing toe grinding. This seems reasonable based on these results, as they only consider the geometric benefits of a potential toe grinding. As mentioned in Chapter 2, Section 2.5.1, when performing toe grinding, initial imperfections are removed as well.
For the real case, d), the first fatigue failure site seems to be in the weld toe with a radius of 1 mm, i.e. no fatigue life improvement work has been performed. Extra caution has to be shown for this load case, as the fatigue life in the weld toe after fatigue life improvement, i.e. with a weld toe radius of 2.5 mm, exceeds the fatigue life in the weld root. As mentioned in the introduction of Chapter 1, it is always advised to have a higher fatigue life in the weld root than in the weld toe, see DNV (2012). This is a consequence of the non-reliable Non Destructive Examinations. These results indicate that performing toe grinding or a large initial weld toe radius could lead to weld root failure before weld toe failure. Based on these results it is not advised to perform any weld improvement in the weld toe.
a) b)
c) d)
CHALMERS, Shipping and Marine Technology, Master’s Thesis X-13/294 55
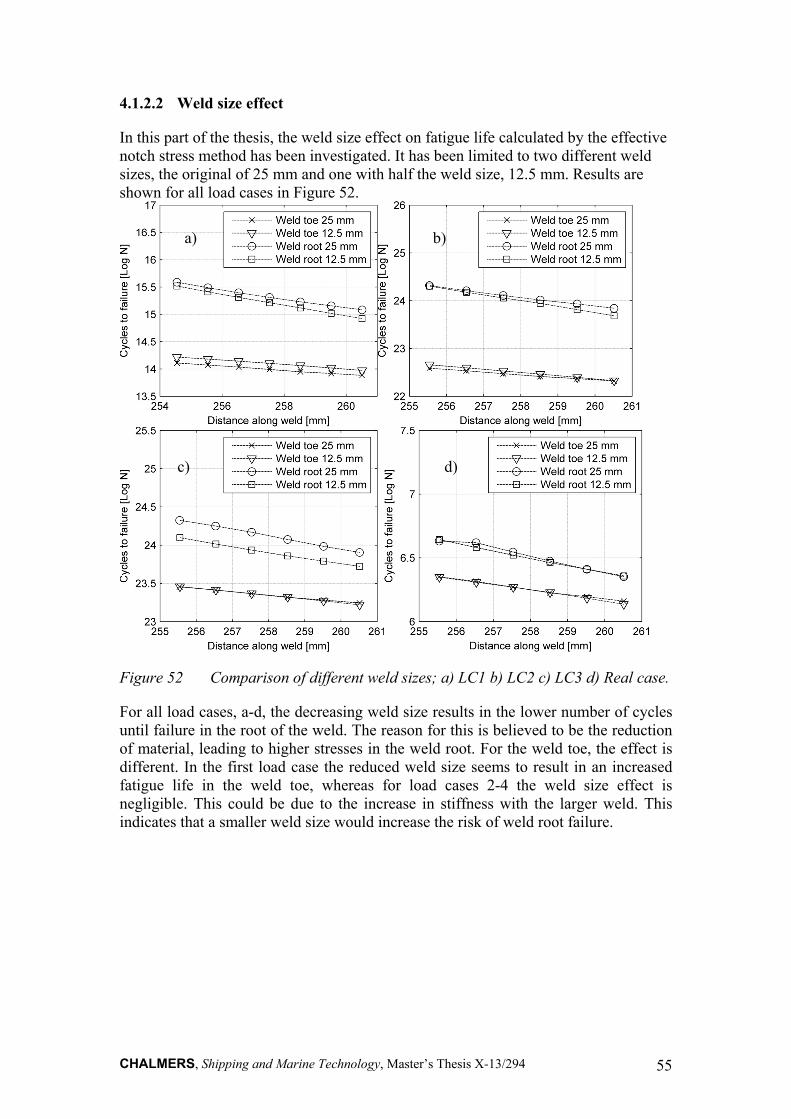
4.1.2.2 Weld size effect
In this part of the thesis, the weld size effect on fatigue life calculated by the effective notch stress method has been investigated. It has been limited to two different weld sizes, the original of 25 mm and one with half the weld size, 12.5 mm. Results are shown for all load cases in Figure 52.
Figure 52 Comparison of different weld sizes; a) LC1 b) LC2 c) LC3 d) Real case.
For all load cases, a-d, the decreasing weld size results in the lower number of cycles until failure in the root of the weld. The reason for this is believed to be the reduction of material, leading to higher stresses in the weld root. For the weld toe, the effect is different. In the first load case the reduced weld size seems to result in an increased fatigue life in the weld toe, whereas for load cases 2-4 the weld size effect is negligible. This could be due to the increase in stiffness with the larger weld. This indicates that a smaller weld size would increase the risk of weld root failure.
a) b)
c) d)
CHALMERS, Shipping and Marine Technology, Master’s Thesis X-13/294 56
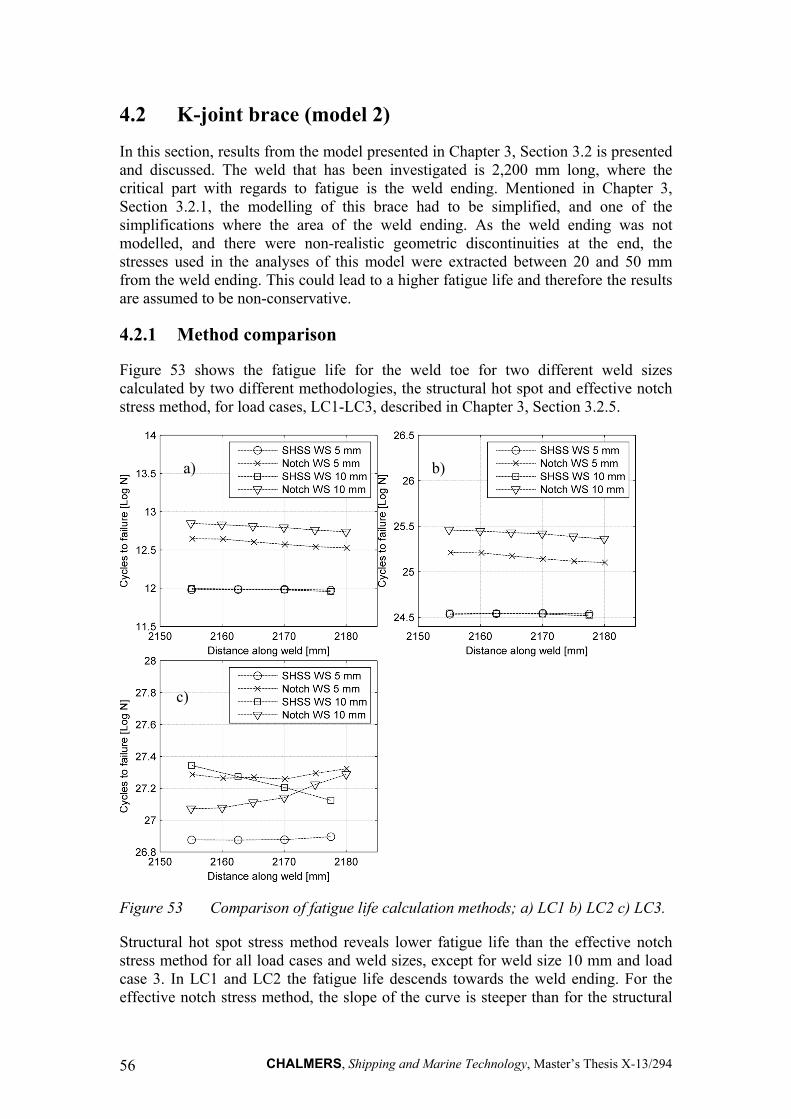
4.2 K-joint brace (model 2)
In this section, results from the model presented in Chapter 3, Section 3.2 is presented and discussed. The weld that has been investigated is 2,200 mm long, where the critical part with regards to fatigue is the weld ending. Mentioned in Chapter 3, Section 3.2.1, the modelling of this brace had to be simplified, and one of the simplifications where the area of the weld ending. As the weld ending was not modelled, and there were non-realistic geometric discontinuities at the end, the stresses used in the analyses of this model were extracted between 20 and 50 mm from the weld ending. This could lead to a higher fatigue life and therefore the results are assumed to be non-conservative.
4.2.1 Method comparison
Figure 53 shows the fatigue life for the weld toe for two different weld sizes calculated by two different methodologies, the structural hot spot and effective notch stress method, for load cases, LC1-LC3, described in Chapter 3, Section 3.2.5.
Figure 53 Comparison of fatigue life calculation methods; a) LC1 b) LC2 c) LC3.
Structural hot spot stress method reveals lower fatigue life than the effective notch stress method for all load cases and weld sizes, except for weld size 10 mm and load case 3. In LC1 and LC2 the fatigue life descends towards the weld ending. For the effective notch stress method, the slope of the curve is steeper than for the structural
a) b)
c)
CHALMERS, Shipping and Marine Technology, Master’s Thesis X-13/294 57
hot spot method. This indicates that the methods would yield a more similar fatigue life at the weld ending.
The structural hot spot stress method for load cases 1 and 2 does not reveal any significant difference in the fatigue life for the different weld sizes, while the effective notch stress method does. For the effective notch stress method, the calculated fatigue life increases with a larger weld size.
As shown in Figure 50, the method which reveals the lowest fatigue life varies along the weld for the RHS. With regard to the second model, the reason for the SHSS method to yield the highest fatigue life might be connected to this. A theory for the different results for the RHS is that in the area at the weld ending, the non-linear stress peak has a larger effect than in the middle of the weld. If this is the case, the different methods for the K-joint should reveal a different result at the weld ending.
For load case 3, the fatigue life calculated by the effective notch stress method increases towards the weld ending, which seems unrealistic.
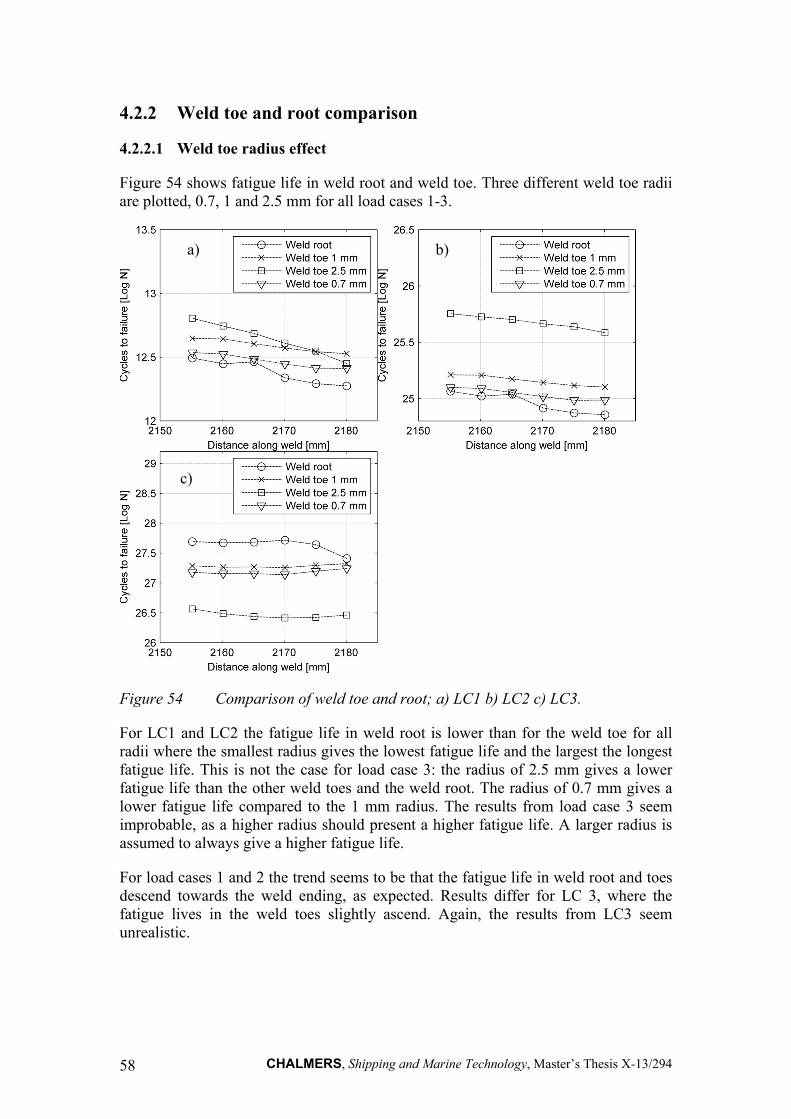
CHALMERS, Shipping and Marine Technology, Master’s Thesis X-13/294 58
4.2.2 Weld toe and root comparison
4.2.2.1 Weld toe radius effect
Figure 54 shows fatigue life in weld root and weld toe. Three different weld toe radii are plotted, 0.7, 1 and 2.5 mm for all load cases 1-3.
Figure 54 Comparison of weld toe and root; a) LC1 b) LC2 c) LC3.
For LC1 and LC2 the fatigue life in weld root is lower than for the weld toe for all radii where the smallest radius gives the lowest fatigue life and the largest the longest fatigue life. This is not the case for load case 3: the radius of 2.5 mm gives a lower fatigue life than the other weld toes and the weld root. The radius of 0.7 mm gives a lower fatigue life compared to the 1 mm radius. The results from load case 3 seem improbable, as a higher radius should present a higher fatigue life. A larger radius is assumed to always give a higher fatigue life.
For load cases 1 and 2 the trend seems to be that the fatigue life in weld root and toes descend towards the weld ending, as expected. Results differ for LC 3, where the fatigue lives in the weld toes slightly ascend. Again, the results from LC3 seem unrealistic.
a) b)
c)
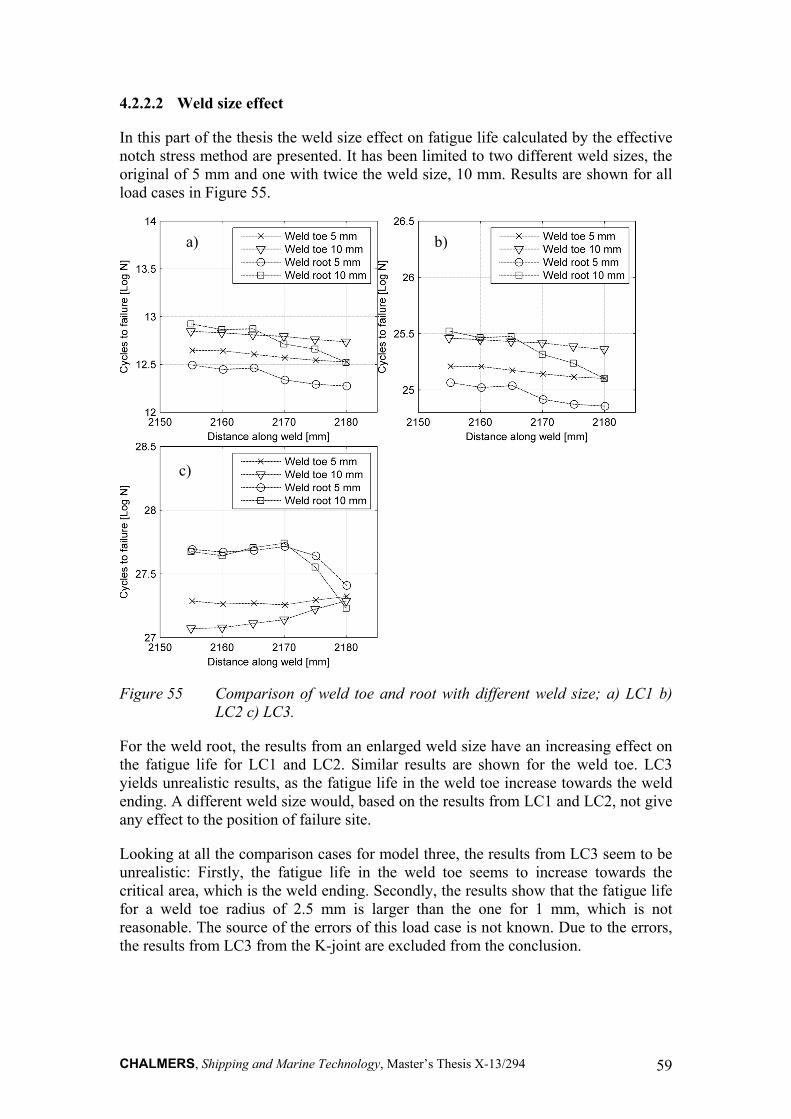
CHALMERS, Shipping and Marine Technology, Master’s Thesis X-13/294 59
4.2.2.2 Weld size effect
In this part of the thesis the weld size effect on fatigue life calculated by the effective notch stress method are presented. It has been limited to two different weld sizes, the original of 5 mm and one with twice the weld size, 10 mm. Results are shown for all load cases in Figure 55.
Figure 55 Comparison of weld toe and root with different weld size; a) LC1 b) LC2 c) LC3.
For the weld root, the results from an enlarged weld size have an increasing effect on the fatigue life for LC1 and LC2. Similar results are shown for the weld toe. LC3 yields unrealistic results, as the fatigue life in the weld toe increase towards the weld ending. A different weld size would, based on the results from LC1 and LC2, not give any effect to the position of failure site.
Looking at all the comparison cases for model three, the results from LC3 seem to be unrealistic: Firstly, the fatigue life in the weld toe seems to increase towards the critical area, which is the weld ending. Secondly, the results show that the fatigue life for a weld toe radius of 2.5 mm is larger than the one for 1 mm, which is not reasonable. The source of the errors of this load case is not known. Due to the errors, the results from LC3 from the K-joint are excluded from the conclusion.
a) b)
c)

CHALMERS, Shipping and Marine Technology, Master’s Thesis X-13/294 60
CHALMERS, Shipping and Marine Technology, Master’s Thesis X-13/294 61
5 Conclusions
Fatigue life assessment using two different methods, the structural hot spot and effective notch stress method, have been performed on two fillet welded joints. These two joint were provided by Aker Solutions MMO AS, Bergen, Norway for this study. The first joint is a rectangular hollow section from a davit, built as a truss. The second model is a part of a K-joint from the platform Songa Trym. The assessments have been performed for different load cases and with various weld sizes and weld toe radii. This was done in order to compare the different fatigue life calculation methods and to investigate the effect of the local weld parameters.
The two different methods, the structural hot spot and effective notch stress method, yielded different results. For the rectangular hollow section, the effective notch stress method revealed the lowest fatigue life of the two methods. Contradicting results were found for the Songa Trym K-joint. Conclusions regarding conservatism of the methods cannot be drawn from these results. Also, based on the effective notch stress method calculations, there is an indication of weld root failure for the second model. Fatigue life improvement methods only increasing weld toe fatigue life is not recommended based on these results.
The study on the local weld parameters shows that an increase in the weld toe radius gives an increase in fatigue strength, which was expected. This is due to the smooth transition created from the base material to the weld. DNV (2012) have provided a factor of 3.5 for fatigue life if a toe grinding is performed at the weld toe. A radius of 2.5 mm was considered to represent this radius created by the grinding operation. The difference between the fatigue lives for the initial radii of 1 mm and the radius of 2.5 mm was calculated to be between 2.5 and 3. The only positive gain from the increased radius included in the model case was the geometric change - effects such as removing a weld toe defect are not included. Such effects would also give an increase in fatigue life, and therefore the higher fatigue life improvement factor provided by DNV (2012) corresponds well with the results.
An analysis of different weld sizes shows that an increase in weld size leads to a higher fatigue life in the weld root. Both models display the same result. This is most likely due to the increase in material reducing the stress. This leads to the conclusion that an enlarged weld size compared to the plate thickness would increase the fatigue life in the weld root. However, a conclusion regarding the weld size effect on the weld toe could not be established, since the different models yielded inconclusive results.
The results show that local weld parameters, such as weld size, have a considerable effect on the fatigue life. The wrong design criteria, including local weld parameters, may increase the chance of weld root failure, meaning that a local method, such as the notch stress method should be used for calculating the fatigue life for the critical area. This study highlights the importance of choosing a suitable fatigue calculation method to be used during the design phase. Choosing the right fatigue calculation method may improve the accuracy of the fatigue life estimations, thereby providing higher sustainability of the design.

CHALMERS, Shipping and Marine Technology, Master’s Thesis X-13/294 62
CHALMERS, Shipping and Marine Technology, Master’s Thesis X-13/294 63
6 Future work
Ideas and proposals for future work are presented in this chapter.
In the effective notch stress method there is one absolute value for a fictitious rounding, independent of the weld size. As presented in this thesis, the weld size does affect the results regarding the calculated fatigue life when using the effective notch stress method. Some research has been performed regarding whether or not the weld size should be taken into consideration when choosing the value for the fictitious rounding, Schijve (2012). It is proposed that this is further discussed and investigated.
In order to get a good understanding of the effect of local weld parameters, numerous studies need to be carried out. This should include advanced geometries, as the majority of published studies have been performed for quite simple geometries.
The ending of a weld, such as the one presented in 3.2.1, is the most interesting part of the weld with regard to fatigue life. Due to complex geometry and uncertainties in the drawing, this part of the weld were not analysed in this thesis work. An analysis of a similar weld ending could clarify the results from the analysis of the K-joint.
For the structural hot spot stress method, a welded structure can be modelled with or without the weld. In the case of a model with a weld, the distances where the stresses are read out are measured from the weld toe, while for the case without a weld it is measured from the weld root. In most cases modelling without the weld is more conservative, since the stress raiser is higher for a plate than for a weld. It is advised that the effect of these different modelling types should be further investigated and documented.
Since the heat affected zone and the residual stresses were excluded from the analysis, further investigation can be performed with these effects included.
As the effective notch stress method is a relatively new method, it should be further investigated and compared with real-life fatigue testing. Guidelines for the use of the effective notch stress method are limited, especially the one included in DNV (2012). When performing fatigue analysis with this method, local parameters have a large effect on the calculated fatigue life, thus the modelling of these parameters has to be performed with a high degree of accuracy. The limited guidelines could lead to a scatter in the ways of performing a fatigue analysis with this method. Moreover, this could increase the uncertainties around this local fatigue analysis method. A more methodically and detailed guideline could increase the recognition for this method.

CHALMERS, Shipping and Marine Technology, Master’s Thesis X-13/294 64
CHALMERS, Shipping and Marine Technology, Master’s Thesis X-13/294 65
7 References Akhlaghi, F.Z. (2009): Fatigue life assessment of welded bridge details using structural hot spot stress method, Master thesis, Department of Civil and Environmental Engineering, Chalmers University of Technology, Göteborg, Sweden, 2009
Abaqus/CAE User's Manual, Version 6.12, Dassault Systèmes Corp., Providence, RI, USA
DNV-RP-C203 (2012), Fatigue Design of Offshore Steel Structures, Det Norske Veritas AS, October, 2012.
Doerk O, Fricke W, Weissenborn C. (2002): Comparison of different calculation methods for structural stresses at welded joints, International journal of fatigue, Vol 25, 2013, pp 359-369
Dong, P. (2000): A structural stress definition and numerical implementation for fatigue analysis of welded joints, International Journal of Fatigue, Vol 23, 2001, pp 865-876
Dowling, N. E. (2012): Mechanical Behaviour of Materials 4th edition, Pearson Education.
Fricke, Wolfgang (2003): Fatigue analysis of welded joints: state of development, Marine structures, Volume 16, Issue 3, May 2003, pp. 185-200.
Fricke, W. (2005): Comparison of different structural stress approaches for fatigue assessment of welded ship structures, Marine Structures, Vol 18, No 7-8, November 2005, pp 473- 488
Fricke, W., Doerk, O. (2006): Simplified approach of fatigue strength assessment of fillet-welded attachment ends, International Journal of Fatigue, Vol. 28, 2006, pp. 141-150
Fricke, Wolfgang (2010): Guideline for the Fatigue Assessment by Notch Stress Analysis for Welded Structures, International institute of welding, doc XIII-2240r2-08/XV-1289r2-08, Hamburg, Germany, July 2010
Hobbacher, A. F. (2009): The new IIW recommendations for fatigue assessment of welded joints and components – A comprehensive code recently updated, International Journal of Fatigue, Vol 39, 2009, pp. 50-58
IIW (2008): Recommendations for fatigue design of welded joints and components, International institute of welding, doc XIII-1539-96 / XV845-96, Paris, France, October 2008
IIW (2012): Guideline for the Assessment of Weld Root Fatigue, International institute of welding, doc XIII-2380r3-11/XV-1383r3-11, Hamburg University of Technology (TUHH), June 2012
Kainuma, S., Mori, T. (2008): A study on fatigue crack initiation point of load-carrying fillet welded cruciform joints, International Journal of Fatigue, Vol 30, No. 9, November 2007, pp 1669-1677
CHALMERS, Shipping and Marine Technology, Master’s Thesis X-13/294 66
Maddox, S.J. (1991): Fatigue strength of welded structures second edition, Woodhead publishing, Cambridge.
Marquis, G., Samuelson, J. (2005): Modelling and fatigue life assessment of complex structures, Meterialwissenschaft und Werkstofftechnik, 2005, Vol 36, No. 11, pp 678-684
Neuber, H. (1968): Über die Berücksichtigung der Spannungskonzentration bei Festigkeitsberechnungen, Konstruktion, 1968, pp 245-251
Poutiainen, I., Tanskanen P, Marquis G. (2003): Finite element methods for structural hot spot stress determination -a comparison of procedures, International journal of fatigue, Vol 26, 2004, pp 1147-1157
Radaj, D. (1969): Approximate calculation of the stress concentration factors of welded joints, Schw Schn, Vol 21, 1969, pp 97-103.
Radaj, D. (1990): Design and Analysis of Fatigue Resistant Welded Structures, Abington Publishing, Cambridge, 1990.
Radaj, D (1996): Review of fatigue strength assessment of nonwelded and welded structures based on local parameters, International Journal of Fatigue Vol. 18, No. 3, pp. 153-170.
Radaj, D., Sonsino, CM., Fricke, W. (2006): Fatigue strength assessment of welded joints by local approaches, Woodhead Publishing, Cambridge, 2006.
Schijve, Jaap (2012): Fatigue predictions of welded joints and the effective notch stress concept, International Journal of Fatigue, Vol. 45, June 2012, pp 33-38.
Sonsino, C.M., Fricke, W., de Bruyne, F., Hoppe, A., Ahmadi, A., Zhang, G. (2010): Notch stress concepts for the fatigue assessment of welded joints – Background and applications, International Journal of Fatigue, Vol. 34, 2012, pp 2-16.
7.1 Figure references
[1] Picture Downloaded from: http://upload.wikimedia.org/wikipedia/commons/d/d2/Alexander_L_Kielland_Column_D_with_fractures_NOMF-02663-1-647.jpg [cited May 20th, 2013]