Embed Size (px)
Citation preview
8/13/2019 Paper - Effect of Uit on Fatigue Life in Web-gusset Welded Joints
http://slidepdf.com/reader/full/paper-effect-of-uit-on-fatigue-life-in-web-gusset-welded-joints 1/10
Journal of Solid Mechanicsand Materials
Engineering
Vol. 4, No. 3, 2010
391
Effect of UIT on Fatigue Life in
Web-Gusset Welded Joints*
Yu TOGASAKI**
, Hirokazu TSUJI***
, Takashi HONDA****
, Tetsuya SASAKI****
and Atsushi YAMAGUCHI**** **Graduate School of Tokyo Denki University
Ishizaka, Hatoyama, Hiki-gun, Saitama 350-0394, Japan
E-mail: [email protected]
***Tokyo Denki University
****National Institute of Occupational Safety and Health, Japan
Umezono 1-4-6, Kiyose, Tokyo 204-0024, Japan
Abstract
Ultrasonic impact treatment (UIT), which is a peening method, is usually used as a
post-weld treatment in order to improve the fatigue strength of welded joints. In
this study, fatigue tests were carried out on web-gusset welded joints treated by UIT
and the results were compared with the fatigue lives of as-welded joints in order to
examine the effects of UIT on the fatigue lives of welded joints. The fatigue lives
of web-gusset welded joints treated by UIT increased to more than ten times those
of as-welded joints. The introduction of compressive residual stress, relaxation of
stress concentration at a weld toe, and refinement of grains under the weld toes
were considered as possible reasons for the improvement in fatigue life caused by
UIT. Residual stress near weld toes was measured using the X-ray diffraction
method. The stress concentration factor at the weld toes was analyzed using the
finite element method (FEM). The grain size under the weld toes was measured
using electron backscatter diffraction pattern (EBSD) analysis.
Key words: Welded Joint, Fatigue, Stress Concentration, Residual Stress, Grain
Size
1. Introduction
Welded joints used in steel structures such as cranes and bridges are often the cause of
failure accidents as a result of fatigue cracks at the weld toes initiated by the weld
geometries or defects(1)
. The fatigue lives of welded joints are much lower than those of
base metals because of the tensile residual stress and stress concentration at weld toes(2)
.
The fatigue life of a web-gusset welded joint in particular needs to be improved since its
fatigue life is considerably lower than that of other types of weld joints.
A reduction in the tensile residual stress and relaxation of the stress concentration at the
weld toes are required to improve the fatigue lives of welded joints. Shot peening and
hammer peening are used to introduce compressive residual stress in weld joints(3)(4)
. The
stress concentration of a weld toe can also be reduced using the grinder method or
tungsten-inert gas (TIG) dressing(4)(5)
. Ultrasonic impact treatment (UIT), which is a
peening method that was developed in Russia, is applied to welded joints as a post-weld
treatment in order to introduce compressive residual stress and relax the stress concentration
at weld toes. The application of UIT to steel structures such as cranes and ships is
performed as a substitute for shot peening or griding(6)(7)
. However, there is insufficient
fatigue data available on welded joints treated by UIT for it to be applied to actual steel
structures.
*Received 13 Oct., 2009 (No. 09-0587)[DOI: 10.1299/jmmp.4.391]
Copyright © 2010 by JSME

8/13/2019 Paper - Effect of Uit on Fatigue Life in Web-gusset Welded Joints
http://slidepdf.com/reader/full/paper-effect-of-uit-on-fatigue-life-in-web-gusset-welded-joints 2/10
Journal of Solid Mechanics
and Materials Engineering
Vol. 4, No. 3, 2010
392
In this study, fatigue tests were carried out on web-gusset welded joints treated by UIT
and the results were compared with the fatigue lives of as-welded joints. Also, the changes
in residual stress, stress concentration factor, and grain size around the weld toes were
measured after UIT was applied in order to clarify the reason for the improvement in the
fatigue lives of welded joints.
2. Experimental Procedure
2.1 UIT and specimens
Figure 1 shows a schematic of a UIT system, the Applied Ultrasonic ESONIX™
27 UIS.
This equipment consists of a generator, a cooling unit, and a hand tool. The pins mounted
on the tip of the hand tool are vibrated by ultrasonic waves generated in the transducer. The
radius of curvature of the pin tip is 3 mm. The resonant frequency of the pins is 27 kHz and
the amplitude of the pins is about 30 µm.
The specimens used in this study were machined from a plate of JIS SM570Q with a
thickness of 12 mm. Table 1 shows the mechanical properties of the material used. Table 2
shows the chemical composition of the material used. The welding of the web gussets was
carried out using the carbon dioxide semi-automatic arc welding method with YFW-C60FM
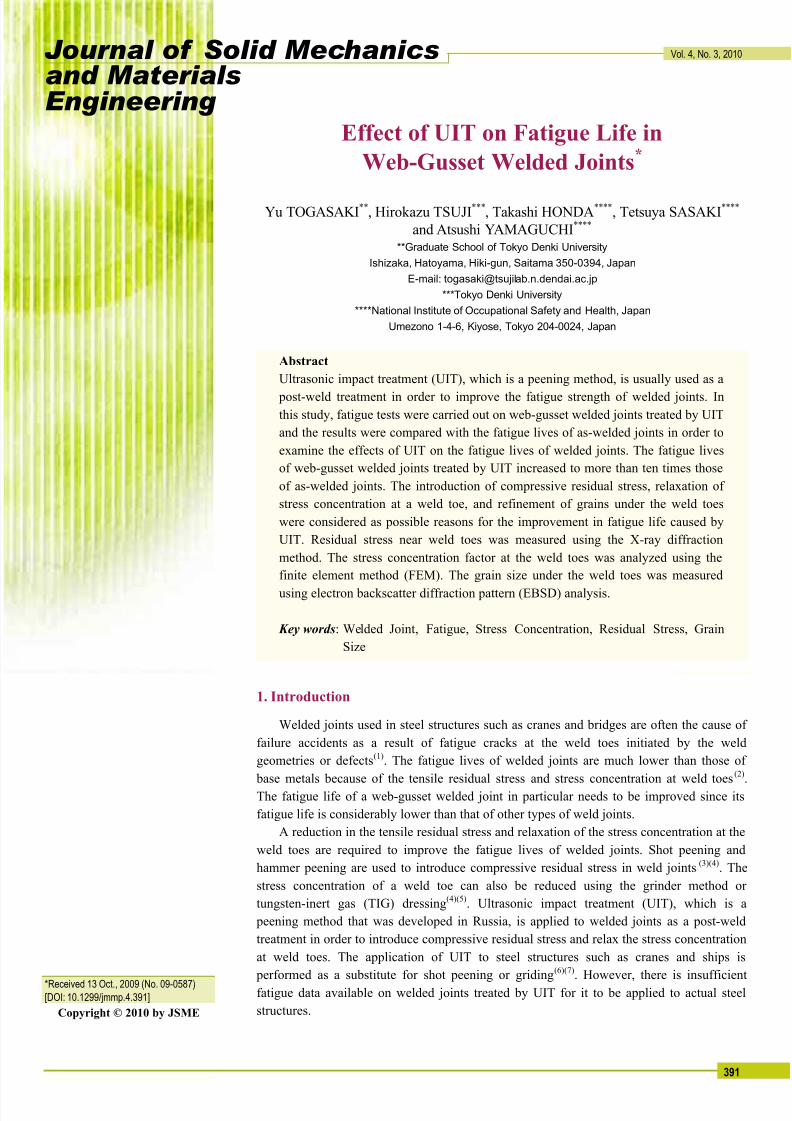
(JIS Z 3313) of the weld metal. Table 3 shows the welding conditions. Figure 2 shows the
configuration of the web-gusset welded joint specimens used. Half of the specimens were
treated by UIT until grooves at the weld toe completely disappeared.
Fig. 1 Schematic of UIT system.
Table 1 Mechanical properties of material used.
Yield strength
MPa
Tensile strength
MPa
Elongation
%
SM570Q 514 608 34
Table 2 Chemical composition of material used. (wt. %)
C Si Mn P S Ni Cr Nb V
SM570Q 0.11 0.23 1.53 0.007 0.002 0.02 0.02 0.02 0.06
Table 3 Welding conditions.
Current 25 A
Voltage 270 V
Welding speed 33 mm/min
Carbon dioxide flow rate 300 l/min
Leg length 10 mm
Wave guidePins
Generator SpringTransducer
Cooling unit
Hand tool
8/13/2019 Paper - Effect of Uit on Fatigue Life in Web-gusset Welded Joints
http://slidepdf.com/reader/full/paper-effect-of-uit-on-fatigue-life-in-web-gusset-welded-joints 3/10
Journal of Solid Mechanics
and Materials Engineering
Vol. 4, No. 3, 2010
393
Fig. 2 Configuration of web-gusset welded joints. (unit: mm)
2.2 Fatigue test
Fatigue tests were carried out based on the 14S - N testing method as regulated in JSME
S 002-1994, the standard method of statistical fatigue testing(8)
. Fatigue tests were
conducted at room temperature under a load frequency f of 4 to 9 Hz and a stress ration R of
0.1 using a servo-hydraulic fatigue machine with a capacity of 1500 kN. Fatigue tests were
terminated in cases where the number of load cycles reached 10 million. During fatigue
tests, the strain amplitude of each weld toe was measured with a strain gage attached at a point 5 mm from the weld toe in order to detect a fatigue crack initiated at the weld toe. The
crack initiation life at a weld toe was defined as the number of cycles in which the value R s,
calculated by using Eq. (1), decreased 5%(9)
.
1000
×=ε
ε iS R (1)
where ε i is the strain amplitude during the fatigue test and ε 0 is the value of the initial strain
amplitude.
3. Results and Discussion
3.1 Fatigue test results
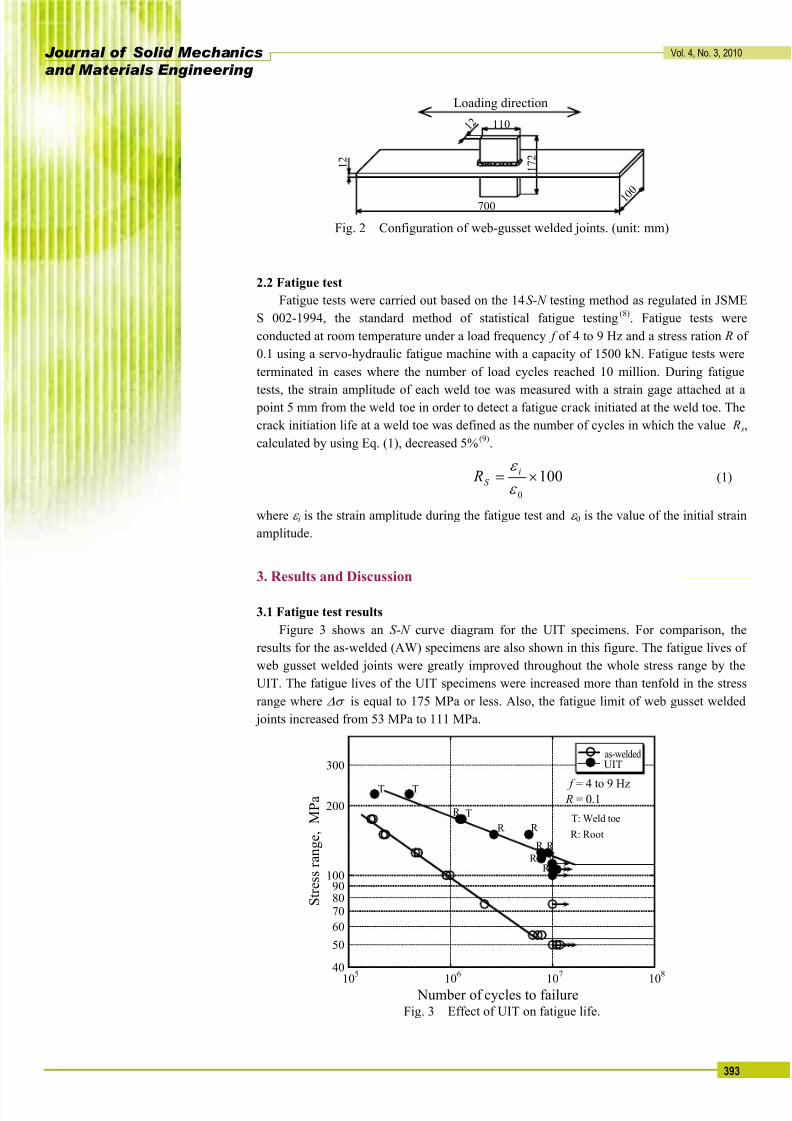
Figure 3 shows an S - N curve diagram for the UIT specimens. For comparison, the
results for the as-welded (AW) specimens are also shown in this figure. The fatigue lives of
web gusset welded joints were greatly improved throughout the whole stress range by the
UIT. The fatigue lives of the UIT specimens were increased more than tenfold in the stress
range where ∆σ is equal to 175 MPa or less. Also, the fatigue limit of web gusset welded
joints increased from 53 MPa to 111 MPa.
Fig. 3 Effect of UIT on fatigue life.
1 2
700
1 7 2
110
1 0 0
1 2
Loading direction
40
50
60
708090
100
200
300
10
5
10
6
10
7
10
8
As-weldUIT
S t r e s s r a n g e ,
M P a
Number of cycles to failure
R = 0.1 f = 4 to 9 HzT T
TR
R
R R
T: Weld toe
R: Root
R R
R
R
as-welded
8/13/2019 Paper - Effect of Uit on Fatigue Life in Web-gusset Welded Joints
http://slidepdf.com/reader/full/paper-effect-of-uit-on-fatigue-life-in-web-gusset-welded-joints 4/10
Journal of Solid Mechanics
and Materials Engineering
Vol. 4, No. 3, 2010
394
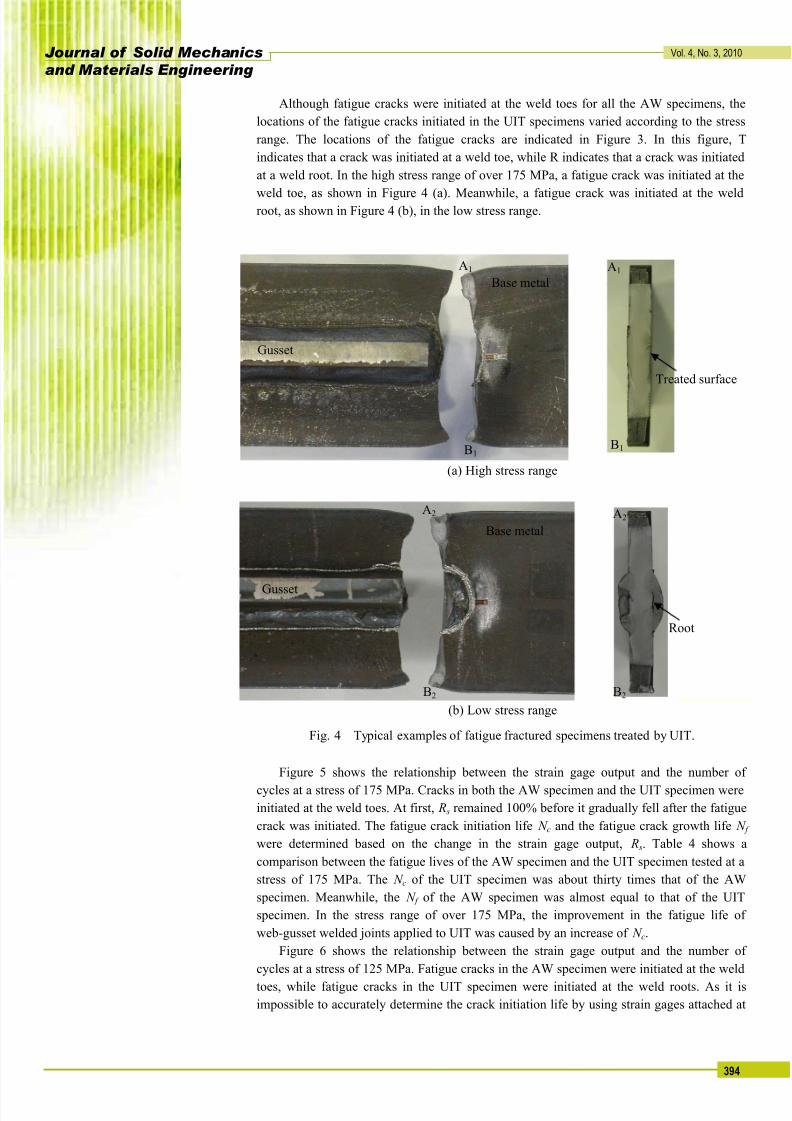
Although fatigue cracks were initiated at the weld toes for all the AW specimens, the
locations of the fatigue cracks initiated in the UIT specimens varied according to the stress
range. The locations of the fatigue cracks are indicated in Figure 3. In this figure, T
indicates that a crack was initiated at a weld toe, while R indicates that a crack was initiated
at a weld root. In the high stress range of over 175 MPa, a fatigue crack was initiated at the
weld toe, as shown in Figure 4 (a). Meanwhile, a fatigue crack was initiated at the weldroot, as shown in Figure 4 (b), in the low stress range.
Fig. 4 Typical examples of fatigue fractured specimens treated by UIT.
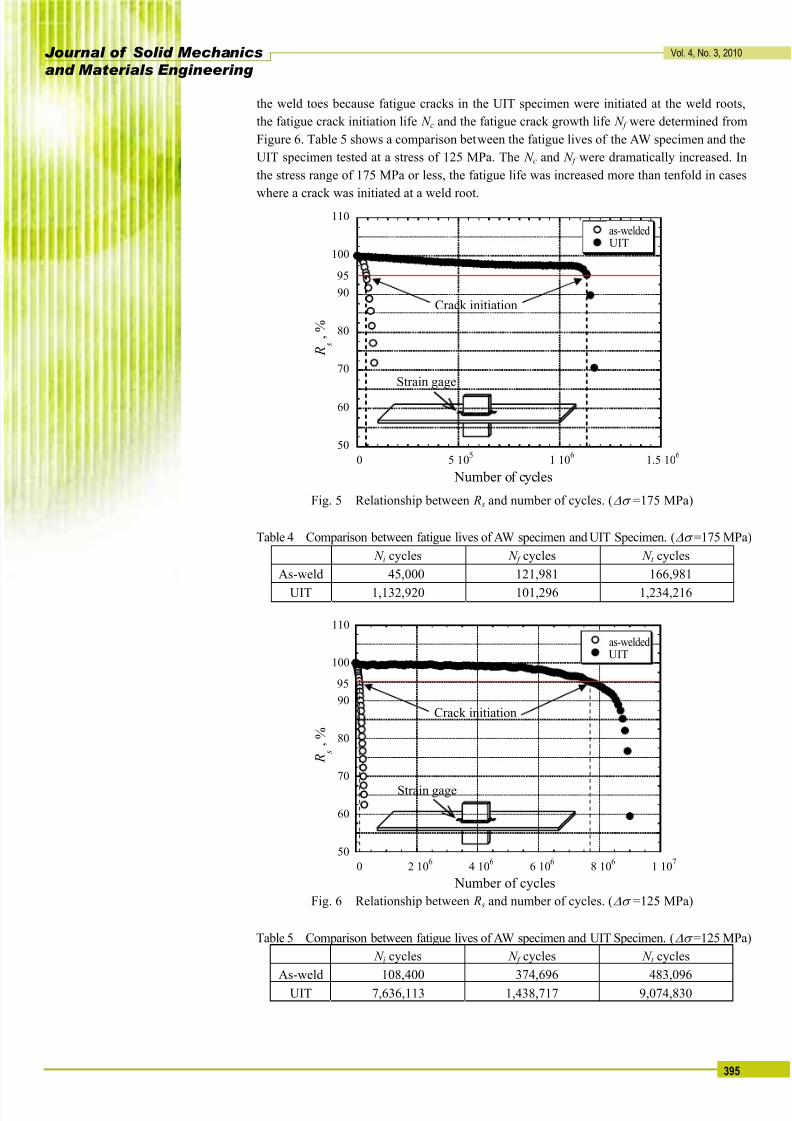
Figure 5 shows the relationship between the strain gage output and the number of
cycles at a stress of 175 MPa. Cracks in both the AW specimen and the UIT specimen were
initiated at the weld toes. At first, R s remained 100% before it gradually fell after the fatigue
crack was initiated. The fatigue crack initiation life N c and the fatigue crack growth life N f
were determined based on the change in the strain gage output, R s. Table 4 shows a
comparison between the fatigue lives of the AW specimen and the UIT specimen tested at a
stress of 175 MPa. The N c of the UIT specimen was about thirty times that of the AW
specimen. Meanwhile, the N f of the AW specimen was almost equal to that of the UIT
specimen. In the stress range of over 175 MPa, the improvement in the fatigue life of
web-gusset welded joints applied to UIT was caused by an increase of N c.
Figure 6 shows the relationship between the strain gage output and the number of
cycles at a stress of 125 MPa. Fatigue cracks in the AW specimen were initiated at the weld
toes, while fatigue cracks in the UIT specimen were initiated at the weld roots. As it is
impossible to accurately determine the crack initiation life by using strain gages attached at
A1
B1
Gusset
Base metal
A1
B1
Treated surface
(a) High stress range
A2
B2
Base metal
Gusset
B2
A2
Root
(b) Low stress range
8/13/2019 Paper - Effect of Uit on Fatigue Life in Web-gusset Welded Joints
http://slidepdf.com/reader/full/paper-effect-of-uit-on-fatigue-life-in-web-gusset-welded-joints 5/10
Journal of Solid Mechanics
and Materials Engineering
Vol. 4, No. 3, 2010
395
the weld toes because fatigue cracks in the UIT specimen were initiated at the weld roots,
the fatigue crack initiation life N c and the fatigue crack growth life N f were determined from
Figure 6. Table 5 shows a comparison between the fatigue lives of the AW specimen and the
UIT specimen tested at a stress of 125 MPa. The N c and N f were dramatically increased. In
the stress range of 175 MPa or less, the fatigue life was increased more than tenfold in cases
where a crack was initiated at a weld root.
Fig. 5 Relationship between R s and number of cycles. (∆σ =175 MPa)
N i cycles N f cycles N t cycles
As-weld 45,000 121,981 166,981
UIT 1,132,920 101,296 1,234,216
Fig. 6 Relationship between R s and number of cycles. (∆σ =125 MPa)
N i cycles N f cycles N t cycles
As-weld 108,400 374,696 483,096
UIT 7,636,113 1,438,717 9,074,830
50
60
70
80
90
100
110
0 5 105
1 106
1.5 106
As-weldUIT
R s
, %
Number of cycles
95
Strain gage
Crack initiation
Table 4 Comparison between fatigue lives of AW specimen and UIT Specimen. (∆σ =175 MPa)
Table 5 Comparison between fatigue lives of AW specimen and UIT Specimen. (∆σ =125 MPa)
50
60
70
80
90
100
110
0 2 106
4 106
6 106
8 106
1 107
As-weldUIT
R s
, %
Number of cycles
Strain gage
Crack initiation
95
as-welded
as-welded
8/13/2019 Paper - Effect of Uit on Fatigue Life in Web-gusset Welded Joints
http://slidepdf.com/reader/full/paper-effect-of-uit-on-fatigue-life-in-web-gusset-welded-joints 6/10
Journal of Solid Mechanics
and Materials Engineering
Vol. 4, No. 3, 2010
396
3.2 Factors affecting the fatigue lives of welded joints
3.2.1 Residual stress
The residual stress distribution on the surface along the cross section at the weld toe of
the AW specimen and that of the UIT specimen were measured using an X-ray diffraction
stress analyzer (Rigaku PSPC-MSF-2) with an X-ray target CrK α. The peak location of theresidual stress was calculated using the half-breadth method and seven Ψ angles were used
to determine the slope of sin2Ψ - 2θ diagram(10)
. The diffraction angle was 156.08°, and the
irradiation area was 4 mm2.
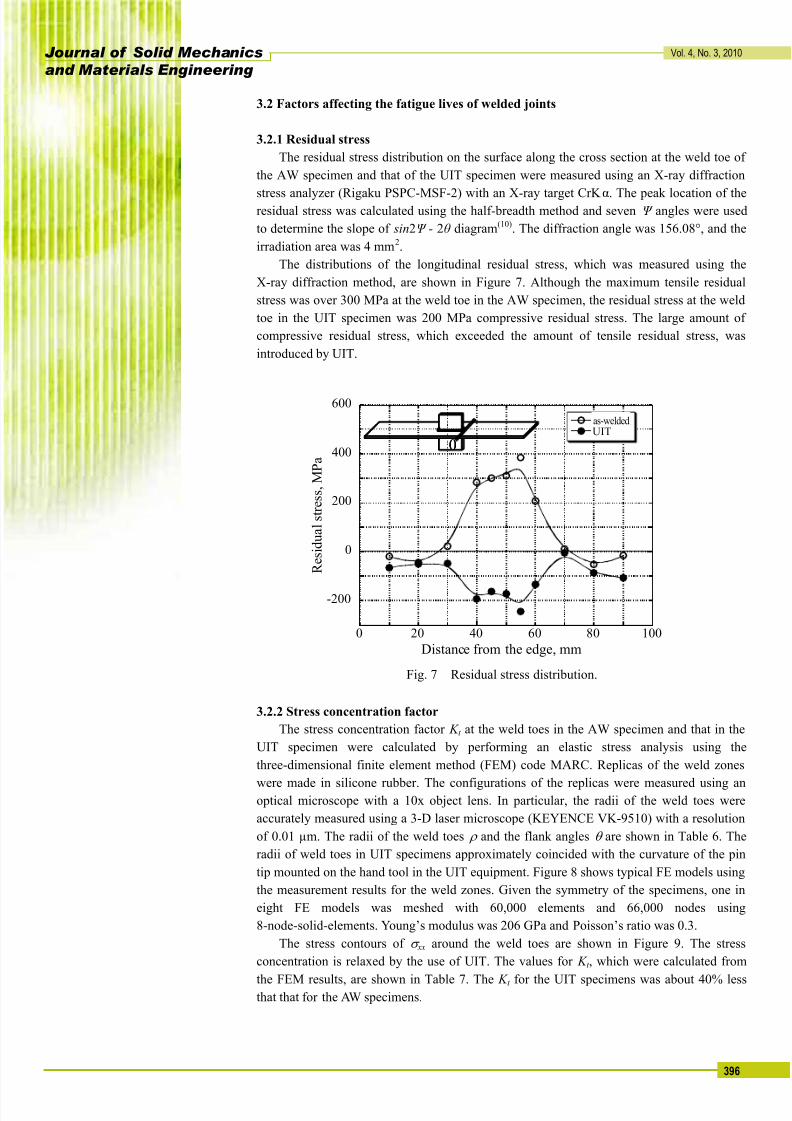
The distributions of the longitudinal residual stress, which was measured using the
X-ray diffraction method, are shown in Figure 7. Although the maximum tensile residual
stress was over 300 MPa at the weld toe in the AW specimen, the residual stress at the weld
toe in the UIT specimen was 200 MPa compressive residual stress. The large amount of
compressive residual stress, which exceeded the amount of tensile residual stress, was
introduced by UIT.
Fig. 7 Residual stress distribution.
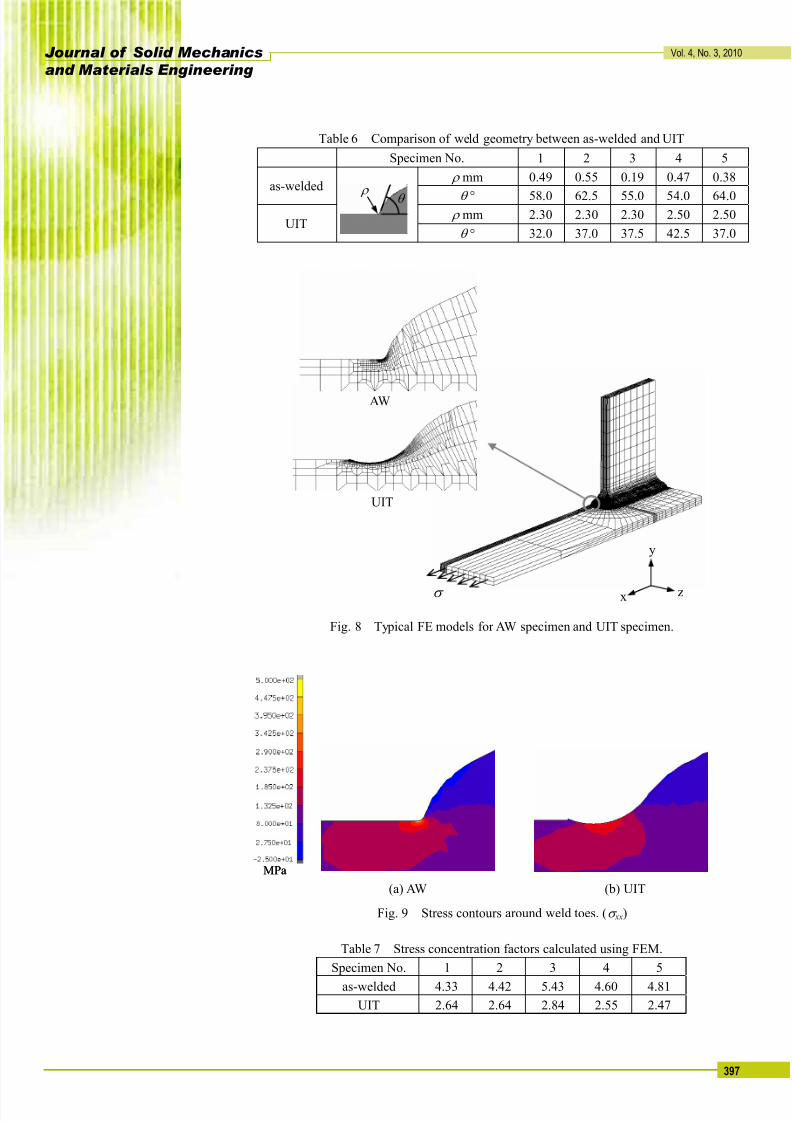
3.2.2 Stress concentration factor
The stress concentration factor K t at the weld toes in the AW specimen and that in the
UIT specimen were calculated by performing an elastic stress analysis using the
three-dimensional finite element method (FEM) code MARC. Replicas of the weld zones
were made in silicone rubber. The configurations of the replicas were measured using anoptical microscope with a 10x object lens. In particular, the radii of the weld toes were
accurately measured using a 3-D laser microscope (KEYENCE VK-9510) with a resolution
of 0.01 µm. The radii of the weld toes ρ and the flank angles θ are shown in Table 6. The
radii of weld toes in UIT specimens approximately coincided with the curvature of the pin
tip mounted on the hand tool in the UIT equipment. Figure 8 shows typical FE models using
the measurement results for the weld zones. Given the symmetry of the specimens, one in
eight FE models was meshed with 60,000 elements and 66,000 nodes using
8-node-solid-elements. Young’s modulus was 206 GPa and Poisson’s ratio was 0.3.
The stress contours of σ xx around the weld toes are shown in Figure 9. The stress
concentration is relaxed by the use of UIT. The values for K t , which were calculated from
the FEM results, are shown in Table 7. The K t for the UIT specimens was about 40% lessthat that for the AW specimens.
-200
0
200
400
600
0 20 40 60 80 100
As-weldUIT
R e s i d u a l s t r e s s , M P a
Distance from the edge, mm
00
as-welded
8/13/2019 Paper - Effect of Uit on Fatigue Life in Web-gusset Welded Joints
http://slidepdf.com/reader/full/paper-effect-of-uit-on-fatigue-life-in-web-gusset-welded-joints 7/10
Journal of Solid Mechanics
and Materials Engineering
Vol. 4, No. 3, 2010
397
Table 6 Comparison of weld geometry between as-welded and UIT
Specimen No. 1 2 3 4 5
ρ mm 0.49 0.55 0.19 0.47 0.38as-welded
θ ° 58.0 62.5 55.0 54.0 64.0 ρ mm 2.30 2.30 2.30 2.50 2.50
UIT θ ° 32.0 37.0 37.5 42.5 37.0
Fig. 8 Typical FE models for AW specimen and UIT specimen.
Fig. 9 Stress contours around weld toes. (σ xx)
Table 7 Stress concentration factors calculated using FEM.
Specimen No. 1 2 3 4 5
as-welded 4.33 4.42 5.43 4.60 4.81
UIT 2.64 2.64 2.84 2.55 2.47
(a) AW (b) UIT
MPaMPa
σ
AW
UIT
x
y
z
ρ θ
8/13/2019 Paper - Effect of Uit on Fatigue Life in Web-gusset Welded Joints
http://slidepdf.com/reader/full/paper-effect-of-uit-on-fatigue-life-in-web-gusset-welded-joints 8/10
Journal of Solid Mechanics
and Materials Engineering
Vol. 4, No. 3, 2010
398
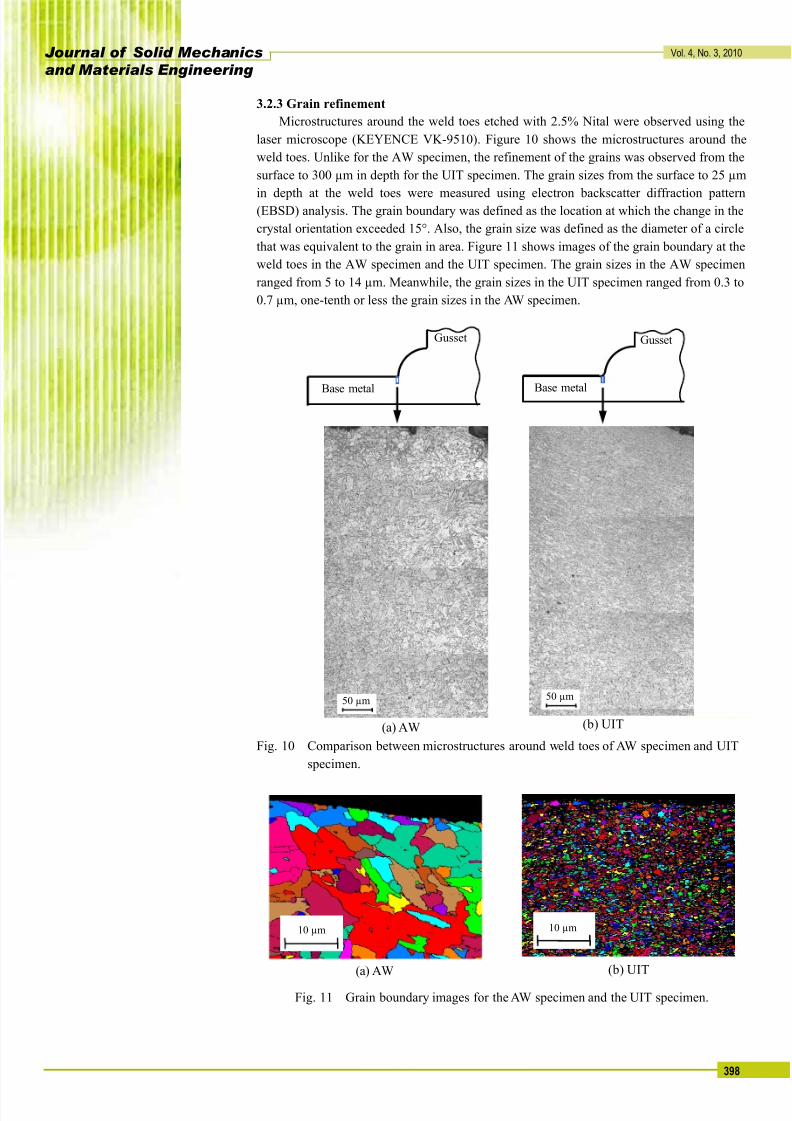
3.2.3 Grain refinement
Microstructures around the weld toes etched with 2.5% Nital were observed using the
laser microscope (KEYENCE VK-9510). Figure 10 shows the microstructures around the
weld toes. Unlike for the AW specimen, the refinement of the grains was observed from the
surface to 300 µm in depth for the UIT specimen. The grain sizes from the surface to 25 µm
in depth at the weld toes were measured using electron backscatter diffraction pattern(EBSD) analysis. The grain boundary was defined as the location at which the change in the
crystal orientation exceeded 15°. Also, the grain size was defined as the diameter of a circle
that was equivalent to the grain in area. Figure 11 shows images of the grain boundary at the
weld toes in the AW specimen and the UIT specimen. The grain sizes in the AW specimen
ranged from 5 to 14 µm. Meanwhile, the grain sizes in the UIT specimen ranged from 0.3 to
0.7 µm, one-tenth or less the grain sizes in the AW specimen.
Fig. 10 Comparison between microstructures around weld toes of AW specimen and UIT
specimen.
Fig. 11 Grain boundary images for the AW specimen and the UIT specimen.
50 µm 50 µm
(a) AW (b) UIT
Gusset
Base metal
Gusset
Base metal
10 µm 10 µm
(a) AW (b) UIT
8/13/2019 Paper - Effect of Uit on Fatigue Life in Web-gusset Welded Joints
http://slidepdf.com/reader/full/paper-effect-of-uit-on-fatigue-life-in-web-gusset-welded-joints 9/10
Journal of Solid Mechanics
and Materials Engineering
Vol. 4, No. 3, 2010
399
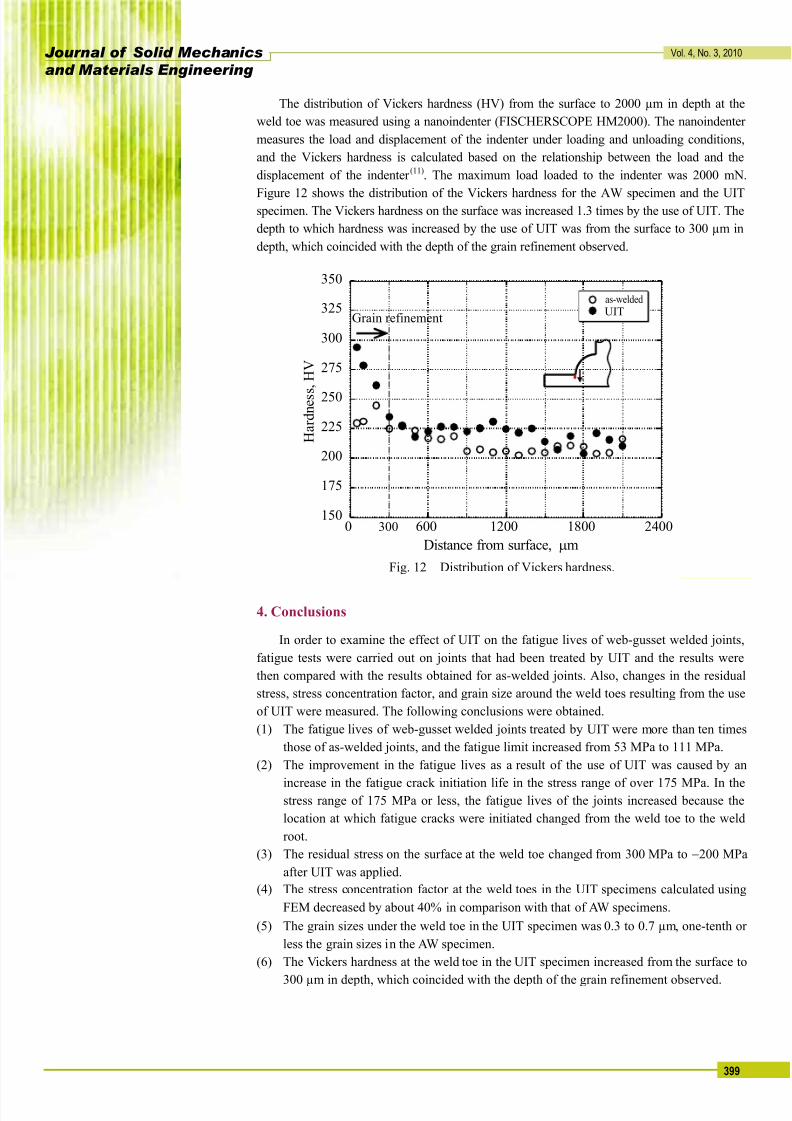
The distribution of Vickers hardness (HV) from the surface to 2000 µm in depth at the
weld toe was measured using a nanoindenter (FISCHERSCOPE HM2000). The nanoindenter
measures the load and displacement of the indenter under loading and unloading conditions,
and the Vickers hardness is calculated based on the relationship between the load and the
displacement of the indenter (11)
. The maximum load loaded to the indenter was 2000 mN.
Figure 12 shows the distribution of the Vickers hardness for the AW specimen and the UITspecimen. The Vickers hardness on the surface was increased 1.3 times by the use of UIT. The
depth to which hardness was increased by the use of UIT was from the surface to 300 µm in
depth, which coincided with the depth of the grain refinement observed.
Fig. 12 Distribution of Vickers hardness.
4. Conclusions
In order to examine the effect of UIT on the fatigue lives of web-gusset welded joints,
fatigue tests were carried out on joints that had been treated by UIT and the results were
then compared with the results obtained for as-welded joints. Also, changes in the residual
stress, stress concentration factor, and grain size around the weld toes resulting from the use
of UIT were measured. The following conclusions were obtained.
(1) The fatigue lives of web-gusset welded joints treated by UIT were more than ten times
those of as-welded joints, and the fatigue limit increased from 53 MPa to 111 MPa.
(2) The improvement in the fatigue lives as a result of the use of UIT was caused by an
increase in the fatigue crack initiation life in the stress range of over 175 MPa. In thestress range of 175 MPa or less, the fatigue lives of the joints increased because the
location at which fatigue cracks were initiated changed from the weld toe to the weld
root.
(3) The residual stress on the surface at the weld toe changed from 300 MPa to −200 MPa
after UIT was applied.
(4) The stress concentration factor at the weld toes in the UIT specimens calculated using
FEM decreased by about 40% in comparison with that of AW specimens.
(5) The grain sizes under the weld toe in the UIT specimen was 0.3 to 0.7 µm, one-tenth or
less the grain sizes in the AW specimen.
(6) The Vickers hardness at the weld toe in the UIT specimen increased from the surface to
300 µm in depth, which coincided with the depth of the grain refinement observed.
150
175
200
225
250
275
300
325
350
0 600 1200 1800 2400
As-weldUIT
H a r d n e s s
, H V
Distance from surface, µm
300
Grain refinement
as-welded
8/13/2019 Paper - Effect of Uit on Fatigue Life in Web-gusset Welded Joints
http://slidepdf.com/reader/full/paper-effect-of-uit-on-fatigue-life-in-web-gusset-welded-joints 10/10
Journal of Solid Mechanics
and Materials Engineering
Vol. 4, No. 3, 2010
400
Acknowledgements
The application of UIT to the web-gusset welded joints used in this study was
conducted at the Technical Development Bureau of Nippon Steel Cooperation. The authors
would like to thank Dr. Tetsuro Nose and Dr. Hiroshi Shimanuki, both of whom work in the
Technical Development Bureau, for all their help.
References
(1) Nakajima H., Nakamura H., and Suzuki H., Study on Fatigue Strength of Web-Gusset
Welded Joints, Journal of Constructional Steel , Vol.14, (2006), pp.583-586.
(2) Ushirokawa O., and Nakayama E., Stress Concentration Factor at Welded Joints,
Ishikawajima Harima Engineering Review, Vol.23, No.4, (1983), pp.351-355.
(3) Hasegawa M., Suzuki H., and Miura K., Effect of Strong Shot peening Cleaning and Hot
Galvanizing on Fatigue Strength of Steel Welded Joint, Quarterly Journal of the Japan
Welding Society, Vol.25, No.4, (2007), pp.486-493.
(4) Anami K., Miki C., Yamamoto H., and Higuchi Y., Fatigue Strength of Welded Joint Made
of High Strength Steel and Fatigue Strength Improvement, Journal of Structural
Mechanics and Earthquake Engineering (I), No.675, (2001), pp.251-260.
(5) Hirayama S., Mori T., and Inomata T., Influence of Grinding Method on Fatigue Strength
of Web-Gusset Welded Joints, Steel Construction Engineering , Vol.12, No.45, (2005),
pp.111-121.
(6) Nose, T., Ultrasonic Peening Method for Fatigue Strength Improvement, Journal of the
Japan Welding Society,Vol.77, No.3, (2008), pp.210-213.
(7) Nose, T., and Shimanuki, H., Experiment and Analysis of Influence of Ultrasonic Peening
on Fatigue Life in Pad Welded Joint,Transactions of the Japan Society of Mechanical
Engineers, Series A, Vol.74, No.737 (2008), pp.166-168.
(8) The Japan Society of Mechanical Engineers ed., JSME STANDARD Standard Method of
Statistical Fatigue Testing (2nd Edition) JSME S 002, (1994), pp.8-15, The Japan Society
of Mechanical Engineer.
(9) Machida S., Matoba M., Yoshinari H., Lin C., and Makino H., Consideration on
Estimation of Welded Structure's Fatigue Life under Block Loading, Journal of the Society
of Naval Architects of Japan, No.172, (1992), pp.579-587.
(10) Rigaku Corporation, X-ray Diffraction Handbook (in Japanese), (2006), pp103-104.
Rigaku Corporation.
(11) Fischer, Operating Instructions FISCHERSCOPE HM2000, (2003), pp.97-102, Fischer.


![[Corus] Design of SHS Welded Joints](https://img.dokumen.tips/doc/110x75/577d1fe51a28ab4e1e918f6a/corus-design-of-shs-welded-joints.jpg)