Embed Size (px)
Citation preview

Student Achievement Results
2016-2017DR. NANCY A. GIGANTE
PARSIPPANY-TROY HILLS SCHOOLS
SEPTEMBER 2017
1

Parsippany-Troy Hills
Standardized Assessments
2016-17
PARCC (Partnership for the Assessment of Readiness for College and
Careers)
AP (Advanced Placement)
SAT
ACT
NJASK (New Jersey Assessment of Skills and Knowledge)
NJBCT (New Jersey Biology Competency Test)
2

Comparison of Parsippany-Troy Hills’
Spring 2015, Spring 2016, and Spring 2017 PARCC
English Language Arts/Literacy
Not Yet Meeting Expectations
(Level 1)
Partially Meeting Expectations
(Level 2)
Approaching Expectations
(Level 3)
Meeting Expectations
(Level 4)
Exceeding Expectations
(Level 5)
2015 2016 2017 2015 2016 2017 2015 2016 2017 2015 2016 2017 2015 2016 2017
Grade 3 7% 4% 5% 11% 11% 7% 22% 24% 20% 50% 51% 57% 10% 9% 11%
Grade 4 3% 3% 2% 7% 7% 4% 17% 20% 13% 53% 51% 51% 19% 18% 30%
Grade 5 2% 2% 2% 8% 6% 6% 20% 21% 16% 58% 60% 58% 12% 11% 18%
Grade 6 1% 3% 2% 8% 7% 7% 25% 19% 17% 49% 51% 52% 17% 20% 21%
Grade 7 3% 2% 4% 8% 9% 6% 18% 15% 10% 40% 35% 38% 31% 39% 42%
Grade 8 4% 3% 2% 8% 7% 5% 17% 15% 13% 50% 43% 42% 22% 32% 37%
Grade 9 8% 4% 6% 11% 8% 9% 19% 21% 21% 43% 47% 46% 19% 19% 18%
Grade 10 12% 18% 16% 11% 12% 12% 18% 18% 16% 37% 35% 36% 23% 17% 21%
Grade 11 6% 22% 21% 7% 16% 17% 13% 23% 23% 38% 27% 30% 35% 12% 9%
3

Comparison of Parsippany-Troy Hills’
Spring 2015, Spring 2016, and Spring 2017 PARCC
English Language Arts/Literacy – GRADE 3
4
60% 60%
68%
0%
10%
20%
30%
40%
50%
60%
70%
80%
90%
100%
Pe
rce
nt
Pro
fic
ien
t –
Sc
ore
of
4 o
r 5
2015 2016 2017

Comparison of Parsippany-Troy Hills’
Spring 2015, Spring 2016, and Spring 2017 PARCC
English Language Arts/Literacy – GRADE 4
5
72%69%
81%
0%
10%
20%
30%
40%
50%
60%
70%
80%
90%
100%
Pe
rce
nt
Pro
fic
ien
t –
Sc
ore
of
4 o
r 5
2015 2016 2017

Comparison of Parsippany-Troy Hills’
Spring 2015, Spring 2016, and Spring 2017 PARCC
English Language Arts/Literacy – GRADE 5
6
70% 71%
76%
0%
10%
20%
30%
40%
50%
60%
70%
80%
90%
100%
Pe
rce
nt
Pro
fic
ien
t –
Sc
ore
of
4 o
r 5
2015 2016 2017

Comparison of Parsippany-Troy Hills’
Spring 2015, Spring 2016, and Spring 2017 PARCC
English Language Arts/Literacy – GRADE 6
7
66%
71%73%
0%
10%
20%
30%
40%
50%
60%
70%
80%
90%
100%
Pe
rce
nt
Pro
fic
ien
t –
Sc
ore
of
4 o
r 5
2015 2016 2017

Comparison of Parsippany-Troy Hills’
Spring 2015, Spring 2016, and Spring 2017 PARCC
English Language Arts/Literacy – GRADE 7
8
71%74%
80%
0%
10%
20%
30%
40%
50%
60%
70%
80%
90%
100%
Pe
rce
nt
Pro
fic
ien
t –
Sc
ore
of
4 o
r 5
2015 2016 2017

Comparison of Parsippany-Troy Hills’
Spring 2015, Spring 2016, and Spring 2017 PARCC
English Language Arts/Literacy – GRADE 8
9
72%75%
79%
0%
10%
20%
30%
40%
50%
60%
70%
80%
90%
100%
Pe
rce
nt
Pro
fic
ien
t –
Sc
ore
of
4 o
r 5
2015 2016 2017

Comparison of Parsippany-Troy Hills’
Spring 2015, Spring 2016, and Spring 2017 PARCC
English Language Arts/Literacy – GRADE 9
10
62%
66%64%
0%
10%
20%
30%
40%
50%
60%
70%
80%
90%
100%
Pe
rce
nt
Pro
fic
ien
t –
Sc
ore
of
4 o
r 5
2015 2016 2017

Comparison of Parsippany-Troy Hills’
Spring 2015, Spring 2016, and Spring 2017 PARCC
English Language Arts/Literacy – GRADE 10
11
60%
52%
57%
0%
10%
20%
30%
40%
50%
60%
70%
80%
90%
100%
Pe
rce
nt
Pro
fic
ien
t –
Sc
ore
of
4 o
r 5
2015 2016 2017

Comparison of Parsippany-Troy Hills’
Spring 2015, Spring 2016, and Spring 2017 PARCC
English Language Arts/Literacy – GRADE 11
12
73%
39% 39%
0%
10%
20%
30%
40%
50%
60%
70%
80%
90%
100%
Pe
rce
nt
Pro
fic
ien
t –
Sc
ore
of
4 o
r 5
2015 2016 2017
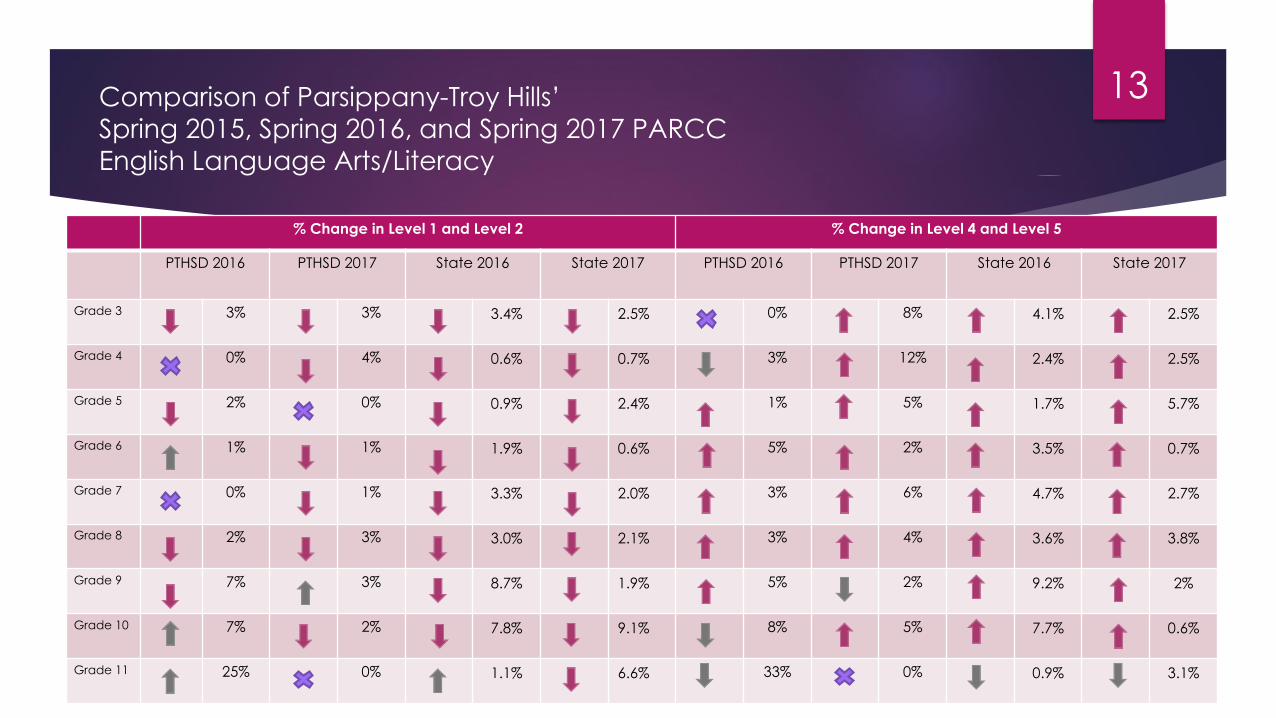
% Change in Level 1 and Level 2 % Change in Level 4 and Level 5
PTHSD 2016 PTHSD 2017 State 2016 State 2017 PTHSD 2016 PTHSD 2017 State 2016 State 2017
Grade 3 3% 3% 3.4% 2.5% 0% 8% 4.1% 2.5%
Grade 4 0% 4% 0.6% 0.7% 3% 12% 2.4% 2.5%
Grade 5 2% 0% 0.9% 2.4% 1% 5% 1.7% 5.7%
Grade 6 1% 1% 1.9% 0.6% 5% 2% 3.5% 0.7%
Grade 7 0% 1% 3.3% 2.0% 3% 6% 4.7% 2.7%
Grade 8 2% 3% 3.0% 2.1% 3% 4% 3.6% 3.8%
Grade 9 7% 3% 8.7% 1.9% 5% 2% 9.2% 2%
Grade 10 7% 2% 7.8% 9.1% 8% 5% 7.7% 0.6%
Grade 11 25% 0% 1.1% 6.6% 33% 0% 0.9% 3.1%
Comparison of Parsippany-Troy Hills’
Spring 2015, Spring 2016, and Spring 2017 PARCC
English Language Arts/Literacy
13

Comparison of Parsippany-Troy Hills’
Spring 2015, Spring 2016, and Spring 2017 PARCC
Mathematics
Not Yet Meeting Expectations
(Level 1)
Partially Meeting Expectations
(Level 2)
Approaching Expectations
(Level 3)
Meeting Expectations
(Level 4)
Exceeding Expectations
(Level 5)
2015 2016 2017 2015 2016 2017 2015 2016 2017 2015 2016 2017 2015 2016 2017
Grade 3 2% 2% 3% 9% 5% 5% 22% 16% 19% 51% 54% 49% 16% 24% 24%
Grade 4 2% 2% 2% 10% 11% 3% 23% 23% 19% 56% 56% 58% 9% 9% 18%
Grade 5 2% 2% 2% 8% 8% 8% 25% 21% 20% 49% 50% 50% 16% 20% 19%
Grade 6 2% 3% 5% 11% 10% 10% 27% 25% 19% 50% 49% 47% 11% 14% 19%
Grade 7 1% 3% 3% 12% 15% 10% 31% 26% 27% 44% 43% 42% 13% 13% 17%
Grade 8* 9% 8% 12% 20% 17% 14% 34% 27% 31% 37% 48% 41% 1% 1% 1%
Algebra I 8% 6% 3% 17% 10% 11% 23% 24% 22% 46% 49% 55% 6% 11% 9%
Geometry 15% 9% 2% 16% 21% 19% 22% 31% 33% 40% 34% 39% 7% 6% 7%
Algebra II 6% 27% 24% 22% 15% 16% 39% 22% 19% 28% 30% 36% 5% 5% 5%
14
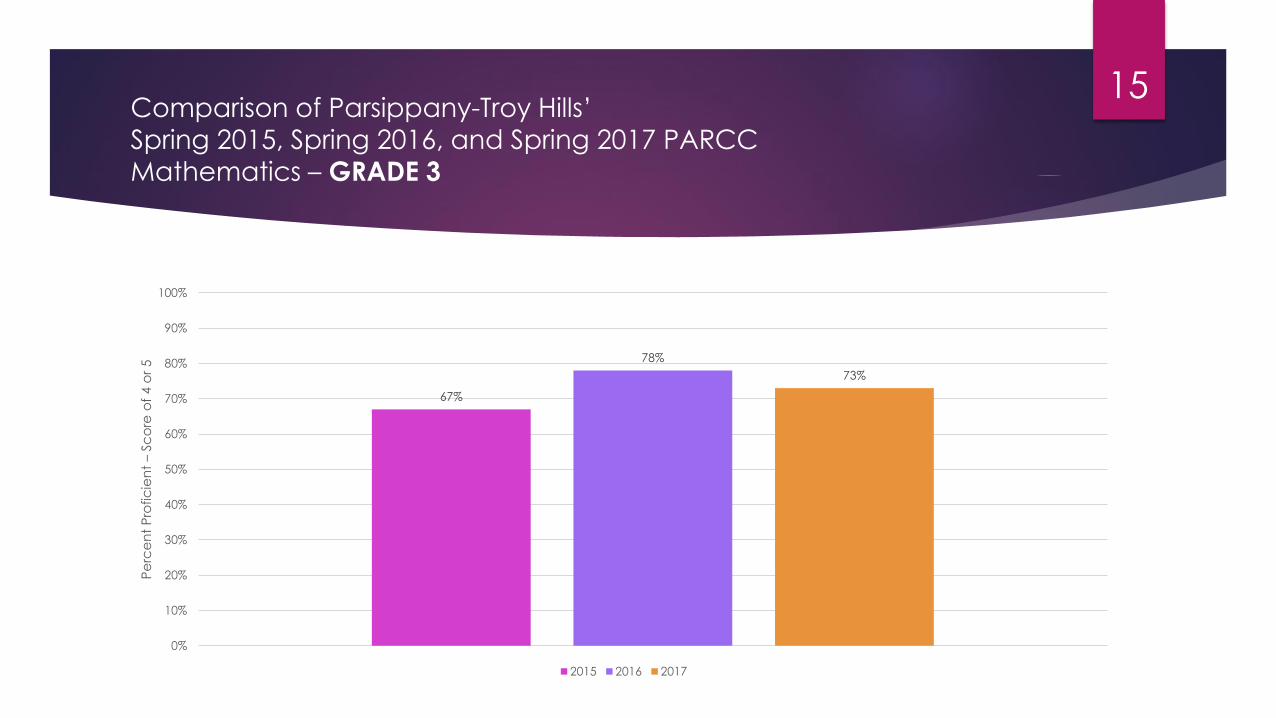
Comparison of Parsippany-Troy Hills’
Spring 2015, Spring 2016, and Spring 2017 PARCC
Mathematics – GRADE 3
15
67%
78%
73%
0%
10%
20%
30%
40%
50%
60%
70%
80%
90%
100%
Pe
rce
nt
Pro
fic
ien
t –
Sc
ore
of
4 o
r 5
2015 2016 2017

Comparison of Parsippany-Troy Hills’
Spring 2015, Spring 2016, and Spring 2017 PARCC
Mathematics – GRADE 4
16
65% 65%
76%
0%
10%
20%
30%
40%
50%
60%
70%
80%
90%
100%
Pe
rce
nt
Pro
fic
ien
t –
Sc
ore
of
4 o
r 5
2015 2016 2017

Comparison of Parsippany-Troy Hills’
Spring 2015, Spring 2016, and Spring 2017 PARCC
Mathematics – GRADE 5
17
65%
70% 69%
0%
10%
20%
30%
40%
50%
60%
70%
80%
90%
100%
Pe
rce
nt
Pro
fic
ien
t –
Sc
ore
of
4 o
r 5
2015 2016 2017

Comparison of Parsippany-Troy Hills’
Spring 2015, Spring 2016, and Spring 2017 PARCC
Mathematics – GRADE 6
18
61%63%
66%
0%
10%
20%
30%
40%
50%
60%
70%
80%
90%
100%
Pe
rce
nt
Pro
fic
ien
t–Sc
ore
of
4 o
r 5
2015 2016 2017

Comparison of Parsippany-Troy Hills’
Spring 2015, Spring 2016, and Spring 2017 PARCC
Mathematics – GRADE 7
19
57% 56%59%
0%
10%
20%
30%
40%
50%
60%
70%
80%
90%
100%
Pe
rce
nt
Pro
fic
ien
t –
Sc
ore
of
4 o
r 5
2015 2016 2017

Comparison of Parsippany-Troy Hills’
Spring 2015, Spring 2016, and Spring 2017 PARCC
Mathematics – GRADE 8
20
38%
49%
42%
0%
10%
20%
30%
40%
50%
60%
70%
80%
90%
100%
Pe
rce
nt
Pro
fic
ien
t –
Sc
ore
of
4 o
r 5
2015 2016 2017

Comparison of Parsippany-Troy Hills’
Spring 2015, Spring 2016, and Spring 2017 PARCC
Mathematics – ALGEBRA 1
21
52%
60%64%
0%
10%
20%
30%
40%
50%
60%
70%
80%
90%
100%
Pe
rce
nt
Pro
fic
ien
t –
Sc
ore
of
4 o
r 5
2015 2016 2017
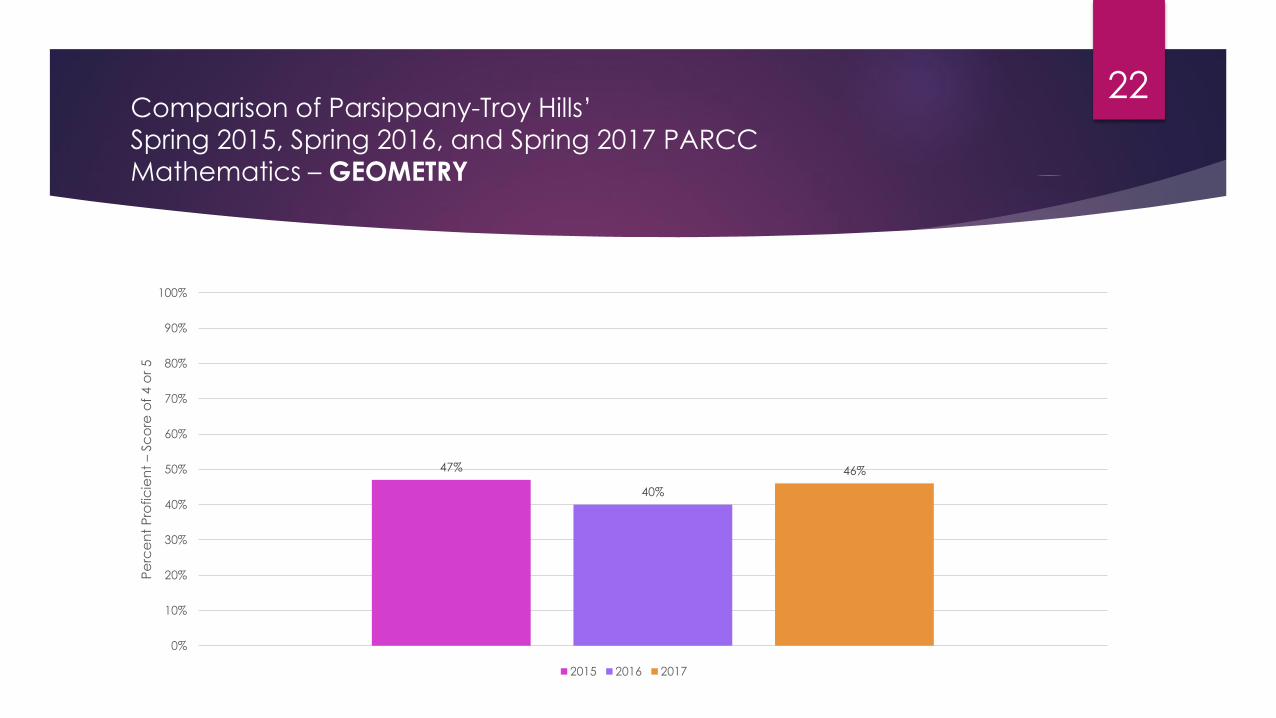
Comparison of Parsippany-Troy Hills’
Spring 2015, Spring 2016, and Spring 2017 PARCC
Mathematics – GEOMETRY
22
47%
40%
46%
0%
10%
20%
30%
40%
50%
60%
70%
80%
90%
100%
Pe
rce
nt
Pro
fic
ien
t –
Sc
ore
of
4 o
r 5
2015 2016 2017

Comparison of Parsippany-Troy Hills’
Spring 2015, Spring 2016, and Spring 2017 PARCC
Mathematics – ALGEBRA 2
23
33%35%
41%
0%
10%
20%
30%
40%
50%
60%
70%
80%
90%
100%
Pe
rce
nt
Pro
fic
ien
t –
Sc
ore
of
4 o
r 5
2015 2016 2017

Comparison of Parsippany-Troy Hills’
Spring 2015, Spring 2016, and Spring 2017 PARCC
Mathematics
24
% Change in Level 1 and Level 2 % Change in Level 4 and Level 5
PTHSD 2016 PTHSD 2017 State 2016 State 2017 PTHSD 2016 PTHSD 2017 State 2016 State 2017
Grade 3 4% 1% 2.8% 1% 11% 5% 6.8% 1.3%
Grade 4 1% 8% 2.5% 0.6% 0% 11% 5.9% 1.4%
Grade 5 0% 0% 2.3% 0.5% 5% 1% 6.2% 1.2%
Grade 6 0% 2% 1.0% 1% 2% 3% 2.2% 1.1%
Grade 7 5% 5% 0.9% 1.1% 1% 3% 1.9% 1.3%
Grade 8 4% 1% 1.3% 2.8% 10% 7% 2.1% 2.4%
Algebra 1 9% 2% 5.0% 0.1% 8% 4% 5.2% 0.8%
Geometry 1% 9% 6.3% 2.6% 7% 6% 4.6% 3%
Algebra 2 14% 2% 0.1% 1.1% 2% 6% 1.1% 1.9%

Comparison of Parsippany-Troy Hills’
Spring 2015, Spring 2016, and Spring 2017 PARCC Cohort
English Language Arts/Literacy – CURRENT 5TH GRADERS
25
61%
82%
0%
10%
20%
30%
40%
50%
60%
70%
80%
90%
100%
2015 2016 2017
Pe
rce
nt
Pro
fic
ien
t–Sc
ore
of
4 o
r 5

Comparison of Parsippany-Troy Hills’
Spring 2015, Spring 2016, and Spring 2017 PARCC Cohort
English Language Arts/Literacy – CURRENT 6TH GRADERS
26
61%
71%
78%
0%
10%
20%
30%
40%
50%
60%
70%
80%
90%
100%
2015 2016 2017
Pe
rce
nt
Pro
fic
ien
t –
Sc
ore
of
4 o
r 5

Comparison of Parsippany-Troy Hills’
Spring 2015, Spring 2016, and Spring 2017 PARCC Cohort
English Language Arts/Literacy – CURRENT 7TH GRADERS
27
74%72%
76%
0%
10%
20%
30%
40%
50%
60%
70%
80%
90%
100%
2015 2016 2017
Pe
rce
nt
Pro
fic
ien
t –
Sc
ore
of
4 o
r 5

Comparison of Parsippany-Troy Hills’
Spring 2015, Spring 2016, and Spring 2017 PARCC Cohort
English Language Arts/Literacy – CURRENT 8TH GRADERS
28
72% 72%
83%
0%
10%
20%
30%
40%
50%
60%
70%
80%
90%
100%
2015 2016 2017
Pe
rce
nt
Pro
fic
ien
t –
Sc
ore
of
4 o
r 5

Comparison of Parsippany-Troy Hills’
Spring 2015, Spring 2016, and Spring 2017 PARCC Cohort
English Language Arts/Literacy – CURRENT 9TH GRADERS
29
66%
75%
83%
0%
10%
20%
30%
40%
50%
60%
70%
80%
90%
100%
2015 2016 2017
Pe
rce
nt
Pro
fic
ien
t –
Sc
ore
of
4 o
r 5

Comparison of Parsippany-Troy Hills’
Spring 2015, Spring 2016, and Spring 2017 PARCC Cohort
English Language Arts/Literacy – CURRENT 10TH GRADERS
30
70%
75%
70%
0%
10%
20%
30%
40%
50%
60%
70%
80%
90%
100%
2015 2016 2017
Pe
rce
nt
Pro
fic
ien
t –
Sc
ore
of
4 o
r 5
30% low 4
47% 3 or lower

Comparison of Parsippany-Troy Hills’
Spring 2015, Spring 2016, and Spring 2017 PARCC Cohort
English Language Arts/Literacy – CURRENT 11TH GRADERS
31
69%71%
62%
0%
10%
20%
30%
40%
50%
60%
70%
80%
90%
100%
2015 2016 2017
Pe
rce
nt
Pro
fic
ien
t –
Sc
ore
of
4 o
r 5
15% low 4
50% 3 or lower

Comparison of Parsippany-Troy Hills’
Spring 2015, Spring 2016, and Spring 2017 PARCC Cohort
English Language Arts/Literacy – CURRENT 12TH GRADERS
32
63%
56%
42%
0%
10%
20%
30%
40%
50%
60%
70%
80%
90%
100%
2015 2016 2017
Pe
rce
nt
Pro
fic
ien
t –
Sc
ore
of
4 o
r 5
11% low 4
40% 3 or lower
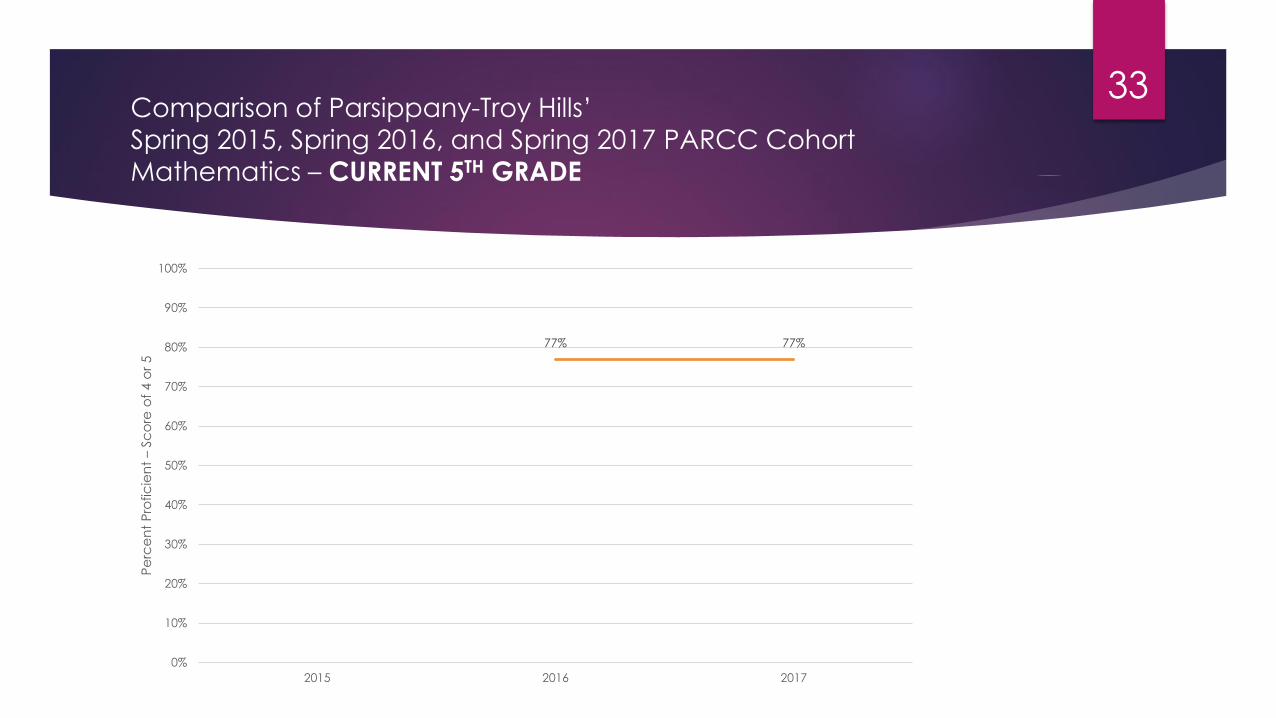
Comparison of Parsippany-Troy Hills’
Spring 2015, Spring 2016, and Spring 2017 PARCC Cohort
Mathematics – CURRENT 5TH GRADE
33
77% 77%
0%
10%
20%
30%
40%
50%
60%
70%
80%
90%
100%
2015 2016 2017
Pe
rce
nt
Pro
fic
ien
t –
Sc
ore
of
4 o
r 5

Comparison of Parsippany-Troy Hills’
Spring 2015, Spring 2016, and Spring 2017 PARCC Cohort
Mathematics – CURRENT 6TH GRADE
34
67% 66%
72%
0%
10%
20%
30%
40%
50%
60%
70%
80%
90%
100%
2015 2016 2017
Pe
rce
nt
Pro
fic
ien
t –
Sc
ore
of
4 o
r 5

Comparison of Parsippany-Troy Hills’
Spring 2015, Spring 2016, and Spring 2017 PARCC Cohort
Mathematics – CURRENT 7TH GRADE
35
66%
71% 70%
0%
10%
20%
30%
40%
50%
60%
70%
80%
90%
100%
2015 2016 2017
Pe
rce
nt
Pro
fic
ien
t –
Sc
ore
of
4 o
r 5

Comparison of Parsippany-Troy Hills’
Spring 2015, Spring 2016, and Spring 2017 PARCC Cohort
Mathematics – CURRENT 8TH GRADE
36
66% 65%62%
0%
10%
20%
30%
40%
50%
60%
70%
80%
90%
100%
2015 2016 2017
Pe
rce
nt
Pro
fic
ien
t –
Sc
ore
of
4 o
r 5
15% low 4
32% 3 or lower

Comparison of Parsippany-Troy Hills’
Spring 2015, Spring 2016, and Spring 2017 PARCC Cohort
Mathematics – CURRENT 9TH GRADE (6-7-8)
37
34%
30%
43%
0%
10%
20%
30%
40%
50%
60%
70%
80%
90%
100%
2015 2016 2017
Pe
rce
nt
Pro
fic
ien
t –
Sc
ore
of
4 o
r 5

Comparison of Parsippany-Troy Hills’
Spring 2015, Spring 2016, and Spring 2017 PARCC Cohort
Mathematics – CURRENT 9TH GRADE (6-7-ALGEBRA 1)
38
98% 98% 97%
0%
10%
20%
30%
40%
50%
60%
70%
80%
90%
100%
2015 2016 2017
Pe
rce
nt
Pro
fic
ien
t –
Sc
ore
of
4 o
r 5

Comparison of Parsippany-Troy Hills’
Spring 2015, Spring 2016, and Spring 2017 PARCC Cohort
Mathematics – CURRENT 10TH GRADE (7-8-ALGEBRA 1)
39
36%
50% 51%
0%
10%
20%
30%
40%
50%
60%
70%
80%
90%
100%
2015 2016 2017
Pe
rce
nt
Pro
fic
ien
t –
Sc
ore
of
4 o
r 5

Comparison of Parsippany-Troy Hills’
Spring 2015, Spring 2016, and Spring 2017 PARCC Cohort
Mathematics – CURRENT 10TH GRADE (7-ALGEBRA 1-GEOMETRY)
40
97% 99% 96%
0%
10%
20%
30%
40%
50%
60%
70%
80%
90%
100%
2015 2016 2017
Pe
rce
nt
Pro
fic
ien
t –
Sc
ore
of
4 o
r 5

Comparison of Parsippany-Troy Hills’
Spring 2015, Spring 2016, and Spring 2017 PARCC Cohort
Mathematics – CURRENT 11TH GRADE (8-ALGEBRA 1-GEOMETRY)
41
29%
33%
26%
0%
10%
20%
30%
40%
50%
60%
70%
80%
90%
100%
2015 2016 2017
Pe
rce
nt
Pro
fic
ien
t –
Sc
ore
of
4 o
r 5
19% low 4
43% 3 or lower

Comparison of Parsippany-Troy Hills’
Spring 2015, Spring 2016, and Spring 2017 PARCC Cohort
Mathematics – CURRENT 11TH OR 12TH GRADE (ALGEBRA 1-GEOMETRY-ALGEBRA 2)
42
53%
44%
39%
0%
10%
20%
30%
40%
50%
60%
70%
80%
90%
100%
2015 2016 2017
Pe
rce
nt
Pro
fic
ien
t –
Sc
ore
of
4 o
r 5
9% low 4
69% 3 or lower

PARCC PERFORMANCE
Drilling Down the Data
District Summary Report
43

PARCC PERFORMANCE
Drilling Down the Data
Student Roster Report
44
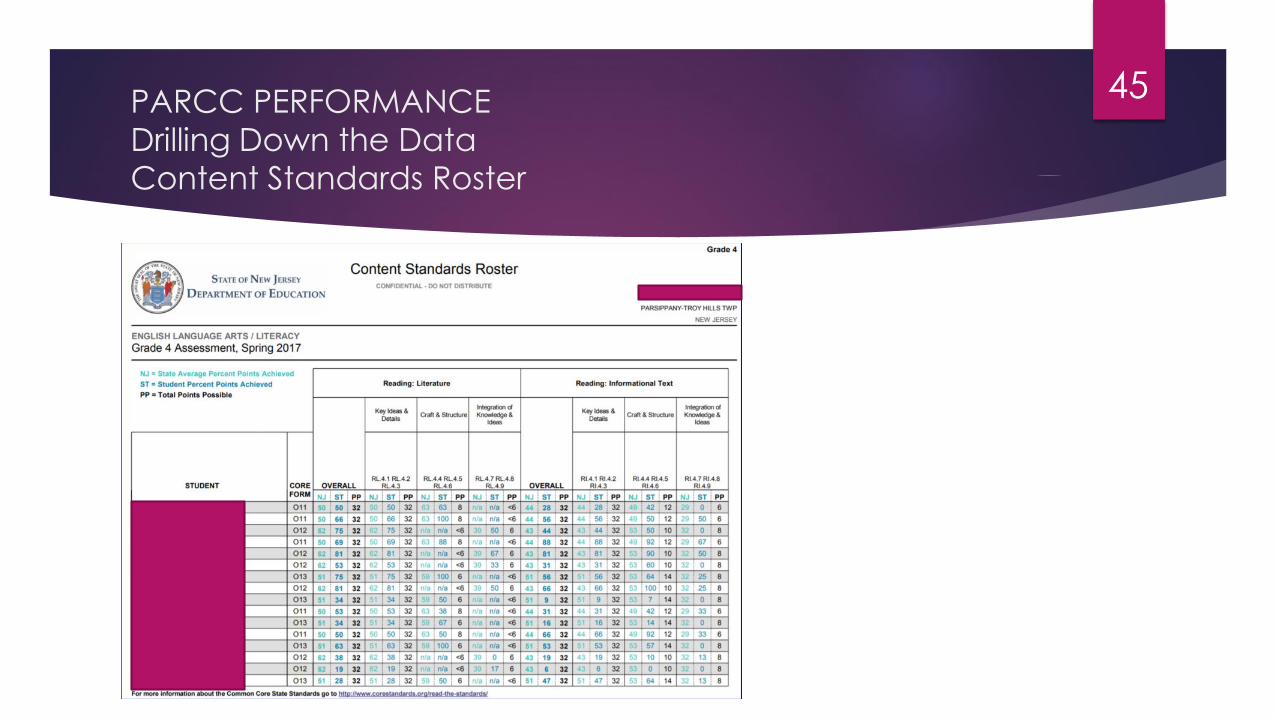
PARCC PERFORMANCE
Drilling Down the Data
Content Standards Roster
45

PARCC PERFORMANCE
Drilling Down the Data
School Evidence Statement Analysis
46

PARCC PERFORMANCE
Drilling Down the Data
School Evidence Statement Analysis
47

PARCC PERFORMANCE
Drilling Down the Data
School Evidence Statement Analysis
Mathematics
ELA
48

PARCC PERFORMANCE
Drilling Down the Data
School Evidence Statement Analysis
U
I
N
49

PARCC PERFORMANCE
Drilling Down the Data
School Evidence Statement Analysis
50

PARCC PERFORMANCE
Drilling Down the Data
School Evidence Statement Analysis
51

Parsippany-Troy Hills
AP (Advanced Placement)
Courses Offered
52
Studio Art Computer Science
Economics Computer Science Principles
English Statistics
Government and Politics Calculus
European history Music Theory
US History Biology
French Chemistry
Italian Environmental Science
Spanish Physics

Comparison of Parsippany-Troy Hills’
AP
Course Participation Rate*
53
* 11th or 12th grade students who took at least one AP course
36.339.1
41.544.1
47.7 49.2
38.3 39.7 39.5
0
10
20
30
40
50
60
70
80
90
100
2015 2016 2017
Pe
rce
nt
Takin
g C
ou
rse
(s)
state comp HS district

Comparison of Parsippany-Troy Hills’
AP
Testing Participation Rate*
54
*11th and 12th graders who took at least one AP exam in any subject area
30.7 32.334.535.1
39.142.6
29.231.9 33
0
10
20
30
40
50
60
70
80
90
100
2015 2016 2017
Pe
rce
nta
ge
Ta
kin
g A
t Le
ast
On
e E
xa
m
state comp HSs district

Comparison of Parsippany-Troy Hills’
AP
Testing Performance (Students Receiving Score of 3, 4, or 5)*
55
*2015 and 2016 = all students taking AP exams in English, math, social studies, or science2017 = all students taking an AP exam in any subject
No
t a
va
ilab
le
59.8 59.857.5
69.7 69.4 68.9
87.183.5
79.883.7
93.8
88
0
10
20
30
40
50
60
70
80
90
100
2015 2016 2017
Pe
rce
nta
ge
Sc
orin
g a
3, 4, o
r 5
nation state comp HSs district

Comparison of Parsippany-Troy Hills’
AP Testing
Performance (All Tests - Average Score)
56
3.23 3.253.11
3.44 3.42
3.7
1
1.5
2
2.5
3
3.5
4
4.5
5
2015 2016 2017
Ave
rag
e S
co
re R
ec
eiv
ed
1 -
5
nation district

Comparison of Parsippany-Troy Hills’
SAT
Participation Rate
57
No
t a
va
ilab
le
79.1
58
94.7
85.4
60
94.1
85
62.1
96
0
10
20
30
40
50
60
70
80
90
100
2015 2016 2017
Pe
rce
nta
ge
Ta
kin
g S
AT
state comp HSs district

Comparison of Parsippany-Troy Hills’
SAT
Performance (Average Composite Score)*
58
*Converted to 1600 scale
No
t a
va
ilab
le
10901044
11001075 1056
1160 1144 11631180 1172 1171
400
600
800
1000
1200
1400
1600
2015 2016 2017
Ave
rag
e S
co
re R
ec
eiv
ed
400 -
16
00
nation state comp HSs district

Comparison of Parsippany-Troy Hills’
ACT
Participation
59
59
6460
25.227.6 28.329.1
35.9
40.4
28.9 29.7
35.6
0
10
20
30
40
50
60
70
80
90
100
2015 2016 2017
Pe
rce
nta
ge
Ta
kin
g A
CT
nation state comp HSs district

Comparison of Parsippany-Troy Hills’
ACT
Performance (Average Score)
60
No
t a
va
ilab
le
21 20.8 21
23.222.5
23.924.5 24.6
23.5 23.2
24.9
1
6
11
16
21
26
31
36
2015 2016 2017
Ave
rag
e S
co
re R
ec
eiv
ed
1 -
36
nation state comp HSs district
No
t a
va
ilab
le

Conversations Moving Forward
61