Embed Size (px)
Citation preview
IZA DP No. 2490
Student Achievement and University Classes:Effects of Attendance, Size, Peers, and Teachers
Pedro MartinsIan Walker
DI
SC
US
SI
ON
PA
PE
R S
ER
IE
S
Forschungsinstitutzur Zukunft der ArbeitInstitute for the Studyof Labor
December 2006
Student Achievement and University
Classes: Effects of Attendance, Size, Peers, and Teachers
Pedro Martins Queen Mary, University of London,
CEG-IST Lisbon and IZA Bonn
Ian Walker University of Warwick, Princeton University
and IZA Bonn
Discussion Paper No. 2490 December 2006
IZA
P.O. Box 7240 53072 Bonn
Germany
Phone: +49-228-3894-0 Fax: +49-228-3894-180
E-mail: [email protected]
Any opinions expressed here are those of the author(s) and not those of the institute. Research disseminated by IZA may include views on policy, but the institute itself takes no institutional policy positions. The Institute for the Study of Labor (IZA) in Bonn is a local and virtual international research center and a place of communication between science, politics and business. IZA is an independent nonprofit company supported by Deutsche Post World Net. The center is associated with the University of Bonn and offers a stimulating research environment through its research networks, research support, and visitors and doctoral programs. IZA engages in (i) original and internationally competitive research in all fields of labor economics, (ii) development of policy concepts, and (iii) dissemination of research results and concepts to the interested public. IZA Discussion Papers often represent preliminary work and are circulated to encourage discussion. Citation of such a paper should account for its provisional character. A revised version may be available directly from the author.
IZA Discussion Paper No. 2490 December 2006
ABSTRACT
Student Achievement and University Classes: Effects of Attendance, Size, Peers, and Teachers*
We examine the empirical determinants of student achievement in higher education, focusing our attention on its small-group teaching component (classes or seminars) and on the role of attendance, number of students per class, peers, and tutors. The empirical analysis is based on longitudinal administrative data from a major undergraduate program where students are allocated to class groups in a systematic way, but one which is plausibly uncorrelated with ability. Although, in simple specifications, we find positive returns to attendance and sizeable differences in the effectiveness of teaching assistants, most effects are not significant in specifications that include student fixed effects. We conclude that unobserved heterogeneity amongst students, even in an institution that imposes rigorous admission criteria and so has little observable heterogeneity, is apparently much more important than observable variation in inputs in explaining student outcomes. JEL Classification: I2, J2 Keywords: education production functions, attendance, class size, peer effects Corresponding author: Pedro S. Martins School of Business and Management Queen Mary, University of London Mile End Road London E1 4NS United Kingdom E-mail: [email protected]
* Financial support from the University of Warwick Teaching Development Fund is gratefully acknowledged. Ian Walker is indebted to the Education Research Section at Princeton University for providing a Visiting Fellowship that facilitated the completion of this paper. We also grateful for the feedback from colleagues at the University of Warwick for their comments and Eric Hanushek, Steve Machin, Steve Pischke, Vincent Vanderberghe and conference participants at Universidade Nova de Lisboa, ZEW in Mannheim, the American Economic Association Annual Meetings (Boston), and the University of Lund for their feedback. All the remaining errors are ours.

1
1. Introduction
Teaching in small groups of students is widely regarded as an important contribution to
an undergraduate university education, at least in US and UK institutions. While in lectures
students are traditionally passive absorbers of the course material, in classes, by solving
exercises or discussing topics, students may not only test their understanding of the topic but
may also acquire a deeper knowledge of the material.
However, as far as we know, there is no empirical evidence to support this view. In
fact, our ignorance of the nature of the higher education (HE) production function, particularly
compared to that at lower educational levels, is quite remarkable1. Important references in the
case of primary or secondary schooling, each one examining separately the role of class size,
peers, teachers or attendance, include Evans et al (1992), Burke and Sass (2004), Romer
(1993), Hanushek et al (2003), Bingley et al (2006), Hoxby (2001), and Vigdor and Nechyba
(2004a and 2004b). Notable contributions in the context of HE are Arcidiacono et al (2005),
and Arcidiacono and Nicholson (2005) that build on the earlier important contribution by
Sacerdote (2001). The relative paucity of empirical evidence about the higher education
production function is a serious deficiency in the literature. Indeed, as higher education is
becoming an increasingly competitive and global industry, we would have expected that
universities would find it more important to understand the determinants of the quality of their
teaching. The need for research regarding the determinants of learning is particularly pressing
since large increases in tuition fees have occurred in many countries in recent years which has
put the spotlight on the efficiency of the HE sector.
This paper seeks to contribute to the empirical study of teaching and learning quality
by assessing the impact of different aspects of undergraduate classes on students’
performance. The dimensions of university classes considered here are: attendance, size, peer
effects, and the role of teaching assistants. As far as we are aware, this paper is the first that
considers simultaneously these four components of the education production function.
Moreover, at least some of our findings can be interpreted as causal effects and not merely
statistical associations. These interpretations are driven by our use of longitudinal
1 See Todd and Wolpin (2003) and Krueger (1999) for research on education production in the context of schools.
2
administrative data, allowing one to control for different types of heterogeneity through fixed
effects, including student fixed effects, and the fact that our students are allocated to classes in
a manner which is plausibly uncorrelated with ability – and it is this that allows us to
investigate the causal impacts of peers and other variables.
It should also be mentioned that the standard identification issues that arise in the
firm/worker fixed effects literature (see Abowd et al (1999)) do not arise in terms of the
separate identification of tutor and student (and module) fixed effects. While in the former
literature, the simultaneous estimation of both types of fixed effects relies on the strong
assumption of random mobility (conditional on workers and firms observable characteristics),
in the case of the present paper the mechanics of university education are such that students
have necessarily to be taught by different tutors, so no assumptions about mobility are
required in order to disentangle student and tutor effects. .
We start, in Section 2, by describing the data used in the paper, while Section 3
presents the main results, and the final section concludes with recommendations for further
research. Regarding our results, we find strong evidence of the relevance of student
heterogeneity. Students’ observable and unobservable characteristics seem to play a more
important role in explaining student outcomes than our alternative explanatory variables based
on university inputs. In other words, we find that most effects (class attendance, size, peers
and teaching assistants) generally lose their significance (and become smaller) in the
specifications that include student fixed effects.
2. Data
Our data are derived from records of student attendance in class meetings of all 1st and
2nd year undergraduate modules2 offered in Economics at a major UK university over the
academic years of 2001/02, 2002/03 and 2003/043. Admission to UK universities is
2 By module we mean a specific individual component of study in a degree course. Introductory Microeconomics or Econometric Theory are examples of modules. A class is a meeting of a relatively small number of students (typically ranging between 5 and 15 students per class) with a class tutor, lasting usually 50 minutes. Finally, a degree is made of different modules, typically taken over a period of three years, after which the student is awarded the corresponding diploma. 3 We do not use data from final year of undergraduate studies, as there are no compulsory 3rd year modules and classes are given by academic staff and not graduate students.
3
competitive, based largely on school performance, and the institution that has provided the
data is extremely popular and can impose very high admission standards. Consequently their
UK-based undergraduates are extremely homogeneous in terms of their observable
characteristics. All will have the highest scores from their secondary schooling and all will
have studied Mathematics at an advanced level; many will have also studied Economics4.
Students take modules in five subjects each year. First year performance has to be at a
minimum level to progress to second year. Results at second year and in the final year
contribute to a final degree classification. These modules are the main components of the
three-year economics degrees offered by the Economics Department and are attended by all
Economics students, plus some students enrolled in related degrees (e.g. Mathematics or
Business)5. The purpose of class meetings is to discuss the lecture material, to solve exercises
and/or to have students deliver short presentations.
An important source of information is the class attendance records that are kept by
each class tutor. These tutors are, in most classes, teaching assistants, who are usually also
PhD students. In some rare cases some classes for some modules are led by the lecturer in
charge of the module. Class attendance is regarded as compulsory and poor attendance can
give rise to reprimands. As the department emphasizes the importance of class attendance,
class tutors are required to make sure all absences are recorded. Any student that misses more
than two classes is contacted by his or her tutor to ask for an explanation for his or her
absence. These requirements lead us to believe that our data is significantly more reliable than
information based on surveys of attendance, which may be affected by recall bias6. We then
merged the individual attendance records with additional information obtained from
administrative records, namely students’ backgrounds – in particular, their home or overseas
4 Foreign-based students are also admitted and here there is inevitably more heterogeneity here. Many non-EU foreign students will have “English” school qualifications because they have been to schools that focus on sending children to UK universities. UK universities have an incentive to discriminate in favor of non-EU-based students because they are charged much higher tuition fees. Most EU students will have an “international Baccalaureate” qualification from their school. Although this offers a broader curriculum than that of UK schools, there is considerable familiarity with this qualification and it seems likely that, on average, the marginal EU student is equivalent quality to the marginal UK student. 5 We do not include non-economics students in our analysis of attendance and peer effects but we consider them when examining class size effects, i.e. our measures of class size consider the presence of these students although we do not study the role of class attendance or peer effects for these non-economics students. 6 Tutor fixed effects are in many of our specifications which ought to sweep out differential reporting errors.
4
status. For each (student-year-module) observation we also have available the student’s final
results, as a percentage mark, which we take as our measure of achievement or performance.
At present, we have been able to merge data concerning about 1,700 complete student-module
observations.
Although the data are for a single subject in just one institution, the homogeneity of
our data allows us to focus on quite specific issues than has been typical in other studies that
have focused on larger populations. In particular, we are able to follow students over a period
of up to two years, as they choose different modules and attend different class groups. In these
classes, students are likely to exhibit different attendance rates, to be allocated to classes of
different sizes, and/or to interact with different peers. This within-student variability in inputs
across their classes is an important component of the identification strategy we pursue.
Another important aspect in our identification strategy is that the allocation of students to
classes is conducted alphabetically. This means that students enrolled in each module are first
ordered alphabetically, by their surname, and only then sequentially distributed to different
class groups7. To this extent, and assuming no ethnic effects related to surnames, one’s class
time and tutor are exogenous, and one’s peers are a random sample of the entire student
population. It is this randomness that we seek to exploit in order to avoid serious endogeneity
issues that trouble most research about peer effects8.
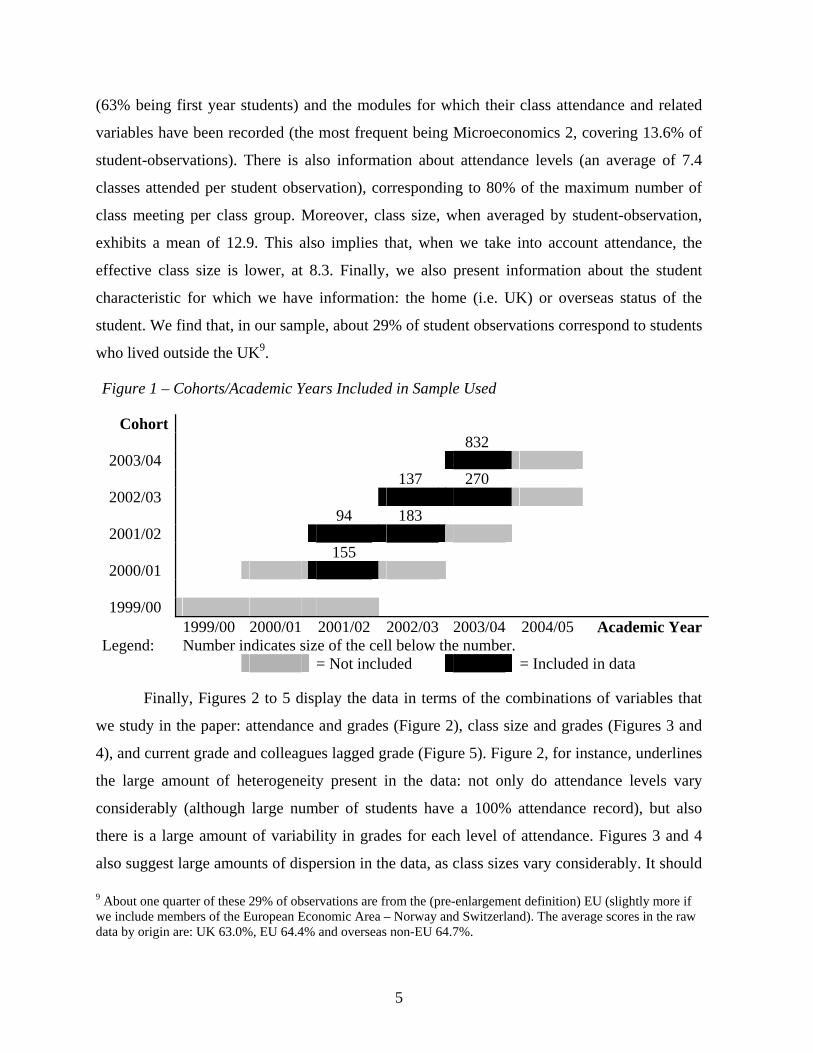
Figure 1 presents a summary description of the data, in terms of the students’ entry
year cohort and their academic year of study when their observations were collected. It can be
seen in the Figure that most observations correspond to 1st year students starting their degree
at the 2003/04 academic year (this group of students corresponds to 832 student-module
observations). The second most important entry-year/academic-year cell is the second year
students that entered in 2002/03 (270 observations).
Table 1 presents some descriptive statistics, including the students grades (a mean
grade of 63%), their academic year (the most frequent being 2003/04), their year of study
7 Students can move to different groups only when they can prove they have a timetable clash. 8 There is limited support in the literature for there being an alphabetic correlation with academic performance. In any case, we find that our results are robust to the exclusion of the most obvious surname initial letters for Asians, the largest ethnic group in our data.
5
(63% being first year students) and the modules for which their class attendance and related
variables have been recorded (the most frequent being Microeconomics 2, covering 13.6% of
student-observations). There is also information about attendance levels (an average of 7.4
classes attended per student observation), corresponding to 80% of the maximum number of
class meeting per class group. Moreover, class size, when averaged by student-observation,
exhibits a mean of 12.9. This also implies that, when we take into account attendance, the
effective class size is lower, at 8.3. Finally, we also present information about the student
characteristic for which we have information: the home (i.e. UK) or overseas status of the
student. We find that, in our sample, about 29% of student observations correspond to students
who lived outside the UK9.
Figure 1 – Cohorts/Academic Years Included in Sample Used
Cohort 832 2003/04
137 270 2002/03
94 183 2001/02
155 2000/01
1999/00
1999/00 2000/01 2001/02 2002/03 2003/04 2004/05 Academic YearLegend: Number indicates size of the cell below the number. = Not included = Included in data
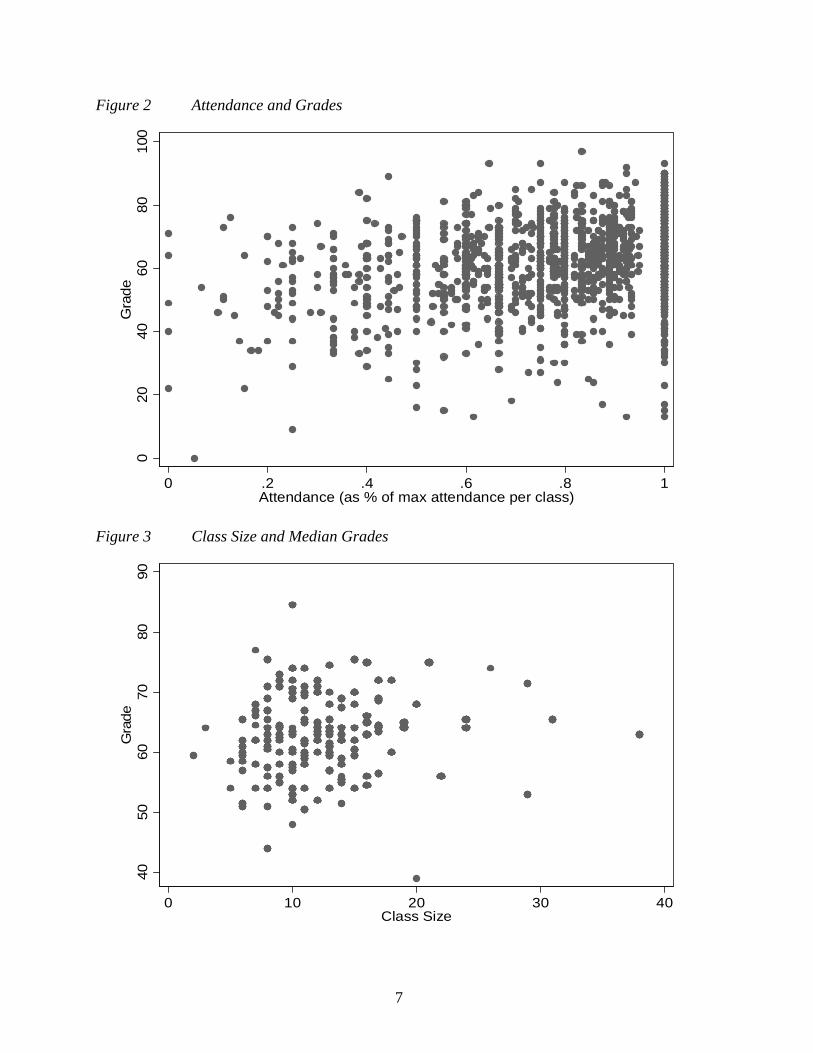
Finally, Figures 2 to 5 display the data in terms of the combinations of variables that
we study in the paper: attendance and grades (Figure 2), class size and grades (Figures 3 and
4), and current grade and colleagues lagged grade (Figure 5). Figure 2, for instance, underlines
the large amount of heterogeneity present in the data: not only do attendance levels vary
considerably (although large number of students have a 100% attendance record), but also
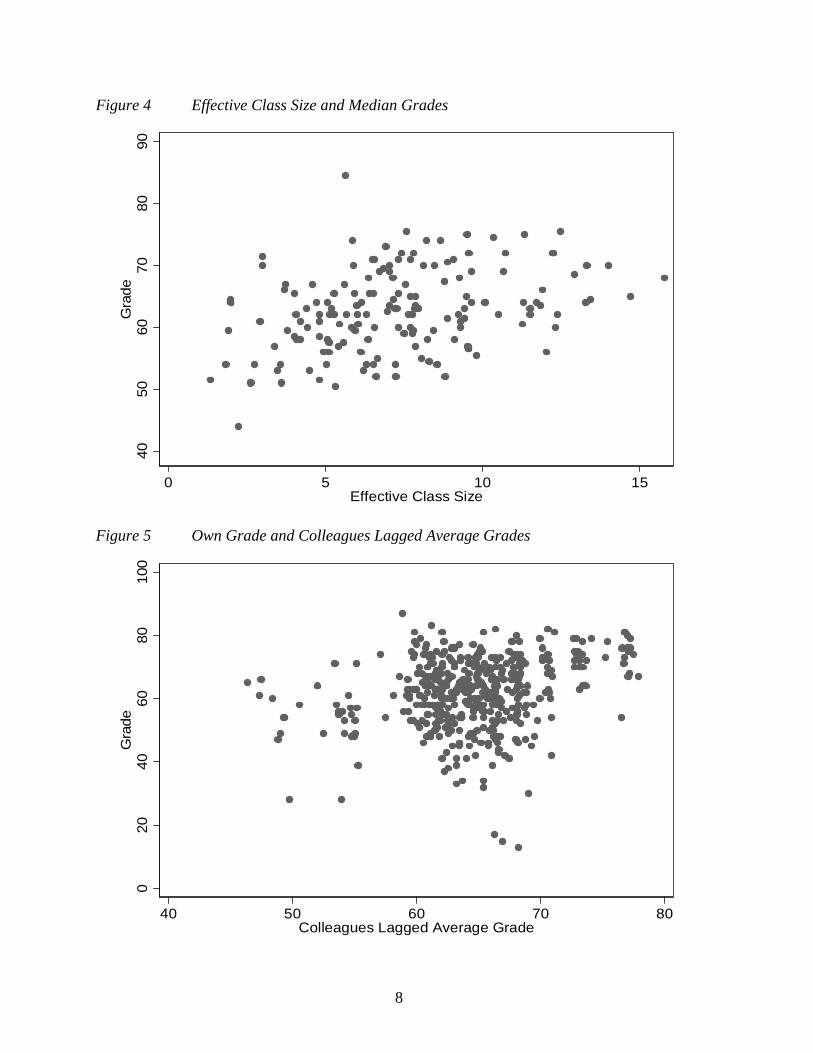
there is a large amount of variability in grades for each level of attendance. Figures 3 and 4
also suggest large amounts of dispersion in the data, as class sizes vary considerably. It should
9 About one quarter of these 29% of observations are from the (pre-enlargement definition) EU (slightly more if we include members of the European Economic Area – Norway and Switzerland). The average scores in the raw data by origin are: UK 63.0%, EU 64.4% and overseas non-EU 64.7%.
6
also be pointed out that the degree of effective dispersion in class sizes, after taking into
account attendance rates, is much smaller. This result is consistent with the administrative
procedures followed when deciding on class size (e.g. bigger groups when attendance is
expected to be lower). Figure 5 again presents evidence of some heterogeneity but in this case
there seems to be evidence of positive correlation between students’ current grades and lagged
grades of their peers. Our analysis will examine the statistical significance of this.
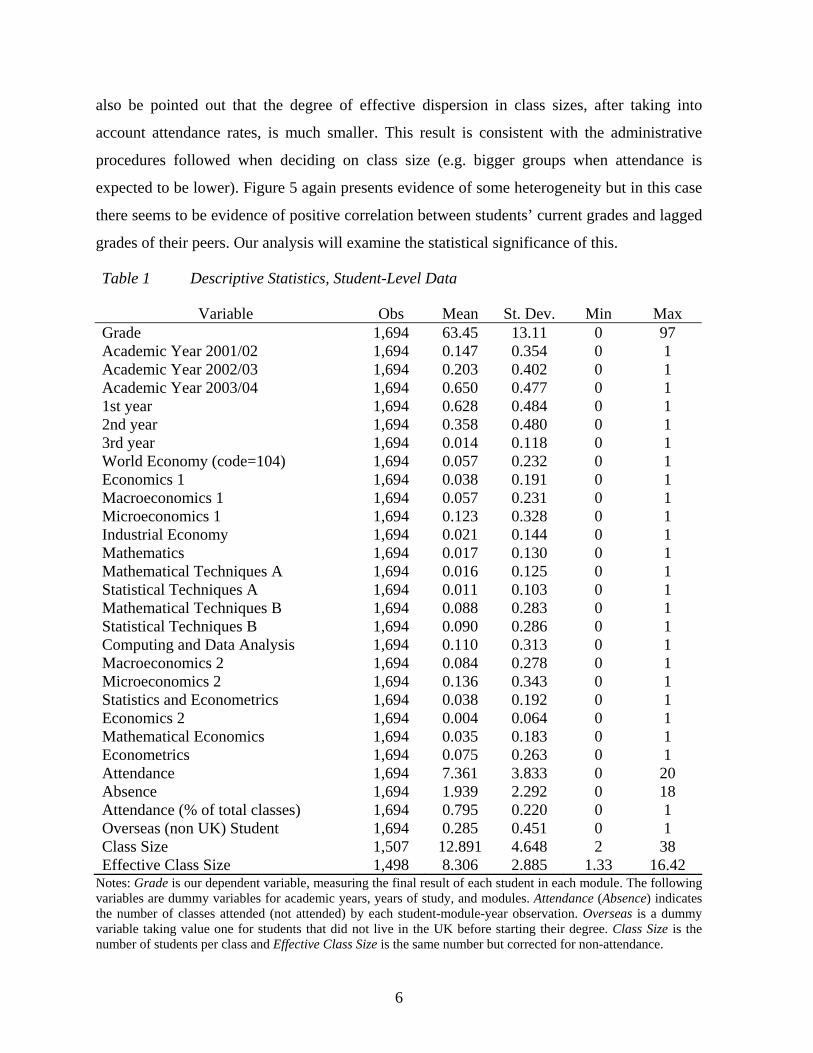
Table 1 Descriptive Statistics, Student-Level Data
Variable Obs Mean St. Dev. Min Max Grade 1,694 63.45 13.11 0 97 Academic Year 2001/02 1,694 0.147 0.354 0 1 Academic Year 2002/03 1,694 0.203 0.402 0 1 Academic Year 2003/04 1,694 0.650 0.477 0 1 1st year 1,694 0.628 0.484 0 1 2nd year 1,694 0.358 0.480 0 1 3rd year 1,694 0.014 0.118 0 1 World Economy (code=104) 1,694 0.057 0.232 0 1 Economics 1 1,694 0.038 0.191 0 1 Macroeconomics 1 1,694 0.057 0.231 0 1 Microeconomics 1 1,694 0.123 0.328 0 1 Industrial Economy 1,694 0.021 0.144 0 1 Mathematics 1,694 0.017 0.130 0 1 Mathematical Techniques A 1,694 0.016 0.125 0 1 Statistical Techniques A 1,694 0.011 0.103 0 1 Mathematical Techniques B 1,694 0.088 0.283 0 1 Statistical Techniques B 1,694 0.090 0.286 0 1 Computing and Data Analysis 1,694 0.110 0.313 0 1 Macroeconomics 2 1,694 0.084 0.278 0 1 Microeconomics 2 1,694 0.136 0.343 0 1 Statistics and Econometrics 1,694 0.038 0.192 0 1 Economics 2 1,694 0.004 0.064 0 1 Mathematical Economics 1,694 0.035 0.183 0 1 Econometrics 1,694 0.075 0.263 0 1 Attendance 1,694 7.361 3.833 0 20 Absence 1,694 1.939 2.292 0 18 Attendance (% of total classes) 1,694 0.795 0.220 0 1 Overseas (non UK) Student 1,694 0.285 0.451 0 1 Class Size 1,507 12.891 4.648 2 38 Effective Class Size 1,498 8.306 2.885 1.33 16.42
Notes: Grade is our dependent variable, measuring the final result of each student in each module. The following variables are dummy variables for academic years, years of study, and modules. Attendance (Absence) indicates the number of classes attended (not attended) by each student-module-year observation. Overseas is a dummy variable taking value one for students that did not live in the UK before starting their degree. Class Size is the number of students per class and Effective Class Size is the same number but corrected for non-attendance.
7
Figure 2 Attendance and Grades
020
4060
8010
0G
rade
0 .2 .4 .6 .8 1Attendance (as % of max attendance per class)
Figure 3 Class Size and Median Grades
4050
6070
8090
Gra
de
0 10 20 30 40Class Size
8
Figure 4 Effective Class Size and Median Grades
4050
6070
8090
Gra
de
0 5 10 15Effective Class Size
Figure 5 Own Grade and Colleagues Lagged Average Grades
020
4060
8010
0G
rade
40 50 60 70 80Colleagues Lagged Average Grade

9
3. Results
Most of the empirical results in this paper are based on different versions of the
following specification of a grade equation:
(1) yitma = β1 attitm + β2 sizeitm + β3 peersitm + αt + αa + αm + αi + εitma
The α’s are fixed effects for academic year (αt) – to allow for grade inflation/deflation; for
modules (αm) – to allow for different levels of difficulty across different subjects; for class
tutors/teaching assistants (αa) – to allow for the possibly different contributions of each tutor;
and for students (αi) – to allow for the possible correlation between some explanatory
variables and the students characteristics that we have not been able to control for.
Partialling out the effects of these variables (students, modules, academic years and
teaching assistants) is likely to be important for the identification of the impacts of attendance,
size and peers, as these latter variables are likely to be endogenous. For instance, students who
are more motivated or more dedicated may simultaneously attend more classes and also do
better in examinations, regardless of their attendance levels. In this case, specifications
without fixed effects would generate upward biased estimates of the impact of attendance.
Class size may also vary endogenously: as mentioned before, smaller classes may be designed
for more challenging modules, in which students may benefit more from class discussions.
In the most thorough specifications, we deal with these and other possible sources of
bias by imposing student fixed effects. This implies that our estimates in the student fixed
effect specifications are based on a comparison of module grade results (our measure of
achievement or performance) for each student across different modules. To the extent that
other determinants of student performance besides the one being considered (e.g. attendance)
are student-invariant (i.e. each student puts roughly the same commitment or dedication into
each module), then these other performance determinants will be implicitly controlled for in
these specifications.
In some specifications, we also use fixed effects for each specific class group (i.e. the
combination of academic year, module and teaching assistant):
(2) yitma = β1 attitm + β2 sizeitm + β3 peersitm + αtma + αi + εitma

10
The results from this specification are derived from differences within specific classes. For
instance, in the case without the student fixed effect (αi=0), the question addressed is: do
students that attend a given class group more often do better in that module than students who
attend fewer meetings of that same class group? If an individual fixed effect is also included,
then the analysis would address the question: do students do better in classes that they attend
relatively more frequently than their colleagues when compared to classes that they attend
relatively less frequently?
Although models such as that of specification (2) are very general, they have the
drawback that they do not allow for the identification of class group invariant variables, such
as size. In our analysis, for the benefit of robustness, we will present results based on different
specifications.
3.1 Class Attendance
The first topic we address concerns the relevance of class attendance for students’
learning. The motivation underpinning this specific analysis is, in part, due to the question of
whether or not class attendance should be made compulsory. More fundamentally, our study is
concerned with the contribution of small group teaching to students learning, with a view to
the informing the optimal allocation of scarce teaching funds across different alternatives.
As mentioned before, an important issue to acknowledge here is that attendance may
pick up the effect of other variables not controlled for (e.g. motivation), which would lead to
the overestimation of the role of attendance. In an earlier study, Romer (1993), using about
200 observations from a single module, deals with the endogeneity of class attendance by
controlling for students’ grades in earlier modules or by focusing on the “more motivated”
students that submit all the required assessments10. As indicated before, our approach is
primarily based on conducting within-student estimations (see Stanca, 2006, for a recent
contribution using a similar methodology).
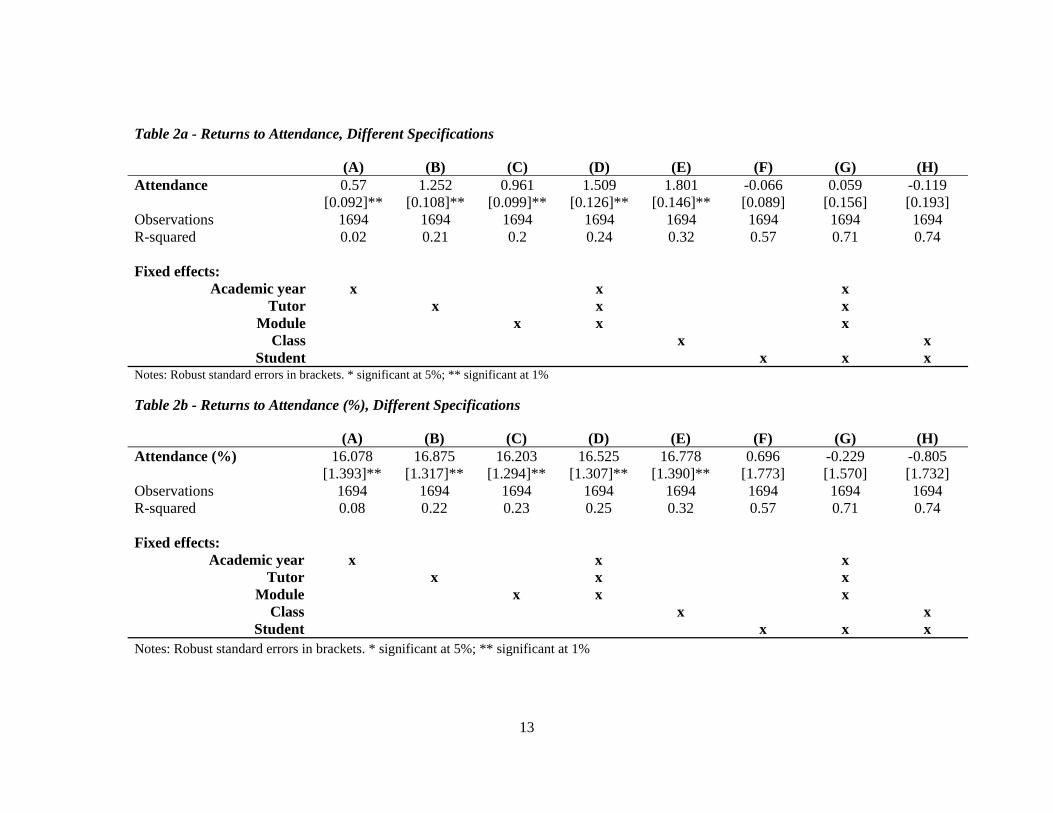
Our evidence in Tables 2a and 2b indicates, at first, that the returns to class attendance
are significant and of a relatively important magnitude. Each additional class attended is
related to an increase of between 0.6 and 1.8 percentage points in a student final grade
10 Durden and Ellis (1995) is another early contribution to the HE literature.

11
(specifications A to E, Table 2a – and similar results for Table 2b, based on attendance as a
percentage of maximum attendance in the class group). However, these effects appear to be
smaller in size, unstable with respect to sign, and less well determined when we allow student
unobserved heterogeneity to be correlated with attendance levels. In other words, while there
are significant returns in all specifications that do not include student fixed effects, all
specifications including student fixed effects result in insignificant impacts. This pattern
generally also holds when one allows for decreasing returns to class attendance by including a
squared term in the specification (results not presented but available upon request).
It should also be mentioned that the return to attendance remains significant when
controlling for class effects (column E) – this is when the return is derived from variation
within class (i.e. whether students that attend more frequently a given class also do better in
the module). This specification is important also because it allows us to control for
measurement error problems across class groups (e.g. for some groups there is data only for
one term, even if the module runs for two terms)11. The most important result is probably that
the attendance coefficient remains insignificant when one controls simultaneously for student
and class effects. In this case, estimation is driven by grade and attendance variation relative to
the student’s and her class group’s means (i.e. if the student does better in a module whose
classes she attends relatively more often than her colleagues that attend the same class, with
respect to other modules). This therefore controls for differences across groups in terms of
how many classes students are supposed to attend and also for unobserved individual factors
that simultaneously influence attendance and results and that are invariant across modules.
Taken at face value, the results of specification H (an insignificant coefficient of -0.12)
suggest that class attendance has no causal impact upon students’ results.
One word of caution is that the attendance coefficient of specification H becomes
positive and bigger (although still insignificant, but less so) when the sample is restricted to
students that are present in the data more often (i.e. in more groups). The attendance point
11 This data issue can also explain why the specification with student fixed effects (column F) produces insignificant results: this specification compares attendance and marks across modules for each student but, while marks are comparable, attendance levels are not necessarily so (not only because of measurement error but also because some modules have different total numbers of classes over the module, ranging from 4 to 20). In specification G, differences in module structure are controlled for but not, for instance, the specific type of measurement error related to attendance sheets being available only for one term.

12
estimate also increases (although the coefficient again remains insignificant) when the sample
is restricted to students who have higher mean absence rates or higher standard deviations of
absence rates.
These two results may suggest that the insignificant results for the entire sample are at
least partially driven by the little variability left in the data when one controls for group and
student effects. In any case, it must also be acknowledged that the within-student variation
across groups may not be random: maybe students devote relatively more time (including by
attending more classes) to those modules which they find more challenging or in which they
predict they will do worse. Alternatively, students may do the opposite because, for instance,
they derive more enjoyment from the modules in which they do better. In the first case, the
attendance coefficient would be biased downward, as may be the case in our results, while in
the second case it would be biased upwards. Other possible biases should also be
acknowledged: for instance, class attendance may be correlated with lecture attendance and
the latter may vary by student and by module.
We have attempted to deal with some of the biases that may remain, even after
adopting an individual fixed effects specification. In this extension, our approach was based
on the fact that attendance changes markedly at different days and at different times of the day
(see Figures 7a and 7b). In particular, Mondays and Fridays and early mornings (up to 10.00)
and late afternoons (from 16.00) typically display poorer attendance levels. Assuming,
possibly too strongly, that day of the week / time of the day interactions do not have a direct
impact upon student performance, we used the day and time interactions of the class meeting
as an instrument for attendance rates. Although we found the expected signs in the first stage,
the results regarding the impact of attendance were still insignificant (results are available
upon request).
13
Table 2a - Returns to Attendance, Different Specifications
(A) (B) (C) (D) (E) (F) (G) (H) Attendance 0.57 1.252 0.961 1.509 1.801 -0.066 0.059 -0.119 [0.092]** [0.108]** [0.099]** [0.126]** [0.146]** [0.089] [0.156] [0.193] Observations 1694 1694 1694 1694 1694 1694 1694 1694 R-squared 0.02 0.21 0.2 0.24 0.32 0.57 0.71 0.74 Fixed effects:
Academic year x x x Tutor x x x
Module x x x Class x x
Student x x x Notes: Robust standard errors in brackets. * significant at 5%; ** significant at 1% Table 2b - Returns to Attendance (%), Different Specifications
(A) (B) (C) (D) (E) (F) (G) (H) Attendance (%) 16.078 16.875 16.203 16.525 16.778 0.696 -0.229 -0.805 [1.393]** [1.317]** [1.294]** [1.307]** [1.390]** [1.773] [1.570] [1.732] Observations 1694 1694 1694 1694 1694 1694 1694 1694 R-squared 0.08 0.22 0.23 0.25 0.32 0.57 0.71 0.74 Fixed effects:
Academic year x x x Tutor x x x
Module x x x Class x x
Student x x x Notes: Robust standard errors in brackets. * significant at 5%; ** significant at 1%

Figure 7a Mean Grades and Class Times
5560
6570
75M
ean
Gra
de
8 10 12 14 16 18Class Time
Figure 7b Mean Attendance and Class Times
.75
.8.8
5.9
Mea
n At
tend
ance
8 10 12 14 16 18Class Time
15
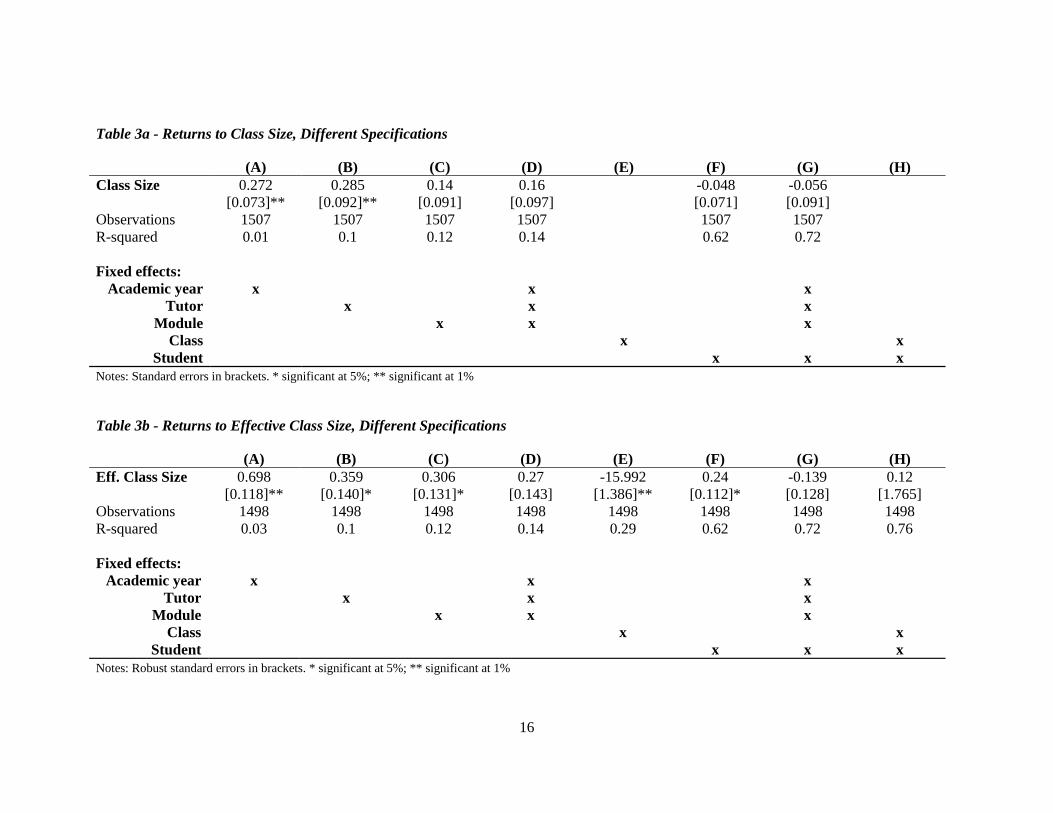
3.2 Class Size
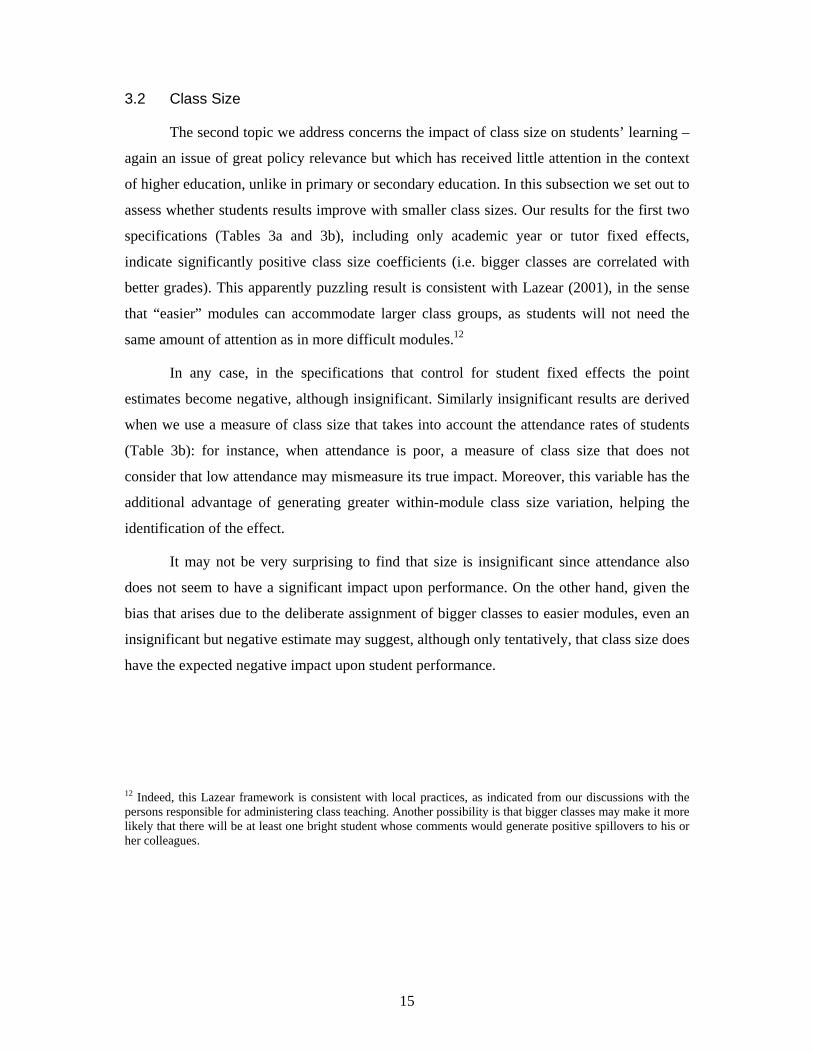
The second topic we address concerns the impact of class size on students’ learning –
again an issue of great policy relevance but which has received little attention in the context
of higher education, unlike in primary or secondary education. In this subsection we set out to
assess whether students results improve with smaller class sizes. Our results for the first two
specifications (Tables 3a and 3b), including only academic year or tutor fixed effects,
indicate significantly positive class size coefficients (i.e. bigger classes are correlated with
better grades). This apparently puzzling result is consistent with Lazear (2001), in the sense
that “easier” modules can accommodate larger class groups, as students will not need the
same amount of attention as in more difficult modules.12
In any case, in the specifications that control for student fixed effects the point
estimates become negative, although insignificant. Similarly insignificant results are derived
when we use a measure of class size that takes into account the attendance rates of students
(Table 3b): for instance, when attendance is poor, a measure of class size that does not
consider that low attendance may mismeasure its true impact. Moreover, this variable has the
additional advantage of generating greater within-module class size variation, helping the
identification of the effect.
It may not be very surprising to find that size is insignificant since attendance also
does not seem to have a significant impact upon performance. On the other hand, given the
bias that arises due to the deliberate assignment of bigger classes to easier modules, even an
insignificant but negative estimate may suggest, although only tentatively, that class size does
have the expected negative impact upon student performance.
12 Indeed, this Lazear framework is consistent with local practices, as indicated from our discussions with the persons responsible for administering class teaching. Another possibility is that bigger classes may make it more likely that there will be at least one bright student whose comments would generate positive spillovers to his or her colleagues.
16
Table 3a - Returns to Class Size, Different Specifications
(A) (B) (C) (D) (E) (F) (G) (H) Class Size 0.272 0.285 0.14 0.16 -0.048 -0.056 [0.073]** [0.092]** [0.091] [0.097] [0.071] [0.091] Observations 1507 1507 1507 1507 1507 1507 R-squared 0.01 0.1 0.12 0.14 0.62 0.72 Fixed effects:
Academic year x x x Tutor x x x
Module x x x Class x x
Student x x x Notes: Standard errors in brackets. * significant at 5%; ** significant at 1%
Table 3b - Returns to Effective Class Size, Different Specifications
(A) (B) (C) (D) (E) (F) (G) (H) Eff. Class Size 0.698 0.359 0.306 0.27 -15.992 0.24 -0.139 0.12 [0.118]** [0.140]* [0.131]* [0.143] [1.386]** [0.112]* [0.128] [1.765] Observations 1498 1498 1498 1498 1498 1498 1498 1498 R-squared 0.03 0.1 0.12 0.14 0.29 0.62 0.72 0.76 Fixed effects:
Academic year x x x Tutor x x x
Module x x x Class x x
Student x x x Notes: Robust standard errors in brackets. * significant at 5%; ** significant at 1%
17
3.3 Joint Analysis and Tutor Effects
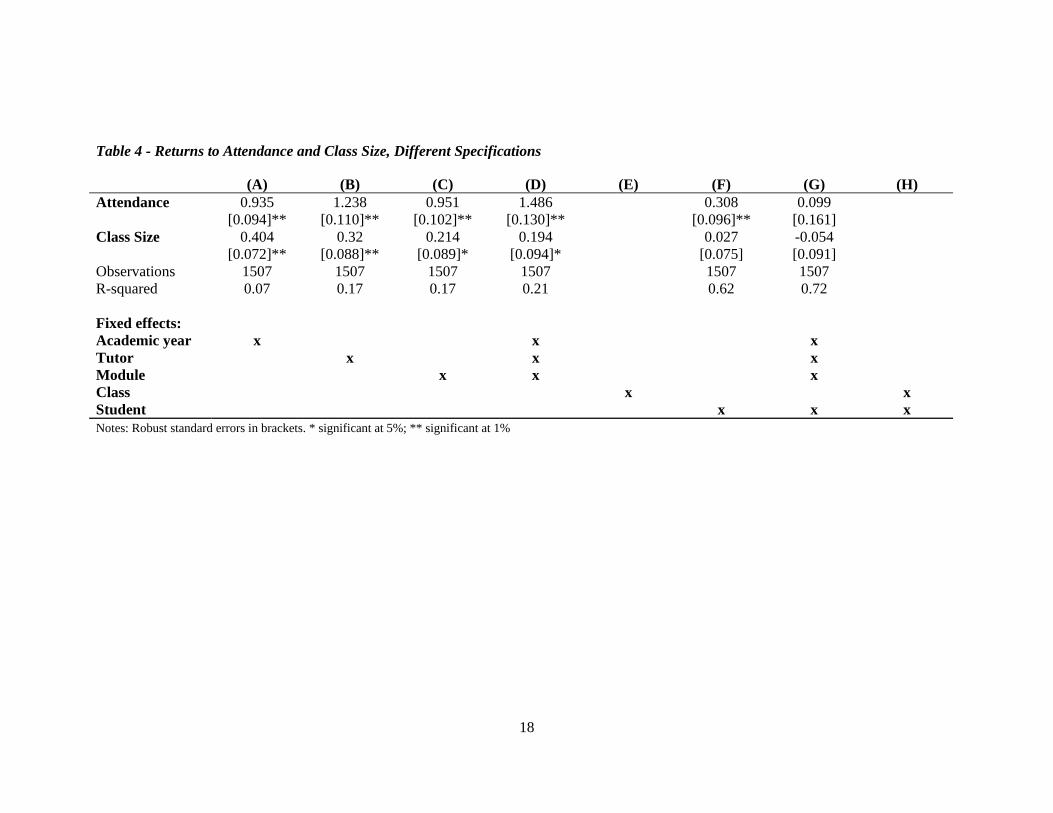
Table 4 presents estimates from specifications that simultaneously consider the role of
attendance and class size. We find results similar to those described before, when analyzing
each variable in separate equations. Namely, those specifications without student fixed
effects tend to present significantly positive coefficients, both for attendance and for class
size. When controlling for student effects, both coefficients become insignificant, although
the point estimate of class size is negative (as before) while the point estimate of attendance
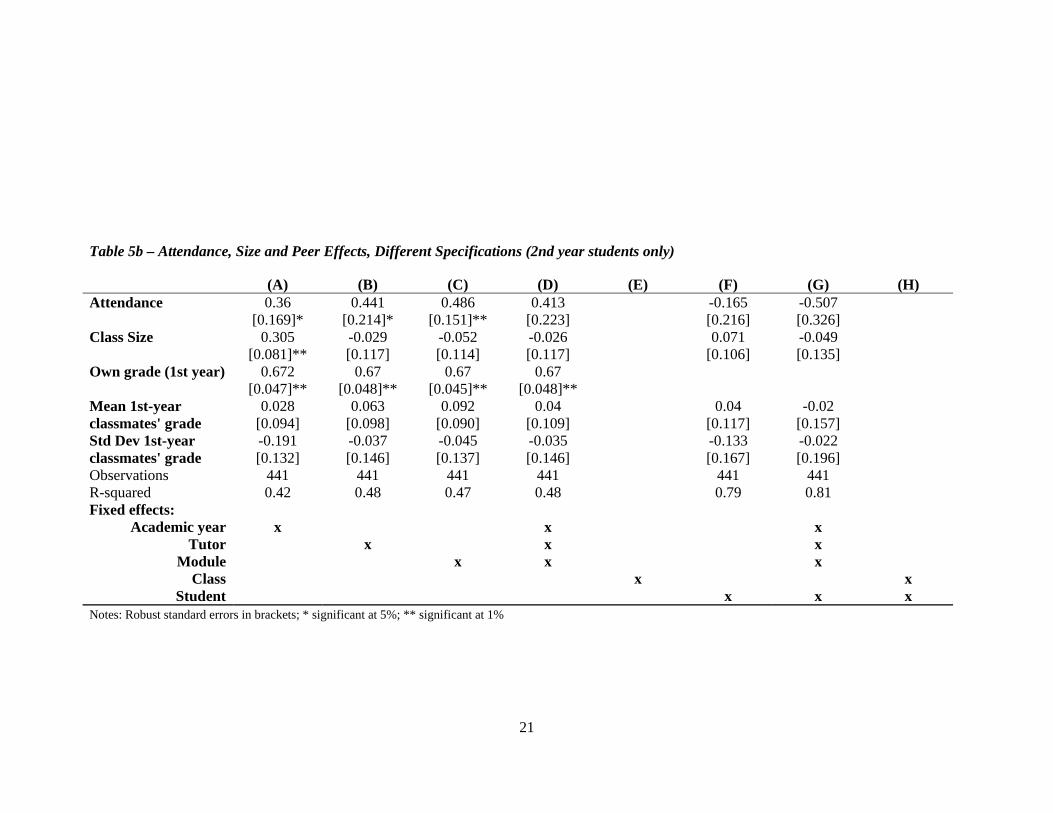
is positive (unlike before). Similarly insignificant results are found in Table 5b, where we
have added peer effects to the analysis of attendance and class size. No coefficient in the
most detailed equation (column G) is significant.
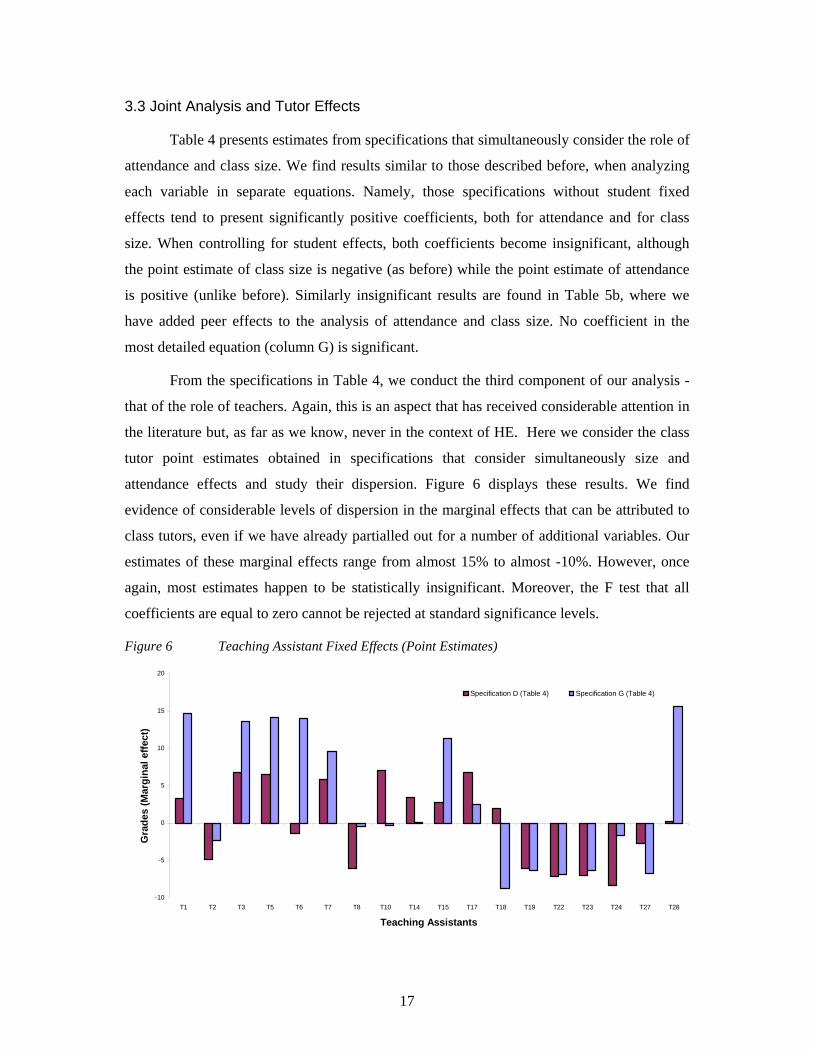
From the specifications in Table 4, we conduct the third component of our analysis -
that of the role of teachers. Again, this is an aspect that has received considerable attention in
the literature but, as far as we know, never in the context of HE. Here we consider the class
tutor point estimates obtained in specifications that consider simultaneously size and
attendance effects and study their dispersion. Figure 6 displays these results. We find
evidence of considerable levels of dispersion in the marginal effects that can be attributed to
class tutors, even if we have already partialled out for a number of additional variables. Our
estimates of these marginal effects range from almost 15% to almost -10%. However, once
again, most estimates happen to be statistically insignificant. Moreover, the F test that all
coefficients are equal to zero cannot be rejected at standard significance levels.
Figure 6 Teaching Assistant Fixed Effects (Point Estimates)
-10
-5
0
5
10
15
20
T1 T2 T3 T5 T6 T7 T8 T10 T14 T15 T17 T18 T19 T22 T23 T24 T27 T28
Teaching Assistants
Gra
des
(Mar
gina
l effe
ct)
Specification D (Table 4) Specification G (Table 4)
18
Table 4 - Returns to Attendance and Class Size, Different Specifications
(A) (B) (C) (D) (E) (F) (G) (H) Attendance 0.935 1.238 0.951 1.486 0.308 0.099 [0.094]** [0.110]** [0.102]** [0.130]** [0.096]** [0.161] Class Size 0.404 0.32 0.214 0.194 0.027 -0.054 [0.072]** [0.088]** [0.089]* [0.094]* [0.075] [0.091] Observations 1507 1507 1507 1507 1507 1507 R-squared 0.07 0.17 0.17 0.21 0.62 0.72 Fixed effects: Academic year x x x Tutor x x x Module x x x Class x x Student x x x Notes: Robust standard errors in brackets. * significant at 5%; ** significant at 1%

19
3.4 Class Peer-Effects
The last aspect addressed in the paper concerns class peer-group effects. This is a
topic which has received a considerable amount of interest recently, in particular in the
context of the economics of education literature. Some recent evidence by Zimmerman
(2003) and Zimmerman and Whinston (2003), for US institutions, suggests that good students
are not negatively affected from interacting with students that do poorly, while the latter
benefit from interacting with the former. In other words, the peer effects are nonlinear, so that
the mix of students is important to the average outcome. These results indicate that
heterogeneous groups (based on students of different abilities) would lead to overall better
outcomes.
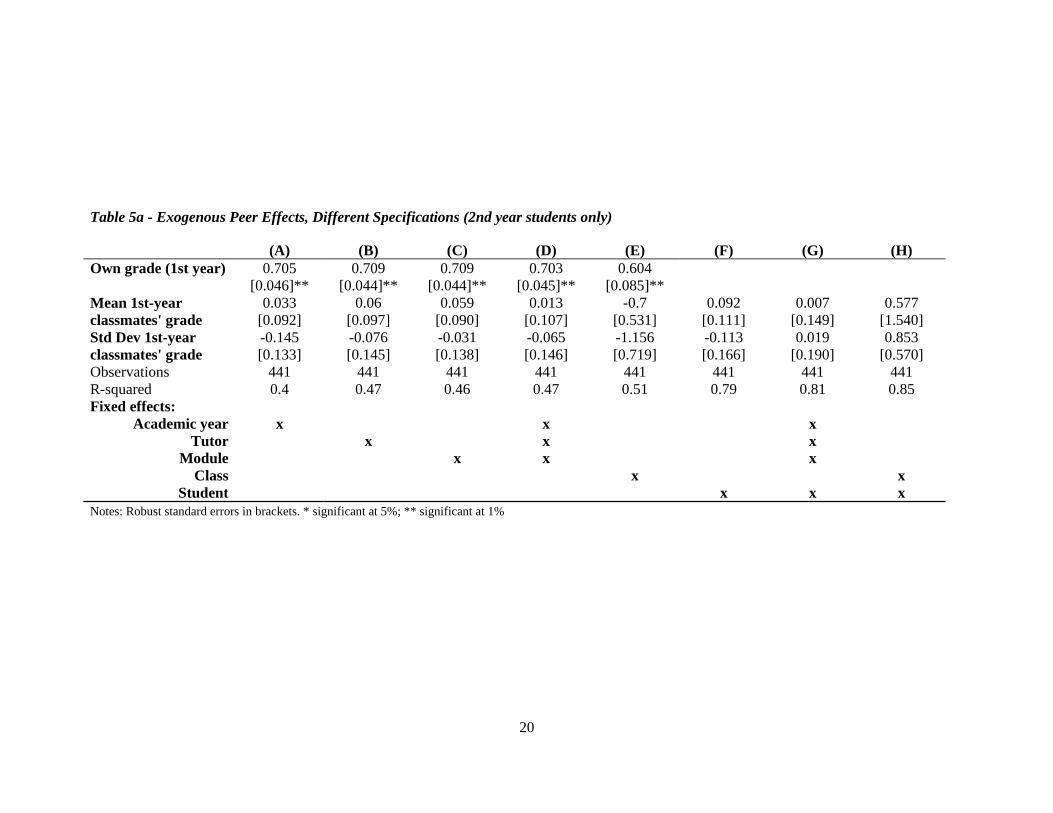
Our approach involved first computing an average of student grades in the first year
and taking that as a proxy of student ability. We then calculated, for each student in each
second year class, the mean of their colleagues’ first year grades and their standard deviation.
We finally considered equations in which we control for the same combinations of fixed
effects used before, plus the students own first year grade, the mean first year grades of his or
her colleagues, and the standard deviation of those grades.
These results are presented in Table 5a. The first specifications without student fixed
effects indicate a very strong degree of autocorrelation of grades, in the sense that current
second-year grades are very significantly predicted by own first-year grades. However, all
variables capturing peer effects fail to come out significant. The coefficients for the two first
moments of the colleagues grades are generally positive which suggests, leaving aside issues
of statistical significance, that students, on average, do better when mixed with better students
and/or when assigned to less uniform groups (in terms of their ability).
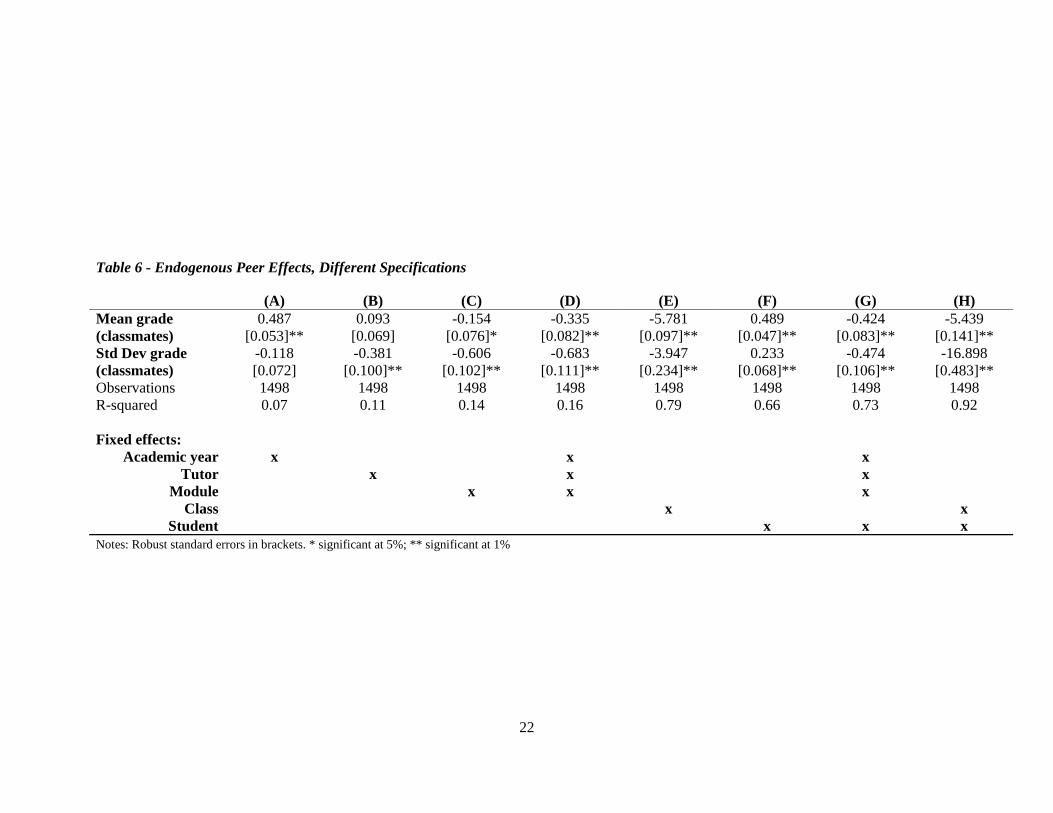
Table 6 presents some supplementary evidence about peer effects - in this case based
on endogenous peer effects. Here we examine the relationship between current grades and the
current grades of each student’s peer. Although these results need to be interpreted with care
(see Manski (1993) and Moffitt (2001)) it is interesting to notice that, when considering
student effects, there is evidence of a statistically significant relationship between own and
peer grades (i.e. students do relatively better when paired with colleagues that also do
relatively better), which is consistent with the presence of a Manski reflection effect. On the
other hand, when we add controls for the class characteristics, the relationship between own
and peer grades becomes significantly negative.
20
Table 5a - Exogenous Peer Effects, Different Specifications (2nd year students only)
(A) (B) (C) (D) (E) (F) (G) (H) Own grade (1st year) 0.705 0.709 0.709 0.703 0.604 [0.046]** [0.044]** [0.044]** [0.045]** [0.085]** Mean 1st-year 0.033 0.06 0.059 0.013 -0.7 0.092 0.007 0.577 classmates' grade [0.092] [0.097] [0.090] [0.107] [0.531] [0.111] [0.149] [1.540] Std Dev 1st-year -0.145 -0.076 -0.031 -0.065 -1.156 -0.113 0.019 0.853 classmates' grade [0.133] [0.145] [0.138] [0.146] [0.719] [0.166] [0.190] [0.570] Observations 441 441 441 441 441 441 441 441 R-squared 0.4 0.47 0.46 0.47 0.51 0.79 0.81 0.85 Fixed effects:
Academic year x x x Tutor x x x
Module x x x Class x x
Student x x x Notes: Robust standard errors in brackets. * significant at 5%; ** significant at 1%
21
Table 5b – Attendance, Size and Peer Effects, Different Specifications (2nd year students only)
(A) (B) (C) (D) (E) (F) (G) (H) Attendance 0.36 0.441 0.486 0.413 -0.165 -0.507 [0.169]* [0.214]* [0.151]** [0.223] [0.216] [0.326] Class Size 0.305 -0.029 -0.052 -0.026 0.071 -0.049 [0.081]** [0.117] [0.114] [0.117] [0.106] [0.135] Own grade (1st year) 0.672 0.67 0.67 0.67 [0.047]** [0.048]** [0.045]** [0.048]** Mean 1st-year 0.028 0.063 0.092 0.04 0.04 -0.02 classmates' grade [0.094] [0.098] [0.090] [0.109] [0.117] [0.157] Std Dev 1st-year -0.191 -0.037 -0.045 -0.035 -0.133 -0.022 classmates' grade [0.132] [0.146] [0.137] [0.146] [0.167] [0.196] Observations 441 441 441 441 441 441 R-squared 0.42 0.48 0.47 0.48 0.79 0.81 Fixed effects:
Academic year x x x Tutor x x x
Module x x x Class x x
Student x x x Notes: Robust standard errors in brackets; * significant at 5%; ** significant at 1%
22
Table 6 - Endogenous Peer Effects, Different Specifications
(A) (B) (C) (D) (E) (F) (G) (H) Mean grade 0.487 0.093 -0.154 -0.335 -5.781 0.489 -0.424 -5.439 (classmates) [0.053]** [0.069] [0.076]* [0.082]** [0.097]** [0.047]** [0.083]** [0.141]** Std Dev grade -0.118 -0.381 -0.606 -0.683 -3.947 0.233 -0.474 -16.898 (classmates) [0.072] [0.100]** [0.102]** [0.111]** [0.234]** [0.068]** [0.106]** [0.483]** Observations 1498 1498 1498 1498 1498 1498 1498 1498 R-squared 0.07 0.11 0.14 0.16 0.79 0.66 0.73 0.92 Fixed effects:
Academic year x x x Tutor x x x
Module x x x Class x x
Student x x x Notes: Robust standard errors in brackets. * significant at 5%; ** significant at 1%
23
4. Conclusions
Our paper contributes to the understanding of the higher education production
function. This is a topic that we feel has received less attention than it should. One reason
why HE is expensive is because of its lower class sizes, leading many institutions to make
extensive use of PhD students as teaching assistants to reduce the cost. Thus, in practice the
marginal costs of classes can be quite low and the question we ask here is - what is their
marginal benefit? We therefore focus on the role of several dimensions of small group
teaching (class size, attendance, peers and tutors) in terms of students’ performance, as
measured by their examinations.
We exploited rich data from a large department of a leading UK university - namely
the availability of multiple observations for each student and the plausibly random allocation
of students to classes. The research framework that we use here can, and should, be easily
exported to other universities and departments, where our study can be replicated and
extended.
Two main results emerge from the present analysis. The first suggests that there are
no significant effects from class attendance. The second indicates that smaller classes do not
translate into gains in achievement. Other results include the lack of significant peer effects
and evidence of variability in teaching effects, which is, however, also not significant.
These findings need to be interpreted carefully. For instance, the result of no
attendance effects may not necessarily indicate that attendance does not matter per se: on the
contrary, it can instead be the case that attendance does matter but that the students in our
data choose optimally how many classes to attend, so that marginal variation around that
attendance level does not translate into any gains in terms of achievement.
The result about class size also does not necessarily allow one to extrapolate to other
universities where class size may be larger. However, these results do seem to suggest that
class sizes at present are too small as students would not have their learning negatively
affected by marginally bigger classes – while those saved resources could be employed in
other teaching dimensions which would hopefully have significant effects.
Finally, we should point out that an important shortcoming of our analysis is that we
cannot address the way in which students respond to the shocks that occur to their classes in
terms of peer mix, class size and inability to attend for exogenous reasons. For example, if we
found that students who missed class compensated by working harder themselves then we

24
could argue that students do as well as they want and institutions can pass on, at the margin at
least, some of the burden of achieving this target. On the other hand, if students do not
compensate, then one might conclude that students do as badly as institutions allow them to.
This issue is left for further work.
25
References Abowd, J., F. Kramarz and D. Margolis (1999), “High Wage Workers and High Wage
Firms”, Econometrica, 67, 251-334.
Arcidiacono, P., G. Foster, N. Goodpaster and J. Kinsler (2005) ,“Estimating Spillovers in the Classroom with Panel Data”, Duke University, mimeo.
Arcidiacono, P. and S. Nicholson (2005), “Peer Effects in Medical School”, Journal of Public Economics, 89, 327-350.
Bingley, P., Myrup Jensen, V., and I. Walker (2005), “The Effects of School Resources on Participation in Post-Compulsory Education in Denmark”, Aarhus University, mimeo.
Burke, M. and T. Sass (2004), “Classroom Peer Effects and Student Achievement”, Florida State University, mimeo.
Durden, G., and L. Ellis (1995), “The Effects of Attendance on Student Learning in Principles of Economics”, American Economic Review (Papers and Proceedings), 85, 343-346.
Evans, W., W. Oates, and R. Schwab (1992), “Measuring Peer Group Effects: A Study of Teenage Behaviour”, Journal of Political Economy, 100, 966-991.
Hanushek, E., J. Kain, J. Markman and S. Rivkin (2003), “Does Peer Ability Affect Student Achievement?”, Journal of Applied Econometrics, 18, 527-544.
Hoxby, C. (2001), “Peer Effects in the Classroom: Learning from Gender and Race Variation,” NBER Working Paper No. 7867.
Krueger, A. (1999), "Experimental Estimates of Education Production Functions", Quarterly Journal of Economics,114, 497-532.
Lazear, E. (2001), “Educational Production”, Quarterly Journal of Economics, 116, 777-803.
Manski, C. (1993), “Identification of Endogenous Social Effects: The Reflection Problem”, Review of Economic Studies, 60, 531-542.
Moffitt, R. (2001) ,“Policy Interventions, Low-Level Equilibria, and Social Interactions”, in S. Durlauf and H.P. Young (eds.), Social Dynamics, , Cambridge: MIT
Romer, D. (1993), “Do Students Go To Classes? Should They?” Journal of Economic Perspectives, 7, 167-174.
Sacerdote, B. (2001), “Peer Effects with Random Assignment: Results for Dartmouth Roommates”, Quarterly Journal of Economics, 116, 681-704.
Stanca, L. (2006), “The Effects of Attendance on Academic Performance: Panel Data Evidence for Introductory Microeconomics”, Journal of Economic Education, 37, 251-266.
Todd, P. and K. Wolpin (2003), “On the Specification and Estimation of the Production Function for Cognitive Achievement”, Economic Journal, 113, 3-33.
Vigdor, J. and T. Nechyba (2004a), “Peer Effects in North Carolina Public Schools”, Duke University, mimeo.
Vigdor, J. and T. Nechyba (2004b), “Peer Effects in Elementary School: Learning from 'Apparent' Random Assignment”, Duke University, mimeo.

26
Zimmerman, D. and G. Winston (2003), “Peer Effects in Higher Education”, in C. Hoxby, (ed.), College Decisions: How Students Actually Make Them and How they Could, University of Chicago Press.
Zimmerman, D. (2003,) “Peer Effects in Higher Education: Evidence from a Natural Experiment”, Review of Economics and Statistics, 85, 9-23.