Embed Size (px)
Citation preview

1 23
Journal of MolecularModelingComputational Chemistry - LifeScience - Advanced Materials -New Methods ISSN 1610-2940Volume 17Number 1 J Mol Model (2010) 17:37-48DOI 10.1007/s00894-010-0696-6
Structure and dynamics of human vimentinintermediate filament dimer and tetramerin explicit and implicit solvent models

1 23
Your article is protected by copyright and
all rights are held exclusively by Springer-
Verlag. This e-offprint is for personal use only
and shall not be self-archived in electronic
repositories. If you wish to self-archive your
work, please use the accepted author’s
version for posting to your own website or
your institution’s repository. You may further
deposit the accepted author’s version on a
funder’s repository at a funder’s request,
provided it is not made publicly available until
12 months after publication.
ORIGINAL PAPER
Structure and dynamics of human vimentin intermediatefilament dimer and tetramer in explicit and implicitsolvent models
Zhao Qin & Markus J. Buehler
Received: 22 December 2009 /Accepted: 22 February 2010 /Published online: 1 April 2010# Springer-Verlag 2010
Abstract Intermediate filaments, in addition to micro-tubules and microfilaments, are one of the three majorcomponents of the cytoskeleton in eukaryotic cells, andplay an important role in mechanotransduction as well as inproviding mechanical stability to cells at large stretch. Themolecular structures, mechanical and dynamical propertiesof the intermediate filament basic building blocks, thedimer and the tetramer, however, have remained elusivedue to persistent experimental challenges owing to the largesize and fibrillar geometry of this protein. We have recentlyreported an atomistic-level model of the human vimentindimer and tetramer, obtained through a bottom-up approachbased on structural optimization via molecular simulationbased on an implicit solvent model (Qin et al. in PLoS ONE2009 4(10):e7294, 9). Here we present extensive simu-lations and structural analyses of the model based on ultralarge-scale atomistic-level simulations in an explicit solventmodel, with system sizes exceeding 500,000 atoms and
simulations carried out at 20 ns time-scales. We report adetailed comparison of the structural and dynamicalbehavior of this large biomolecular model with implicitand explicit solvent models. Our simulations confirm thestability of the molecular model and provide insight into thedynamical properties of the dimer and tetramer. Specifical-ly, our simulations reveal a heterogeneous distribution ofthe bending stiffness along the molecular axis with theformation of rather soft and highly flexible hinge-likeregions defined by non-alpha-helical linker domains. Wereport a comparison of Ramachandran maps and the solventaccessible surface area between implicit and explicit solventmodels, and compute the persistence length of the dimerand tetramer structure of vimentin intermediate filamentsfor various subdomains of the protein. Our simulationsprovide detailed insight into the dynamical properties of thevimentin dimer and tetramer intermediate filament buildingblocks, which may guide the development of novel coarse-grained models of intermediate filaments, and could alsohelp in understanding assembly mechanisms.
Keywords Bending stiffness . Biopolymer . Dimer .
Explicit solvent . Implicit solvent . Intermediate filaments .
Materiomics . Molecular dynamics . Molecular structure .
Persistence length . Structural optimization . Tetramer .
Vimentin
Introduction
Intermediate filaments (IFs), in addition to microtubulesand microfilaments, are one of the three major componentsof the cytoskeleton in eukaryotic cells [1] and are emergingas major players in cell biology, in particular in issuesrelated to mechanobiological mechanisms. IFs are crucial in
Z. Qin :M. J. Buehler (*)Laboratory for Atomistic and Molecular Mechanics,Department of Civil and Environmental Engineering,Massachusetts Institute of Technology,77 Massachusetts Ave., Room 1-235A&B,Cambridge, MA, USAe-mail: [email protected]
Z. Qin :M. J. BuehlerCenter for Materials Science and Engineering,Massachusetts Institute of Technology,77 Massachusetts Ave.,Cambridge, MA, USA
M. J. BuehlerCenter for Computational Engineering,Massachusetts Institute of Technology,77 Massachusetts Ave.,Cambridge, MA, USA
J Mol Model (2011) 17:37–48DOI 10.1007/s00894-010-0696-6
Author's personal copy

defining key mechanical functions of cells such as cellmigration, cell division and mechanotransduction, and havealso been referred to as the “safety belts of cells” in thebiology community as they play a structural role inpreventing exceedingly large cell stretch [2–6]. Earlierstudies focused on analyzing the mechanical signature ofIFs have suggested that they are highly sensitive to appliedforces at small levels, and that they can sustain extremelylarge deformation of up to 300% or four times their initiallength [7, 8], an observation that was also observed inrecent simulation studies [9]. Proteins of the IF family arealso found in the cell’s nucleus in the form of lamin, wherethey form a dense mesh-like network providing mechanicalintegrity and biochemical functions at the cytoskeleton-chromatin interface [10–12]. IFs have been associated withmany genetic diseases, where single point mutations,domain deletions as well as sequence modifications leadto structural changes at different levels in the IFs’hierarchical organization. IF related diseases include muscledystrophies, Alexander disease [13], epidermolysis bullosasimplex, as well as a broad class of disorders referred to aslaminopathies (e.g., rapid aging disease progeria) [14–17].In extracellular materials, IF proteins are found in hair, hoofand wool, further emphasizing the broad significance of thisprotein material for a variety of applications in biology,medicine and engineering.
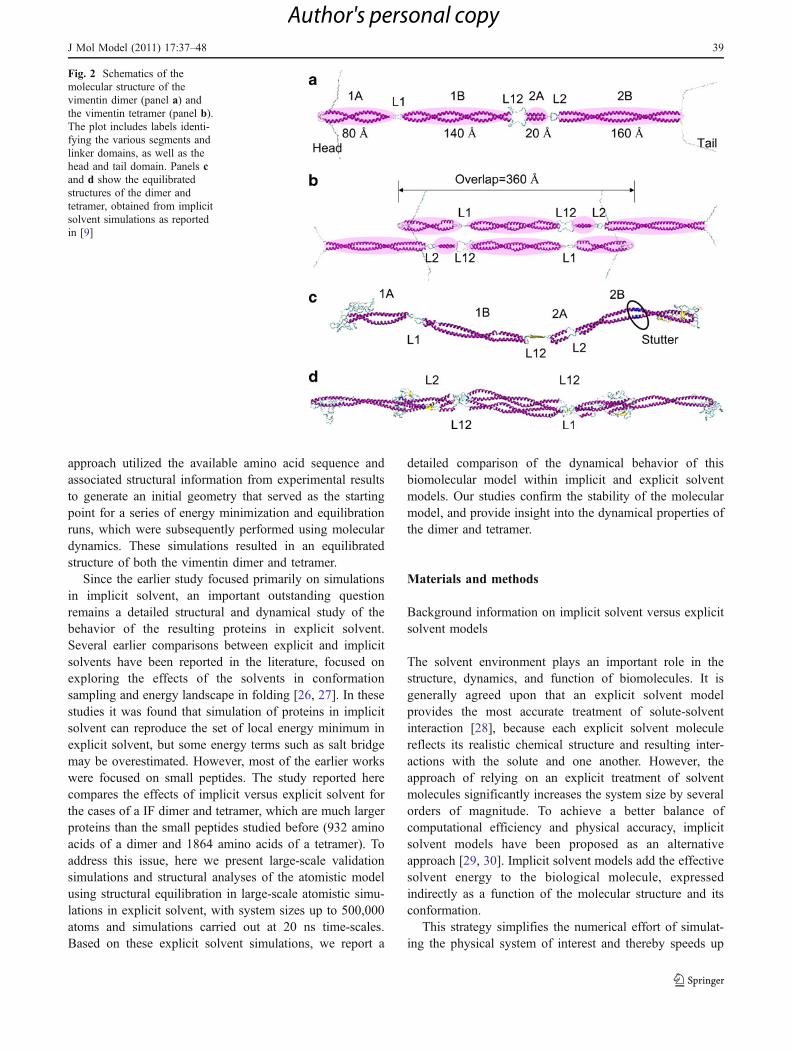
IFs form hierarchical structures as shown in Fig. 1,ranging from dimers, tetramers, unit length filaments, full-length filaments to the cellular level. Each vimentin dimer,the basic building block of this protein filament, contains466 amino acids. Experimental studies suggested that theyform four major structural segments linked in series in thesequence 1A, 1B, 2A and 2B, connected by linkers L1, L12and L2 (see Fig. 2a). Up until now, a complete atomistic-level molecular model of the dimer or tetramer structure hasremained elusive. So far, only parts of two of the foursegments of the dimer, a section of the 1A and 2B domainof the vimentin dimer structure, have been crystallized andtheir atomic structure identified based on x-ray diffractionexperiments [18–22] (the structures are found in ProteinData Bank (PDB) entries 1gk4, 1gk6, 3klt and 1gk7).Persistent experimental challenges have prevented theidentification of the remaining parts of the IF structureusing experimental approaches. This is because IFs areintrinsically disordered structures [23], so that x-raydiffraction studies on naturally occurring or recombinantlyproduced IF bundles do not provide sufficient data toproduce a full atomistic model of IFs. Whereas solid statenuclear magnetic resonance (ssNMR) has been successfullyutilized to derive atomistic models of amyloid fibrils [24],this approach has not yet worked for IF dimers or tetramer,likely because amyloid peptides are much smaller than IFdimers. Cryoelectron tomography has been suggested as a
possible molecular-level imaging tool to visualize singleIFs, but the highest resolution tomograms are still limited toa resolution around 5 nm [25].
The lack of a complete structural model of IFs hasprevented us from addressing fundamental structure-function relationship questions related to the mechanicalrole of intermediate filaments, which is crucial to linkstructure and function in the protein filament’s biologicalcontext. The availability of a structural model of IFs couldalso be the key to understanding the mechanisms of IFrelated genetic diseases, where structural flaws that origi-nate at the genetic or molecular level may cause majorstructural changes of biologically relevant properties. Toaddress these issues, here we provide a detailed analysis ofa molecular model of IF dimers and tetramers withatomistic resolution that was recently obtained based on abottom-up molecular simulation approach using an effec-tive solvent model [9]. The earlier structure identification
Fig. 1 The hierarchical structure of intermediate filaments, fromatomic to cellular scales. The figure shows relevant structural levels(H0 to H7). The present paper focuses on structural analysis of levelsH4 and H5 (dimer/tetramer structure). The regions marked in yellowin the dimer level are those that have been crystallized in earlierstudies. The focus of the study reported in this paper is on vimentindimers and tetramers, corresponding to hierarchy levels H4 and H5 asmarked in the figure. Figure adapted from reference [9]
38 J Mol Model (2011) 17:37–48
Author's personal copy
approach utilized the available amino acid sequence andassociated structural information from experimental resultsto generate an initial geometry that served as the startingpoint for a series of energy minimization and equilibrationruns, which were subsequently performed using moleculardynamics. These simulations resulted in an equilibratedstructure of both the vimentin dimer and tetramer.
Since the earlier study focused primarily on simulationsin implicit solvent, an important outstanding questionremains a detailed structural and dynamical study of thebehavior of the resulting proteins in explicit solvent.Several earlier comparisons between explicit and implicitsolvents have been reported in the literature, focused onexploring the effects of the solvents in conformationsampling and energy landscape in folding [26, 27]. In thesestudies it was found that simulation of proteins in implicitsolvent can reproduce the set of local energy minimum inexplicit solvent, but some energy terms such as salt bridgemay be overestimated. However, most of the earlier workswere focused on small peptides. The study reported herecompares the effects of implicit versus explicit solvent forthe cases of a IF dimer and tetramer, which are much largerproteins than the small peptides studied before (932 aminoacids of a dimer and 1864 amino acids of a tetramer). Toaddress this issue, here we present large-scale validationsimulations and structural analyses of the atomistic modelusing structural equilibration in large-scale atomistic simu-lations in explicit solvent, with system sizes up to 500,000atoms and simulations carried out at 20 ns time-scales.Based on these explicit solvent simulations, we report a
detailed comparison of the dynamical behavior of thisbiomolecular model within implicit and explicit solventmodels. Our studies confirm the stability of the molecularmodel, and provide insight into the dynamical properties ofthe dimer and tetramer.
Materials and methods
Background information on implicit solvent versus explicitsolvent models
The solvent environment plays an important role in thestructure, dynamics, and function of biomolecules. It isgenerally agreed upon that an explicit solvent modelprovides the most accurate treatment of solute-solventinteraction [28], because each explicit solvent moleculereflects its realistic chemical structure and resulting inter-actions with the solute and one another. However, theapproach of relying on an explicit treatment of solventmolecules significantly increases the system size by severalorders of magnitude. To achieve a better balance ofcomputational efficiency and physical accuracy, implicitsolvent models have been proposed as an alternativeapproach [29, 30]. Implicit solvent models add the effectivesolvent energy to the biological molecule, expressedindirectly as a function of the molecular structure and itsconformation.
This strategy simplifies the numerical effort of simulat-ing the physical system of interest and thereby speeds up
Fig. 2 Schematics of themolecular structure of thevimentin dimer (panel a) andthe vimentin tetramer (panel b).The plot includes labels identi-fying the various segments andlinker domains, as well as thehead and tail domain. Panels cand d show the equilibratedstructures of the dimer andtetramer, obtained from implicitsolvent simulations as reportedin [9]
J Mol Model (2011) 17:37–48 39
Author's personal copy
the simulation efficiency by averaging the solvent effect.Since no frictional effects are included in implicit solventmethods, such models can facilitate a more rapid structuralorganization toward the equilibrium geometry due to thelack of viscosity imposed by explicit water molecules. Thiseffect can be advantageous in structure identificationapproaches [31–33] (such as in the study reported in [9])since it accelerates the sampling of molecular configura-tions, so that more configurations are visited per simulatedunit time. Whereas the approach of using implicit solventsis computationally efficient, it has been discussed that theimplicit model may overestimate some energy terms andlead to inaccurate results, in particular regarding thedetailed configurations of domains in a protein [27].Therefore, further validation and comparison by explicitsolvent models is needed to ensure the validity of theresults obtained from implicit solvent simulations. Toaddress these issues, a detailed comparison betweenimplicit and explicit simulation models is provided here,applied specifically to a vimentin intermediate filamentdimer and tetramer.
Molecular models and force field
The implicit solvent simulations whose results are analyzedhere [9] were carried out with the CHARMM program byusing the CHARMM19 all-atom energy function and animplicit Gaussian model for the water solvent [29, 30].Explicit solvent simulations [34] are used to confirm thestability of the equilibrated structures, showing that thestructures predicted by our approach are stable also inexplicit solvent. We use the CHARMM force field andexplicit TIP3 water [34] implemented in NAMD [35],starting from the equilibrated structure obtained using theapproach described above. The time step used in allsimulations is 1 fs, at a constant temperature (300 K)controlled by Langevin thermostat. A pressure of 1atmosphere is used in the explicit water simulations. Weuse the particle mesh Ewald (PME) method in calculatingthe electrostatic interactions, with a grid size of 1 Å in allthree directions. A cutoff length of 10 Å is applied to thevan der Waals interactions and to switch the electrostaticforces from short range to long range forces. We use purewater in our simulations (no ions are included).
Initial molecular structure
The structure of the dimer has been identified by a series ofcomputational steps, as reported in [9]. Figure 2a and bshow a schematic of the structural character of the dimerand the tetramer, with each domain labeled. Figure 2c and ddepict a snapshot of the equilibrated dimer and tetramerstructures as obtained from implicit solvent calculations.
These geometries from earlier studies [9] are used as astarting point for the simulations reported here. The dimerstructure is reported at http://www.plosone.org/article/fetchSingleRepresentation.action?uri=info:doi/10.1371/journal.pone.0007294.s010, and the tetramer structure is reported athttp://www.plosone.org/article/fetchSingleRepresentation.action?uri=info:doi/10.1371/journal.pone.0007294.s011 isused. Explicit water is added in a rectangular water boxwith periodic boundary conditions in all three directionsusing visual molecular dynamics (VMD). We use arectangular solvent box with dimension of 54 nm×7.5 nm×7 nm for the dimer and 66 nm×9 nm×9 nm forthe tetramer. Because the diameters of the dimer andtetrameter are estimated to be 2.4 nm and 4 nm, respec-tively, the nearest distances between two neighboringdimers and tetramers are 4.6 nm and 5 nm, respectively.These distances are much larger than the cutoff length ofthe pair list distance (12 Å) and thereby there is nointeraction between the neighboring dimers or tetramers.
The dimer and tetramer systems in explicit solventcontain ≈250,000 in the dimer and ≈500,000 atoms in thetetramer case (in this case ≈30,000 atoms for the proteinplus ≈470,000 for the water molecules). The use ofparallelized supercomputers enables us to reach about20 ns in about one month of simulation time.
Results
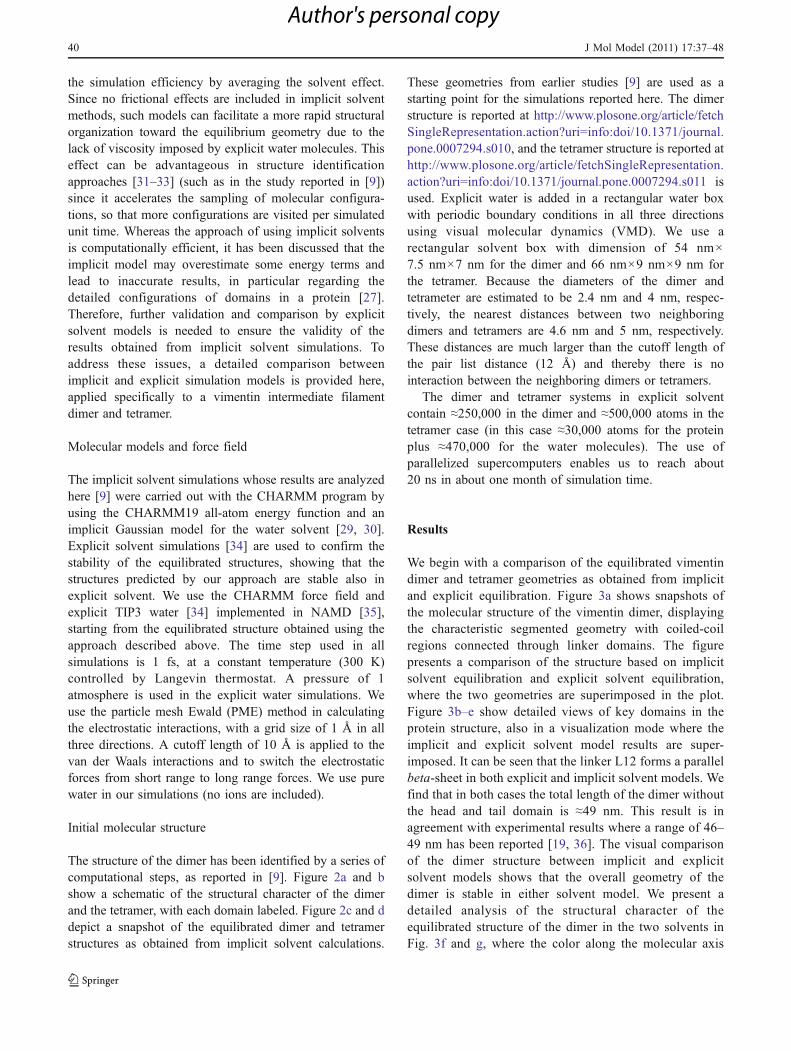
We begin with a comparison of the equilibrated vimentindimer and tetramer geometries as obtained from implicitand explicit equilibration. Figure 3a shows snapshots ofthe molecular structure of the vimentin dimer, displayingthe characteristic segmented geometry with coiled-coilregions connected through linker domains. The figurepresents a comparison of the structure based on implicitsolvent equilibration and explicit solvent equilibration,where the two geometries are superimposed in the plot.Figure 3b–e show detailed views of key domains in theprotein structure, also in a visualization mode where theimplicit and explicit solvent model results are super-imposed. It can be seen that the linker L12 forms a parallelbeta-sheet in both explicit and implicit solvent models. Wefind that in both cases the total length of the dimer withoutthe head and tail domain is ≈49 nm. This result is inagreement with experimental results where a range of 46–49 nm has been reported [19, 36]. The visual comparisonof the dimer structure between implicit and explicitsolvent models shows that the overall geometry of thedimer is stable in either solvent model. We present adetailed analysis of the structural character of theequilibrated structure of the dimer in the two solvents inFig. 3f and g, where the color along the molecular axis
40 J Mol Model (2011) 17:37–48
Author's personal copy
denotes the protein filament’s secondary structure. Bycomparing the two structures, we find that the 2A segment(parallel helices) and L12 (beta-sheet) are only marginallystable, because the 2A segment lacks the hierarchicalstructure in enforcing its strength, and short beta-sheetsegments are more energy favorable at the more flexibleparts of the protein [37].
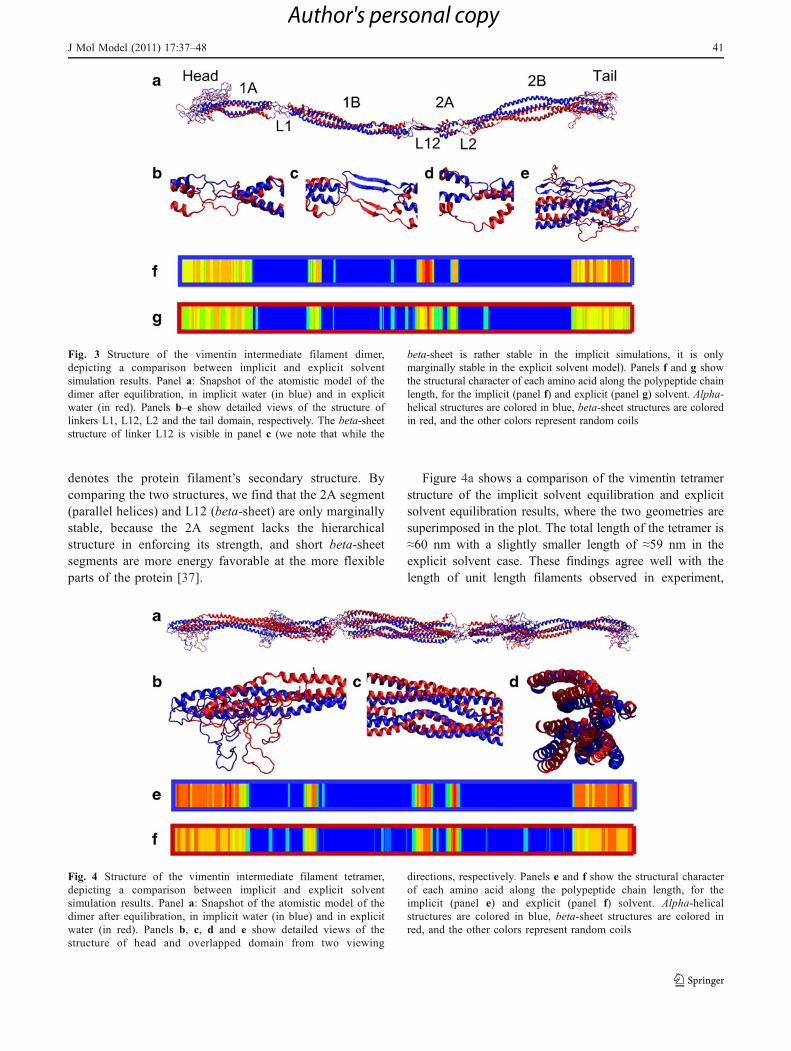
Figure 4a shows a comparison of the vimentin tetramerstructure of the implicit solvent equilibration and explicitsolvent equilibration results, where the two geometries aresuperimposed in the plot. The total length of the tetramer is≈60 nm with a slightly smaller length of ≈59 nm in theexplicit solvent case. These findings agree well with thelength of unit length filaments observed in experiment,
Fig. 3 Structure of the vimentin intermediate filament dimer,depicting a comparison between implicit and explicit solventsimulation results. Panel a: Snapshot of the atomistic model of thedimer after equilibration, in implicit water (in blue) and in explicitwater (in red). Panels b–e show detailed views of the structure oflinkers L1, L12, L2 and the tail domain, respectively. The beta-sheetstructure of linker L12 is visible in panel c (we note that while the
beta-sheet is rather stable in the implicit simulations, it is onlymarginally stable in the explicit solvent model). Panels f and g showthe structural character of each amino acid along the polypeptide chainlength, for the implicit (panel f) and explicit (panel g) solvent. Alpha-helical structures are colored in blue, beta-sheet structures are coloredin red, and the other colors represent random coils
Fig. 4 Structure of the vimentin intermediate filament tetramer,depicting a comparison between implicit and explicit solventsimulation results. Panel a: Snapshot of the atomistic model of thedimer after equilibration, in implicit water (in blue) and in explicitwater (in red). Panels b, c, d and e show detailed views of thestructure of head and overlapped domain from two viewing
directions, respectively. Panels e and f show the structural characterof each amino acid along the polypeptide chain length, for theimplicit (panel e) and explicit (panel f) solvent. Alpha-helicalstructures are colored in blue, beta-sheet structures are colored inred, and the other colors represent random coils
J Mol Model (2011) 17:37–48 41
Author's personal copy
62 nm at pH 7.5 [36]. In both cases the overlap part of thetetramer has a length of ≈36 nm, where the experimentalvalue is 30–36 nm [19, 36]. Segments 1A, 1B and 2A arefully contained in this overlapped part, but the 2B segmentsin the immediate vicinity of the two terminals are locatedcompletely outside. We find that the head segment of eachdimer is coiled around the other dimer, increasing thecontact surface area and thereby providing enhancedinterdimer interactions, as shown in Fig. 4b. The structureof the coiled-coil dominated overlap region is rather stable,as shown in Fig. 4c and d (the images show the same partof the tetramer from different viewing directions). As forthe dimer case discussed in the previous paragraph, here wealso present a detailed analysis of the structural character ofthe equilibrated protein in Fig. 4e and f. The analysis showsthat in comparison with the dimer case, the tetramerstructure is more stable, and most of the structural featuresare well conserved after explicit solvent equilibration.
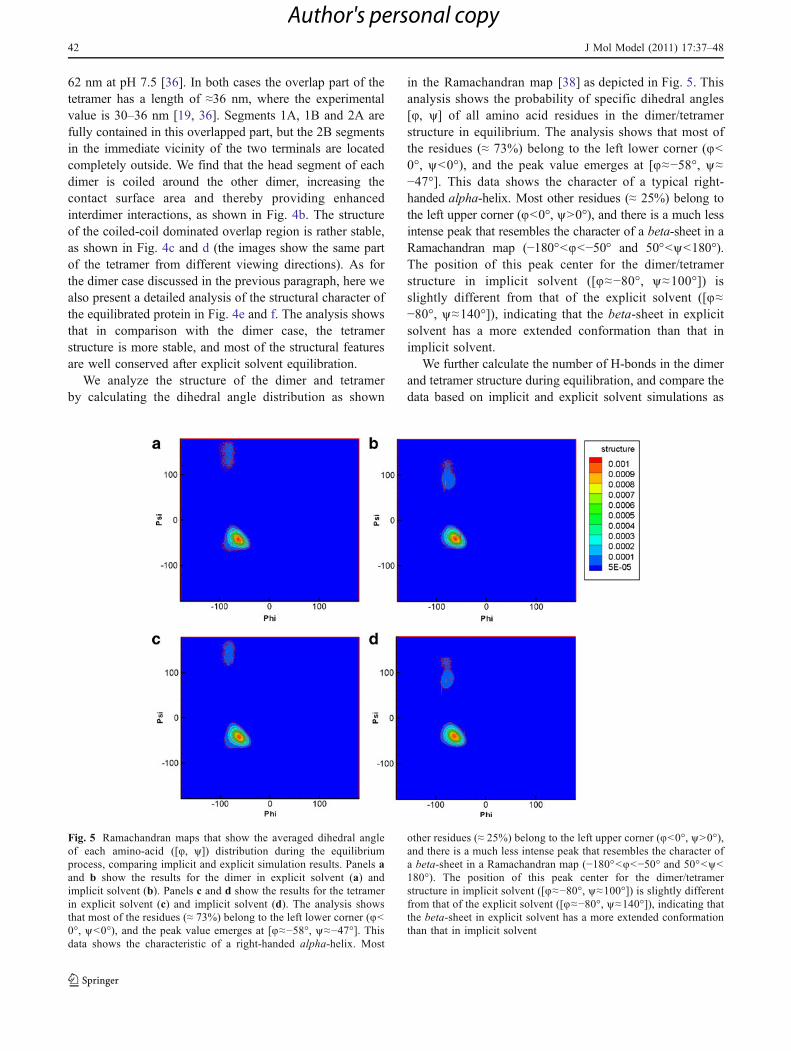
We analyze the structure of the dimer and tetramerby calculating the dihedral angle distribution as shown
in the Ramachandran map [38] as depicted in Fig. 5. Thisanalysis shows the probability of specific dihedral angles[8, y] of all amino acid residues in the dimer/tetramerstructure in equilibrium. The analysis shows that most ofthe residues (≈ 73%) belong to the left lower corner (8<0°, y<0°), and the peak value emerges at [8≈−58°, y≈−47°]. This data shows the character of a typical right-handed alpha-helix. Most other residues (≈ 25%) belong tothe left upper corner (8<0°, y>0°), and there is a much lessintense peak that resembles the character of a beta-sheet in aRamachandran map (−180°<8<−50° and 50°<y<180°).The position of this peak center for the dimer/tetramerstructure in implicit solvent ([8≈−80°, y≈100°]) isslightly different from that of the explicit solvent ([8≈−80°, y≈140°]), indicating that the beta-sheet in explicitsolvent has a more extended conformation than that inimplicit solvent.
We further calculate the number of H-bonds in the dimerand tetramer structure during equilibration, and compare thedata based on implicit and explicit solvent simulations as
Fig. 5 Ramachandran maps that show the averaged dihedral angleof each amino-acid ([8, y]) distribution during the equilibriumprocess, comparing implicit and explicit simulation results. Panels aand b show the results for the dimer in explicit solvent (a) andimplicit solvent (b). Panels c and d show the results for the tetramerin explicit solvent (c) and implicit solvent (d). The analysis showsthat most of the residues (≈ 73%) belong to the left lower corner (8<0°, y<0°), and the peak value emerges at [8≈−58°, y≈−47°]. Thisdata shows the characteristic of a right-handed alpha-helix. Most
other residues (≈ 25%) belong to the left upper corner (8<0°, y>0°),and there is a much less intense peak that resembles the character ofa beta-sheet in a Ramachandran map (−180°<8<−50° and 50°<y<180°). The position of this peak center for the dimer/tetramerstructure in implicit solvent ([8≈−80°, y≈100°]) is slightly differentfrom that of the explicit solvent ([8≈−80°, y≈140°]), indicating thatthe beta-sheet in explicit solvent has a more extended conformationthan that in implicit solvent
42 J Mol Model (2011) 17:37–48
Author's personal copy
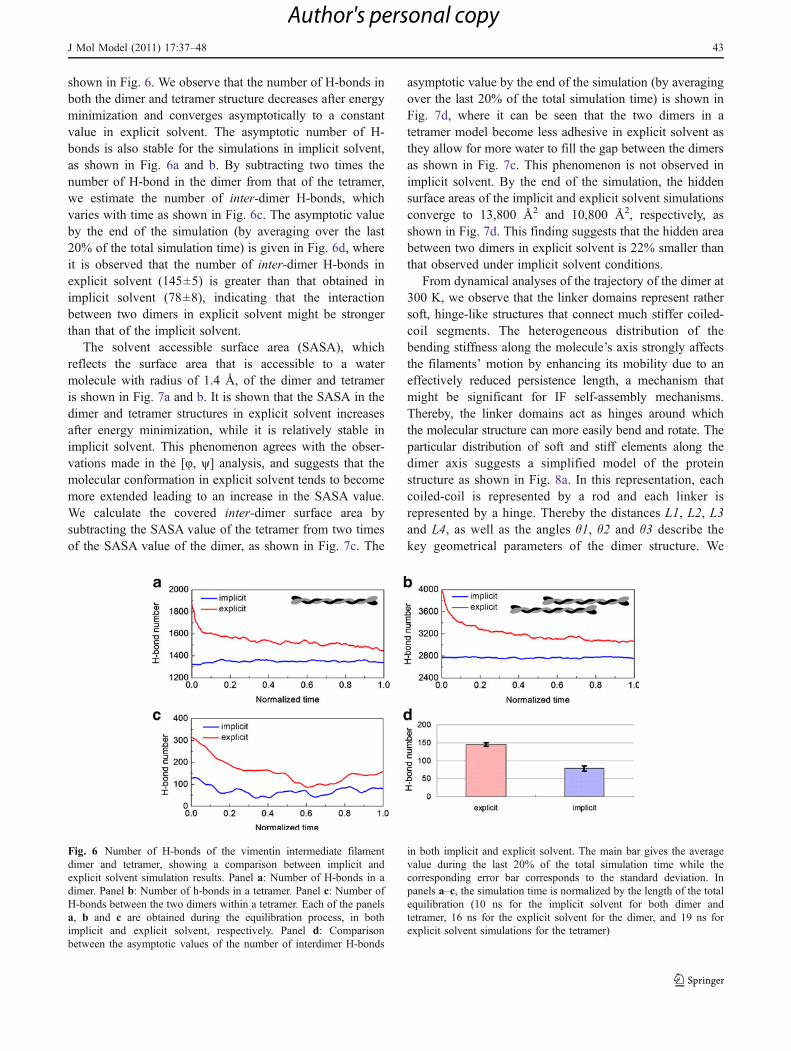
shown in Fig. 6. We observe that the number of H-bonds inboth the dimer and tetramer structure decreases after energyminimization and converges asymptotically to a constantvalue in explicit solvent. The asymptotic number of H-bonds is also stable for the simulations in implicit solvent,as shown in Fig. 6a and b. By subtracting two times thenumber of H-bond in the dimer from that of the tetramer,we estimate the number of inter-dimer H-bonds, whichvaries with time as shown in Fig. 6c. The asymptotic valueby the end of the simulation (by averaging over the last20% of the total simulation time) is given in Fig. 6d, whereit is observed that the number of inter-dimer H-bonds inexplicit solvent (145±5) is greater than that obtained inimplicit solvent (78±8), indicating that the interactionbetween two dimers in explicit solvent might be strongerthan that of the implicit solvent.
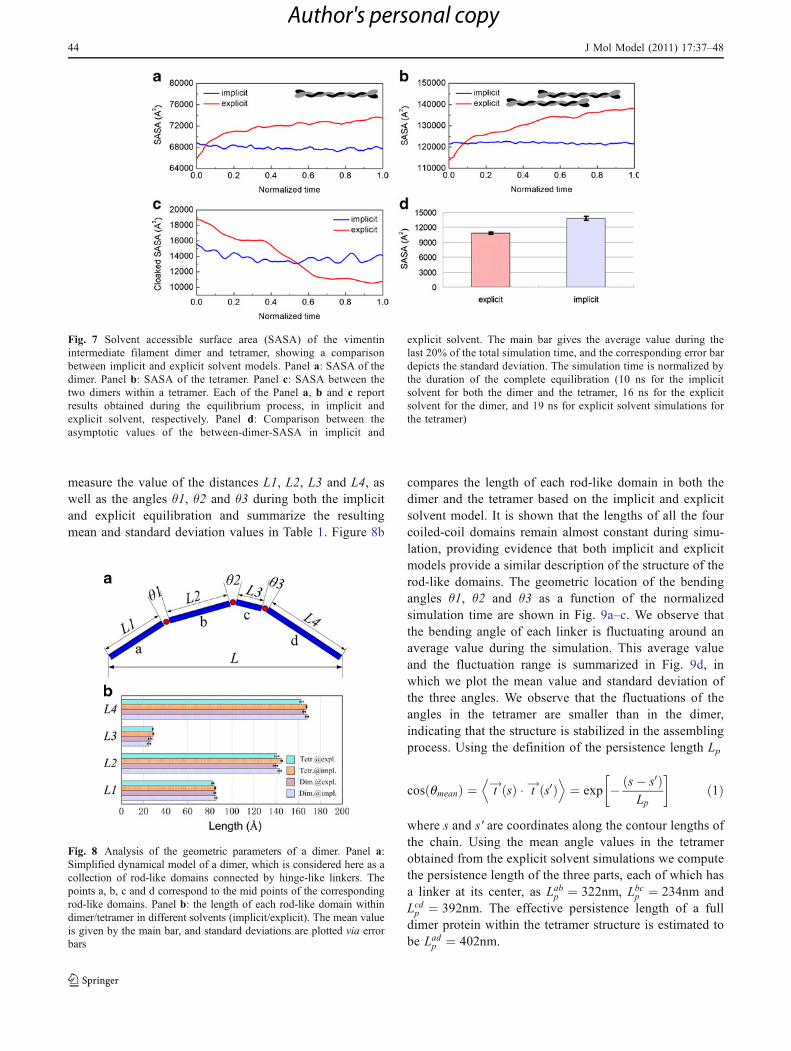
The solvent accessible surface area (SASA), whichreflects the surface area that is accessible to a watermolecule with radius of 1.4 Å, of the dimer and tetrameris shown in Fig. 7a and b. It is shown that the SASA in thedimer and tetramer structures in explicit solvent increasesafter energy minimization, while it is relatively stable inimplicit solvent. This phenomenon agrees with the obser-vations made in the [8, y] analysis, and suggests that themolecular conformation in explicit solvent tends to becomemore extended leading to an increase in the SASA value.We calculate the covered inter-dimer surface area bysubtracting the SASA value of the tetramer from two timesof the SASA value of the dimer, as shown in Fig. 7c. The
asymptotic value by the end of the simulation (by averagingover the last 20% of the total simulation time) is shown inFig. 7d, where it can be seen that the two dimers in atetramer model become less adhesive in explicit solvent asthey allow for more water to fill the gap between the dimersas shown in Fig. 7c. This phenomenon is not observed inimplicit solvent. By the end of the simulation, the hiddensurface areas of the implicit and explicit solvent simulationsconverge to 13,800 Å2 and 10,800 Å2, respectively, asshown in Fig. 7d. This finding suggests that the hidden areabetween two dimers in explicit solvent is 22% smaller thanthat observed under implicit solvent conditions.
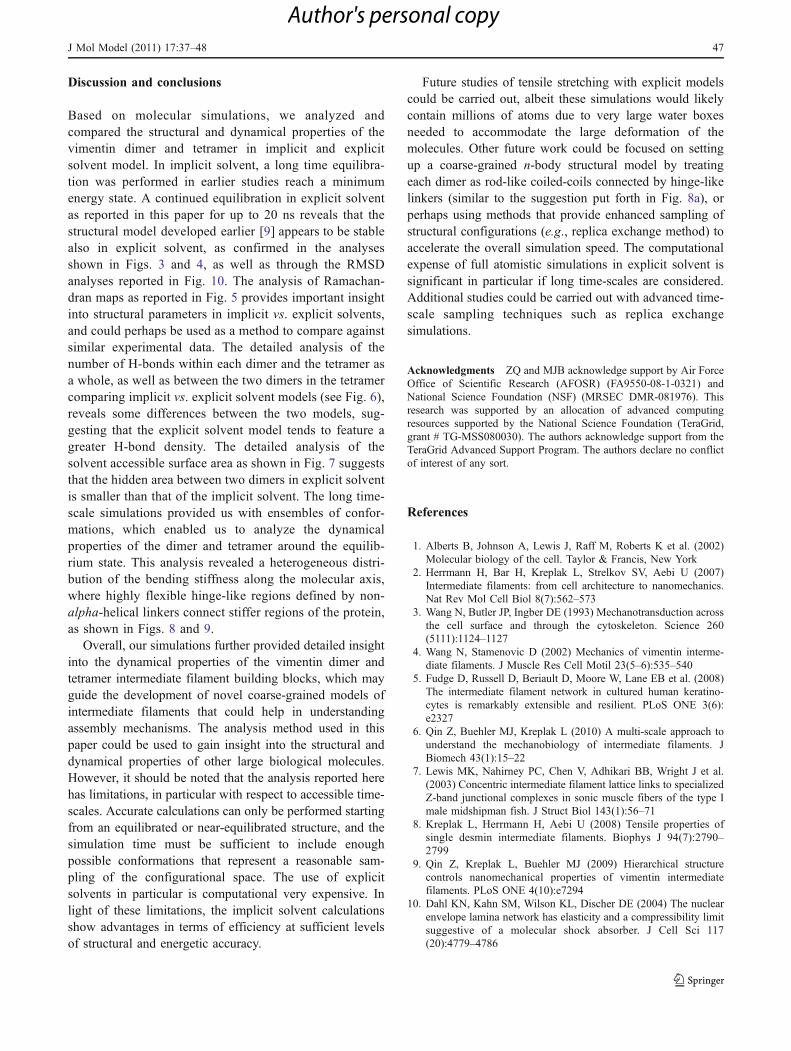
From dynamical analyses of the trajectory of the dimer at300 K, we observe that the linker domains represent rathersoft, hinge-like structures that connect much stiffer coiled-coil segments. The heterogeneous distribution of thebending stiffness along the molecule’s axis strongly affectsthe filaments’ motion by enhancing its mobility due to aneffectively reduced persistence length, a mechanism thatmight be significant for IF self-assembly mechanisms.Thereby, the linker domains act as hinges around whichthe molecular structure can more easily bend and rotate. Theparticular distribution of soft and stiff elements along thedimer axis suggests a simplified model of the proteinstructure as shown in Fig. 8a. In this representation, eachcoiled-coil is represented by a rod and each linker isrepresented by a hinge. Thereby the distances L1, L2, L3and L4, as well as the angles θ1, θ2 and θ3 describe thekey geometrical parameters of the dimer structure. We
Fig. 6 Number of H-bonds of the vimentin intermediate filamentdimer and tetramer, showing a comparison between implicit andexplicit solvent simulation results. Panel a: Number of H-bonds in adimer. Panel b: Number of h-bonds in a tetramer. Panel c: Number ofH-bonds between the two dimers within a tetramer. Each of the panelsa, b and c are obtained during the equilibration process, in bothimplicit and explicit solvent, respectively. Panel d: Comparisonbetween the asymptotic values of the number of interdimer H-bonds
in both implicit and explicit solvent. The main bar gives the averagevalue during the last 20% of the total simulation time while thecorresponding error bar corresponds to the standard deviation. Inpanels a–c, the simulation time is normalized by the length of the totalequilibration (10 ns for the implicit solvent for both dimer andtetramer, 16 ns for the explicit solvent for the dimer, and 19 ns forexplicit solvent simulations for the tetramer)
J Mol Model (2011) 17:37–48 43
Author's personal copy
measure the value of the distances L1, L2, L3 and L4, aswell as the angles θ1, θ2 and θ3 during both the implicitand explicit equilibration and summarize the resultingmean and standard deviation values in Table 1. Figure 8b
compares the length of each rod-like domain in both thedimer and the tetramer based on the implicit and explicitsolvent model. It is shown that the lengths of all the fourcoiled-coil domains remain almost constant during simu-lation, providing evidence that both implicit and explicitmodels provide a similar description of the structure of therod-like domains. The geometric location of the bendingangles θ1, θ2 and θ3 as a function of the normalizedsimulation time are shown in Fig. 9a–c. We observe thatthe bending angle of each linker is fluctuating around anaverage value during the simulation. This average valueand the fluctuation range is summarized in Fig. 9d, inwhich we plot the mean value and standard deviation ofthe three angles. We observe that the fluctuations of theangles in the tetramer are smaller than in the dimer,indicating that the structure is stabilized in the assemblingprocess. Using the definition of the persistence length Lp
cos qmeanð Þ ¼ t!ðsÞ � t! s0ð ÞD E
¼ exp � s� s0ð ÞLp
� �ð1Þ
where s and s′ are coordinates along the contour lengths ofthe chain. Using the mean angle values in the tetramerobtained from the explicit solvent simulations we computethe persistence length of the three parts, each of which hasa linker at its center, as Labp ¼ 322nm, Lbcp ¼ 234nm andLcdp ¼ 392nm. The effective persistence length of a fulldimer protein within the tetramer structure is estimated tobe Ladp ¼ 402nm.
Fig. 8 Analysis of the geometric parameters of a dimer. Panel a:Simplified dynamical model of a dimer, which is considered here as acollection of rod-like domains connected by hinge-like linkers. Thepoints a, b, c and d correspond to the mid points of the correspondingrod-like domains. Panel b: the length of each rod-like domain withindimer/tetramer in different solvents (implicit/explicit). The mean valueis given by the main bar, and standard deviations are plotted via errorbars
Fig. 7 Solvent accessible surface area (SASA) of the vimentinintermediate filament dimer and tetramer, showing a comparisonbetween implicit and explicit solvent models. Panel a: SASA of thedimer. Panel b: SASA of the tetramer. Panel c: SASA between thetwo dimers within a tetramer. Each of the Panel a, b and c reportresults obtained during the equilibrium process, in implicit andexplicit solvent, respectively. Panel d: Comparison between theasymptotic values of the between-dimer-SASA in implicit and
explicit solvent. The main bar gives the average value during thelast 20% of the total simulation time, and the corresponding error bardepicts the standard deviation. The simulation time is normalized bythe duration of the complete equilibration (10 ns for the implicitsolvent for both the dimer and the tetramer, 16 ns for the explicitsolvent for the dimer, and 19 ns for explicit solvent simulations forthe tetramer)
44 J Mol Model (2011) 17:37–48
Author's personal copy

Based on the estimated persistence length, the bendingmodulus of the dimer can be expressed as [39]
Ebend ¼ kBTLp�I ð2Þ
where I ¼ pd464 , and d=2.4 nm is the diameter of the dimer
including the vdW radius (obtained from geometric analysisof the protein structure). Thereby, the bending modulus isfound to be Ebend=1 GPa. The bending modulus obtainedfrom experimental bending was reported to be around900 MPa in earlier studies [39], close to our results.
In extending this analysis, we estimate the angularstiffness of each hinge shown in Fig. 8a. Using a beamtheory for a clamped beam, the angle change is given by:
$q ¼ Ml
EbendIð3Þ
where l is the contour length of the domain considered (forexample, in studying ab, we have l=(l1+l2)/2). SinceKq ¼ M
$q, combining with Eq. 2 and we obtain
Kq ¼ kBTLpl
: ð4Þ
Based on this analysis the angular stiffness for each ofthe three hinges is calculated to be Kq1 ¼ 1:72kcal=mol(for L1), Kq2 ¼ 1:65kcal=mol (for L12), and Kq3 ¼2:44kcal=mol (for L2). It is observed that all these valuesare relatively small, which explains why each rod-like
domain can easily rotate around its linker, in agreementwith the observations made in the dynamical simulations.
Finally, Fig. 10 shows the evolution of the root meansquare deviation (RMSD) for the dimer (Fig. 10a) and thetetramer (Fig. 10b) in explicit solvent (compared with theinitial structure as obtained from implicit solvent equilibra-tion). The results show that after 12 ns, the RMSD valuesfor both the dimer and tetramer converge to a constantvalue, suggesting that both structures have reached a stableconfiguration in the explicit solvent model (the finalstructures are the structures shown in Figs. 3 and 4,respectively). Furthermore, the overall relatively smalldeviation of the structure provides evidence for the factthat the implicit model is a reasonable approximation forthe dimer and tetramer structure, at least at the time-scalesconsidered here.
Additional analysis of the dynamical properties of eachamino-acid in the dimer and tetramer during the simulationis shown in Fig. 11, where the RMSD value for eachresidue in the simulation is depicted. These results alsoreflect the relative flexibility of each domain during theequilibration process. We observe that the peaks shown inFig. 11a correspond to the linker, head and tail segments,providing the evidence that these domains are among themost flexible ones in the dimer structure and as suchundergo the largest structural fluctuations. The peak RMSDvalues P corresponding to the linkers have a relation asPL12 > PL1 > PL2, which agrees with the relation of theangular stiffness of each linker Kq2Kq1Kq3. It is also
Table 1 Structure analysis of each domain within the dimer and tetramer in implicit solvent and explicit solvent during equilibrium, the geometricparameters are as shown in Fig. 5a
Geometric parameter Dimer in implicit solvent Dimer in explicit solvent Tetramer in implicit solvent Tetramer in explicit solvent
L1 Average (Å) 85.5 84.6 84.8 82.8
SD. ±(Å) 1.0 0.9 0.5 1.0
L2 Average (Å) 143.2 139.6 145.1 140.7
SD. ±(Å) 1.6 2.0 0.8 1.8
L3 Average (Å) 24.8 26.1 28.8 28.3
SD. ±(Å) 1.5 1.5 0.5 0.5
L4 Average (Å) 168.0 165.2 167.5 162.9
SD. ±(Å) 1.5 1.4 0.5 1.5
L Average (Å) 487.0 479.7 613.0 593.4
SD. ±(Å) – 2.2 – 3.2
θ1 Average (°) 10.7 12.0 15.8 9.8
SD. ±(°) 4.7 5.7 2.9 3.1
θ2 Average (°) 13.9 12.7 7.9 15.3
SD. ±(°) 6.9 6.0 4.4 6.2
θ3 Average (°) 13.7 11.6 11.2 12.6
SD. ±(°) 7.1 6.3 4.1 4.1
It is noted that except for L (which represents the end-to-end length of a dimer or tetramer), all other parameters are measured based on the rod-like domains and linkers as identified in the dimer structure. SD = standard deviation, used here to define error bars
J Mol Model (2011) 17:37–48 45
Author's personal copy

interesting to note that the right part (amino acid numbers291 to 351) of the 2B segment are more stable than the leftpart (amino acid numbers 351 to 405), as shown by thepeaks in these regions. Experiments have revealed that astutter defect is located around amino acid number 351.This information provides evidence that the 2B segment ismarginally stable from the stutter region on to thebeginning of the tail domain, but more flexible before thestutter region. The RMSD value of the tetramer (Fig. 11b)shows that the interaction between two dimers significantlyaffects the flexibility and stability. As the two anti-paralleldimers combine, the overlapped part becomes more stablethan the other domains. Moreover, we do not find a peak atthe L2 domain, which confirms that this linker interactswith the rod like segment of the other dimer and itsflexibility is significantly reduced, reflecting an enhancedstability in this assembly stage.
Fig. 11 Root mean square displacement (RMSD) analysis during theequilibrium process in explicit solvent (during the period as shown inFig. 6), for the dimer (panel a) and the tetramer (panel b). Theresidues in the range from 1 to 466 refer to the number in one of thepolypeptide chains. It corresponds to the average of RMSD values fortwo chain (dimer) and to four chains (tetramer), respectively. Thecolor bars show the magnitude of RMSD value from low (blue) tohigh (red). The location of head (H), tail (T) and linker domains (L1,L12, L2) are indicated in the plot. A schematic of the overall dimerstructure is shown above panel a
Fig. 10 Root mean square displacement (RMSD) analysis in explicitsolvent, for the dimer (panel a) and the tetramer (panel b). Thedeviation is calculated with respect to the starting configuration, whichis the result of equilibration in implicit solvent. Both systems are seento converge to a constant RMSD value at approximately 12 ns time-scale, with an overall structural deviation of approximately 10 Å. Theinserts in each panel depict the RMSD analysis during the last 2 ns ofequilibration for the dimer and tetramer, respectively
Fig. 9 Analysis of hinge angles of a dimer and tetramer. Panels a, band c show how the angles θ1, θ2 and θ3 change during the simulation(for geometry see Fig. 5a). The simulation time is normalized by thetotal equilibration time length (10 ns for the implicit solvent for bothdimer and tetramer, 16 ns for the explicit solvent for the dimer, and19 ns for explicit solvent simulations for the tetramer). Panel dsummarizes the mean value and standard deviations of the threeangles during the simulation. The mean value is given by the mainbar, and standard deviations are plotted via error bars
46 J Mol Model (2011) 17:37–48
Author's personal copy
Discussion and conclusions
Based on molecular simulations, we analyzed andcompared the structural and dynamical properties of thevimentin dimer and tetramer in implicit and explicitsolvent model. In implicit solvent, a long time equilibra-tion was performed in earlier studies reach a minimumenergy state. A continued equilibration in explicit solventas reported in this paper for up to 20 ns reveals that thestructural model developed earlier [9] appears to be stablealso in explicit solvent, as confirmed in the analysesshown in Figs. 3 and 4, as well as through the RMSDanalyses reported in Fig. 10. The analysis of Ramachan-dran maps as reported in Fig. 5 provides important insightinto structural parameters in implicit vs. explicit solvents,and could perhaps be used as a method to compare againstsimilar experimental data. The detailed analysis of thenumber of H-bonds within each dimer and the tetramer asa whole, as well as between the two dimers in the tetramercomparing implicit vs. explicit solvent models (see Fig. 6),reveals some differences between the two models, sug-gesting that the explicit solvent model tends to feature agreater H-bond density. The detailed analysis of thesolvent accessible surface area as shown in Fig. 7 suggeststhat the hidden area between two dimers in explicit solventis smaller than that of the implicit solvent. The long time-scale simulations provided us with ensembles of confor-mations, which enabled us to analyze the dynamicalproperties of the dimer and tetramer around the equilib-rium state. This analysis revealed a heterogeneous distri-bution of the bending stiffness along the molecular axis,where highly flexible hinge-like regions defined by non-alpha-helical linkers connect stiffer regions of the protein,as shown in Figs. 8 and 9.
Overall, our simulations further provided detailed insightinto the dynamical properties of the vimentin dimer andtetramer intermediate filament building blocks, which mayguide the development of novel coarse-grained models ofintermediate filaments that could help in understandingassembly mechanisms. The analysis method used in thispaper could be used to gain insight into the structural anddynamical properties of other large biological molecules.However, it should be noted that the analysis reported herehas limitations, in particular with respect to accessible time-scales. Accurate calculations can only be performed startingfrom an equilibrated or near-equilibrated structure, and thesimulation time must be sufficient to include enoughpossible conformations that represent a reasonable sam-pling of the configurational space. The use of explicitsolvents in particular is computational very expensive. Inlight of these limitations, the implicit solvent calculationsshow advantages in terms of efficiency at sufficient levelsof structural and energetic accuracy.
Future studies of tensile stretching with explicit modelscould be carried out, albeit these simulations would likelycontain millions of atoms due to very large water boxesneeded to accommodate the large deformation of themolecules. Other future work could be focused on settingup a coarse-grained n-body structural model by treatingeach dimer as rod-like coiled-coils connected by hinge-likelinkers (similar to the suggestion put forth in Fig. 8a), orperhaps using methods that provide enhanced sampling ofstructural configurations (e.g., replica exchange method) toaccelerate the overall simulation speed. The computationalexpense of full atomistic simulations in explicit solvent issignificant in particular if long time-scales are considered.Additional studies could be carried out with advanced time-scale sampling techniques such as replica exchangesimulations.
Acknowledgments ZQ and MJB acknowledge support by Air ForceOffice of Scientific Research (AFOSR) (FA9550-08-1-0321) andNational Science Foundation (NSF) (MRSEC DMR-081976). Thisresearch was supported by an allocation of advanced computingresources supported by the National Science Foundation (TeraGrid,grant # TG-MSS080030). The authors acknowledge support from theTeraGrid Advanced Support Program. The authors declare no conflictof interest of any sort.
References
1. Alberts B, Johnson A, Lewis J, Raff M, Roberts K et al. (2002)Molecular biology of the cell. Taylor & Francis, New York
2. Herrmann H, Bar H, Kreplak L, Strelkov SV, Aebi U (2007)Intermediate filaments: from cell architecture to nanomechanics.Nat Rev Mol Cell Biol 8(7):562–573
3. Wang N, Butler JP, Ingber DE (1993) Mechanotransduction acrossthe cell surface and through the cytoskeleton. Science 260(5111):1124–1127
4. Wang N, Stamenovic D (2002) Mechanics of vimentin interme-diate filaments. J Muscle Res Cell Motil 23(5–6):535–540
5. Fudge D, Russell D, Beriault D, Moore W, Lane EB et al. (2008)The intermediate filament network in cultured human keratino-cytes is remarkably extensible and resilient. PLoS ONE 3(6):e2327
6. Qin Z, Buehler MJ, Kreplak L (2010) A multi-scale approach tounderstand the mechanobiology of intermediate filaments. JBiomech 43(1):15–22
7. Lewis MK, Nahirney PC, Chen V, Adhikari BB, Wright J et al.(2003) Concentric intermediate filament lattice links to specializedZ-band junctional complexes in sonic muscle fibers of the type Imale midshipman fish. J Struct Biol 143(1):56–71
8. Kreplak L, Herrmann H, Aebi U (2008) Tensile properties ofsingle desmin intermediate filaments. Biophys J 94(7):2790–2799
9. Qin Z, Kreplak L, Buehler MJ (2009) Hierarchical structurecontrols nanomechanical properties of vimentin intermediatefilaments. PLoS ONE 4(10):e7294
10. Dahl KN, Kahn SM, Wilson KL, Discher DE (2004) The nuclearenvelope lamina network has elasticity and a compressibility limitsuggestive of a molecular shock absorber. J Cell Sci 117(20):4779–4786
J Mol Model (2011) 17:37–48 47
Author's personal copy
11. Wilson KL, Zastrow MS, Lee KK (2001) Lamins and disease:Insights into nuclear infrastructure. Cell 104(5):647–650
12. Aebi U, Cohn J, Buhle L, Gerace L (1986) The Nuclear Lamina isa Meshwork of Intermediate-Type Filaments. Nature 323(6088):560–564
13. Brenner M, Johnson AB, Boespflug-Tanguy O, Rodriguez D,Goldman JE et al. (2001) Mutations in GFAP, encoding glialfibrillary acidic protein, are associated with Alexander disease.Nat Genet 27(1):117–120
14. Brown CA, Lanning RW, McKinney KQ, Salvino AR, CherniskeE et al. (2001) Novel and recurrent mutations in lamin A/C inpatients with Emery-Dreifuss muscular dystrophy. Am J MedGenet 102(4):359–367
15. Bonne G, Mercuri E, Muchir A, Urtizberea A, Becane HM et al.(2000) Clinical and molecular genetic spectrum of autosomaldominant Emery-Dreifuss muscular dystrophy due to mutations ofthe lamin A/C gene. Ann Neurol 48(2):170–180
16. Broers JLV, Hutchison CJ, Ramaekers FCS (2004) Laminopathies.J Pathol 204(4):478–488
17. Omary MB, Coulombe PA, McLean WH (2004) Intermediatefilament proteins and their associated diseases. N Engl J Med 351(20):2087–2100
18. Parry DAD, Strelkov SV, Burkhard P, Aebi U, Herrmann H(2007) Towards a molecular description of intermediate filamentstructure and assembly. Exp Cell Res 313(10):2204–2216
19. Sokolova AV, Kreplak L, Wedig T, Mucke N, Svergun DI et al.(2006) Monitoring intermediate filament assembly by small-anglex-ray scattering reveals the molecular architecture of assemblyintermediates. Proc Natl Acad Sci USA 103(44):16206–16211
20. Strelkov SV, Herrmann H, Geisler N, Lustig A, Ivaninskii S et al.(2001) Divide-and-conquer crystallographic approach towards anatomic structure of intermediate filaments. JMol Biol 306(4):773–781
21. Parry DAD (2006) Hendecad repeat in segment 2A and linker L2of intermediate filament chains implies the possibility of a right-handed coiled-coil structure. J Struct Biol 155(2):370–374
22. Strelkov SV, Herrmann H, Geisler N, Wedig T, Zimbelmann R etal. (2002) Conserved segments 1A and 2B of the intermediatefilament dimer: their atomic structures and role in filamentassembly. EMBO J 21(6):1255–1266
23. Rafik ME, Doucet J, Briki F (2004) The intermediate filamentarchitecture as determined by X-ray diffraction modeling of hardalpha-keratin. Biophys J 86(6):3893–3904
24. Luca S, YauWM, LeapmanR, Tycko R (2007) Peptide conformationand supramolecular organization in amylin fibrils: Constraints fromsolid-state NMR. Biochemistry 46(47):13505–13522
25. Goldie KN, Wedig T, Mitra AK, Aebi U, Herrmann H et al.(2007) Dissecting the 3-D structure of vimentin intermediate
filaments by cryo-electron tomography. J Struct Biol 158(3):378–385
26. Huang A, Stultz CM (2007) Conformational sampling withimplicit solvent models: Application to the PHF6 peptide in tauprotein. Biophys J 92(1):34–45
27. Zhou RH, Berne BJ (2002) Can a continuum solvent modelreproduce the free energy landscape of a beta-hairpin folding inwater? Proc Natl Acad Sci USA 99(20):12777–12782
28. Nymeyer H, Garcia AE (2003) Simulation of the foldingequilibrium of alpha-helical peptides: a comparison of thegeneralized Born approximation with explicit solvent. Proc NatlAcad Sci USA 100(24):13934–13939
29. Lazaridis T, Karplus M (1999) Effective energy function forproteins in solution. Protein Struct Funct Genet 35(2):133–152
30. Lazaridis T, Karplus M (1997) “New view” of protein foldingreconciled with the old through multiple unfolding simulations.Science 278(5345):1928–1931
31. Best RB, Merchant KA, Gopich IV, Schuler B, Bax A et al.(2007) Effect of flexibility and cis residues in single-moleculeFRET studies of polyproline. Proc Natl Acad Sci USA 104(48):18964–18969
32. Paci E, Karplus M (2000) Unfolding proteins by external forcesand temperature: the importance of topology and energetics. ProcNatl Acad Sci USA 97(12):6521–6526
33. Paci E, Karplus M (1999) Forced unfolding of fibronectin type 3modules: An analysis by biased molecular dynamics simulations.J Mol Biol 288(3):441–459
34. MacKerell AD, Bashford D, Bellott M, Dunbrack RL, EvanseckJD et al. (1998) All-atom empirical potential for molecularmodeling and dynamics studies of proteins. J Phys Chem B 102(18):3586–3616
35. Nelson MT, Humphrey W, Gursoy A, Dalke A, Kale LV et al.(1996) NAMD: A parallel, object oriented molecular dynamicsprogram. Int J Supercomput Appl 10(4):251–268
36. Mucke N, Wedig T, Burer A, Marekov LN, Steinert PM et al.(2004) Molecular and biophysical characterization of assembly-starter units of human vimentin. J Mol Biol 340(1):97–114
37. Keten S, Buehler MJ (2008) Geometric confinement governs therupture strength of H-bond assemblies at a critical length scale.Nano Lett 8(2):743–748
38. Ramachandran GN, Ramakrishnan C, Sasisekharan V (1963)Stereochemistry of polypeptide chain configurations. J Mol Biol7:95–99
39. Guzman C, Jeney S, Kreplak L, Kasas S, Kulik AJ et al. (2006)Exploring the mechanical properties of single vimentin interme-diate filaments by atomic force microscopy. J Mol Biol 360(3):623–630
48 J Mol Model (2011) 17:37–48
Author's personal copy