Embed Size (px)
Citation preview

BROOKINGS | June 2011 1
STATE OF METROPOLITAN AMERICA
The Geography of Immigrant Skills:Educational Profiles of Metropolitan AreasMatthew Hall, Audrey Singer, Gordon F. De Jong, and Deborah Roempke Graefe1
“ The new
geography of
immigration
raises many
questions about
the stock and
flow of high-
and low-skilled
immigrants
and how local
and state
governments
can respond.”
FindingsAn analysis of educational attainment among foreign-born adults in the nation’s 100 largest metropolitan areas reveals that: n The share of working-age immigrants in the United States who have a bachelor’s degree
has risen considerably since 1980, and now exceeds the share without a high school diploma. In 1980, just 19 percent of immigrants aged 25 to 64 held a bachelor’s degree, and nearly 40 percent had not completed high school. By 2010, 30 percent of working-age immi-grants had at least a college degree and 28 percent lacked a high school diploma.
n Forty-four (44) of the nation’s 100 largest metropolitan areas are high-skill immigrant destinations, in which college-educated immigrants outnumber immigrants without high school diplomas by at least 25 percent. These destinations include large coastal metro areas like San Francisco and Washington, D.C. The 30 low-skill destinations, in which the relative sizes of these immigrant skill groups are reversed, include many in the border states of the West and Southwest, as well as in the Great Plains.
n Immigrants’ skill levels vary by metropolitan area due to historical settlement patterns and economic structures. In former immigration destinations, or “gateways,” with low levels of contemporary immigration such as Detroit, and re-emerging gateways such as Philadelphia, immigrants have high levels of educational attainment. In established post-World War II immigration gateways such as Houston, and minor-continuous gateways along the U.S.-Mexico border and in interior California, low-skilled immigrants predominate.
n Recent immigrants to metro areas with the fastest-growing immigrant populations have markedly lower educational attainment than immigrants settling elsewhere. Low-skilled immigrants are much more likely to hail from Mexico, less likely to speak English proficiently, more likely to be male, and less likely to be naturalized U.S. citizens than high-skilled immi-grants.
n Compared with their U.S.-born counterparts, low-skilled immigrants have higher rates of employment and lower rates of household poverty, but also have lower individual earn-ings, in all types of metro areas. Almost half of immigrants with a bachelor’s degree, across all destinations, appear to be over-qualified for their jobs.
The Great Recession at the tail of the last decade, combined with rapid demographic changes across metropolitan America, has reshaped and intensified the debate about the economic value of immigrants and their importance in the U.S. labor market. A pragmatic approach to immigration—one that considers the economic advantages of the new arrivals—should include a more flexible admissions system to respond to labor market changes. With the United States at a critical point in both immigration policy and economic trajectory, policymakers should care-fully weigh options to provide support for immigrant workers at all skill levels to keep the United States globally competitive.

BROOKINGS | June 20112
Introduction
Since Congress last debated comprehensive immigration reform in 2007, the United States has experienced the Great Recession and now faces a slow recovery. Throughout, the highly-charged public debate on immigration has focused on illegal immigration and its costs. Often lost in this discussion is the vital role of immigrants in the U.S. labor market. Immigrants are
now one-in-seven U.S. residents and almost one-in-six workers.2 They are a significant presence in vari-ous sectors of the economy such as construction and hospitality on the low-skill end, and information technology and health care on the high-skill end.3 While border enforcement and illegal immigration are a focal point, longer-term U.S. global competitiveness rests on the ability of immigrants and their children to thrive economically and to contribute to the nation’s productivity.
The Great Recession has slowed migration worldwide and abruptly curtailed foreign arrivals to the United States since 2007. Even with the recent pause in immigration, the United States has expe-rienced extraordinary growth in its foreign-born population for several decades.4 There are more immigrants now than ever before in the nation’s history (38.5 million in 2009) and their share of the American population (12.5 percent) is approaching levels not witnessed since the height of the indus-trial era.
The majority of immigrants admitted to the United States for permanent residence are selected by their family ties without regard to skill level or employability, while a much smaller share are admitted for work-related purposes. In addition, a large proportion of annual entries are temporary workers and their families, such as H-1B and L-1 visa holders.5 Therefore, the metropolitan settlement of immi-grants is largely a market-driven algorithm of immigrant supply and demand based on a number of factors including employer recruitment, hiring practices, visa availability, and immigrant networks.
Shifts in the settlement patterns of the foreign-born population, first identified in Census 2000, have motivated a new research and policy agenda. Previous immigration research had focused primar-ily on the five largest immigrant-receiving metropolitan destinations (New York, Los Angeles, Chicago, Houston, and Miami); this new geography of immigration has garnered great attention among policy-makers, business leaders, academics, service providers, and journalists.6 Of particular interest have been the newest and fast-growing locales where conflict between immigrant and native-born interests has erupted.7 Chief among these are Great Plains and Southeastern destinations, which have attracted many low-skilled Latin American workers and their families. While this group’s contribution to the foreign-born population is substantial and its migration patterns have undoubtedly had a dramatic effect on U.S. communities, the broader foreign-born population is diverse in both origins and skill levels. Nonetheless, new state and local policies and practices aimed at unauthorized immigrants have gained traction in areas with mushrooming immigrant populations. Most notably, Arizona adopted a law intended to crack down on illegal immigration in April 2010, setting off debates and inspiring copy-cat legislation.
Contentious arguments about job competition and wage effects between U.S.-born workers and immigrant workers play out in many ways across metropolitan areas. Different metropolitan economic structures create variation in the industrial and occupational demand for workers across regional labor markets, yielding an uneven geographic distribution of low- and high-skilled immigrants (like their native-born counterparts). Some areas draw on immigrants to fill vacancies in low-skill sectors, where they work as builders, groundskeepers, farm hands, and cooks. Others attract immigrants with highly educated backgrounds to work in computing, engineering, and health care. The metropolitan areas that house highly educated native populations, however, may not correspond to those that attract high-skilled immigrants if these workers are not perfect substitutes for high-skill native talent. Instead, high-skilled immigrants may be tapped as replacements for high-skilled natives or to fill indus-trial demands not met by the native-born population.
America’s newest arrivals have profound implications for metropolitan populations and municipal governance. As the global economy becomes increasingly competitive—in both high- and low-skill sectors—pressure mounts for sources of cheap labor.8 While low-skilled immigrants are not exclusively confined to peripheral jobs, they have been the targets of hostile, nativist sentiments; often work in dangerous, and arguably exploitative, settings; and often cluster in isolated residential enclaves.9 The challenges that low-skilled immigrants face are clearly linked to the fact that many of them are not

BROOKINGS | June 2011 3
authorized to work or live in the United States. Recent estimates indicate that more than one-fifth of all U.S. residents lacking a high school diploma are unauthorized immigrants.10 While evidence on the labor market impacts of low-skilled and illegal immigration is not entirely conclusive, most research-ers agree that new immigration has at least a small negative effect on wages and employment for other low-skilled immigrants and some low-wage native workers (especially minority men).11 In addition, the local impacts of low-skill immigration are often intertwined with social tension. Recent media reports and academic studies have noted that inter-group tensions often ensue after low-skilled, largely Latino, immigrants enter ethnically homogenous communities.12
Underutilized labor and talent is a major challenge confronting areas with large high-skilled immigrant populations. Because these migrants tend to enter this country through the front door—as legal permanent residents or via work and educational visas—they are less likely than the low-skilled foreign born to suffer from exploitative work conditions. However, they are also less likely than their highly-skilled native counterparts to hold jobs that are commensurate with their education and more likely to be unemployed.13
Recognizing how immigrant skills influence local economic and social outcomes for both foreign- and native-born populations, this report examines the variation in immigrant educational attain-ment across the 100 largest U.S. metropolitan areas, which house more than two-thirds of the U.S. population and 85 percent of immigrants nationwide. Using data from the U.S. Census Bureau, the report primarily documents trends in immigrant residents as of 2009, when the Great Recession was underway. As such, it primarily captures changes already in motion during the years prior to the recession. After documenting trends in immigrant educational attainment at the national level, the report demonstrates how foreign-born skill profiles vary across metropolitan destinations that have distinct economic structures and immigrant settlement histories. It also separately profiles new immigrants to understand the most recently arrived U.S. immigrant workers. Finally, the report com-pares characteristics of immigrant and native-born workers by skill and settlement area to illuminate how these groups relate to one another within regional labor markets.
Geographically distinct immigrant skill profiles raise important policy questions examined in the discussion section of this report. These include exploring the merits of a national commission on labor and immigration that could facilitate more timely adjustments to immigration policy, particu-larly around admissions. We explore low-cost, politically-neutral ways to support immigrant workers and their families as well as strategies to invest in high-skilled immigrants, especially those that are having trouble finding jobs that match their training. The findings are relevant for discussions around U.S. competitiveness, future labor supply, and state and municipal benefits of immigrant integration.
Methodology
About the DataMost data for this report come from metropolitan-level summary tables of the 2009 American Com-munity Survey (ACS) and county-level tables from the 1900 to 2000 decennial censuses.14 Historical decennial census data used in this study are based on full enumerations (between 1900 and 1930) or large samples of the U.S. population (i.e., the “long” form between 1940 and 2000). Summary tables and questionnaire wording vary across census years, particularly during the early part of the 20th century, however, foreign-born and total populations can be identified at the start of each decade between 1900 and 2000, and in 2009. For metropolitan areas, the educational attainment of im-migrants and natives is extracted from the 2009 ACS, which is based on a smaller sample than previ-ous decennial censuses, but still offers a representative portrait of immigrants in metro areas.15 More detailed analysis of immigrant characteristics within metropolitan areas, including country of birth, language ability, entry period, citizenship status, employment, earnings, and poverty status, are derived from ACS 3-year estimates, 2006 to 2008, a period largely before the height of the Great Recession.16 Annual national estimates on the share of low- and high-skilled immigrant and U.S.-born workers annually come from the Current Population Survey (CPS).
Both the ACS and decennial census seek to enumerate the full population, but fail to fully cover certain hard-to-reach populations. Unauthorized immigrants are a particularly vulnerable group that

BROOKINGS | June 20114
is likely reluctant to respond to government officials. Department of Homeland Security (DHS) reports pin the undercount of the unauthorized in the ACS at somewhere between 10 and 20 percent of the total foreign-born population.17
TerminologyWe use the terms skills and human capital interchangeably to refer to the educational attainment of foreign- and native-born working-age adults between ages 25 and 64 (regardless of employment sta-tus). This captures adults who have likely completed their schooling and are still in the labor market. To be sure, educational attainment is not a perfect measure of occupational skill, particularly among the foreign-born, for whom the quality of educational degrees received abroad may vary substantial-ly.18 Nor is educational attainment the only measure of human capital, which can include labor market experience and job- and sector-specific knowledge and training. Yet educational attainment itself remains a strong predictor of employment, job stability, and wages—especially for workers at the high and low ends of the educational distribution.19
Immigrant and foreign-born are also used interchangeably throughout this report to refer to per-sons born outside the United States, excluding those born abroad to American citizens.20 Immigrant status is determined by a question on birthplace in the census questionnaire; however, legal status is not specified except whether a person has become a naturalized U.S. citizen. In this analysis, we are unable to distinguish immigrants who are legally authorized to work in the United States from those who are not. Thus, the data analyzed in this report for the foreign born include naturalized U.S. citi-zens, legal permanent residents, temporary immigrants, refugees, asylum seekers, and to the extent to which they are counted, unauthorized immigrants.
Measuring the Distribution of Immigrant SkillsThis report measures immigrant skill by educational attainment as reported in U.S. Census Bureau questionnaires. “Low-skilled” immigrants are defined as those lacking a high school diploma, and “high-skilled” immigrants are those with a college degree or more.21 To evaluate the representation of these groups in metropolitan areas, we calculate the ratio of high- to low-skilled adult immigrants, and multiply by 100.22 We have elected to exclude the “middle” portion of the educational distribution (those with a high school diploma or some college but no degree) in our key measure because the relative size of this group varies little across the 100 largest metro areas.23 The middle-skilled group is larger than either the high- or low-skilled groups for both the foreign-born and U.S.-born populations, but a focus on high- and low-skilled immigrants correlates with contemporary policy debates on the value of these foreign-born workers to critical sectors of the slowly recovering U.S. economy.
This metropolitan immigrant skill ratio ranges from a low of 13.3 (Bakersfield, CA), indicating a very low-skilled immigrant population, to a high of 391.3 (Pittsburgh, PA), where high-skilled immigrants outnumber low-skilled immigrants by nearly 4 to 1. (A skill ratio of 100 indicates an equal number of high- and low-skilled immigrants.) The skill ratio for all immigrants living in the 100 largest metro areas is 101.6.
Each of the 100 metropolitan areas in the study are assigned to one of three categories according to their immigrant skill ratios: low-skill, balanced-skill, or high-skill destination. Low-skill destinations are metro areas with an immigrant skill ratio below 75 (i.e., fewer than 75 high-skilled immigrants for every 100 low-skilled immigrants); balanced-skill destinations have ratios between 75 and 125 (i.e., relatively comparable numbers of high- and low-skilled immigrants); and high-skill destinations have immigrant skill ratios greater than 125 (i.e., more than 125 high-skilled for every 100 low-skilled immigrants). While these groupings could be defined statistically or distributionally (e.g., breaking the metro areas into thirds, or based on standard deviations from the mean), we believe that these groups should be qualitatively different. Most importantly, low- and high-skill destinations should be clearly defined as places where low- and high- skilled immigrants, respectively, predominate. Similarly, “balanced” skill destinations should demonstrate an approximate equilibrium in the educational distribution of immigrant workers. Nonetheless, readers should be aware that different groupings may be defensible for different purposes and that altering these skill-group definitions would shift the metro areas that fall under each category.

BROOKINGS | June 2011 5
GeographyConsistent with other work in the State of Metropolitan America series, this report focuses on the 100 largest metropolitan areas as defined by the Office of Management and Budget (OMB) in 2009 and based on U.S. Census Bureau population estimates for that year. Metropolitan areas and their con-stituent counties have expanded (and occasionally contracted) over the course of the 20th century. In order to maintain geographic consistency in these units over time, Geographical Information Systems (GIS) tools are used to apply current metropolitan boundaries to historical county-level data.24 Coun-ties that fall completely within the boundaries of a metropolitan area are assigned to the correspond-ing metro area; for the rare case when a county crosses a metropolitan boundary or boundaries, it is included in the metropolitan area in which its geometric centroid lies.25
We use an expanded typology of metropolitan immigrant gateways to analyze the 100 metropolitan areas, adding historical depth and significance to geographical settlement patterns (see Box on page 11).26
Findings
A. The share of working-age immigrants in the United States who have a bachelor’s degree has risen considerably since 1980, and now exceeds the share without a high school diploma. During a period of the highest immigration levels on record, the skill levels of immigrant workers converged. The share of immigrants with college degrees has been increasing; the share without a high school education, declining. In 1980, there were more than twice as many low-skilled immigrants residing in the United States as high-skilled ones, and their respective shares of the working-age im-migrant population differed by 20 percentage points (Table 1). Over the next 30 years, the low-skilled immigrant share dropped by more than 10 percentage points, while the high-skilled share increased by more than 10 percentage points. Those with “middle” skills (a high school diploma, some college, or an associate’s degree) grew in absolute terms, but remained a stable proportion of the working-age immigrant population between 1980 and 2010.
Despite the public perception of immigrants as being poorly educated, the high-skilled U.S. immi-grant population today outnumbers the low-skilled population.27 As recently as 1994 (the earliest available annual data from the CPS), the low-skilled share of all working-age immigrants was about 8 percentage points higher than the high-skilled share (Figure 1A). By 2010, however, high-skilled immigrants constituted 30 percent, and low-skilled immigrants 28 percent, of the total working-age immigrant population. Even more dramatically, this shift in the distribution of immigrant skills occurred during a period in which the working-age foreign-born population more than doubled – from 14.6 million to 29.7 million.
Similar shifts in skills are evident among the working-age, U.S.-born population, though the propor-tion of that population without a high school diploma is much smaller than for immigrants. Between 1994 and 2010, the proportion considered low-skilled dropped from about 12 percent to 7 percent,
Table 1. Percent Low, Middle, and High-Skilled Immigrants in the United States, 1980–2010
Low Skilled Middle Skilled High Skilled
1980 39.5 41.5 19.0
1990 36.8 40.7 22.5
2000 30.4 42.7 26.9
2010 27.8 42.6 29.6
Source: Authors’ analysis of 1980, 1990 and 2000 decennial census data and 2010 Current Population Survey

BROOKINGS | June 20116
Figure 1A. Share of Low, Middle, and High-Skilled immigrants, 1994–2010
Figure 1B. Share of Low, Middle, and High-Skilled Natives, 1994–2010
Note: Author’s analysis of weighted 1994–2010 Current Population Surveys
Note: Author’s analysis of weighted 1994–2010 Current Population Surveys
Low-Skilled
Mid-Skilled
High-Skilled
18
20
22
24
26
28
30
32
34
36
38
40
42
44
46
1994
1995
1996
1997
1998
1999
20002001
20022003
20042005
20062007
20082009
2010
Per
cen
t of
work
ing a
ge
imm
igra
nts
Low-Skilled
Mid-Skilled
High-Skilled
0
10
20
30
40
50
60
70
1994
1995
1996
1997
1998
1999
20002001
20022003
20042005
20062007
20082009
2010
Per
cen
t of
work
ing a
ge
nati
ves

BROOKINGS | June 2011 7
those with a college degree or more increased from 24 percent to 32 per-cent, and the middle-skilled segment decreased slightly from 63 percent to 61 percent (Figure 1B).
This shift toward higher-skilled immi-grants accelerated in the past decade. Among the 7.9 million working-age immigrants reported in the 2009 ACS who arrived in the United States during the 2000s, nearly a third of them were high-skilled, more than the number of low-skilled immigrants who arrived during the same period (Figure 2). By contrast, new immigrants recorded in Census 2000 as arriving during the 1990s were considerably more likely to be low- than high-skilled. Similarly, among those arriving in the 1980s, low-skilled immigrants outnumbered high-skilled immigrants by 60 percent.
What accounts for the rise in the skill level of the foreign born entering U.S. borders? While the absolute size of the high- and low-skilled immigrant populations has increased over time, the high-skilled population is growing faster than the low-skilled population. Part of this shift simply reflects rising demand for high-skilled workers, both foreign- and native-born, resulting from the long-term restructuring of the U.S. economy in response to technological advancement and global trade.
At the same time that demand for high-skilled workers spiked, policy changes augmented the supply of high-skilled immigrants. The temporary H-1B visa for workers in “specialty occupations” has boosted the number of immigrants in the United States with a college degree or more since the 1990s. A bach-elor’s degree or its equivalent is typically the minimum requirement for this visa, and exemptions from the cap are given to 20,000 immigrants with degrees from a U.S. institution. Yet, those petitioned for, or employed at, an institution of higher education, a nonprofit research organization, or a government research organization are exempt from the numerical cap. During the 2000s, approximately 200,000 to 331,000 H-1B petitions were approved annually.28
The number of international students in the United States has steadily increased during the past several decades, rising from 250,000 in 1978–79, to half a million in 1998–99, to close to 700,000 in 2009–10.29 The upward trend in the international student population at American colleges and uni-versities increases the number of high-skilled immigrants as some of them are able to adjust to a visa status that allows them to live and work in the United States after graduation. Some proportion of the temporary workers and international students become legal permanent residents, putting them on the pathway to U.S. citizenship.30
Figure 2. Distribution of Skill Levels of New Immigrants, by Period of Arrival
Source: 1990 and 2000 Census PUMS, and 2009 ACS PUMS
0
10
20
30
40
50
60
70
80
90
100
■ High-Skilled
■ Mid-Skilled
■ Low-Skilled
2000s1990s1980s
0
10
20
30
40
50
60
70
80
90
100
High Skill
Mid Skill
Low Skill
2000s1990s1980s
24.3
36.8
38.9
28.6
35.3
36.1
32.1
38.0
29.9

BROOKINGS | June 20118
B. Forty-four (44) of the nation’s 100 largest metropolitan areas are high-skill immi-grant destinations, in which college-educated immigrants outnumber immigrants without high school diplomas by at least 25 percent.The nearly equal shares of low- and high-skilled immigrants nationally are not reflected uniformly across the metropolitan areas where immigrants live and work. Rather, low-skilled immigrants cluster in some areas while high-skilled immigrants gather in others, producing an uneven map of metropolitan immigrant skill profiles (Map 1). (See Appendix A for skills ratios for each of the 100 metropolitan areas).
Low-skill destinations (denoted by downward-facing triangles) are strongly represented in the border states of California, Arizona, New Mexico, and Texas. In fact, of the 20 metropolitan areas in these four states, all but four of them are classified as low-skill, and 8 of the 10 metropolitan areas with the low-est immigrant skill ratios are located in these states.
Low-skilled immigrants also concentrate in the major metropolitan areas of the Great Plains. Oklahoma City, Omaha, Tulsa, and Wichita, for example, are all low-skilled immigrant destinations, as are areas just west of the Plains like Boise and Ogden. Despite being at least mid-sized metro areas, many of the labor markets in these areas boast prominent agricultural and/or food processing indus-tries; this coupled with their relatively close proximity to border states serves to attract low-skilled laborers. There are 30 low-skilled destinations in total; only five of them—Cape Coral, Lakeland, Grand Rapids, Greensboro, and Providence—are located east of the Mississippi River.
High-skill destinations (denoted by upward-facing triangles) have grown strongly along the coasts. Many of these areas, such as Seattle, San Francisco, and Washington, D.C., have reputations as cultural, knowledge, and technology centers. Metropolitan areas centered around large college towns such as Columbus, Knoxville, and Madison have highly skilled immigrant populations in part because they draw students from abroad, many of whom stay in the United States for extended periods of time.
Map 1. Immigration Skill Ratio, 100 Largest Metropolitan Areas, 2009
Source: Authors’ analysis of 2009 American Community Survey data
#
#
!
#
##
##!
#
!
#
#
#
#
#
#
##
# #
!
#
# #
#
#
!
#!
#
!
##
#
# #
#
# !
#
###
# ##!#
#
!!
#
#
#
#
#!
!
!
!
!
!
#
!
!
!##
#
#
####
!
!
#!!
## #
#
#
#
##
!##
#
#
#!###
#
#
Map 1. Immigrant skill type, 100 largest metropolitan areas, 2009
Source: authors' analysis of 2009 American Community Survey data#
Low
! Balanced
# High

BROOKINGS | June 2011 9
Perhaps most notable is the very high concentration of high-skilled immigrants in older industrial metro areas in the Midwest and Northeast such as Albany, Buffalo, Cleveland, Pittsburgh, St. Louis, and Syracuse. Detroit, for instance, has 144 high-skilled immigrants for every 100 low-skilled immi-grants. Immigrants in these metropolitan areas tilt toward high-skill because they blend earlier arriving cohorts who have had time to complete higher education with newcomers entering who can fit into the labor market because of their high educational attainment. Several of the cities in these metropoli-tan areas also campaign to attract and retain immigrants, signaling appreciation for the small number of high-skilled immigrants they do have.31 In total, there are 44 high-skilled destinations; the majority in the Northeast and Midwest.
Balanced-skill destinations (denoted by circles) are most prominently found in Eastern and Southern states. Many metropolitan areas in Southeastern states, the newest destination region for immi-grants, are surprisingly diverse in their skill profiles. Atlanta, Birmingham, Charlotte, and Nashville, for instance, have attracted roughly equal numbers of high- and low-skilled immigrants. Metropolitan areas such as Des Moines, Kansas City, Milwaukee and Chicago in the Midwest and Great Plains also have balanced skill levels among their immigrant populations, as do New York, Scranton and Springfield in the Northeast, and Portland, Sacramento and San Diego in the West.
C. Immigrants’ skill levels vary by metropolitan area due to historical settlement patterns and economic structures. To further explore this, we expand and update a typology of immigrant destinations that classified 45 metro areas based on the size and change in their foreign-born populations from 1900 to 2000, to include all 100 largest metro areas using the most current census data and metropolitan boundar-ies. This revision yields eight metropolitan destination types for the 100 largest metropolitan areas in 2009.32 Grouping by destination type allows us to generalize, beyond geographic location and, more broadly by historical settlement trends. Table 2 shows the updated categorization and the metropoli-tan areas that fall into each skill-grouping.
Each of the eight “gateway” types features a distinct mix of low-, balanced-, and high-skill desti-nations (Figure 3). This reflects differences in their industrial history and contemporary economic
Figure 3. Distribution of Immigrant Skill Ratio, by Gateway Type, 2009
0% 20% 40% 60% 80% 100%
Former
Major-Continuous
Low Immigration Metro
Re-Emerging
All Destinations
Pre-Emerging
Emerging
Post-World War II
Minor-Continuous
m=166.3
m=129.2
m=126.5
m=124.7
m=111.2
m=81.9
m=73.3
m=62.3
m=50.9
Low Balanced High
Note: m refers to median immigrant skill ratio by gateway type (higher values indicate more highly-skilled immi-
grant populations) Source: Authors’ analysis of 2009 American Community Survey data

BROOKINGS | June 201110
structure, their proximity to immigrants’ home countries, and in the social networks on which their immigrant populations draw. This section describes the metropolitan immigrant skill profiles in each of the gateway types, with the highest-skilled gateway types listed first.
Former gateways—These largely older industrial metro areas have the most highly skilled immigrant populations, with a median skill ratio of 166. This indicates that immigrants with college degrees typically outnumber those without high school diplomas by 66 percent. More than two-thirds of destinations in this group are classified as high-skill. Several of the most highly educated immigrant populations nationwide (e.g., Pittsburgh and St. Louis) are located in former gateways that have transitioned, at least partially, into concentrations such as science, health care, and education. It is widely recognized that many of these “old” destinations suffer from native out-migration—particularly among adults with high levels of education. One factor attracting highly educated immigrants to former destinations may thus be a demand for the skilled labor they can provide. Demographer William Frey has noted that “immigration tends to compensate, to some degree, for the ‘brain drain’” in these metropolitan areas.”34 Nonetheless, the demand for low-skilled immigrant workers in these destinations remains low.
Major-continuous gateways—These metro areas have, in the aggregate, quite skilled immigrant popu-lations. Possibly attesting to the size and diversity of their economies, as well as to the diverse origins of the immigrants they attract, two of these four metro areas (Chicago and New York) have immigrant populations fairly balanced in education levels. The other two metro areas (San Francisco and Boston) house more high- than low-skilled immigrants, reflecting markets oriented toward high technology, professional services and finance. Importantly, none of the major-continuous gateways are classified as low skill. The layering of newer flows on top of long-settled streams likely accounts for the relative equity in their skill distributions.
Low-immigration metro areas—These metro areas contain, on average, more high- than low-skilled immigrants (median skill ratio 126). As previously noted, they include several “college towns” with high rates of immigrant educational attainment, like Knoxville and Madison. Others share more in common with the former gateways. Areas such as Akron, Cincinnati, Dayton, and Syracuse have long-established manufacturing industries that continue to employ small but very highly-skilled immigrant populations. Other high-skill areas with few immigrants, such as Augusta, have emerging high-skill industries such as medicine and biotechnology.
Re-emerging gateways—Some re-emerging gateways such as Baltimore, the Twin Cities, Sacramento, Portland and Seattle have had considerable refugee resettlement in the past few decades. Depending on origin country conditions, some refugees arrive with little in the way of formal education, while oth-ers possess a wide range of skills, experience, and education. The net effect on metro areas that have a high proportion of a diverse set of refugees among their foreign-born populations is a likely boost to both ends of the skills spectrum.35
Pre-emerging and emerging gateways—On average, pre-emerging and emerging gateways tend to have more low- than high-skilled immigrants (median skill ratios of 82 and 73, respectively). The tendency for these metros to attract relatively low-skilled immigrant populations is consistent with the mainstream perception of new settlement areas. Notably, Mountain West metro areas such as Phoenix, Las Vegas, and Salt Lake City align with this “new and low-skilled” characterization. While a majority of metro areas in these gateway types are low-skilled destinations, several balanced- and high-skilled destinations can be found in the Southeast. New settlement areas such as Atlanta, Orlando, and Raleigh contain at least as many high- than low-skilled immigrants. These metros attracted high-skilled immigrants in a range of jobs in sectors including health care, professional services, and technology. However, many of these metro areas were fast-growing, housing market-dominant economies before the economic downturn. Immigrants were drawn to these metros by the abundance of lower-skilled construction, housing and real estate industry jobs, as well as by the relatively low cost of living.
Post-World War II gateways—These metro areas also exhibit low-skill immigrant profiles (median skill ratio of 62). They rely much less heavily on agricultural industries than the minor-continuous destina-tions (see below), but more than half of them are in border states, and they house a large portion of the U.S. undocumented population.36 The main exception is the Washington, D.C. region, whose skill ratio of 189 reflects an economy dominated by the federal government and associated high-level ser-vices, headquarters of international organizations, and embassies.37

BROOKINGS | June 2011 11
Eight Immigration Destination Types—A Typology of ‘Gateways’ (Guide to Table 2)
In order to better understand the relationship between contemporary metropolitan immigrant skill profiles and historical patterns of immigrant
settlement, this report updates and extends a typology of metropolitan immigrant “gateways,” classifying the 100 largest metro areas into the
eight destination types described below.
Former gateways (seven metro areas) were once major immigrant ports of entry, and are mostly found in old manufacturing areas in the
Northeast or Midwest. These destinations, such as Cleveland, Milwaukee, and St. Louis, had populations with a higher immigrant share than the
national average from 1900 to 1930, followed by a foreign born share lower than the national average in every decade to the present.
Major-continuous gateways (four metro areas), New York, Boston, San Francisco, and Chicago are the quintessential immigrant destinations,
having large and sustained immigrant populations over the course of the 20th century. The proportion of their foreign-born populations has
exceeded the national average for every decade of the past century. More recently, however, these cities are serving as way stations for new
arrivals that may eventually head to other destinations. Nonetheless, the four metro areas classified as major-continuous gateways continue to
house about one-quarter of all immigrants nationwide.
Minor-continuous gateways (15 metro areas), are more modest versions of the major-continuous gateways, with long histories of immigrant
settlement. These destinations had an above-average immigrant population share from 1900-1950, and an immigrant population share above
or near the national average in 2009. They include two distinct sets of metro areas. One group, including places like New Haven and Worcester,
historically served as suburban-like destinations for early 20th century European immigrants. The other group, including areas such as McAllen
and Stockton, is located in border states and has long been home to Mexican labor migrants. Several are located in California’s Central Valley,
arguably the most productive agricultural center in the country.
Post-World War II gateways (seven metro areas) emerged as large immigrant hubs during the mid-20th century. These destinations, like Los
Angeles and Houston, had comparatively small immigrant populations until the 1950s, but grew rapidly thereafter. Metropolitan areas in this
category are now major immigrant destinations, in some cases rivaling the status of a few of the major-continuous gateways. Combined, nearly
one-third of all immigrants nationwide reside in the seven post-World War II gateways.
Collectively, the next three destination types form what is typically referred to as the “new destinations” or “21st century gateways.”33
Emerging gateways (five metro areas) have only recently become major destinations for immigrants. These metropolitan areas had small
immigrant populations for most of the 20th century, but their foreign born populations grew faster than the national rate during one of the last
three decades of the 20th century, and their immigrant population share has exceeded the national average since 1990. Atlanta and Phoenix are
prime examples of emerging gateways, with foreign-born populations that have grown very rapidly in the past two decades, and are now quite
large in size.
Re-emerging gateways (nine metro areas), such as Minneapolis and Seattle, had an early 20th century settlement pattern very similar to the
former gateways. These metro areas attracted immigrants in great numbers in the early part of the 20th century but during the rest of the
century experienced low levels of immigration. In a turnaround, they saw fast immigrant growth at the tail end of the 20th century and into the
last decade, thus re-emerging as major immigrant gateways.
Pre-emerging gateways (eight metro areas) have little historical record of receiving immigrants, but in recent decades have experienced
extraordinary growth in their foreign-born populations. These destinations, like Greensboro and Nashville, have smaller immigrant populations
than the other 21st century gateways and immigrant growth has occurred more recently (since 1990). But immigrant growth has been much
faster—at least three times the national average.
Low-immigration metro areas (45 metro areas) include places with modest immigrant inflows or small foreign-born populations. There is
considerable variation in the size and growth patterns of the immigrant population in these metro areas. Some have very small, but growing
foreign-born populations, such as Jackson and Scranton, and others have sizable, but slow-growing immigrant populations, like Indianapolis and
Kansas City. If the growth trajectories of some of these low- immigration metro areas—including Boise, Birmingham and Greenville—continue,
they are poised to become “pre-emerging gateways” within the next few years.

BROOKINGS | June 201112
Table 2. Metro Immigrant Skill Ratios, 2009
Former Gateways Major-Continuous Gateways Minor-Continuous Gateways
Buffalo-Niagara Falls, NY High Boston-Cambridge-Quincy, MA-NH High Bakersfield, CA Low
Cleveland-Elyria-Mentor, OH High Chicago-Naperville-Joliet, IL-IN-WI Balanced Bridgeport-Stamford-Norwalk, CT High
Detroit-Warren-Livonia, MI High New York, NY-NJ-PA* Balanced El Paso, TX Low
Milwaukee-Waukesha-West Allis, WI Balanced San Francisco-Oakland-Fremont, CA High Fresno, CA Low
Pittsburgh, PA High Hartford-West Hartford, CT* High
Providence-New Bedford, RI-MA* Low Honolulu, HI High
St. Louis, MO-IL High McAllen-Edinburg-Mission, TX Low
Modesto, CA Low
Post-World War II Gateways Re-Emerging Gateways New Haven-Milford, CT High
Dallas-Fort Worth-Arlington, TX Low Baltimore-Towson, MD High Oxnard-Thousand Oaks-Ventura, CA Low
Houston-Sugar Land-Baytown, TX Low Denver-Aurora, CO Low Rochester, NY High
Los Angeles-Long Beach, CA* Low Minneapolis-St. Paul, MN-WI* High San Antonio, TX Low
Miami-Fort Lauderdale, FL* Balanced Philadelphia-Camden, PA-NJ-DE-MD* High Stockton, CA Low
Riverside-San Bernardino-Ontario, CA Low Portland-Vancouver, OR-WA* Balanced Tucson, AZ Low
San Diego-Carlsbad-San Marcos, CA Balanced Sacramento--Arden-Arcade, CA* Balanced Worcester, MA High
Washington, DC-VA-MD-WV* High San Jose-Sunnyvale-Santa Clara, CA High
Seattle-Tacoma-Bellevue, WA High Pre-Emerging Gateways
Emerging Gateways Tampa-St. Petersburg-Clearwater, FL Balanced Cape Coral-Fort Myers, FL Low
Atlanta-Sandy Springs-Marietta, GA Balanced Charlotte-Gastonia-Concord, NC-SC Balanced
Austin-Round Rock, TX Low Columbus, OH High
Las Vegas-Paradise, NV Low Greensboro-High Point, NC Low
Orlando-Kissimmee, FL Balanced Lakeland-Winter Haven, FL Low
Phoenix-Mesa-Scottsdale, AZ Low Nashville-Davidson, TN* Balanced
Raleigh-Cary, NC High
Salt Lake City, UT Low
Low Immigration Metros
Akron, OH High Des Moines-West Des Moines, IA Balanced Oklahoma City, OK Low
Albany-Schenectady-Troy, NY High Grand Rapids-Wyoming, MI Low Omaha-Council Bluffs, NE-IA Low
Albuquerque, NM Low Greenville-Mauldin-Easley, SC Balanced Palm Bay-Melbourne-Titusville, FL High
Allentown-Bethlehem-Easton, PA-NJ High Harrisburg-Carlisle, PA High Portland-South Portland-Biddeford, ME High
Augusta-Richmond County, GA-SC High Indianapolis-Carmel, IN Balanced Poughkeepsie-Newburgh, NY* High
Baton Rouge, LA High Jackson, MS Balanced Provo-Orem, UT High
Birmingham-Hoover, AL Balanced Jacksonville, FL High Richmond, VA High
Boise City-Nampa, ID Low Kansas City, MO-KS Balanced Scranton--Wilkes-Barre, PA Balanced
Bradenton-Sarasota-Venice, FL High Knoxville, TN High Springfield, MA Balanced
Charleston-North Charleston, SC* High Little Rock-North Little Rock, AR* Balanced Syracuse, NY High
Chattanooga, TN-GA Balanced Louisville-Jefferson County, KY-IN Balanced Toledo, OH High
Cincinnati-Middletown, OH-KY-IN High Madison, WI High Tulsa, OK Low
Colorado Springs, CO Balanced Memphis, TN-MS-AR Balanced Virginia Beach-Norfolk, VA-NC* High
Columbia, SC High New Orleans-Metairie-Kenner, LA Balanced Wichita, KS Low
Dayton, OH High Ogden-Clearfield, UT Low Youngstown-Warren, OH-PA* High
Note: Full name and skill ratios are shown in the Appendix

BROOKINGS | June 2011 13
Minor-continuous gateways—With a median immigrant skill ratio of 51, implying nearly twice as many low- as high-skilled immigrants, minor-continuous destinations house the least-educated immigrant populations. Several of these metros are longstanding agricultural centers or are a short distance from Mexico. In many, the histories of Mexican migration stretches back to the early part of the 20th century, when farmhands from rural Mexico were brought in via the Bracero Program to harvest beets, tomatoes, and other crops in the American West. Not all minor-continuous gateways are low-skill destinations; about one-third are classified as high skill, mostly extended suburban regions of the New York-Boston corridor, including four Connecticut metropolitan areas.
D. Recent immigrants to metro areas with the fastest-growing immigrant populations have markedly lower educational attainment than immigrants settling elsewhere.Among immigrants arriving during the 2000s, high-skilled immigrants outnumbered low-skilled immi-grants nationwide. However, as the other findings demonstrate, metropolitan areas are receiving each of these groups in very different numbers and proportions.
Low-skilled immigrants dominate recent inflows in fast-growing destinations (Figure 4). Among metropolitan areas with above-average growth in their foreign-born populations since 2000, larger shares of those recent arrivals were low- than high-skilled. For example, in Omaha, where the immi-grant population grew by two-thirds between 2000 and 2009, 41.1 percent of new arrivals were low-skilled versus 29.4 percent who were high-skilled. Similar trends in immigrant skills characterize other metro areas with fast-growing foreign-born populations, such as Charlotte, Dallas-Ft. Worth, Phoenix, and Las Vegas.
Conversely, in areas with slower-growing immigrant populations, high-skilled immigrants tend to constitute a larger share of the newest cohort. Cleveland illustrates this phenomenon well: its foreign-born population grew by just 2.8 percent during the 2000s. Among recent arrivals, however, 50 per-cent were high skilled, compared to 10.4 percent who were low skilled. In Pittsburgh, the most extreme example, the immigrant population grew by 13 percent between 2000 and 2009, and 76.4 percent of these new arrivals were college-educated, while just 6.1 percent lacked a high school diploma. This tilt toward higher-skilled immigrants in the 2000s characterizes other slow-growing former gateways such as Buffalo, Detroit, and St. Louis.
Figure 4. New Immigrant Arrivals by Skill Type, by Metropolitan Growth in the Immigrant Population in the 2000s
Source: Authors’ analysis of 2009 American Community Survey data
30.9
37.1
26.7
27.2
40.1
34.7
37.9
38.4
29.1
28.2
35.4
34.4
0 20 40 60 80 100
4th Quartile (Fastest Growing)
3rd Quartile
2nd Quartile
1st Quartile (Slowest Growing)
Low-Skilled Mid-Skilled High-Skilled

BROOKINGS | June 201114
We shift focus now to the individual characteristics of immigrants that vary by skill level (Table 3) and offer insights into their U.S. labor market potential.38 Across the 100 largest metro areas, low-skilled immigrants are much more likely than high-skilled immigrants to hail from Mexico (57.3 percent versus 5.5 percent), about half as likely to be naturalized, only one-fifth as likely to speak English pro-ficiently, and slightly more likely to be male.39 For their part, a greater share of high- than low-skilled immigrants arrived during the last decade (21.7 percent vs. 18.2 percent, respectively).
Key characteristics of high- and low-skilled immigrants vary across the metropolitan gateway types. Take, for example, Mexican origin of low-skilled immigrants. In former and major-continuous gate-ways—destinations that have not largely drawn Mexican immigrants—low-skilled immigrants are consid-erably less likely to be from Mexico than they are in any other gateway type. Mexicans constitute just 6.2 percent of the low-skilled immigrant population in Buffalo, and just 13.8 percent in the New York area, despite rapid growth in its Mexican population in recent years.40 By contrast, in minor-continuous gateways such as Fresno, Bakersfield, El Paso, and San Antonio—which have long-standing Mexican immigrant populations—greater than 75 percent of low-skilled immigrants are from Mexico. A similar pattern prevails in many newer settlement areas such as Las Vegas (75.2 percent), Salt Lake City (79.7 percent), and Austin (85.8 percent).
Both low- and high-skilled immigrants are more likely to be citizens and speak English proficiently in destinations where the share of recent arrivals is smaller, such as former and major-continuous gateways, as well as low-immigration metro areas. This reflects the fact that English ability and natu-ralization rates increase with time in the United States. For immigrants of both skill types, however, the
Table 3. Demographic Characteristics of Low- and High-Skilled Immigrants, by Gateway Type, 2006-2008
Low-Skilled Immigrants
Arrived during English
2000s Mexican Naturalized Proficient Age Male
100 Largest Metro Areas 18.2% 57.3% 26.2% 16.4% 42.3 53.5%
Gateway Type
Former 16.8% 27.6% 38.9% 22.3% 44.4 51.8%
Major-Continuous 17.8% 32.8% 33.7% 20.1% 43.9 51.8%
Minor-Continuous 15.4% 77.9% 24.2% 15.5% 43.4 51.1%
PostWorldWarII 15.0% 64.8% 24.4% 13.9% 42.3 53.2%
Emerging 25.7% 73.8% 17.4% 15.7% 39.5 58.9%
Re-Emerging 22.5% 54.6% 27.4% 16.0% 41.6 52.9%
Pre-Emerging 29.3% 60.9% 17.6% 18.3% 38.7 60.4%
LowImmigrationMetro 26.6% 56.6% 23.2% 20.1% 40.3 56.5%
High-Skilled Immigrants
Arrived during English
2000s Mexican Naturalized Proficient Age Male
100 Largest Metro Areas 21.7% 5.5% 54.0% 71.5% 42.1 50.8%
Gateway Type
Former 26.0% 1.9% 50.1% 76.1% 41.7 55.1%
Major-Continuous 19.6% 2.5% 57.0% 71.5% 42.1 49.6%
Minor-Continuous 22.8% 16.4% 52.6% 72.4% 42.1 49.3%
Post-WorldWarII 20.3% 7.8% 55.6% 68.1% 42.8 50.3%
Emerging 24.8% 8.2% 47.9% 73.0% 41.6 52.3%
Re-Emerging 22.9% 3.5% 52.2% 74.2% 41.3 52.1%
Pre-Emerging 29.5% 5.4% 41.5% 73.2% 41.0 53.5%
LowImmigrationMetro 26.7% 4.3% 48.7% 76.7% 41.7 53.3%
Source: Authors’ analysis of ACS three-year estimates, 2006-2008
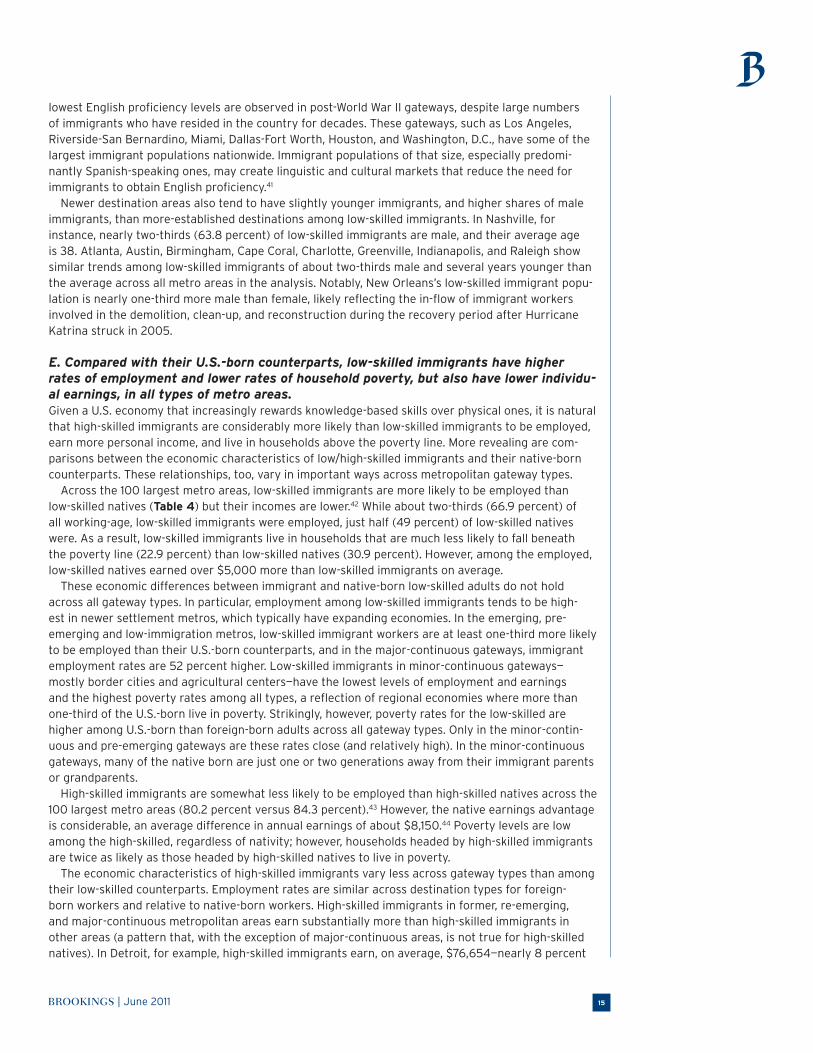
BROOKINGS | June 2011 15
lowest English proficiency levels are observed in post-World War II gateways, despite large numbers of immigrants who have resided in the country for decades. These gateways, such as Los Angeles, Riverside-San Bernardino, Miami, Dallas-Fort Worth, Houston, and Washington, D.C., have some of the largest immigrant populations nationwide. Immigrant populations of that size, especially predomi-nantly Spanish-speaking ones, may create linguistic and cultural markets that reduce the need for immigrants to obtain English proficiency.41
Newer destination areas also tend to have slightly younger immigrants, and higher shares of male immigrants, than more-established destinations among low-skilled immigrants. In Nashville, for instance, nearly two-thirds (63.8 percent) of low-skilled immigrants are male, and their average age is 38. Atlanta, Austin, Birmingham, Cape Coral, Charlotte, Greenville, Indianapolis, and Raleigh show similar trends among low-skilled immigrants of about two-thirds male and several years younger than the average across all metro areas in the analysis. Notably, New Orleans’s low-skilled immigrant popu-lation is nearly one-third more male than female, likely reflecting the in-flow of immigrant workers involved in the demolition, clean-up, and reconstruction during the recovery period after Hurricane Katrina struck in 2005.
E. Compared with their U.S.-born counterparts, low-skilled immigrants have higher rates of employment and lower rates of household poverty, but also have lower individu-al earnings, in all types of metro areas.Given a U.S. economy that increasingly rewards knowledge-based skills over physical ones, it is natural that high-skilled immigrants are considerably more likely than low-skilled immigrants to be employed, earn more personal income, and live in households above the poverty line. More revealing are com-parisons between the economic characteristics of low/high-skilled immigrants and their native-born counterparts. These relationships, too, vary in important ways across metropolitan gateway types.
Across the 100 largest metro areas, low-skilled immigrants are more likely to be employed than low-skilled natives (Table 4) but their incomes are lower.42 While about two-thirds (66.9 percent) of all working-age, low-skilled immigrants were employed, just half (49 percent) of low-skilled natives were. As a result, low-skilled immigrants live in households that are much less likely to fall beneath the poverty line (22.9 percent) than low-skilled natives (30.9 percent). However, among the employed, low-skilled natives earned over $5,000 more than low-skilled immigrants on average.
These economic differences between immigrant and native-born low-skilled adults do not hold across all gateway types. In particular, employment among low-skilled immigrants tends to be high-est in newer settlement metros, which typically have expanding economies. In the emerging, pre-emerging and low-immigration metros, low-skilled immigrant workers are at least one-third more likely to be employed than their U.S.-born counterparts, and in the major-continuous gateways, immigrant employment rates are 52 percent higher. Low-skilled immigrants in minor-continuous gateways—mostly border cities and agricultural centers—have the lowest levels of employment and earnings and the highest poverty rates among all types, a reflection of regional economies where more than one-third of the U.S.-born live in poverty. Strikingly, however, poverty rates for the low-skilled are higher among U.S.-born than foreign-born adults across all gateway types. Only in the minor-contin-uous and pre-emerging gateways are these rates close (and relatively high). In the minor-continuous gateways, many of the native born are just one or two generations away from their immigrant parents or grandparents.
High-skilled immigrants are somewhat less likely to be employed than high-skilled natives across the 100 largest metro areas (80.2 percent versus 84.3 percent).43 However, the native earnings advantage is considerable, an average difference in annual earnings of about $8,150.44 Poverty levels are low among the high-skilled, regardless of nativity; however, households headed by high-skilled immigrants are twice as likely as those headed by high-skilled natives to live in poverty.
The economic characteristics of high-skilled immigrants vary less across gateway types than among their low-skilled counterparts. Employment rates are similar across destination types for foreign-born workers and relative to native-born workers. High-skilled immigrants in former, re-emerging, and major-continuous metropolitan areas earn substantially more than high-skilled immigrants in other areas (a pattern that, with the exception of major-continuous areas, is not true for high-skilled natives). In Detroit, for example, high-skilled immigrants earn, on average, $76,654—nearly 8 percent

BROOKINGS | June 201116
more than the average across all areas. By contrast, high-skilled immigrants in newer immigrant gate-ways (emerging and pre-emerging gateways), such as Atlanta, Cape Coral, Las Vegas, Orlando, and Salt Lake, earn more than $10,000 less than high-skilled immigrants in most other areas. In Greensboro, for example, the typical high-skilled immigrant is paid just $52,833 annually.
More than their native-born counterparts, many high-skilled immigrants labor in jobs for which they are over-credentialed and/or overqualified. Some empirical research bears out anecdotal stories of immigrant taxi drivers with doctorates or computer engineers laboring in restaurant kitchens.45 Using a simple and widely-used measure of overqualification that takes into consideration the average level of schooling for specific occupations, nearly half (49 percent) of high-skilled immigrants in the 100 largest metros are overqualified for their jobs (i.e., their educational attainment is at least one stan-dard deviation above the mean attainment for their occupation).46 About one in nine (11.3 percent) is greatly overqualified (i.e., two or more standard deviation above the mean) (Table 5). These figures are substantially lower for native-born high-skilled workers, about one-third of whom (36.1 percent) are overqualified, and 6.1 percent greatly overqualified.47
High-skilled immigrants are more likely to be underemployed than high-skilled natives across all met-ropolitan gateway types. The greatest discrepancies between natives and foreign-born are observed in newer settlement areas (emerging and pre-emerging gateways). The least discrepancies are found
Table 4. Economic Characteristics of Low- and High-Skilled Immigrants and Natives, by Gateway Type, 2006-2008
Low-Skilled Immigrants and Natives
% Employed Individual Earnings % in Poverty
Immigrant Native Immigrant Native Immigrant Native
100 largest metro areas 66.9% 49.0% $24,598 $29,751 22.9% 30.9%
Former 59.6% 44.9% $25,878 $28,575 22.8% 33.3%
Major-Continuous 66.1% 43.5% $26,292 $32,707 20.4% 34.3%
Minor-Continuous 60.3% 46.8% $22,489 $28,177 31.4% 35.4%
Post-WorldWarII 67.8% 51.7% $24,283 $30,993 22.1% 28.3%
Emerging 71.0% 52.7% $24,583 $30,647 22.6% 28.0%
Re-Emerging 66.8% 50.5% $24,840 $31,774 23.2% 28.8%
Pre-Emerging 71.5% 53.1% $22,680 $27,969 25.1% 27.8%
LowImmigrationMetro 69.3% 49.4% $23,361 $27,517 25.5% 31.2%
High-Skilled Immigrants and Natives
% Employed Individual Earnings % in Poverty
Immigrant Native Immigrant Native Immigrant Native
100 largest metro areas 80.2% 84.3% $71,121 $79,270 6.2% 3.0%
Former 78.4% 84.9% $75,691 $70,926 6.4% 2.9%
Major-Continuous 80.9% 84.4% $75,905 $92,068 5.8% 3.0%
Minor-Continuous 78.9% 83.6% $68,648 $78,207 7.2% 3.1%
Post-WorldWarII 80.4% 84.4% $67,324 $86,498 6.2% 3.0%
Emerging 80.2% 83.7% $62,682 $75,158 6.5% 3.2%
Re-Emerging 80.2% 84.5% $76,093 $78,127 5.4% 3.0%
Pre-Emerging 79.1% 84.7% $63,897 $72,184 7.6% 2.8%
LowImmigrationMetro 78.7% 84.4% $66,024 $67,364 7.3% 3.2%
Note: % Employed is the percentage of all working-age, low- or high-skilled immigrants/natives currently working (i.e., the denominator includes those both in and out
of the labor force); Individual Earnings is annual earned income for employed individuals; % in Poverty in the percentage of individuals living in households that are
below the official federal poverty line.
Source: Authors’ analysis of ACS three-year estimates, 2006-2008

BROOKINGS | June 2011 17
in former and major-continuous gateways, as well as low-immigrant metro areas. These differences may reflect underlying variation in other characteristics of high-skilled immigrants across places. In their study of college-educated immigrants in the United States, Jeanne Batalova and Michael Fix find that limited English-proficient, high-skilled immigrants were twice as likely to work in unskilled jobs as their proficient counterparts. They also found that having a U.S. degree is highly associated with immigrants securing a job that matches their skills. In addition, legal status matters, but only partially explains the underutilization of skills among Latin American and African immigrants, in particular.48
Discussion
In recent decades, Americans have witnessed a demographic transformation, in large part through immigration, which has brought tens of millions of new faces to their communities and substantially reshaped social, economic, and political institutions. This report finds that, despite popular percep-tions, there are just as many high-skilled as low-skilled working-age immigrants currently living in
the United States, and the growth rate of more educated arrivals to the United States now outpaces that of immigrants with little education. Where these new immigrants settle, as well as their skill sets, have greatly influenced the national debate on immigration reform.
The analysis presented here reveals three important features of the distribution of immigrant skills across metropolitan America: (1) variation in metropolitan economic structure and historical settle-ment patterns yields an uneven distribution of high- and low-skilled immigrants across the country; (2) metropolitan areas with slow-growing, foreign-born populations tend to attract many more high- than low-skilled immigrants, while faster-growing destinations draw larger shares of low-skilled immigrants; (3) low- and high-skilled immigrants have different labor market positions compared with their U.S.-born counterparts, and almost half of immigrants with a bachelor’s degree or more are overqualified for their current jobs.
This report provides a snapshot of the “new geography of immigration,” especially as it relates to the education levels of immigrants, at a moment when historically high levels of immigration have coincided with a particularly turbulent economic period.
Our findings offer important insights into both how to reshape national immigration policy and how to invest in and support immigrants already residing in the United States.
The swift demographic changes across metropolitan America intensify the debate on the economic value of immigrants and their role in the U.S. labor market, especially as the number of unauthorized
Table 5. Overqualification of High-Skilled Immigrants and Natives, by Metropolitan Gateway Type, 2006-2008
Overqualified Greatly Overqualified
Foreign-Born Native-Born Foreign-Born Native-Born
100 largest metro areas 49.0% 36.1% 11.3% 6.1%
Former 46.6% 36.3% 10.6% 5.9%
Major-Continuous 49.6% 36.8% 11.0% 6.2%
Minor-Continuous 48.2% 35.6% 11.8% 6.2%
Post-WorldWarII 50.0% 35.2% 11.6% 6.2%
Emerging 53.1% 37.1% 13.5% 6.3%
Re-Emerging 45.2% 35.7% 10.8% 8.9%
Pre-Emerging 50.3% 35.6% 12.3% 5.3%
LowImmigrationMetro 46.0% 36.1% 10.4% 6.0%
Note: See endnote #46.
Source: Authors’ analysis of ACS three-year estimates, 2006-2008

BROOKINGS | June 201118
immigrants has grown in the past decade. Without confronting this in a constructive manner, explosive anti-immigrant rhetoric will continue to dominate national, state, and local discussions.
The passage of several high-profile state and local laws aimed at punishing and deflecting unau-thorized immigrants resonates with an economically vulnerable, and understandably anxious, public. This context complicates legislative consideration of changes to U.S. immigration policy, as politicians may be loath to exert political capital for such a charged issue. Moreover, the strain of unsuccessful attempts in recent years has made the politics of immigration reform particularly toxic.
Without action at the federal level, states and local governments have emerged as the key players on immigration policy. According to the National Conference of State Legislatures, states enacted a record number of bills and resolutions on immigration issues during the 2010 sessions.49 While many of the proposed laws were restrictive, punitive or related to law enforcement, others—likely more—were inclusive or protective, such as those that allocate funding for language learning, educational programs, or worker training.50 The year 2010 also included Arizona’s SB 1070, a law that expands the power of police and, among other actions, requires police to ask people during arrests and routine stops to verify their residency, and makes it a state crime to be present without documentation. The intent of the law is to push unauthorized immigrants from the state; however, the most controversial parts of the law are blocked from enforcement by a preliminary injunction ordered by a federal judge in July 2010. At this writing at least a dozen other states have considered similar bills, and two states, Utah and Georgia, have passed slightly watered down enforcement measures into law. Although Utah’s HB 497 passed as part of a package of broader comprehensive immigration bills it was still blocked by a federal court injunction on the day that it went into effect, May 13, 2011- the same day that Georgia Governor Nathan Deal signed HB 87 into law. This is likely a sign of things to come for Georgia’s law.
New provisions by local jurisdictions, including cities, counties and towns, are also on the rise. However, these are much more difficult to track than state action. Some of the earliest restrictive pro-posals occurred at the city or county level, serving as models for places looking for ways to discourage immigrants from settling down, including Hazleton, PA and Prince William County, VA.51 However, as many states and local governments consider restrictive legislation, they must also weigh the costs of new technology or the potential costs of expensive lawsuits. Jurisdictions facing budget deficits may not be well positioned to take on added expenses that often come with major policy changes.
Our report confirms what some industries, employers and municipalities have already begun to recognize: that the new arrivals to this country should be viewed as a positive and skilled addition to the labor force rather than as a strain on society. By examining the new geography of immigrant skills across the 100 top metropolitan areas, we have also provided the data necessary for beginning to explore more inclusive immigration policies at the local, state and regional levels.
Traditionally, the role of the federal government has been to set admissions policy and to secure the border. The role of states, cities, and other local municipalities has largely been to deal with the poli-cies that affect immigrants’ social, economic, and civic integration.
State and local governments have important choices about how to welcome immigrants. While states and localities have little control over where immigrants choose to live, they play an integral role in the management of immigrants once they are living within their jurisdictions. In recent years, many state and local leaders have come to recognize the benefits of a proactively welcoming approach to immigrants, despite the challenges of integrating newcomers. New immigrants have injected new life into struggling areas, reinvigorating declining commercial districts, and rejuvenating dilapidated neighborhoods. They have contributed to economic growth through entrepreneurship and business growth and supplied labor during moments of expansion. Yet immigrants have variable skill sets and legal statuses and tension around immigrants, particularly those from Mexico and Central America, is percolating below the surface in some places, while in others, hostility from state and local leaders is voiced openly. Within this mix of opportunity and challenge, there are basic programs and policy changes that state and municipal governments can do to capitalize on the many strengths of the low-, middle- and high-skilled immigrants living in the United States today.
We offer and expand on several ideas to strengthen economic competitiveness and immigrant inte-gration for metropolitan areas, state governments, as well as the federal government.

BROOKINGS | June 2011 19
1. A Standing Commission on Labor and Immigration Repairing U.S. immigration policy has proven to be neither a simple nor speedy process. Since the Immigration and Nationality Act was passed in 1965, there have been only a few major reforms that have overhauled admissions policy or set new policies in place.52 For example, the current thresholds for employment-based admissions for legal permanent residence were established in 1990. Temporary worker programs for those in specialty occupations, such as the H-1B program begun in 1992, have had adjustments to the number of immigrants admitted annually, largely through political pressure and lobbying by various constituents.
Although President Barack Obama has called for comprehensive immigration reform as recently as his 2011 State of the Union speech and again in a major address in El Paso in May 2011, Congress has been deadlocked on the issue and will likely remain that way for some time. However, we argue here that as the United States goes through an anticipated industrial restructuring over the medium term, what is needed is a more informed, strategic, and nimble system for implementing changes to immigration policy. Congressional debates around immigration policy reform often span years; some policies appear outdated as soon as they are implemented. In other cases, adjustments to exist-ing policies, if applied in a timely manner, could improve their functions. However, often there is no mechanism to make the changes.
One way to create policies that more closely hew to current realities is to have a dedicated body of experts analyze and make recommendations to Congress in a timely and systematic way. Several proposals have been offered by organizations such as the Migration Policy Institute, the Economic Policy Institute, and the Council on Foreign Relations as well as the Brookings-Duke Roundtable on Immigration Policy to create a federal-level standing commission on labor and immigration.53 These proposals call for a bipartisan, independent body to be composed of economists, demographers, and other experts to analyze labor and immigration trends and to make policy recommendations to Congress. The goal would be to have more flexible, swift, and responsive policy changes to short- and long-term labor needs, global and national structural shifts, and potentially, spatial mismatches and labor patterns. Such a system would boost U.S. competitiveness in a globalized economy where work-ers can ostensibly compete for jobs in their choice of countries.
The model of the Standing Commission, as proposed by the Migration Policy Institute, would be required by statue to submit an annual report and recommendations simultaneously to the president and Congress. The process would then include congressional consultation, and unless Congress acted to maintain existing labor market-related immigration visa levels, the president would make a numeri-cal and preferential adjustment to the annual visas allocated.
Currently such a mechanism does not exist. Nor do we have a large body of research to draw on to understand how immigration policy and U.S. labor markets are related, especially how particular visas impact both immigrant flows and economic growth. Thus, a major component of the duties of the Standing Commission would be to analyze these trends and to manage the collection of new data on the relationship between immigrants, admissions policy, and the U.S. labor market. Some of this could be done administratively, for example, by keeping track of temporary workers and their propensities to change status, leave this country, stay in this country, and so forth. The Standing Commission would then be able to formulate recommendations based on evidence from the markets, immigrant behavior, and immigration policy instead of the current process, which is contentious, political, and often driven more by emotion than fact.
The analysis presented here shows that immigrant skills are anything but evenly distributed across metropolitan areas. Therefore we propose that a Standing Commission on Labor and Immigration should be extended to include state-level affiliates. State-level commissions could be created that would be similarly structured, but serve an advisory role to the federal commission. Thus, we envision they would have two primary missions. First, the creation of bipartisan teams of experts who would get input and data from state, metropolitan and local business, government, nonprofit, and university officials to make connections between immigrant workers and local labor gaps. In addition, they would help iden-tify local avenues for potential economic development and entrepreneurial activities. Ultimately state-level commissions would provide analyses and findings to the national Standing Commission. In this way, regional needs would be identified from the source and, as each state works toward building their own robust local economies, the federal Standing Commission would benefit from these resources too.

BROOKINGS | June 201120
Some states already have commissions or partnerships that could be tasked with analyzing regional needs. For example, the short-term Commission to Study the Impact of Immigrants in Maryland was authorized by that state in 2008 to “study the demographic profile of immigrants and their impact on Maryland” and includes assessments of economic and fiscal impacts, budget implications of immi-grants and their children, and constraints on immigrants and their businesses, among other issues.54 Another model, the Utah Compact, was designed to come up with state legislation that would have widespread support among law enforcement, business, community, and religious leaders. More of a political process than an economic assessment, the Compact proposed legislation that was largely an alternative response to the Arizona legislation, and ultimately may provoke as much as it provides. While neither of these models are necessarily the right ones for state-level commissions as envisioned above, they do establish that there is a need to understand immigration processes better and a desire to manage immigration at the state and local level.
2. Investing in Low-Skilled ImmigrantsThe challenges in low-skill destinations are undoubtedly plentiful, but are far from insurmountable. Lo-cal governments can implement simple, politically-neutral, and cost-effective policy changes that can improve the lives of low-skilled immigrants and those that interact with them.
We focus first on the most fundamental: English language access and training. Large shares of immigrants in low-skilled destination areas struggle linguistically, limiting employment and educational opportunities, narrowing housing options, and potentially straining the formation of relationships with U.S.-born residents. Poor language skills also complicate the delivery of public goods and services, which research shows is effective at helping to lift immigrants out of poverty.55 It is crucial then that regional leaders, particularly those in areas where low-skill immigrants predominate, work not only to craft policies that aid and encourage the formation of strong English language skills, but that they simultaneously promote service programs that reach out to immigrants in their mother tongue.
While some localities have reacted to growing immigrant populations by declaring English as the official language and mandating that all government activities and publications use English only, oth-ers, such as Montgomery County, MD in suburban Washington have developed policies to better com-municate and serve the population with limited English skills. Examples of successful programs include requiring government employees to attend language-sensitivity training, offering interpreter and translation services for public programs and services, and providing multilingual information resources and program applications.
In the digital era, a simple step state and local governments can take to assist immigrants with limited English skills is to create and maintain websites in languages other than English. Some major immigrant gateways, such as New York City (see http://www.nyc.gov/html/lg/ ) have successfully done this, but few other local governments have custom translated pages on their websites. Basic civic responsibilities that are now frequently completed online—such as registering a car, applying for busi-ness permits, paying utility bills and traffic infractions, communicating with public officials, or request-ing building or remodeling permits—can be pain-staking endeavors for those with limited English abilities. Offering these online services in multiple languages not only assist immigrants, but it fosters opportunities for immigrants to become civically engaged, and is potentially financially advantageous for local governments if they can save resources in collecting fees and dues or dedicating funds to costly translators for basic services.
The link between English ability and economic success is well established: immigrants who speak English proficiently have higher wages, more stable jobs, and greater leverage in bargaining than those with limited English skills. Local governments should therefore be active in developing language abilities for the benefit of all. Public-private partnerships, such as the Montgomery Coalition for Adult English Literacy that promotes the idea that employers deserve to have workforces that are literate in English by providing resources for employers who offer on-the-job linguistic training, are an additional model local governments could consider.56
Policymakers are frequently concerned about the potential for job competition between immigrant and native low-skilled workers. While these anxieties will undoubtedly continue, local governments may be able to develop programs to manage direct labor force competition, by having programs that are inclusive of both immigrants and U.S.-born workers. Some examples are local governments playing

BROOKINGS | June 2011 21
a more proactive role in matching low-skilled workers, regardless of nativity status, with employer demands. Potential areas of consideration include electronic portals that offer listings of employment opportunities, as well as social networking-style summaries of workers’ skills and job histories acces-sible by employers. Authorizing or even sponsoring day laborer work locations can also be effective at connecting employers and employees in a manner that promotes fair wages, safe work sites, and contractual agreements between parties. Some day labor sites run by local governments and nonprof-its offer English language instruction and other workforce training to potential workers in addition to matching employers and workers.
Investing in High-Skilled ImmigrantsImmigrant integration in high-skill destinations is also complicated by language barriers, and immi-grants with college and graduate degrees often are unable to work in their fields due to lack of English language proficiency.57 Thus, the initiatives and programs described above are likely relevant to the needs of high-skilled immigrants with limited English skills. But, as we demonstrate in this report, high-skilled immigrants could use assistance in transferring their skills to the U.S. labor markets.
We view states and local governments as being natural sources of support in facilitating better job matches for high-skilled immigrants. The types of programs we envision include training workshops on how to navigate local job markets, and resume and interview assistance. Even better would be programs that, as the Migration Policy Institute’s Jeanne Batalova and Michael Fix argue, “bridge” deficiencies in foreign-trained workers skills with the needs of U.S. employers.58 These could include a mix of language, educational, and business training targeted specifically at skilled immigrants.
These types of programs exist currently, targeting professionals and partnering with local govern-ments, non-profits, universities, and private businesses. One good example is the organization Upwardly Global, which brings together employers and workers in Chicago, New York and San Francisco. They work with immigrants to integrate them into the mainstream workforce by preparing them for the specifics of their job markets and helping them develop networks. And, they work with employers who value immigrant workers to reach into this labor pool. Similarly, the Welcome Back Initiative works with immigrant health professionals on licensing, language and marketing information to find jobs in U.S. communities.
In addition, non-profits such as Global Detroit and Global Pittsburgh aim to attract high-skilled immi-grant workers. Using strategies to internationalize those metro areas, such as marketing the regions as immigrant-friendly, retaining international university students, and boosting foreign direct investment, allow local areas to reach out to immigrants in an effort to grow their international communities, their economies and their resident populations.
Conclusion
The new geography of immigration raises many questions about the stock and flow of high- and low-skilled immigrants and how local and state governments can respond. The human capital that immigrants offer, including what they gain while living in the United States, is an important dimension of contemporary immigration. And while low-skilled immigration has
grown steeply over the last several decades, research has all but overlooked the fact that high-skilled immigration has grown dramatically.
Our findings point to several reasons why the perception persists that most immigrants are low-skilled. They make up an increasing share of the low-skilled labor force as the share of U.S.-born workers with no high school degree dwindles. In 1994, 73 percent of working-age adults without a high school degree were born in the United States; 15 years later, U.S.-born residents made up only 53 per-cent of those without a high school degree. In addition, lower- skilled immigrants dominate flows into new destinations, and the visibility of these newcomers changes the dynamic in areas that have never dealt with immigration. This group of new immigrants is more likely to be from Latin America, less likely to speak English well, and more likely to be unauthorized These prominent features have received a lot of attention from local leaders and media alike, and usually not the favorable kind. These popular depic-tions add to the pressure that elected officials face—compounded in recessionary times with diminishing

BROOKINGS | June 201122
resources and budgets cuts—to reduce spending. Expenses associated with immigrants, frequently couched as illegal immigrants, is often one of the first places that local leaders look for savings.
Immigrants and the role they will play in the future U.S. labor force are ultimately linked to demo-graphic transformations currently underway. Recent numbers released by the U.S. Census Bureau for 2010 show how fast the U.S. racial and ethnic composition is changing due to the rapid growth of Latino and Asian populations, through both immigration and natural increase. One-in-six U.S. residents is now Latino, and that group represented one half of the population growth during the 2000s when nearly 15 million Hispanics were added to the population. Asians make up less than 5 percent of the population, but grew by 43 percent between 2000 and 2010, the same pace as Latinos. Contrast those rates with growth rates for whites (1.2 percent) and blacks (11 percent).
The acceleration of ethnic diversity is even more striking in the child population, where one-in-four children are Latino. Indeed, population projections put the Hispanic population as the major source of growth over the next several decades, so that by 2050, nearly one-third of the total U.S. population will be Latino.59 These statistics underscore the need to ensure that this generation of immigrants suc-ceeds so that their children will be well prepared to participate in the U.S. labor market, which is tied to the increasingly competitive globalized market. With a large and aging native population, the edu-cational attainment of the children of immigrants is one of the most pressing issues of the moment.
Understanding what the future holds for different metropolitan areas due to compositional differ-ences is also of central importance. Immigrant networks and chain migration may reinforce existing skill profiles. But professional and high-tech industrial growth may create demand not only for high-skill immigrants, but also for cheap, low-skill immigrant labor in construction and service-oriented work, ultimately leading to a convergence in skill ratios across destinations over time and the array of service needs that come with that mix.
Anti-immigrant rhetoric dominates political and policy discussions around immigration. As metro-politan areas begin recovering from the recession and local economies begin to grow, immigrants will continue to be in the spotlight. We urge policymakers to address this important issue pragmatically and rationally to ensure that local economies and the U.S. economy prosper.

BROOKINGS | June 2011 23
Appen
dix
Table
1. Im
mig
rant
Popu
lati
on
, G
ate
way
Ty
pe,
an
d I
mm
igra
nt
Ski
ll P
rofi
les
in
10
0 L
arg
est
Met
ropolita
n A
reas,
20
09
Imm
igra
nt
Per
cent
Im
mig
rant
Ski
lls
M
etro
polita
n a
rea
Gate
way
Ty
pe
Popu
lati
on
Im
mig
rant
Low
Ski
ll
Mid
Ski
ll
Hig
h S
kill
Ski
ll R
ati
o
Ski
ll T
ype
Akr
on
, OH
L
ow Im
mig
rati
on
Met
ro
25,167
3.6
4,54
89,076
6,289
138
Hig
h
Alb
any-
Sch
enec
tad
y-Tr
oy, N
Y
Low
Imm
igra
tio
n M
etro
59
,321
6.9
8,60
519,584
19,087
222
Hig
h
Alb
uq
uer
qu
e, N
M
Low
Imm
igra
tio
n M
etro
82
,986
9.7
30,904
25,410
11,997
39
Low
Alle
nto
wn
-Bet
hle
hem
-Eas
ton
, PA
-NJ
L
ow Im
mig
rati
on
Met
ro
63,174
7.7
11,800
24,468
17,859
151
Hig
h
Atl
anta
-San
dy
Sp
rin
gs-
Mar
iett
a, G
A
Em
erg
ing
71
3,33
313
.0
152,79
9238,983
182,534
119
Bal
ance
d
Au
gu
sta-
Ric
hm
on
d C
ou
nty
, GA
-SC
L
ow Im
mig
rati
on
Met
ro
18,490
3.4
3,36
05,517
6,124
182
Hig
h
Au
stin
-Ro
un
d R
ock
, TX
E
mer
gin
g
249,24
014
.6
81,210
63,559
59,523
73
Low
Bak
ersfi
eld
, CA
M
ino
r-C
on
tin
uo
us
159,21
819
.7
76,512
43,611
10,176
13
Low
Bal
tim
ore
-Tow
son
, MD
R
e-E
mer
gin
g
222,67
88.3
31,546
66,729
87,965
279
Hig
h
Bat
on
Ro
ug
e, L
A
Low
Imm
igra
tio
n M
etro
24
,979
3.2
5,71
26,830
7,275
127
Hig
h
Bir
min
gh
am-H
oov
er, A
L
Low
Imm
igra
tio
n M
etro
45
,320
4.0
9,69
514,335
11,866
122
Bal
ance
d
Bo
ise
Cit
y-N
ampa
, ID
L
ow Im
mig
rati
on
Met
ro
44,829
7.5
13,548
14,030
7,277
54
Low
Bo
sto
n-C
amb
rid
ge-
Qu
incy
, MA
-NH
M
ajo
r-C
on
tin
uo
us
726,53
615
.8
140,77
0251,697
226,802
161
Hig
h
Bra
den
ton
-Sar
aso
ta-V
enic
e, F
L
Low
Imm
igra
tio
n M
etro
83
,398
12
.1
15,036
36,973
20,063
133
Hig
h
Bri
dg
epo
rt-S
tam
ford
-No
rwal
k, C
T
Min
or-
Co
nti
nu
ou
s 17
7,76
719
.7
35,511
66,433
46,762
132
Hig
h
Bu
ffal
o-N
iag
ara
Falls
, NY
Fo
rmer
64
,115
5.7
11,246
21,735
18,698
166
Hig
h
Cap
e C
ora
l-Fo
rt M
yers
, FL
P
re-E
mer
gin
g
84,957
14
.5
19,901
35,401
14,421
72
Low
Ch
arle
sto
n-N
ort
h C
har
lest
on
-Su
mm
ervi
lle, S
C
Low
Imm
igra
tio
n M
etro
32
,501
4.9
5,80
711,604
8,625
149
Hig
h
Ch
arlo
tte-
Gas
ton
ia-C
on
cord
, NC
-SC
P
re-E
mer
gin
g
167,42
39.6
42,762
52,874
39,059
91
Bal
ance
d
Ch
atta
no
og
a, T
N-G
A
Low
Imm
igra
tio
n M
etro
17
,599
3.4
3,93
95,754
4,235
108
Bal
ance
d
Ch
icag
o-N
aper
ville
-Jo
liet,
IL-I
N-W
I M
ajo
r-C
on
tin
uo
us
1,64
5,92
017
.2
437,83
3590,265
386,882
88
Bal
ance
d
Cin
cin
nat
i-M
idd
leto
wn
, OH
-KY
-IN
L
ow Im
mig
rati
on
Met
ro
81,693
3.8
11,155
23,286
30,663
275
Hig
h
Cle
vela
nd
-Ely
ria-
Men
tor,
OH
Fo
rmer
11
6,19
25.6
20,646
45,966
34,820
169
Hig
h
Co
lora
do
Sp
rin
gs,
CO
L
ow Im
mig
rati
on
Met
ro
43,359
6.9
9,14
318,786
8,347
91
Bal
ance
d
Co
lum
bia
, SC
L
ow Im
mig
rati
on
Met
ro
32,514
4.4
6,39
78,673
10,114
158
Hig
h
Co
lum
bu
s, O
H
Pre
-Em
erg
ing
12
4,08
36.9
18,105
40,868
39,727
219
Hig
h
Dal
las-
Fort
Wo
rth
-Arl
ing
ton
, TX
P
ost
-WW
II 1,14
2,12
217
.7
421,77
1308,663
201,605
48
Low
Day
ton
, OH
L
ow Im
mig
rati
on
Met
ro
25,247
3.0
2,84
68,819
9,398
330
Hig
h
Den
ver-
Au
rora
, CO
R
e-E
mer
gin
g
301,66
811
.8
94,872
90,404
58,869
62
Low
Des
Mo
ines
-Wes
t D
es M
oin
es, I
A
Low
Imm
igra
tio
n M
etro
37
,400
6.6
8,87
212,478
8,548
96
Bal
ance
d
Det
roit
-War
ren
-Liv
on
ia, M
I Fo
rmer
39
3,49
98.9
83,226
124,954
119,657
144
Hig
h
El P
aso,
TX
M
ino
r-C
on
tin
uo
us
190,46
525
.4
84,792
63,233
22,279
26
Low
Fres
no,
CA
M
ino
r-C
on
tin
uo
us
196,12
021
.4
94,510
46,116
21,293
23
Low
Gra
nd
Rap
ids-
Wyo
min
g, M
I L
ow Im
mig
rati
on
Met
ro
48,723
6.3
15,847
14,268
8,108
51
Low
Gre
ensb
oro
-Hig
h P
oin
t, N
C
Pre
-Em
erg
ing
56
,393
7.9
15,959
17,531
9,120
57
Low
Gre
envi
lle-M
auld
in-E
asle
y, S
C
Low
Imm
igra
tio
n M
etro
43
,199
6.8
12,157
12,645
9,807
81
Bal
ance
d
Har
risb
urg
-Car
lisle
, PA
L
ow Im
mig
rati
on
Met
ro
24,125
4.5
3,55
08,784
8,189
231
Hig
h
Har
tfo
rd-W
est
Har
tfo
rd-E
ast
Har
tfo
rd, C
T
Min
or-
Co
nti
nu
ou
s 14
8,50
712
.4
26,527
60,688
36,582
138
Hig
h

BROOKINGS | June 201124
Appen
dix
Table
1. Im
mig
rant
Popu
lati
on
, G
ate
way
Ty
pe,
an
d I
mm
igra
nt
Ski
ll P
rofi
les
in
10
0 L
arg
est
Met
ropolita
n A
reas,
20
09
(co
nti
nu
ed)
Imm
igra
nt
Per
cent
Im
mig
rant
Ski
lls
M
etro
polita
n a
rea
Gate
way
Ty
pe
Popu
lati
on
Im
mig
rant
Low
Ski
ll
Mid
Ski
ll
Hig
h S
kill
Ski
ll R
ati
o
Ski
ll T
ype
Ho
no
lulu
, HI
Min
or-
Co
nti
nu
ou
s 17
4,12
4
19.2
29
,58
5
83,
791
40
,46
4
137
H
igh
Ho
ust
on
-Su
gar
Lan
d-B
ayto
wn
, TX
P
ost
-WW
II 1,27
8,41
321
.8
448,87
7370,177
235,140
52
Low
Ind
ian
apo
lis-C
arm
el, I
N
Low
Imm
igra
tio
n M
etro
10
1,28
15.8
27,034
24,730
23,997
89
Bal
ance
d
Jac
kso
n, M
S
Low
Imm
igra
tio
n M
etro
12
,707
2.3
3,27
32,586
3,860
118
Bal
ance
d
Jac
kso
nvill
e, F
L
Low
Imm
igra
tio
n M
etro
10
6,02
98.0
13,473
44,935
30,103
223
Hig
h
Kan
sas
Cit
y, M
O-K
S
Low
Imm
igra
tio
n M
etro
11
9,15
25.8
30,619
38,096
26,063
85
Bal
ance
d
Kn
oxvi
lle, T
N
Low
Imm
igra
tio
n M
etro
22
,249
3.2
4,40
45,475
7,562
172
Hig
h
Lak
elan
d-W
inte
r H
aven
, FL
P
re-E
mer
gin
g
59,791
10
.2
19,343
23,264
7,154
37
Low
Las
Veg
as-P
arad
ise,
NV
E
mer
gin
g
416,21
421
.9
130,09
6157,276
63,367
49
Low
Lit
tle
Ro
ck-N
ort
h L
ittl
e R
ock
-Co
nway
, AR
L
ow Im
mig
rati
on
Met
ro
23,884
3.5
6,76
86,516
6,091
90
Bal
ance
d
Lo
s A
ng
eles
-Lo
ng
Bea
ch-S
anta
An
a, C
A
Po
st-W
WII
4,43
4,01
234
.4
1,47
7,20
11,507,441
919,667
62
Low
Lo
uis
ville
-Jef
fers
on
Co
un
ty, K
Y-I
N
Low
Imm
igra
tio
n M
etro
51
,995
4.1
9,29
417,319
11,058
119
Bal
ance
d
Mad
iso
n, W
I L
ow Im
mig
rati
on
Met
ro
35,673
6.3
4,72
610,381
12,243
259
Hig
h
McA
llen
-Ed
inb
urg
-Mis
sio
n, T
X
Min
or-
Co
nti
nu
ou
s 21
4,75
829
.0
106,34
351,252
19,218
18
Low
Mem
ph
is, T
N-M
S-A
R
Low
Imm
igra
tio
n M
etro
61
,458
4.7
15,410
17,798
15,850
103
Bal
ance
d
Mia
mi-
Fort
Lau
der
dal
e-P
om
pan
o B
each
, FL
P
ost
-WW
II 2,05
9,17
037
.1
458,83
7926,746
422,811
92
Bal
ance
d
Milw
auke
e-W
auke
sha-
Wes
t A
llis,
WI
Form
er
107,64
06.9
27,797
34,079
26,654
96
Bal
ance
d
Min
nea
po
lis-S
t. P
aul-
Blo
om
ing
ton
, MN
-WI
Re-
Em
erg
ing
29
6,93
29.1
61,813
89,425
77,103
125
Hig
h
Mo
des
to, C
A
Min
or-
Co
nti
nu
ou
s 10
6,68
420
.9
44,962
31,753
9,584
21
Low
Nas
hvill
e-D
avid
son
--M
urf
rees
bo
ro--
Fran
klin
, TN
P
re-E
mer
gin
g
113,41
87.2
25,132
37,358
24,926
99
Bal
ance
d
New
Hav
en-M
ilfo
rd, C
T
Min
or-
Co
nti
nu
ou
s93
,907
11
.1
16,963
36,654
27,535
162
Hig
h
New
Orl
ean
s-M
etai
rie-
Ken
ner
, LA
L
ow Im
mig
rati
on
Met
ro
83,394
7.0
19,988
35,544
15,891
80
Bal
ance
d
New
Yo
rk-N
ort
her
n N
ew J
erse
y-L
on
g Is
lan
d,
N
Y-N
J-P
A
Maj
or-
Co
nti
nu
ou
s 5,27
1,23
827
.6
1,20
0,04
72,029,319
1,378,929
115
Bal
ance
d
Og
den
-Cle
arfi
eld
, UT
L
ow Im
mig
rati
on
Met
ro
31,136
5.7
9,52
911,548
4,048
42
Low
Okl
aho
ma
Cit
y, O
K
Low
Imm
igra
tio
n M
etro
88
,693
7.2
28,307
26,406
16,743
59
Low
Om
aha-
Co
un
cil B
luff
s, N
E-IA
L
ow Im
mig
rati
on
Met
ro
56,429
6.6
17,652
15,077
10,205
58
Low
Orl
and
o-K
issi
mm
ee, F
L
Em
erg
ing
32
8,49
915
.8
58,869
147,867
68,447
116
Bal
ance
d
Oxn
ard
-Th
ou
san
d O
aks-
Ven
tura
, CA
M
ino
r-C
on
tin
uo
us
183,44
422
.8
65,454
59,396
33,321
51
Low
Pal
m B
ay-M
elb
ou
rne-
Tit
usv
ille,
FL
L
ow Im
mig
rati
on
Met
ro
45,384
8.5
5,01
325,248
9,450
189
Hig
h
Ph
ilad
elp
hia
-Cam
den
-Wilm
ing
ton
, PA
-NJ
-DE-
MD
R
e-E
mer
gin
g
553,92
19.3
100,34
5186,612
174,278
174
Hig
h
Ph
oen
ix-M
esa-
Sco
ttsd
ale,
AZ
E
mer
gin
g
671,81
715
.4
225,55
8227,481
105,230
47
Low
Pit
tsb
urg
h, P
A
Form
er
70,918
3.0
7,80
618,596
30,542
391
Hig
h
Po
rtla
nd
-So
uth
Po
rtla
nd
-Bid
def
ord
, ME
L
ow Im
mig
rati
on
Met
ro
20,384
3.9
2,40
58,414
4,979
207
Hig
h
Po
rtla
nd
-Van
cou
ver-
Bea
vert
on
, OR
-WA
R
e-E
mer
gin
g
270,09
912
.0
63,971
93,105
63,471
99
Bal
ance
d
Po
ug
hke
epsi
e-N
ewb
urg
h-M
idd
leto
wn
, NY
L
ow Im
mig
rati
on
Met
ro
75,227
11
.1
15,653
28,363
19,793
126
Hig
h
Pro
vid
ence
-New
Bed
ford
-Fal
l Riv
er, R
I-M
A
Form
er
200,64
112
.5
69,120
77,929
29,109
42
Low
Pro
vo-O
rem
, UT
L
ow Im
mig
rati
on
Met
ro
36,409
6.6
6,05
211,268
7,786
129
Hig
h

BROOKINGS | June 2011 25
Appen
dix
Table
1. Im
mig
rant
Popu
lati
on
, G
ate
way
Ty
pe,
an
d I
mm
igra
nt
Ski
ll P
rofi
les
in
10
0 L
arg
est
Met
ropolita
n A
reas,
20
09
(co
nti
nu
ed)
Imm
igra
nt
Per
cent
Im
mig
rant
Ski
lls
M
etro
polita
n a
rea
Gate
way
Ty
pe
Popu
lati
on
Im
mig
rant
Low
Ski
ll
Mid
Ski
ll
Hig
h S
kill
Ski
ll R
ati
o
Ski
ll T
ype
Ral
eig
h-C
ary,
NC
P
re-E
mer
gin
g
125,92
011
.2
29,063
32,993
40,347
139
Hig
h
Ric
hm
on
d, V
A
Low
Imm
igra
tio
n M
etro
76
,347
6.2
15,260
24,599
22,200
145
Hig
h
Riv
ersi
de-
San
Ber
nar
din
o-O
nta
rio,
CA
P
ost
-WW
II 88
3,15
021
.3
323,27
3325,415
124,624
39
Low
Ro
ches
ter,
NY
M
ino
r-C
on
tin
uo
us
65,141
6.3
12,396
24,583
17,404
140
Hig
h
Sac
ram
ento
--A
rden
-Arc
ade-
-Ro
sevi
lle, C
A
Re-
Em
erg
ing
36
1,59
617
.0
97,198
129,637
75,964
78
Bal
ance
d
St.
Lo
uis
, MO
-IL
Fo
rmer
11
3,74
24.0
13,307
34,217
40,573
305
Hig
h
Sal
t L
ake
Cit
y, U
T
Pre
-Em
erg
ing
12
3,04
410
.9
34,877
44,410
18,521
53
Low
San
An
ton
io, T
X
Min
or-
Co
nti
nu
ou
s 23
3,56
011
.3
82,256
78,846
36,661
45
Low
San
Die
go
-Car
lsba
d-S
an M
arco
s, C
A
Po
st-W
WII
694,23
822
.7
201,43
6236,473
160,775
80
Bal
ance
d
San
Fra
nci
sco
-Oak
lan
d-F
rem
on
t, C
A
Maj
or-
Co
nti
nu
ou
s1,27
3,78
029
.5
289,40
6433,327
415,036
143
Hig
h
San
Jo
se-S
un
nyva
le-S
anta
Cla
ra, C
A
Re-
Em
erg
ing
65
3,23
635
.5
132,14
0187,790
254,532
193
Hig
h
Scr
anto
n--
Wilk
es-B
arre
, PA
L
ow Im
mig
rati
on
Met
ro
20,310
3.7
5,31
96,679
3,985
75
Bal
ance
d
Sea
ttle
-Tac
om
a-B
elle
vue,
WA
R
e-E
mer
gin
g
535,48
115
.7
93,206
182,633
169,901
182
Hig
h
Sp
rin
gfi
eld
, MA
L
ow Im
mig
rati
on
Met
ro
56,504
8.1
11,279
24,090
10,990
97
Bal
ance
d
Sto
ckto
n, C
A
Min
or-
Co
nti
nu
ou
s 16
0,21
623
.7
64,041
50,755
20,854
33
Low
Syr
acu
se, N
Y
Low
Imm
igra
tio
n M
etro
34
,044
5.3
4,98
512,243
9,949
200
Hig
h
Tam
pa-S
t. P
eter
sbu
rg-C
lear
wat
er, F
L
Re-
Em
erg
ing
31
9,05
211
.6
66,210
139,491
70,268
106
Bal
ance
d
Tole
do,
OH
L
ow Im
mig
rati
on
Met
ro
20,642
3.1
3,76
76,629
5,828
155
Hig
h
Tucs
on
, AZ
M
ino
r-C
on
tin
uo
us
137,21
413
.4
38,641
50,648
22,536
58
Low
Tuls
a, O
K
Low
Imm
igra
tio
n M
etro
49
,894
5.4
15,107
15,822
7,862
52
Low
Vir
gin
ia B
each
-No
rfo
lk-N
ewp
ort
New
s, V
A-N
C
Low
Imm
igra
tio
n M
etro
97
,853
5.8
11,345
44,351
26,287
232
Hig
h
Was
hin
gto
n-A
rlin
gto
n-A
lexa
nd
ria,
DC
-VA
-MD
-WV
P
ost
-WW
II 1,10
3,27
120
.1
198,94
4349,705
375,164
189
Hig
h
Wic
hit
a, K
S
Low
Imm
igra
tio
n M
etro
37
,732
6.1
11,118
14,112
6,737
61
Low
Wo
rces
ter,
MA
M
ino
r-C
on
tin
uo
us
90,140
11
.2
14,834
33,412
27,775
187
Hig
h
You
ng
stow
n-W
arre
n-B
oar
dm
an, O
H-P
A
Low
Imm
igra
tio
n M
etro
12
,363
2.2
2,29
65,464
3,033
132
Hig
h
No
tes:
Dat
a fr
om
20
09
Am
eric
an C
om
mu
nit
y S
urv
ey; “
Ski
ll R
atio
” is
th
e ra
tio
of
hig
h-s
kille
d t
o lo
w-s
kille
d im
mig
ran
ts (
mu
ltip
lied
by
100
)

BROOKINGS | June 201126
Endnotes
1. The authors’ affiliations are as follows: Matthew Hall,
Institute of Government and Public Affairs and Department
of Sociology, University of Illinois-Chicago; Audrey
Singer, The Brookings Institution; Gordon F. De Jong,
Department of Sociology and Population Research Institute
Pennsylvania State University; and Deborah Roempke
Graefe, Population Research Institute Pennsylvania State
University.
2. U.S. Congressional Budget Office, “The role of Immigrants
in the U.S. Labor Market: An Update” (2010).
3. Randy Capps, Michael Fix and Serena Yi-Ying Lin, 2010,
“Still an Hourglass?: Immigrant Workers in Middle-Skilled
Jobs,” Washington D.C.: Migration Policy Institute.
4. Audrey Singer and Jill H. Wilson. 2010. “The Impact of the
Great Recession on Metropolitan Immigration Trends,”
State of Metropolitan Area #22. Washington D.C.: Brookings
Institution.
5. Among the 463,042 immigrants who arrived to the United
States in 2009 with legal permanent resident (LPR) status,
only 3.6% were granted for employment-based reasons vs.
86.1% of new LPRs being based on family reasons (family
sponsorship or being the immediate relative of a U.S.
citizen). Of the nearly 3.5 million short-term visas allotted
in 2009, half (49.6%) were to temporary workers and
their families (for more information see, U.S. Department
of Homeland Security. 2009. Yearbook of Immigration
Statistics: 2009. Washington, D.C.: U.S. Department of
Homeland Security.)
6. Elźbieta M. Goździak and Susan F. Martin, 2005. Beyond
the Gateway: Immigrants in a Changing America. Lanham,
MD: Lexington Books; Daniel T. Lichter and Kenneth
M. Johnson. 2009. “Immigrant Gateways and Hispanic
Migration to New Destinations.” International Migration
Review 43: 496-518; Douglas. Massey 2008. New Faces in
New Places: The New Geography of American Immigration.
New York: Russell Sage Foundation; Audrey Singer 2005.
“The Rise of New Immigrant Gateways.” In Alan Berube,
Bruce Katz, and Robert E. Lang (eds.), Redefining Urban
and Suburban America: Evidence from Census 2000,
Volume 2. Washington, D.C.: Brookings Institution.; Audrey
Singer. 2009. “The New Geography of United States
Immigration.” Washington, D.C.: Brookings Institution;
Audrey Singer, Susan W. Hardwick, 2008, and Caroline
B. Brettell (Eds.). 2008. Twenty-First Century Gateways:
Immigrant Incorporation in Suburban America. Washington,
D.C.: Brookings Institution.; Victor Zuniga and Ruben
Hernandez-Leon (Eds.). 2005. New Destinations: Mexican
Immigration in the United States. New York: Russell Sage
Foundation.
7. Ana Campoy, “Newcomers Test Schools,” Wall Street
Journal, January 28, 2010; Alex Kotlowitz, “Our Town,”
New York Times, August 5, 2007; Charisse Jones,
“Immigration fuels housing battles,” USA Today, January
31, 2006; Ernesto Londoño and Karin Brulliard, “Liberal
Suburbs Don’t Avoid Heated Debates on Immigration,” The
Washington Post, August 18, 2007; (no byline), “Into the
Suburbs” The Economist, March 11, 2004.
8. Michael Piore. 1979. Birds of Passage: Migrant Labor in
Industrial Societies. Cambridge: Cambridge University
Press; Stephen Castles and Mark Miller. 1998. Age of
Migration: International Population Movements in the
Modern World. New York: Guilford Press.
9. Matthew Hall and George Farkas. 2008. “Does Human
Capital Raise Earnings for Immigrants in the Low-Skill
Labor Market?” Demography 45: 619-39; Matthew Hall,
Emily Greenman, and George Farkas. 2010. “Legal Status
and Wage Disparities for Mexican Immigrants.” Social
Forces 39; Douglas S. Massey, Jorge Durand, and Nolan
J. Malone. 2002. Beyond Smoke and Mirrors: Mexican
Immigration in an Era of Economic Integration. New York:
Russell Sage Foundation; Pia M. Orrenius and Madeline
Zavodny. 2009. “Do Immigrants Work in Riskier Jobs?”
Demography 46: 535-51; Roger Waldinger and Michael
Lichter. 2003. How the Other Half Works: Immigration and
the Social Organization of Labor. Berkeley, CA: University
of California Press; John Iceland. 2009. Where We Live
Now: Immigration and Race in the United States. Berkeley:
University of California Press.
10. Jeffrey S. Passel and D’Vera Cohn. 2009. “A Portrait
of Unauthorized Immigrants in the United States.” Pew
Hispanic Center, April 14.
11. See Gianmarco I.P. Ottaviano and Giovanni Peri. 2006.
“Rethinking the Effects of Immigration on Wages,” NBER
Working Paper #12497 http://www.nber.org/papers/
w12497.pdf and Heidi Shierholz, “Immigration and Wages:
Methodological advancements confirm modest gains for
native workers,” Washington: Economic Policy Institute,
2010. http://epi.3cdn.net/81ac21ed8143664879_wvm-
6bakyu.pdf
12. Helen Marrow. 2009. “New Immigrant Destinations and
the American Color Line.” Ethnic and Racial Studies
32: 1037-57; William Julius Wilson and Richard P. Taub.
2006. There Goes the Neighborhood: Racial, Ethnic, and

BROOKINGS | June 2011 27
Class Tensions in Four Chicago Neighborhoods and Their
Meaning for America. New York, NY: Knopf; Jamie Winders.
2008. “Nashville’s New “Sonido”: Latino Migration and
the Changing Politics of Race.” Pp. 249-73 in Douglas
Massey (ed.), New Faces in New Places: The Changing
Geography of American Immigration. New York, NY: Russell
Sage Foundation; Edward S. Shihadeh and Raymond E.
Barranco. 2010. “Latino Employment and Black Crime: The
Unintended Consequence of U.S. Immigration Policy.” Social
Forces 88: 1393-142
13. Jeanne Batalova and Michael Fix. 2008. Uneven Progress:
The Employment Pathways of Skilled immigrants in the
United States. Washington DC: Migration Policy Institute.
14. The 2010 Census did not include a question on birthplace,
which is where immigrant status is derived in previous
decennial census years. Therefore, we rely on the ACS for
the most recent estimates of the foreign-born.
15. The 2009 ACS surveyed about 3 million households
nationwide and reports estimates for geographic areas with
populations of 65,000 or more.
16. These 3-year estimates from the American Community
Survey allow for examination of smaller populations (i.e.
the foreign-born). They are pooled data collected over a
36-month period, during 2006, 2007 and 2008.
17. Michael Hoefer, Nancy Rytina, and Christopher Campbell.
2007. “Estimates of the Unauthorized Immigrant
Population Residing in the United States: January 2006.”
Population Estimates, Office of Immigration Statistics.
Washington DC: Department of Homeland Security. In areas
with a large unauthorized population, this undercoverage
is thus problematic. Given the tendency for immigrants
to co-reside, the undercount rate may be higher in areas
with high unauthorized populations. While we are not
able to correct our estimates for this lack of coverage,
we reanalyzed our data excluding metro areas where this
concern is particularly salient (e.g., the four “border cities”
in our sample: El Paso, McAllen-Edinburg-Mission, San
Diego-Carlsbad-San Marcos, and Tucson), and found no
substantive differences with the results presented here.
Nevertheless, readers should be aware that the undocu-
mented population, most of whom are low-skilled, are likely
underrepresented in our estimates of both the size and skill
distribution of foreign-born populations.
18. Batalova and Fix 2008
19. Harry Holzer, Julia I. Lane, David B. Rosenblum, and Fredrik
Andersson. 2011. Where are all the Good Jobs Going? What
National and Local Job Quality and Dynamics Mean for U.S.
Workers. New York: Russell Sage Foundation.
20. Puerto Ricans are U.S. citizens and are not considered
immigrants.
21. While there is some unevenness with how other work has
defined “low-skilled,” we follow David Card’s recent work
that compellingly argues that immigrants lacking high
school diplomas are substitutes for natives with no more
than a high school education. See David Card, “Immigration
and Inequality,” NBER Working Paper 14683, Cambridge:
National Bureau of Economic Research, 2009 http://www.
nber.org/papers/w14683.pdf?new_window=1
22. The lower age bound of 25 is necessary to afford a reason-
able time period for completing schooling. We are also con-
strained by the ACS data that tabulates education only for
those 25 years and older. Using ACS PUMS and CPS data,
the overall immigrant skill ratio is, as expected, lower when
18 to 24 year-olds are included in the calculations (1.01 for
25+ immigrants vs. 0.93 for 18+ immigrants) and, nationally,
the percent of working-age immigrants who are low-skilled
is slightly higher than the percent high-skilled when 18
to 24 years old are included (27.8 percent low-skilled for
immigrants age 25 to 64 versus 28.7 percent low-skilled for
immigrants age 18 to 64).
23. If high school graduates are included with the low-skilled,
the overall skill ratio of immigrants in the largest 100
metros drops considerably to 55.3, meaning that there
are nearly twice as many immigrants with a high school
diploma or less to those with a college degree. Importantly,
however, the general pattern of metropolitan variation
observed by our preferred definition of low-skilled immi-
grants remains intact, with former gateways having the
highest-skilled immigrant populations (skill ratio of 89.3)
and minor-continuous gateways having the least-skilled
ones (skill ratio of 40.3).
24. Historical county-level data come from Minnesota
Population Center, National Historical Geographic
Information System: Pre-release Version 0.1 (Minneapolis:
University of Minnesota, 2004). For analyses relying on
Census Public Use Microdata Samples (PUMS), the Census
Public Use Microdata Areas (PUMAs) is the lowest level of
geography identified. Spatial correspondence tools from
the Missouri Data Center are used to link PUMAs to cur-
rent metropolitan areas. For the most part, PUMAs do not
cross metro boundaries (see www.census.gov/geo/puma/
puma_guide.pdf), but for those that do, the metro area in
which the greatest share of the PUMA population is located
is assigned. Those PUMAs in which the assigned metro area

BROOKINGS | June 201128
contains less than 25 percent of the PUMA population are
excluded (N=85). After these restrictions, the mean share
of the PUMA population located in the assigned metro is 95
percent.
25. This approach to assess the histories of immigration to
metro areas differs from Singer’s earlier approach (Audrey
Singer, “The Rise of New Immigrant Gateways,” Washington,
DC: Brookings, 2004 which was based on historical data
on major center cities (i.e., New York City rather than New
York metropolitan area). Because the procedure used here
includes area outside of the central cities, estimates of
the foreign-born populations are larger, but percentage
foreign-born smaller than those used in Singer’s typology
(e.g., in 1900 New York City had an estimated immigrant
population of 1.27 million that comprised 37 percent of the
total population, while our procedure based on current
metro boundaries finds the New York metro area to have
a 1900 foreign born population of 1.73 million and a 33
percent population share). Despite these differences, the
two estimates are highly correlated (e.g., 1900 foreign born
population, r = .98; 1900 percentage foreign born, r = .99)
and result in identical destination typology characteriza-
tion.
26. This typology was first developed in Audrey Singer, “The
Rise of New Immigrant Gateways” (Washington D.C.:
Brookings Institution, 2004).
27. In 2010, among working-aged adults, there were 8.80
million high-skilled immigrants, 12.68 million middle-skilled
immigrants, and 8.26 million low-skilled immigrants.
28. U.S. Department of Homeland Security, United States
Citizenship and Immigration Services, Report on H-1B
Petitions, various years. http://www.uscis.gov/portal/site/
uscis/menuitem.eb1d4c2a3e5b9ac89243c6a7543f6d1a/?vg
nextoid=9a1d9ddf801b3210VgnVCM100000b92ca60aRCRD
&vgnextchannel=9a1d9ddf801b3210VgnVCM100000b92ca6
0aRCRD
29. Open Doors Data, “International Students: Enrollment
Trends” Washington, D.C.: Institute of International
Education, 2010. http://www.iie.org/en/Research-and-
Publications/Open-Doors/Data/International-Students/
Enrollment-Trends/1948-2010
30. While data about such adjustments in status are not
readily available, B. Lindsay Lowell has estimated that
approximately 7% of foreign students adjusted to LPR
status directly, and that an additional 7% to 8% of stu-
dents adjusted to LPR status from an H visa. In addition,
he estimated that about half of all H-1Bs became legal
permanent residents. See B. Lindsay Lowell, “Foreign
Student Adjustment to Permanent Status in the United
States,” Presentation at the International Metropolis
Conference, Toronto, 2005, and B. Lindsay Lowell, “H-1B
Temporary Workers: Estimating the Population,” University
of California San Diego: The Center for Comparative
Immigration Studies, 2000 http://www.ccis-ucsd.org/
PUBLICATIONS/wrkg12.PDF.
31. For example, Michigan’s New Economy Initiative, aims to
make the region more welcoming to high-skilled immi-
grants http://neweconomyinitiative.cfsem.org/blog/global-
detroit-tapping-the-economic-potential-of-immigrants;
Global Pittsburgh whose mission statement is “Actively
marketing & promoting the Pittsburgh region and its many
international connections around the world” http://www.
globalpittsburgh.org/ and the Global Cleveland Initiative,
which encourages people from all over the world to live and
work in the area http://blog.cleveland.com/metro/2011/04/
welcome_center_opens_arms_to_n.html
32. See Singer, “The Rise of New Immigrant Gateways.” The
typology is based on various thresholds of the size and
share of the immigrant population during the 20th century.
Using metropolitan area definitions (the original was based
on cities) and incorporating more recent data for the
2000s, we also update the status of metropolitan areas
in the original typology. The extended time period of the
typology results in a few metropolitan areas shifting from
one category to another, reflecting the dynamic growth of
immigrant populations at the metropolitan level. For exam-
ple, several metro areas (Washington, Dallas-Fort Worth)
were originally identified as emerging gateways are re-
designated as post-WWII. In addition, Baltimore moved from
former to re-emerging, Austin moved from pre-emerging
to emerging, and several metros not in the original analysis
due to population size appear in the former (Providence)
and pre-emerging (Cape Coral, Columbus, Lakeland) lists. In
addition, an altogether new category, the minor-continuous
gateways was added to designate smaller but stable
immigrant populations in 15 metro areas (as compared to
their major continuous counterparts). Complete threshold
criteria for all gateway types is available from the authors.
33. Singer, Hardwick, Brettell 2008.
34. Page 18 in William H. Frey, “Immigration and Domestic
Migration in US Metro Areas: 2000 and 1990 Census
Findings by Education and Race.” Research Report 05-572,
Population Studies Center, University of Michigan, 2005.
35. Audrey Singer and Jill H. Wilson, “From ‘Here’ to ‘There:’
Refugee Resettlement in Metropolitan America,”
Washington, D.C.: Brookings Institution, 2006.

BROOKINGS | June 2011 29
36. See Table 4 in Karina Fortuny, Randy Capps, and Jeffrey
S. Passel. 2007. The Characteristics of Unauthorized
Immigrants in California, Los Angeles County, and the
United States. Urban Institute: Washington, D.C.
37. The original typology of immigrant gateways placed
Washington in the category of emerging immigrant
gateways. However, one decade later, it is clear from the
size and rate of growth that metropolitan Washington
(along with the Dallas-Fort Worth metropolex) has fully
emerged as a gateway and now is classified as Post-WWII.
See, Audrey Singer, “The Rise of Immigrants Gateways,”
Washington, D.C.: Brookings Institution, 2004 and Audrey
Singer, 2003, “At Home in the Nation’s Capital: Immigrant
Trends in Metropolitan Washington.” Washington, D.C.:
Brookings Institution.
38. We use the 2006-2008 ACS 3- year estimates here.
39. Immigrants who respond to the ACS that they speak
English “only” or “very well” are considered proficient.
40. Exceptions include Chicago with a long history of settling
Mexican immigrants and nearby Milwaukee, as well as San
Francisco and Los Angeles.
41. Barry R. Chiswick and Paul W. Miller. 2005. “Do Enclaves
Matter in Immigrant Adjustment?” City & Community 4:
5-35; Sean-Shong Hwang and Juan Xi. 2008. “Structural
and Individual Covariates of English Language Proficiency.”
Social Forces 86: 1079-104.
42. We use the 2006-2008 ACS three- year estimates here.
43. Excluding individuals out of the labor force from this calcu-
lation increases employment rates considerably: to 93.5%
and 87.1% for low-skilled immigrants and natives, respec-
tively, and to 96.6% and 97.4% for high-skilled immigrants
and natives, respectively.
44. Summarizing earnings based on medians (rather than
means) produce native-immigrant differences similar in
size. Given the positive skew of the distribution, the median
earnings of high-skilled workers are substantially lower
than the reported means ($53,394 for immigrants; $59,190
for natives).
45. Batalova and Fix 2008.
46. Overqualification is measured by first finding the mean
educational attainment, and its standard deviation, for all
detailed occupations in the country, based on ACS data.
Individual workers’ level of education is compared to these
occupation-specific means and if a worker’s educational
attainment is one or more standard deviations above the
mean education for their occupation, they are considered
“overqualified.” Workers with educational attainments 2 or
more standard deviations above the mean are considered
“greatly overqualified.” Given the low level of education
in the low-skilled immigrant population, no low-skilled immi-
grant workers in the ACS are overqualified, according to
this operationalization.
47. These results are consistent with an analysis of occupa-
tional status of immigrant workers in Fiscal Policy Institute,
“Across the Spectrum: the Wide Range of Job Immigrants
Do,” New York: Fiscal Policy Institute, 2010. http://www.
fiscalpolicy.org/FPI_ImmigrantsAndOccupationalDiversity.
pdf.
48. Batalova and Fix 2008.
49. National Conference of State Legislatures, “2010
Immigration-Related Laws and Resolutions in the States
(January 1 - December 31, 2010),” http://www.ncsl.org/
default.aspx?tabid=21857
50. Progressive States Network, The Anti-Immigrant Movement
that Failed, 2008.
51. In 2006, Hazleton, PA passed the “Illegal Immigration
Relief Act” designed to make Hazleton inhospitable to
illegal immigrants and those who did business with them by
making it illegal to rent or employ anyone without status,
and in 2007 Prince William County, VA passed a resolution
that ordered local police to check the residency status
of lawbreakers if there was “probable cause” to believe
they were present illegally among other provisions (see
Singer, Hardwick and Brettell, 2008 and Singer, Wilson,
and DeRenzis, “Immigrants, Politics, and Local Response in
Suburban Washington,” Washington, DC: Brookings, 2009.)
52. After the US Nationality Act was amended in 1965, admis-
sions criteria switched from a national origins based system
to a categorical preference based system. Admissions were
modified again in 1976 (to include Western Hemisphere
admissions under the preference system) and then in 1978
to create an annual worldwide numerical ceiling for admis-
sions. The Immigration Act of 1990 raised the numerical
ceiling and also created the “diversity” visa among other
things. Other major acts to be adopted were the Refugee
Act of 1980 that set up a system for admitting refugees in
line with international protocols, giving the President (in
consultation with Congress) the authority to set the annual
ceiling for refugee entries. The 1986 Immigration Reform
and Control Act legalized over 3 million unauthorized immi-
grants and set in place several enforcement controls. In
1996, three consecutive acts intersected with immigration:

BROOKINGS | June 201130
The Illegal Immigration Reform and Illegal Immigrant
Responsibility Act, the Anti-Terrorism and Effective Death
Penalty Act, and the Personal Responsibility and Work
Opportunity Reconciliation Act (also known as “Welfare
Reform”).
53. See, Demetri Papdemetriou, Doris Meissner, Marc
Rosenblum, and Madeleine Sumption, “Harnessing the
Advantages of a 21st Century Economy: A Standing
Commission on Labor Markets, Economic Competitiveness,
and Immigration,” Washington DC: Migration Policy Institute
http://www.migrationpolicy.org/pubs/StandingCommission_
May09.pdf; Ray Marshall, “Immigration for Shared
Prosperity — A Framework for Comprehensive Reform,”
Washington, DC: Economic Policy Institute, 2009 http://
www.epi.org/publications/entry/book_isp/; Council on
Foreign Relations, “US Immigration Policy,” Washington,
DC: Council on Foreign Relations: 2009 http://www.cfr.org/
immigration/us-immigration-policy/p20030; The Brookings-
Duke Immigration Roundtable, “Breaking the Immigration
Stalemate: From Deep Disagreements to Constructive
Proposals, Washington, DC: Brookings, 2009, http://www.
brookings.edu/reports/2009/1006_immigration_round-
table.aspx
54. Commission To Study The Impact Of Immigrants
In Maryland : http://www.msa.md.gov/msa/
mdmanual/26excom/defunct/html/22immigrant.html
55. Matthew Hall, Deborah Graefe, and Gordon De Jong. 2010.
“Economic Self-Sufficiency among Immigrant TANF-leavers:
Welfare Eligibility as a Natural Experiment.” Social Science
Research 39: 78-91; Jennifer Van Hook and Kelly Stamper
Balistreri. 2006. “Ineligible Parents, Eligible Children: Food
Stamps Receipt, Allotments, and Food Insecurity among
Children of Immigrants.” Social Science Research 35: 228-51
56. Montgomery Coalition for Adult English Literacy http://
www.mcael.org/Index.aspx
57. Batalova and Fix, 2008
58. Batalova and Fix, 2008.
59. Kenneth M. Johnson and Daniel T. Lichter. 2010. “Growing
Diversity among America”s Children and Youth: Spatial
and Temporal Dimensions.” Population and Development
Review 36: 151-175; Jeffrey S. Passel and D’Vera Cohn,
“Immigration to Play Lead Role In Future U.S. Growth,”
Washington, DC: Pew Hispanic Center, 2008. http://pewre-
search.org/pubs/729/united-states-population-projection

BROOKINGS | June 2011 31
Acknowledgments
The authors would like to thank Jill Wilson, Courtney Pitman, and Alec Friedhoff of Brookings for their research assistance and comments and Jeanne Batalova, Alan Berube, Samantha Friedman, Beth Fussell, Shelley Irving, David Kallick, Barry Lee, Dan Lichter, Darren Lubotsky, and Howard Wial for their helpful comments. Thanks also to Brookings staffers Susan Kellam, Barbara Semedo, Amy Liu and the entire Metropolitan Policy Program communications team for their input and support.
The Metropolitan Policy Program at Brookings would like to thank the John D. and Catherine T. MacArthur Foundation, the Heinz Endowments, the F.B. Heron Foundation, and the George Gund Foundation who provide general support for the program’s research and policy efforts. We would also like to thank the Metropolitan Leadership Council, a bipartisan network of individual, cor-porate, and philanthropic investors that provide us financial support but, more importantly, are true intellectual and strategic partners. While many of these leaders act globally, they retain a commitment to the vitality of their local and regional communities, a rare blend that makes their engagement even more valuable.
For More InformationMatthew HallAssistant ProfessorUniversity of Illinois at Chicago(312) [email protected]
Audrey Singer Senior FellowMetropolitan Policy Program at Brookings(202) 797-6241 [email protected]
For General InformationMetropolitan Policy Program at Brookings(202) 797-6139www.brookings.edu/metro
The Brookings Institution is a private non-profit organization. Its mission is to conduct high qual-ity, independent research and, based on that research, to provide innovative, practical recommen-dations for policymakers and the public. The conclusions and recommendations of any Brookings publication are solely those of its author(s), and do not reflect the views of the Institution, its management, or its other scholars.
Brookings recognizes that the value it provides to any supporter is in its absolute commitment to quality, independence and impact. Activities supported by its donors reflect this commitment and the analysis and recommendations are not determined by any donation.

1775 Massachusetts Avenue, NW Washington D.C. 20036-2188telephone 202.797.6000fax 202.797.6004web site www.brookings.edu
telephone 202.797.6139 fax 202.797.2965web site www.brookings.edu/metro
BROOKINGS
About the Metropolitan Policy Program at the Brookings Institution Created in 1996, the Brookings Institution’s Metropolitan Policy Program provides decision makers with cutting-edge research and policy ideas for improving the health and prosperity of cities and metropolitan areas including their component cities, suburbs, and rural areas. To learn more visit: www.brookings.edu/metro
About the State of Metropolitan America The State of Metropolitan America is a signature effort of the Brookings Metropolitan Policy Program that portrays the demographic and social trends shaping the nation’s essential economic and societal units—its large metropolitan areas—and discusses what they imply for public policies to secureprosperity for these places and their populations.Reports in the State of Metropolitan America series focus on five key dimensions of demographic trans-formation in the United States through the lens of these large metro areas: growth, diversity, aging, educational attainment, and income. Visit the State of Metropolitan America, including an interactivedemographic mapping tool for the nation’s 50 states, 100 largest metro areas, and their cities and suburbs online at: www.brookings.edu/metroamerica