Embed Size (px)
Citation preview

Standardization of Measures Prior to Cluster AnalysisAuthor(s): Anne M. StoddardSource: Biometrics, Vol. 35, No. 4 (Dec., 1979), pp. 765-773Published by: International Biometric SocietyStable URL: http://www.jstor.org/stable/2530108 .
Accessed: 17/07/2014 19:37
Your use of the JSTOR archive indicates your acceptance of the Terms & Conditions of Use, available at .http://www.jstor.org/page/info/about/policies/terms.jsp
.JSTOR is a not-for-profit service that helps scholars, researchers, and students discover, use, and build upon a wide range ofcontent in a trusted digital archive. We use information technology and tools to increase productivity and facilitate new formsof scholarship. For more information about JSTOR, please contact [email protected].
.
International Biometric Society is collaborating with JSTOR to digitize, preserve and extend access toBiometrics.
http://www.jstor.org
This content downloaded from 195.159.195.238 on Thu, 17 Jul 2014 19:37:39 PMAll use subject to JSTOR Terms and Conditions
Key Words: Cluster analysis; Distance scaling; Crossed electrophoresis.
BIOMETRICS 35, 765-773 December, 1979
Standardization of Measures Prior to Cluster Analysis ANNE M. STODDARD
Division of Public Health, University of Massachusetts Amherst, Massachusetts 01003, U.S.A.
Summary
A common problem in cluster analysis is the determination of a scale-free measure of dis- tance between individuals. This paper presents a procedure for scaling measurements using a ref- erence individual as a standard of comparison. The procedure is particularly useful in classifica- tion of the results of laboratory procedures, where a reference standard is routinely produced. An example is the clustering of patterns that result from crossed antigen-antibody electrophoresis for determining the phenotype of the serum protein oa,-antitrypsin. The procedure appears to remove extraneous variability while retaining the information necessary for classification.
1. Introduction
In statistical clustering problems, there are several measures for the similarity or differ- ence between individuals (Cormack 1971, Hartigan 1975 and Rao 1977). Euclidean distance is commonly used as a measure of difference, and minimization within clusters is equivalent to minimizing within group mean square error. However, the size of the Euclidean distance between two individuals is dependent on the scales of measurement of the characteristics of the individuals. No satisfactory scheme for weighting characteristics has been proposed (Sokal 1977), although many statisticians recommend normalizing each characteristic by some measure of its variability, to give the characteristics equal weight. This scaling should be based on the variability within clusters, but the parameters of the clusters are unknown and not estimable until the clustering has been performed. Normalization based on variabil- ity over the entire sample is likely to remove important between-cluster variation. In addi- tion, the intrinsic differences in scale between characteristics may form a natural weighting and is useful in classification (Cormack 1971, Kendall 1975).
In classification problems where objects to be classified are the results of a laboratory procedure, the observations are often subject to variation in laboratory conditions from run to run. In such cases the run-to-run variability may be sufficient to mask between-cluster dif- ferences and make classification diflicult, if not impossible. This problem is recognized by laboratory scientists who establish procedures so that a reference pattern is produced by every laboratory run. This reference is to be used as a control for run-to-run variability. An example is the classification of individuals according to the phenotype of the serum protein a,-antitrypsin where the classification is to be done using the patterns that result from crossed antigen-antibody electrophoresis. In every crossed electrophoresis run, a sample of serum known to be of the most common phenotype is run as a reference standard for com- parison purposes.
765
This content downloaded from 195.159.195.238 on Thu, 17 Jul 2014 19:37:39 PMAll use subject to JSTOR Terms and Conditions

766 BIOMETRICS, DECEMBER 1979
This paper describes a cluster analysis of patterns with measurements subject to system- atic changes from run to run. The analysis is based on the K-means clustering algorithm of Hartigan (1975) and uses reference objects as standards for normalizing measurements. The steps in the procedure are: (1) specify a model to describe the run-to-run variability and identify a transformation that will remove this variability, (2) apply the transformation to the experimental data, and (3) use a clustering algorithm to group the transformed data into classes. The procedure is necessarily specific to the problem at hand but could be generally applied to this type of classification problem. We describe the details of the procedure as ap- plied to the clustering of crossed electrophoresis patterns.
2. Description of the Problem
The cluster analysis reported here was part of a larger project to develop an objective, quantitative method for the classification of serum a,-antitrypsin based on crossed elec- trophoresis patterns. Because the error in the conventional classification procedure is un- known, it was not appropriate to develop a procedure along the lines of discriminant func- tion analysis. A cluster analysis was used to investigate "natural" groupings of the patterns based on quantitative measures. The emerging clusters could then be used as a basis for the quantitative classification procedure.
The classification of individuals according to phenotype of the serum protein a,-anti- trypsin has been a medical concern since the mid-1960's when a,-antitrypsin deficiency was described and its association with chronic obstructive lung disease identified (Eriksson 1965). Several laboratory procedures are used to evaluate serum a,-antitrypsin, but the standard laboratory procedure for determination of a,-antitrypsin phenotypes is crossed antigen-anti- body electrophoresis (Fagerhol 1975). A serum sample is classified according to phenotype based on the interpretations of the crossed electrophoresis pattern by trained experts. In some cases the serum will be subjected to other laboratory analyses or sent to a reference laboratory for classification. The procedure is highly subjective and the reliability and accu- racy of the procedure unknown (Matthews 1978).
The pattern resulting from crossed electrophoresis is defined by a stained precipitation line and appears as a series of peaks of varying height. Each peak represents a component or group of components of the protein; the electrophoretic mobility of the component deter- mines the location of the peak. The height of a peak represents the concentration of the cor- responding component or group. The origin of the pattern is the point where the drop of serum was originally placed for electrophoresis and the baseline is the location of the edge of the starch gel. Each pattern is approximately 3.2 inches (8 cm.) wide and is usually 1 to 2.5 inches in height. The conventional classification of these crossed-electrophoresis patterns is based on the relative locations and sizes of the pattern peaks.
A reference pattern from serum known to be of the most common phenotype (MM) is produced whenever a crossed electrophoresis is run. This pattern is used as a standard of comparison for the other patterns produced by that run to control for variability in labora- tory conditions. In evaluating the relative location and sizes of peaks on a pattern to be clas- sified, a laboratory technician will compare the sizes and locations of peaks on the appropri- ate reference pattern. This comparison of each pattern to the appropriate reference standard is an important part of the laboratory classification procedure. The standardization proce- dure described here was developed to adjust the quantitative measures on the patterns from each run according to the reference pattern for that run, so that variation in the measures due to laboratory conditions might be removed.
This content downloaded from 195.159.195.238 on Thu, 17 Jul 2014 19:37:39 PMAll use subject to JSTOR Terms and Conditions

STANDARDIZATION FOR CLUSTER ANALYSIS 767
3. Data Sources and Characteristics
Patterns were obtained from two sources: 1233 were obtained from two studies of the ag- gregation of pulmonary disease undertaken at the Channing Laboratories of Harvard Medi- cal School, and 130 were obtained from the federally funded reference laboratory at Johns Hopkins University. These patterns had been previously classified as the result of six pheno- types (MM, MS, MZ, SS, SZ, or ZZ) by their respective laboratories. The 1363 research pat- terns were produced by 227 laboratory runs: 183 at the Channing Laboratories and 44 at Johns Hopkins. The 227 corresponding reference patterns were also obtained.
The characteristics of the patterns were quantified according to procedures described in Matthews (1978). A digitizer was used to measure selected points along the precipitation line relative to the origin. The array of points was then used to describe the features of the pat- tern thought to be important in classification. Figure 1 is a replica of a typical reference pat- tern drawn to scale from the digitized points. The vertical lines were draw in to indicate the peak boundaries used in this analysis. The peaks were labelled according to the laboratory convention which numbers them in decreasing order of eletrophoretic mobility. Peaks 1, 3 and 5 often fail to appear as distinct peaks in a typical MM pattern. Peak 6 always appears and is used, in the conventional classification procedure, as a reference for the location of the other peaks.
We examined the characteristics of the 227 reference patterns in order to evaluate varia- bility due to laboratory run and to identify a norm for these patterns. We found 26 patterns to be atypical according to criteria described by experts in the classification of serum a,-anti- trypsin (Matthews 1978). The 201 typical reference patterns were used to develop the stan- dardization algorithm. Atypical reference patterns might indicate an atypical laboratory run and should mandate repeating the run.
3.00-
S 2.0 0 - 0 ll
1.00- \ I WJ I
A \ A
o.oo 1.00 2.00 3.00
X IN INCHES
Figure 1 Pattern Replica of a Typical Reference Pattern
Pattern replica drawn from digitized points of a reference pattern. Pattern peaks were labelled according to laboratory numbering convention and vertical lines were drawn to indicate peak boundaries used in the analysis.
This content downloaded from 195.159.195.238 on Thu, 17 Jul 2014 19:37:39 PMAll use subject to JSTOR Terms and Conditions

768 BIOMETRICS, DECEMBER 1979
4. Standardization 4.1. Step 1: Specifying the Model and Identifying the Transformation
Initially it was not clear how much of the variability among reference patterns was due to differences in laboratory conditions and how much was due to diSerences in the sera. Never- theless, we sought a functional relationship for the effects of these sources on pattern charac- teristics, so that the inverse function could be used to remove the effects. Crossed elec- trophoresis is a two-phase procedure that separates serum protein into its components linearly along one axis and then spreads out the component linearly along an axis per- pendicular to the first. The shape of the pattern is a result of the electrophoretic migration of the serum protein. This mobility is determined by the inherent qualities of the serum as well as by the laboratory conditions of the run. We hypothesized that the laboratory conditions would influence the migration of all the components of a particular protein similarly and that we could estimate the relationship with a linear model. We hypothesized separate linear models for the two axes of the pattern (that is, the location and area measures) because we felt the crossed-electrophoresis procedure would influence the two dimensions of the pattern separately. Let (i be the parameter of a particular measure on peak i for MM patterns and let xij be the observed value of that parameter for reference pattern j. Then under the model,
xij= ogj + AXi + fij, (1)
where aj and jBj are the coefficients for the run that produced reference pattern j and sij is the random measurement error of observation xij. We estimated (i as the mean of the observed values over all typical reference patterns, i.e., (i = z/x,J201. We then used least squares re- gression to estimate aj and jBj for each reference pattern,
/§j= E (XiX-XJ3(Si-S)/ E (Si-()2 and aj= x;- (2) i i
where x; = Eixij/S and 4 = ,tJS. To obtain standardized estimates of the parameters for each reference, (i, we substituted aj and ,Ej in (1) and solved for (i,
Si= (XiX-AJ3/AX (3) To evaluate the standardization procedure, we applied it to the 201 typical reference pat- terns. Comparison of the location and area measures, before and after standardization, showed that the standardization procedure greatly reduced the variability without altering the means (Table 1). The linear relationship among the locations and among the areas of the peaks appears to explain the variability in these measures in the reference patterns. To evaluate the eSect of standardization on the sources of variation in pattern measure- ments, the results of nine laboratory runs that each produced two replicate patterns from the same reference serum were used. In addition to the nine pairs of patterns from the same MM serum, one other pattern that had been subsequently classified as from MM serum was se- lected from each run. This resulted in a sample of three patterns from each of nine runs: 18 patterns produced by single reference serum and nine patterns produced by nine different MM sera.
A two-way analysis of variance was used to test the hypothesis of no effect due to labora- tory run or due to serum on the location and area of peak 6 before and after standardization. In both the location and area measures there was significant variability between runs and be- tween sera before standardization. After standardization, the variability in peak locations
This content downloaded from 195.159.195.238 on Thu, 17 Jul 2014 19:37:39 PMAll use subject to JSTOR Terms and Conditions
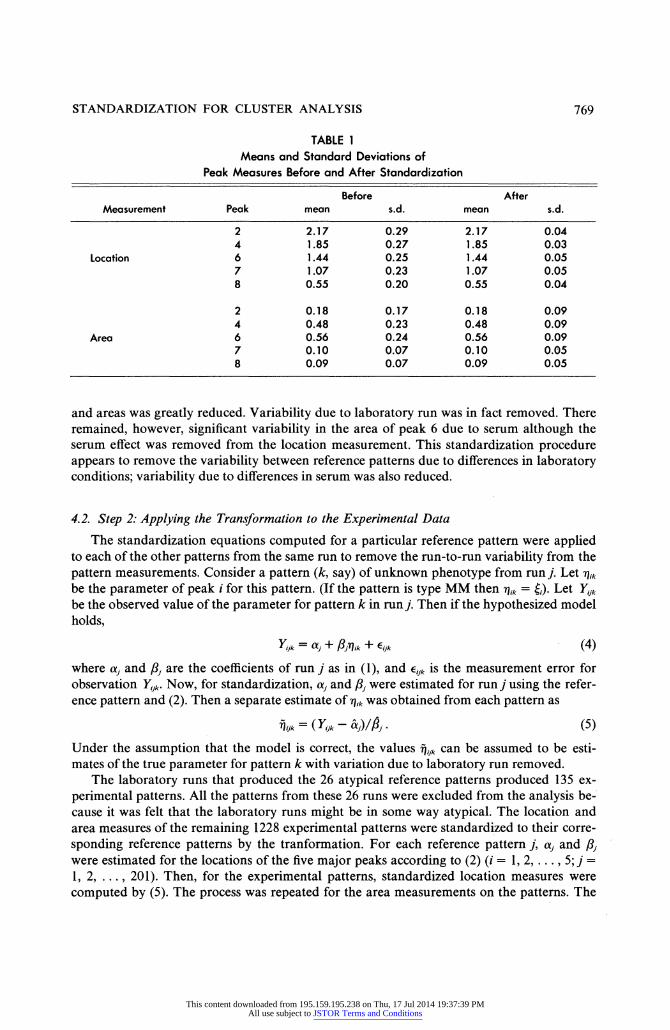
TABLE 1 Means and Standard Deviations of
Peak Measures Before and After Standardization
Before After Measurement Peak mean s.d. mean s.d.
2 2.17 0.29 2.17 0.04 4 1.85 0.27 1.85 0.03
Location 6 1.44 0.25 1.44 0.05 7 1.07 0.23 1.07 0.05 8 0.55 0.20 0.55 0.04
2 0.18 0.17 0.18 0.09 4 0.48 0.23 0.48 0.09
Area 6 0.56 0.24 0.56 0.09 7 0.10 0.07 0.10 0.()5 8 0.09 0.07 0.09 0.05
STANDARDIZATION FOR CLUSTER ANALYSIS 769
and areas was greatly reduced. Variability due to laboratory run was in fact removed. There remained, however, significant variability in the area of peak 6 due to serum although the serum effect was removed from the location measurement. This standardization procedure appears to remove the variability between reference patterns due to differences in laboratory conditions; variability due to differences in serum was also reduced.
4.2. Step 2: Applying the Transformation to the Experimental Data
The standardization equations computed for a particular reference pattern were applied to each of the other patterns from the same run to remove the run-to-run variability from the pattern measurements. Consider a pattern (k, say) of unknown phenotype from run j. Let nik
be the parameter of peak i for this pattern. (If the pattern is type MM then nik = (i) Let Yijk
be the observed value of the parameter for pattern k in run j. Then if the hypothesized model holds,
Yijk °ti + AjNik + (ijk (4)
where cx; and jBj are the coeflicients of run j as in (1), and fijk iS the measurement error for observation Yijk. Now, for standardization, cx; and jBj were estimated for run j using the refer- ence pattern and (2). Then a separate estimate of nik was obtained from each pattern as
nijk ( Yijk RJ3/j * (5 )
Under the assumption that the model is correct, the values 71iJk can be assumed to be esti- mates of the true parameter for pattern k with variation due to laboratory run removed.
The laboratory runs that produced the 26 atypical reference patterns produced 135 ex- perimental patterns. All the patterns from these 26 runs were excluded from the analysis be- cause it was felt that the laboratory runs might be in some way atypical. The location and area measures of the remaining 1228 experimental patterns were standardized to their corre- sponding reference patterns by the tranformation. For each reference pattern j, cx; and jB were estimated for the locations of the five major peaks according to (2) (i = 1, 2, . . ., 5; j = 1, 2, ..., 201). Then, for the experimental patterns, standardized location measures were computed by (5). The process was repeated for the area measurements on the patterns. The
This content downloaded from 195.159.195.238 on Thu, 17 Jul 2014 19:37:39 PMAll use subject to JSTOR Terms and Conditions

45 13 9 3 0 0 70 (1 6) (2) (5) (0) (0) (°) (23) 17 6 5 0 0 0 28
(15) (9) (6) (1) (°) (°) (31) 14 5 7 0 2 0 28 (8) (4) (4) (1 ) (0) (°) (1 7) 2 0 0 0 0 0 2
(1 6) (7) (2) (2) (2) (1 ) (30) 1 8 0 3 8 0 20
(24) (7) (4) (1) (6) (°) (42) 0 0 0 0 0 13 13
(0) (3) (0) (1 ) (2) (1 2) (1 8)
79 32 21 6 10 12 161
770 BIOMETRICS, DECEMBER 1979
standardized location and area measurements were then used in the clustering procedure to group the patterns.
5. Cluster Analysis of the Transformed Data
A cluster analysis of the standardized data was performed to determine a "natural" grouping of patterns that might be used as the basis for a statistical pattern classification pro- cedure. A sample of 161 standardized patterns was selected on which to develop the statisti- cal procedure. The remaining 1067 were to be used to evaluate the procedure. The K-means clustering algorithm of Hartigan (1975) was used because it allows for the specification of an initial partition of individuals into clusters. The algorithm then seeks an optimum partition in the neighborhood of the initial partition, by minimizing the overall mean square error within clusters. In this case the laboratory classifications of the patterns determined the ini- tial partition.
Applying this algorithm to the standardized measurements on the 161 patterns of the training sample produced a cluster partition in moderate agreement with the laboratory classification scheme. The amount of agreement as measured by Cohen's Kappa statistic (Bishop, Fienberg and Holland 1975) is 0.29 with 95% confidence limits of 0.17 and 0.41.
For comparison purposes the cluster analysis was repeated using the original measures standardized to unit variance (Table 2). For this ahalysis the amount of agreement between the original partition and the optimum partition was less than that for Table 3: K = 0.18 with 95So confidence limits 0.10 and 0.26. In addition the cluster analysis was performed using un- standardized pattern measures. This analysis resulted in the least agreement between the original and optimum partition (K = 0.18, 95% confidence limits of 0.09 and 0.27).
The optimization criterion for the K-means algorithm is minimization of the overall within-cluster mean square error. The ratio of overall within-cluster mean square error of the optimum partition to that of the initial partition was obtained for the two-cluster analy- ses. The cluster analysis using measures standardized to the reference pattern produced a slightly greater reduction in overall mean square error (ratio = 2.12) than the other analysis (ratio= 1.96).
TABLE 2 Results of K-Means Clustering Using Measurements
Standardized to Reference Pattern (and to Unit Variance)
Laboratory Classification Cluster MM MS MZ SS SZ ZZ Total
3
4
5
6
Total
This content downloaded from 195.159.195.238 on Thu, 17 Jul 2014 19:37:39 PMAll use subject to JSTOR Terms and Conditions

69 26 28 0 20 1 3 1 56
(22) (28) (1 7) (30) (40) (1 8) (1 55) 1 2 0 2 0 0 5
(1 ) (3) (0) (0) (2) (°) (6)
70 28 28 2 20 13 161
STANDARDIZATION FOR CLUSTER ANALYSIS 771
A disadvantage of the K-means clustenng algonthm, when the actual structure of the data consists of groups of disparate sizes, is that the algonthm tends to produce partitions into groups of similar size (Eventt 1979). For the data from the crossed electrophoresis pat- terns the cluster analysis did result in similar size groups when the measures were standard- ized to unit variance. When the data were standardized to the reference patterns, however, the optimum clusters were very close in size to the onginal clusters (Table 2).
The results of these cluster analyses might simply be due to the algonthm used. In order to evaluate the stability of the results the analyses were repeated using BMDP-2M, a hier- archical algorithm with average Euclidean distance between clusters as the joining criterion (Dixon and Brown 1977). The results ofthese analyses are reported for the stage of joining at which six clusters were obtained, and the results are compared to the results of the corre- sponding K-means analyses (Table 3). In each case some patterns remained unclustered by the hierarchical algorithm at the stage where six clusters were obtained.
There is almost perfect agreement between the two clustering algonthms when measures standardized to the reference patterns were used. In this case K = 0.86 with 95% confidence limits of 0.79 and 0.93. When the measures are standardized to unit vanance there is agree- ment between the two algonthms, but it is much less than that observed when the measures are standardized to the reference patterns: K = 0.41 with 95So confidence limits of 0.31 and 0.51. Whexl the measures are unstandardized there is the least agreement between al- gorithms: K = 0.35 with 95% confidence limits of 0.26 and 0.44.
TABLE 3 Comparison of K-Means and Hierarchical Clustering
Using Measurements Standardized to Reference Patterns (and to Unit Variance)
Hierarchical K-Means Cluster Cluster 1 2 3 4 5 6 Tofol
1 69 6 3 0 0 0 78 (0) (1) (0) (0) {4) (0) (5)
2 0 20 0 0 0 0 20 (0) (26) (0) (0) (0) (°) (26)
3 0 0 21 0 3 0 24 (°) (°) (9) (2) (0) (°) (1 1)
4 0 0 3 0 0 0 24
(O) (O) (4) (0) (2) (C)) (9) 5 0 0 1 0 17 0 18
(22) (1 ) (1 ) (26) (33) (3) (86) 6 0 0 0 0 0 13 13
(0) (0) (0) (2) (1 ) (1 5) (1 8)
Subtotal
Unclustered
Total f
(23) (31) (17) (30) (42) (18)
This content downloaded from 195.159.195.238 on Thu, 17 Jul 2014 19:37:39 PMAll use subject to JSTOR Terms and Conditions

772 BIOMETRICS, DECEMBER 1979
6. I)iscussion
The type of classification problem presented here is common in the analysis and inter- pretation of laboratory results. Many laboratory procedures require the generation of a ref- erence individual for comparison purposes. These reference individuals are used on an ad hoc basis by laboratory personnel to control for variability in laboratory conditions. They should also be used in a systematic, quantitative analysis of results. This standardization pro- cedure provides for a formal specification of the laboratory variability and a method for us- ing the model to remove that variability.
Another common characteristic of laboratory results is that all measures are made in the same scale, so that diffierences among measures may be intrinsic and not due in any way to variation in scale. This standardization procedure allows for the removal of laboratory varia- bility but retains the intrinsic differences in the size of the characteristics. No further normal- ization is necessary and the standardized measures are in the scale of measurement that is easily interpretable by laboratory personnel.
It is difficult to evaluate the results of a cluster analysis because a solution will always be obtained whether there is any underlying structure to the data or not. The clustering results reported here were evaluated in three ways and in all three evaluations the standardization of pattern measures to a reference pattern provided better results than measures standard- ized to unit variance. The K-means cluster analysis showed more agreement with the labora- tory classification procedure when the measures were standardized to the reference. The K-means and hierarchical analyses showed more agreement for these measures as well. In addition, the reduction in overall within-cluster mean square achieved by the K-means al- gorithm was greater for these pattern measures.
The simplicity of this standardization procedure makes it a logical choice for adoption in many laboratory settings. The results can be interpreted easily by personnel familiar only with the laboratory procedures. It does not require pnor assumptions about the distnbution of pattern characteristics within and between classes. This is a straightforward, easily imple- mented procedure that can be used in connection with computer clustenng of laboratory re- sults.
Acknowledgments
The author is grateful to Dr. Yvonne Bishop and the referees for many helpful sugges-. tions in the preparation of this manuscript. Research was supported by training grant HL05998 from the National Heart, Lung and Blood Institute through the Channing Labora- tones of Harvard University. The complltatioIls were supported in part by a grant from the University of Massachusetts Computing Center.
References
Bishop, Y. M. M., Fienberg, S. E. and Holland, P. W. (1975). DiscreteMultivariateAnalysis. MIT Press, Cambridge, Massachusetts.
Cormack, R. M. (1971). A review of classification. Journal of the Royal Statistical Society, Series A 134, 321-367.
Dixon, W. J. and Brown, M. B. (1977). BMDP-77: Biomedical Computer Programs, P Series. University of California Press, Berkeley, California.
Eriksson, S. (1965). Studies in Ltl-antitrypsin deficiency. Acta Medica Scandinavica Supplement 432, 1- 85.
Everitt, B. S. (1979). Unresolved problems in cluster analysis. Biometrics 35, 169-181 .
This content downloaded from 195.159.195.238 on Thu, 17 Jul 2014 19:37:39 PMAll use subject to JSTOR Terms and Conditions

STANDARDIZATION FOR CLUSTER ANALYSIS 773
Fagerhol, M. K. (1975). Pi typing techniques. In Protides of Biological Fluids, Proceedings of the 22nd ColloquEum. D. Peeters (ed.), Pergammon Press, Oxford, England, 492v95.
Hartigan, J. A. (1975). ClusteringAlgorithms. John Wiley and Sons, New York. Kendall, M. G. (1975). MultivariateAnalysis. Charles Griffin and Co., Ltd., London. Matthews, M. A. (1978). A statistical pattern recognition problem: The classification of serum alphal-
antitrypsin. Unpublished Sc.D. thesis, Harvard University, Boston, Massachusetts. Rao, C. R. (1977). Cluster analysis applied to a study of race mixture in human populations. In Classi-
fication and Clustering. J. Van Rizzin (ed.), Academic Press, New York. Sokal, R. (1977). Clustering and classification: background and current directions. In Classification and
Clustering. J. Van Rizzin (ed.), Academic Press, New York.
Received November 1978; Revised April 1979
This content downloaded from 195.159.195.238 on Thu, 17 Jul 2014 19:37:39 PMAll use subject to JSTOR Terms and Conditions