Embed Size (px)
Citation preview

Report No. 16269-CE
Sri LankaTransport Sector Strategy Study(In Two Volumes) Volume 1: Main Report
January 1997
Infrastructure Operations DivisionSouth Asia Country Department I
Government of the Democratic Socialist Republic of Sri Lankawith assistance from the UNDP
FOR OFFICIAL USE ONLY
Document of the WorWd Bank
This document has a restricted distribution anId rnybe used by recipients only irtth~performance of their offcial duties. Its contei~-ayn teisbdslosedwithiWorld Bank autoohiwieeds
World Bank authoriza~~~~~~~~~~~~~~~~~~~~~~~~~~~~~~~~~~~~~~~~~~~~~~~~~~~~~~~~~~~~~~~~~~~~~bn~~~~~~
Pub
lic D
iscl
osur
e A
utho
rized
Pub
lic D
iscl
osur
e A
utho
rized
Pub
lic D
iscl
osur
e A
utho
rized
Pub
lic D
iscl
osur
e A
utho
rized
Pub
lic D
iscl
osur
e A
utho
rized
Pub
lic D
iscl
osur
e A
utho
rized
Pub
lic D
iscl
osur
e A
utho
rized
Pub
lic D
iscl
osur
e A
utho
rized

CURRENCY AND EQUIVALENT UNITS(January 1996)
Sri Lanka Rupee (Rs.) I = US$0.0180US$1.00 Rs. 55.60 (July 1996)
WEIGHTS AND MEASURES1 meter (m) 1.1 yard1 kilometer (km) 0.62 mile (mi)I hectare (ha) 2.47 acres (ac)I metric ton (m ton) = 2,205 pounds (lbs.)
ABBREVIATIONS
BOI - Board of InvestmentBOT - Build, Operate, TransferCAS - Country Assistance StrategyCEIP - Colombo Environmental Improvement ProjectCMR - Colombo Metropolitan RegionCPC - Ceylon Shipping CompanyCTB - Ceylon Transport BoardCUTS - Colombo Urban Transport PlanIMTs - Intermediate Modes of TransportationMEIP - Metropolitan Environmental Improvement ProgramMTIP - Medium Term Investment ProgramNESC - National Environmental Steering CommitteeNMT - Non-Motorized TransportNTC - National Transport CommissionPIP - Public Investment ProgramPSA - Private Sector AssessmentPTAs - Provinicial Transport AuthoritiesRCDC - Road Construction and Development CompanyRDA - Road Development AuthoritySLPA - Sri Lanka Ports AuthoritySLR - Sri Lanka RailroadsSMEs - Small Scale EnterprisesT&CP - Town and Country PlanningTEC - Technical Evaluation CommitteeTEU - Twenty-foot equivalent unitsTSPC - Transport Studies and Planning CenterUDA - Urban Development AuthorityULAs - Urban Local AuthoritiesWHO - World Health Organization
Vice President: Mr. D. Joseph WoodDirector: Ms. Mieko NishimizuDivision Chief: Ms. Marie RobinsonTask Manager: Ms. Frannie Humplick

(Gkasry
Access Fees: payments made to the owner of a network of infrastructure (usually public)based on an agreed upon system of charges such as incremental cost incurred by theowner through the use of the system by another (usually private) operator
Build-Operate-Transfer (BOT): a form of concession involving finance, construction,and maintenance of a facility for a specified period before ownership is transferred to apublic authority
Commercialization: transition of public or non-market enterprises to commercialmarket-based behavior
Concession: grant or sale by a public authority of a right to develop or operate assetsowned, or reverting to, the ownership or authority, usually for an extended period of time
Devolution: transfer of functions or decision-making authority to legally incorporatedlocal governments, such as provinces or municipalities
Externality: an unpaid-for effect of a transaction or activity on third parties
Liberalization: allowing entry into the provision of goods and services formerly in thehands of a single entity
Motorization: transition to higher levels of ownership and use of road motor vehicles(motorcycles, automobiles, and trucks)
Open Access: opening the transport networks to private operators in a manner such thatinfrastructure networks such as railway track can be used by private freight operatingcompanies, in return for access payments
Peoplization: term used to denote transfer of assets owned by the state to formeremployees of public enterprises in Sri Lanka
Restructuring: the process of reorganizing the assets, liabilities, and work force toenable an existing public enterprise to respond more efficiently to its customers' needs
Transport Infrastructure: all fixed facilities associated with the movement of freight orpassengers, such as rights of way, track or terminals, and associated traffic managementsystems such as traffic lights, signals, and communication systems
Transport Services: all activities associated with conveyance of passengers and freight


SRI LANKA
TRANSPORT SECTOR STRATEGY STUDY
TABLE OF CONTENTS
EXECUTIVE SUMMARY ............................................. i
A. Background .......................................................
B. Short Term Strategy: Increase Efficiency of Public Investments ............................................... iii
C. Medium Term Strategy: Economic and Financial Sustainability ............................................... vi
D. Long Term Strategy: Environmental and Social Sustainability ............................................... viii
E. Sector Specific Reforms ...................................................... x
F. Policy Implementation Process ..................................................... xviii
G. Logical Framework for the Transport Sector Strategy ..................................................... xx
H. Summary of Recommendations for Transport Sector Strategy ............................................... xxi
1. INTRODUCTION ........................................... I
A. Objectives and Scope ..................................................... 1l
B. Audience ...................................................... 2
C. Ownership and Participation ...................................................... 2
D. Major Themes Covered ...................................................... 2
E. Framework for Transport Sector Strategy ..................................................... 4
This report is based on the findings of a joint World Bank/Government of Sri Lanka team. The team wasintegrated by Frannie Humplick (WB, team leader, author of Volume I and editor of Volume II of thisreport), and included Jose G6mez-Ibdftez (Harvard University, competition in passenger services), AjayKumar (WB, planning and implementation), Gerard J. McCullough (Putnam, Hayes, and Bartlett,restructuring the railway), Ismail Mobarek (WB, ports and shipping), and Nancy Zhao (WB, co-teamleader and public sector reform). The Government counterpart team led by W.L.P. de Mel, Director TSPC,consisted of TSPC Staff and several other participants who carried responsibility for sub-sectors within thetransport sector, transport consultants and leading private sector construction and transport managers.Contributions were also received from Sheoli Pargal (PRDEI, environmental sustainability). Funding forthe workshop and the consultants was provided by a technical assistance grant from the UNDP.Background papers used in the report were prepared by a number of local participants, as well asrepresentatives of OECF and ADB. Their names appear in Volume II of this report. Internal peerreviewers were Ian Heggie (TWUTD), Gerhard Menckhoff (LA1IU), Lou Thompson (TWUTD), ZmarakShalizi (PRDEI), and Dominique Van De Walle (PRDPE). External reviewers were Harry Garnett (ABTAssociates). Mieko Nishimizu is the Director and Marie Robinson is Division Chief. The report wasprocessed by Jack Williams.
II. REORIENTING TRANSPORT SECTOR POLICY .......................................... 6
A. The Government's Policy Agenda and the Transport Sector ....................................................... 6
B. Coverage and Performance .................................................................. 9
C. Transport Demands of Export-Led Growth ................................................................. 11
D. Urbanization, Environmental, and Social Sustainability ............................................................. 13
E. Institutional Weaknesses in Planning and Implementation ........................................................ 15
III. IMPROVING THE EFFICIENCY OF PUBLIC INVESTMENTS ................. 19
A. Planned Investments in Transport ................................................................. 19
B. Pattern of Public Expenditures in Transport ................................................................. 19
C. Composition of Transport Expenditures ................................................................. 20
D. Devolution and the Capacity of Sub-National Agencies .............................................................. 25
E. Revenue Generation and Subsidies ................................................................. 26
F. Recommendations to Improve Efficiency of Public Investments ................................................ 26
IV. ECONOMICALLY AND FINANCIALLY SUSTAINABLE DELIVERY OFTRANSPORT INFRASTRUCTURE AND SERVICES ................................... 29
A. Role of the Government in Transport ................................................................. 29
B. Competition in the Provision of Road Infrastructure ................................................................. 31
C. Strategy for Reforming the Ports and Shipping Sector ............................................................... 36
D. Competition in Bus Passenger Services ................................................................. 42
E. Pricing and Financing in Roads ........................ 45
F. Restructuring the Railroads . 47
V. ENVIRONMENTAL AND SOCIAL SUSTAINABILITY ............................... 55
A. Physical Planning and Environmental Issues in Transport . 55
B. Environmental Planning and Implementation ...................................... 60
C. Traffic Management for Congestion Control and Safety. . 62
D. Role of Transport in Poverty Alleviation and Regional Dcvelopment ....................................... 63
E. Access and Mobility in Rural Areas .............................. . 64
F. Regional Integration Through Transport .65

List of Figures
Figure 1 Dominant Position of Colombo .................................................................. 66
Figure 2 Modal Shift to Private Transport .................................................................. 67
Figure 3 Expenditure as a Share of GDP .................................................................. 68
Figure 4 Demand for Land Transport .................................................................. 69
Figure 5 Composition of Public Expenditures in Transport .............................................................. 70
Figure 6 Ratio of Recurrent to Capital Expenditures in Transport ................................................. 71
List of Tables
Table 1 Transport Infrastructure: Coverage and Performance ..................................................... 10
Table 2 Priority Ranking by the Private Sector of Transportation Bottlenecks ............................ 11
Table 3 Patterns of Urbanization in Asia .................................................................. 13
Table 4 Structure of Public Investments 1995-1999 (Rs. Million) ................................................... 19
Table 5 Sectoral Composition of Expenditures in Transport 1995-1999 ........................................ 20
Table 6 Modal Balance in Capital Investments in Transport .......................................................... 21
Table 7 Financial Allocations to the Road Sector by Source ........................................................... 25
Table 8 Expenditures on Roads by Levels of Government .............................................................. 26
Table 9 Market and Regulatory Structure in Transport ................................................................. 30
Table 10 Comparative Costs of Providing Roads .................................................................. 32
Table 11 Share of Transshipment Cargo in Colombo Compared to Major Ports ........................... 37
Table 12 Performance and Reliability of Colombo Port .................................................................. 37
Table 13 Comparative Costs of a 24 Hours Connection of Transshipping Containers ................... 38
Table 14 Passenger km of Travel Between 1985 and 1995 ................................................................. 42
Table 15 Performance of the Peoplized Bus Sector .................................................................. 43
Table 16 Structure of Charges and Costs for Road Usage in 1995 .................................................... 46
Table 17 Countries with Railway Concessions .................................................................. 51
Table 18 Income Distribution of Users of Rail, Bus and Van Passenger Services ............................ 51
Table 19 Road Accident Fatality Rates by Country .................................................................. 56
Table 20 Growth in Vehicular Emissions 1992-1996 .................................................................. 58

List of Boxes
Boxi1 ..12
Box 2 ...16
Box 3 ...16
Box 4 ... t18
Box 5 .. 22
Box 6 .. 23
Box 7 .. 24
BoxS8...33
Box 9 .. 35
Box 10 .. 40
Box 11 .. 49
Box 12 .. 61
Annexes
Annex 1 Impacts and Issues of Sri Lanka Clean Air 2000
Annex 2 Estimated Investment Needs and Payoff from Proposed Reforms
Annex 3 List of Workshop Participants

EXECUTIVE SUMMARY
A. BACKGROUND
1. Sri Lanka aspires to achieve economic growth and poverty reduction comparableto that of its more prosperous neighbors in East Asia'. To realize this dream the countryis focusing on an export-oriented and private-sector led growth strategy, which is to beenvironmentally and socially sustainable. To increase export competitiveness, theGovernment is focusing on ways to improve the productivity of key export earningsectors: agriculture and manufacturing. To encourage export development, theGovernment is actively promoting higher value added items. The economic growthstrategy followed by the Government is not to come by sacrificing the naturalenvironment, nor the quality of urban life. Moreover, to guarantee social sustainability,growth strategies are to ensure that the poor are included by providing access to servicesand employment.
2. The transport sector has a critical role to play in achieving these goals. Toincrease economic productivity through export oriented growth, the country needs atransport system that functions in a seamless fashion from the perspective of the exporter.This requires more focus on transport facilities and services attending to export regionsand products as well as an integrated intermodal transport sector strategy; in particular,maintaining, upgrading, modernizing, and ensuring connectivity between those transportfacilities and services. Within manufacturing, the Government proposes to promotehigher value added items such as garments, toys, and fashion accessories as well as entryinto higher technology and skill-based activities such as electronic and electric assemblyand manufacture of precision engineering parts and tools; sports goods and footwear; andscientific instruments and software. In agriculture, the objective is to also promote highvalue added products especially in the non-plantation crop sector. All these productshave very specific demands for transport. Products like garments, toys, and fashionaccessories require reliable, safe and secure transport services, contracted on demand.Electronic goods, scientific instruments, and precision tools, require specializedpackaging and suspension. Products like spices, fruits, vegetables, and flowers needrefrigeration and specialized containers. Also necessary are efficient and reliable publictransit systems, offering a variety of service options, and traffic management and restraintmeasures to relieve congestion and pollution.
3. Recognizing the critical role the transport sector has to play, a sector strategy wasjointly prepared by the Government of Sri Lanka and the World Bank, with technical
Sri Lanka: Country Assistance Strategy of the World Bank Group. Report No. 15633-CE, 1996.
2Policy Statement by Her Excellency Chandrika Bandaranaike Kumaratunga, President of the DemocraticSocialist Republic of Sri Lanka, 1995.

assistance from the UNDP. It has the following objectives: (i) identifies the principalissues affecting the transport sector's ability to perform; (ii) sets a clear vision, foundedon principles of an effective public-private partnership, for the sector to provideefficiently the infrastructure and services needed to underpin growth in the country; and(iii) lays out a reform agenda and an investment strategy for the sector.
4. Successful policy reform in the transport sector can have significant payoffs forthe country. At present, the transport sector contributes to -about 50% of the public sectorshare of GDP (1991). Improving the performance of the transport sector could removemajor bottlenecks to economic growth and productivity. The transport sector is also animportant source of employment, generating about 6% of direct employment (1995) and4% of indirect employment (1995)3. The sector also absorbs, at present, a large share ofpublic investments (about 22% of planned investments in the period 1995-1999).Improving the effectiveness of transport expenditures could result in major savings in theprojected needs for investment. Estimates indicate that projected savings from reforms inthe highway sector alone could be as high as 70% of estimated expenditures withoutreforms. In other words, with reform the Govermnent could invest 30% of the estimatedfunds otherwise needed to support economic growth (see Annex 2).
5. The transport sector in Sri Lanka has not performed as well as that of its EastAsian neighbors, failing to meet the demands necessary for the country to sustain higherlevels of economic growth. Furthermore, rising expectations as a result of Sri Lanka'slong-term per capita growth as well as changing characteristics of Sri Lanka's productionand trade, have placed new challenges on the sector. Among these challenges is the needfor reliable, efficient, and safe services for passenger and freight transport, whilemanaging the negative consequences such as congestion, air pollution, and accidents.
6. Basic coverage has been good in terms of extending transport networks butexisting systems are aged, obsolete, and congested. Misguided capital investments,inadequate balance between transport modes, and inattention to maintenance have furtherreduced the ability of the transport sector to perform. The transport sector is sufferingfrom a low level equilibrium trap. Misallocation of expenditures in transport has led toimproper modal balance in capital investments as well as an underinvestment in recurrentrelative to capital expenditures. This has led to insufficient maintenance, causingdeterioration in assets and service quality, and the consequent decline in willingness touse public services. This has made it difficult to raise revenues through higher prices, asusers have resisted having to pay more for increasingly deteriorated services. Thecountry, and especially the Greater Colombo Region, has seen a high rate ofmotorization, and the private vehicle has captured a larger share of the growing demandfor transport. In combination with deterioration in urban bus and rail services,motorization has led to large modal shifts from public transit to private vehicles. The
Annual Report 1995, Central Bank of Sri Lanka and TSPC, Transport Sector Data Bank.
iii
consequences have been congestion, accidents, and pollution. The private sector cites anumber of transport bottlenecks as factors constraining their potential. Addressing thesebottlenecks is critical if the country is to widen its export base.
7. The Government plays a major role in the transport sector in Sri Lanka. Publicenterprises are responsible for direct provision of road, railway, and port infrastructure.There is no private provision of infrastructure. The Government plays a smaller role inthe direct provision of transport services, with the exception of railways which are in thehands of Sri Lanka Railways, a Government Department, and bus transport where theGovernment is a 50% share holder of the peoplized bus companies. The poorperformance of the transport sector has been mainly because the public sector hasoverextended itself as a direct provider of facilities and operator of services and is failingto meet important functions as manager of competition, custodian for the environment,and guarantor for social concerns. The challenges of operating and managing transportinfrastructure and services have absorbed a lot of effort from the public sector, fosteringweaknesses in planning, implementation, and regulation.
8. The strategy proposed has three main objectives. In the short-run (1997-1999) thestrategy focuses on actions to improve the efficiency of investments in the transportsector. Medium term (2000-2005)concems addressed by the proposed strategy are policyreforms and institutional changes to achieve economic and financial sustainability in thetransport sector. The long term (2006-2010) is aimed at making transport sectorexpenditures socially and environmentally sustainable. The strategy proposes stagedinvestments, with proper balance across modes, emphasis on redressing past neglect inmaintenance, and policy and institutional reforms which are key to the strategy's success.
B. SHORT TERM STRATEGY: INCREASE EFFICIENCY OF PUBLIC INVESTMENTS
9. There are three key reforms needed in the short run. First, there is a need tocorrect the imbalance in the composition of transport expenditures between modes, aswell as the ratio of recurrent to capital investments. This will address the problemscaused by past misallocations of capital investments and will begin reversing the negativecycle the transport sector has settled into. Second, the capacity of agencies responsiblefor formulating and implementing policies in the transport sector needs to bestrengthened. Third, in order to address the shortfall in capital for investments in thetransport sector, there is a need to mobilize funds from other sources including the privatesector and user charges and fees.
10. Addressing Past Imbalances Across Transport Modes. Past allocations incapital expenditures, according to official records, went mostly to railways, with very lowinvestments in the highway sector. However, the official records of past capitalallocations in railways overestimate the real level of investments in the sector, as many ofthe current expenditures were misclassified as capital ones. There is a need to improve

iv
the balance across modes, focusing on improving transport connections in regionscontributing the most to exports and regions whose export products are growing faster.Also needed is upgrading and modernization of transport facilities and services forintermodal linkages with proper logistic support. Such a focus requires attention not onlyto the Greater Colombo Region, which is responsible for about 50% of total freightmovements and 54% of all exports, but to regions such as North Central, North Western,Uva, Sabaragamuwa, and Northern and Eastern provinces with export growth ratesbetween two and twenty times higher than those in Greater Colombo. The public sectoris not well-equipped to provide such services on its own. Efforts need to be made todefine an intermodal strategy with proper logistical support that can be carried out by theprivate sector in partnership with the public sector. Critical to success of an intermodalstrategy is a need to shift the sectoral balance of investments to meet the objectives of aseamless transport system. The Government should seek private sector participation inthe integrated provision of containerized transport by road, rail, and ports, as well as thetransport of specialized cargo by sea and air. Such partnerships should includearrangements for dedicated telecommunication, information processing, and warehousingfacilities and services.
11. Redressing Past Maintenance Neglect. There have also been insufficientallocations to maintenance. In the case of roads in the 1990's, the country has under-allocated to maintenance by a factor of about 2.5 compared to international benchmarks.Neglect of maintenance has caused gradual deterioration of road and rail infrastructureand facilities, leading to a decline in the quantity and quality of passenger and freightservices. The Government needs to address the past inattention to maintenance bymaking available sufficient resources in the recurrent budget to meet maintenance needs.These allocations would also need to be protected so that they would not be diverted tomeet other expenditure requirements during the budget year, as has been the practice.The road sector is the largest consumer of the maintenance budget. For this sector it isrecommended that the Government put in place a mechanism with the followingcharacteristics to protect maintenance funds4 : (a) the protected funds would be used toundertake routine and periodic maintenance but not capital and major rehabilitationworks; (b) a portion of revenues from user charges (not all user charges and especially notthose from congestion or pollution charges) would be allocated towards meetingmaintenance needs; (c) stakeholders would participate in managing maintenance funds;and (d) controls would be put in place to avoid opportunistic and gaming behavior amongstakeholders. In roads, as well as in railways, the budgetary and planning process needsto be improved so that the appropriate levels and types of capital investments and
During a Workshop held in December 1996 to ratify this Transport Sector Strategy there was anagreement to direct adequate funds to maintenance and to shield such funds from diversion to other uses, aswell as to include stakeholders in decisions about maintenance priorities. Consensus was not reached onthe need for a road maintenance fund. The World Bank's experience, however, shows that until traditionalmechanisms for allocating and protecting maintenance funds are functioning appropriately, a roadmaintenance fund as recommended in this report is a good interim measure to ensure that prioritymaintenance is carried out.

v
recurrent expenditures are made. Critical to this end is the need to adopt a properclassification of expenditure items so that the effectiveness of capital expenditures can beestablished and the size of operating deficits determined. The practice of classifyingrecurrent expenditure items as capital expenditures needs to be stopped to prevent furtherdecapitalization of the infrastructure stocks. A key input to such a mechanism is a cleardefinition of what constitutes maintenance, rehabilitation, and reconstruction activities,and an adherence to these definitions in the budgetary process.
12. Capacity to Formulate and Implement Sector Policy. To ensure that theimbalances in the composition of transport expenditures are appropriately addressed,there is a need to strengthen the capacity to formulate and implement sector policy. Thisincludes improving the budgetary and planning process so that transport planning can beintegrated with other sectors. At present, there is no single body with responsibility forstrategic planning for both transport services (bus, rail, and shipping) and infrastructure(highways, ports, railway track and facilities). A key change to build capacity includesintegrating urban development and intermodal planning in transport sector strategyformulation. To ensure that urban development and intermodal issues are incorporated intransport planning and that the recommended reforms in budget and expenditureformulation are implemented, we recommend the creation of a body to be responsible fortransport sector policy and strategy. This body would also assist sub-national agencies.There is a need for representation to this body from concerned ministries andstakeholders, including provincial authorities, the private sector, and consumer groups.The functions of such a body should include: (a) overall planning for transport in thecountry with prioritization among different modes; (b) information gathering and analyticresponsibility to support key policy decisions; (c) development of policy guidelines fortransport infrastructure at national, provincial, and local levels; and (d) support toprovincial and local levels in planning and policy implementation including providing forcapacity building at these levels. Six options for such a body have been identifiedfollowing discussions with key stakeholders in two workshops in Colombo (seeparagraph 49). An evaluation, spearheaded by the TSPC, is ongoing of the pros and consof each option. The study is to be completed by early February, 1997, after which arecommendation will be made to implement one of the options.
13. Devolution and Capacity of Sub-national Agencies. Critical to improving theefficiency and effectiveness of public expenditures is the capacity of sub-national units ofgovernment. Provincial governments and other local bodies have been delegatedresponsibilities for transport service provision including roads and bus services. Ongoingdiscussions for devolution may result in transfer of even more responsibilities. Sub-national units have access to many sources of funds that they use for financingexpenditures on their devolved responsibilities. It is necessary to make sure that theexpenditures made do not duplicate those made by national agencies for similar types ofservices, and are coordinated across different modes such as road, rail, and ports. Thecapacity of sub-national agencies to undertake these responsibilities needs to bestrengthened, as at present they seem to be limited in their ability to implement theresponsibilities given to them, returning allocated funds at the end of each fiscal year.
vi
Furthermore, it is necessary to link their functional responsibilities to their revenuegeneration capacity and the system of intergovernmental transfers currently in place. Allprovincial governments should prepare a 3 to 4 year investment program with itemsindicating their revenue generation capacity. The funds required from the CentralGovernment should be identified by the end of each year on a program that could bemodified to ensure implementation at the beginning of the next fiscal year in order toreduce underutilization of funds.
14. Mobilization of Resources. To meet the projected expenditures in the sector itwill be necessary to mobilize funds from other sources including the private sector, usercharges, and fees. Reducing waste in the implementation of transport projects, especiallyin the road sector, would be a logical source of investment savings. The rail and portsectors are main candidates to attract private sector funds. The Government needs to putin place policies and incentives conducive to private sector participation in infrastructurefinance. Institutional reforms needed to achieve this objective include strengthening thecapacity of the BOI to handle investment proposals in transport. Improving the capacityto generate revenues from users of transport infrastructure and services would also allowthe Government to tap other sources of financing the needed expenditures in the sector.The Government needs to continue to rationalize the system of rail and bus tariffs toincrease revenue generation from users and reduce the dependence of sector agencies ontreasury to meet their recurrent cost needs. It is also critical to reform the system of roaduser charges to make them meet the revenue needs for modernizing, upgrading, andrehabilitating the highway network. Particularly, the Government needs to raise the levelof charges for larger vehicles who are currently not meeting even the financial costs ofdamage they cause on the highways. Critical to this end is a reform in the price and taxstructure for diesel as well as the system of licensing and registration of vehicles. Otherareas where savings can be generated are from restructuring the system of subsidyallocations in the sector, especially for school bus operations, to reduce the abuse of theexisting system and better target the subsidies.
C. MEDIUM TERM STRATEGY: ECONOMIC AND FINANCIAL SUSTAINABILITY
15. In the medium term, the proposed strategy focuses on two key aspects. The firstaspect relates to the role of government in the direct provision of services andinfrastructure in the transport sector. There is a need to define the appropriate share ofresponsibility between the public and private sector in transport, so that an effectivepartnership can be built to handle the demands of an export-oriented private sector-ledgrowth strategy. In particular, it is important to increase private sector participation intransport infrastructure and service provision, at all stages, including policy setting aswell as direct provision of services. The Government should create and adopt appropriateregulatory structures to ensure the efficient functioning of the public-private partnership.The second aspect relates to improving the efficiency of public sector agencies throughintroducing competition, making public sector management more market sensitive, andrestructuring pricing and financing systems.
vii
16. Role of the Government in Transport. The World Bank's experience in reformingthe transport sector indicates that successful reform involves a new role of theGovernment in the transport sector, less as a producer of services, and more as aregulator--the enabler of competition and the custodian of environmental and socialinterests5 . In general, the Government has a role when the potential for competition inservice provision is low, cost recovery from users is difficult, equity concerns areimportant, and externalities (environment) are high. In the short-term, given social unrestand the growing fiscal problems, policy will need to concentrate on improving theefficiency of planned public investments in the sector. In particular, efficiencies willneed to be sought so that more can be accomplished with existing allocations and efforts.The Government should seek ways of improving the quality of services rendered underexisting allocations, mainly by focusing on maximizing the number of passenger andfreight units served per dollar of investment than the number of employees per passengeror freight unit. In the medium and long-term, policy needs to address the appropriate roleof government in each of the transport subsectors. Recommendations in this regard aremade for each subsector in subsequent sections of the report.
17. Private Sector Participation. There are a number of expenditures that will need tobe made in order for the transport sector to support the expected projections for economicgrowth. Key among these are modernization and expansion of the facilities at the ports aswell as improvements in the reliability and connectivity of land transport systems,especially railways. The Government should seek private sector participation in thefinancing and execution of these activities. This is critical not only for addressing thebudgetary pressures that such activities would create on public sector finances, but also toinject into these activities the client focus and financial discipline that accompaniesprivate sector participation.
18. Regulation and Control. The Government needs to strengthen its regulatoryfunctions in terms of enhancing and managing competition in urban bus transport as wellas in road construction, rehabilitation, and maintenance. Misguided controls, such as inhiring and firing of personnel at the port or in making procurement decisions for railwayoperations, reduce the autonomy of line managers and delay processes of implementation.The Government will need to reduce the extent to which it interferes in day to daymanagement of transport services, focusing its efforts on concerns such as managingsafety and reducing air pollution. There is a need for an independent regulator who isonly answerable to parliament, who will play a fair and just role by introducingregulations for public and private sector institutions and organizations providing transportinfrastructure and services.
19. Improve Efficiency of Public Agencies. For those supply activities that willremain under the responsibility of the public sector, reforms will be needed to introducemore competition in the production of transport services and facilities, make public sectormanagement more market sensitive, and restructure the pricing and financing systems
Sustainable Transport: Priorities for Policy Reform. The World Bank, 1996.

viii
currently in place. These reforms, in addition to properly directed investments to meetcapacity expansion and modernization requirements, as well as the long-term needs formaintenance and upkeep, will contribute to higher efficiency in the sector, an elementthat is key to achieving and sustaining the high levels of growth Sri Lanka aspires.Recommended reforms include introducing competition in the provision port and railservices that are now in the hands of public monopolies which is critical to make theservice operators more sensitive to customers' needs, and reduce the costs of serviceprovision. Enhanced intermodal competition for freight markets will also be possiblewhen the efficiency of railway freight operations has been improved by allowing contractaccess for freight services. Franchising bus routes would also allow more effectivecompetition in the provision of bus services. To ensure that competition is effective, it isnecessary to subject the RCDC to hard budget constraints. Other institutional reformsrelate to refining the ongoing clustering of peoplized companies, and strengtheningNTC's capacity to manage the competition process. Regulatory reform to enhance thedegree of competition and control the negative costs of transport such as accidents andpollution is needed to prevent future loss of market share from public transit to the privateautomobile, thereby obviating the need for expensive investments in capacity expansionof the existing system of roads. Commercialization of the remaining activities in thepublic sector-- provision of road infrastructure, operation of activities at ports, andrailway passenger services--would also improve the efficiency of these activities.Detailed recommendations for reform in each of the subsectors along these lines follow inSection E of the Executive Summary.
D. LONG TERM STRATEGY: ENVIRONMENTAL AND SOCIAL SUSTAINABILITY
20. Three key issues are dealt with in the proposed long term strategy. The firstrelates to the need for more efficient management of congestion, pollution, and safety.The second has to do with integrating the needs of the poor for access and mobility intransport strategy and policy setting. The third focuses on the processes by whichtransport investments are made and managed; recommending that participation ofstakeholders including the rural poor in planning and implementation be enhanced.Reforms and investments to address participation and rural concerns as well ascongestion, pollution, and accidents are discussed under the sector-specific reforms insection E.
21. Congestion and Pollution. Estimates indicate that the cost of congestion in theWestern Province (Colombo Metropolitan Region) was around Rs. 550 million (US$ 9million) in 1995. The degree of congestion and associated cost is expected to double overthe next decade. In addition, estimates indicate that for a 6% increase in GDP, thedemand for road space increases by 8%. Measures outlined in Clean Air 2000 need to beimplemented in order to control the effects of congestion. Demand side measures shouldbe given first priority, given the fiscal crisis and the limited ability to expand capacity andrestructure institutions in the short term. Such measures need to ensure motor vehicle

ix
users pay the full cost of driving. Among the instruments available are congestionpricing and parking fees and other traffic restraint measures. On the supply side, priorityshould be given to restructuring of the public and private bus systems, to improve theirreliability, frequency of service, comfort, and level of safety, to attract more consumers totravel on buses. Upgrading the suburban rail system to mass transit standard is also apossibility. This is an activity that can be concessioned out to the private sector on anegative bid basis as has been done in Argentina.
22. Other supply side options to reduce congestion include the construction of keyhighway improvements and new highways to develop a better network. Given thedensity of the highway network in Sri Lanka, and the high costs of providing newhighways in terms of land acquisition and relocation, this option is more limited.Furthermore, capacity improvements may not always lead to reduction in congestion, asthey may result in attracting more traffic. Other options that have been defined in CleanAir 2000 need to be considered when the appropriate institutional structures are in place.These include: (a) set standards for import of vehicles by age and fuel efficiency,especially for operation as buses, school, and office vans and for encouraging thepurchase of four-stroke rather than two-stroke motorcycles and three-wheelers; (b)undertake more efficient inspection of vehicles to ensure they meet standards; (c)implement fuel reformulation policies; and (d) encourage and support the use of non-motorized transport (bicycles and animal drawn vehicles) and make provisions forpedestrians in urban areas (see paragraphs 41 and 42).
23. Safet. In addition to the costs of congestion, are the costs of accidents. The levelof safety in Sri Lanka is low compared to its East Asian neighbors which have muchhigher levels of motorization. Measures to ensure safety would involve structural andinstitutional reform, including setting up systems for transportation planning and trafficmanagement.
24. Poverty and Rural Mobility. Poverty alleviation requires a transport policyfocused on the poor. Lack of such a policy and the respective information basis in SriLanka has made it difficult to analyze how the transport sector is doing vis a vis the poor.It has been assumed that the mobility needs of the poor can all be resolved by improvingtransport networks and public transport services in rural areas. However, it may notalways be cost-effective to alleviate poverty problems through the transport sector alone.In particular, transport services do not and cannot penetrate all rural areas. Problems ofmobility and access are acute in such disadvantaged areas. In these areas attention needsto be focussed on means and modes of travel other than public transport services.Transport policy has to include promoting non-motorized modes and providing local ruralroads in such areas. Moreover, a large proportion of rural dwellers are low incomeearners, and there is a need to look at the distributional consequences of transportinvestments and policies.
25. Focus on Access to Service. To improve access of rural dwellers to service it isnecessary to have a transport policy that includes the needs of rural populations, beyond

x
those of providing for mobility. At present, the most time consuming activity in ruralareas is collecting water. Policies that improve rural water supply and also provide non-motorized means of transport for rural dwellers can go a long way to improving ruralproductivity. At present it is Government policy to establishyprimary schools in villageareas, and research studies conducted by the NTC and others show that there is a primaryschool within 2 km of many village centers. Access to secondary schools is still aproblem, with children having to travel on average 5 to 10 km away, and sometimes up to30 km or more in more remote rural areas. There is a critical need to link transport policyto education policy to meet these demands. Other access solutions include the use ofmobile banks and clinics; in other words, bringing the facilities closer to the people.Critical to improving the access to services is the need to know the distributionalconsequences of transport investment. Ability to measure distributional consequenceswill become more critical as the government reduces its role in the direct provision ofservices and fosters private sector provision and competition. The Government shouldcollect information on price differentials, expected savings in transport costs as a result ofimproving services, and wages and prices in rural areas, to measure the distributionalimpact of transport policies. Using such information, decisions to provide transport foraccess to services can be made more optimal.
26. Participation. Given the limitations in information available to make detailedassessments of the best ways of meeting the needs of the poor, it is imperative to fosterthe participation of rural communities. This will ensure that the perspectives of ruralpeople and poor communities are included in the setting of policy. Where povertyalleviation programs exist and unemployment levels are high, participation of rural laborto improve roads can provide a least cost option for carrying out such works.
E. SECTOR SPECIFIC REFORMS
27. Ports. A major problem facing the port sector is providing adequate capacity tomeet demand for transshipment growth, to enhance revenue earnings in foreign exchangefor the country. Other problems result from constraints imposed on the port sector byvarious interventions. There is a tendency for the port to be used as an employmentgenerating entity which contradicts the pursuit of normal port objectives such as efficientport operations. As a result, port management is weakened, productivity is lowered, andtimely provision of services is hampered. These problems impose high direct andindirect costs for provision of port services, with two significant consequences--loss ofmarket share for international transshipment and higher economic costs of providing forport infrastructure and services.
28. The port sector is embarking on a very costly, but needed, expansion plan. Due tofiscal problems facing the country, it may be difficult to finance the required capacity
6 See Diandas J. and M.J. Sahabandu, "Study on Subsidy Allocation in Rural Transport and Operation ofBus Services on I ,remunerative Routes", June 1996, in Volume II of this report.

xi
expansions (such as for common access facilities) entirely from public funding sources.Seeking partnerships with the private sector may be the only available option to meet thefinancing needs for expansion. The Government would need to select partnerships thatnot only provide the necessary financing but meet the objectives of a planned portexpansion and modernization plan, and lead to improved efficiency, enhancedproductivity, and lower operating costs. Critical to efficient competition in a public-private partnership is the need for a level playing field among various port operators,including similar treatment for tax incentives including import tariffs for capital goods,access to loans, and control over tariffs.
29. The following recommendations need to be implemented as soon as possible andprogress on implementation should be monitored by the highest Government levels, on acontinuous and sustainable basis. To improve the efficiency of investments in the portsector, the Government should implement the institutional strengtheningrecommendations and action plan from the OECF financed study. The port authorityshould focus its efforts on the main port-related activities by disposing of all non-portrelated activities to autonomous entities or private sector organizations. To furtherincrease the efficiency of investments in the port, it is necessary to carry out therecommended Port Development Study (Phase I and II) under the PHRD grant.
30. For economic and financial sustainability in port operations it is important toreduce the role of government in direct provision of port services, focusing efforts onmanaging competition and regulation. This would require enacting legislative reforms inthe port sector to enhance private sector participation. The port authority should adopt a"landlord" strategy in the provision of port infrastructure and services, where it retainsownership of assets and responsibilities for development of common user facilities butallows private sector participation by earmarking certain operational activities forpartnership with the private sector through concessions, leases, joint venturing, BOT
7and/or BOO. A landlord strategy may require creating an independent Port Regulator7.To increase the degree of autonomy, it is important to shield port management andoperations from political structure interference. To establish some competition inhandling containers of Sri Lankan imports and exports, it would be desirable to allowdifferent operators to operate different terminals. This would require the following steps:short term actions for cost containment purposes and medium term actions to create anenabling environment for private sector participation. Among the short term actions are:(a) allow public-private partnerships to operate berths at the ports on a BOTIBOO basis toimprove throughput, productivity, and efficiency. Public-private partnerships should beselected according to a clearly defined process with clear goals and objectives; and (b)rationalize the port's labor force through negotiations with the unions to reach agreementon voluntary retrenchment, golden handshakes, early retirement and possible retraining.
7During the December 1996 Workshop to ratify the recommendations made in the Transport SectorStrategy, two members of the discussion group declined endorsing this recommendation in favor oflooking at options other than the landlord strategy.

xii
It worthwhile to note that the port has a very large redundant labor force and at the sametime is short of skilled stevedores.
31. In the medium term, it would be necessary to: (a) strengthen port planning andmanagement decision-making capabilities by providing qualified staff competent inoperation research techniques and modem management methods; (b) undertake therecommended development by the UDA of 700 ha adjacent to the port to relieve thepressure for land shortage; (c) implement the Inland Container Depot (ICD) utilizing therail link, possibly to be operated by a public-private partnership; and (d) initiate andimplement a marketing study to attract private sector participation. More measures areneeded to further increase efficiency of port operations, and should be given high priority:(a) rationalize the tariff structure at the port; (b) establish incentive-productivity basedschemes for port employees; and (c) introduce national Electronic Data Interchange (EDI)systems and further develop port EDI systems.
32. To ensure that port investments and activities are environmentally and sociallysustainable the Government should give high priority to: (a) improve the port's safety byadopting a safety code and replacing obsolete floating craft according to SLPA'srequirements; (b) improve and monitor environmental conditions at the ports byproviding private sector operated ship waste collection and disposal facilities, as well ascreating and enforcing environmental safety rules and code of practice; and (c) undertakea Port efficiency Improvement Project and improve the capacity to carry out portmarketing. The key actions and investments required in the port sector along withtentative cost estimates and timing are summarized in section G and discussed in detail inChapter IV, section C.
33. Roads. Sri Lanka is a road dependent economy. The road network covers thecountry adequately, but is in serious state of disrepair, with only 10% of the paved roadnetwork in good condition. The immediate concern in the short run, to increase theefficiency of road investments, is to resolve the maintenance neglect problem. Amongthe reasons for maintenance neglect, is that funds allocated to maintenance are diverted tomeet cost overruns and counterpart funds for foreign-financed projects. To address theserious backlog in maintenance it is necessary first to increase recurrent expenditureallocations for road maintenance, especially for the provincial and local road network. Toensure that these funds are appropriately used for maintenance, there is a need to developmechanisms to protect funds allocated to maintenance. The Bank's experience in othercountries indicates that a Road Maintenance Fund can provide such a mechanism (seeBox 7 on the case for and against road funds).
34. To reduce the impact of cost overruns and other inefficiencies in the provision ofroad works, which make the cost of road provision in Sri Lanka very high, there is a needto: (a) reduce the amount of time it takes to process projects; and (b) increase the degreeof competition in the provision of road works. The tendering and project appraisalprocedures need to be reformed in order to reduce project preparation and implementationtime. The roles of the Road Development Authority (RDA) and its subsidiary the Road
xiii
Construction and Development Company (RCDC) need to be redefined. In the shortterm, the RCDC should compete with the private contracting industry on an equal footingfor contracts in road improvement and maintenance. In the medium term, the RCDCshould divest its activities in operation of quarries, asphalt plants, and the leasing ofconstruction machinery and equipment to the private sector. In the short-term, and untilthe private sector can handle these activities, the RCDC should use prices for leasingequipment to the private contractors that reflect the true cost of maintaining andreplenishing the fleet. However, care should be taken to make sure that inefficiencies inmaintaining the equipment fleet are not transferred to the private contractors. The currentprocess of contracting out maintenance activities and domestically funded rehabilitationto the private contractors should be continued, with particular attention to increasing thedegree of competition for the works. The RCDC should continue to reduce its directinvolvement in carrying out works and increase participation by local private contractors.Appropriate support should be provided to the local construction and consulting industryto facilitate its development, as is being done in other countries such as Bangladesh.Once a sufficient number of capable domestic contractors are available, the RCDC shouldbe converted into a management body, providing project management services to thelocal contracting and consulting industry. This would require transferring managementcapacity and training from the RCDC to domestic contractors and consultants. Criteria tomonitor this phasing out process need to be developed.
35. The Government has already taken action to implement some of theserecommendations. Following recommendations from an ADB financed study, theGovernment is setting up a permanent tender board with a technical evaluation committeeand a full time secretariat to be responsible for all procurement procedures. Guidelineshave also been issued on the allowed processing time for feasibility studies andconsultant reports to less than 3 months, and less than 3 months for the tendering process.Also following a Cabinet Decision on October 16, 1996, the RCDC is to compete withthe private sector for road improvement contracts, and RDA is to stop giving any roadimprovement contracts to the RCDC without such competitive bidding.
36. Other measures targeted towards improving the capacity of the private sector,especially small scale enterprises (SMEs) include: packaging contracts and designingcontracting programs at a scale and scope suitable for SMEs, providing training forSMEs, modifying prequalification criteria for the SMEs, extending mobilization advancesto SMEs, coordinating with other donors on the need to support the local constructionindustry, and developing credit schemes for the private sector to obtain machinery inorder to establish a competitive market. The key actions and investments needed in theroad sector are summarized in Section G and discussed in detail in Chapter IV Section B.
37. Road Transport. To improve the efficiency of investments in road transport,urban and regional development and transport planning should be coordinated so thattransport and development plans are consistent and reasonable. It should no longer bepossible, for example, to prepare a development plan for the Southern Region without atransport component, as was recently done. For institutional strengthening, in a

xiv
discussion of the recommendations of this report, the proposal recently approved inCabinet to create special human settlement committees at the provincial and districtlevels, was endorsed. These committees, to be chaired by the chief secretary of theprovince or district will include the relevant provincial and district officials as well asrepresentatives from relevant national agencies.
38. To attain economic and financial sustainability, it is necessary to rationalize busfares, restructure the bus industry, and enhance competition in the provision of busservices. Bus services-provide important social benefits, and it is important to maintainselective subsidies for non-economic rural bus routes and low fares for poor schoolchildren. With these exceptions, however, bus fares should be raised to a level that wouldallow an efficient bus operator offering service without excessive overloading to recoupthe costs of providing that service, including an adequate reserve to replace their busesapproximately every 9 or 10 years. Chapter IV, section D of this report, provides detailsof the formula to use to determine fare increases. To ensure that fares keep pace withcosts despite political pressure to hold fares down, it is recommended that a law be passedrequiring the NTC to phase in price increases and to approve regular annual fare increasesin the manner described in the formula. The law would stipulate that the increases wouldnot be subject to Cabinet approval, although Parliament could review and disapprove anincrease if it thought it inappropriate. If the Government decides not to raise fares forpolitical reasons, proper compensatory measures need to be put in place, to allow busoperators to meet their operating costs.
39. There is a need to restructure the system of providing bus services in Sri Lankawhich is now shared by the private sector and joint public-private "peoplized" companies.This will require maintaining the positive aspects of competition and public/privateprovision while minimizing the negative aspects related to accidents and congestion.First, the present 93 "peoplized" companies should be clustered to achieve economies ofscale and improve their management and performance. There is a law currently beforeParliament proposing to have 11 companies. During discussions of the recommendationsof this report, there was sentiment that it might be advisable to have more than 11companies to enhance competition. Private buses should remain unclustered for at leastseveral years in recognition that the proposed consolidation in the bill before Parliamentmight reduce some of the advantages of low costs and overheads that the privateoperators currently enjoy. In the interim, the NTC and PTAs ought to use their statutoryauthority to supervise schedules, dispatching and evening services so as to improve thequality of service that the private and peoplized companies offer. Such regulatoryauthority is being used on an experimental basis in the Western and Southern provincesand needs to be applied to other provinces. If the NTC and PTAs are unable to improvethe performance of the private sector, then forced consolidation and a system ofcompetitive bidding for exclusive route franchises for limited terms of 5 years need to beintroduced. Such franchise arrangements should allow restructured "peoplized"companies to compete or merge with private operators to bid for the franchise. To ensureimplementation, it is necessary to strengthen the capacity of the NTC and PTAs tosupervise bus operations. Also necessary is the need to affirm that the peoplized as well
xv
as the private companies are subject to the regulatory authority of the NTC and the PTAs.The Government should monitor the efforts of the NTC and PTAs to improve busservices.
40. In discussions of the recommendations of this report in the December 1996Workshop in Colombo, it was agreed that there might be an argument for providing somefinancial support for the "peoplized" bus companies as long as they are providing sociallyimportant services, such as night and early morning services or school fares, that theprivate companies were not providing. However, to the extent that the differencesbetween the private and peoplized companies in this regard are narrowed, then it weakensthe case for special aid to the peoplized companies in the form of buses sold at below costand other means of support.
41. For social and environmental sustainability in road transport, the Governmentshould support the use of non-motorized transport and intermediate technology modes.Non-motorized travel includes walking as well as bicycles and bicycle trailers. Thesupport should take the form of aid for research and development (R&D) as well as theencouragement of the dissemination of information on these modes. In the case ofwalking, support should also take the form of the construction of sidewalks andpedestrian crossings on congested streets in urban areas. A key institutional componentneeded to ensure the proper balance across transport modes is the need to establish a unitwithin the Ministry of Transport, Environment, and Women's Affairs to sponsor R&Dand dissemination by NGOs and others. At the local level, urban councils should beaided in the construction of sidewalks and pedestrian crossings. Provision of sociallybeneficial bus services should be improved. In particular, the practice of competitivebidding for non-economic rural bus services should be expanded, with private as well aspeoplized companies participating in the bidding. In addition, processes for targetingconcessionary fares to poor children and introducing those fares on private buses shouldbe explored. This would require strengthening the capacity of the NTC and the PTAs tosupervise rural bus services and school fares.
42. Efforts are also needed to control the congestion and pollution generated byprivate motor vehicles. Measures recommended include: (a) controls on parking andother measures to discourage the use of private motor vehicles in congested and pollutedurban areas; (b) priority for buses in the allocation of street space in congested urbanareas; and (c) raising the cost diesel private motor vehicle use, excluding buses andperhaps trucks. These measures could include increases in the annual and newregistration fees for targeted diesel vehicles. To control air pollution, more attentionneeds to be paid to particulate emissions. Sri Lanka is in serious violation of WHOambient air standards for particulates while it complies with WHO ambient standards forlead. Additional efforts to control particulate emissions include: (a) better enforcement ofexisting laws against poorly maintained and heavily polluting diesel vehicles. Inparticular, enforcement against "belching" vehicles can be improved by using simplePolaroid cameras; and (b) importing crude oils with lower sulfur content or othercharacteristics that might reduce particulate emissions. There is a need to strengthen the
xvi
capacity to enforce emission laws and to develop practical measures to control traffic andcongestion, and to reduce particulate emissions. The key actions and investments neededin road transport are summarized in Section G and discussed in detail in Chapter IVSection D.
43. Railways. Looking at the historical capital outlays for the railway suggests thatthe Government has invested quite heavily in railways. However, official records grosslyoverestimate the real capital expenditures due to misclassifying recurrent expenditures ascapital expenditures. The railway infrastructure and rolling stock is deteriorated and inbad need of repair, reducing the quantity and quality of service the system is able toprovide. There is a need to address the problem of misclassifying recurrent and capitalexpenditures so that rational allocations can be made to meet the needs for rehabilitationand maintenance, as well as capital. Critical to this end is upgrading of the ManagementInformation Systems (MIS) and accounting procedures at the railway.
44. For the railway to be able to compete efficiently with the road sector, there is acritical need to restructure the operations of the SLR. While the railway plays animportant economic role in the commuter passenger market, it is marginally utilized forfreight transport. Intermodal competition has eroded the railway's pre-World War II'smonopoly on land transport to only 12% of the passenger market and 6% of the freightmarket. Given the structure of the transport industry at present, the railway will continueto depend on transfers from treasury for meeting part of its operating costs as well ascapital needs. However, there is a critical need to improve the operational efficiency ofthe railway.
45. The Government has just completed preparing a structured Business Plan for therailways which identifies four key railway markets°: (a) suburban passenger services; (b)long-distance express passenger trains; (c) non-stop fast freight trains; and (d) specialpurpose non-stop unit trains for bulk freight. The Sri Lanka Railroad (SLR) should focusits efforts on meeting the needs for travel of the suburban passengers, mainly because itcurrently does meet a large share of its operating costs on these markets, but also becausethere are social and environmental benefits in terms of reduced congestion and airpollution. There is a need to develop a public sector obligation contract (PSO) betweenthe Government and SLR that ties the level of subsidies for suburban passenger servicesto external benefits such as reduction in road vehicle operating costs and congestioncosts. It would be necessary to finance a study to quantify and design PSO contractsbetween the Government and the SLR for provision of passenger services.
46. In a Policy Statement from the Ministry of Transport, Environment, and Women'sAffairs for 1997, the Government has accepted in principle a policy to open access to therailway track and other rail facilities. Under an open access policy, SLR would make
Policy Statement, Ministry of Transport, Environment, and Women's Affairs, by the Honorable SrimaniAthulamudali, for 1997.
xvii
available track to private freight operating companies, in return for access payments,which would provide a source of revenue to the railway. This would allow the SLR tofocus on the key services to its passengers. The SLR and BOI (assisted with otherGovernment agencies) should continue to advertise and develop contract accessagreements with freight shippers and other potential carriers. To allow the SLR tooperate based on commercial reality and to enhance its capacity to deal with the privatesector on matters of open access and other joint ventures, as well as to make it an equalpartner in negotiating access and PSO agreements, it is necessary to permit it to functionon the basis of sound business practice and to invest in human resource development.The latter would include training on accounting and modem management techniques, aswell as establishing a commercial business unit, separate from the railway's passengerservices, so that the SLR can properly manage the access and PSO contracts in addition toother services remaining under direct provision by the SLR. It should be pointed out,however, that there are few examples of efficiently operated railway services, free ofpolitical interference, in the developing world.
47. In the case of long-distance passenger services, the Government should rationalizethe provision of these services by adjusting price levels to reflect the full costs ofproviding these services. There is an ongoing evaluation of a proposal to electrify asegment of the Colombo-Kandy line on a BOT/BOO basis. The Bank recommends thatthis proposal be thoroughly evaluated before a decision is made to continue with theinvestment. In particular, the electrification proposal needs to be justified on aneconomic and financial basis, and compared to investments such as upgrading theexisting services on rail without electrification, and improving conditions on the parallelhighway. Concerning local passenger rail services, the SLR should transfer theseservices to road in cases where they can be provided more efficiently by bus. Costrecovery for local passenger services is very low, and it has been found that few of thebeneficiaries of these services are poor with no other options. There is a need to evaluatethe remaining local passenger services on a case by case basis to determine if a publicservice obligation exists.
48. Intermodal Transport. The transport sector in Sri Lanka is not geared to providingefficiently for intermodal transport. The current systems are aged, obsolete, andcongested, and there is no logistic support and intermodal connection for a seamlessservice from the point of view of a freight shipper or a passenger. There are a number ofopportunities presenting themselves, allowing the country to address these limitations.First, there is growing demand for intermodal services, mostly deriving from the exportmarkets. Second, there is interest from the private sector to invest in intermodal transportand logistic support. Finally, the preparation of a transport sector strategy presents anopportunity to deal with intermodal concerns.
49. At present there is no single body with sufficient clout to undertake the planningand implementation for intermodal concerns. There are multiple agencies with poorcoordination, making decisions and investments on separate modes. Six possible optionsfor reform were considered: (a) strengthen the Interministerial Committee (IMC) set up to
xviii
oversee intermodal planning issues; (b) operationalize the transport sub-committee withinthe NDC to take over intermodal planning issues; (c) create a National TransportAdministration (NTA) and pass a law to allow the NTA to make and enforce policydecisions on intermodal matters; (d) create a new Ministry combining the presentMinistries of Transport with that of Highways for better intermodal planning; (e) widenthe scope of the NTC to take over responsibility for intermodal planning as is beingconsidered in the amendments to the NTC Act; and (f) create a council of Ministers,similar to the group that meets to make decisions on exports, to take responsibility forintermodal planning. These six options are currently being evaluated by the TSPC afterwhich a final recommendation will be made (see paragraph 12). There is also a need tostrengthen the capacity of sub-national agencies for intermodal planning andimplementation.
50. To ease the use of public transit systems it is recommended that infrastructureinvestments be made to create proper intermodal links between road and rail. For moreefficient freight movements, investments in rail-to-port and road-to-port linkages for theproposed ICD project need to be considered for provision under a public-privatepartnership. It is also critical to invest in upgrading the system of feeder roads to increasethe efficiency and reliability of land transport services. On the service side, to enhancefeeder bus-to-rail services consideration should be given to a single ticketing system forroad and rail transport for these services, as well as the potential for contracting out theoperation of feeder bus services to service rail stations to the private sector. Investmentsin EDI, informatics, and logistics would be critical to improve the processing of freight atthe port, as well as at depots and other points in the logistic chain. Also needed arereforms in the customs clearance and documentation procedures at the port.
51. There is a critical need to strengthen the capacity of the BOI to handle privatesector investment proposals of an intermodal nature. With such capacity, theGovernment can seek strategic alliances with the private sector for intermodal concerns(containerized transport, port terminals, ICD). The BOI can also be the agencyresponsible to make sure that private investments in telecommunications are linked withthe needs in transport for the provision of EDI, informatics, and logistic services.
F. POLICY IMPLEMENTATION PROCESS
52. This strategy paper was prepared in a consultative manner with participation fromhigh level Government officials, representatives of the private sector, public sectoragencies, user associations, academics, and representatives of the major donor agencies(see Annex 3 for a list of participants). Two workshops were jointly chaired by theWorld Bank and the Transport Studies and Planning Center (TSPC) in Sri Lanka. Toensure that the participative effort for policy formulation is continued and to improve thecapacity to implement policy in the transport sector, it is recommended that theconsultative approach be used to: (a) conduct an annual progress review; (b) update thispolicy document; and (c) prepare annually an expenditure program for the following year,

xix
consistent with the recommended policies. It was agreed during the December 1996Workshop that the World Bank would continue to chair meetings for these purposes withthe TSPC. The policy ratification process mentioned above needs to be incorporated intobudgetary policy to ensure implementation.

xx
G. LOGICAL FRAMEWORK FOR THE TRANSPORT SECTOR STRATEGY
TrAns ! Strate gy in Other Sectors_ _ _ _ _ _ _ _ _ _ _ _ _ _ _ _ _ _ _ _ _ _ (C A S)
• Address the imbalance *reduce:role of *more efficientin the composition of government in direct management oftransport expenditures: provision of transport congestion, pollution,=> between modes; => role of and safety
and public/private * integrate needs of poor> recurrent/capital sector for access and mobility
allocations => private sector in transport strategy* strengthen capacity to participation . enhance participation in
formulate and => regulation and planning andimplement sector control implementationpolicy: * restructure public sector=> national level agencies and
agencies introduce/enhance=> sub-national competition
agencies* Mobilize funds from
other sources:=> private sector; and=> user charges/ fees

xxi
H. SUMMARY OF RECOMMENDATIONS FOR TRANSPORT SECTOR STRATEGY
Objective 1: Improve Efficiency of Transport Investments
iIflJwPlc;. Iu Ds ti iliCo s. ____________
Address the * Create a mechanism to * Strengthen capacity of * Increase recurrent expenditureimbalance in the protect maintenance line agencies to allocations for maintenance incomposition of funds formulate budgets railways and roadstransport * Restructure * Include suggested * Upgrade railway accounting andexpenditures classification of capital institutional changes MIS capabilities to better definebetween modes and maintenance in Public Expenditure maintenance and capitaland recurrent activities in railways Review process improvement needsversus capital * Incorporate recommendations inallocations Public Investment ReviewStrengthen * Integrate urban * Create body to be * Evaluate the six possible options forcapacity to development and responsible for a single transport body andformulate and intermodal planning transport sector recommend oneimplement sector into transport sector strategy formulation * Implement OECF's institutionalpolicy strategy formulation * Strengthen capacity of strengthening recommendations and
* Reform tendering and sub-national agencies action plan ($ 2 million)project approval to carry out devolved * Implement human settlementprocess responsibilities for communities at provincial and
transport service district levelsprovision * Implement ADB recommendations
* Create a permanent to reform tendering and projectagency for tendering approval processand project approval * Evaluate proposed rail access to
ICD and Colombo-Galle connectionImprove the * Rationalize system of * NTC and PTAs to * Undertake study to determine buscapacity to bus tariffs adopt fare setting fare increases and devise cost indexgenerate * Reform system of road formulae for raising faresrevenues from user charges * Pass law requiring * Draft fare increase lawusers * Restructure tariffs at NTC to approve fare * Undertake Port Development Study
the port increases * Undertake PSO study for rail* Rationalize rail tariffs * Develop PSO services
contracts betweenGovernment and SLR
Mobilize funds * Announce open access * Strengthen capacity of * Continue to advertise and developfrom private policy for railway BOI to handle private contract access agreements for railsector freight sector investments in * Undertake Port Development Study
* Seek strategic alliances transport (PHRD)with private sector forport modernization andexpansion
xxii
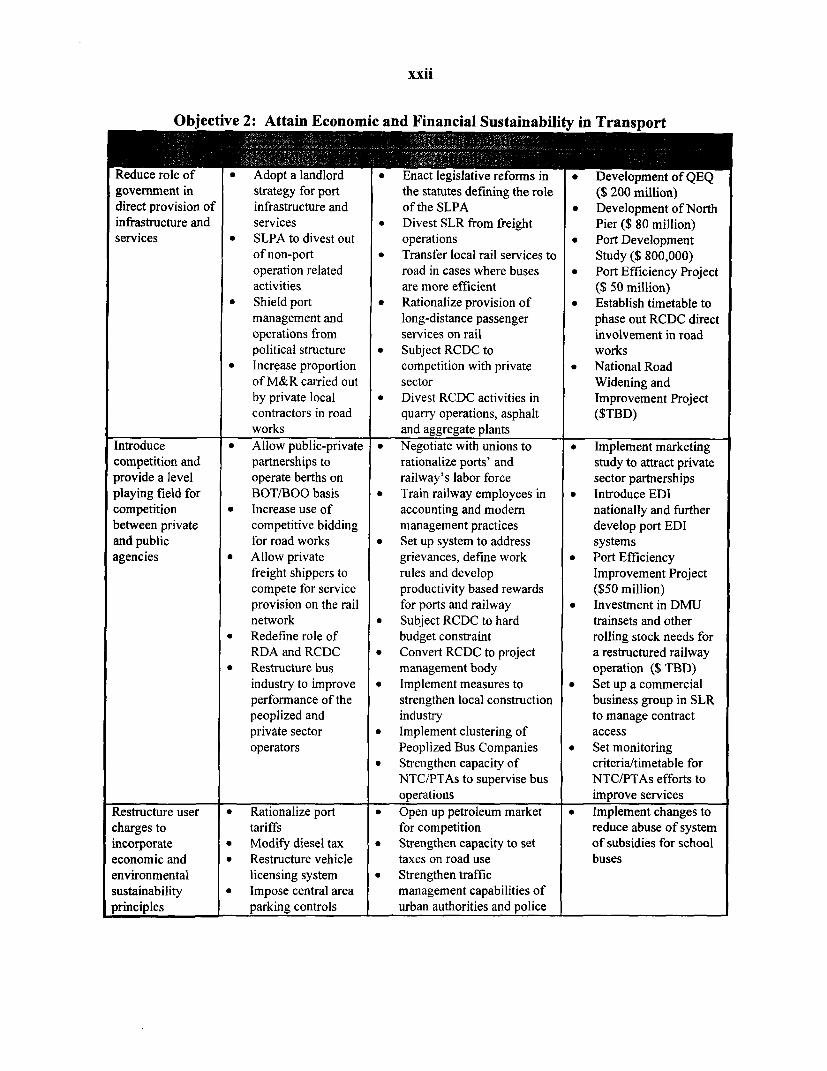
Objective 2: Attain Economic and Financial Sustainability in Transport
Redce oleof * Adpt a landlord * Enc leislative reforms in * Development of QEQgovermentin strategy for port the statutes def ning the role ($ 200 million)diret poviion of infrastructure and of the SLPA * Development of North
infrastructure and services * Divest SLR from freight Pier ($ 80 million)services * SLPA to divest out operations * Port Development
of non-port * Transfer local rail services to Study ($ 800,000)operation related road in cases where buses * Port Efficiency Projectactivities are more efficient ($ 50 million)
* Shield port * Rationalize provision of * Establish timetable tomanagement and long-distance passenger phase out RCDC directoperations from services on rail involvement in roadpolitical structure * Subject RCDC to works
* Increase proportion competition with private * National Roadof M&R carried out sector Widening andby private local * Divest RCDC activities in Improvement Projectcontractors in road quarry operations, asphalt ($TBD)works and aggregate plants
Introduce * Allow public-private * Negotiate with unions to * Implement marketingcompetition and partnerships to rationalize ports' and study to attract privateprovide a level operate berths on railway's labor force sector partnershipsplaying field for BOT/BOO basis * Train railway employees in * Introduce EDIcompetition * Increase use of accounting and modem nationally and furtherbetween private competitive bidding management practices develop port EDIand public for road works * Set up system to address systemsagencies * Allow private grievances, define work * Port Efficiency
freight shippers to rules and develop Improvement Projectcompete for service productivity based rewards ($50 million)provision on the rail for ports and railway * Investment in DMNJnetwork * Subject RCDC to hard trainsets and other
* Redefine role of budget constraint rolling stock needs forRDA and RCDC * Convert RCDC to project a restructured railway
* Restructure bus management body operation ($ TBD)industry to improve * Implement measures to * Set up a commercialperformance of the strengthen local construction business group in SLRpeoplized and industry to manage contractprivate sector * Implement clustering of accessoperators Peoplized Bus Companies * Set monitoring
* Strengthen capacity of criteria/timetable forNTC/PTAs to supervise bus NTC/PTAs efforts tooperations improve services
Restructure user * Rationalize port * Open up petroleum market * Implement changes tocharges to tariffs for competition reduce abuse of systemincorporate * Modify diesel tax * Strengthen capacity to set of subsidies for schooleconomic and * Restructure vehicle taxes on road use busesenvironmental licensing system * Strengthen trafficsustainability * Impose central area management capabilities ofprinciples parking controls urban authorities and police

xxiii
Objective 3: Attain Social and Environmental Sustainability in Transport
sector strategy to the people transport projects Rehabilitation and* Support use of non- * Create a unit within Maintenance Project
motorized and Ministry of Transport ($ TBD)intermediate means of to sponsor R&D and * Rural Access
transport dissemination on NMTs IMProveMent ProjeCtp Extend competitive by NGOs and others ($ TBD)
bidding for providing | Assist local 0 Study to targetnon-economic rural bus govermments in the concessionary fares toservices to both construction of poor children andpeoplized and private sidewalks and introduce those farescompanies pedestrian crossings to private buses
. Explore measures to b Expand role of SMEstarget concessionary in the development offares to poor children transport infrastructureand introduce those and servicesfares on private buses Support SMEs'
. Adopt where feasible manufacturing for non-
project designs to focus motorized andon labor generation intermediate means of(particularly female) in transportthe construction and * Strengthen capacity ofmaintenance of roads NTC and PTAs toand other transport supervise rural businfrastructure services and school
faresControl effects of * Institute parking * Create and enforce port | Replace obsolete
congestion, pollution, controls and other safety rules and codes floating craftand accidents traffic restraint of practice * Provide private sector
measures * Monitor environmental operated ship waste* Give priority to buses in conditions at ports collection and
the allocation of street | Strengthen the capacity disposal facilitiesspace in congested to undertake traffic * Study to deftneurban areas management methods practical measures to
. Tax use of diesel for for congestion control control traffic andprivate motor vehicles and safety congestion, and
* Charge trucks full cost * Strengthen inter-agency reduce particulateof damage to roadway coordination to emissions
. Import crude oils with incorporate land-use * Transport serviceslower sulfur content to considerations in improvement project
reduce particulate transport planning ($TBD)emissions * Strengthen capacity to * Electrification on
enforce emission laws Colombo-Kandy linel_______ _______ |_____________ _ on BOT basis ($TBD)


SRI LANKA
TRANSPORT SECTOR STRATEGY STUDY
I. INTRODUCTION
A. OBJECTIVES AND SCOPE
1.1 The purpose of this report is to identify and discuss in detail, the principal issuesaffecting the transport sector's ability to provide efficiently the infrastructure and servicesneeded to underpin growth in Sri Lanka. The objectives of the report are to assist theGovernment in (a) setting a clear vision for the transport sector to support the country'soverall development goals; and (b) formulating an appropriate strategy and reform agendafor transforming the sector from a state-dominated one into an effective and efficientpublic-private partnership.
1.2 The report discusses the role of the transport sector in the context of theGovernment's Medium Term Development Strategy. The transport sector strategypresented in the report is firmly embedded within the overall goal of export-oriented,private sector-led growth that is environmentally and socially sustainable. Furthermore,it is consistent with the World Bank Group's Country Assistance Strategy for Sri Lanka.
1.3 Included in the analysis are the key sub-sectors of ports and shipping, railways,highways, and urban transport. The report analyses the past performance of the transportsector in terms of achieving its policy objectives. Key challenges facing the sector atpresent and in the future are identified and an evaluation is made as to the necessaryreforms and policy orientation to meet these challenges.
1.4 Recognizing that growth objectives have to be balanced in terms of their impacton environmental and social sustainability, the report suggests a sector policy that isembedded in the principles of sustainable development. These principles derive from theBank's policy for sustainable transport which are founded on three key pillars9: (a)economic and financial sustainability; (b) environmental sustainability; and (c) socialsustainability. In particular, the role of the Government, and the partnerships it can createbetween the public and private sectors to ensure that development is sustainable in thosethree dimensions is discussed.
Sustainable Transport: Priorities for Policy Reform. The World Bank, 1996.
2
B. AUDIENCE
1.5 The intended audience for the report includes high level Government Officialsinvolved in development and transport policy formulation, managers of public sectoragencies currently involved in transport service provision, the private sector seekingopportunities for investment in Sri Lanka, private entrepreneurs involved in activitiesdependent on the transport sector, associations of transport users, academics, and donoragencies.
C. OWNERSHIP AND PARTICIPATION
1.6 Most of the material used in the report derives from two workshops that were heldin Colombo in July and December, 1996 jointly sponsored by the Government, UNDPthrough technical assistance, and the World Bank. The workshops were attended by highlevel Government officials including: (a) the Honorable Minister of Transport,Environment, and Women's Affairs who gave a keynote speech on the "Vision of theTransport Sector as an Effective and Efficient Public-Private Partnership"; (b) theHonorable Minister of Health, Highways, and Social Services who presented "TheNational Highway Program for Economic and Social Development"; and (c) theHonorable Minister of Shipping, Ports, Rehabilitation and Reconstruction who talkedabout "Shipping and Infrastructure Development to Meet Demands of Export, Import andTransshipment". Representatives of the private sector, public sector agencies, and userassociations in transport were also present. The workshops were also attended by highlevel representatives of the UNDP, OECF, and ADB (see Annex 3 for a list ofparticipants). Background papers prepared for presentation and discussion at thisworkshop provided key input into identifying the issues and laying out the strategy forreform.
1.7 In an attempt to get consensus on the issues and strategy for reform, key reformareas were identified and discussed at the workshop and agreement was reached on mostof them. Remaining issues where consensus was not reached are also included in thisreport. Next steps for implementing the report's recommendations as well as theinvestments needed are included in the report (see Section H of the Executive Summary).
D. MAJOR THEMES COVERED
1.8 The workshops focused on a particular set of issues, which were classified intogeneral themes as summarized below:
Overall Policy Issues
Economic, Social and Environmental Demands on the Transport Sector: PastPerformance and Emerging Challenges

3
* Efficiency, Equity, and Environmental Sustainability: Do we Have the RightBalance for Sri Lanka
* Institutional Development and Capacity Building in the Public Sector* Decentralization and the Public Expenditure Program* Strengthening Planning, Regulatory, and Policy-Making Capacities
* The Changing Role of the Government in the Transport Sector* View on the public-private role in Transport from a major donor
agency (OECF)* Cases from Intemational Experience in roads and passenger transport,
railways, ports and shipping* Altematives for Financing Investments in Transport* Opportunities for Private Sector Participation.
Environmentally and Socially Sustainable Transport Infrastructure and Services
* Physical Planning and Environmental Issues in Transport* Integrating Urban Structure, Planning and Transport* Traffic Management for Congestion Control and Safety* Implementing Clean Air 2000.
* Role of Transport in Poverty Alleviation and Regional Development* Opportunities for Employment Generation in Transport* Access and Mobility in Rural Areas* Regional Integration Through Transport: The Southern Regional
Development Plan* Opportunities for Competition in Transport
* Ports, Shipping and Transshipment Markets* Competition in Passenger and Freight Services* Competition for the Provision of Road Infrastructure and Restructuring of
Road Provision Agencies
Economically and Financially Sustainable Delivery of Transport Infrastructure and Services
* Making Public Sector Management More Market Sensitive* Improving the Efficiency of Port Management* Reforming the Railways* What to do About Peoplized Companies
* Pricing and Financing in Transport• Are the Current User Charges in Roads Adequate?* Cost Recovery and Subsidies for Passenger and Freight Services* Competitiveness of Charges in Sri Lankan Ports
This report maintains the thematic breakdown above in the discussion that follows, butpresents the material in the context of the logical framework for the transport sectorstrategy presented in Section G of the Executive Summary. The background papers

4
presented at the workshop and which form the basis for this strategy are attached in aseparate volume.
E. FRAMEWORK FOR TRANSPORT SECTOR STRATEGY
1.10. The transport sector strategy presented in this report is firmly embedded within theoverall Government goal of export-oriented, private sector-led growth that isenvironmentally and socially sustainable. Furthermore, it is consistent with the WorldBank Group's three-pronged country assistance strategy for Sri Lanka which is to: (a)improve fiscal discipline through expenditure and revenue reforms, increased allocations tomaintenance, increased reliance on user charges, and reduction in financial losses of publicenterprises; (b) support private sector development through developing institutional andpolicy framework for public private investment and easing infrastructure bottleneckscurrently constraining private sector activity; and (c) build human capital by reducingpoverty, creating an environment for private sector growth in agriculture, and increasingfemale participation in the labor force. (See the logical framework in the ExecutiveSummary, section G.)
1.11 The first component of the transport sector strategy addresses issues of fiscaldiscipline by assisting the Government in reforming the public expenditure and budgetingprocess for transport. The main objective of this component of the strategy is to increasethe efficiency of investments. Three actions are recommended for reform under thiscomponent of the strategy: (a) address the imbalance in the composition of transportexpenditures between modes and recurrent versus capital allocations; (b) outline a plan tostrengthen the capacity of national and sub-national agencies to formulate and implementsector policy; and (c) mobilize funds from other sources including the private sector anduser charges and fees.
1.12 The second component of the strategy is focused on the medium term and its mainobjective, in addition to assisting the Government in easing bottlenecks in the sector thatare constraining growth, is to make the transport sector economically and financiallysustainable. The key reform actions under this component include: (a) reduce the role ofgovernment in direct provision of transport services by defining the appropriate roles forthe public and private sectors, defining areas for private sector participation, and puttingin place the appropriate regulations and control structures; and (b) define areas whereagency restructuring, increased competition, and regulatory reform would improve theefficiency of service provision, thereby releasing resources for financing other importantinvestments. These two policy and institutional reform actions will provide the maininput to an investment plan for capacity expansion, modernization of service operations,and rehabilitation of critical infrastructure in the medium term.
1.13 The third component of the strategy focuses on assisting the Government infostering social and environmental sustainability in transport policy. Actions under thiscomponent seek to achieve: (a) more efficient management of congestion, pollution, and
5
accidents; (b) integrate the needs of the poor for access and mobility in transport sectorpolicy including the support for non-motorized and intermediate means of travel; and (c)enhance participation in transport policy formulation, planning, and implementation.

6
II. REORIENTING TRANSPORT SECTOR POLICY
A. THE GOVERNMENT'S POLICY AGENDA AND THE TRANSPORT SECTOR
2.1 The Government's development strategy, as outlined in the short-term policyagenda of the National Development Council and in "Sri Lanka in the Year 2000"includes a number of issues which have direct or indirect impact on policies andtherefore on transport sector strategy.
2.2 Export Competitiveness and Transport. The Government would like to increaseexport competitiveness and encourage export development. As part of this strategy is theneed to improve the productivity of the key export-earning sectors: agriculture andmanufacturing. Within manufacturing the Government proposes to promote higher valueadded items such as garments, toys, fashion accessories, and jewelry as well as encourageentry into new and higher technology and skill-based activities such as electronic andelectrical assembly and manufacture of precision engineering, parts and tools; sportsgoods and footwear; and scientific instruments and software. In agriculture, the objectiveis to also promote high value added products especially in the non-plantation crop sector.All these products have very specialized requirements for transport. In terms of landtransport, they require reliable, safe, and secure services, which can be contracted ondemand (for just-in-time delivery). Some products may require specialized containerssuch as refrigeration or special suspension for high precision goods. Connectivity amongtransport networks and modes is also critical to meeting such demands. This requires atransport system that functions in a seamless fashion from the perspective of the exporter.The public sector is not well-equipped to provide such services on its own. This willrequire an intermodal strategy with proper logistical support that is better carried out bythe private sector in partnership with the public sector.
2.3 Economic Growth, Urban Development, and Port Development Strategy. TheGovernment envisions a direct role of the transport sector in contributing to growththrough the development of port facilities for Sri Lanka to serve as a regional trade andtransshipment center. Given available projections of cargo traffic for the South Asiaregion, there is room for development of no more than a single hub-port. If Sri Lankawants to become such a center, it would have to act quickly to improve the facilities andefficiency of its existing port infrastructure and services. Colombo has a naturaladvantage over other ports in the region: It is close to international navigational lanesproviding the least cost deviations from these lanes for the main shipping lines on routesbetween the Far East and the Indian Subcontinent, and Europe as well as the East Coastof the U.S. However, Colombo can no longer rely on this natural advantage and needs toimprove its level of competitiveness.
2.4 To make Colombo a regional hub would require, large injections of capital tomodernize and upgrade facilities such as berths as well as construct supportinginfrastructure such as a breakwater. Moreover, the port will need to improve its

7
efficiency to levels of its competitors in order to secure its markets. Internationalexperience has indicated that to achieve such a strategy requires the port authority to actas a landlord, contracting out or leasing the responsibility for operation and managementof its facilities and services so that it can benefit from the higher efficiency, better clientorientation, and financial discipline of the private sector. The implications for urbandevelopment of expanding the role of Colombo port under such a strategy also need to beconsidered. Transport sector strategy to reduce negative effects of such port developmentand enhance the efficiency of existing transport systems in the Greater Colombo areawould need to be well-founded in a land-use strategy as well as options for trafficmanagement and control.
2.5 Budgetarv Policy and the Transport Sector. With regard to achieving andmaintaining macroeconomic stability, the budgetary strategy of the Government is toincrease revenues and reduce expenditures in the medium term. Since the transport sectorabsorbs a large share of public expenditures and transport sector agencies are majorrevenue earners (SLPA) or depend to a great extent on transfers from treasury (SLR), it isimperative for success of this budgetary strategy that opportunities for expenditurereduction or revenue raising within the transport sector be identified. This requiresseeking opportunities for competition to reduce the cost of providing infrastructure andservices, improving the efficiency of public sector agencies through restructuring andreform, adopting pricing and financing policies that are geared towards cost recovery, andmanaging subsidies in a more targeted and efficient way.
2.6 Competition Policv. Lack of adequate competition in transport raises the costsof providing infrastructure and services, which have direct effect on the budget. In theabsence of competition, service providers have also little incentive to improve quality ofservices and diversify their products to meet the varying needs of consumers. For SriLanka to achieve the high levels of growth of its East Asian neighbors, it will benecessary to seek opportunities for introducing or increasing the level of competition inthe transport sector. Barriers to entry need to be removed and public monopolies need tobe challenged by allowing them to compete with private providers where possible.However, adequate regulation also needs to be developed to protect consumer andoperator rights where necessary as well as to manage externalities. Such policies areneeded for virtually all the transport sub-sectors to a higher or lesser degree.
2.7 Transport and the Environment. The Government has taken a number of steps toensure that sectoral policies and growth strategies are consistent with long term goals ofsustainability and environmental protection. Existing policies are targeted directly orindirectly to the transport sector. Clean Air 2000 directly targets the transport sector withobjectives to reduce ambient levels of pollution in the Greater Colombo Region,including vehicular emissions which are the major source of pollution. Other policiessuch as siting of industries to reduce industrial pollution have an indirect impact ontransport policy. The transport sector strategy will need to be aligned to environmentalpolicy if implementation is to be successful. This point is made specifically since theGovernment has had a very poor record of implementing policies with respect to the

8
environment, despite having developed a number of action plans. Consideration for non-motorized means of travel need to be given more emphasis when dealing with the nexusbetween transport, poverty, and the environment as well as resolving the problems ofurban pollution.
2.8 Devolution of Responsibilities and Transport. Effective devolution requires aproper alignment of fiscal and functional responsibilities as well as ensuring complianceof sub-national units of government with overall macroeconomic objectives. At present,the devolution package proposed by the Government has focused on political rather thaneconomic and financial aspects'0 . Provincial councils have been given responsibilitiesfor transport provision, including highways and bus services, with little attention to thesources of revenues to meet investment and maintenance needs, or the accountability andcapacity at these levels to manage such services. Given the fiscal crisis that the country isfacing, it will be important to balance the political needs for devolution of responsibilitieswith macroeconomic objectives. In particular, it will be necessary to put in placemechanisms to ensure that the quality of services provided at the decentralized level isnot undermined, and that spending volumes at different levels of government areconsistent with overall macroeconomic ceilings.
2.9 Transport and Regional Integration. The Government should search for win-winstrategies that balance the different objectives of regional integration, economic growth,and environmental management if it is to use the transport sector to achieve suchobjectives. In the past, the Government has followed policies of industrial dispersion inorder to enhance regional equity. Dispersed production centers have created high demandfor infrastructure facilities, and have contributed to the increasing demand for travel. Theconsequences of increased travel on air pollution need to be balanced against the desire tomeet environmental management objectives by reducing industrial pollution. Currently,the Government is planning to site all new medium and high pollution industries withinindustrial estates with adequate environmental protection measures. However, theseindustrial estates will be dispersed throughout the island with the explicit objective ofreducing urban pressures. An assessment of the impact of such policies on the tripleobjectives of achieving high economic growth thereby reducing regional inequities,reducing pollution from stationary and mobile sources, and reducing regional inequitieswill need to be investigated. Furthermore, regional integration has been hampered byuncoordinated investments on primary, secondary, and feeder systems of roads, as well aspoor coordination across transport modes. Such limitations need to be addressed to avoidduplication and waste of resources.
2.10 Transport and Poverty Alleviation. Successful poverty alleviation requirestransport policies that integrate policy considerations in the formulation of transportstrategies. Such policies include among other things, the best means for providingadequate and affordable access for the poor to get to work, particularly in rural and
Sri Lanka: Public Expenditure Review. Yellow Cover Report. World Bank. August 6, 1996.

9
marginal urban areas, opportunities for generating employment through the transportsector, and strategic use of transport to reduce regional disparities. At present theGovernment does not have an explicit strategy for a transport sector role for the ruralsector and poverty alleviation, especially with regard to access and mobility. It has animplicit one deriving from the policy of dispersing economic activity. Past policies forrural transport are based on perspectives of urban transport and urban planning. Ruraldwellers in Sri Lanka have restricted mobility, which further contributes to rural poverty.Furthermore, the existing system of subsidies, such as for rural bus services, is verypoorly targeted. With respect to employment, the Government has not tapped the privatesector's potential to generate work opportunities in the development of transportinfrastructure and services. There has been very low participation of local labor in theconstruction and maintenance of roads and other transport infrastructure. All these issueswill need to be addressed if Sri Lanka is to achieve the goals of sustainable development.
B. COVERAGE AND PERFORMANCE
2.11 The transport sector is critical to development. While it absorbs a large share ofthe public finances in Sri Lanka, its performance has not been adequate to meet thechanging needs of the economy. Estimated requirements in the medium to long term arein the order of US$ 15 billion per year for the sector to meet the demands of increasedindustrial productivity and export promotion (see Annex 2). In the short run (1995-99)the transport sector will absorb 22% of the Government's capital budget1 1 . This includesinvestments in ports and shipping, highways, and railways. These investments are criticalas the transport sector in Sri Lanka has not performed as well as that of its East Asianneighbors that it tries to emulate, failing to meet the demands necessary for the country tosustain higher levels of economic growth (see Table 1).
2.12 Basic coverage has been good in terms of extending transport networks butexisting systems are aged, obsolete, and capacitated. Sri Lanka is well endowed in termsof transport infrastructure stocks, compared to other countries in Asia and Latin America.The road network, which is the most dense in Asia, covers the country adequately. Therailway network allows traffic to move to most of the major cities and production centerson the island. The transportation infrastructure stock was put in place many years ago andis outmoded and old. A large share of the 95,000 km of roads that exist were constructedat a time when mechanized practices were not known and were meant to cater to carriageand wagon traffic. They present a large expense and difficulties for modernization andupgrading to meet the demands of modern traffic fleets. The 1,450 km of railway trackexisting today were mostly built between 50 and 100 years ago. Rolling stock andsignaling systems are so outdated that they are obsolete in manufacturing countries,making it almost impossible to get spare parts and repair them when they fail.
Public Investment 1995-1999. Department of National Planning, Ministry of Finance, Planning, EthnicAffairs, and National Integration. Colombo, Sri Lanka, April 1995.

10
Table 1: Transport Infrastructure: Coverage and Performance
Country Paved Roads RailwaysRoad density Roads in good Rail traffic (km Diesels in use (%(km per million condition (% per million $ of dieselpersons) paved roads) GDP) inventory)1988 1988 1990 1990
Sri Lanka 536 10 318(a) 42(a)Malaysia .. 37 76
Thailand 513 50 76 72Indonesia 160 30 .. 74
Argentina 858 35 161 49Peru 347 24 22 66(b)Source: World Development Report 1994 on Infrastructure for Development, Table 35.(a) Rail traffic data obtained from the Sri Lanka Railways (SLR) in 1992; GDP figures are from the World
Data Tables published by the World Bank; and locomotive availability is calculated from an averageof the fleet used for passenger travel and freight movements using data from the SLR.
(b) Average obtained from Peru-Strategy Paper for the Infrastructure Sectors, Report No. PE-12412.
2.13 Misguided capital investments within and across transport modes have reduced
the efficiency of investments in the sector. Sri Lanka's passenger and freight transport
demand are road-dependent. The country depends on the system of roads for domestic
freight (96%) and passenger transport (97%), with private vehicles (including motor and
tricycles) carrying a big share of passenger transport (55%). Past capital investment has
not been in line with the heavier role of the road and highways sector. From the period
1977 to 1990, railways absorbed Rs 19.53 billion of the capital budget (58%), compared
with Rs 10.58 billion (31 %) invested roads during the same period. The Government has
partially addressed the imbalance across sectors. In the 1995-99 budget, the railway will
absorb Rs 19.17 billion (31%) and highways will absorb Rs 30.53 billion (50%). The
high share of capital investment in rail is misleading as there is significant
misclassification of operation and maintenance activities as capital.
2.14. Inattention to maintenance have further reduced the ability of the transport sector
to perform. The infrastructure stocks have not been maintained due to insufficient
allocations to maintenance, poor maintenance practices, and misguided decisions on
investment and upgrading. The result has been very low levels of performance when
compared to international best practice; only 10% of the road system is in good condition
and locomotive availability is around 42% and declining.
2.15 The consequences of obsolete, congested, and deteriorated infrastructure have
been echoed by the private sector. A Private Sector Assessment (PSA) survey indicates
that poor infrastructure services result in high costs of transportation, reducing the
competitiveness of Sri Lanka in export markets. Road condition and capacity was ranked
as the most important logistical constraint, followed by port facilities, air freight,
container services, and rail services (Table 2). These constraints to growth need to be
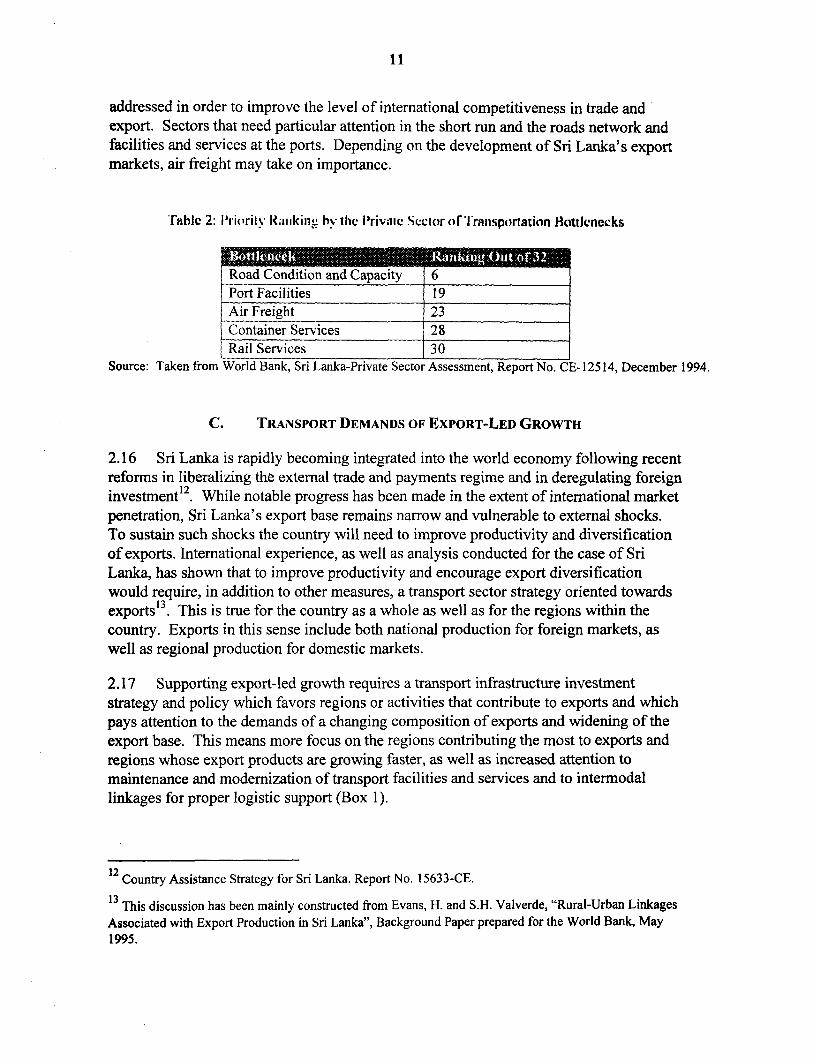
11
addressed in order to improve the level of international competitiveness in trade andexport. Sectors that need particular attention in the short run and the roads network andfacilities and services at the ports. Depending on the development of Sri Lanka's exportmarkets, air freight may take on importance.
f able 2: I'riorily lianikinu lvs thc Ilriviic Seclor r l'raiisportatiun lBottlenecks
Road Condition and Capacity 6_ _ _ _ _ _ _ _ _ _ _ . . . . . . . _ __ __ . _ _ 2Port Facilities 19
Air Freight 23_ _
Container Services 28Rail Services 30
Source: Taken from World Bank, Sri Lanka-Private Sector Assessment, Report No. CE- 12514, December 1994.
C. TRANSPORT DEMANDS OF EXPORT-LED GROWTH
2.16 Sri Lanka is rapidly becoming integrated into the world economy following recentreforms in liberalizing the external trade and payments regime and in deregulating foreign
12investment . While notable progress has been made in the extent of international marketpenetration, Sri Lanka's export base remains narrow and vulnerable to external shocks.To sustain such shocks the country will need to improve productivity and diversificationof exports. International experience, as well as analysis conducted for the case of SriLanka, has shown that to improve productivity and encourage export diversificationwould require, in addition to other measures, a transport sector strategy oriented towardsexports'3 . This is true for the country as a whole as well as for the regions within thecountry. Exports in this sense include both national production for foreign markets, aswell as regional production for domestic markets.
2.17 Supporting export-led growth requires a transport infrastructure investmentstrategy and policy which favors regions or activities that contribute to exports and whichpays attention to the demands of a changing composition of exports and widening of theexport base. This means more focus on the regions contributing the most to exports andregions whose export products are growing faster, as well as increased attention tomaintenance and modernization of transport facilities and services and to intermodallinkages for proper logistic support (Box 1).
12 Country Assistance Strategy for Sri Lanka. Report No. 15633-CE.
13 This discussion has been mainly constructed from Evans, H. and S.H. Valverde, "Rural-Urban LinkagesAssociated with Export Production in Sri Lanka", Background Paper prepared for the World Bank, May1995.

12
BoX 1: TrasDport Demands of a Changing Composition and Spatial Locus of Production
The composition of exports0 in SrtiLaiak has shifted from agriculture, towards industry. Within'agriculture, there has been a shift away from traditional bulk exports such as tea, rubber, and coconuts towards high value added crops including tobacco, cinnamon. pepper, vegetables, andcashew nuts. .. The industrial export base has also changed from a reliance ton garments andtextiles to a high growth in industrial goods0 such as chemicals, machinery, appliances, and'goods*processed from petroleum, rubber, and leather. Further diversificationi of exports is. expected tocontinue as0Sri Lanka tries to widen its export base and redce the impadc of external shocks especially in the garment and textile markets. Which are subject to iquotas; in main markets. Thefdemands that. a diversified and high value added export base placecon transport systems areveyry.different firmithose of a narrow base andd bulk or primary products.
Contribution of Provinces; to. Agriculturalt and Indusrial4 ExportsValue in Rs. Million
1990 1993 . Change 1990-93
Province Agriculture Industry Agriculture Industry Agriculture Ilndustryv
Western tt ; 2,058 0 0 134,576 2,108 70,611 2% 104%
Cenrtral 12,057 2,260 13,095 7,769 9% 244%
Southern 4,003 1,334 4,253 4,927 6% 269%:
North WeSteMr 1,751 1,667 1,984 6,812 13% 309%
Nrth Cental 132 87 543 2,286 31 1% 2528%
Uva: 7007097 l:|00 l:00 7: 0073,275 303 3,534 2,328 8%'/0 668%
Sabaragamuw&a: 4,769: 1,205 4,900 5,501 3% 357%°
Notrthern +iEasterf 842 69 1,201 183 43% 165%
Source: Evans, H. and Harwood-Valverde, S., 'Rural-Urban iLinkages As soiated With Export:Production in Sri Lanka, Background Paper prepared for the World Bank, May 1995.
High value added export products require reliable, secure, and speedy logistic support to be:internationally $competitive.i This means that transport systems have to be more operationallyeffiient. Investing more to compvensate for opierational inefficiencies, as. in. the past, 'isunrealistic.:: What is needed is a re-orientation of transport investment and4 plicy towarsproviding high quality, reliable, and well-main:tained systems that can sustaii the demandsplaced on tihem by a: diverse product market. Measures traditionally pursued to enhance theefficiency ofitransport services in the direction of higher quality, reliability, and sustainiability oUservices through reforming public enterprises and agencies responsible : for transport provisionhave not been successful. What is needed is a well-defined public-private partnership, paying:cltoser attention to the needs of clients and the fiscal and financial linkages between transport andother economic:activities.
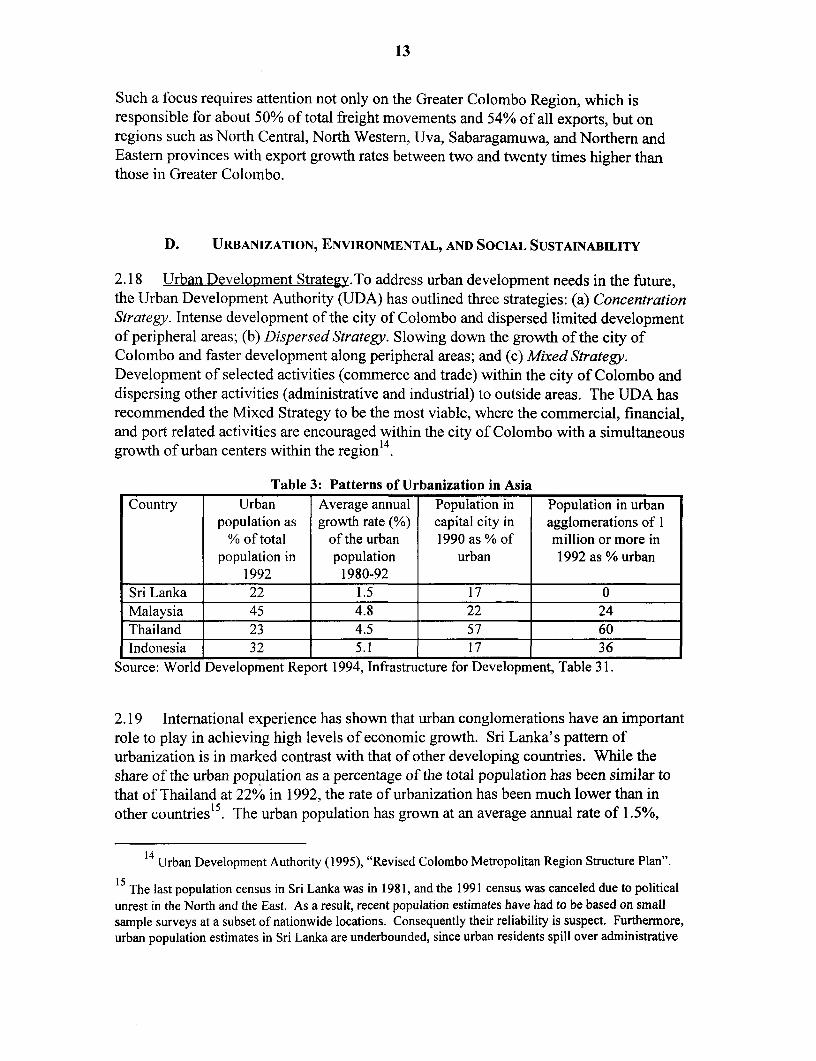
13
Such a focus requires attention not only on the Greater Colombo Region, which isresponsible for about 50% of total freight movements and 54% of all exports, but onregions such as North Central, North Western, Uva, Sabaragamuwa, and Northern andEastern provinces with export growth rates between two and twenty times higher thanthose in Greater Colombo.
D. URBANIZATION, ENVIRONMENTAL, AND SOCIAL SUSTAINABILITY
2.18 Urban Development Strategy.To address urban development needs in the future,the Urban Development Authority (UDA) has outlined three strategies: (a) ConcentrationStrategy. Intense development of the city of Colombo and dispersed limited developmentof peripheral areas; (b) Dispersed Strategy. Slowing down the growth of the city ofColombo and faster development along peripheral areas; and (c) Mixed Strategy.Development of selected activities (commerce and trade) within the city of Colombo anddispersing other activities (administrative and industrial) to outside areas. The UDA hasrecommended the Mixed Strategy to be the most viable, where the commercial, financial,and port related activities are encouraged within the city of Colombo with a simultaneous
14growth of urban centers within the region
Table 3: Patterns of Urbanization in AsiaCountry Urban Average annual Population in Population in urban
population as growth rate (%) capital city in agglomerations of 1% of total of the urban 1990 as % of million or more in
population in population urban 1992 as % urban1992 1980-92
Sri Lanka 22 1.5 17 0Malaysia 45 4.8 22 24Thailand 23 4.5 57 60Indonesia 32 5.1 17 36
Source: World Development Report 1994, Infrastructure for Development, Table 31.
2.19 International experience has shown that urban conglomerations have an importantrole to play in achieving high levels of economic growth. Sri Lanka's pattern ofurbanization is in marked contrast with that of other developing countries. While theshare of the urban population as a percentage of the total population has been similar tothat of Thailand at 22% in 1992, the rate of urbanization has been much lower than inother countries1 5. The urban population has grown at an average annual rate of 1.5%,
Urban Development Authority (1995), "Revised Colombo Metropolitan Region Structure Plan".
15 The last population census in Sri Lanka was in 1981, and the 1991 census was canceled due to politicalunrest in the North and the East. As a result, recent population estimates have had to be based on smallsample surveys at a subset of nationwide locations. Consequently their reliability is suspect. Furthermore,urban population estimates in Sri Lanka are underbounded, since urban residents spill over administrative

14
compared to nearly 5% in Thailand, Malaysia and Indonesia (see Table 3). As of 1992,16Sri Lanka had no urban agglomeration of 1 million or more . The mixed strategy
proposed by the UDA is a solution which maintains the benefits of dispersion, such aslower congestion and pollution, while introducing some benefits of agglomeration, suchas lower transportation costs due to consolidation of production and consumption
1 7centers
2.20 Another major difference between Sri Lanka and other developing countries is therole of Colombo (Figure 1). First, there is a major gap between the size of Colombo andthe size of the next largest cities (Jaffna, Galle and Kandy). Second, Greater Colombohas seen relatively no net migration over the years. In consequence, the pressure ofpopulation growth in Greater Colombo is relatively light. Among the major factorscontributing to this pattern of urbanization is the past policies of industrial dispersion andeconomic decentralization, which were followed in an attempt to alleviate poverty andreduce regional disparities. For Sri Lanka to ensure high economic grpwth as itdiversifies its production base, it will be necessary that the level of productivity of theGreater Colombo area and its regional trading partners be increased. This would requiredeveloping an urban strategy that is consistent with this objective. Among the keyelements of such a strategy is the resolution of the major transport bottlenecks currentlyimpeding growth.
2.21 Existing urban development strategies have not been able to mitigate the adverseconsequences of travel in the Greater Colombo Region. Despite having low populationlevels compared to other capital cities in developing countries, Greater Colombo has anumber of transport problems. Rising incomes have contributed to a high rate ofmotorization, and the private vehicle has captured a larger share of the growing demandfor transport (see Figure 2). In combination with deterioration in urban bus and railservices, motorization has led to large modal shifts from public transit to private vehicles.The consequences have been congestion, accidents, and pollution. Transport policyneeds to balance the demands of export led growth, the process of urbanization, and thedemands for higher quality of life which are translated into more reliable, safer, and less-polluting options for meeting transportation demands.
boundaries but are not counted as urban population. However, it is expected that using four indicators ofurbanization taken from the World Development Report represent a good "guesstimate" of the trend inurbanization.
16 Unofficial population estimates for the Colombo Metropolitan Region for 1991 are around 5.03 million,which is larger than the country's total official urban population in the same year which was less than 4million. The figure presented in Table 3 is taken from the World Development Report, 1994.
17 Personal communication with Prof. L.L. Ratnayake of the University of Moratuwa.
15
E. INSTITUTIONAL WEAKNESSES IN PLANNING AND IMPLEMENTATION
2.22 The adverse effects of transport have not been adequately addressed in Sri Lanka,mainly because of weaknesses in planning and implementation. Even when there isunanimous agreement on directions for policy and planning, and endorsement of policyplans by the administrative and political system, implementation is slow at best or rarelycarried out.
2.23 A number of weaknesses contribute to the poor performance in planning andimplementation: (a) existence of multiple agencies with poor coordination; (b)fragmentation of the legal authority to plan and the lack of authority to enforce agreedupon plans, causing duplication of effort and haphazard decision-making; (c) misguidedcontrol of day to day management activities causing large delays and undermining theautonomy of line-agency managers; and (d) poor alignment between planning, policymaking, and the budgeting process.
2.24 There is no single body with the responsibility for the transport sector. At presentthere are four ministries involved in the sector: Ministry of Transport, Environment, andWomen's Affairs is responsible for Rail and Bus transport and vehicle administration;Ministry of Housing, Construction, and Public Utilities for Urban Land Use; Ministry ofHealth, Highways, and Social Affairs for highways; and Ministry of Ports, Shipping,Rehabilitation and Reconstruction for ports and shipping. Since there is no singleauthority for the sector, issues requiring coordination are handled within inter-ministerialand inter-agency committees. A number of such committees have been set up to reviewpolicy, coordinate plans, and supervise implementation of specific issues. There is acommittee dealing with environmental policy, there are technical evaluation committeesresponsible for reviewing procurement requests by the sector agencies, and there arecommittees set up to ensure implementation of action plans. These committees do nothave adequate technical support, funding, and the general capacity to undertake majoractions. Moreover, the time commitments required of the members of such committees,who are usually high level managers of line-agencies, are overwhelming. Because ofsuch limitations, when the committees meet, they look mechanically at minutes of theprevious meeting and merely pass on to the next meeting with little positive action. Forexample, the National Environmental Steering Committee (NESC) has met 30 times overthe past three years on matters related to the implementation of Clean Air 2000. Despitesuch a high frequency of meetings, only 4 out of 50 actions recommended in the planhave been implemented.
2.25 Many different agencies are responsible or authorized to plan. In the urbancontext, for example, agencies with responsibility and authority to plan include: theUDA, local governments, and various specialized or sector agencies such as the RDA.Multiplicity of urban planning organizations without any coordination has resulted ininconsistent plans. Consider the recent plans for the Colombo metropolitan area. TheUDA plan uses one definition, the Colombo Urban Transport Plan (CUTS) uses another,and the recent water conservation plan uses yet another. Furthermore, planning for

16
different transport modes (bus, rail, private transport) is pursued without any coordinationresulting in sub-optimal use of scarce resources. Lack of coordination is also cited asbeing responsible for delays in mobilizing funds and in project implementation, furtherreducing the effectiveness of funds.
Box 2: Multiplicity of Organizations and Fragmentation of Authority in Planning
Sri Lanka has a long history of planning and the immediate need is to coordinate different planningefforts and ensure their implementation. Planning at the macro-level was initiated in 1946, by enactingthe Town and Country Planning (T&CP) Ordinance. The objective of the T&CP was to assist localmunicipalities in adopting development control measures such as: (a) securing health, safety, welfare,conveniences, and amenities for the people; (b) increasing efficiency; and (c) maintaining equity. TheUrban Development Authority Law of 1978 was enacted, setting up the Urban Development Authority(UDA). Wide powers were given to the UDA to "promote integrated planning and implementation ofeconomic, social, and physical development of certain areas as may be declared by the Minister to beurban development areas ..." The law also authorized the Minister to make regulations. A developmentplan prepared by the UDA becomes a legal document once it is approved by the Minister and ispublished in the Gazette. As a check to centralization of power and authority within the UDA, certainfunctions were decentralized to the Urban Local Authorities (ULAs) and only problem cases werereferred to the UDA for suitable action. In addition, there is a Board of Investment in Sri Lanka (BOI)with the task to attract private sector investment for developmental activities. Other agenciesresponsible for spatial planning are Special Project Areas, Subsidiary Organizations (CoastConservation Authority, Central Environment Authority, Low Lying Reclamation Board, Tourist Boardetc.). The Road Development Authority (RDA) is responsible for planning for investments in roads andoften works in isolation of plans put forward by the UDA. At the national level, there is an inter-ministerial national development council that is to provide overall guidance for the economy.
2.26 Misguided controls, such as the requirement for technical evaluation by acommittee of submitted proposals for funding from the line agencies, reduce theautonomy of line agency managers and delay the processes of implementation.Furthermore, due to the lack of information and technical staff to advice on key policyissues, and little or no participation of consumers in the planning and policy definitionprocess, even well-intentioned controls and guidance have little positive effect.
Box 3: Deas iin ProcurementlDue toMisguidedI Control of Line Agencies
Mhost often cited fas a situation of misguided fcontrol are the long delays in procurement processesas a;result of approvals that are needed beftre expenditures can be made. Antexampl]ewhere-suchAdeJAysare causing acute 1problems is in the railway. The railway is required to have approval from aT chnical Evaluation Committees (TEC) 'ifotrexpenditures totaling more than Rs 10 imillion, miniialapproval for expenditures between Rs:140and 20 million, and Cabinet approval ffependitures more..-than Rs 20Mmillion. An average spareopart at the railway such as crankshafts, radiators, and gear boxes
g-are in the order ofiRs 120 mnllion. This:makes the spare parts acquisition process ver leny resuIti gi even futher deterioration of rollingi stock and the en gservice levels.

17
2.27 The planning process is not well aligned to the budget process in most of theagencies involved in planning, so there is no mechanism to ensure that the agency'sspending priorities are consistent with the plan's. Furthermore, there is no formalmechanism to reconcile the various plans, such as CUTS, UDA, RDA. It is uncertain thatthe UDA has the legal authority to compel some key agencies, such as RDA, to ensurethat its projects are consistent with the UDA's plan.
2.28 Because of all these weaknesses it is difficult to arrive at a coordinated sectorstrategy and ensure its implementation. There is a need for a single authority withresponsibility for tactical planning for both transport services (bus, rail, and shipping) andinfrastructure (highways, ports, railway track and facilities). Such an authority shouldhave representation from concerned ministries, including urban planning, the privatesector, and consumer groups. The functions of the authority should include: (a) overallplanning for transport in the country with prioritization among different modes; (b)information gathering and analytic responsibility to support key policy decisions; (c)development of policy guidelines for transport infrastructure at national, provincial, andlocal levels; and (d) support to provincial and local levels in planning and policyimplementation including providing for capacity building at these levels.
2.29 Six options for improving sector policy and planning at the national level arepresented in Box 4. Discussions of the recommendations of this report indicated thatevaluation of the six options was necessary before a strong recommendation can be made.Previously in the July 1996 Workshop the preferred option in the short-run was a hybridof options 1 and 2, and in a break out session in the December 1996 Workshop, option 4was unanimously endorsed. It is necessary that whichever option is selected beembedded in the principles of Civil Service Reform that the Government plans toundertake. Furthermore, it is imperative that the Government give legal authority to planto the body created. This would require definition of reporting requirements by this bodyto the sub-committee on transport and by line agencies to this body. A mechanism toensure that plans are enforced needs to be developed.

Ir I4 4. - t
-. o ocO3 ~~~~~~f2. ...
~~~~ ~ ~ ~ ~ ~
. .... .. CD t0 o C- ~~~~~~~IhD
a .-. 0 .-t 0-p. ~~~ ~~~~~. . ..
0~~~~~~~~~~~~~~0

19
III. IMPROVING THE EFFICIENCY OF PUBLIC INVESTMENTS
A. PLANNED INVESTMENTS IN TRANSPORT
3.1 The Government is planning to spend a total of Rs. 61 billion in the transportsector, a sum which is 22% of the total capital expenditure program during this period(Table 4). Most of the planned expenditures (Rs. 59 billion) are already committed asthey are part of ongoing projects in the sector. New projects planned at RS. 2 billionduring the five year period are mostly in the highway sector (Rs. 1.7 billion) and apreliminary analysis indicates that they are well justified. This means that it will bedifficult to make any cuts in the planned program for transport. Moreover, given thefiscal crisis in the country, it may also not be possible to increase further the share of thetransport sector in the public investment program (PIP). Improvements will need to besought in the efficiency of public investments so that more can be accomplished withexisting allocations and efforts will need to be made to attract private sector investmentsin infrastructure.
Table 4: Structure of PubTic Investments 1995-1999 {Rs. Million)
Item/Year 1995 1996 1997 1998 1999 TotalTotal Capital Investment 63681 66039 56630 51486 45225 283055
Agriculture 8697 8632 6919 5230 3143 32621Industries, Tourism & Trade 1475 1368 1966 2278 1406 8487
Human Settlements 10622 9705 8959 6776 5048 41110Power & Energy 4777 9204 8076 6591 5904 34552
Posts & Telecom. 4069 1850 850 253 294 7316Recons. & Rehabi. 1049 1203 1003 1003 1004 5262Ports & Shipping 4438 5026 216 1222 846 11748
Railway 4215 4448 3693 3407 3403 19166Highway 5785 6937 6797 6058 4952 30529
Social Infrastructure 7543 8425 8548 8685 8842 42043Administrative Overheads 11011 9241 9603 9983 10383 50221
Total Transport 14438 16411 10706 10687 9201 61443Share Transport (%) 23 25 19 21 20 22
Source: Department of National Planning
B. PATTERN OF PUBLIC EXPENDITURES IN TRANSPORT
3.2 Expenditures in the transport sector have been growing in current terms between1981 and present, from about 6% of the PIP in 1981-85 to about 22% in the PIP for 1995-1999. As a share of GDP, however, there was a sharp decline in the PIP for 1989-93from about 3% in the 1980's to 1.6%. The highest level of investments in transport as ashare of GDP was in 1986 were it was close to 5% of GDP, when major expenditures inports and airports were undertaken (Figure 3). Since it is difficult to compare countries

20
with highly varied modal'8 mixes, cross-country comparisons of investments as a share ofGDP are not particularly helpful. A more meaningful comparison is between the ratio ofexpenditures in transport to GDP and the growth in demand for transport1 9, as measuredby the passenger and freight kilometers of travel. Such a comparison has the potential toidentify major bottlenecks, if they exist. Growth in demand for transport has faroutstripped the growth in per capita GDP (Figure 4). It appears that this high growth indemand has not been appropriately accommodated by past investments as transportinfrastructure at present is characterized by capacitated and antiquated facilities such asroads, bridges, terminal facilities, railway track and signaling systems, and facilities atports and airports. Given that the spending levels have been historically high, the poorperformance of the sector must be due to misdirected and inefficiently implementedinvestments.
C. COMPOSITION OF TRANSPORT EXPENDITURES
3.3 Sectoral Composition.The allocations in the 1995-1999 period give priority to thehighways and railways subsectors (Table 5). The bulk of the expenditures planned are forthe highway (Rs. 31 billion, 50% of the capital expenditures in transport) and railway(Rs. 19 billion, 31% of the capital expenditures in transport) subsectors. Using historicalfigures, these sectors appear to have had minor but steady increases in capital investmentin the past (Figure 5). However, there are a number of anomalies in the classification ofroad and railway expenditures, which when corrected for, indicate that there may havebeen a reduction in the capital investments to roads and rail.
Table 5: Sectoral: Conposition of Expenditures in Transport 1995-1999 7... ( ) ___. _ ...... ....... .....
1995 1996 1997 1998 1999 TotalPorts shipping 31 31 2 11 9 19
Railways 29 27 34 32 37 31Highways 40 42 63 57 54 50
Source: Calculated from Expenditure Data from the Department of National Planning
3.4 Modal Balance. The Government seems to have addressed the pastimbalance in the investments allocations across modes. In the 1980's more was investedin railways relative to the other sectors. The planned investments in the 1995-99 budgetindicate a switch in policy, giving more priority to highways. This trend is more in linewith the demand shares between rail and highways and should be continued. Projected
18 Modal mix includes the relative share of passenger and freight transport carried by roads, rail, ports andshipping, river transport, and air.
19 The demand for transport across modes will be affected by the relative prices charged by each mode.For the purposes of this analysis, it is assumed that there has been no change in the structure of pricingacross modes during the period of analysis.

21
demand for transport investments to support a private sector oriented export led growthstrategy suggest an even further change in the modal allocations as shown in Table 6. Itmust be noted again that the practice of misclassifying maintenance and repair activitiesas capital makes it difficult to get a real estimate of the actual capital expendituresespecially for the railway. It is necessary to first establish the extent to which thispractice has been used in the past and the relative ratio of misclassified expendituresbefore a final estimate of the balance across modes can be done. This is an area requiringimmediate action to avoid further decapitalization.
Table 6: Modal Balance in Capital Investments in Transport
Sector Actual (a) Planned (b) Projected (c) Projected (c)1977-90 1995-99 2000-05 2006-20
Railways 58% 31% 20% 20%Highways 31% 50% 67% 65%Ports & Shipping 11% 19% 13% 16%Total 100% 100% 100% 100%(a) Calculated from Transport Studies and Planning Center data base(b) Calculated from Expenditure Data from the Department of National Planning(c) Estimated using existing conditions and unit costs (see Annex 2)
3.5 Recurrent Versus Capital Expenditures. Insufficient resources have beenallocated to maintenance in the past and even when allocations have been made,maintenance funds have been diverted to meet other expenditures. The ratio of recurrentto capital expenditures has been falling over the last six years (Figure 6). Looking morespecifically at the road sector, there have historically been large fluctuations in theallocations to maintenance, with 1986 being a particularly bad year. Part of the reasonfor the low allocation to maintenance of roads in 1986 is due to the very highexpenditures in ports and airports, which absorbed a large share of the capital budget.Cost overruns in the execution of road projects that were donor financed led to divertingof the maintenance budgets that had been allocated to meet the requirements forcounterpart funds.
3.6 Neglect of routine and periodic maintenance has caused gradual deterioration ofbus and rail services both in terms of quality and quantity, making it difficult to raiserevenues through higher tariffs, as users have resisted having to pay more for increasinglydeteriorated services. Furthermore, the highly deteriorated road and rail infrastructure,due to maintenance neglect, have required expensive rehabilitation. These two effectshave put further strain on the Government budget. Major improvements in the efficiencyof implementing public expenditures, in addition to solving the O&M problem, would beneeded to redress these issues. Most importantly, the Government needs to increaserecurrent expenditure allocations for maintenance, and put in place mechanisms to protectsuch funds. As mentioned in the Executive Summary, the Bank's experience has shown

22
that a road fund is a good way to deal with the problems of maintenance in the short run.There are advantages and disadvantages to road funds as shown in Box 7.
Boxi 5: Has there been soufficient allocation fore maintenancee inthe;road sector?
Based on international comvarisons (see He1ler, 1977), the optimal ratio betweenpmaintenanceand capital ependitures in roads&should&be between 0.06 and 0.14. Ahistoricalt analsis of theallocations made for maintenance :and capital investments shows that this ratio sfor Sri forthe national network has been as high as00.46 in l989 and as low as 0.07`in 1995 , and thatit hasbeen on the decline since 1989. The situation :on the National Network 0is generallyjvbetter, sinceithe R-ratios there have beenosystematiallyt high, falling: between0.06"and.0.)7.. Thismeans that:the allocation between maintenance and capital categories for the sub-national network is thearIea in which. reforms need ~to focus.
Expenditures in Roads 19801995
Srti Lanka Expenditures* 1980 1986 1990 1995
0Capital : :00:;0: :::;:0;V t40700000 0;000t0000:- 0775 ;:000000 :lf 21270:;0lj R-Ratio Whole Network 0.30 0.003 ~ 0.06 0.07-
.R-Ratio National Network 0.46(a) 0.19 0.07
Comparator R-Ratios 19:86 |1989 1 990 1993
Peru R-Rtio000.63 0.0001 0.68 0'14
Source: TSPC, :1994 and RDA ~Accounhts ~~(a)' Fgre for4989.
A cursory look at the R-ratio in Sri Laka maya lead to the conclusion that suficient allocationshave been made to maintenance. However, tw6o factors mask the real effect. '0First, the high-figure for this ratio in 1980 is due to thebpast maintenance neglect which necessitated expensivereparative wrs to keep the road systemapassable. A similaripattern has beeniobserved.inother:countries which have neglected maintenance in'the past and have goneAthrough acIycle ofexpensiveirehabilitation6to maintainthe network. See the:case of Peru in the comparison above.Second, un:it costs of maintenance, rehabilitation: and construction in Sri Lanka mare veryhigh, incomparison with other countrlesA The lack of competition in 0the executionof ofadorks frt thedomestically funded program may be a contributing factor.

23
Box 6: Misclassification of Expenditures Between Capital and Recurrent Items
Consider for example an itemized allocation in 1996 to the railway under an expenditure codetitled "Rehabilitation and Improvements of Capital Assets". More than 40% of the expenditureslisted under this item are not capital expenditures, but have been included under the capitalbudget. Similarly for the case of expenditures in roads. The classification of expenditures madeby the Road Development Authority between 1980 and 1990 have not been consistent withrespect to what is labeled capital investment. For example, routine maintenance and flooddamage repair have been treated as capital20. Some of the consequences of suchmisclassification are:
* while the railway has received large capital transfers its stock is old and has not beenreplaced or received major rehabilitation, modernization, and upgrading
* operational deficits of the railway seem to have stabilized when in reality they have beenescalating
* roads are in bad condition (only 1,000 km have been rehabilitated) despite having allocatedlarge sums in the capital budget for roads
Railway: Rolling Stock-Rehabilitation and Improvement of Capital Assets
Item Allocation in Rs. 1996
Actual Capital Allocation 650,000,000
Total Misallocated Expenditures 265,080,000
Misclassified Proportion 7 41%
Source: Calculated from SLR 1996 Allocation from the Capital Budget. Misallocated itemsincluding expenditures such as overtime Sunday pay, uniforms, office furniture, and otherincidental expenditures. For more detail see the aide memoire for the Public Investment Reviewfor Sri Lanka, 1996.
This misclassification raises a number of issues. It appears that operational subsidies are hiddenby covering current expenditures in capital budgets especially in the case of railways. It wouldbe important to check the handling of capital and recurrent expenditures in the other transportsectors, to determine the breadth of the problem. The picture the broad capital budget in thetransport sector gives is one of replenishment and expansion of capital stock, while the realityseems to be asset deterioration and diminished ability to meet demand. With respect to therecommendations concerning recurrent versus capital allocations, there is a need to recalculatethe real capital and recurrent needs based on a proper classification, before one can make anassessment of whether the current ratios are optimal. There is a need to rectify the existingsystem of classification, especially for the railways, to avoid further decapitalizing of the systemand to prevent a future crisis in the recurrent budget.
20 This problem was first pointed out in the Transport Sector Memorandum for Sri Lanka in 1990, Report8962-CE in the case of the road sector. A recent mission discovered that the problem was not limited toroads but was also practiced in railways. The last public investment review found that the problem in theroad sector had not been addressed despite having been raised several times.
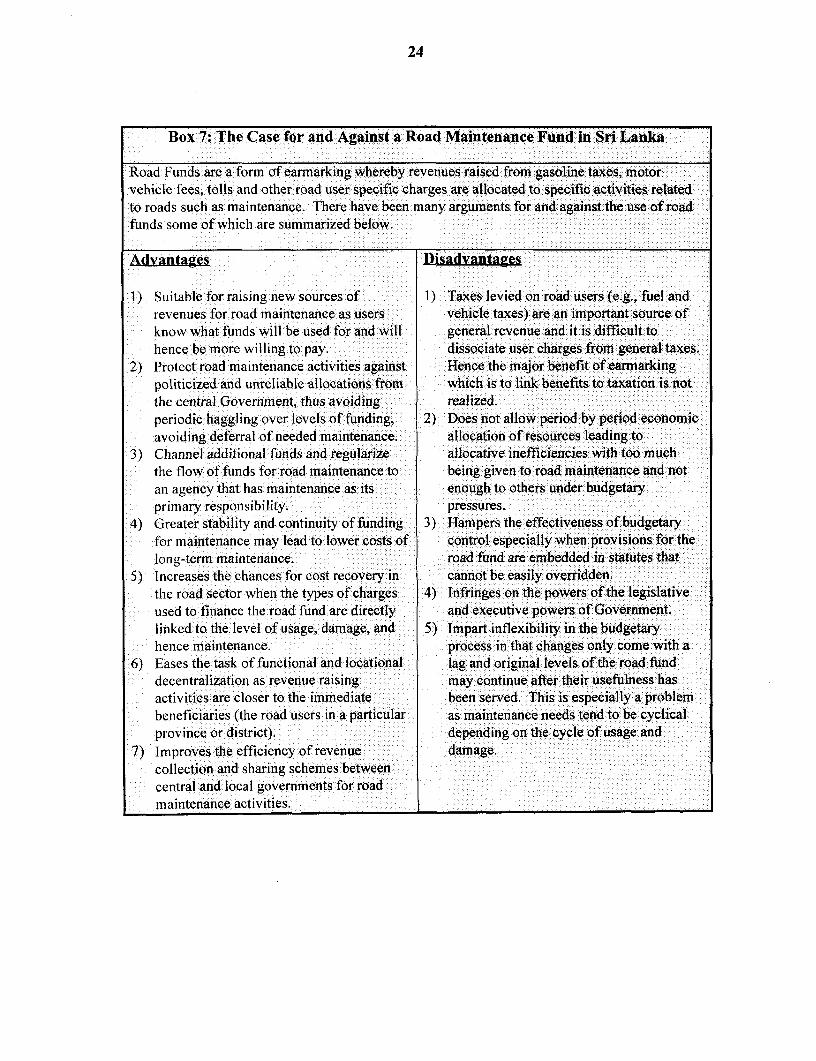
24
Box 7: The Casefr andA gainst taRoad Maintenance Fund'in Sri Lanka
Road Funds are a form of earmarking whereby revenues raised from gasoline taxes, motor lvehicle fees, tolls and other road user:specific charges arei allocated to specifc aciites relaedto roads such as maintenance. There have been many arguments for andiiagainst the use of roadfunds some of which are summarized below.
Advantages llsadvntagc
1) Suitable for raising new sources of I Taxes levied on road usersl (g., fuel andrevenues for road maintenance as users vehicle, taxes) are an important source ofknow what funds will be used for and will general revenueeaund..it is diftkult tDhence be more willing to pay. dissociate userf charges from generalttaxes.
2) Protect road maintenance activities against Hencet the major benefit of earmarkingpoliticized and unreliable allocations from whichi is to link benefits to6taxationt is nottthe central Government, thus avoiding realized.periodic haggling over levels of funtding, 2) Does not allow period by period zeconomici0iavoiding deferral of needed maintenance; allocation oftresources leading to
3) Channel additional fuinds and regularize allocative inefficiencies withl too mu:chthe flow of funds for road maintenancedto being:given to road maintenance and 0notan agency that has maintenance asi its enough to others undert budgWeayprimary responsibility,: pressures.
4) Greater stability and.continuity of funding 3) Hampers the effectiveness of budgetaryfor maintenance may lead to lower costs of control especially: whenprovisions for the 0
long-term maintenance. road fund are embedded in statuteswthat5) Increases the chances for cost recovery in cannot be easily overridden.
the road sector when the types of charges 4) Infringes on the powers of the legislativeused to finance the road fund are directly and executive powers 0ofGovernmfet.linked to the level of usage, damage, and 5) Impart inflexibility^ in the budgetaryhence maintenance. process in that changes only come with a
i6) Eases the task of functional and locational lagiandoriginaljlevelsfofthefiroad funddecentralization as revenue raising may continue after their usefulness hasactivities are closer to the immediate been served. This lis especilly a: problembeneficiaries (the road users in a particular as maintenance needs tend to be cyclicalprovince or district), dIepending on thecycleof usaget,and
7) Improves the efficiency of revenue damiage.collection and sharing schemes betwe:ecentral 0and local governments for roadmaintenance activities.

25
D. DEVOLUTION AND THE CAPACITY OF SUB-NATIONAL AGENCIES
3.7 Capacity of Sub-National Agencies. A good share of the planned investments forhighways in the 1995-99 PIP will be at the provincial level, given the decentralizedstructure of road provision. The Government is planning to allocate Rs. 600 million peryear over the five year period to the provinces for the road sector. This figure is withinthe range of amounts allocated in the past which were about Rs 530 million in 1991 andRs. 939 million in 1992. In the post-devolution period, expenditure by the ProvincialCouncils are not readily available for overall comparative purposes and data have to belaboriously collected from different agencies and sorted out. This makes it difficult to getan exact estimate of the share of expenditures at the sub-national level. Furthermore,provinces have many sources of funds that they use in the road sector and it is not easy toconsolidate the various sources of information. Nevertheless, an attempt was made toreconstruct expenditure levels from past information to get an idea of the share ofspending at the sub-national level (see Table 7).
Table 7: Financial Allocations to the Road Sector by SourceFunding Source 1991 1992
Allocation Share Allocation ShareRs. Million (%) Rs. Million (%)
Consolidated Fund 1768 57.9 1582 40.6Foreign Aid 751 24.6 1379 35.4Capital Grants (MTIP) 191 6.3 533 13.6Block Grants 103 3.4 103 2.6Criteria-Based Grants 150 4.9 225 5.8Decentralized Budget 61 2.0 66 1.7Integrated Rural Development 28 0.9 12 0.3Total 3051 100.0 3900 100.0
Source: Consolidated from Sri Lanka: Road User Charges Study, Transport Studies and Planning Center, January 1993.
3.8 Provincial councils have access to a number of funds which they use for financingexpenditures in roads. These include: (a) capital grants to provincial councils forimplementation of the Medium Term Investment Program (MTIP) from the Ministry ofHealth, Highways, and Social Affairs; (b) block grants for recurrent expenditure ondevolved functions which provinces get from the Ministry of Public Administration,Provincial Councils and Home Affairs; (c) criteria based grants to the provinces forcapital expenditures which are allocated by the Ministry of Public Administration,Provincial Councils and Home Affairs using a formula which takes into accountpopulation and selected indicators of economic differences; (d) decentralized budgetfunds given to members of parliament for expenditure in their areas; and (e) funds fromspecial projects such as integrated rural development projects. In 1991, around 18% ofroad expenditures were made at the sub-national level. This figure increased to between24% in 1992 as shown in Table 8.

26
Table 8: Expenditures on Roads by Levels of Government
Total Expenditure 1,972 3,051 3,900Provincial Level 0 532 939Provinces Share 0% 18% 24%
3.9 The capacity of the sub-national units of government to undertake road works is akey issue. Provincial and other sub-national agencies have not been able to implementthe expenditure program they had planned in the past. Evaluation of the expendituresallocated versus actually implemented shows that there has been systematic under-expenditure at the sub-national level. Measures will be needed to improve theeffectiveness of transport expenditures at the sub-national level.
E. REVENUE GENERATION AND SUBSIDIES
3.10 Improvements in the capacity to generate revenues from the users of the transportsector would allow the Government to tap other sources of financing the plannedexpenditure program, thus relieving the strain on the budget. At present, the system oftariffs at the port is complicated and uncertain such that shippers do not know the pricesthey face in advance. A restructuring of the tariffs at the port and reducing payments of"sweet money" would be a potential source of revenue to meet the planned investmentsfor the port subsector. In the case of roads, results from a road user charges studyindicate that the current system of charges is unfair across categories of vehicles, with apossible underpayment by larger vehicles relative to the level of usage and damage thatthey cause on road pavements. Furthermore, there seems to be an abuse of the currentsystem of reduced fees for school and commercial vans resulting in a loss of potentialrevenue and a mis-targeting of the subsidies to school children. Private vehicles canobtain a certificate from the Motor Registry as a school or commercial van since there isweak enforcement to check whether a van is being used for school and commercialpurposes. Bus fares also need to be regularly raised to ensure that tariffs keep up withinflation and changes in cost structures. In the case of rail, there is no relationshipbetween prices charged for rail services and the cost to the SLR for operating a givenservice. This is mainly because of the social and political obligations that the railway isrequired to meet. There is a need to define Public Service Obligations (PSO) and developcontracts between the SLR and the Government to meet such obligations. These issuesare dealt with in more detail in Chapter IV.
F. RECOMMENDATIONS TO IMPROVE EFFICIENCY OF PUBLIC INVESTMENTS
3.11 The following actions would be needed to improve the effectiveness andefficiency of the planned investments in the Transport Sector:

27
Resource Allocation
* identify the key competencies of each transport mode and set investmentpriorities fbr the transport sub-sectors to be in line with the objectives of aprivate sector led export oriented growth strategy
* improve the modal balance in the public investment program for transport,focusing on the neglected areas in the road and rail sub-sectors and givingpriority to improving the efficiency of the port of Colombo so that thetransport system can function in a seamless fashion from the perspective ofan exporter
* define and adopt the appropriate classification scheme for recurrent andexpenditure categories across all transport budgets to stop furtherdecapitalization of the asset base
* restructure budgetary allocations between capital and recurrent categories toensure that maintenance is properly funded
Revenue Generation
* mobilize funds from other sources including the private sector by putting inplace policies and incentives conducive to private sector participation
* rationalize the system of rail tariffs for both passenger and freight to increaserevenue generation from users and reduce the dependence of sector agencieson treasury to meet their recurrent costs needs
* reform the system of road user charges to make them meet the revenue needsespecially for the larger vehicles, as the current structure cross-subsidizeslarge vehicles
- restructure the system of subsidy allocations, especially for school busoperations so that the budget currently allocated to transport subsidies isbetter targeted
* raise bus fares to put the prices of service in line with inflation and changingcost structures
mlpDke1
* develop capacity at the provincial level for planning and policyimplementation in order to ensure that the budgets are prepared consistentlyacross levels of government
* strengthen the capacity of provincial and local authorities to undertake theirdecentralized responsibilities so that the effectiveness of expenditures at thesub-national level is not compromised
* create a bo,dy to be responsible for transport sector strategy formulation, andthat will ensure that urban development and intermodal planning areintegrated into transport sector strategy formulation

28
* reform tendering and project approval process to reduce delays inimplementation and cost overruns and create a permanent agency fortendering and project approval
* create mechanisms to protect maintenance funds, such as a roadmaintenance fund to: (a) undertake routine and periodic maintenance but notcapital and major works; (b) be financed from a share of road user chargesbut should not include charges from congestion or pollution abatement; (c) bemanaged by a well-designed Board with representations from users, localauthorities and other stakeholders, to prevent diverting of funds allocated tomaintenance and to ensure that the roads maintained are priority roads; (d)have a finite life with a well-defined set of sunset monitoring criteria; and (e)have controls in place to avoid opportunistic and gaming behavior amongstakeholdersundertake emergency rehabilitation and maintenance program to halt thedeterioration and traffic loss on the railway line, and hence reduce long-runrecurrent budget needsstrengthen the capacity of the BOI to handle private sector investments intransport, including those that are intermodal in nature
29
IV. ECONOMICALLY AND FINANCIALLY SUSTAINABLEDELIVERY OF TRANSPORT INFRASTRUCTURE AND SERVICES 2 1
To be economically andfinancially sustainable, transport must be cost-effective and continuallyresponsive to changing demands. Competition, facilitated by regulatory reform to enable privatefirms to enter and exit the market more freely, forces transport suppliers to respond to users'needs at lower costs. Charges for use of infrastructure and services that reflect the full cost ofthat use to society are necessaryfor market signals to be meaningful. The commercialization ofremaining public sector firms is also necessary for economic andfinancial sustainability.
Sustainable Transport: Priorities for Policy Reform. The World Bank, 1996.
A. ROLE OF THE GOVERNMENT IN TRANSPORT
4.1 The Governrnent has a major role in the transport sector in Sri Lanka. Publicenterprises are responsible for direct provision of road, railway and port infrastructure.There is no private provision of infrastructure. In the case of roads, provisionresponsibilities are decentralized, with the Road Development Authority (RDA),provincial councils, local authorities and estate sector sharing ownership andresponsibility for the network (see Table 9). Ports are the sole responsibility of the SriLanka Ports Authority (SLPA).
4.2 In the case of transport services, the role of the Government in direct provision ismore limited, with the exception of railways, which are in the hands of the Sri LankaRailways, a Government Department. Urban bus service provision is shared betweenquasi-public (44% of passenger km) and private (66% of passenger km) companies. Thequasi-public companies are called "Peoplized Companies" after the manner in which theformer assets and responsibilities of the State Owned Monopoly--the Ceylon TransportBoard (CTB)--were transferred to former employees free of charge. The state retains a50% share in the peoplized companies. Road freight is almost entirely in the hands of theprivate sector with the exception that some state owned enterprises provide their owntransport. Shipping was formerly the monopoly of Ceylon Shipping Company (CPC),until liberalization allowed entry by other national, international, and joint venturecompanies.
21 Most of the issues and suggested recommendations in this section come from a joint workshop held bythe Government of Sri Lanka, UNDP, OECF, ADB, and the World Bank to discuss sector strategy. Therewas broad representation from within the country of the stakeholders in transport including the privatesector. In preparation for the workshop, background papers were prepared. These papers dealt in detailwith key issues and appear in Volume II of this report.
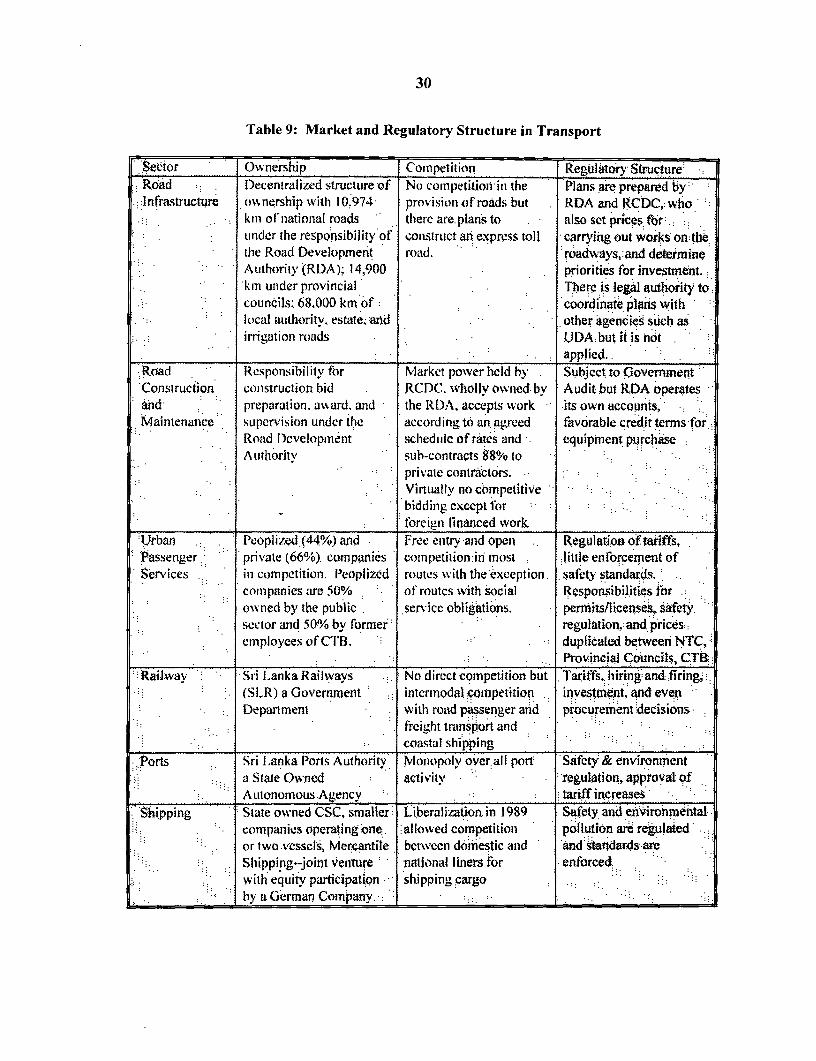
30
Table 9: Market and Regulatory Structure in Transport
Secior Owirnership Comilpeitiol kRegul1tory StructureRnoad t I)ecentralized struclture of NC) competitionrin the Plans are prepared by:
..lnfrastructure o%nership wit0h 1,0974 provisiono o Rroads bLMt RDA and RCDC, whok.km of national roads | there are.plans to . also set prices for
: uinder [he responsibility of consitruct an exprcss toll carrying out works on the.: . . the Roiad Development road. roadways,:and determine
AuLthority (RDA). 14.900 priorities for inyestment.kI;m uider provincial There is legal authority to:couneils; 684000 k}m of . . coordinate plaris withlocal authoritv. estate and . other agencies such as
. irrigation roads U DA: but it is not. .. . : . . ._____ applied..
Road Responsibililt for N'larket power held by . Subjcct to GovernmentConstruction conistructiot bid . RCDC. whollv owned. by Audit but RDA operatesand : preparation. avard. and the RDA. accepts work its own accounts,Maintenatice supervision under tlhc according to an. agreed favorable credit terms -for.
Road Development sledidilc of rates and -. equipment purchaseAutihority sub-contrawts 88% to
private contractors.Virtuallv no competitve ..bidding except lorforeigni linanced wvork.
Urban . P['eopliz.0(44%0) and Free entry and open .. Regulatioon of taiffs,Passenger private (66%/o). companlies competitiomir inmost lithle enforcement ofServices . in COt-npetitioil. Ileoplized routes xv-ith the eixception .. safety standars. .
coMpanies are 50% . ot' roltes with social Responsibilities forowned by the public . service obligations. penmits/licenses, safety.sector andi 50% by former . regulation. and pricesemployees of'CTl B. . dupficaled between NTC,
___.__.__.__.. __. __.._ Provincial Councils, C UB
Railwav S Sri Lanka .Railwavs . : No direct competition but .Tariff's, hiring and firing, I. . .S LR) a Govermnent~~~ intrerodal ¢omnpetition . investment, and evenDepartment with r oad passenger arid procurement decisions
frei-dit trmnsp:ort andcoastal shsip.ing ___
.Ports Sri Lanka l'orts Authority Monopoly over.all port Safety & environment: State Owned activitv :regulation, approval ofALtuonomnous Aggency . tariff increases
Shipping State owned CSC, smaller Liberalization. in 1989 Safety and environmentalcompaniics operating one. allowed competition pollaution are regulaitedor two vesseks', Mercantile between domiestic and and standards areS.. ipping -joint *eniure national liners for enforcedwvith equitv participation . shipping cargoby a GCerman Company.'. JI

31
4.3 There is not much competition in the provision of infrastructure, but competitionexists in the provision of transport services. There is direct competition between publicand private bus companies as well as among private bus operators for the provision ofurban and intercity passenger services. Effective competition also exists between privatetrucks for provision of freight transport services. Intermodal competition exists betweenroad and rail for provision of freight and passenger services. Also, private automobiles(including motorcycles and three wheelers) compete for road space with public andprivately operated buses. On the infrastructure side, the construction and maintenance ofroads is controlled by the RCDC, which is a fully-owned subsidiary of the RDA. TheRDA organizes road works for the Ministry of Health, Highways, and Social Affairs. Itis responsible for preparing plans, bidding documents, contract awarding, and workssupervision. Road work contracts are handed by the RDA to RCDC according to anagreed Schedule of Rates. The RCDC contracts out about 70% of its work, from RDA, toprivate sub-contractors. RCDC is also active in planning, design, and managementfunctions related to roads, and has an information advantage over the private sector.Aided by favorable credit terms, the structure of providing road works has retarded thedevelopment of domestic contractors.
B. COMPETITION IN THE PROVISION OF ROAD INFRASTRUCTURE2 2
4.4 In the case of roads, the primary concern is the ability of local contractors tocompete for road maintenance and rehabilitation contracts. The RDA/RCDC has beensteadily increasing the portion of its maintenance projects that are contracted out to thelocal construction companies. The RCDC has assisted a number of private sectorcontractors in undertaking rehabilitation works, especially in the Colombo area. Theportion of maintenance funding contracted out has increased from none in 1987 to 88% in1995, and the RDA has set a target of 100% for the year 2000 but it is not likely that this
23will be achieved, unless important changes are undertaken . The role of the RCDCwould need to change as the private sector contractors gain more experience and grow(see Box 8).
4.5 At present, the local construction industry cannot compete for major rehabilitationprojects and major reconstruction which are carried out primarily by foreign contractors.Private local contractors have little capacity to perform mechanized works, and have littleexperience in handling complex works. A number of factors prevent them from investingin equipment and machinery: (a) the presence of a dominant public sector agency(RCDC) with preferential access to information, equipment, and expertise; (b) high
22 The background material in this section derives from the following papers presented at a Workshop inColombo, June 1996. Munasinghe, E.I., Advisor to National Construction Contractors Association of SriLanka. "Towards a Better Image of Road Construction Contractors"; Abe, H., OECF, "Recommendationfor Restructuring Road Agencies in Sri Lanka"; and Norman, A., ADB, "Development of a Local RoadConstruction Industry.
23 Taken from a presentation by M.B.S. Fernando, Chairman of the RCDC, Colombo, June 1996.

32
interest rates for borrowing to purchase equipment; (c) difficulty obtaining spare parts forequipment and limited experience with managing large machinery; and (d) lack ofcontinuity in works which makes it risky for the private contractors to take on large risksin upgrading their equipment and labor force skills mix24 . RCDC on the other hand, inaddition to the preferential access to information, has access to generous credit forequipment purchase, as well as the possibility for deficit financing. Most of the heavyconstruction machinery in the country, is owned by RCDC and is available for lease toprivate contractors.
4.6 High Costs of Road Provision. Among the consequences of lack of competitionare the high costs of provision. Unit costs to perform major rehabilitation, periodicmaintenance, and routine maintenance in Sri Lanka are very high compared tointernational standards (such as those in Latin American countries) as shown in Table 10.A number of factors contribute to this high cost: (a) insufficient competition for works;(b) favorable credit terms and ability to finance the deficits of RCDC which does not giveit incentives to reduce costs; and (c) lack of sufficient control over the spending byRCDC and RDA. In the face of a growing fiscal deficit, it is imperative to seekefficiencies in provision of infrastructure. Since the road sector absorbs a big share of thepublic expenditures in transport, introducing competition for the provision of road workscan result in substantial savings, allowing the Government to meet many more of theneeds in the sector without raising expenditure levels.
Table 10: Comparative Costs of Providing Roads($/km)
Activity/Country Sri Lanka(a) Peru(b) Argentina(c)Major rehabilitation 250,000 154,000 87,000Periodic maintenance 36,000 25,000 18,000Routine maintenance 405(d) |2,500 3400
Source: (a)Data for National Road Network only from the Road Development Administration (RDA), SriLanka; (b) Peru-Transport Rehabilitation Project, World Bank 1993; and (c)Argentina-Survey ofProvincial Agencies in the Road Sector, 1995. (d) The low figure for unit costs of routine maintenance inSri Lanka is due to definition, as it is calculated as the ratio between allocations made to the RDA formaintenance divided by the length of the national network. Costs obtained from an analysis of actual bidsare in the order of $/km 6,000, as reported in a project preparation report for the National Roads Project,World Bank, 1994.
4.7 Increasing the degree of competition in the provision of roads has the potential toreduce the costs, generating savings that can be used to rehabilitate more roads. It isnecessary to assist the local construction industry to improve their capacity and efficiencyso that they can compete effectively. This would require restructuring the way in whichthe RCDC interacts with the RDA in the conduct of road maintenance works, an issueaddressed in the following section.
24 Factors (b) through (d) from a presentation by Patrick Jayawardena of Link Engineering, Colombo, June1996.

33
4.8 Increasing the proportion of maintenance and rehabilitation work done by localcontractors has several potential advantages for Sri Lanka. First, it increases the localvalue-added from these projects, and thereby stimulates domestic economic growth. Inaddition, local contractors, using local talent and labor, have the potential to be morecost-effective. This has to be weighed against the advantage of international competitivebidding, which offers the possibility of reducing construction costs of the project andintroducing new technologies.
4.9 There is general consensus in the country about what needs to be done, but notnecessarily how and at what pace. In particular, the consensus is that the Governmentand donor agencies that often finance these projects need to:
* prequalify local contractors for International Competitive Bidding (ICB) andLocal Competitive Bidding (LCB) conditional on having access tomanagement advice and the equipment holding of the RCDC
* package contracts at a scale and scope suitable for the typical Sri Lankancontractor
- design contracting programs to ensure reasonable continuity in the work forthe contractors
- provide training for contractors particularly in the use of machinery- provide guarantees for a private leasing company to acquire machinery* modify prequalification criteria so that contractors have an opportunity to gain
experience* extend mobilization and advances to contractors
Box 8: Project Based Development of a Contracting Industry
The private contractors, when given the opportunity, as in recent ADB and WB financedprojects, have performed well. Under an ADB assisted Third Road Improvement Project, thereis a large component for work by local contractors. Construction and supervision are by anassociation of international and local consultants who also provide construction managementadvice. Contract packaging is of a size and nature to suit the limited roadwork experience ofIocal contractors. Contractor prequalification is based upon ICTAD registration and, for phase 2contracts, on phase I performance. The project also provides mobilization advances toencourage contractor investmnent in equipment. This approach gives the industry the incentivesto perform well and to increase their capacity, and have also proved successful elsewhere isSouth Asia.
Source: Andrew Norman, Asian Development Bank, "Development of a Local Road ConstructionContracting Industry", presented at the Transport Sector Strategy Workshop, Colombo, July 3-5, 1996.
4.10 Sri Lanka now has a reasonable number of local road contractors, partly due to theefforts of the RDA to increase maintenance contracting. Thus, there is a foundation foreffective competition in the bidding for works, particularly for jobs which are not overly

34
complex or large. Two qualifications are noted to this conclusion: (a) there is somesentiment among the construction industry that it would be unwise to increase the numberof contractors so that firms already in the business could gain more needed experienceand skills; and (b) it is doubtful whether local contractors have reached sufficient scale orsophistication to purchase and maintain their own heavy equipment. Two options exist toresolve this problem: to centralize the equipment fleet in the hands of the RDA and let theRDA lease it to the private contracting industry and the RCDC on equal access basis; orto create a special private equipment leasing company for that purpose. The Associationof Contractors is willing to create a private leasing company if it can obtain conditions forborrowing similar to those of the RCDC. Recommendations for reform of the sectorfrom a state dominated one to a competitive environment with opportunities for growth ofthe private contracting and consulting industry is shown in Box 9.
4.11 In the proposed structure in Box 9, the private contractors and the RCDC will beat the same level, equally treated and allowed to compete with each other. There shouldbe an independent regulator to handle competitive bidding for maintenance and RDAshould monitor the work according to standards laid down by them, using privatesupervision consultants selected on a competitive basis. There should be separatemanagers for the RDA and RCDC to maintain independence of the two entities.
4.12 The Government has already taken action to implement some of therecommendations in the proposed structure in Box 9. Following a Cabinet Decision onOctober 16, 1996, road improvement contracts are to be awarded following competitivebidding between the RCDC and other contractors, after calling for open quotations usingnormal tender procedures. The RDA is to stop giving any road improvement contracts tothe RCDC without such competitive bidding
25 Cabinet Paper 96/2194/120/210, a Memorandum dated 20.09.1996 by the Minister of Health, Highways,and Social Services on "Approval of Estimates--Widening and Improving Seduwa-Udugampola Road: 0.2kIn" was considered along with the observations of Minister of Finance and Planning and approval of theCabinet of Ministers was granted to the proposals in the Memorandum, subject to normal tenderprocedures being followed in this type of projects in the future. Action by Ministry of Health, Highways,and Social Services.

35
Box 9: Opportunities for Growth of the Private Contracting and Consulting Industry
From a Dominant Public Sector in Road Provision...
Ministry of Highways
-Road Development Agency (RDA)|
i rivate Local Contractors Road Construction and- eeopetCompany (RCDC)
EquyLeasingf Equipment and Machineryq RepaTn Workshops
-PSupervision of Works0 ~~~~~~~~Asphalt and Aggtegate Plants
... To Competitive Road Provision
|Ministry of Highways|
. ~~~~~~~~~~~Road Development Agency (RD:A
4 ,Piate Local Contractors KRoad Construction and Developmenwt;4 : _ . \ ~~~~~~~Comnpany (RCDC)
-:-: / \ \ ~~~~~~~Leasing for Heavy Equipment and Machinery. / \ : ' ~~~~~~~~~~~Training of Contractors
spatand Light Equipment,Sgeate Plants and Machinery-.
: | ~~~~~~~~~~~~~Pfivate Supervision Consultants|
.. e~ ~ ~ ~~~~4- o

36
C. STRATEGY FOR REFORMING THE PORTS AND SHIPPING SECTOR2 6
4.12 The port and shipping sector has made significant contributions to the economy ofSri Lanka in the past. Being an island nation, the ports of Sri Lanka are virtually astridesome of the world's busiest shipping lanes. Close to the international navigation lanes,the country's ports provide the shortest and least cost deviation from these lanes for themain shipping lines; on routes between the Far East and the Indian Subcontinent, andEurope as well as the East Coast of the U.S. Because of these advantages, the countrycurrently enjoys substantial and expanding port activities both for import-export and fortransshipment of cargo with origins and destinations in other countries served by vesselscalling at its ports. The import-export volume is a function of the growing Sri Lankaeconomy, while the transshipment business is responsive to the competitiveness of itsport facilities within the region's burgeoning shipping operations.
4.13 Role of the Port of Colombo. Sri Lanka currently accommodates ocean shippingat three ports, namely: Colombo, Galle, and Trincomalee. The major volume of presentport facilities and activities is at Colombo Port. Cargo throughput at Sri Lanka's portsreached 18 million tons in 1994, with Colombo port handling about 16.1 million tons(89%), while the port of Galle handled about 0.3 million tons (2%), and Trincomaleehandled about 1.65 million tons (9%). Of the mentioned throughput at Colombo, 7.9million tons was domestic cargo, 7.8 million transshipment cargo, and the rest wascoastal trade. Almost all the container traffic is handled at Colombo port which reached0.972 million TEUs in 1994, with 70% transshipment containers (0.666 million TEUs).This is expected to increase to 1.2 million TEUs after the addition of JCT IV to theoperating berths. The Government should focus on the port of Colombo in its efforts totransform the country into a major transshipment and regional hub. Domestic cargo canbe handled at the ports of Galle and Trincomalee.
4.14 Critical to transforming Colombo into such a hub is improving its ability tocapture demand. Despite its geographical advantage, Colombo has not been able tocapture as much transshipment cargo compared to other major ports (Table 11). WhileColombo's throughput grew only by 8% in 1995 over 1994, Singapore increased theirthroughput by 13.5%, and Dubai saw a 14.6% increase during the same period. Poorperformance and reliability coupled with high prices charged to shippers of transshipmentcargo all contribute towards the low transshipment shares.
26 Taken from papers presented at the Transport Sector Strategy Workshop in Colombo, July 3/5, 1996.Mobarek, I., World Bank, "Strategic Issues in Development of Sri Lankan Ports"; Abeywickrema, R.J.,"Competitiveness of Charges in Sri Lankan Ports".
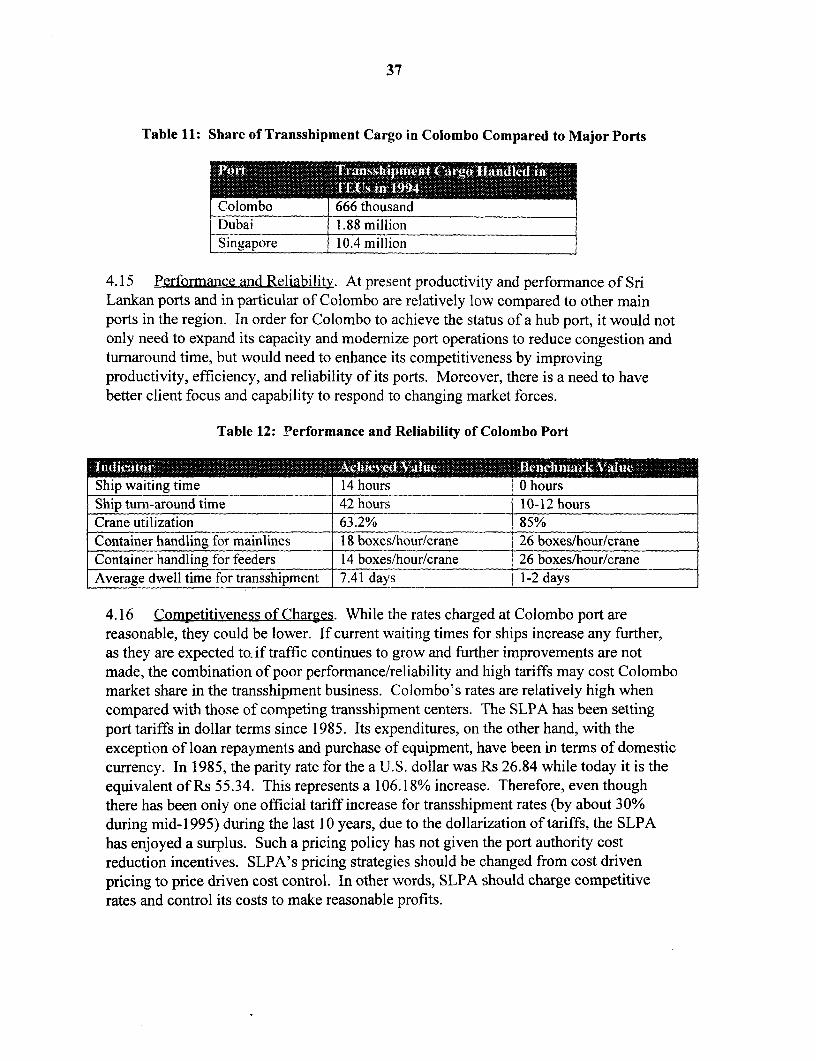
37
Table 11: Share of Transshipment Cargo in Colombo Compared to Major Ports
Coombo 666 thousandDuai 1.88 million
Singapore 10.4 million
4.15 Performance and Reliability. At present productivity and performance of SriLankan ports and in particular of Colombo are relatively low compared to other mainports in the region. In order for Colombo to achieve the status of a hub port, it would notonly need to expand its capacity and modernize port operations to reduce congestion andturnaround time, but would need to enhance its competitiveness by improvingproductivity, efficiency, and reliability of its ports. Moreover, there is a need to havebetter client focus and capability to respond to changing market forces.
Table 12: Performance and Reliability of Colombo Port
Sip waiting time 14 hours 0 hoursShip turn-around time 42 hours 10-12 hoursCrane utilization 63.2% 85%
ainer handling for mainlines 18 boxes/hour/crane 26 boxes/hour/craneContainer handling for feeders 14 boxes/hour/crane 26 boxes/hour/craneAverage dwell time for transshipment 7.41 days 1-2 days
4.16 Competitiveness of Charges. While the rates charged at Colombo port arereasonable, they could be lower. If current waiting times for ships increase any further,as they are expected to. if traffic continues to grow and further improvements are notmade, the combination of poor performance/reliability and high tariffs may cost Colombomarket share in the transshipment business. Colombo's rates are relatively high whencompared with those of competing transshipment centers. The SLPA has been settingport tariffs in dollar terms since 1985. Its expenditures, on the other hand, with theexception of loan repayments and purchase of equipment, have been in terms of domesticcurrency. In 1985, the parity rate for the a U.S. dollar was Rs 26.84 while today it is theequivalent of Rs 55.34. This represents a 106.18% increase. Therefore, even thoughthere has been only one official tariff increase for transshipment rates (by about 30%during mid-1995) during the last 10 years, due to the dollarization of tariffs, the SLPAhas enjoyed a surplus. Such a pricing policy has not given the port authority costreduction incentives. SLPA's pricing strategies should be changed from cost drivenpricing to price driven cost control. In other words, SLPA should charge competitiverates and control its costs to make reasonable profits.

38
Table 13: Comparative Costs of a 24 Hours Connection of Transshipping Containers ($)
Port/Size 15,000 TEUs 100,000 TEUs 200,000 TEUs 350,000 TEUs
20' 40' 20' 40' 20' 40' 20' 40'Colombo 83 132 73 116 69 111 66 106Singapore 93 136 84 122 82 119 81 118Dubai 85 119 68 95 60 83 47 65Khorfakkan 59 83 59 83 47 66 41 58Abudhabi 41 55 41 55 41 55 41 55Fujairah 82 114 65 92 57 80 45 51Rotterdam 81 162 81 162 81 162 81 162
Source: Abeywickrema, 1996. The costs are per container per TEU category. Shipping linesnegotiate lower rates based on the maximum volume of freight they transport per year through aport. Most ports give a discount for larger volumes of cargo from the same line.
4.17 Furthermore, there is a need to increase the commercial orientation of portoperations and management in order for Colombo to develop beyond simpletransshipment into re-export activities. The shipping business is highly competitive andoperates on thin margins, so liner companies are constantly in search of ports that offerhigh quality service at reasonable costs. It is also imperative that the port of Colombodiversifies its activities in order to contribute to the high economic growth necessary forthe country to join the ranks of the East Asian Tigers. Much of Colombo's transshipmenttraffic is destined for India. If one of the ports of South India develops a major andefficient container facility, Colombo could lose a significant portion of its transshipmenttraffic. Colombo also needs to be ready to handle increasing numbers of post-Panamaxcontainer ships, which liner companies are expected to deploy on high volume routes. Inaddition, Sri Lanka must develop beyond simple transshipment into re-export activities.Ports like Singapore, Hong Kong, and Rotterdam, for example, often unload, sort,process, restuff, and reship the contents of transshipment containers. Compared to re-export, simple transshipment functions are more footloose and vulnerable to competitionfrom other ports. Moreover, re-export provides more value added to the local economythan simple transshipment.
4.18 Privatization Initiatives in Ports. The ports are presently a public monopoly inthat the SLPA provides virtually all services. The Government of Sri Lanka hasannounced a policy of welcoming private investment in the ports. As has beenannounced through the news media, the Government has issued a letter of intent to aconsortium led by Mott-McDonnald, an Australian Consultant Firm, to develop acontainer terminal at Galle port on a BOT basis. Also there is a proposal from a privateliner company (P&O) to improve and operate one container terminal (QEQ), and theGovernment has issued a letter of intent for the development of this terminal on a BOTbasis. The Governmenit is currently carrying out negotiations with the P&O. Concerningthe future roles of the ports of Sri Lanka, specifically Colombo and Galle, theGovernment has also not developed a clear strategy as to which port needs to be

39
developed first and what the impact of developing one port would have on another. Theprivatization initiatives underway need to be accompanied by an announced policy andadopted strategy by the Government on all these matters and an action plan to implementthe strategy. Other areas where the SLPA could consider the private sector, as a measureto control costs, is in the non cargo handling activities such as vehicle repair, carpentry,steel foundry, and catering. These activities do not depend on a strategy for the portsector and could be spun off immediately to the private sector.
4.19 Optimization of the Ports of Sri Lanka. The Government has recognized theselimitations and has agreed to carry out a study to optimize the distribution of cargo andpublic sector investment over the existing ports. The study to be financed by the Bankwould include a market analysis for the container transshipment market in Asia and thestatus of competition with regional ports. It would also build a model that wouldreplicate the existing situation at the ports and the effect of various factors on theproductivity, efficiency, and investment required. Among the components of the studywill be recommendations for improving productivity of the public sector as well as theoptions for introducing competition by the private sector in some of the port activities.
4.20 Recommendations for Reform. International experience has demonstrated that thebest approach for achieving commercialization and more client orientation is throughcombined liberalization and private sector participation by adopting a "landlord"approach for the development of ports. Under such a strategy the SLPA retainsownership of assets and responsibility for development of common user facilities butallows private sector participation by eannarking operational activities for partnershipwith the private sector through concessions or leases for certain activities (Box 9). Toestablish some competition in handling containers of Sri Lankan imports and exports, itwould be desirable to allow different operators to operate different terminals.
4.21 Discussions of the recommendations of this report, resulted in the following set ofpriority actions for the port sector.
Top Priority
* implement institutional strengthening recommendations and action plan fromthe OECF funded study
* dispose of all non-port operation related activities to autonomous entities or tothe private sector
* carry out the recommended studies to be funded by the PHRD grant--both,*phase I and II
* enact legislative reforms for the port sector to enhance private sectorparticipation

40
* adopt a landlord strategy in the provision of port infrastructure and services,which may require a Port Regulator27
* shield port management and operations from political structure interference* allow public-private partnerships to operate on a BOT/BOO basis, berths at
the ports to improve throughput, productivity, and efficiency. Partnershipswith the private sector should be chosen according to a clearly defined processwith clear goals and objectives
* rationalize the port's labor force through negotiations with the unions to reachagreements on: voluntary retrenchment, golden handshakes, early retirementand possible retraining. The port has a very large redundant labor force and atthe same time it is short of skilled stevedores, so there is a need to make thelabor rationalization program meet the skills mix needs of the port in additionto productivity gains.
Box 10 Alternative Port Developent Strategies
Port development strategy has taken a shafply different turn because of the heavy investments:required inbport developmenti to keep pace with trends in ship design and1container size andargo handling.equipment and controls. It' isnow necessary to operate ports as a commercial
proposition and: to remove constraints from Iport services. Managementii objectives and capacity-of ports are 0inow determined by external rather than domestic considerations, and ports needitorespond6 totechnological advances in international shipping as well as the. 0local needs forishipping. A number of strategies to maike ports more responsive to these changes have beentried by various countries. These include:
diiernizingi Port Admninistration: irmproving performance of agency by investing in newtechnology and.. moderization: of port failities and activities without requiring institutionalrefbrm. ..
Commercialization: providing4autonomy and total control over all decisions related to portoperations and. administration andr holding agency accountable fortresults.Libealization,:removing monopoly of single state authority in provision of port services bydecentralizationof port tactivities and allowing; entry and competition by private providers.
onicessing: giving M rigOihts over a specified period of timeAto operate a facility such as aterminal to a private entity which has a stkie in the running of port business.
~QnIr.giiflX giving jrespzonsibility for executing specific tasks such as construction, refusedisposal,:and equipment maintenance and paying a private entity for the supply of agreed goods
mdservices-.-adsrgiee.:_ ich00V isAh f anf iA ws0000000000000000f0 s,f00 statei iif;f fi fffff fXff;:fljestitur: which is the transfer of assets of a state owned entity to a private owner with fulllegal responsibility for control, management, and financing.
27 During the discussions of the report's recommendations, two participants were not in favor of thisrecommendation, opting for flexibility including options other than the landlord strategy.

41
High Priority* strengthen port planning and management decision-making capabilities by
providing qualified staff who have competencies in modem managementtechniques, including operations research methods
* develop the 700 hectares adjacent to the port to relieve the pressure for landshortage, following the plans developed by the UDA
* implement the Inland Container Depot (ICD) utilizing the rail link to beoperated by a public-private partnership
* initiate and implement a marketing study to attract private sector participation* rationalize tariff structures at the port to make them in line with competing ports* establish incentive-productivity based schemes to improve the level of
productivity at the port* introduce national EDI systems and further develop port EDI systems* adopt a safety code and improve the port's safety by replacing obsolete
floating craft according to SLPA's requirements* create and enforce environmental safety rules and a code of practice* improve and monitor environmental conditions at the ports by providing
private sector operated ship waste collection and disposal facilities* undertake a Port Efficiency Improvement Project and improve port marketing
to ensure implementation of these recommendations
4.23 In addition to these actions, the port sector needs heavy injections of capital tomodernize and upgrade it services, so that it can effectively become a regional hub fortransshipment and other services. The investment requirements to meet these objectives,as well as the priorities for investment are summarized below.
Investment Requirements in the Port Sector
Investment Amount Year Donor$ million
Development of QEQ, 200 1997Colombo PortDevelopment of North Pier, 80 1997 OECFColombo PortColombo Port EfficiencyImprovement ProjectI. Port Development Study 0.8 1997 PHRDII. Vessels, Safety, 50 WB
Environment, EDI, TradeFacility
Institutional Strengthening 2 1997 OECFDevelopment of Galle Port 700 1998Development of 100 1998Trincomalee PortColombo Port Development 400 1997/8Labor Rationalization 1000 1999

42
D. COMPETITION IN Bus PASSENGER SERVICES
4.23 Sri Lanka's bus industry faces a number of serious problems: (a) decliningnumbers of buses, resulting in severe overloading and inadequate services; (b) fares toolow to meet operational costs; (c) high operating costs due to inefficiencies whichcombined with low fares result in failure to support fleet renewal; (d) chaotic andsometimes unsafe competition among nurnerous small private operators; and (e) poorlymanaged and inefficient peoplized companies. Reform of the bus industry is criticalsince buses, which were by far the dominant mode, are losing market share to their majorcompetitor, the private automobile.
Table 14: Passenger km of Travel Between 1985 and 1995Millions
Mode 1985 1990 1995Public Bus 15,249 13,674 19,308Private Bus 14,060 22,565 31,355Private Vehicle (a) 1,238 2,717 7,938Rail 2,101 2,781 3,404(a) Excluding motor and tricycles.Source: Transport Studies and Policy Center.
4.24 Organization of the Bus Industry. Sri Lanka has a complex system with over10,000 small private operators and 93 peoplized companies, competing with each other(see Table 9). The peoplized companies are a result of a series of reforms since 1978which converted the depots of the former Ceylon Transport Board, a public companywith an exclusive franchise on bus transport, into independent peoplized companies.
4.25 The objective of peoplization was to create self-financing viable public-privatebusiness ventures with social obligations such as operating school services and cateringto special needs. It was expected that, since the social obligations would be transparent,the companies would perform better than when they were a centralized public monopoly.Peoplization has had some benefits over the old structure of bus service provision. Thecompanies have shown close to an 80% increase in total revenue earned, and a 41 %increase in the passenger km operated per day, compared with corresponding figures forthe period prior to peoplization in 1990. However, operating deficits have more thandoubled during the same period. The structure of the peoplized companies maycontribute to this problem.
28 Most of the material from this section has been taken from the following background papers presented atthe Workshop on Transport Sector Strategy, Colombo July 3/5, 1996. G6mez-IbAftez, J.A., HarvardUniversity, "Competition in Sri Lankan Bus Services: Prospects and Alternatives"; Premaratne, M.C.,"Methods of Managing Routes Served by Multiple Operators"; and Lye, "Study on TransportationServices Provided by School and Office Vans". Valuable comments were also received from J. Diandas.

43
Table 15: Performance of the Peoplized Bus Sector
Year Passenger Km Costs Revenues OperatingOperated (Rs M) (Rs M) Deficit (Rs M)
1980 23,701 1,791 1,564 2271985 15,249 2,771 2,333 4381990 13,674 2,900 2,617 2831995 19,308 5,339 4,701 638
294.26 The former employees of the CTB hold 50% of the shares , and occasionallyhold management at ransom when unpopular reforms are suggested. There are incidenceswhere managers are voted out of management because of suggestions for reform. Thereseems to be no incentive to control costs under the current structure of ownership. This isa serious concern, as the liability of these companies is mounting. Other signs indicatingthe absence of long-term planning for cost cutting, is the low levels of fleet maintenance.It is estimated that 665 buses will go out of service by the end of 1996.
4.27 The peoplized companies are dependent on the Government for financial support,which they receive in a number of ways. First, they get new buses supplied at nominalcost. The companies just received an injection of 3,500 new buses to their fleet. As itstands now, more than 60% of the buses in operation are less than 3 years old and havebeen supplied after peoplization. Second, they get support for non-remunerative ruralroutes and for discount student fares. The support for non-remunerative rural routes anddiscounted school season tickets are partial reimbursement for services which would notbe provided if not for the reimbursement. Despite these forms of support, manycompanies do not cover their operational deficits. The operational deficits, which hadbeen reduced following peoplization in 1990, have started to escalate (Table 15). Amongthe reasons for escalation in operating deficits is the fact that tariff increases have notbeen in line with increases in expenditures.
4.27 Recommendations for Reform. There are a number of recommendations whichcame out from the Tilakaratna Report (1995)3°, background papers, Committeesappointed by the Minister of Environment, Transport, and Women's Affairs and fromdiscussion at two workshops in Colombo.
4.28 To improve the efficiency of investments in transport, there was unanimousagreement that urban and regional development and transport planning should be
29 Shares were determined only on the value of movable property available in respective depots at the timeof peoplization. However, if lands and buildings and the vehicles that were provided subsequently arecapitalized the public share would exceed 75% in all companies.
30 Tilakaratna, W.M., T.P. Gunawardena, M.C. Premaratne, and M. Fernando, Report of the Committee onReorganization of the Peoplized Companies and Private Bus Operation, July 1995.

44
coordinated, so that transport development plans are consistent and reasonable. Atpresent there is no established mechanism to carry out integrated transport planning. Forexample, the Regional Development Plan for the Southern Province was developedwithout input from transport planners. This would require setting up an institutionalstructure to carry out such integrated planning. The recent proposal approved inCabinet to create special human settlement committees at the provincial and districtlevels was endorsed in discussions of the recommendations of this report with a widerange of stakeholders. These committees to be chaired by the chief secretary of theprovince or district will include the relevant provincial and district officials as well asrepresentatives from relevant national agencies. Also needed for coordinated transportplanning is a body to be responsible for transport sector strategy and policy (seeparagraph 2.29).
4.29 To attain economic and financial sustainability it is necessary to raise bus fares toa level that would allow an efficient private bus operator offering service withoutexcessive overloading to recoup the costs of providing that service, including an adequatereserve to replace their buses approximately every 100 months. During discussions of therecommendations of this report, there was agreement that fares to meet such operatingconditions ought to be phased in and regular annual fare increases be implemented tokeep them at appropriate levels. Subsidies need to be targeted to maintain selectivesupport for non-economic rural bus routes and low fares for poor schoolchildren3 1. Forother services, fare increases should follow the following formula:
* an increase between 35% and 50% (over and above the recent 15% increase)to be phased in over 2 to 3 years
* regular annual increases linked to a weighted index of bus costs to reflect themix of imported and local inputs used in bus service provision
- separate indices as needed for long distance and local services* index to be applied to average fares, with the NTC and PTAs allowed some
discretion in determining how to translate average fares to individual stages ofincrements
* higher fares for premium services would be allowed* surcharge for night and early morning services would be allowed
4.30 Some institutional changes will be needed to ensure that fares keep pace withcosts, despite political pressure to keep fares low. A law needs to be passed requiring theNTC to phase in increases and to approve regular annual fare increases in the mannerdescribed in paragraph 4.29. The law would stipulate that the increases would not be
31In the December 1996 Workshop, it was agreed that there might be an argument for providing somefinancial support for the peoplized companies as long as they were providing socially important services,such as night and early morning services or school fares, that the private companies were not. However, tothe extent that the differences between the private and peoplized companies in this regard were narrowed,then it weakens the case for special aid to the peoplized companies in the form of concessionary loans forbus purchases and other forms of preferential support.

45
subject to Cabinet approval, although Parliament could review and disapprove an increaseif it thought it inappropriate. A study is needed to determine the increase required tomake fares compensatory and to devise the cost index to govern the regular annualincreases. The Government should give top priority to drafting the fare increase law.
4.31 Other policy and institutional changes tc improve the economic and financialsustainability of the road transport sector relate to the structure of the bus industry. Thepresent 93 peoplized companies should be clustered to improve their management andperformance. During discussions of the recommendations of this report, there wassentiment that it might be advisable to have more than the 11 companies proposed in thelaw currently before Parliament. Private buses should remain unclustered for at leastseveral years in recognition that the proposed consolidation bill before Parliament mightreduce some of the advantages of low costs and overheads that the private operatorscurrently enjoy.
4.32 Until the law is passed, the NTC and PTAs should use their statutory authority tosupervise bus schedules, dispatching, and provision of evening services to improve thequality of service that the private and peoplized companies offer. This is currently beingexperimented upon in the Western and Southern provinces, and needs to be extended toother provinces. In this regard, it is important to affirm that the peoplized as well as theprivate companies are subject to the regulatory authority of the NTC and PTAs. If theNTC and PTAs are unable to improve the performance of the private sector, then forcedconsolidation of private buses into companies, and a system of competitively bidding forexclusive route franchises for limited terms of 5 years, would need to be introduced. Toimplement all these measures, it would be necessary to strengthen the capacity of theNTC and PTAs to supervise bus operations. The Government should carry out therecommended clustering and monitor the efforts of the NTC and PTAs to improve busservices.
E. PRICING AND FINANCING IN ROADS
4.33 Structure of User Charges. A well structured system of user charges shouldincorporate economic and environmental sustainability principles, in addition to theirrevenue-raising function. The system of charges currently in use in Sri Lanka, meets thecriteria of financial sustainability, since, as a class all road users meet all the financialcosts of the road system. Estimated road expenditures are in the order of Rs 7 billion,while revenues from road user charges are about Rs 12 billion. However, the system ofcharges in place masks certain inefficiencies. First, not all road users are meeting thedistance-based cost of damage to the system. Damage is caused primarily by diesel-powered heavy vehicles. With the exception of articulated trucks, the remaining heavyvehicles do not meet the distance based costs of damage.
32 Much of the material in this section derives from a presentation by Jayaweera, D.S., "Are the CurrentUser Charges in Roads Adequate?", Transport Sector Strategy Workshop, Colombo, July 3/5, 1996.

46
Table 16: Structure of Charges and Costs for Road Usage in 1995
Vehicle Category Damage Cost in Rs per km Revenue in Rs per kmCar 0.63 2.59Utility 0.96 1.64Medium Truck 1.72 1.212-Axle Truck 1.29 1.093-Axle Truck 2.36 1.75Articulated Truck 1.75 2.50Medium Bus 1.05 0.67Large Bus 0.55 0.79Motor Cycle 0.09 0.49Source: Calculated from Updated Costs and Revenues from the TSPC using the a cost-allocation formuladeveloped in a Road User Charges Study for Sri Lanka which used HDM as a basic model for damagecosts.
4.34 The costs that are recovered from users do not meet all the economic costs, whenthe non-private costs of road use are taken into account, but some users meet these coststo a larger extent than others. Cars and motorcycles meet more than their share of roaddamage costs, and seem to be meeting some of the non-private costs of extra road space,as they do contribute to congestion and air pollution. Similarly, for large articulatedtrucks. Medium trucks and buses do not seem to be meeting not only the costs ofdamage, but the costs of road space and air pollution.
4.35 The current system of prices in the road sector relies on indirect charges for roaduse, paid by highway users in the form of fuel taxes, import duties, insurance andregistration fees. This form of charges in not efficient and fair across classes of users.The considerable pavement damage done by trucks are more related to truck use andweight than ownership, and fuel consumption rises roughly with truck weight. Even iffuel taxes are raised for the classes that are now not meeting their full share, they will notsubstitute completely for costs of damage, since pavement damage rises exponentiallywith axle loads. It may be necessary to use some surcharges in registration fees and tocharge for surpassing axle load limits.
4.36 It is recommended that a new system of road user charges be developed, whichincorporates the two main purposes of user charges: (a) to raise revenues to financehighway services; and (b) to change the behavior of vehicle owners and users,particularly by making them take into account the full costs of their use of roads. Assuch, a system of road user charges should include in addition to budgetary costs of roadprovision, the social and environmental costs (pollution and congestion).
4.37 In particular, this will require: (a) changing the price of diesel and modifying thediesel tax; (b) restructuring the annual revenue licensing system; (c) implementing a roadmanagement system (including pavement, roadside, and bridges) so that the actual costsof road damage can be calculated and apportioned correctly; (c) opening up the petroleum
47
market so that there is more competition thus lowering the price of fuel allowing a non-inflationary increase in the taxes on fuel; (d) imposing central area parking controls toregulate Colombo's congestion. Parking controls will only affect local traffic, and notthrough traffic which is half of current area traffic, and will also not affect trucks, so thereis a need to think of a congestion tax for through traffic (such as a penalty for use of roadsduring congested times); and (e) restructuring the system of subsidy allocations in thesector. This is of particular importance for subsidies to school vans. At present suchsubsidies are being used for purposes other than what they are meant for because it iseasy to obtain a certificate from the Motor Registry as a school van, and insurancecompanies are unable to distinguish between designated and other users. Many of thevans operating are not actually carrying students and not only are they not paying theirfair share of the costs of road usage, but are being subsidized for road usage.
4.38 All these recommendations were endorsed by participants at two workshops heldin Colombo.
4.39 Financing Road Maintenance. With respect to financing maintenance, andrelated to the issue of reforming road user charges, the Government needs to find amechanism to protect funds generated for road users for maintenance purposes. A "RoadMaintenance Fund" is a possible option (see Box 7 for the advantages and disadvantagesof a road maintenance fund).
F. RESTRUCTURING THE RAILROADS 33
4.40 The railways in Sri Lanka are run by a Government Department, the SLR. It isresponsible for a dense network of 1,453 km of track, which spans the island from Northto South and East to West, linking Colombo with all major centers of economic activity.At 22 km of track per thousand square km of land mass, the SLR operates one of the mostdense rail networks in South Asia. Though the network is extensive, railway does notcurrently play an essential productive role in the Sri Lankan economy; however, it playsan essential social role. Of the 3.5 billion ton-km of freight movements in 1994, 92.2%were by truck, 3.4% by coastal shipping, and 4.4% by rail. Shutdown of freightoperations on the SLR would have limited effect on Sri Lanka's economy, with theexception of freight movements to and from the port of Colombo and in the transport ofproducts such as limestone, oil, flour and fertilizer. On the passenger side it is a differentstory. Of the 28.4 billion passenger km in 1994, excluding motorcycles, 86.9% were bybus, 5.1 % by private auto, and 8% by rail. Shutting down passenger operations wouldcause increased congestion in Colombo, where passenger movements are concentrated
This section uses material from the following papers presented at the Transport Sector StrategyWorkshop, Colombo, July 3/5, 1996. McCullough, G.J. "Efficient Utilization and Development of The SriLanka Rail Network"; Weerasooriya, G.P.S. and Storm, U.E., "Operation of Non-Economic Routes byRail; and "Weerasooriya, G.P.S, "Reforming the Railway".
48
(see Box 1 1). As much as 20% of the passenger km of travel are from suburbancommuters.
4.41 Need for Reform The performance of the SLR as it is currently operated istroubling. The railway operating deficit in 1995 is over Rs 1.4 billion. The operatingdeficit in 1994 was about the same, and represented about 5% of tax revenues and 10% ofpublic expenditures in Transport (ports and shipping, railways, highways). Laborexpenditures alone during this period were Rs 1.2 billion, greater than the combinedpassenger and freight revenue of Rs 0.96 billion. In the meantime, passenger output onSLR has increased significantly since 1992, growing nearly 30%, despite very poor levelsof service. Freight output during the same period declined by 23%. The reason for thepoor performance in terms of operational deficits, is partially due to the inability of therailway to raise tariffs, due to its expected role in meeting political and social serviceobligations. The SLR presents a policy dilemma for policy makers in Sri Lanka. Thealternatives available in terms of extremes are to: (a) abandon the railroad (and placemore burden on congested highways), (b) reform the current system of operations; or (c)continue to sustain large railway deficits.
4.42 Railway Reform. The dilemma facing Sri Lanka is not unique. Governmentsaround the world have had to confront railway problems. In particular, reform processeshave been put in place to mrLake railway operations more sensitive to changing marketsand demands for service. Sri Lanka's railway networks, technology, and operatingpractices, like those of many other countries, developed 50 to 100 years ago. Whileeconomic activity dependent on transport has evolved, in terms of location, productdiversity, and intermodal competition, railways have remained more or less fixed. Thishas resulted in a loss in market share. To revitalize the railways, it is necessary toreorganize the assets, liabilities, and work force to enable railways to respond to itscustomers needs34 . Key to such a revitalization is the participation of the private sector inrailway activities such as through contracting out internal functions, as well as theintroduction of competition in the provision of railway services, including enhancing thecapacity of the railway to compete internodally.
3 Kopicki, R. and L.S. Thompson, Best Methods of Railway Restructuring and Privatization, The WorldBank, CFS Discussion Paper Series, Number 111, p.1 1.

49
Box 11: External Benefits of the Railway
There is evidence that rail services in Sri Lanka provide cxternal benefits that offset, to some extent, thelosses incurred. A major benefit is the reduction in demand for roads, thus saving vehicle operating costs,and more importantly, red6ced congestion, delays and associated costs, not to mention the environmentalbenefits of lower air pollution per km of travel. A corridor analysis calculated the increased number of-vehicles that would travel on Galle Road, between Kalutara and Colombo, in the event that the morningpeak rail service is not operated. The study indicated the railway saves on the order of Rs. 200 million-U`S$ 4 million) in operating costs and in congestion costs, for the morning peak. Assuming similarfindings for the evening peak, total savings would be in the order of Rs. 400 million (US$ 8 million) peryear. Annual railway operating costs for this corridor are now around Rs. 90 million (US$ 1.8 million),and around Rs. 290 million (US$ 5.8 million) including capital and fixed costs. The estimated savings invehicle operating and congestion costs exceed the current operational deficit, and meet more than 100% ofthe total costs including capital and fixed costs.
::Road Link ig | =Vehices. i(Re.milins (e mills ItC . ... ... . nfin
Colombo-Kollupitiya $15 . . .23Kollupitiya-Dehiwela . .. . ..
Dehiwela-Ratmalana . 47 '2Ratnalana-Panadura 15' .4 '9Panadura-Kalutara 8: . .... 6 .....Total ......_ i1 2
Similar studies have not yet been done for the other suburban services, but given the congestion thatalready exists on parallel roads, and in the case of the Main Line, a lack of directly connecting roads, it cansafely be assuned that savmngs will be significantly for heavy traffic areas near Colombo. This is more
Ariiportant Lnbuilt-up corridors where it is very expensive (land acquisition and resettlement) to expandhighway capacity.
Source: Weerasooriya, G.P.S., and Storm, U.E., "Operation of Non-Economic Routes by Rail", presentedat the Transport Sector Strategy Workshop, Colombo, July 3-5, 1996.
4.43 The World Bank's experience in support of rail restructuring suggests that
successful restructuring begins not with changes in managerial practices, but with
changes in the political and economic operating environment. Restructuring is
sometimes a long sequential process in which managerial changes (implementation)
follows political agreement about the role of the railroad and planning of an appropriaterail system.
4.44 Restructuring Process. For Sri Lanka to successfully restructure a number of
steps are necessary. These include: (a) acknowledge that there is a crisis in the operations
and management of the railway; (b) define the economic role for the railway; and (c)
develop a system plan that is consistent with the economic role. This will require
adjusting transportation policy to meet the new role of the railway. There is general
acknowledgment that there is a crisis in the railways. The Deputy Minister of Finance in
his 1994 budget speech stated that "[Sri Lanka's] antiquated railway system is in urgent

so
need of modernization". In an interview with the Sunday Times, December 15, 1996, theMinister of Transport, stated that "we will give the SLR a deadline, and if they do notachieve a given target, it would be turned into an authority, headed by a Chairman andcontrolled by a Board of Directors".
4.45 Role of the Railway. To define the economic role of the railway, the Governmenthas just completed a structured Business Plan, which defines the main focus areas of therailway as: (a) suburban passenger services; (b) long distance express passenger trainsstopping only at major population centers; (c) non-stop fast trains transporting "train-load" general freight between major population centers only; and (d) special purpose non-stop unit trains for transporting bulk freight from source to destination . This BusinessPlan is to ensure that decision making within the SLR is based on commercial reality andthat the railways are geared to change to meet an ever changing business environment.
4.46 Focus on Suburban Passenger Market. A preliminary analysis of the physicalassets, markets, and operations of SLR have indicated that the railway is mostly asuburban passenger railway. The railway is able to meet up to 48% of its operating costson passenger commuter services to and from the Colombo Metropolitan area, indicatingthat with proper operation and improvements in efficiency, there is an economic role forthe railway in these services. Not to mention the social and environmental role in termsof reduced congestion and air pollution. A passenger survey indicated that, passengerswho use this service mostly use it because it is less expensive and faster than bus.
4.47 Rationalize Intercity Passenger Services. Intercity passenger services provided byrail are in direct competition with buses. The railway does well in terms of runningintercity fast passenger trains, where cost recovery levels are as high as 66% on somelines. This is a service that would be very suitable for concessioning out to the privatesector, especially since passengers ride these trains for their comfort and safety comparedto competing bus services. The high accident rate on intercity roads does contribute tothe transfer of passengers onto the railway. In the interim, the SLR should seek fareincreases for intercity passenger services to be in line with the level of fares for busservices in competing corridors.
35 Policy Statement, Ministry of Transport, Environment, and Women' Affairs, Hon. SrimaniAthulathmudali, Minister, 1997.
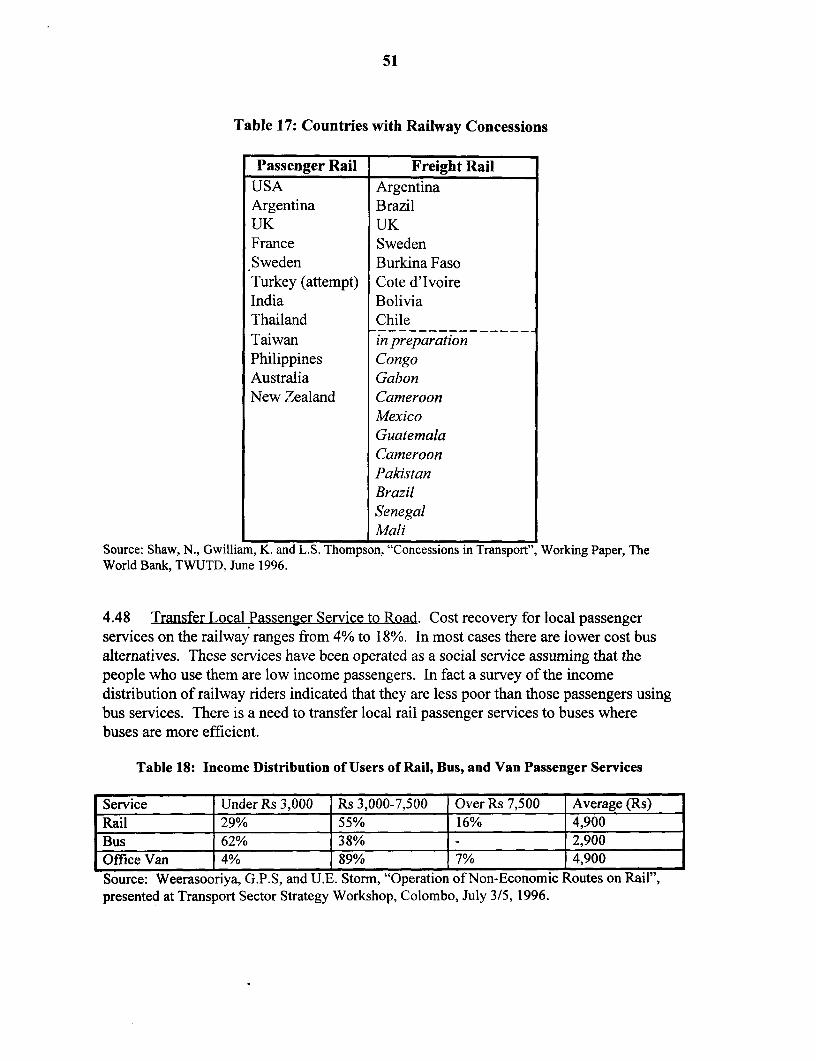
51
Table 17: Countries with Railway Concessions
Passenger Rail Freight RailUSA ArgentinaArgentina BrazilUK UKFrance SwedenSweden Burkina FasoTurkey (attempt) Cote d'IvoireIndia BoliviaThailand ChileTaiwan in preparationPhilippines CongoAustralia GabonNew Zealand Cameroon
MexicoGuatemalaCameroonPakistanBrazilSenegalMali
Source: Shaw, N., Gwilliam, K. and L.S. Thompson, "Concessions in Transport", Working Paper, TheWorld Bank, TWUTD, June 1996.
4.48 Transfer Local Passenier Service to Road. Cost recovery for local passengerservices on the railway ranges from 4% to 18%. In most cases there are lower cost busalternatives. These services have been operated as a social service assuming that thepeople who use them are low income passengers. In fact a survey of the incomedistribution of railway riders indicated that they are less poor than those passengers usingbus services. There is a need to transfer local rail passenger services to buses wherebuses are more efficient.
Table 18: Income Distribution of Users of Rail, Bus, and Van Passenger Services
Service Under Rs 3,000 Rs 3,000-7,500 Over Rs 7,500 Average (Rs)Rail 29% 55% 16% 4,900Bus 62% 38% 2,900Office Van 4% 89% 7% 4,900Source: Weerasooriya, G.P.S, and U.E. Storm, "Operation of Non-Economic Routes on Rail",presented at Transport Sector Strategy Workshop, Colombo, July 3/5, 1996.

52
4.49 Rationalize Tariffs and System of Subsidies. The reason for the skew in theincome distribution of railway users, is because most of them are civil servants, whopurchase season tickets on the railway, which are for unlimited use, and their departmentspay 75% of the season ticket price. Therefore, these passengers receive subsidies forusing the railway. A typical civil servant using the railway gets a monthly season ticketfor less than the cost of three days travel at ordinary ticket prices. The low incomerailway users who are not civil servants have to pay the full cost of travel on the railway.There is a critical need for the Government to rationalize the system of tariffs andsubsidies on the railway.
4.50 Public Service Obligation (PSO) Contracts. There is a need to develop PSOcontracts between the SLR and the Government that tie the level of subsidies for servicesthat the SLR is required to provide to meet the operating costs for these services. Inaddition, to capture some of the external benefits of the railway and give incentives to theSLR to improve service conditions, it would be prudent to tie the PSO contracts to thelevel of reduction in congestion and air pollution attributable to the railway. A studyneeds to be conducted to determine the structure of such PSO contracts which includesattributing achievement in congestion and air pollution reduction to improvedperformance of the railway.
4.51 Open Access to the Network for Freight Operations. The railway transports manycommodities, but its niajor customers for freight service are limestone, oil products, andflour. Limestone is the main commodity by tonnage, but falls behind oil products andflour in terms of tonne-km and revenue. Cost recovery for these freight services evenwith the existing levels of tariffs and inefficiencies in operation is between 60% and 85%,indicating that, with improvements in efficiency, these services may be viable for privateoperation. One option is to open access to the railway network for freight shippers.Under an open access policy, SLR would make available track to private freight operatingcompanies, in return for access payments. Access payments, based on incremental coststo SLR, would provide a source of revenue to the railway, and access rights would enablenew carriers to finance needed motive power and other capital to improve freightoperations. This would allow the SLR to focus on the key services to its passengers. TheSLR and BOI with assistance from other agencies should continue to advertise anddevelop contract access agreements with freight shippers and other potential carriers.
4.52 Commercialization and Modernization3. To allow the railway to competeeffectively with trucking and bus services, as well as to manage contract accessagreements and negotiations for PSO, it is necessary to have the SLR operate followingcommercial principles. This requires not only increased productivity, but management ofrailway operations as a business. The SLR needs to set up a commercial business groupwithin the commercial section at the railway, that will manage both the commercialservices deriving from access agreements, as well as the PSO agreements with the
36 Adapted from a note prepared by Ed Storn, December, 1996.
53
Government for provision of non-economic passenger services. This group will need tobe appropriately staffed, and should have a separate budget allocation. It should also begiven responsibility for negotiating other profitable business opportunities, such asdeveloping lands owned by the railway. To support this commercial unit, there is anurgent need to upgrade the accounting system at the railway. The current system is slow(often in arrears by several months) and only provides data that is too consolidated forany use. Computerization of the various accounting sub-systems as well as updating ofthe accounting rules and procedures in use will be critical, to determine revenues andcosts by line of business, as well as to provide up to date balance sheets includingvaluation of the railways assets. Also critically needed is an improvement in theprocurement procedures at the railway.
4.53 Labor Rationalization. The railway, as the port, has a large labor force. Therestructuring options recommended in this report will make some employees redundant.There is a need for labor retrenchment schemes, including compensation, re-training,assistance in finding employment, as well as retirement schemes. To improve the level ofproductivity of remaining employees, training is needed in accounting procedures,computers, proper maintenance practices, and modem methods of management andoperation. There is also a need for an objective and transparent system to addressgrievances at the railway, redefine work rules to improve productivity, evaluate employeeperformance, and link promotions and pay increases to productivity improvements. Thisrequires improving the level of communication between management and the railwaystaff as well as the unions.
4.54 Government Agreement on Reform. The Government has accepted in principle,to open access to the railway track and other rail facilities to the private sector and otherpublic-private operators'7 . The proposed direction of reform for the SLR is consistentwith advice from the Minister of Transport. In her speech at the Transport StrategyWorkshop in Colombo, July 1996, the Minister stressed the public role of the railroad inproviding passenger services but also acknowledged "a lot of possibilities for privatesector-public sector collaboration in freight" (see Volume II of the report for the speech).
4.55 Maintenance. The practice of misclassifying expenditures between capital andrecurrent items (see Box 6) needs to be stopped. The SLR should develop a system ofconsistent definitions of what constitutes maintenance, rehabilitation, upgrading,modernization, and new investment. These definitions should be used in the budgetaryprocess as well as in the accounting systems at the railway. Once such definitions havebeen agreed upon, sufficient funds should be allocated for maintenance and rehabilitationactivities to capture the accelerated deterioration of the assets of the railway.
Policy Statement, Ministry of Transport, Environment, and Women' Affairs, Hon. SrimaniAthulathmudali, Minister, 1997.
54
4.56 Investments. In addition to the policy reform measures outlined above, someinvestments are needed to make the railway an effective competitor with road transport.The railway should continue the ongoing track rehabilitation program, funded by theOECF, to improve the quality of services on the railway. Of utmost importance, tosupport the ongoing restructuring, is the need for a study to quantify and design publicservice obligation contracts between the Government and the SLR. Investment is alsoneeded to upgrade the accounting and management information systems (MIS) at therailway. To better provide services to the suburban passenger market, the railway needsDiesel Multiple Unit (DMU) trainsets and other supporting rolling stock. For long-distance passenger services, such as in the planned electrification of the Colombo-Kandyline, the BOI should continue to seek private sector participation to upgrade theseservices, when analyses indicate that they are economically feasible. It is critical thatevaluation of electrification proposals be done on an economic and financial return basis,and that they be compared to other investment options such as upgrading services on railwithout electrification and investing in the parallel road network. A key input to suchcomparative evaluation is a mode-choice demand model, which needs to be developed.The last mode-choice model was calibrated in 1987 and is in need of updating, since anumber of changes have occurred since then, including the private provision of busservices and an escalation in the share of motorcycle and threewheeler traffic. There isalso a need to invest, with private sector participation, in providing rail access to theplanned intermodal facilities at ICD and improving rail access from Galle port to theGalle-Colombo line. Other investments such as for common access facilities will bedefined as the railway negotiates contract access agreements with private shippers.
55
V. ENVIRONMENTAL AND SOCIAL SUSTAINABILITY3 8
A. PHYSICAL PLANNING AND ENVIRONMENTAL ISSUES IN TRANSPORT39
5.1 Demand for Transport. Since the mid 1980s, the demand for freight andpassenger transport has been growing faster than population and GDP in Sri Lanka.There has been an immense increase in the share of private modes (other than buses) intransportation, with automobiles and motorcycles now accounting for about 40% of thetotal (these estimates need to be verified!). In particular, motorcycle travel has beengrowing at an accelerating rate, which has ominous implications since two wheeledscooters and motorcycles are far more polluting than automobiles (22 times morevehicular emissions per mile traveled). When normalized in terms of passenger km, thedifferential in favor of cars is even higher.
5.2 The magnitude of this increase, as well as shift in mode, can be seen from the factthat the passenger km from private automobiles excluding motorcycles has been growingfrom 1,238 million in 1985 to 2,717 million in 1990, and 7,938 million in 1995. Theestimated passenger km for 1995 by motorcycles is about 19,000 million.
5.3 During the same period, passenger km on private buses increased sharply from14,060 (1985) to 22,565 (1990) to 31,355 (1995) while public bus use barely movedbetween 1985-90, going from 15,249 (1985) to 13,674 (1990) increasing to 19,308(1995) after purchasing new buses. Passenger km on the railways were similarly staticgoing from 2,101 to 2,781 to 3,404. Thus the increase in road motorization was fueled inpart by a huge drop in the utilization of public transport.
5.4 It is probable that the increase in motorization involved a shift in mode from non-motorized to motorized (e.g., from bicycle to motorcycle), in addition to the shift fromhigh occupancy vehicle to low occupancy (e.g., from bus to automobile). Demandstudies would be needed to assess the reasons for this shift as well as to estimate theelasticity of consumer response with respect to different attributes of each mode,including, as in the case of private vs. public buses, service quality, and reliability etc.This is important for assessing the best policy options to tackle the environmentalproblems caused.
38 Most of the issues and suggested recommendations in this section come from a joint workshop held bythe Government of Sri Lanka, IJNDP. OECF, ADB, and the World Bank to discuss sector strategy. Therewas broad representation ffom within the country of the stakeholders in transport including the privatesector. In preparation for the workshop, background papers were prepared. These papers dealt in detailwith key issues and appear in Volume II of this report.
39 Material for this section has been taken from notes by Ajay Kumar and Sheoli Pargal.

56
5.5 Congestion and Safety. A number of studies have estimated the cost ofcongestion in the Colombo Metropolitan Region. According to a 1993 study by theMetropolitan Environmental Improvement Program, the cost of congestion per year isprojected to increase from Rs. 240m in 1992 to Rs. 778m in 2002, spreading across aradius from the city center of 26.5 km to 28.7 km respectively4 0. More recent estimatesindicate that the cost of congestion in the Western Province (Colombo MetropolitanRegion) in 1995 were around Rs. 550 million (US$ 9 million)41. The degree of
42congestion and associated cost is expected to double over the next decade . In addition,estimates indicate that for a 6% increase in GDP, the demand for road space increases by8%. In addition to the costs of congestion are the costs of accidents and the directenvironmental costs resulting from pollution. All these estimates need to be refined withthe ongoing congestion analysis. The level of safety in Sri Lanka, when measured interms of fatalities per 1 0,000 vehicles, is low compared to its East Asian neighbors whichhave much higher levels of motorization (Table 19). Adding the cost of accidents peryear to the costs of congestion brings the total cost of congestion and accidents to Rs.420.5m in 1992, Rs. 631.6m in 1997, and Rs. 930.4m in 200243. The significance ofthese numbers can be gauged from the fact that GDP in 1992 was Rs. 384.36 billion, sothat in 1992 the cost of accidents and congestion was about 0.1% of GDP. While thisfigure is not as high as other countries with levels between 1-2% of GDP, the trend anddistribution is disturbing. Between 1980 and 1992, the number of road accidents reportedin the Western Province divisions alone rose by 94% compared to 54% in the rest of thecountry. More than half of the accidents involve pedestrians and cyclists, and about 10%of them are fatal.
Table 19: Road Accident Fatality Rates by Country
Country Year Fatalities/] Ok Vehicles/lOk Fat/lOOKVehicles Persons Persons
Sri Lanka 1992 20.0 501 10.0Malaysia 1993 7.0 3523 24.5Thailand 1993 8.4 1927 16.3Indonesia 1990/92 10.6 571 6.1Source: Taken from the International Road Federation Statistics except for Malaysia which istaken from PDM.
5.6 Environmental Pollution. World Health Organization (WHO) data show thattwelve of the fifteen cities with the highest level of particulate matter and six of the
Urban Development Authority (1995), Revised Colombo Metropolitan Regional (Outline) StructurePlan: Colombo Metropolitan Region Annexures, page 9-10.
41 TSPC estimates.
42 Colombo Urban Transport Study, 1996.
Urban Development Authority (1995), Revised Colombo Metropolitan regional (Outline) Structure Plan:Colombo Metropolitan Region Annexures, page 21.

57
fifteen cities with the highest level of sulphur dioxide in the world are in Asia. Theimmediate and long term implications for the health and quality of life of the inhabitantsof these cities are manifested in increased morbidity and mortality rates, lowerproductivity of the labor force, deterioration of physical capital and infrastructure, and theloss of amenity and ecological values.
5.7 The sources and severity of air pollution vary. They depend on a city's economicbase, income levels, and topographic and meteorological conditions. Pollution frommotor vehicles produces about one fifth of the incremental CO2 in the atmosphere arisingfrom human activity (which has implications for global warming), one third of the CFCsemitted (ozone layer depletion), and about half of the nitrogen oxides (which contributeto acidification and thus ecological damage). Road motor vehicles account for more thanthree quarters of the transport sector's contribution to global air pollution.44
5.8 Health Impacts. The health impact of different pollutants varies. Lead fromleaded gasoline is toxic. It is absorbed by the blood and accumulates in the body. It isassociated with damage to the central nervous system, resulting in learning disorders ininfants and young children. Particulate, especially the very fine ones, affect the lungs andaggravate or cause respiratory disorders. Sulphur dioxide has a similar effect, which has,however, not been clearly differentiated from the effect of particulate per se. Nitrogenoxides and volatile hydrocarbons do not have direct health impacts but are precursors ofozone, which has an impact on human health. Carbon monoxide has a debilitating effectand causes death at high levels.
5.9 Air Pollution. Sri Lanka has limited experience in air quality monitoring andmanagement. To address this gap, the UNDP-funded, World Bank-executedMetropolitan Environmental Improvement Program (MEIP) began work in Colombo in1990, along with four other metropolitan areas in Asia. MEIP's mission is to assist Asianurban areas tackle their rapidly growing environmental problems. In 1992, MEIP-Colombo prepared a draft proposal for air quality management in the ColomboMetropolitan Area, the Clean Air 2000 Action Plan.
5.10 Sri Lanka's air pollution problem appears to be currently at manageable levels.Yet based on projected rates of economic, demographic, and vehicular growth, the airpollution situation in Colombo could come to resemble that of more severely affectedAsian metropoli. The Clean Air 2000 Action Plan45 notes that the transport sector is thebiggest contributor of air pollutants to the environment in the Colombo Metropolitanarea. It is responsible for 88% of particulate emissions, 4% of SO2 (94% of SO2 is fromindustrial sources), 82% of NOx, and 100% of HC and CO emissions. Thus it is clearthat the transport sector's contribution to environmental problems overall in the Colombometropolitan area is quite high.
4Sustainable Transport: Priorities for Policy Reform, 1996. The World Bank: Washington, D.C.
MEIP, October 1992

58
5.11 An indication of the environmental impact of this immense increase inmotorization, coupled with the shift away from mass/public transport modes, is providedby the data on vehicular emissions over the past four years (Table 20).
Table 20: Growth in Vehicular Emissions 1992-96Pollutant Vehicle Emissions in Change 1992-96
'000 Kg in 1996CO 320.64 199%HC 73.81 156%NOx 113.77 564%SOx 16.01 124%Aldehydes 4.50 3114%PM 9.66 928%
Source: Transport Studies Planning Center.
5.12 Mobile sources of pollution in Sri Lanka are currently not controlled. Vehicleemissions discharge pollutants directly to the external air in restricted corridors. Thequality of fuel plays an important role in the emission of exhaust gases. The diesel fuelpermitted for use in Sri Lanka contains up to 1. 1% sulphur, contributing to the high levelsof sulphur dioxide emissions. The diesel in Sri Lanka also contains a large quantity of"high ends" which results in high emissions of hydrocarbons. Leaded gasoline is alsoused; about 0.43 grams per liter of tetra ethyl is allowed which is high in comparison toleaded gasoline in other countries. Imports of second hand vehicles and motorcyclesfurther contribute to the problem of emissions, since they have poor combustionperformance.
5.13 Policy Options. The relative importance of the environmental/health and time costsof transport related congestion will determine the appropriate policies to be adopted toalleviate the problem, but for the most part policies that attack one aspect will have abeneficial effect on the other. A detailed list of recommendations is summarized in Box 12.
5.14 It has been recognized that Colombo needs a balanced transport strategy whichmakes some provision for private transport but, at the same time, realizes that the citymust retain and be based upon a strong, comprehensive, public transport system.46 Werevisit the Clean Air 2000 Action Plan in order to determine whether it is properlyaligned to address the needs of such a strategy.
5.15 The Clean Air 2000 Action Plan was to reduce air pollutants in the ColomboMetropolitan Region by the year 2000. Based on a review of the available air qualitydata, the Action Plan concluded that by year 2000, the following reductions in ambientlevels should be achieved: carbon monoxide 40%, oxides of nitrogen 30%, lead 30%,
46 Colombo Urban Transport Study (March 1996)

59
oxides of sulphur 75%, and hydrocarbons 20%. To reach the targets, 50 actions wererecommended falling under seven headings: vehicle inspection and maintenance; fuelreformulation, pricing and fleet mix; emission inventory and monitoring; standardsetting; institutional framework and regulatory compliance; economic instruments;transportation planning and traffic management. Of these, emission inventory andmonitoring, institutional framework and regulatory compliance, and transportationplanning and traffic management, are clearly longer term measures that involve structuraland institutional policies.
5.16 The remaining four measures are likely to be implementable in the short term.Following Eskeland (1994), we can rank them in terms of increasing marginal cost as(least cost) economic instruments, standard setting, vehicle inspections, and, finally, fuelreformulation (maximum marginal cost).47 For more information on therecommendations under Clean Air 2000, see Annex 1.
Critique of actions recommended under Clean Air 2000 Plan
5.17 Appropriate policy design requires knowledge of the behavioral dimensions of thephenomenon of motorization. All the actions suggested under the Plan, however, tacklevehicular emissions from the same angle: the mitigation of the impact of motorization.There has been no attempt to look at the issue analytically - why has there been thisparticular pattern of motorization and what options exist to reverse or stem the increasein motorization?
5.18 This has effectively meant ignoring most policies that would lead to themodification of behavior including those that would reduce individual trips, encouragetraffic to move away from particularly vulnerable areas or times, or switch to four-strokerather than two-stroke motorcycles. Given that such a large proportion of the increase inpassenger miles traveled has been due to a shift from public to private modes of transport,this is a surprising lacuna. Further, this has resulted in limited analysis of the alternativesto private vehicle use Qr design of strategies to make them more attractive. The existenceof viable public mass transit alternatives is a pre-condition for switching away fromreliance on private modes to the use of public modes.
5.19 Economic instruments affect the demand for polluting trips (like fuel andcongestion taxes or road user charges). While they are indirect (in terms of impact onpollution), they may be easy to implement. In addition they would generate revenuesthat could be earmarked for supply side improvements like rehabilitation of roads, as well
7 Ranking the different options for reducing air pollution emissions in order of increasing marginal cost,the least cost option is retrofitting engines to use compressed natural gas (CNG) or liquefied petroleum gas(LPG); setting emission standards follows; then comes the inspection of first, high use vehicles and then,passenger cars; and finally fuel improvements. From Eskeland, Gunnar S. 1994. 'A PresumptivePigovian Tax: Complementing Regulation to Mimic an Emissions Fee'. The World Bank EconomicReview, 8 (3).

60
as building secondary arteries and highways that improve traffic flow and reduce thecongestion and associated pollution from slow moving traffic. The weakness of relyingon reducing congestion to improve air quality is that the impact will depend on wheretraffic is diverted and on the resulting distribution of traffic speeds. In particular, supplyside improvements aimed at reducing congestion usually result in attracting more trafficon the roads.
5.20 It is possible that high duties or taxes on new vehicles could have a perverseimpact on the environment by increasing the incentive for consumers to keep on usingolder, less efficient vehicles. As one of the main causes of the air pollution problems inColombo is the state of the vehicle fleet, some more thought may need to go into this.Policies that encourage fleet turnover would be important in ameliorating theenvironmental impact of transport in Colombo.
B. ENVIRONMENTAL PLANNING AND IMPLEMENTATION4 8
5.21 With respect to environmental planning, it is important for expedientimplementation that the critique concerning the Clean Air 2000 Plan be taken intoconsideration when updating the plan. More importantly, for effective implementation itwould be necessary to set new priorities and limit the plan to do-able objectives;eliminating the rest. A time frame for realizing actions is also needed.
5.22 The general feeling after discussion with key stakeholders is that over the pastthree years since the preparation of the Clean Air 2000 Plan, the original flavor of thedocument has been lost. The National Task Force for the Environment, needs to becomemore effective in ensuring implementation of the key actions selected as priorities. Inparticular, the following will be needed:
• revitalize the goals and aspirations of the original document* encourage actions which could be pursued by the private sector* examine the possibility of a Greater Colombo Metropolitan Transport Authority, to be
responsible for overall evaluation, programming, and standard setting
Material for this section has been taken from a note by Ajay Kumar and Sumith Pilapitiya, and apresentation by Ravi Perera at the Transport Sector Strategy Workshop in Colombo, July 1996.
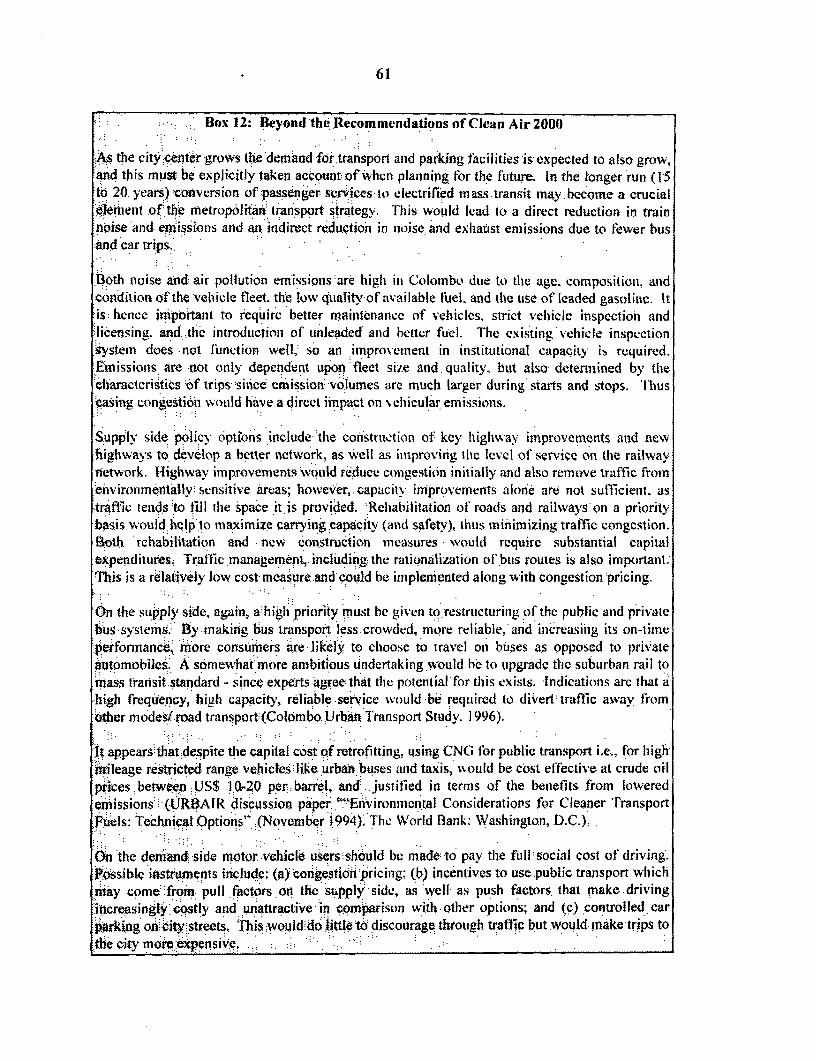
61
Box 12: lBeyond the Recommendations of Clean Air 2000
As the city center grows the dernand -fo transport and parking tacilities is expected to also grow,and this must be explicitly taklen account of whcn planninig for the ftiture. in the longer run (15to 20 years) conversion of passenger sel'icesulo electrified inass.transit may.becomne a crucialelement of the metrop6litan transport strategy. This would lead lo a direct reduction in trainnoise and emissiions and an indirect reduction in noise and exliatst enmissions due to fewer busand car trips..
Both noise and: air pollution emissions are iigh in Colombo dtue to the age. composition, andcondition of the velhicle fleet. the low quality of available tuel. and thic use of leaded gasoline. Itis: helicc important to requirc better maintenance of vehicles, strict vehicle inspectioil andlicensing. and.the introductioni Of unleadied and better fuel. t'he existing vehicle inspectionsystem does not lfunction well, so an improvement in institutional capacity ik required.EEmissions are not only dependent upon fleet size and. quality. but also determined by thie&haractcristics of trips shice cmission:uvouJumes arc much larger during starts and stops. 'Ihuseasing congestion wvould have a direct impact on %ehicular emissions.
Supply side policy opttons include tie conistrlletion of key highway imnprovemenits anid newhighwvays to develop a better network, as ; ell as improving tie level of scrvicc on the railwaynetwork. H4ighway improvenments would reduce colngestion initially and also remonve traffic fromenvironmentally sensitive areas; however, capacitv improvements alone are not sullcient. as*traftic lends to fill the space it.is provided. Reliabilitation of roads and railways'on a prioritybasis would beip.'o maximize carrying capacaty (anid safety), ilths miniimizing traffic congestioni.Both. rchabilitation and new construction measures, would require substantial capitalexpenditures; Traffic.management, including the rationnalization ol .bus routes is also important;This is a relatively low cost measure .and could be implemented along with congestion pricing.
On the supply side, again, a:high priority must he given to.restruicturinig of the public and privatebus systems. By nakning bus transport less.crowdcd, more reliable, and increasihl its on-timepeiformance, More consumers are likely to choose to travel on buses as opposed to pri'ateautomobiles. A somevwhat more ambitious undertaking.would hc to upgradc tlic suburban rail tomass tranlsit standard - since experts a4gree: that the potential'for this exists. Indications are that a-high frequency, high capacity, reliable service Would be required to divert: traffic awav fromofber modes/road transport (Colombo Urban T'ransport Study. I 996).
It appears:that.despite the capital cost of retrofitting, using CNG3 lor public transp)rt i.e., for highMileage restricted range vehicles like urban buses and taxis, %%ould be cost effective at crude oilprices between US$ 10-20 per barrel, and justified in terms of the benefits from loweredCmission1s ([J0RBAIR discussion paper tci4 Environnillntal Considerations for Cleaner TransportFuels: Technical Options" November 1994); The World flank: Washington, D.C.).
On thc demand side motor vehicle users should be made: to pay the full social cost of driving.Possible instruments iiiciudCe (a) congestion pricing; (b) incentives to use public transport whiclimay come from pull factors on thie supply side, as 'well as push factors, that make drivingincreasingly costly and unattractive in comparison with other options; and (c) controlled carparking on city streets. This would do fittle to discourage through traafic but would inake trips totlhe City more apensive.

62
5.23 In the case of air pollution, the Government should focus its efforts in the short-run to reductions in particulate emissions. Sri Lanka is in serious violation of WHOambient air quality standards for particulates while it complies with ambient standards forlead. Additional efforts to control particulate emissions include:* better enforcement of existing laws against poorly maintained and heavily polluting
diesel vehicles. In particular, enforcement against "belching" vehicles might beimproved by simple Polaroid cameras.
* import of crude oils with lower sulphur content or other characteristics that mightreduce particulate emissions
* strengthen the capacity to enforce emission laws* carry out studies to find practical measures to control traffic and congestion and
reduce particulate emissions
C. TRAFFIC MANAGEMENT FOR CONGESTION CONTROL AND SAFETY49
5.24 On the sub-issue of traffic management, there are a number of causes forcongested and unsafe use of road space: (a) growth in private vehicle ownership coupledwith declining public transport facilities; (b) both slow and fast modes sharing the sameright of way; (c) poor coordination between transport and land use; (d) conflict betweenmotorized and non-motorized modes conflict within motorized modes; (e) physicaldesign constraints; (f) lack of firm policies for traffic management; (g) poor drivingbehavior; (h) lack of public awareness; and (i) poor enforcement.
5.25 The fiscal deficit and other constraints to capacity expansion on the roads to dealwith growing demand for infrastructure facilities and reduce congestion, suggest thatthere is an urgent need to address traffic management and safety issues. Among themajor constraints to proper management of traffic is the in existence of a body withresponsibility for traffic management and safety in the Colombo Metropolitan Region(CMR), and nationally. There are a number of inter-agency committees and workinggroups but these function merely as administrative bodies without any statutory power,resources and technical capacity to plan and program.
5.26 Recommendations to improve the situation, including the need for a national levelplanning agency and a transport authority for the CMR are:
* controls on parking and other measures to discourage the use of private motorvehicles in congested and polluted urban areas
* priority for buses in the allocation of street space in congested urban areas* raising the cost of private diesel motor vehicles, which could be based on
targeted increases in the annual and new registration fees for private dieselmotor vehicles
9 Material for this section has been taken from a presentation by Roger P. Parker of WS AtkinsInternational, Ltd. and a summary by Ajay Kumar.
63
* raise level of awareness for traffic safety and road management among roadusers
* need for police training and better equipment to monitor* improve coordination among different transport modes* develop a strong information base* support the use of non-motorized travel, including walking, bicycles and
cycle-trailers (see paragraph 5.29)* provide support to local governments to construct- sidewalks and pedestrian
crossings on congested streets in urban areas
D. ROLE OF TRANSPORT IN POVERTY ALLEVIATION ANDREGIONAL DEVELOPMENT50
5.27 There were valuable contributions from papers prepared to address this issue inthe workshop as well as from participants on the floor. It was suggested that the transportindustry (road, rail, air, sea and river together) has provided a relatively large volume ofemployment. Its expansion, which is crucial for sustainable development offersconsiderable opportunities for direct and indirect employment generation in the future.Recommended actions in this direction are the following:
* develop a better information base to estimate the impact of transport oneconomic development
• expand the role of the private sector in the development of transportinfrastructure (especially roads) and services to create more jobs
* increase the participation of rural unskilled labor, particularly female, in theconstruction and maintenance of roads and other transport infrastructure
e support small scale manufacturing to make non-motorized and intermediatemodes of transport more adaptive to rural conditions, thereby increasing theaccess and mobility needs for rural production
* adopt where feasible project designs to focus on labor generation capacity* encourage participatory planning approaches for developing rural transport
systems* support where feasible cost-effective labor based methods in construction and
maintenance of transport infrastructure
50 Dominique Van de Walle provided a short note on key issues in poverty alleviation and ruraldevelopment.
64
E. ACCESS AND MOBILITY IN RURAL AREAS 5'
5.28 There is a need to look at accessibility and mobility in rural areas (a) not from theperspective of urban transport and urban planning but (b) from the perspective of theneeds of the rural people through their participation. Nature of rural travel is differentfrom urban travel. It is characterized among other things by, limitation of motorizedvehicles, and the bad conditions of roads. These must be borne in mind when planningfor increased access and mobility in rural areas and when planning to enhance facilitiesalternative to existing ones. Non-Motorized Modes of Transport (NMTs) andIntermediate Modes of Transport (IMTs) may be more appropriate than buses in thiscontext. The Government should integrate considerations for access and mobility intotransport sector policy. In particular, efforts should be made to look at alternativesincluding bringing facilities closer to the people, thus obviating the need for travel. Atpresent it is Government policy to establish primary schools in village areas. Research
52studies show that there is a primary school within 2 km of many village centers. Theproblem is for children attending secondary schools, where research indicates that suchschools are on average 5 to 10 km away, and sometimes up to 30 km or more, in remoterural areas. Therefore access to secondary schools for rural children needs to beaddressed. The Government should create a unit within the Ministry of Transport tosponsor research and developed, as well as dissemination by NGOs and others, ofinformation relating to non-motorized and intermediate means of transport. This unitshould also be responsible for safety aspects of NMT and IMT travel.
5.29 Other measures are needed to improve access and mobility in rural areas. TheGovernment should better target support for non-economic rural bus services in order tomake fares affordable for school children. The provision of this support should be on thebasis of competitive bidding for non-economic rural bus services, expanding the currentprogram to include peoplized as well as private companies. Targeted concessionary faresfor poor school children should also be introduced on private buses. It is necessary tostrengthen the capacity of the NTC and PTAs to supervise rural bus services and schoolfares. A study is needed to develop subsidy and targeting schemes for poor children,which includes mechanisms for including the private bus operators in the provision ofservices.
Two reports provided valuable inputs: J. Diandas and M.J. Sahabandu, "Study on Subsidy Allocations inRoad Transport and Operation of Bus Services on Unremunerative Rural Routes", presented in Colombo,July 1996; and Intermediate Technology Development Group, "Access and Mobility in Rural Areas",Transport Sector Strategy Study, Consultative Workshop, July 3-5, 1996.
52 J. Diandas and M.J. Sahabandu, "Study on Subsidy Allocations in Road Transport and Operation of BusServices on Unremunerative Rural Routes", page 71-72, presented in Colombo, July 1996.
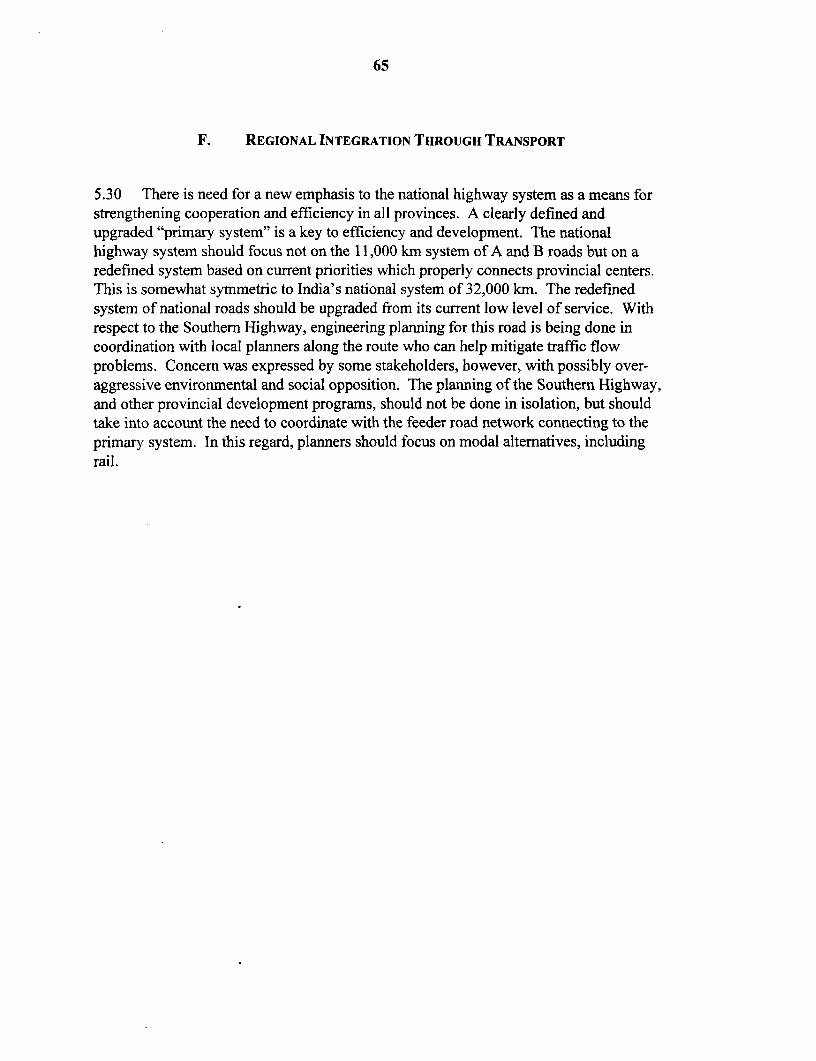
65
F. REGIONAL INTEGRATION THROUGH TRANSPORT
5.30 There is need for a new emphasis to the national highway system as a means forstrengthening cooperation and efficiency in all provinces. A clearly defined andupgraded "primary system" is a key to efficiency and development. The nationalhighway system should focus not on the 11,000 km system of A and B roads but on aredefined system based on current priorities which properly connects provincial centers.This is somewhat symmetric to India's national system of 32,000 km. The redefinedsystem of national roads should be upgraded from its current low level of service. Withrespect to the Southern Highway, engineering planning for this road is being done incoordination with local planners along the route who can help mitigate traffic flowproblems. Concern was expressed by some stakeholders, however, with possibly over-aggressive environmental and social opposition. The planning of the Southern Highway,and other provincial development programs, should not be done in isolation, but shouldtake into account the need to coordinate with the feeder road network connecting to theprimary system. In this regard, planners should focus on modal alternatives, includingrail.
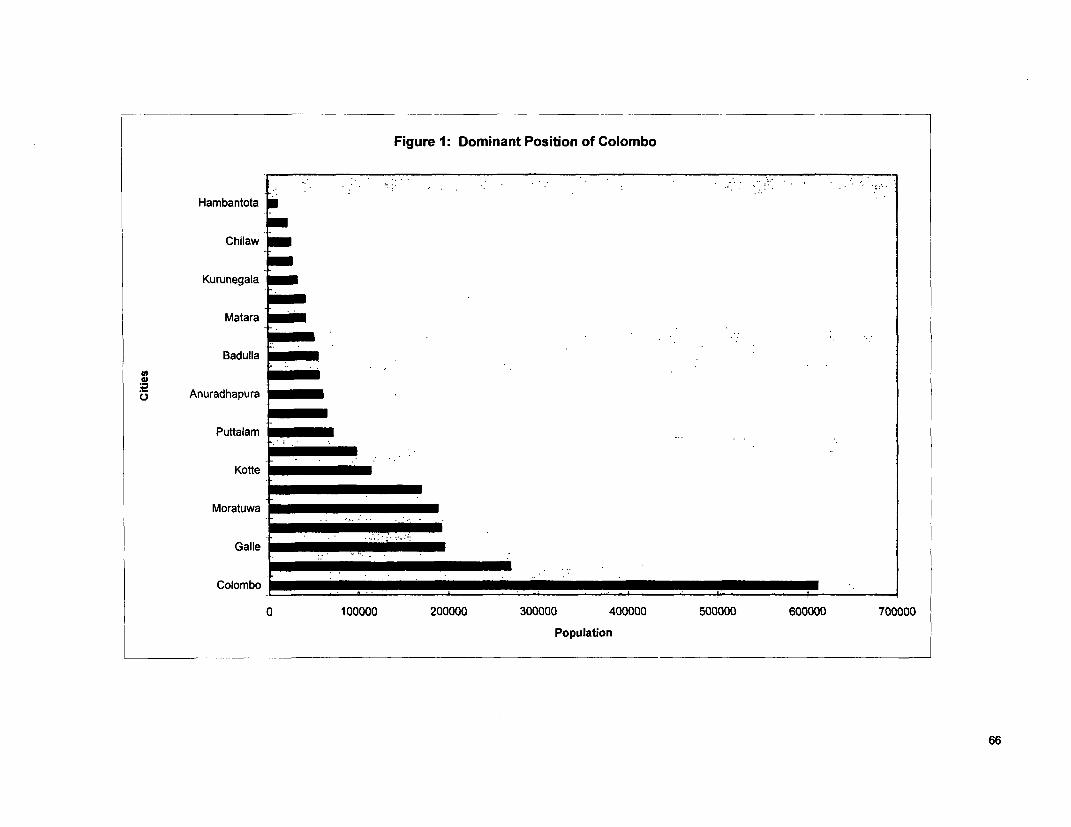
Figure 1: Dominant Position of Colombo
: ': : ... ~ ~ ~~~~~~~ ~ ~~~~~~~~~. . .-,-
Hambantota
Chilaw
Kurunegala
Matara
Badulla
i) Anuradhapura
Puttalam
Kotte
Moratuwa
Galle
Colombo
0 100000 200000 300000 400000 500000 80000 700000
Population
66

Figure 2: Modal Shift to Private Transport
70
60
,A'
50
40
30
20
10
1982 1983 1984 1985 1986 1987 1988 1989 1990 1991 1992 1993 1994 1995
Year
67
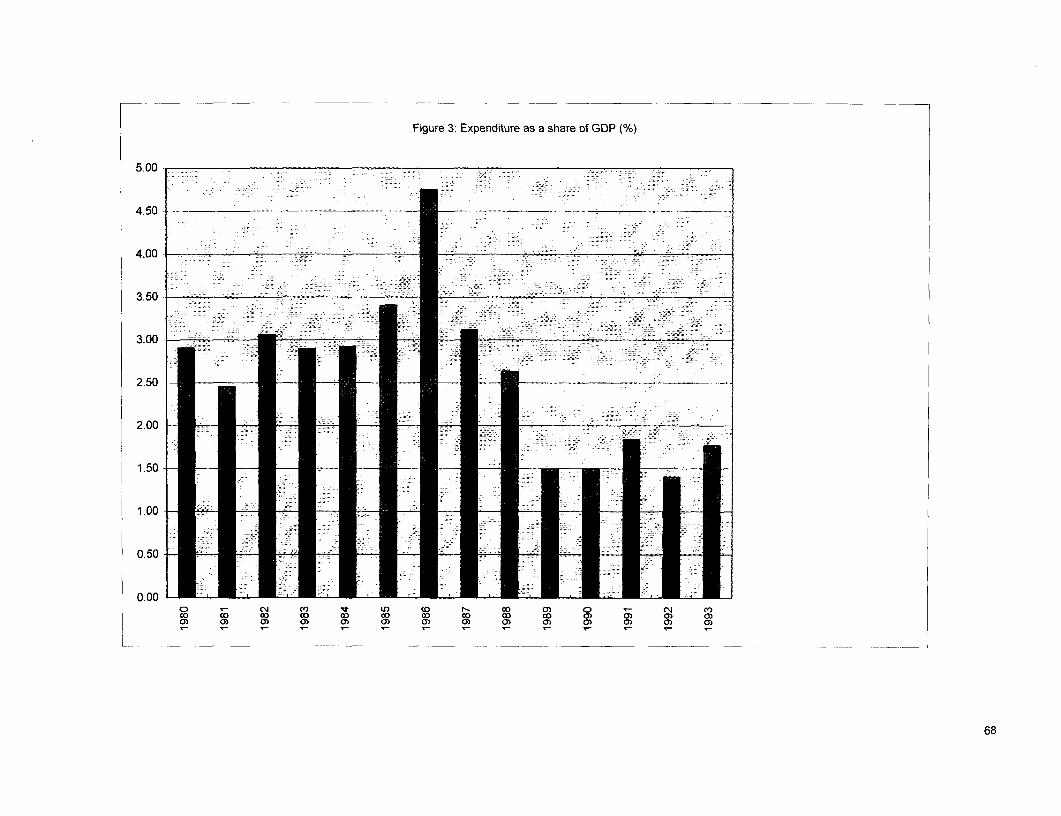
Figure 3: Expenditure as a share of GDP (%)
500-
3.5 0 _.. .. ... .. .. . _ _. . ..... .... _._
4.50 ^. ..... .: .... ..... ... . . ..... .: .S .. .... ... .: ......... ........ .............
2. 50 < _ _ _ . . H . A ,,,, ,, ,_, ,,,,,, _,,,, __, . _ .... _~~~~~~~~~~~~~~~~~~~~~.. .. .... . .. ....
2.00 . ._
1.50- __-_ _ -f
0.50- _
0.00- . v t . , t:|v0,:is:^'v'^|2 l...
) 0 N 0) 0) 0) 0) 0) 0 0) 0 0 0) 0)
L ___________ __ __ ___ _________ _______ _______
68
Figure 4: Demand for Land Transport
- Per Capita GDP (Constant 1982 Rs)- Passenger Km of Travel Including Motorcyles
180,000 + Passenger Km of Travel Excluding Motorcyles
160,000
= 140,000
60,000
140,000
20,000 -
0 4
04 m LO r- co 0) aC) o 'InT Loco co co co CD co co co a) ? 0) aw ) awa) a) o) a) aw al a) ao 0) m m maw o
Year
69

Figure 5: Composition of Public Expenditures in Transport
3.5
3-
2.5.
2
IL~~~~~~~~~~~~~~~~~~~~~~~~~~~~
0.5
01980 1981 1982 1983 1984 1985 1986 1987 1988 1989 1990
Year
70

Figure 6: Ratio of Recurrent to Capital Expenditures in Transport
3.00 -
2.50 -
2.00
o I < / \ 0~~~~~~~ ~ ~~~~~~~RaiIway11 50 -,\-Public Passenger Transport
9 L j ><<_ _ \ ~~~~~~~~~~~~~~~~*Highways
1.00
0.50--
0.00I!Iix
1980 1981 1982 1983 1984 1990
Year
71


Impacts and Issues of Sri Lanka Clean Air 2000
Action under Clean Air Impacted pollutants Health effect from Impact: Instrument:Dlr Priority Cross sector or Cost Implementation Impact In Should be Undertaken by2000 Plan motorization or ect or Indirect (short other Issues to Issues. short, under private sector?
effects of term) be addressed medium or CMTA?'motorizatlon long term?"
Vehicle Inspections and maintenance
Smoke meters PMIO PM10 Effects Direct High Police training Low Shortintroduced to police required|Tighten inspection CO, VOC, N02, S02. PM10 PM10, N02, VOCs: 03 Eftects Direct High Low Short Ystandards precursers
Voluniary inspections CO, VOC, N02, S02. PMIO PM10. N02, VOCs: 03 Effects Indirect Long Yprecursers
Vehide testing centre for CO, VOC, N02, S02, PM1O PMI0. N02, VOCs: 03 Effects Direct High Investment, Low Short Y Yinspection and precursers trainingmaintenancePromote public CO, VOC, N02, S02, PM10 PMIO, N02, VOCs: 03 Effects Indirect Educalion Low Long Yawareness of benefits of precursers campaignmaintenanceFuel Reformulaison, PricIng, Fleet Mix
Reduce or eliminate lead 11 aromabcs used to compensate, Lead dedine but Etfects Direct High Need to Low. Refinery modifications/ Short Depends on plansBenzene increases while Lead Benzene (carcinogen) reconfigure use of additives to raise for restructuringdeclines. Using oxygenates, N02 and 03 precursers refinery octane => US$ 0.01-0.02/litre petroleum sector.increases while VOC decline, increase (assuming they No, if refinery Is In
do not import the public sector.unleadedgasoline); alsounleaded piceshould beattractive. Mustavoid use ofunleaded in carswitthout catalyticconveriers sincethis results inhigher HC andBenzeneemissions
Reduce diesel proporton PMlO & S02 (higher for diesel), Increased lead as move Effects Direct Cost determined by the Mediumof vehicle mix' CO, N02. VOC (lower for diesel to gasoline use instruments Incenlives to be
than gasoline) (emissions are nil for used. Is it politically feasible?diesel), 03, PM10 Need Information on capital
cosl of diesel vs. petrol______________________ _______________ _____________ ________ _______________ vehidv es.hicles,
Reduce sulphur in diesel S02. If additives like Ba used to PM, Toxics. Efects Direct Hydrodesuilurization refinery Mediumfuel suppress smoke, toxic PM will rise. costs are US$0.05/litre.
EmissIon Inventory and Monitoring
Annex IPage I of 5
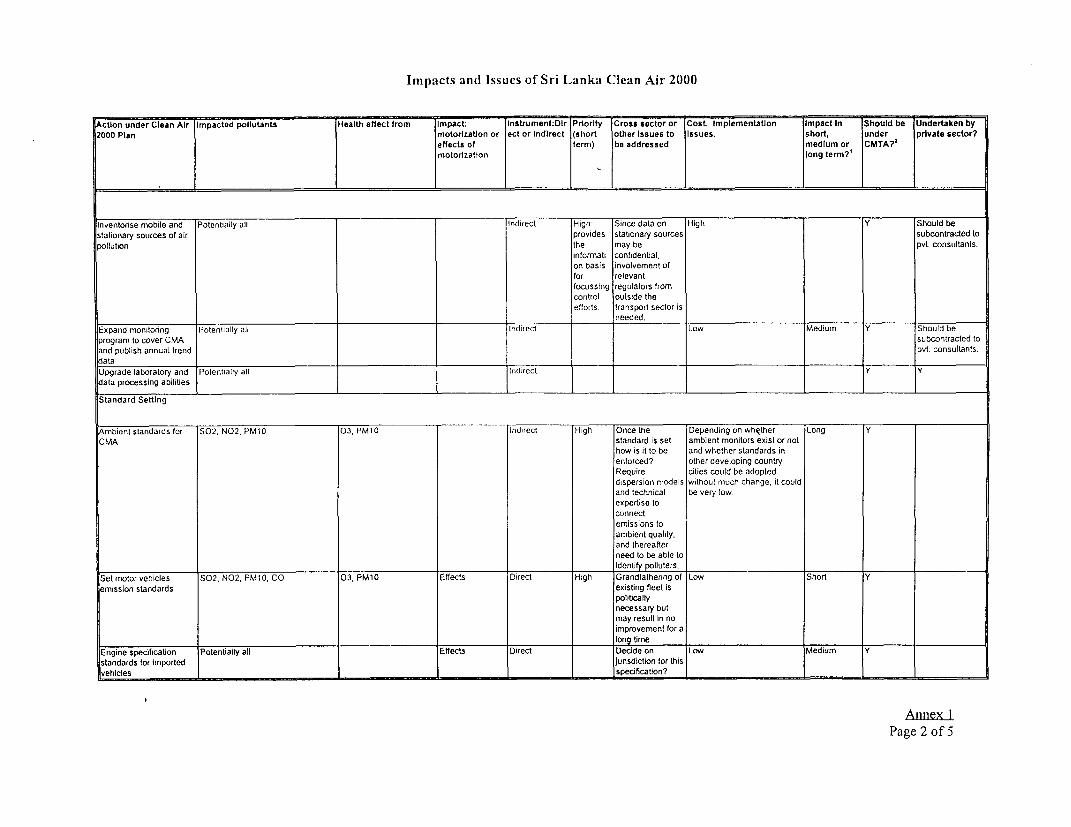
Impacts and Issucs of Sri Lanka Clean Air 2000
Actlon under Clean Alr Impacted pollutants Healh eHfect from Impact: Instrument:Dlr Priority Cross sector or Cost Implementatlon Impact In Should be Undertaken by2000 Plan motorization or ect or Indirect (short other Issues to Issues. short, under private sector?
effects of term) be addressed medlum or CMTA?7motorization long term?'
Inventorise mobile and Potentially all Indirect High: Since data on High Y Should bestationary sources of air provides statonary sources subcontracted topollution the may be pvt. consultants.
intormali confidential,on basis involvement offor relevantfocussing regulators fromcontrol outside theefforts transport sector is
needed.Expand monitonng Potentially all Indirect Low Medium Y Should beprogram to cover CMA subcontracted toand publish annual trend pvt. consultants.dataUpgrade laboratory and Potentially all Indirect y ydata processing abilities
Standard Setting
Ambient standards or 502, N02, PMIO 03, PM1O Indirect High Once the Depending on whether Long YCMA standard is set ambient monitors exist or not
how is it to be and whether standards inentorced? other developing countryRequire cities could be adopteddispersion models without much change, it couldand technical be very low.expertise toconnectemissions to
ambient quality,and thereaterneed to be able to
I_____________________ I___I ___ I__I___ identity polluters.Set motor vehides S02. N02, PM10. CO 03, PM1O Effects Direct High Grandtathenng of Low Short Ymission standards exisUng fleet is
politicaltynecessary butmay result In noimprovement for a
I I I I I l~~~~~~~~~~~~ ~ ~ ~ ~~~~~~long Ume IEngine specificabon Potenbally all Effects Direct Decide on Low Medium Ystandards for Imported jurisdIction for thisvehicles lspecification? I .y .I_..
Annex IPage 2 of 5

Impacts and Issues of Sri Lanka Clean Air 2000
Actlon under Clean Air Impacted pollutants Health effect from Impact: Instrument:Dlr Prlority Cross sector or CosL Implementation Impact In Should be Undertaken by2000 Plan motorizatlon or ect or Indirect (short other Issues to Issues. short, under private sector?
effects of term) be addressed medium or CMTA?'motorizatlon long term?'
Explore feasibility of Ethanol: VOC increase; LPG or Lead, 03 precursers Etfects Indirect High Bus subsector CNGILPG require high Long Y Should bealternate fuels lor public CNG: N02 and VOC increase. would need to be investt. in fuel storage and subcontracted totransport Lead decline in a position to distibution and in retrofitting pvt. consultants.
undertake the of vehicles. Ethanol Is notnecessary competbve with conventionalimprovements fuels (needs subsidies).
Analyse costs of Potentially all Direct High Who would Easy to identity stationary Medium N Should beachieving diferent levels enforce point sources. Emissions subcontracted to
I pollution reduction in compliance with should be connected to pvt. consultants.existing power and emissions ambient quality via dispersionindustrial plants and set standards? Does models to account for local
missions standards regulatory (bubble) absorptive capacity.based on cost info. capacity exist? Monitoring/ enforcement may
This is not related be costly if strict commandto the Transport and control is followed.sector so crosssectorinvolvement isrequired.
Phase-in pollution control PotenUally all Direct High As above. Low Medium Nlimits in Individual units
Set new source emission Potentially all IDirect High As above. Low Longstandards _owInstitutional Framework and Regulatory Compilance
Engine condibon as PMIO, S02, N02. VOCs 03, PMtO Effects Direct Low Medium Yuiterion for issue offitness certificate _Strengthen regulations to PMIO, N02 03. PM10 Effects Indirect High Short r|make smoke belching apunishable offence
Regular smoke and PM10, N02 03, PM10 Effects Direct High Low Short Y |Ypollution checksImported vehicles to Potentally all Effects Direct To be jursdiction Medium Nmeet export country of which ministry?standards __Economic Instruments
Higher penalbes for PM10, S02, N02 103, PM1O Effects Direct High Short YIbelching vehicles I
Lower duty on essenbal PM1O, S02. N02 03, PM1O Effects Indirect High To be jurisdicton -Low. Unless the revenue 'Mediumspare parts _of which ministry7 Impact on the budget is high.
Diferential licensing fees PM1I, CO. N02, Aromabcs 03, PMIO Motorizabon Indirect Medium |Yfor diesel and peirolpowered vehicles i_I_I_I I
Annex IPage 3 of 5

Impacts and Issues of Sri Lanka Clean Air 2000
Aclon under Clean Alr Impactedpollutants Health frt from Impact: Instrument:Dir Priority Cross sector or CosL Implementation Impact In Should be Undertaken byl2000 Plan motorization or ect or Indirect (short other Issues to Issues. short, under private sector?effects of term) be addressed medium or CMTA?7motorlzatlon long term?'
Duty and taxes on new PM10, CO. N02. Aromatics 03, PM10 Motorizalon Indired vvose junsdiclion is this? How does being a Mediumand reconditioned l VwTO member impact on this?vehicles related to i i Ipolluiing potential |Transportation Planning and Traffic Management
Incorporate land-use in transport planning Molorizaton. Indirect Could be quite high especially Long YEffects in terms of bureaucratic
delays to highway________________________________________________________________________________ __________concostrcttion
Implement study recommendations on traffic flow and transportabon planning Motorization, Indirect High Should involve Depends on the extent of Short YEffects the public, and adion taken.
take account oftravel pattems forwork and school.Requirescoordinateddevelopment ofpublic transport.highways andalternate trafficroutes in additlionto economicIncentives totower use ofprivate modes.
Develop a long-term air pollution management program Indirect Should involve High cost. Needs to be Long Y Yprivate Industry. cleardy defined.transport sector,govemment.environmentalists.Will requireinformation on therelativecontributon ofdifferent sourcesto ambientenvironmentalquality so relieson emissions
______ ~~~~~~~~~~~~~~jInvnor.___Non Action Plan suggestions to reduce a)motorizatlon, and b)effects of motor vehicle use
Annex IPage 4 of 5

Impacts and Issues of Sri Lanka Clean Air 2000
IAction under Clean Air Impacted pllutants Healilh effect from Impact: Instrument:Dlr Piority Crosssectoror CosL Implementaon Impact In Should be Undertaken by
2000 Plan motorizatlon or ect or IndIrect (short other Issues to Issues. short, under private sector?
effects of term) be addressed medium or CMTA?'
motorization long term?'
Improve the quality and CO. VOC, N02 dedine but S02. 03. PM10 Motorization, Instrument High Require Incomplete information Short The y
availability of public PM1 0 increase to extent that diesel Effects undefined reorganization of concemed
ransit: buses (diesel) replaces gasoline In fuel bus subsector authorities
consumption. shouldcoordinateclosely with
_______________ ______________________ __________ ~~~ ~~ ~~CMTA _ _ _ _ _
Improve the quality and Electric: all emissions decline. Diesel: overall Motorization, Instrument High Require Incomplete information Short The 7
availability of public emissionsdecline. but to extent that diesel replaces gasoline, Effects undefined independent conceened
transit: trains - diesel or PM10. S02 increase, action by the authorities
electric railway subsector shouldcoordinateclosely withCMTA
Tax on diesel PM10, S02 decline if diesel use PM1O Motorizabon Indirect Relevant Political will? Medium Feasibility/ Can be
isn't compensated for with an authority? Who demand subcontracted to
increase in gasoline use, gains the studies pvt. consultants.revenues? needed
Road user charges Potentally all VOC, PM 10 Motonzation Indirect High Relevant Politkcal will? May end up by Medium FeasiblJity) Can be
authority? Who creaUng red-tape. demand subcontracted to
gains the studies pvt. consultants.I__ revenues? needed
Congestion tax Potentally all VOC, PM10 Molorizabon Indirect High Relevant PoIitical will? Ma9'end up by Short Feasibility/ Can be
authority? Who creating red-tape. demand subcontracted to
gains the studies pvt. consultants._____________________ ___ _________________________ ____________________ ___ _________rre v e n u es?nneede
Parking controls to make Potentially all VOC, PM10 Motorzation Indirect Relevant Political will? Medium n
driving less attractive authoity? Whogains therevenues? Whatabout through
______________ ~~~~~~~~~~~~~~~~~~~~~~ ~~ ~~ ~~~~~~~~~traffic? _ _ _ _ _ _ _ _ _ _ _ _ _ _ _ _
Specifically discourage CO VOC N2, S02. PM10 VOC. PM10 Motorizaton Instrument High Need a reliable Y
shitt to motorcycles undefined allemative mode
Noise? High High ? Maybe under the
environmental authority.
Behaviour modificaton takes time. Also, some amount of demiand Is inelastc and _-_-.
hence will not adjust In the short run. I
For Colombo. The CMTA would combine a research andplanning arm with a requlatory arm.
Assumes fmove to gasoline instead
ote: It is not clear what is the magnitude of transport related environmental Impact In terms of cost to life/health. Also, what Is the ranking of such problems In terms of other
environmental priorities.
AnnexPage 5 of 5

Annex 2Page 1 of 2
Annex 2: Estimated Investment Needs and Payoff from Proposed Reforms
It is estimated that Sri Lanka will need to spend a total of US$128 billion (US$ 2.4 billionper year) over the next twenty years in the highway sector alone (see Table 1). Using thecurrent modal balance with the highway sector absorbing 50% of budget allocations intransport (including rail, ports and shipping), the total investment needs would be close toUS$ 300 billion (US$ 15 billion per year). The public sector will not be able to sustainthis high level of expenditure; allocations for the budget period 1995-99 for the transportsector are around US$ 4.2 billion. This means that efforts will need to be made to seekfunding from other sources such as the private sector and user charges and fees, as well asto increase the efficiency of investments in the public sector.
Since the highway sector is projected to absorb a big share of the estimated expenditures,an analysis was performed to estimate the savings that could be generated if key reformswere undertaken. Three reforms are analyzed: (a) putting in place a road maintenancefund which would be managed in a commercial manner and would ensure that the rightamounts of funds are available for maintenance; (b) increasing the level of competition inthe execution of road works which would lower the overall unit costs of road works; and(c) strengthening the capacity of the sub-national governments to undertake road workswhic,h would also increase the efficiency of execution.
Status Q.u. Using the status quo, we have projected the estimated investment needsfor major rehabilitation, periodic maintenance, and routine maintenance. The unit costsused for this projection are based on sampling bids to the RDA for similar works for theperiod 1992/93 (see consultant report titled Sri Lanka: National Roads Project-RoadRehabilitation and Maintenance Prograrn & Equipment Management, April, 1994). Theresults are shown in Table I.
Road Fund. When a well managed road fund is in place, the execution of maintenanceis going to be done more efficiently, with appropriate priorities, and when needed. Thebenefit will show up in the reduction in unit costs of routine maintenance. Under thestatus quo, according to the report on the National Roads Project, Sri Lanka needs aboutUS$ 6,000 per km per year to maintain their network. (see Figure 1 for a cross-countrycomparison of the unit cost of maintenance). This high unit cost is mainly becausedrainage works have not been performed in the past leading to the need for moreexpensive routine maintenance. When a road fund is in place, it has been assumed thatthe unit cost will decrease to the level of international benchmarks. The internationalbenchmarks were calculated from a 53 country data base (see Table 2). The savingsgenerated from having a road fund in place are three fold: (a) reduction in the unit costsof routine maintenance to about US$ 2,433 per km per year; (b) reductions in the unitcosts of periodic maintenance to about US$ 25,000 per km per year; and (c) a reductionin the number of rehabilitation's needed because appropriate maintenance is beingundertaken from 3 in a 20 year period to 2 in the same time period. Implementing thispolicy has the potential to save around 47% over the status quo.

Annex 2Page 2 of 2
Increased Competition. If the execution of road works is to be undertaken in a morecompetitive fashion by engaging local contractors to compete with each other andreducing the market power of the RCDC, the potential savings over and above those fromhaving a road fund are in the order of 19%, bringing the total savings to about 65%.Increased competition is expected to result in a reduction in the unit costs of all roadrelated activities.
Strengthening Capacity of Subnational Agencies. This policy reform would make theexpenditures made at the subnational level more efficient and effective. Agencies at theprovincial level would be more technically and managerially capable to manage the roadsystem and would hence make appropriate decisions and undertake them efficiently. Theincremental savings from this reform are in the order of 6%, over and above those fromthe road fund and increased competition. The total savings of the three reforms areexpected to be more than 70% over the status quo.

Sri Lanka: Estimated Capital Outlays In Roads Without ReformEstimated
Category Length Responsibillty Major Rehabliltatlon Periodic Malntenance Routine Malntenance Total Costs SavingsClass A 4.116 RDA 3.087,000,000 -2,016,840,000 493,920,000 5,597,760,000Clasp B 6,858 RDA 5,143,500,000 3,360,420,000 822,960,000 9,326,880,000Class C&D 14,900 PC 11,175,000,000 7,301,000,000 1,788,000,000 20,264,000,000Local authority 68,000 PC and Others 51,000,000,000 33,320,000,000 8,160,000,000 92,480,000,000Total Over 20 Years 93,874 70,405,500,000 45,998,260,000 11,264,880,000 127,668,640,000Total per Year 3,520,275,000 2,299,913,000 563,244,000 6,383,432,000 0%Share 55% 36% 9%
Sri Lanka: Estimated Capital Outlays In Roads With Road Malntenance Fund
Category Length Responsibility Major Rehabilitation Periodic Maintenance Routine Maintenance Total CostsClassA 4,116 RDA 2,058,000,000 720,300,000 205,800,000 2,984,100,000Class 8 6.858 RDA 3,429,000,000 1,200,150,000 342,900,000 4,972,050,000Class C&D 14,900 PC 7,450,000,000 2,607,500,000 745,000,000 10,802,500,000Local authority 68,000 PC and Others 34,000,000,000 11,900,000,000 3,400,000,000 49,300,000,000Total Over 20 Years 93,874 46,937,000,000 16,427,950,000 4,693,700,000 68,058,650,000Total per Year 2,346,850,000 821,397,500 234,685,000 3,402,932,500 47%Share 69% 24% 7%
Sri Lanka: Estimated Capital Outlays In Roads With Road Maintenance Fund and More Competitlon
Category Length Responsibility Major Rehabilitatlon Periodlc Malntenance Routine Malntenance Total CostsClassA 4,116 RDA 1,234,800,000 518,616,000 41,160,000 1,794,576,000Class B 6,858 RDA 2,057,400,000 864,108,000 68,580,000 2,990,088,000Class C&D 14,900 PC 4,470,000.000 1,877,400,000 149,000,000 6,496,400,000Local authority 68,000 PC and Others 20,400.000,000 8,568,000,000 680,000,000 29,648,000,000Total Over 20 Years 93,874 28,162,200,000 11,828,124,000 938,740,000 40,929,064,000Total per Year 1,408,II0,000 591,406,200 46,937,000 2,046,453,200 68%Share 69% 29% 2%
Sri Lanka: Estimated Capital Outlays In Roads With Road Malntenance Fund, More Competion, and Stronger Subnational Agencies
Category Length Responsibillty Major Rehabilitatdon Periodic Malntenance Routine Malntenance Total CostsClassA 4,116 RDA 823,200,000 617,400,000 41,160,000 1,481,760,000Class 8 6,858 RDA 1,371,600,000 1,028,700,000 68,580,000 2,468,880,000Class C&D 14,900 PC 2,980,000,000 2,235,000,000 149,000,000 5,364,000,000Local authority 68,000 PC and Others 13,600,000,000 10,200,000,000 680,000,000 24,480,000,000Total Over 20 Years 93,874 18,774,800,000 14,081,100,000 938,740,000 33,794,640,000Total per Year 938,740,000 704,055,000 46,937,000 1,689,732,000 74%Share 56% 42% 3%
o

Assumed Unit Costs in $ per km
Major Rehabilitation Periodic Maintenance Routine MaintenanceStatus Quo 250.000 70,000 6,000With Road Maintenance Fund 250,000 25,000 2,500With Road Maintenance Fund and More Competition 150,000 25,000 500With Road Maintenance Fund, More Competition, and Stronger Subnational Agencies 100,000 25,000 500
Source: Taken from Bid Estimates in 1993/94 for similar works in Sri Lanka and from International Benchmarks on Best Practice
CDl~~~~~~~~~~~~~~~~~~~~~~~~~~~~~~~~

Annex 3Page 1 of 12
LIST OF WORKSHOP PARTICIPANTS_ Invited Attended Invited Attended
July 1996 July 1996 December December1996 1996
1. C. Abeygunawardena VDirector, Traffic Police, Dept. of Traffic Police
2. Mr. Rohan Abeywickrema VGreenlanka Shipping Ltd.46/5 Nawam MawathaColombo 2
3. Ms. P. Ailpperuma V V VAdditional SecretaryMinistry of Transport, Environment and Women's Affairs1 D.R. Wijewardena MawathaColombo 10
4. A. AlfredAdditional SecretaryMinistry of Shipping, Ports, Rehabilitation & Reconstruction
5. Mr. S. Amerasekera VDirectorRegional Development DivisionMinistry of Finance Planning and National Intergrity"Sethsiripaya", Battaramulla
6. Mr. Cecil Amerasinghe V V VSecretaryMinistry of Transport, Environment and Women's Affairs1 D.R. Wijewardena MawathaColombo 10
7. Hon. Mrs. Srimani AthulathmudaliMinisterMinistry of Transport, Environment and Women's Affairs1 D.R. Wijewardena MawathaColombo 10
8. Mr. J.M. Chandradasa V V VDirector (Special Projects)Road Development AuthoritySethsiripaya, Battaramulla
9. P. ChandrasenaDirector, Reg. Dev. Div.Ministry of Finance Planning & National Integrity
10. Mr. T. Collure V VAdditional SecretaryMinistry of Transport, Environment and Women's AffairsI D.R. Wijewardena MawathaColombo 10
11. B. CoorayGeneral Manager, Road Development Authority .
12. Mr. Richard Conroy V V VDeputy Resident RepresentitiveUnited Nations Developement Programme202-204 Bauddhaloka MawathaColombo 4.

Annex 3Page 2 of 12
13 Mr. David l
Managers of SuppliesCeylon Petroleum Corporation113 Galle RoadColombo 3.
14. J. de Mel lDirector, ICTAD l
15. Mr. E.V. de SilvaSenior Asst. SecretaryMinistry of Shipping, Ports, Rehabilitation & Reconstuction45 Leyden Bastin RoadColombo 1.
16. Mrs. Manel de SilvaProgram OfficerUnited Nations Development Programme202-204 Bauddhaloka MawathaColombo 4.
17. Mr. Priyal de SilvaCheif Engineer (Civil)Sri Lanka RailwaysD.R. Wijewardena MawathaColombo 10.
18. Mr. Sunil de SilvaTreasurer, Association of Container Transportc/o Asha Industries72C New Bul]ers RoadColombo 4.
19. M.P. de SoysaChairman, Prov. Road PassengerTransport Authority, WP
20. Mr. K.G.D.D. Dheerasinghe VDirector Public DebtCentral Bank of Sri LankaRural Banking & Staff Training CentreRajagiriya, Welikada.
21. Mr. J. Diandas VIVChairmanNational Transportation Commission241 Park RoadColombo 5.
22. Mr. N.D. Dicerson V VDirector GeneralUrban Development Authority"Sethsiripaya"Battaramulla
23. N.D. Dickson VDirector GeneralUrban Development Authority
24. D. Dissanayake VSecretaryMinistry of Health, Highways and Social Services
25. D.S. Edirisinghe V VCommissioner, Dept. of Motor Traffic
26. D. Fernando VDirector, ICTAD

Annex 3Page 3 of 12
27. H. FernandoChairman, Sri Lanka Telecom
28. Mr. K Fernando VI"Director (Progress Control & Monitoring)Road Development Authority"Sethsiripaya"Bhattaramulla
29. Mr. M.B.S. FernandoChairmanRoad Development Authority"Sethsiripaya"Bhattaramulla
30. Ms. Priyanthi FernandoInternational Forum for Rural Transportation Developementc/o ITDG Publications, 103-105 Southhampton RoadLondon WC I B4 4HH U.K.
31. Dr. S. Fernando VManager, ResearchCeylon Electricity BoardSir Chittampalam A. Gardiner MawathaColombo 2.
32. Mr. Sunil FernandoPresident, Association of Container Transportationc/o Asha Agencies72C New Bullers RoadColombo 4.
33. Mr. W.M. Gamage .
Secretary, Ministry of HighwaysSouthern Provincial CouncilGalle RegionGalle.
34. C.B. GrossgartGeneral Manager, American President Lines
35. Dr. K.L. Gunaratne V VI'ChairmanGunaratne Associates38 Amerasekera MawathaColombo 5.
36. Mr. Navin Gunaratne V VPreasidential Task Force for the Southern Area Developement5th Floor, "SethsiripayaBattaramulla.
37. T.L. Gunaruwan VConsultant, National Development Council
38. Mr. H.R.G.A. Gunasekera VVProvincial Director of TransportSotuthern Provincial CouncilGalle RegionGalle.
39. K.A.S. Gunasekera VSecretaryMinistry of Housing, Construction & Public Utilities

Annex 3Page 4 of 12
40. Dr. T. Gunawardhana V VConsultantTransport Studies and Planning CentreIB Tower Building, 25 Station RoadColombo 4.
41. C. Haslam VIFirst Secretary
42. G.L.J. Hewawasam _Director GeneralSri Lanka Export Development Board
43. H. Idal___ Representative, Colombo Office, OECF44. A.D.V. de S. Pr Indraratna
Consultant45. J.H.J. Jayamaha
Director, Department of External Resources46. Mr. J.M.L. Jayasekera V V V V
Deputy Director General (Planning & Operation)Uban Developement Authority"SethsiripayaBattaramulla.
47. W.A. JayasingheAddi. Sec., Ministry of Health, Social Services and Highways
48. A.S. Jayawardena Vl____ Governor, Central Bank49. D.P.I. Jayawardena V V
Director, Link (Engineering) Ltd.50. Dr. I. Jayawardena
Consultant51. Dr. N. Jayawardena V V V
51 Sri Dhammadara MawathaRatmalana.
52. P. Jayawardena VDirector, Link (Engineering) Ltd.
53. Mr. K. Jegarajasingham V V V VDirector (Tranport Infrustructure)Dept. of National PlanningSecretarait BuildingColombo 1.
54. Mr. Nabavi Junaid V V VSecretaryMinistry of Shipping, Ports, Rehabilitation andReconstruction45 Layden Bastin RoadColombo 1.
55. Mr. T. Kanagasingham V V VDeputy Municipal Engineer, Traffic and PlanningColombo Municipal CouncilTown HallColombo 7.
56. Mr. Gamini Karunatilake SSP (City Traffic)Dept. of Traffic PoliceGunasinghapuraColombo 1.
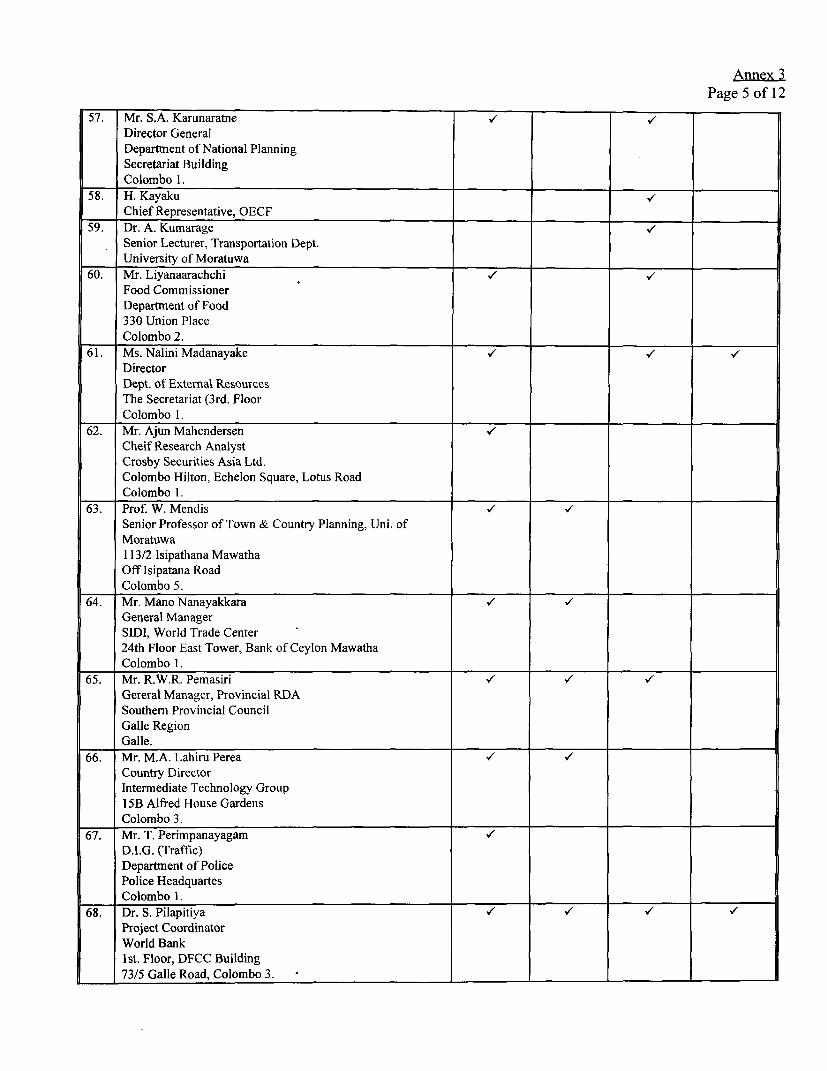
Annex 3Page 5 of 12
57. Mr. S.A. Karunaratne _Director GeneralDepartment of National PlanningSecretariat BuildingColombo 1.
58. H. Kayaku V
Chief Representative, OECF59. Dr. A. Kumarage V
Senior Lecturer, Transportation Dept.University of Moratuwa
60. Mr. Liyanaarachchi /
Food CommissionerDepartment of Food330 Union PlaceColombo 2.
61. Ms. Nalini Madanayake _DirectorDept. of External ResourcesThe Secretariat (3rd. FloorColombo 1.
62. Mr. Ajun Mahendersen V
Cheif Research AnalystCrosby Securities Asia Ltd.Colombo Hilton, Echelon Square, Lotus RoadColombo 1. _ l
63. Prof. W. Mendis _Senior Professor of Town & Country Planning, Uni. ofMoratuwa113/2 Isipathana MawathaOff Isipatana RoadColombo 5.
64. Mr. Mano Nanayakkara /
General ManagerSIDI, World Trade Center24th Floor East Tower, Bank of Ceylon MawathaColombo 1.
65. Mr. R.W.R. Pemasiri V V Gereral Manager, Provincial RDASouthern Provincial CouncilGalle RegionGalle. ___
66. Mr. M.A. Lahiru Perea _ _Country DirectorIntermediate Technology Group15B Alfred House GardensColombo 3. _
67. Mr. T. PerimpanayagamD.I.G. (Traffic)Departtnent of PolicePolice HeadquartesColombo 1.
68. Dr. S. Pilapitiya V V V V
Project CoordinatorWorld Bank1st. Floor, DFCC Building73/5 GaIle Road, Colombo 3.

Annex 3Page 6 of 12
69. Prof. L.L RatnayakeDeanDept. of Civil EngineeringUniversity of MoratuwaMoratuwa.
70. Mrs. M. Sahabandu VI / VDirector GeneralNational Transport Commission241 Park RoadColombo 5
71. Mr. D.D. Senanayake V V i v22/2 Sri Siddhartha PathKirillaponeColombo 5.
72. R. Senanayake V/Senior Commercial Officer
73. Mr. S.L. Seneviratne VI VDirector GeneralDepartment of External resourcesThe Secretariate (3rd Floor)Colombo 1.
74. Mr. Ebert Silva V V VManaging DirectorEbert Silva Touring Co. Ltd.15 Malwatta RoadDehiwela.
75. Mr. Lakshman SiriwardenaExecutive DirectorSri Lanka- German Pvt. Sector Development Project Ltd.William MawathaColombo 2. ___
76. R. SiriwardenaChairman, Sri Lanka Central Transport Board
77. Mr. Wijesiri Soysa V VChairmanWestern Province, Provincial Road Passenger TransportAuthorityKachcheri Complex, Dam StreetColombo 12.
78. Mr. Ed Storm /
ConsultantSri Lanka RailwaysOlcott MawathaColombo 10.
79. Mr. M. Susiriwardena / V VDirector, InvestmentMinistry of Industrial Developme.nt73/1 Galle RoadColombo 3.
80. Mr. M. Vamadevan V V V VDirector (Economic Infrustructure)Dept. of National PlanningSecretarait BuildingColombo 1.

Annex 3Page 7 of 12
81. Mr. P. Weerasinghe _Cheif Engineer (Planning, Research & Development)Sri Lanka Ports Authority45 Leyden Bastian RoadColombo 1.
82. Mr. G.P.S. WeerasooriyaGeneral ManagerSri Lanka RailwaysOlcott MawathaColombo 10.
83. Mr. Susantha Welgama V VWelgama & Sons Freight Transporters325 Sri Snagarajah MawathaColombo 10.
84. Mr. Kazushi Hashimoto V VDirector3rd Division, Operations Department II, OECFNDB Building 40 Nawam MawathaColombo 2.
85. Mr. Hideki Matsunaga V V /
Country Officer3rd Division, Operations Department 11, OECFNDB Building, 40 Nawam MawathaColombo 2. I
86. Mr. Hiroshi Kayaku V VCheif Representative Sri LankaOECFNDB Building, 40 Nawam MawathaColombo 2.
87. Mr. Hachiro IdaRepresentative, Colombo OfficeODA, c/o British High Commossion190 Galle RoadColombo 3.
88. Mr. Martin Elliot V
Philippines, Vietnam and SE Asia DeskEastern Asia DepartmentODA, c/o British High Commission190 GaIle RoadColombo 3
89. Mr. G.W. Kaveendraraja, V VOfficer in Charge ResearchJapan International Cooperation AgencyHotel Taj Samudra,25, Galle Face Centre Road,Colombo 3.
90. Mr. A Senevirathna, VDeputy Director, Regional Industry Service DivisionMinistry of Industrial Development73/ 1, Galle Road,Cololmbo 3.
91. Mr. S. Arsecularatne VDeputy Director PlannningMinistry of Transport, Environment & Women's Affairs1. D.R. Wijewardena Mawatha,Colombo 10. I

Annex 3Page 8 ofl2
92. Mr. Marasinghe A.V. PereraCommissionerColombo Metropolitan Council
93. Mr. D.M. Jayasekera VConsultant
94. Mr. LyeConsulatant
95. Ms. S. Chandrasena V VDirectorCentral Bank of Sri LankaRural Banking & Staff Training Centre
_____ Rajagiriya, Welikada96. Dr. K. Gunawardena
Head, Department of GeographyUniversity of ColomboThurstan RoadColombo 4
97. Mr. A. OstadResident RepresentativeUNDP202-204, Bauddhaloka Mawatha
_____ Colombo 498. Ms. I.H.M.S. Herat V
EconomistCentral Bank of Sri LankaRural Banking & Training CentreRajagiriya, Welikada
99. Ms. K.D. Ranasinghe VSenior EconomistCentral Bank of Sri LankaRural Banking and Training CentreRajagiriya, Welikada l
100. Ms. C. Premaratne V VVSenior EconomistCentral Bank of Sri LankaRural Banking and Training CentreRajagiriya, Welikada
101. Mr. S.N.C. NavaratneGeneral ManagerCentral Transport Board200, Kirula Road, Colombo 5
102. Mr. D. Liyanage VDeputy Secretary General of TreasuryGeneral Treasury, Colombo I
103. Mr. B.C. PereraSecretary General of TreasuryGeneral Treasury, Colombo 1
104. Mr. R. de Silva V V VProgramme ManagerITDG15B, Alfred Place, Colombo 3
105. Mr. Roberto BentjerodtWorld Bank Resident Representative1st Floor, DFCC Bldg.73/5 Galle Road, Colombo
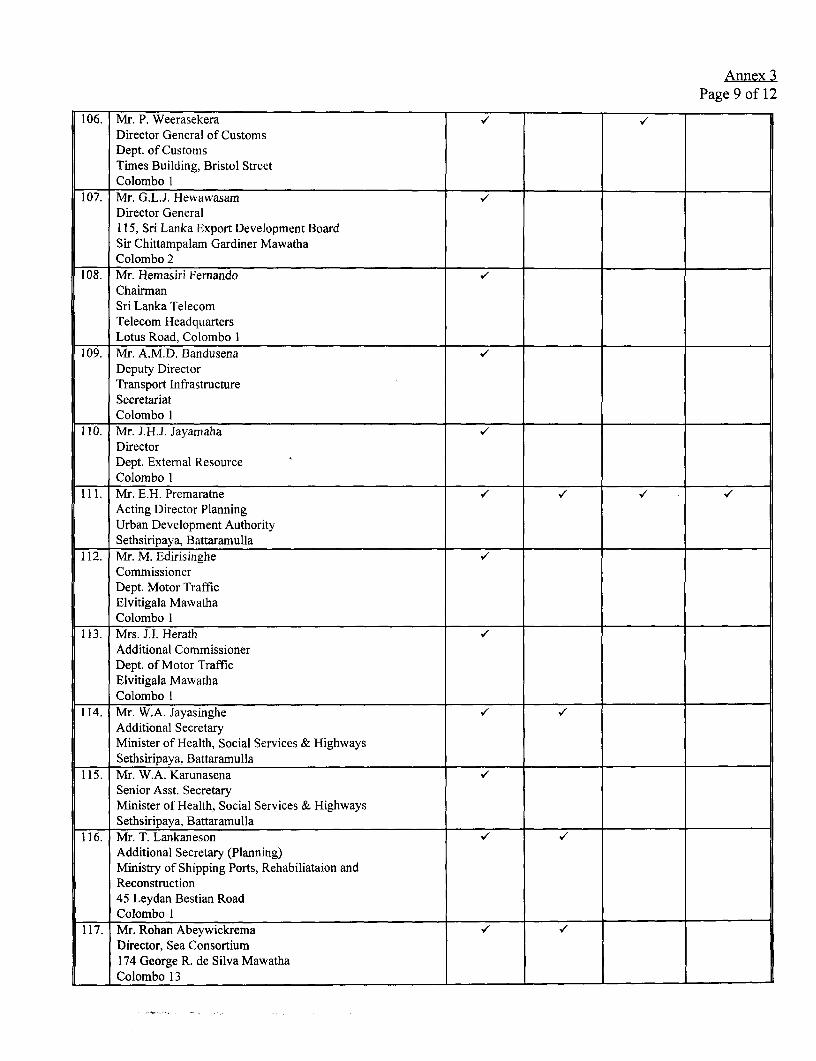
Annex 3Page 9 of 12
106. Mr. P. Weerasekera VDirector General of CustomsDept. of CustomsTimes Building, Bristol StreetColombo 1
107. Mr. G.L.J. HewawasamDirector General115, Sri Lanka Export Development BoardSir Chittampalam Gardiner MawathaColombo 2
108. Mr. Hemasiri FernandoChairmanSri Lanka TelecomTelecom HeadquartersLotus Road, Colombo 1
109. Mr. A.M.D. BandusenaDeputy DirectorTransport InfrastructureSecretariatColombo I
110. Mr. J.H.J. Jayamaha VDirectorDept. External ResourceColombo I
111. Mr. E.H. PremaratneActing Director PlanningUrban Development AuthoritySethsiripaya, Battaramulla .
112. Mr. M. Edirisinghe V/CommissionerDept. Motor TrafficElvitigala MawathaColombo I
113. Mrs. J.I. HerathAdditional CommissionerDept. of Motor TrafficElvitigala MawathaColombo 1
114. Mr. W.A. JayasingheAdditional SecretaryMinister of Health, Social Services & HighwaysSethsiripaya, Battaramulla
115. Mr. W.A. Karunasena .Senior Asst. SecretaryMinister of Health, Social Services & HighwaysSethsiripaya, Battarainulla
116. Mr. T. Lankaneson V/Additional Secretary (Planning)Ministry of Shipping Ports, Rehabiliataion andReconstruction45 Leydan Bestian RoadColombo I
117. Mr. Rohan AbeywickremaDirector, Sea Consortium174 George R. de Silva MawathaColombo 13

Annex 3Page 10 of 12
118. Mr. W.L.P. de Mel lDirector, TSPCIB, Tower Building25, Station RoadColombo 4
119. Mr. Harsha de SaramManaging DirectorInternational Construction Consortium Ltd.291 Modera StreetColombo 15
120. Mr. Sunil de Silva l
TreasurerAssociation of Container Transportersc/o Asha Industries72C New Bullers Road, Colombcr4
121. Dr. W. HettiarachchiEconomic ConsultantWorld Bank Resident Mission1 st floor, DFFC Building73/5 Galle RoadColombo 5
122. Prof. A.D.V. De S. Indraratna355 Park RoadColombo 05
123. Mr. Patric JayawardenaDirector, Link (engineering) Ltd.97A Galle RoadColombo 07
124. Dr. Lal Jayawardena69, Gregory's RoadColombo 07
125. Dr. Nagananda Jayawardena V VTransportation Consultant51, Sri Dhammadara MawathaRatmalana
126. Mr. D.S. JayaweeraDeputy Director Planning, TSPC-100 Horton PlaceColombo 7
127. Mr. S.A. Karunaratne VDirector GeneralDepartment of National PlanningSecretariat BuildingLotus Road, Colombo 01
128. Dr. Amal KumarageSenior LecturerTransportation DepartmentUniversity of MoratuwaKatubedde, Maoratuwa
129. Prof W. Mendis V V V VSenior Professor, Town & Country Planning113/2, Greenlands GardensOff Isipathana MawathaColombo 05
130. F. Mohideen VDirector General. Dept. of External Resources

Annex 3Page II of 12
131. Dr. Mohan Munasinghe10 De Fonseka PlaceColombo 5
132. Mr. Earl MunasingheAdviser, National Construction Contractors Association150/1 Bauddhatoka MawathaColombo 04
133. M. NakagawaRepresentative, OECF
134. A. Obeysekera V
Chairman, Ceylon Petroleum Corporation135. Mr. R.P. Parker V V
Resident ManagerWS Atkins Interational Ltd.39, St. Michael's RoadColombo 03
136. Dr. Ravi Perera VVProject CoordinatoreMetropolitan Environment Improvement ProgrammeMinistry of Planning and Policy PlanningSethsiripaya, Battaramulla
137. Mr. M.A. Lahiru Perera V VCountry DirectorITDG15B, Alfred PlaceColombo 03
138. Mr. M.C. Premaratne V V V
Chief Operations ManagerSLCTB200 Kirula RoadNarahenpita, Colombo 06
139. R. Ramanujam V
Director General140. Mrs. M.J. Sahabandu V V
Director GeneralNational Transport Commission241, Park RoadColombo 05
141. Mr. Prasanna Weerasinghe VChief Engineer (Planning, Research & Development)Sri Lanka Ports Authority45 Leyden Bastian RoadColombo 01
142. Mr. G.P.S. Weerasooriya V VGMRGMR's OfficeColombo 10
143. Mr. Sunil Welgama V VChairmanTruckers AssociationWelgama & Sons Freight Transporters325 Sri Sangarajah MawathaColombo 10
144. Mr. Suren Wickremasinghe V V V VChairman, Urban Delopment AuthoritySethsiripaya, Battaramulla I
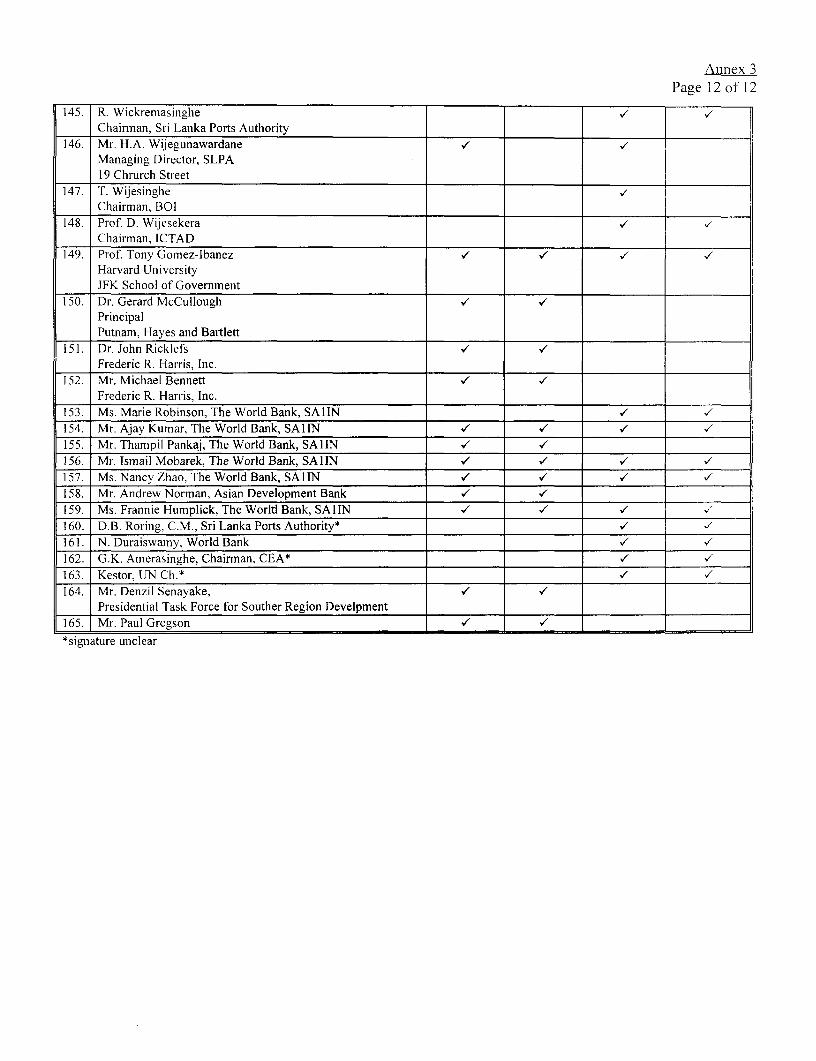
Annex 3Page 12 of 12
145. R. Wickremasinghe .Chairman, Sri Lanka Ports Authority
146. Mr. H.A. Wijegunawardane V vManaging Director, SLPA19 Chrurch Street
147. T. Wijesinghel___ Chairman, BO]148. Prof. D. Wijesekera vv
Chairman, ICTAD149. Prof. Tony Gomez-Ibanez V V V i
Harvard UniversityJFK School of Government
150. Dr. Gerard McCulloughPrincipal
I Putnam, Hayes and Bartlett151. Dr. John Ricklefs
Frederic R. Harris, Inc.152. Mr. Michael Bennett V V
Frederic R. Harris, Inc.153. Ms. Marie Robinson, The World Bank, SAIIN154. Mr. Ajay Kumar, The World Bank, SA1IN _ _______
155. Mr. Thampil Pankaj, The World Bank, SAIIN V156. Mr. Ismail Mobarek, The World Bank, SAIIN157. Ms. Nancy Zhao, The World Bank, SAIIN _____/____
158. Mr. Andrew Norman, Asian Development Bank l
159. Ms. Frannie Humplick, The World Bank, SAIIN _ _ ____at
160. D.B. Roring. C.M., Sri Lanka Ports Authority* _ __
161. N. Duraiswamy, World Bank V V
162. G.K. Amerasinghe, Chairman, CEA* V V
163. Kestor, UN Ch.* V V
164. Mr. Denzil Senayake, V VPresidential Task Force for Souther Region Develpment l
165. Mr. Paul Gregson V/*signature unclear


ccJ
...... ....... .... . . . .~~~~~C.... ...... ... .. . .... . . .
....... ... .......... ......... I
...... ....~~~~~~~~~~~~~~~~~~~~~~4
4tA N-I'MORM-