Embed Size (px)
Citation preview

SPPA 4030 Speech Science 1
Sound Physics

SPPA 4030 Speech Science 2
Outline What is sound? Graphic representation of sound Classifying sounds The Acoustic Filter Resonance The decibel

SPPA 4030 Speech Science 3
What is sound? It may be defined as the propagation of a
pressure wave in space and time. propagates through a medium

SPPA 4030 Speech Science 4
Sound-conducting media Medium is composed of
molecules Molecules have “wiggle room” Molecules exhibit random
motion Molecules can exert pressure
A B

SPPA 4030 Speech Science 5
Spring Mass Model Mass (inertia) Elasticity Friction

SPPA 4030 Speech Science 6
Model of air molecule vibration (Time 1)
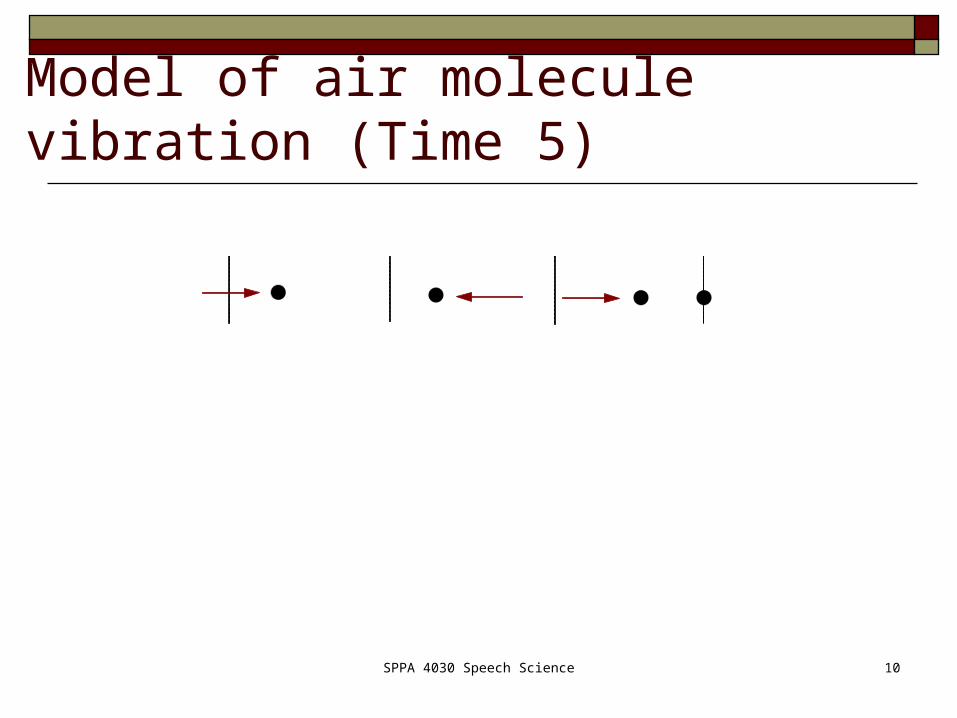
Rest positions
Air molecules sitting side by side

SPPA 4030 Speech Science 7
Model of air molecule vibration (Time 2)

SPPA 4030 Speech Science 8
Model of air molecule vibration (Time 3)

SPPA 4030 Speech Science 9
Model of air molecule vibration (Time 4)
SPPA 4030 Speech Science 10
Model of air molecule vibration (Time 5)

SPPA 4030 Speech Science 11
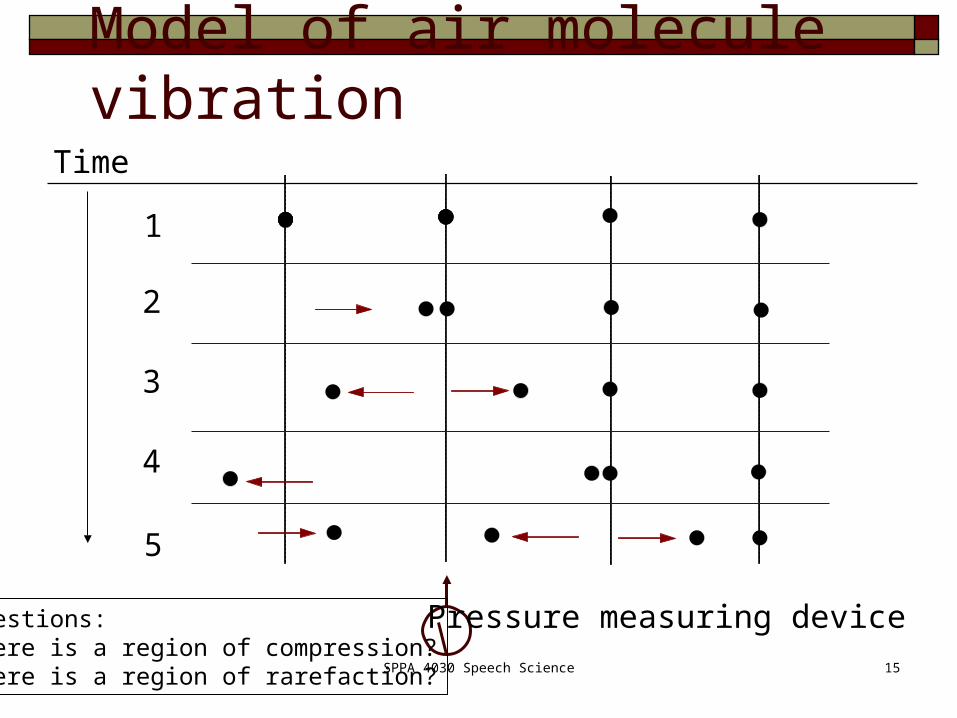
Model of air molecule vibrationTime
1
2
3
4
5
Distance
a b c d

12
Wave action of molecular motionTime
1
2
3
4
5
Distance

SPPA 4030 Speech Science 13
Amplitude waveform
Position
Time

SPPA 4030 Speech Science 14
Amplitude waveform
Amplitude
Time
Question: How long will this last?
SPPA 4030 Speech Science 15
Model of air molecule vibrationTime
1
2
3
4
5
Pressure measuring deviceQuestions: Where is a region of compression?Where is a region of rarefaction?

SPPA 4030 Speech Science 16
For example…P
ress
ure
Time

SPPA 4030 Speech Science 17
Pressure vs. time (pressure waveform)
Pressure
Time
Amplitude
Period (T)
Phase: when a periodbegins
Frequency (F): rate that waveform repeats itself (1/T)
Phase (deg)

SPPA 4030 Speech Science 18
Phase
SPPA 4030 Speech Science 19
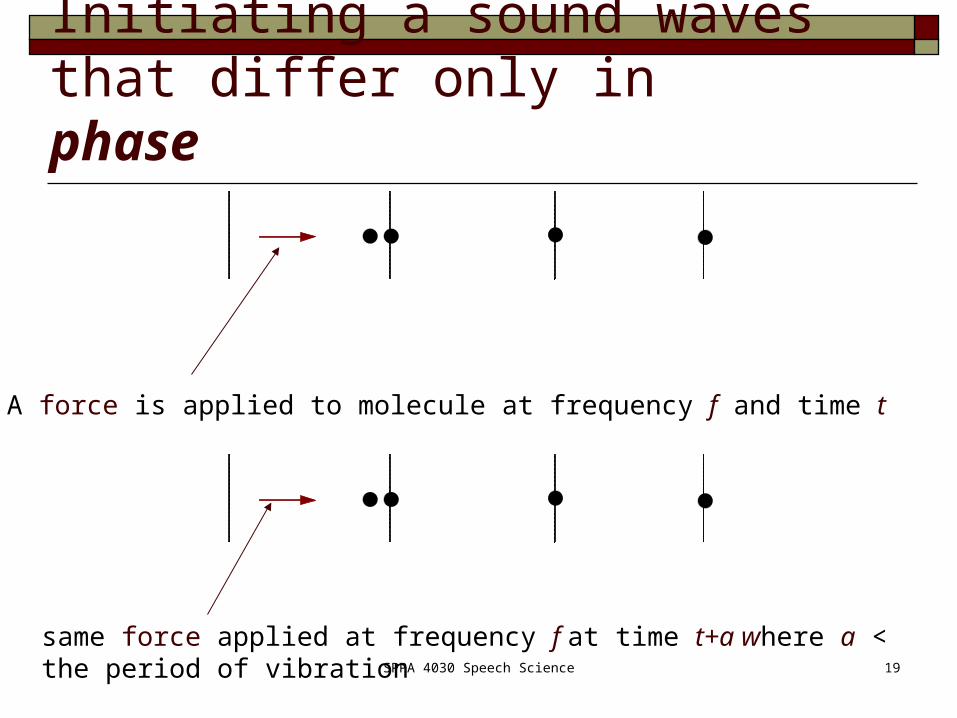
Initiating a sound waves that differ only in phase
A force is applied to molecule at frequency f and time t
same force applied at frequency f at time t+a where a < the period of vibration

SPPA 4030 Speech Science 20
Features of a pressure waveform Amplitude
Measured in pressure units peak amplitude peak-to-peak amplitude Instantaneous amplitude
Period and Frequency Period measured in time (basic quantity) Frequency is a rate measure (per unit time) expressed as Hertz (s-1) May be expressed as octaves, semitones, etc
Phase Measured in degrees (relative to period length) 0-360 degrees

SPPA 4030 Speech Science 21
Frequency representation: The octave Octave shift: doubling or halving of
frequency Non-linear
SPPA 4030 Speech Science 22
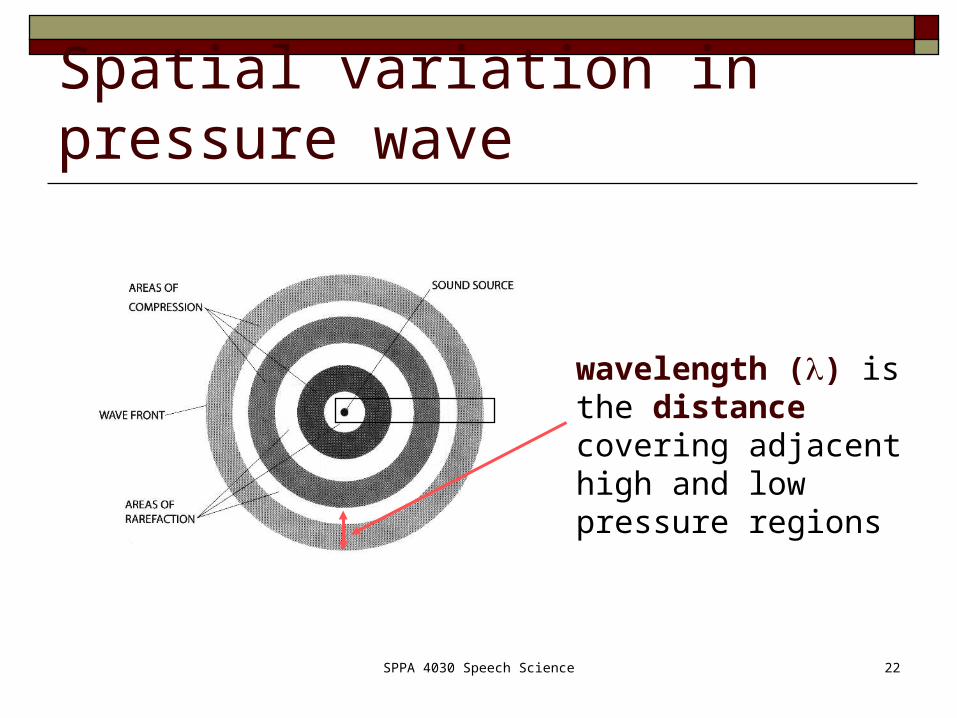
Spatial variation in pressure wave
wavelength () is the distance covering adjacent high and low pressure regions

SPPA 4030 Speech Science 23
For example…
Distance
Wavelength ()
Pre
ssur
e

SPPA 4030 Speech Science 24
Relation between frequency and wavelength
=c/F where
: wavelength
F: is the frequency
c: is sound speed in medium (33,600 cm/sec)

SPPA 4030 Speech Science 25
Additional Concepts Propagation of waves
Transmission Absorption Reflection Reverberation

SPPA 4030 Speech Science 26
Graphic representation of sound Time domain
Called a waveform Amplitude plotted as a
function of time
Frequency domain Called a spectrum Amplitude spectrum
amplitude vs. frequency
Phase spectrum phase vs. frequency
May be measured using a variety of “window” sizes

SPPA 4030 Speech Science 27
Same sound, different graphs
Time domain
Frequency domain
From Hillenbrand

SPPA 4030 Speech Science 28
Classification of sounds Number of frequency components
Simple Complex
Relationship of frequency components Periodic Aperiodic
Duration Continuous Transient

SPPA 4030 Speech Science 29
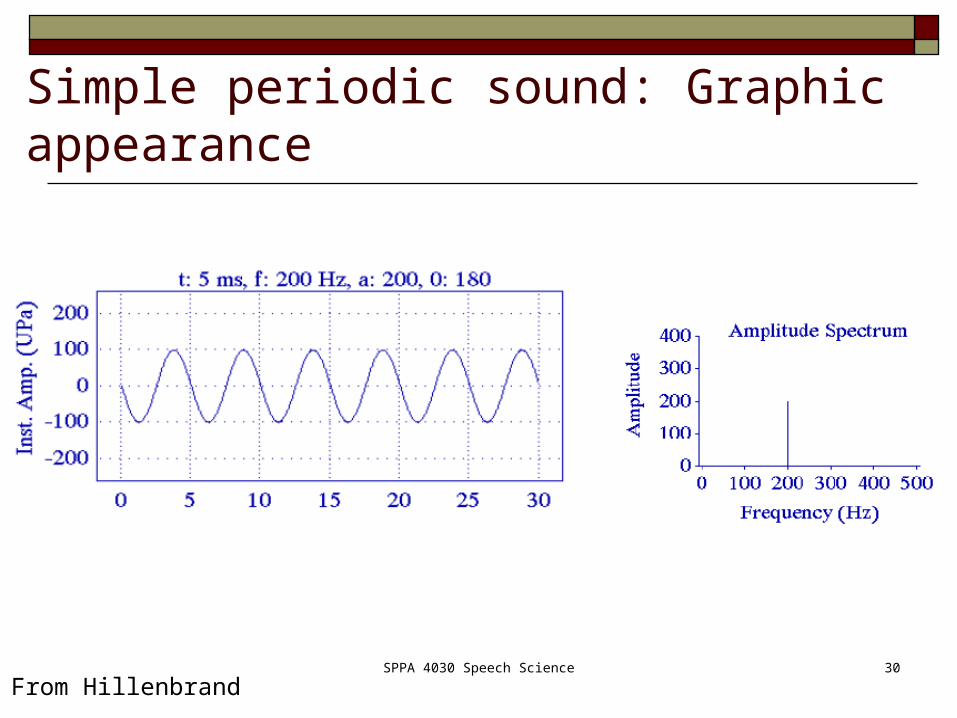
Simple periodic sound Simple: one frequency component Periodic: repeating pattern Completely characterized by
amplitude period (frequency) phase
Other names: sinusoid, simple harmonic motion, pure tone
SPPA 4030 Speech Science 30
Simple periodic sound: Graphic appearance
From Hillenbrand

SPPA 4030 Speech Science 31
Complex periodic sounds Complex: > one frequency component Periodic: repeating pattern Continuous Frequencies components have a special relation
Lowest frequency: fundamental frequency Symbol: fo
Frequency component with longest period
Higher frequency components: harmonics integer (whole number) multiples of the fo
SPPA 4030 Speech Science 32
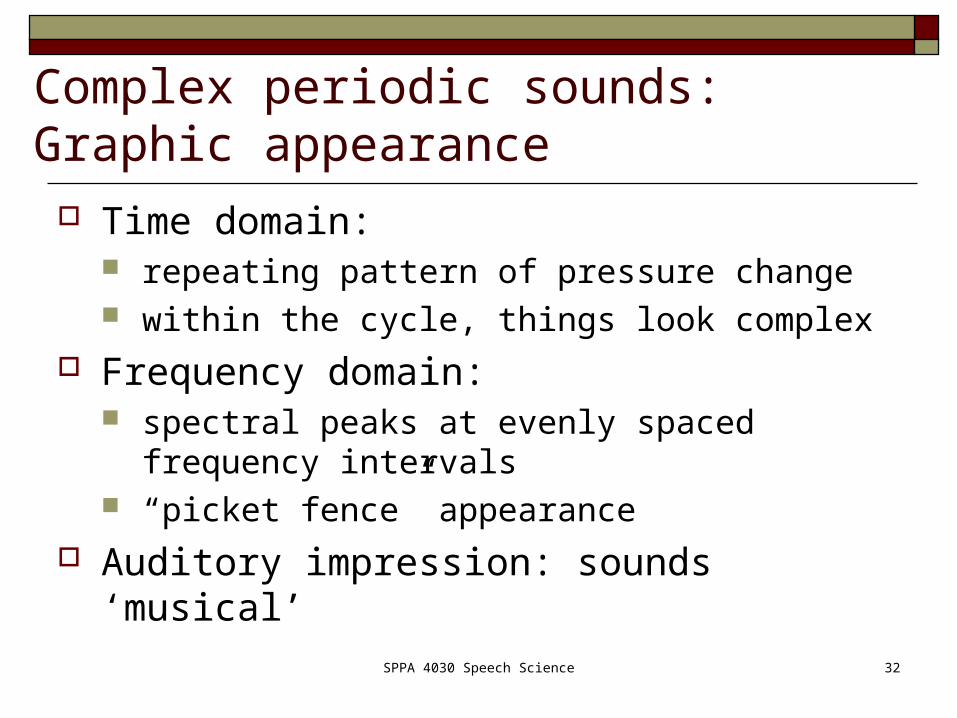
Complex periodic sounds: Graphic appearance
Time domain: repeating pattern of pressure change within the cycle, things look complex
Frequency domain: spectral peaks at evenly spaced frequency
intervals “picket fence” appearance
Auditory impression: sounds ‘musical’

SPPA 4030 Speech Science 33
Complex periodic sounds: Graphic appearance
From Hillenbrand

SPPA 4030 Speech Science 34
(Complex) Aperiodic sounds Complex: > one frequency component Aperiodic: Does not repeat itself Frequency components are not systematically
related May be
Continuous Transient

SPPA 4030 Speech Science 35
Aperiodic sounds: Graphic appearance Time domain:
no repeating pattern of pressure change Frequency domain:
the spectrum is dense No “picket fence”
Auditory impression: sounds ‘noisy’

SPPA 4030 Speech Science 36
Aperiodic sounds: Graphic appearance
From Hillenbrand
SPPA 4030 Speech Science 37
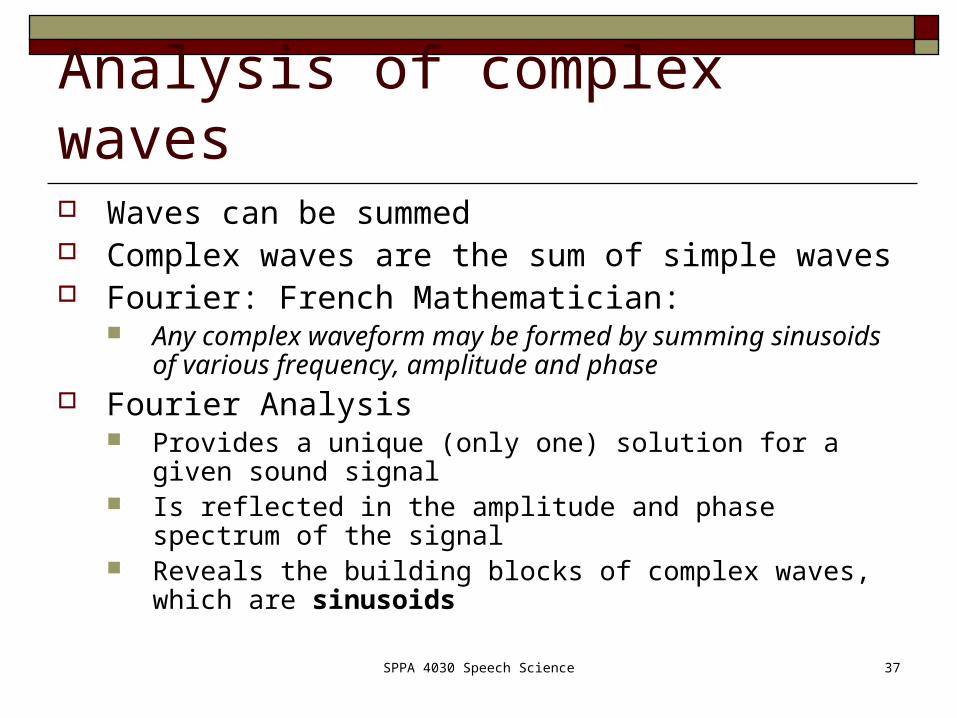
Analysis of complex waves Waves can be summed Complex waves are the sum of simple waves Fourier: French Mathematician:
Any complex waveform may be formed by summing sinusoids of various frequency, amplitude and phase
Fourier Analysis Provides a unique (only one) solution for a given sound signal Is reflected in the amplitude and phase spectrum of the signal Reveals the building blocks of complex waves, which are sinusoids

SPPA 4030 Speech Science 38
The “envelope” of a sound wave Amplitude envelope:
imaginary smooth line that follows the peak of the amplitude of a sound pressure waveform
Spectrum envelope: Imaginary smooth line drawn on top of the
amplitude spectrum

SPPA 4030 Speech Science 39
Amplitude envelope
From Hillenbrand

SPPA 4030 Speech Science 40
Spectrum envelope
From Hillenbrand

SPPA 4030 Speech Science 41
Amplitude Spectrum: Window Size “instantaneous” vs. average spectrum

SPPA 4030 Speech Science 42
“Instantaneous” Amplitude Spectra

SPPA 4030 Speech Science 43
(Long Term) Average Amplitude Spectrum

SPPA 4030 Speech Science 44

SPPA 4030 Speech Science 45
What is a filter?

SPPA 4030 Speech Science 46
“Acoustic” Filter holds back (attenuates) certain sounds and lets other
sounds through - selective.
SPPA 4030 Speech Science 47
Why might we be interested in filters? human vocal tract acts like a frequency selective
acoustic filter helps us understand how speech is produced and
perceived.

48
Frequency Response Curve (FRC)
Frequencylow high
Gai
n
+
-
Center frequency
lower cutofffrequency
upper cutoff frequency
passband
3 dB

SPPA 4030 Speech Science 49
Operation of a filter on a signal
NOTE: Amplitude spectrum describes a soundFrequency response curve describes a filter

SPPA 4030 Speech Science 50
Kinds of frequency selective filtersLow-pass filters
Lets low frequencies “pass through” and attenuates high frequencies
High-pass filters Lets high frequencies “pass through” and attenuates low
frequencies
Band-pass filters Lets a particular frequency range “pass through” and
attenuates other frequencies

SPPA 4030 Speech Science 51
Low Pass Filters
Frequencylow high
Gai
n
+
-

SPPA 4030 Speech Science 52
High Pass Filters
Frequencylow high
Gai
n
+
-

SPPA 4030 Speech Science 53
Band Pass Filter
Frequencylow high
Gai
n
+
-

SPPA 4030 Speech Science 54
Resonance

SPPA 4030 Speech Science 55
Free vibration
objects tend to vibrate at a characteristic or resonant frequency (RF)

SPPA 4030 Speech Science 56
Forced vibration
A vibrating system can force a nearby system into vibration
The efficiency with which this is accomplished is related to the similarity in the resonant frequency (RF) of the two systems

SPPA 4030 Speech Science 57
Forced vibration
If the RF of the two systems are the same, the amplitude of forced vibration will be large
If the RF of the two systems are quite different, the amplitude of forced vibration will be small or nonexistent

SPPA 4030 Speech Science 58
Resonance refers to
Natural vibrating frequency of a system The ability of a vibrating system to force
another system into vibration

SPPA 4030 Speech Science 59
Resonance
Acoustic (Cavity) Resonators Transmit sound frequencies with more or
less efficiency, depending upon the physical characteristics
Therefore, they act as filters, passing through (and even amplifying) some frequencies and attentuating others.

SPPA 4030 Speech Science 60
Resonance
Acoustic (Cavity) Resonators And since they act as filters, they have most of
the same features of a filter, even though we might use different names.
Center frequency is often termed the resonant frequency.
Frequency response curve often termed the resonance curve.
Resonators may be sharply or broadly “tuned” which refers to the roll-off frequency

SPPA 4030 Speech Science 61
Resonator Features
Sharply tuned Broadly tuned

SPPA 4030 Speech Science 62
Resonator Features
An example of the resonance characteristics of the human vocal tract
Frequency
Gain
SPPA 4030 Speech Science 63
Sound pressure, intensity and the decibel scale

SPPA 4030 Speech Science 64
Signal amplitude vs. Signal loudness
The bigger the signal – the louder the signal
Loudness is our perception of signal amplitude

SPPA 4030 Speech Science 65
What units do we use to measure signal amplitude?
Up to this point, we’ve used pressure pressure = force/area cgs units = 1 dyne/cm2 = 1 barye = 0.1 pascal

SPPA 4030 Speech Science 66
What units do we use to measure signal amplitude?
Size may also be represented using intensity Intensity = Power/area
Power=Work/time Work=Force*distance
Units: watts/m2 – not cgs

SPPA 4030 Speech Science 67
Pressure-Intensity Relation Intensity is proportionate to Pressure2

SPPA 4030 Speech Science 68
What is the decibel scale? We use the decibel scale to represent signal
amplitude
We are used to using measurement scales that are absolute and linear
The decibel scale is relative and logarithmic

SPPA 4030 Speech Science 69
Linear vs. logarithmic
Linear scale: 1,2,3… For example, the difference between 2 and
4 is the same as the difference between 8 and 10.
We say these are additive

70
Linear vs. logarithmic Logarithmic scales are multiplicative Recall from high school math and hearing science
10 = 101 = 10 x 1100 = 102 = 10 x 101000= 103 = 10 x 10 x 100.1 = 10-1 = 1/10 x 1
Logarithmic scales use the exponents for the number scalelog1010 = 1
log10100 = 2
log 101000=3
log 100.1 = -1

SPPA 4030 Speech Science 71
Logarithmic Scale base doesn’t have to be 10 In the natural sciences, the base is often 2.7…
or e

SPPA 4030 Speech Science 72
Logarithmic Scale Why use such a complicated scale?
logarithmic scale squeezes a very wide range of magnitudes into a relatively compact scale
this is roughly how our hearing works in that a logarithmic scales matches our perception of loudness change

SPPA 4030 Speech Science 73
For example,
linear log
1 10
2 100
3 1000

SPPA 4030 Speech Science 74
Absolute vs. relative measurement
Relative measures are a ratio of a measure to some reference
Relative scales can be referenced to anything you want.
decibel scale doesn’t measure amplitude (intensity or pressure) absolutely, but as a ratio of some reference value.

SPPA 4030 Speech Science 75
Typical reference values Intensity
10-12 watts/m2 Threshold for normal hearing at 1000 Hz
Sound Pressure Level (SPL) 20 micropascals

SPPA 4030 Speech Science 76
However… You can reference intensity/pressure to
anything you want
For example, Post therapy to pre therapy Sick people to healthy people Sound A to sound B

SPPA 4030 Speech Science 77
Now, let us combine the idea of logarithmic and relative…
bel= log 10(Im/ Ir)
Im –measured intensity
Ir – reference intensity
A bel is pretty big, so we tend to use decibel where deci is 1/10. So 10 decibels makes one bel
dBIL = 10log 10(Im/ Ir)

SPPA 4030 Speech Science 78
Intensity vs. Pressure Intensity is difficult to measure. Pressure is easy to measure – a microphone is
a pressure measuring device. Intensity is proportionate to Pressure2

SPPA 4030 Speech Science 79
Extending the formula to pressure
Using some logrithmic tricks, this translates our equation for the decibel to
dBSPL= (2)(10)log 10(Pm/ Pr) = 20log 10(Pm/ Pr)