Embed Size (px)
Citation preview

1
.
SOCIO-ECONOMIC STATUS AND THE STRUCTURAL CHANGE OF DIETARY
INTAKE IN HUNGARY: A PANNEL STUDY
Zoltán Bakucs(*)(1)
, Imre Fertő(2)
, Cristina Marreiros(3)
(1) Researcher, Institute of Economics, Hungarian Academy of Science
(2) Senior Research Advisor, Institute of Economics, Hungarian Academy
of Science, Professor, Budapest Corvinus University
(3) Lecturer, CEFAGE-UE, Portugal
(*) Corresponding author: [email protected]
Contribution prepared for submission to the 1st EAAE/AAEA Seminar
115th
EAAE Seminar
“The Economics of Food, Food Choice and Health”
Freising, Germany, September 15. – 17. 2010
Copyright 2010 by authors. All rights reserved. Readers may make verbatim
copies of this document for non-commercial purposes by any means, provided
that this copyright notice appears on all such copies.
2010
2
Abstract
Typically, big changes in the economic system lead to alterations on the disposable
income of families and thus on their spending for different type of products, including
food. These may imply, in the long run, a structural modification of the quality of diet
of the population. After the fall of the socialist system, in the past two decades Central
and Eastern European countries, including Hungary, went through a profound, and
sometimes difficult transition of their political and economic systems, shifting from a
centralized planned economy to an open market economy, and more importantly, the
European Union integration. Economic change in lower-income and transitional
economies of the world appears to coincide with increasing rapid social change. With
respect to nutrition there is evidence that those countries are changing their diets and
that these changes seem to be happening at a faster pace than ever before. In this paper
we analyze the evolution of Hungarian dietary patterns based on socio-economic status
(SES) data between 1993 and 2007. Data allows to define and profile several clusters
based on aggregated consumption data, than to inspect the influence of SES variables
using OLS and multinominal logit estimations.
Keywords: Transition economy, food consumption patterns, cluster analysis, logit
analysis
1. Introduction, background and relevance of the research
In Hungary, food expenditures constitute the second largest expenditure position for
private households (overshadowed only by expenditures for housing). Nevertheless,
food expenditure shares as well as absolute expenses per household are declining (from
23.3% in 1995 to 17.5.0% in 2008, versus 14.5% and 12.7% for EU-27 respectively). A
comparison of consumption behavior between East and West Germany reveals a clear
tendency of convergence for most products (Grings, 2001).In 1998, nearly the same
expenditure shares can be observed for fish, vegetables, sugar, sweets and non-
alcoholics, some differences can still be found for bread, cereals, and meat.
Moreover, in a study of food expenditures across 47 countries (Regmi et al, 2008) found
significant convergence in consumption patterns for total food, cereals, meats, seafood,
dairy, sugar and confectionery, caffeinated beverages, and soft drinks. According to the
authors that convergence reflects consumption growth in middle-income countries, in

3
which Hungary was included, due to rapid modernization of their food delivery
systems, as well as to global income growth. Quoting Regmi and Gehlhar (2005) this
study concludes that consumers in developing countries have used their growing
incomes to upgrade diets, increasing their demand for meats, dairy products, and other
higher value food products.
However, several studies (e.g., Irala-Estévez, et al, 2000; James et al, 1997; Arija et al,
1996; Ross et al 1996) show that there are large variations between individuals in the
quantity and quality of food consumed. In spite of the fact that lower income consumers
make bigger changes in food expenditures as income levels change (Seale et al, 2003),
investigation (e.g., Hulshof et al, 2003; Cavelaars et al, 1997; Adler et al, 1994;
Hoeymans et al, 1996) also shows that, in most European countries, there still are great
disparities in nutrition and health with respect to socio-economic status (SES).
In general, less educated and lower income groups appear to consume a less healthy diet
(Hulshof et al, 2003). According to the studies of Dowler et al, 1997 and James et al,
1997 poverty and low income may restrict the ability to buy food on the basis of health
and limit access to healthy food. According to Hulshof et al (2003), particularly in the
North and West of Europe, a higher SES is associated with a greater consumption of
low-fat milk, fruit and vegetables (e.g, Irala-Estevez et al, 2000). Additionally, those
with higher education tend to consume less fats and oils but more cheese (Hulshof et al
2003; Roos et al, 1999). Prattala et al (2003) confirmed that finding concluding that
higher and lower socioeconomic groups have different sources of saturated fats.
Previous research also concluded that consumers with a higher educational level tend to
be more aware of the characteristics of a healthy diet (Margetts et al,1997) and have
more knowledge about food items which are healthier (Martinez-Gonzales et al, 1998;
Hjartaker and Lund, 1998; Margetts et al, 1997). Hulshof et al (2003) state that this
might partly explain the differences in food consumption between SES classes.
The differences in food consumption patterns between SES may also be explained by
the findings of Prattala et al (2003) that higher social classes prefer modern foods and
lower classes traditional foods. This conclusion is in line with Grignon (1999) that
showed that higher social classes consumed more food items that indicated an
increasing trend in use than lower classes. According to the authors these findings are
explained by the Bourdieu‟s theory that the socioeconomically better-off are the first to
adopt food habits (Bourdieu, 1989).

4
To further understand the role of SES in food consumption, in this paper we will
analyze the differences in dietary intake between adults with different socioeconomic
status (SES) and trends over time. Using family food consumption household data from
the beginning of the transition period (1993) and from after EU accession (2007), we
analyze the declared consumption of the main food groups, looking into the differences
on diets of consumer groups with different SES in Hungary. This study allows for the
analysis of the convergence of the Hungarian diet with the diets of other European
countries and the identification of possible measures to improve the dietary intake of
consumers.
The present paper is organized as follows: after this introduction a brief description of
the research methodology is presented, the empirical results of the study will be
discussed in section 3, after which some summary conclusions and recommendations
will be presented. The conclusions will stress the main findings and discuss implications
for food policies in what concerns the improvement of the Hungarian diet.
2 - Data and methodology
The Hungarian Household Budget Survey (HBS) has been conducted annually by the
Hungarian Central Statistical Office since 1993. The survey covers the Hungarian
population living in private households. The unit of sampling is the dwelling; the unit of
observation is the household. The survey contains annually 7,000 to 10,000 households.
The survey is partly based on monthly household records and partly on post facto
annual interviews, providing detailed information both on income and structure of
expenditures. Own consumption of self-produced food and beverages and net farm
revenue are also reported.
The empirical analysis employs three multivariate techniques. First, cluster analysis is
used to group households according to their food consumption habits. Then, a more
detailed multivariate regression analysis follows, where healthy and less healthy food
consumption habits are regressed on variables defining SES. Thus dependant variables
include quantities of fat, sugar, alcohol, various meats, fruit and vegetables
consumption, whilst independent variables include household size, age and education of
the household head, location, income, employment, quality of house-flat (number of
rooms, existence of bathrooms, etc.).

5
Several different measures of socio economics status, like education, location, house
characteristics, were examined in this study. The aim was to compare the direction and
magnitude of associations for each measures of socio-economic status witk fruit and
vegetable intake. Educational level, cultural expenditures or the location in the capital or
bigger city may have important influences on socio-economic status. Higher levels of
education may so also increase the ability to obtain or to understand health-related
information in general or dietary information in particular needed to develop health-
promoting behaviours and beliefs in the field of food habits.
Analyses which have taken into account both education, occupation, income and
employment status have shown that usually education is the strongest determinant of
socio-economic differences. The other socio-economic variables have a similar but
weaker effect that education ( Roos et al. 1996)
Multivariate regressions differ from multiple regressions in that several independent
variables are jointly regressed on the same explanatory variables. Although direct
comparison of 1993 and 2007 regression coefficients should be done with care, since
variables are not entirely the same in the two databases, the analysis gives insight not
only into consumption and dietary habit differences across SES groups, but also into
their change in time. The latter is a rather important issue in the post-communist
economies, where the economic transformations started in 1990 had a deep impact upon
population purchase power, income, and indeed food consumption habits. Finally a
multinominal logit analysis is performed. Using information from the first part of the
empirical analysis, cluster numbers used as dependant variables are regressed upon SES
variables.
3 – Empirical results
3.1. Descriptive statistics
First, a number of SES variables were selected for the analysis. The descriptive statistics
of most important ones are presented in table 1: education of household head (Edu),
Income of household (Inc, monthly total personal income of household head in 1993,
and the deciles the household belongs based on net income per person for 2007),
location (Loc, 1- Budapest, 2 – major city, 3- town, 4 – village), number of people in
the household (Num), number of larger than 12 m2 rooms and number of 4 to 12 m
2

6
rooms in the household (R1 and R2 respectively), bathroom and toilet facilities in the
household (BR), agricultural income (AInc), cultural expenditures (Cult).
- insert Table 1. here –
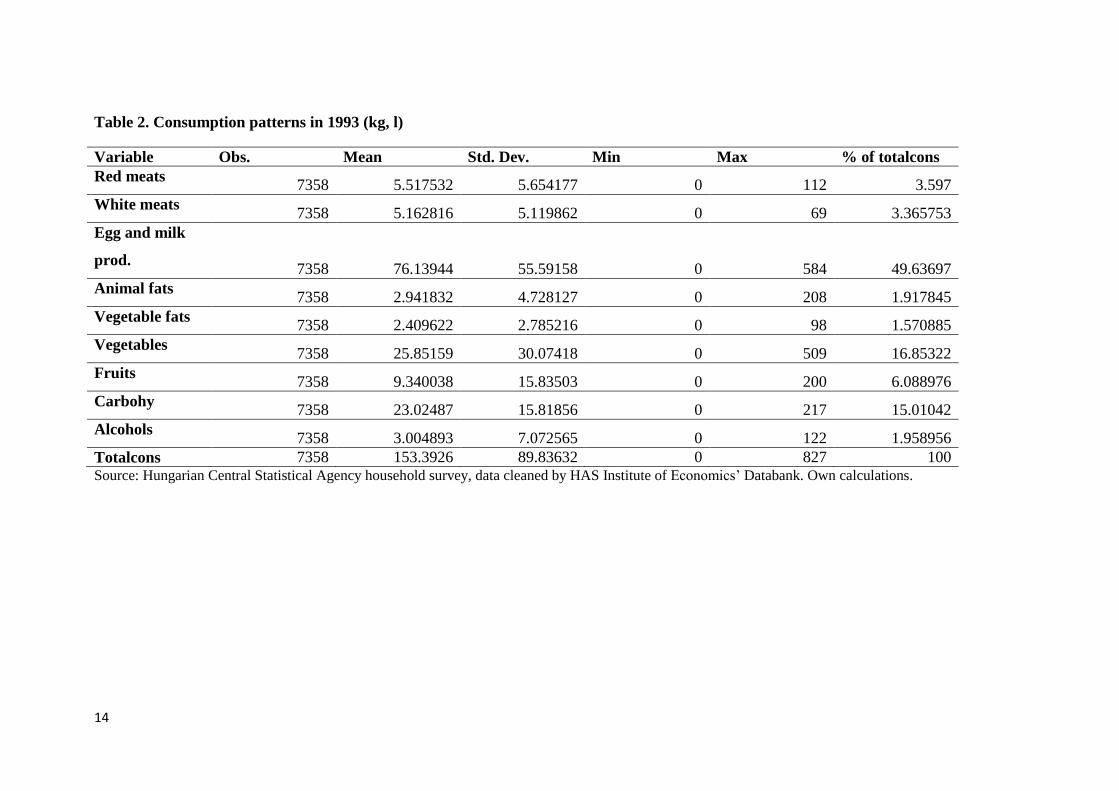
9 aggregated food consumption variables were created, based on individual food item
consumption data. Number of observations, mean values, standard deviation, minimum
and maximum values of the aggregated variables for 1993 and 2007 are presented in
tables 2 and 3 respectively.
- insert Table 2. here-
- insert Table 3. here-
The last column of tables 2 and 3 shows the percentage of aggregated consumption
variables within total food consumption (sum of all 9 categories). Surprisingly, the
structure of food consumption remained almost unchanged during the 14 years time
span. There is more consumption of red and white meats in 2007, but a shift from
animal to vegetable fats may also be observed. The share of vegetables in total
consumption had been massively reduced by 2007, however the share of fruit
consumption remained stable. With the increase of 2007 carbohydrates and alcohol
intakes, one may conclude that dietary habits in Hungary shifted towards less healthy
consumption patterns.
3.2. Cluster analysis
Cluster analysis was applied as a two-stage process to the following 9 aggregated food
intake variables: red meats, white meats, egg and milk products, animal fats, vegetable
fats, vegetables, fruits, carbohydrates and alcohol. In the first stage, a hierarchical
analysis was employed to provide an indication of the appropriate number of clusters.
Hair et al (1998) suggests a procedure based upon inspection of the distance
information from the agglomeration schedule. Following this procedure the appropriate
number of clusters is suggested at the stage where there is a „large‟ increase in the
distance measure, indicating that a further merger would result in decrease in
homogeneity. However Hair et al point out that „the selection of the final cluster
solution requires substantial researcher judgement and is considered by many to be too

7
subjective‟. Following the hierarchical analysis, and the exclusion of outliers in both
databases, the K-Means optimisation procedure was employed, together with
consideration of relative cluster size and the desire for parsimony, to generate a three-
cluster solution for 1993 and a two-cluster solution for 2007. Information about cluster
membership, in the form of a nominal cluster identity variable, and distance to the
cluster center, was saved for posterior analysis.
F tests were performed to the cluster variables. These tests are based upon differences
between clusters, on the basis of a null hypothesis that average variable scores for each
cluster are equal against an alternative hypothesis that they are not. The results indicate
that the 9 variables have significantly different patterns between groups. Therefore, the
criteria used to cluster consumers can be considered meaningful.
The next step in the analysis is to profile the clusters. A profile of each of the groups is
established from the mean of the food intake variables for each group and from the
identification of the SES variables for which there are significant differences between
groups at a 5% level of significance on the basis of a chi-square contingency test for
nominal variables, and an F test for metric variables.
Of the 3 clusters found in the 1993 panel, Cluster 3 is the biggest cluster with more than
half of the members of the population in analysis (62,3%), followed by Cluster 2
(34,5%) and by a quite small Cluster 1 with only 2,7% of observations. Analysing the
profiles of the clusters, significant differences at the 5% level were found in all food
intake variables and in SES variables in analysis, except for the amount spent in
concerts and theatres.
Cluster 3 has the lowest scores in all food intake variables and in the income variable,
which may be explained by the fact that families of this cluster are smaller (average size
of 2,32 members vs 3,28 in Cluster 2 and 3,65 in Cluster 1). These families have smaller
houses than families in the other two cluster (both in number of rooms smaller and
larger than 12m2) and spend relatively less on books. Additionally, they tend to live
relatively more in Budapest and other cities (27,5% vs 16,3% in Cluster 2 and 10,8 in
Cluster 1) and to have a woman has head of the household (34,7% vs 10,8% in Cluster 2
and 8,2% in Cluster 1). The head of the household is relatively older than in the other
two clusters (54,6 vs 50,22 in Cluster 2 and 47,93 in Cluster 1). In what concerns
education level, the profile of this cluster is somewhat mixed, since this is the cluster
that has the highest proportion of people with less than 8 years of school (25,25 vs

8
15,8% in Cluster 2 and 14,8% in Cluster 1) and, at the same time, with a university or
college education (8,6% vs 7,1% in Cluster 2 and 5,1% in Cluster 1).
As it can be understood form the previous paragraph, Cluster 1 is more different from
Cluster 3 than Cluster 2 in terms of both food intake and socio-economic profile. This
rule does not apply on the consumption of fruits, where Cluster 2 has the highest score,
followed by Cluster 1 and then Cluster 3. The same is true for the number of rooms in
the household smaller than 12m2, where the mean value of Cluster 2 is higher. It is also
important to notice that Cluster 1 is the cluster with a higher proportion of people living
in the countryside (59,7% vs 52,1% in Cluster 2 and 40,5% in Cluster 3) with 8 to 10
years of school (36,7 vs 31,5% in Cluster 2 and 29,6% in Cluster 3) and with a men as
head of the household (91,8% vs 89,2% in Cluster 2 and 65,3 in Cluster 3).
The profiles of the 2007 clusters show that cluster 1 is the smallest cluster, with 26.5%
of observations. The mean value of the food intake variables is always higher in this
cluster. When compared to Cluster 2, consumers in Cluster 1 are characterised by
relatively lower education levels and live relatively more in rural areas and small cities
(71.8% versus 53.9% in Cluster 2). They live in bigger households and spend more in
education, culture and holidays. These may be explained by the fact that they tend to
have bigger families than consumers in Cluster 2 (mean value of 3.41 versus 2.3). The
per capita total income is relatively lower in this cluster – the percentage of observations
in decile 1 to 7 is significantly higher for this group. The head of household tends to be
younger than in Cluster 2 (mean value of 50,3 versus 52) and a man (83,3% versus
62,3%).
In conclusion, it can be stated that this cluster is composed of more traditional families,
with relatively lower per capita income, that live in the countryside, have more children
and a relatively young men as head of household, with a medium level of education.
3.3. Regression analysis
OLS regressions of aggregated consumption variables, on cluster data, and SES
variables are performed next. Table 4 presents regression coefficients and their
significance levels for 1993, table 5. for 2007.
- insert Table 4. here –

9
- insert Table 5. here –
Coefficients of determination (adjusted R2) vary considerably between regressions,
from 6% (fruits, alcohols, vegetable fats, animal fats) to 30% (carbohydrates) or even
66% (egg and milk products) for 1993. Similarly dispersed, albeit somewhat higher R2
values were obtained for 2007 as well, ranging from 7% (alcohols) to 15-20% for meat,
vegetable and fruit products or 48% (carbohydrates) and 64% (egg and milk products).
Explanatory variables are generally highly significant, and their sign is persistent from
1993 to 2007 regressions. For 1993 the cluster analysis revealed that households in
cluster 1 consume the most, followed by clusters 2 and 3. For the 2007 data, cluster 1
consumes more than cluster 2. The finding is reflected by the negative coefficients of
the cluster variable in every regression for both 1993 and 2007. The gender variable is
negative for all categories, implying that households managed by women consume less.
Education, coded from 1 (less than 8 classes) to 8 (PhD) significantly reduces
consumption except for vegetable fats and fruits, possibly suggesting more health
conscious eating habits for highly educated households. For 1993 the income variable is
only significant (positive) for red meats, vegetable fats, fruits and alcohol, the more
expensive food categories. For 2007 the income variable is significantly positive for all
food categories except the cheaper and possibly less income sensitive ones, as animal
fats and carbohydrates. The higher number of food categories where the variable is
significant in 2007 compared to 1993 might suggest the growing importance of
household income when purchasing food, i.e. the increase of the food demands‟ income
elasticity coefficient. Location (from 1, Budapest to 4, village), has significantly
positive (e.g. white meats, egg-milk products, animal fats, carbohydrates for 1993) and
negative effects (vegetable fats, consumed more in larger localities) depending on food
category. For 2007 the variable suggests increased consumption of most food categories
in smaller localities compared to bigger ones, with the exception of vegetables, fruits
and alcohols. With exception of alcohols (negative for 1993, not significant for 2007)
the number of household members positively influence all aggregated food categories.
The negative sign of alcohols indicates that households with larger families (more
children) tend to spend less on such items. The number of smaller and larger rooms (R1
and R2) are generally significant and increase consumption of all food variables. The
picture is less obvious for the number of bathrooms/toilets in the household.
Agricultural income seems to be an important determinant in both years, with mostly

10
significant positive coefficients (correlation coefficient between net income and
agricultural sales/income is close to 0). There is an extra variable included in the 2007
regressions, not available for 1993 data, the cultural, artistic expenditures (cult). With
exception of alcohols and fruits where significantly positive, it has negative effects upon
all other food consumption categories. Perhaps those willing to spend more on culture,
arts, and ultimately going out, tend to consume more alcohol in and outdoors, and in the
same time reduce their intake of other food items.
3.4. Logit analysis
A multinominal logit analysis is run for 1993, with the dependant variable being the
cluster (1, 2 or 3). For the 2 cluster solution in 2007 a logit regression is performed.
Results for 1993 and 2007 are presented in tables 6 and 7 respectively.
- insert Table 6. here –
- insert Table 7. here -
The coefficients of the multinominal logit regression fit the cluster profiles presented in
section 3.2: cluster 3, the base is the cluster with lowest food intake, smaller houses (R1,
R2 positive in cluster 1 and 2 versus the base), live more in Budapest or bigger cities
(positive coefficient for location in both clusters vs. cluster 3), smaller families (variable
Num positive). In a similar fashion, those in cluster 1 are more likely to live in rural
areas than those in cluster 2 or 3 (positive location and agricultural income coefficients),
and they are more likely to have a man as household head.
4 – Conclusion
Results emphasize the major post 1990 socio-economic changes in the Hungarian
society. Dietary intakes vary considerably across SES and also in time. A general
deterioration of dietary habits is observed, however some SES groups managed to shift
their food consumption towards healthier intake patterns.
Results are equally relevant for health care professionals, farmers, agro-food
enterprises, and different public bodies that need to know how much and what does the
population of a region or a country eat. Nutrition, or rather poor nutrition, is the main
cause of morbidity and mortality in Europe and, consequently, successful nutritional

11
politics might prove to be a fundamental step for the improvement of health in Europe.
The success of these politics depends on a clear understanding of the dietary patterns of
the population, and how different socio-economic factors influence these patterns. This
study hopefully adds to that understanding in the context of a European transition
economy.
References
Adler, N.; Boyce, T.; Chesney, M.; Cohen, S.; Folkman, S.; Kahn, R.; Syme, S. (1994).
“Socio-economic status and health”. Am. Psychology, 49, 15– 24.
Arija, V.; Salas-Salvado, J.; Fernandes-Ballart, J.; Cuco, G.; Marti-Henneberg, C.
(1996). “Consumo , hábitos alimentarios y estdo nutricional de la poblacion de Reus”.
(IX). Med. Clin. (Barc), 106, 174-179
Bourdieu, P. (1989). Distinction: a social critique of the judgment of taste. London,
Routledge & Kegan Paul
Cavelaars, A.; Kunst, A.; Mackenbach, J. (1997). “Socio-economic differences in risk
factors for morbidity and mortality in the European community: an international
comparison”. Journal of Health Psychology, 2, 353 – 372.
Dowler, E.; Barlosius, E.; Feichtinger, E.; Kohler, B. (1997). “Poverty, food and
nutrition”. In: Poverty and Food in Welfare Societies. Ed. BM Kohler, E Feichtinger, E
Barlosius & E Dowler, 17 – 32. Berlin, Ramer Bohn.
Grignon, C. (1999). “Long Term Trends in food consumption: a French portrait”. Food
Foodways, 8 (3), 151-74
Hjartaker, A.; Lund, E. (1998). “Relationship between dietary habits, age, lifestyle, and
socio-economic status among adult Norwegian women. The Norwegian Women and
Cancer Study”. European Journal of Clinical. Nutrition, 52, 565 – 572.
Hoeymans, N.; Smit, H.; Verkley, H.; Kromhout, D. (1996). “Cardiovascular risk
factors in relation to educational level in 36,000 men and women in the Netherlands”.
European Heart Journal, 17, 518– 525.
Hulshof, K.; Brussaard, J.; Kruizinga, A.; Telman, J.; Lowik, M. (2003). “Socio-
economic status, dietary intake and 10 y trends: the Dutch National Food Consumption
Survey”. European Journal of Clinical Nutrition, 57, 128–137
Irala-Estevez, J.; Groth, M.; Johansson, L.; Prattala R.; Martınez-Gonzalez, M. (2000).
“A systematic review of socio-economic differences in food habits in Europe:
consumption of fruit and vegetables”. European Journal of Clinical Nutrition, 54, 706 –
714.

12
James, W.; Nelson, M.; Ralph, A.; Leather, S. (1997). “Socio-economic determinants of
health. The contribution of nutrition to inequalities in health”. British Medical Journal,
314, 1545 – 1549.
Margetts, M.; Martinez, J.; Saba, A.; Holm, L.; Kearney, M. (1997). “Definitions of
„healthy eating‟: a pan EU survey of consumer attitudes to food, nutrition and health”.
European Journal of Clinical. Nutrition.,51, S23 – S29.
Martınez-Gonzalez, M.; Lopez-Azpiazu, I.; Kearney, M.; Gibney, M.; Martınez, J.
(1998). “Definition of healthy eating in the Spanish adult population: a national sample
in a pan-European survey”. Public Health, 112, 95– 101.
Prattala, R.; Groth, M.; Oltersdorf, U.; Roos, G.; Sekula,W.; Tuamainen, H. (2003).
“Use of butter and cheese in 10 European countries. A case of contrasting educational
differences”. European Journal of Public Health, 13 (2), 124 - 32
Regmi, A.; Takeshima, H.; Unnevehr, L. (2008). “Convergence in global food demand
and delivery”. Economic Research Report Number 56, Economic Research Department,
USDA
Regmi, A.; Gehlhar, M. (2005). “New Directions in Global Food Markets”. AIB – 794,
Economic Research Service, U.S.D.A.
Roos, G.; Prattala, R. and the FAIR-97-3096 Disparities Group (1999). “Disparities in
food habits”. Review of Research in 15 European Countries. Helsinki, National Public
Health Institute
Roos, G.; Prattala, R.; Lahelma, E.; Kleemola, P.; Pietinen, P. (1996). “Modern and
healthy? Socioeconomic differences in the quality of diet”. European Journal of
Clinical Nutrition, 50, 753-60.
Seale, J.; Regmi, A.; Bernstein, J. (2003). “International evidence on food consumption
patterns”. Technical Bulletin, 1904, Economic Research Service, U.S.D.A.

13
Table 1. Descriptive statistics of some variables
Variable Obs. Mean Std. Dev. Min Max Obs. Mean Std. Dev. Min Max
1993 2007
Edu 7358 3.065643 1.985173 1 8 7383 4.237302 2.390157 1 10
Inc 7358 14075.39 8848.325 -3100 152710 7383 6.17134 2.826038 1 10
Loc 7358 3.146099 0.937633 1 4 7383 2.71177 1.100519 1 4
Num 7358 2.685648 1.311999 1 10 7383 2.596235 1.382701 1 11
R1 7358 1.793558 0.769598 0 6 7383 1.830692 0.93752 0 6
R2 7358 0.656157 0.750522 0 6 7383 0.83462 0.902079 0 6
BR 7358 1.543218 1.103318 1 4 7383 1.034268 0.364789 0 2
AInc 7358 18665.77 80856.31 0 2849000 7383 68731.7 201412.8 0 4067600
Cult - - - - - 7383 148524 204833.8 0 4081308
Source: Hungarian Central Statistical Agency household survey, data cleaned by HAS Institute of Economics‟ Databank. Own calculations.
14
Table 2. Consumption patterns in 1993 (kg, l)
Variable Obs. Mean Std. Dev. Min Max % of totalcons
Red meats 7358 5.517532 5.654177 0 112 3.597
White meats 7358 5.162816 5.119862 0 69 3.365753
Egg and milk
prod. 7358 76.13944 55.59158 0 584 49.63697
Animal fats 7358 2.941832 4.728127 0 208 1.917845
Vegetable fats 7358 2.409622 2.785216 0 98 1.570885
Vegetables 7358 25.85159 30.07418 0 509 16.85322
Fruits 7358 9.340038 15.83503 0 200 6.088976
Carbohy 7358 23.02487 15.81856 0 217 15.01042
Alcohols 7358 3.004893 7.072565 0 122 1.958956
Totalcons 7358 153.3926 89.83632 0 827 100 Source: Hungarian Central Statistical Agency household survey, data cleaned by HAS Institute of Economics‟ Databank. Own calculations.

15
Table 3. Consumption patterns in 2007 (kg, l)
Variable Obs. Mean Std. Dev. Min Max % of totalcons
Red meats 7383 4.11378 5.855959 0 157.07 4.325216
White meats 7383 4.101364 4.218907 0 46 4.312162
Egg and milk
prod. 7383 47.13215 35.04902 0 369.98 49.55461
Animal fats 7383 0.748988 1.759469 0 35.22 0.787484
Vegetable fats 7383 2.828576 2.669028 0 38.5 2.973957
Vegetables 7383 7.514245 9.902279 0 223 7.900456
Fruits 7383 7.08544 8.523729 0 130 7.449611
Carbohy 7383 17.15278 12.0848 0 190.96 18.03438
Alcohols 7383 4.434215 8.379235 0 159.9 4.662121
Totalcons 7383 95.11154 58.32562 1.6 553.82 100 Source: Hungarian Central Statistical Agency household survey, data cleaned by HAS Institute of Economics‟ Databank. Own calculations.

16
Table 4. Food consumption regression analysis for 1993
Dep. var. Clus Gen Edu Inc Loc Num R1 R2 BR AInc Cons
Red meats -0.302
*** -0.163
*** -0.032
*** 0.080
*** 0.015 0.130
*** 0.087
*** 0.039
*** -0.049
*** 0.029
*** 1.317
***
White meats -0.369
*** -0.160
*** -0.025
*** 0.024 0.078
*** 0.078
*** 0.083
*** 0.068
*** 0.014 0.023
*** 1.360
***
Egg and
milk prod. -1.028
*** -0.032
*** -0.006
** 0.007 0.019
*** 0.036
*** 0.024
*** 0.000 -0.006 0.007
*** 3.495
***
Animal fats -0.355
*** -0.223
*** -0.055
*** -0.048 0.125
*** 0.134
*** 0.013 0.001 0.048
*** 0.008
*** 1.337
**
Vegetable
fats -0.330
*** -0.031 0.010 0.120
*** -0.035
** 0.053
*** 0.017 0.004 -0.057
*** -0.004 1.747
***
Vegetables -0.680
*** -0.105
*** -0.025
*** 0.003 0.008 0.030
*** 0.066
*** 0.052
*** 0.002 0.000 2.608
***
Fruits -0.605
*** -0.083 0.013 0.116
*** -0.029 0.001 0.091
*** 0.050
* -0.028 0.016
*** 2.364
***
Carbohy -0.235
*** -0.087
*** -0.043
*** 0.000 0.086
*** 0.206
*** 0.003 -0.001 0.030
*** 0.004
*** 0.887
***
Alcohols -0.416
*** -0.828
*** -0.056
*** 0.099
** 0.183
*** -0.085
*** 0.227
*** 0.131
*** -0.008 0.011
* 1.527
***
Source: Hungarian Central Statistical Agency household survey, data cleaned by HAS Institute of Economics‟ Databank. Own calculations.
Note: *** indicates 1% , ** indicates 5% and * indicates 10% levels of significance respectively.

17
Table. 5. Food consumption regression analysis for 2007
Dep var. Clus Gen Edu Inc Loc Num R1 R2 BR AInc Cult Cons
Red meats -0.527***
-0.133***
-0.035***
0.039***
0.056***
0.196***
0.072***
0.023 -0.038 0.067***
-0.054***
1.079***
White meats -0.562***
0.007 -0.023***
0.018***
0.055***
0.153***
0.046***
0.008 -0.056 0.059***
-0.013 1.334***
Egg and
milk prod. -1.188***
0.009 -0.011***
0.009***
0.016***
0.092***
0.012* 0.002 -0.009 0.016
*** -0.012
*** 2.751
***
Animal fats -0.810***
-0.272***
-0.085***
-0.002 0.054**
0.048* 0.072
** -0.032 -0.391
*** 0.151
*** -0.093
*** 2.836
***
Vegetable
fats -0.465***
-0.044* -0.031
*** 0.033
*** 0.054
*** 0.161
*** 0.029
** 0.047
*** 0.031 -0.008
** -0.014
* 1.081
***
Vegetables -0.553***
-0.060* -0.023
*** 0.034
*** -0.037
*** 0.084
*** 0.086
*** 0.059
*** -0.045 0.089
*** -0.001 1.501
***
Fruits -0.521***
-0.035 0.002 0.054***
-0.064***
0.091***
0.056***
0.027 0.077* 0.072
*** 0.045
*** 1.192
***
Carbohy -0.336***
-0.014 -0.026***
0.001 0.100***
0.255***
0.016**
0.002 -0.132***
0.017***
-0.030***
0.875***
Alcohols -0.386***
-0.821***
0.005 0.061***
-0.062***
-0.003 0.060**
0.018 -0.014 0.013* 0.080
*** 1.513
***
Source: Hungarian Central Statistical Agency household survey, data cleaned by HAS Institute of Economics‟ Databank. Own calculations.
Note: *** indicates 1% , ** indicates 5% and * indicates 10% levels of significance respectively.

18
Table 6. Multinominal logit analysis for 1993 (cluster 3 base outcome)
Variables Coef. Signif. Coef. Signif.
Cluster 1. Cluster 2.
Gen -0.634 0.024 -0.660 0.000
Age -0.008 0.205 -0.014 0.000
Edu -0.119 0.022 -0.012 0.479
Inc 0.154 0.158 0.113 0.017
Loc 0.465 0.000 0.293 0.000
Num 0.740 0.000 0.574 0.000
R1 0.281 0.007 0.200 0.000
R2 0.018 0.868 0.102 0.011
BR -0.160 0.067 -0.057 0.047
Book 0.000 0.029 0.000 0.712
Cult -0.001 0.595 0.000 0.579
Mealsg -0.008 0.377 -0.010 0.004
AInc 0.093 0.000 0.075 0.000
_cons 0.833 0.890 9.618 0.000
Pseudo R2 0.135
Source: Hungarian Central Statistical Agency household survey, data cleaned by HAS Institute of Economics‟ Databank. Own calculations.

19
Table 7. Logit analysis for 2007 (cluster 2 base outcome)
Variables Coef. Signif.
Cluster 1.
Gen -0.326 0.000
Age 0.013 0.000
Edu -0.061 0.000
Inc 0.031 0.030
Loc 0.124 0.000
Num 0.583 0.000
R1 0.172 0.000
R2 0.130 0.001
BR -0.009 0.919
Cult 0.009 0.719
Mealsg -0.006 0.233
AInc 0.161 0.000
Health 0.062 0.000
_cons -4.192 0.000
Pseudo R2 0.16
Source: Hungarian Central Statistical Agency household survey, data cleaned by HAS Institute of Economics‟ Databank. Own calculations.

20