Embed Size (px)
Citation preview
DETERMINATION OF DIETARY SODIUM INTAKE AMONG THE MINISTRY OF HEALTH STAFF
RESEARCH PROJECT NO: (NMRR-15-1290-25981)
INSTITUTE FOR PUBLIC HEALTHMinistry of Health, Malaysia 2016
2 3
DETERMINATION OF DIETARY SODIUM INTAKE AMONG THE MINISTRY OF HEALTH STAFF DETERMINATION OF DIETARY SODIUM INTAKE AMONG THE MINISTRY OF HEALTH STAFF
Institute for Public Health, Ministry of Health, Malaysia Institute for Public Health, Ministry of Health, Malaysia
Copyright©Institute for Public Health, National Institutes of Health,Ministry of Health, Malaysia 2016All rights reserved
This work is copyrighted. Institute for Public Health welcomes request for permission to reproduce in whole or part of its publication. Application and inquiries should be addressed to Secretariat Research Committee of Institute for Public Health.
ISBN: 978 – 983 – 99320 – 2 – 7
DETERMINATION OF DIETARY SODIUM INTAKE AMONG THE MINISTRY OF HEALTH STAFF
Suggested citation:
Institute for Public Health (IPH) 2016. Determination of dietary sodium intake among the Ministry of Health staff 2015 (MySalt 2015)
Any enquiries about or comments on this report should be directed to:
Pn Fatimah OthmanInstitut Kesihatan UmumTel: 03- 2297 9446Email : [email protected]
Pn Cheong Siew ManInstitut Kesihatan UmumTel: 03- 2297 9492Email : [email protected]
Published by Institute for Public Health, Ministry of Health, Malaysia
ACKNOWLEDGEMENT
The authors would like to thank the Director-General of Health Malaysia for his permission to publish this report. Appreciation to the Deputy-Director General of Health (Research and Technical Support) and the Director of the Institute for Public Health for their support and advice throughout the survey.
The authors would like to thank the Disease Control Division, Nutrition Division, and State Health Departments of Ministry of Health for the support and cooperation on this survey.
Sincere appreciation is extended to State Liaison Officers, data collectors (nutritionist, dietitian, medical officers, nurses and other relevant health staff for assisting in the implementation of the survey.
Further gratitude goes to Ministry of Health staffs who have contributed their time and urine samples to this study, and the Pathology Department of Hospital Kuala Lumpur for providing technical support throughout the study.
4 5
DETERMINATION OF DIETARY SODIUM INTAKE AMONG THE MINISTRY OF HEALTH STAFF DETERMINATION OF DIETARY SODIUM INTAKE AMONG THE MINISTRY OF HEALTH STAFF
Institute for Public Health, Ministry of Health, Malaysia Institute for Public Health, Ministry of Health, Malaysia
RESEARCH TEAM MEMBERS
1. Fatimah Othman (Principle Investigator 1) Dietitian (Researcher), Institute for Public Health
2. Cheong Siew Man (Principle Investigator 2) Nutritionist (Researcher), Institute for Public Health
3. Dr. Tahir Bin Aris Director, Institute for Public Health
4. Dr. Rozlan Bin Ishak Deputy Director, Disease Control Division, Ministry of Health
5. Rashidah Binti Ambak Dietitian (Researcher), Institute for Public Health
6. Dr. Mohd Azahadi Bin Omar Public Health Specialist, Institute for Public Health
7. Dr Muhammad Fadhli Bin Mohd Yusoff Public Health Specialist, Institute for Public Health
8. Nor Azian Binti Mohd Zaki Dietitian (Researcher), Institute for Public Health
9. Azli Bin Baharudin Nutritionist (Researcher), Institute for Public Health
10. Mohd Hasnan Ahmad Nutritionist (Researcher), Institute for Public Health
11. Nur Shahida Binti Abdul Aziz Dietitian (Researcher), Institute for Public Health
12. Muslimah Yusof Nurse, Institute for Public Health
13. Norazizah Ibrahim Wong Statistician, Institute for Public Health
14. Viola Micheal Senior Principle Assistant Director, Disease Control Division, Ministry of Health
15. Siti Farah Zaidah Mohd Yazid Assistant Principal Director, Disease Control Division, Ministry of Health
16. Azhar Yusuff Assistant Principal Director, Disease Control Division, Ministry of Health
TABLE OF CONTENTS
Abstract 8 1.0 Introduction 8
2.0 Literature review 102.1 Sodium intake among Malaysian adult 102.2 Knowledge, attitude and practice 102.3 Sodium assessment 10
3.0 Methodology 113.1 Study design and sampling 113.2 Objectives 123.3 Inclusion and exclusion criteria 123.4 Data collection 133.5 Study instruments 143.6 Data entry and analysis 163.7 Permission and grant 16
4.0 Findings 174.1 General findings 184.2 Measured and estimated urinary sodium and creatinine excretions 194.3 Sodium excretion by study characteristics 194.4 Estimation of sodium and creatinine using prediction formula 214.5 Knowledge, attitude, and practices (KAP) towards dietary salt intake 224.6 Estimation of dietary sodium Intake 254.7 Estimation of sodium intake with Food Frequency Questionnaire (FFQ) 264.8 Main sources of sodium intake in the diet 284.9 Sodium intake by food groups 294.10 Correlation between dietary sodium intake and urinary sodium excretion 30
5.0 Discussion 31
5.1 Pattern of sodium excretion 315.2 Knowledge, attitude and practice (KAP) towards dietary sodium intake 325.3 Sodium estimation using spot urine 325.4 Estimation of sodium intake analyzed through two days food diary 325.5 Estimation of dietary sodium Intake by Food Frequency Questionnaire 335.6 Main sources of sodium intake in the diet 33
6.0 Conclusion 34
7.0 Suggestion 34
No Content Page Number
6 7
DETERMINATION OF DIETARY SODIUM INTAKE AMONG THE MINISTRY OF HEALTH STAFF DETERMINATION OF DIETARY SODIUM INTAKE AMONG THE MINISTRY OF HEALTH STAFF
Institute for Public Health, Ministry of Health, Malaysia Institute for Public Health, Ministry of Health, Malaysia
4. ABBREVIATIONS
BMI – Body Mass IndexFFQ – Food Frequency Questionnaire
KAP – Knowledge, Attitude and PracticesMOH – Ministry of Health
WHO – World Health OrganizationNCD- Non Communicable Disease
1. LIST OF TABLES
3.0 Matrix to determine sample size 113.1 Calculated samples based on the WHO matrix table 123.2 Data collection instruments 14 3.3 Estimation of 24-hour urine sodium by using spot urine 154.0 Characteristics of the study population 184.1 Sodium and creatinine excretion in 24-hour and spot urine test 19 4.2 Mean of 24 - hour urine sodium excretion by study characteristics 204.3 24 - hour urine sodium and creatinine by using Kawasaki dan Tanaka equations. 224.4 Correlation of actual and estimated 24 - hour urine sodium and creatinine 224.5 Knowledge, attitudes and practices (KAP) towards dietary salt intake 244.6 Dietary sodium intake by food diary and socio demography data 254.7 Dietary sodium intake by Food Frequency Questionnaire (FFQ) and socio demography data 274.8 Main source of sodium in daily diet 284.9 Intake pattern of top 20 high sodium food items 294.10 Sodium intake by food groups 294.11 Correlation between dietary sodium intake and urine sodium excretion 30
2. LIST OF FIGURES
113.0 Sampling flowchart3.1 Data collection flow chart 123.2 Number of respondents by states 14
3. Appendices
Appendix I Borang Maklumat Kajian dan Borang Persetujuan Menyertai Kajian 40Appendix II Manual Operasi Kajian Pengambilan Garam Anggota Kementerian Kesihatan Malaysia (Mysalt 2015) 42Appendix III Borang Soal Selidik Kajian Mysalt 2015 72Appendix IV Diari Makanan Kajian Mysalt 2015 77Appendix V Borang Permohonan Ujian Makmal 78Appendix VI List of Liaison Officers 79
Table Title of Table Page Number
Table Title of Table Page Number
Table Title of Table Page Number
8 9
DETERMINATION OF DIETARY SODIUM INTAKE AMONG THE MINISTRY OF HEALTH STAFF DETERMINATION OF DIETARY SODIUM INTAKE AMONG THE MINISTRY OF HEALTH STAFF
Institute for Public Health, Ministry of Health, Malaysia Institute for Public Health, Ministry of Health, Malaysia
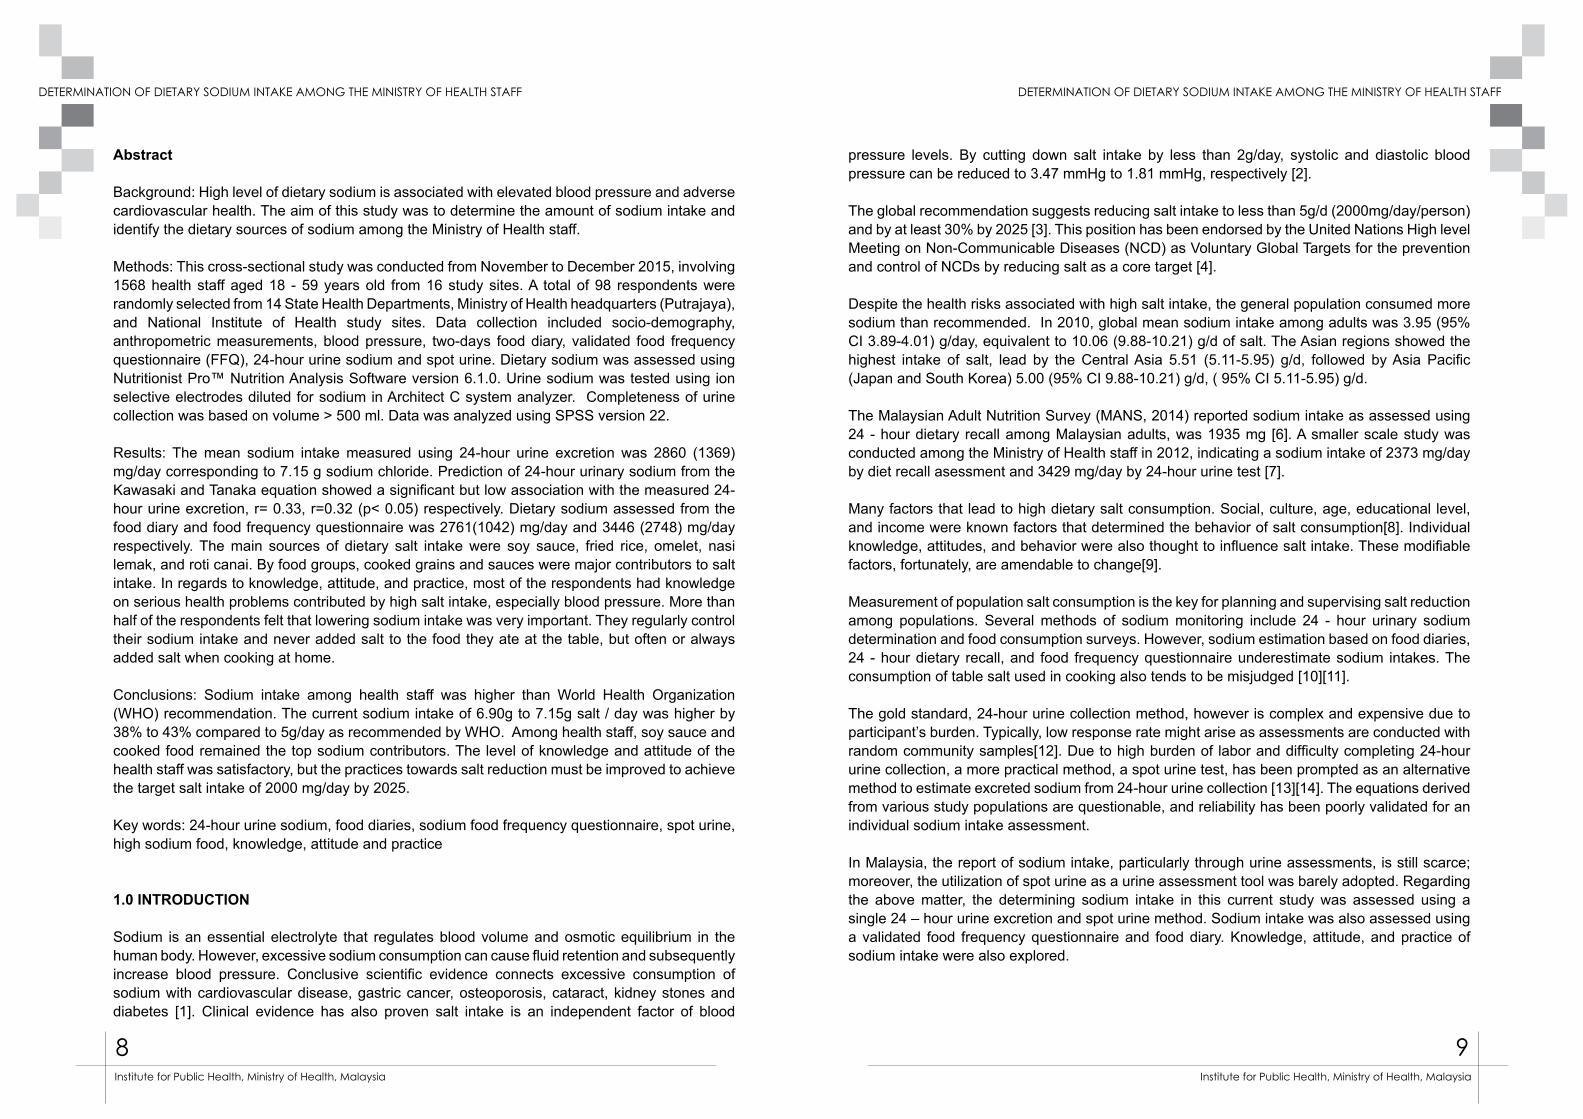
Abstract
Background: High level of dietary sodium is associated with elevated blood pressure and adverse cardiovascular health. The aim of this study was to determine the amount of sodium intake and identify the dietary sources of sodium among the Ministry of Health staff.
Methods: This cross-sectional study was conducted from November to December 2015, involving 1568 health staff aged 18 - 59 years old from 16 study sites. A total of 98 respondents were randomly selected from 14 State Health Departments, Ministry of Health headquarters (Putrajaya), and National Institute of Health study sites. Data collection included socio-demography, anthropometric measurements, blood pressure, two-days food diary, validated food frequency questionnaire (FFQ), 24-hour urine sodium and spot urine. Dietary sodium was assessed using Nutritionist Pro™ Nutrition Analysis Software version 6.1.0. Urine sodium was tested using ion selective electrodes diluted for sodium in Architect C system analyzer. Completeness of urine collection was based on volume > 500 ml. Data was analyzed using SPSS version 22.
Results: The mean sodium intake measured using 24-hour urine excretion was 2860 (1369) mg/day corresponding to 7.15 g sodium chloride. Prediction of 24-hour urinary sodium from the Kawasaki and Tanaka equation showed a significant but low association with the measured 24-hour urine excretion, r= 0.33, r=0.32 (p< 0.05) respectively. Dietary sodium assessed from the food diary and food frequency questionnaire was 2761(1042) mg/day and 3446 (2748) mg/day respectively. The main sources of dietary salt intake were soy sauce, fried rice, omelet, nasi lemak, and roti canai. By food groups, cooked grains and sauces were major contributors to salt intake. In regards to knowledge, attitude, and practice, most of the respondents had knowledge on serious health problems contributed by high salt intake, especially blood pressure. More than half of the respondents felt that lowering sodium intake was very important. They regularly control their sodium intake and never added salt to the food they ate at the table, but often or always added salt when cooking at home.
Conclusions: Sodium intake among health staff was higher than World Health Organization (WHO) recommendation. The current sodium intake of 6.90g to 7.15g salt / day was higher by 38% to 43% compared to 5g/day as recommended by WHO. Among health staff, soy sauce and cooked food remained the top sodium contributors. The level of knowledge and attitude of the health staff was satisfactory, but the practices towards salt reduction must be improved to achieve the target salt intake of 2000 mg/day by 2025.
Key words: 24-hour urine sodium, food diaries, sodium food frequency questionnaire, spot urine, high sodium food, knowledge, attitude and practice
1.0 INTRODUCTION
Sodium is an essential electrolyte that regulates blood volume and osmotic equilibrium in the human body. However, excessive sodium consumption can cause fluid retention and subsequently increase blood pressure. Conclusive scientific evidence connects excessive consumption of sodium with cardiovascular disease, gastric cancer, osteoporosis, cataract, kidney stones and diabetes [1]. Clinical evidence has also proven salt intake is an independent factor of blood
pressure levels. By cutting down salt intake by less than 2g/day, systolic and diastolic blood pressure can be reduced to 3.47 mmHg to 1.81 mmHg, respectively [2].
The global recommendation suggests reducing salt intake to less than 5g/d (2000mg/day/person) and by at least 30% by 2025 [3]. This position has been endorsed by the United Nations High level Meeting on Non-Communicable Diseases (NCD) as Voluntary Global Targets for the prevention and control of NCDs by reducing salt as a core target [4].
Despite the health risks associated with high salt intake, the general population consumed more sodium than recommended. In 2010, global mean sodium intake among adults was 3.95 (95% CI 3.89-4.01) g/day, equivalent to 10.06 (9.88-10.21) g/d of salt. The Asian regions showed the highest intake of salt, lead by the Central Asia 5.51 (5.11-5.95) g/d, followed by Asia Pacific (Japan and South Korea) 5.00 (95% CI 9.88-10.21) g/d, ( 95% CI 5.11-5.95) g/d.
The Malaysian Adult Nutrition Survey (MANS, 2014) reported sodium intake as assessed using 24 - hour dietary recall among Malaysian adults, was 1935 mg [6]. A smaller scale study was conducted among the Ministry of Health staff in 2012, indicating a sodium intake of 2373 mg/day by diet recall asessment and 3429 mg/day by 24-hour urine test [7].
Many factors that lead to high dietary salt consumption. Social, culture, age, educational level, and income were known factors that determined the behavior of salt consumption[8]. Individual knowledge, attitudes, and behavior were also thought to influence salt intake. These modifiable factors, fortunately, are amendable to change[9].
Measurement of population salt consumption is the key for planning and supervising salt reduction among populations. Several methods of sodium monitoring include 24 - hour urinary sodium determination and food consumption surveys. However, sodium estimation based on food diaries, 24 - hour dietary recall, and food frequency questionnaire underestimate sodium intakes. The consumption of table salt used in cooking also tends to be misjudged [10][11].
The gold standard, 24-hour urine collection method, however is complex and expensive due to participant’s burden. Typically, low response rate might arise as assessments are conducted with random community samples[12]. Due to high burden of labor and difficulty completing 24-hour urine collection, a more practical method, a spot urine test, has been prompted as an alternative method to estimate excreted sodium from 24-hour urine collection [13][14]. The equations derived from various study populations are questionable, and reliability has been poorly validated for an individual sodium intake assessment.
In Malaysia, the report of sodium intake, particularly through urine assessments, is still scarce; moreover, the utilization of spot urine as a urine assessment tool was barely adopted. Regarding the above matter, the determining sodium intake in this current study was assessed using a single 24 – hour urine excretion and spot urine method. Sodium intake was also assessed using a validated food frequency questionnaire and food diary. Knowledge, attitude, and practice of sodium intake were also explored.
10 11
DETERMINATION OF DIETARY SODIUM INTAKE AMONG THE MINISTRY OF HEALTH STAFF DETERMINATION OF DIETARY SODIUM INTAKE AMONG THE MINISTRY OF HEALTH STAFF
Institute for Public Health, Ministry of Health, Malaysia Institute for Public Health, Ministry of Health, Malaysia
2.0 Literature review
Sodium is an essential mineral in the human body and we need 0.23 to 0.46 g/day to fulfill the body’s physiological needs. However, most adult populations consumed sodium more than 2g / day as recommended by the World Health Organization. Hence, it increases the risk of cardiovascular disease, renal stones, osteoporosis, and stomach cancer development [15][16][17]. In many Asian countries, sodium consumption was more than > 4.6 g/day (11.7 g/day salt) [18].
2.1 Sodium intake among Malaysian adults
In Malaysia, the average sodium intake among adults varies, ranging from 1935 mg/day to 3429 mg/day [6][7]. Findings consistently showed men, the East Malaysia population, Bumiputra (Sabah and Sarawak), age 30-39 years old consumed the highest sodium intake as assessed using dietary assessment [7][19]. Based on the findings, sodium intake of Malaysian adults is far lower than the average sodium intake in Asian [20]. However, as the trend of hypertension and obesity escalate in Malaysia [21], controlling sodium intake is one of the most cost effective ways to reduce the prevalence of the non-communicable diseases. In addition, sodium intake in Malaysia generally exceeded the WHO recommendation of 2g/day [22].
2.2 Knowledge, attitude and practice
Dietary behaviors are closely related to social, cultural factors, age, educational level and income factors [23]. The knowledge, attitudes, and behaviors towards dietary salt intake are thought to influence salt consumption. Therefore, identifying population level awareness of sodium control provides evidence that enables the development of effective public education initiatives. Empowering healthier dietary behavior in daily life needs mastery of both knowledge and skills. Disseminating education to population should not be limited to information on health and sodium. It also should be practical and culturally appropriate to change their diet.
2.3 Sodium asessment
a) Urinary sodium
The 24-hour urine samples is considered the “gold standard” to measure 85% - 95% of ingested sodium [24]. However, it is an inconvenient method that may render the participation for urinary assessment. A more feasible option, spot urine method, has been widely adopted in population studies [25][26]. However, it was less accurate than the 24-hour urine measurement. Studies showed large discrepancies of correlation between the 24-hour and spot urine measurement, ranging from r = -0.01 to 0.86 [27]. Two published Japanese equations Tanaka and Kawasaki, were widely used to predict the 24-hour urinary sodium excretion [28][26]. Other formulations developed for the Caucasian population like INTERSALT [29] and PAHO [30] were also commonly applied.
b) Dietary assessment
Sodium intake may also be estimated indirectly from a questionnaire or food consumption records. The measurements include 24-hour diet recall, food diaries, food duplicates, and FFQ. A bias and measurement error with this instrument may arise if food intake was underestimated
or overestimated [31]. The accuracy of the data also relies on the updated food composition databases, since a wide array of food products is available in the market [32][33]. Literatures revealed the correlation between the dietary survey and urinary sodium ranges from r = 0.09 to 0.30 [34][35].
3.0 Methodology
3.1 Study design and sampling
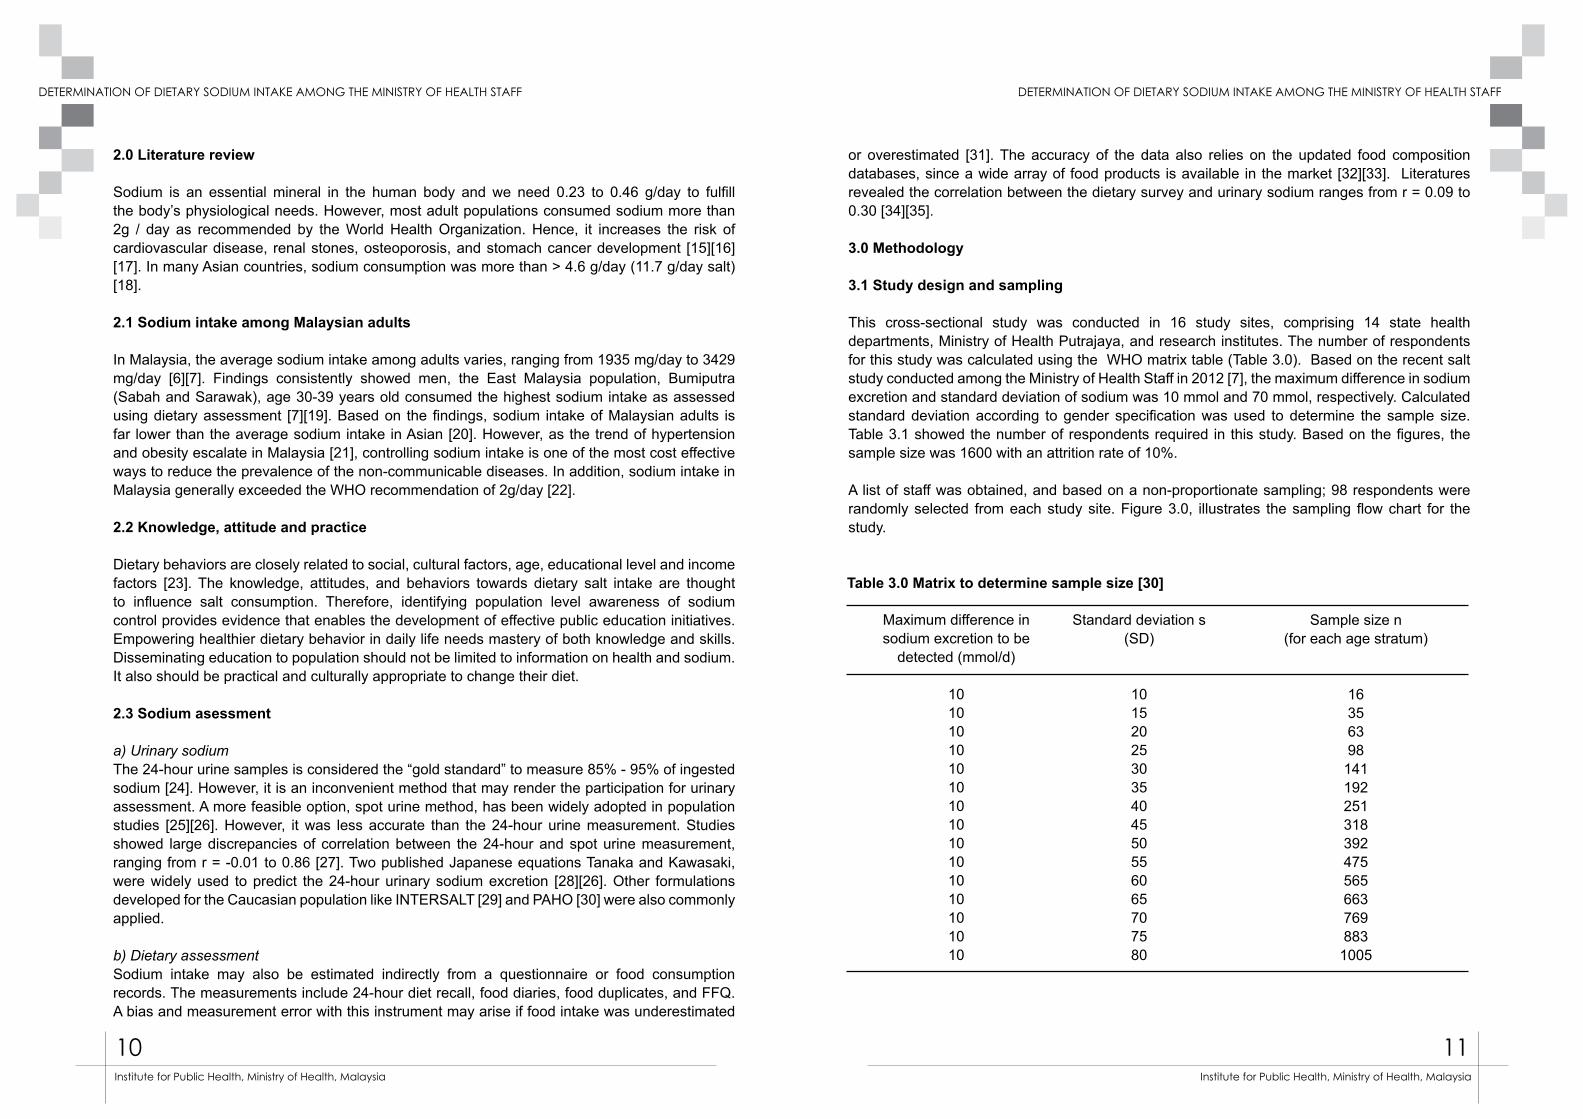
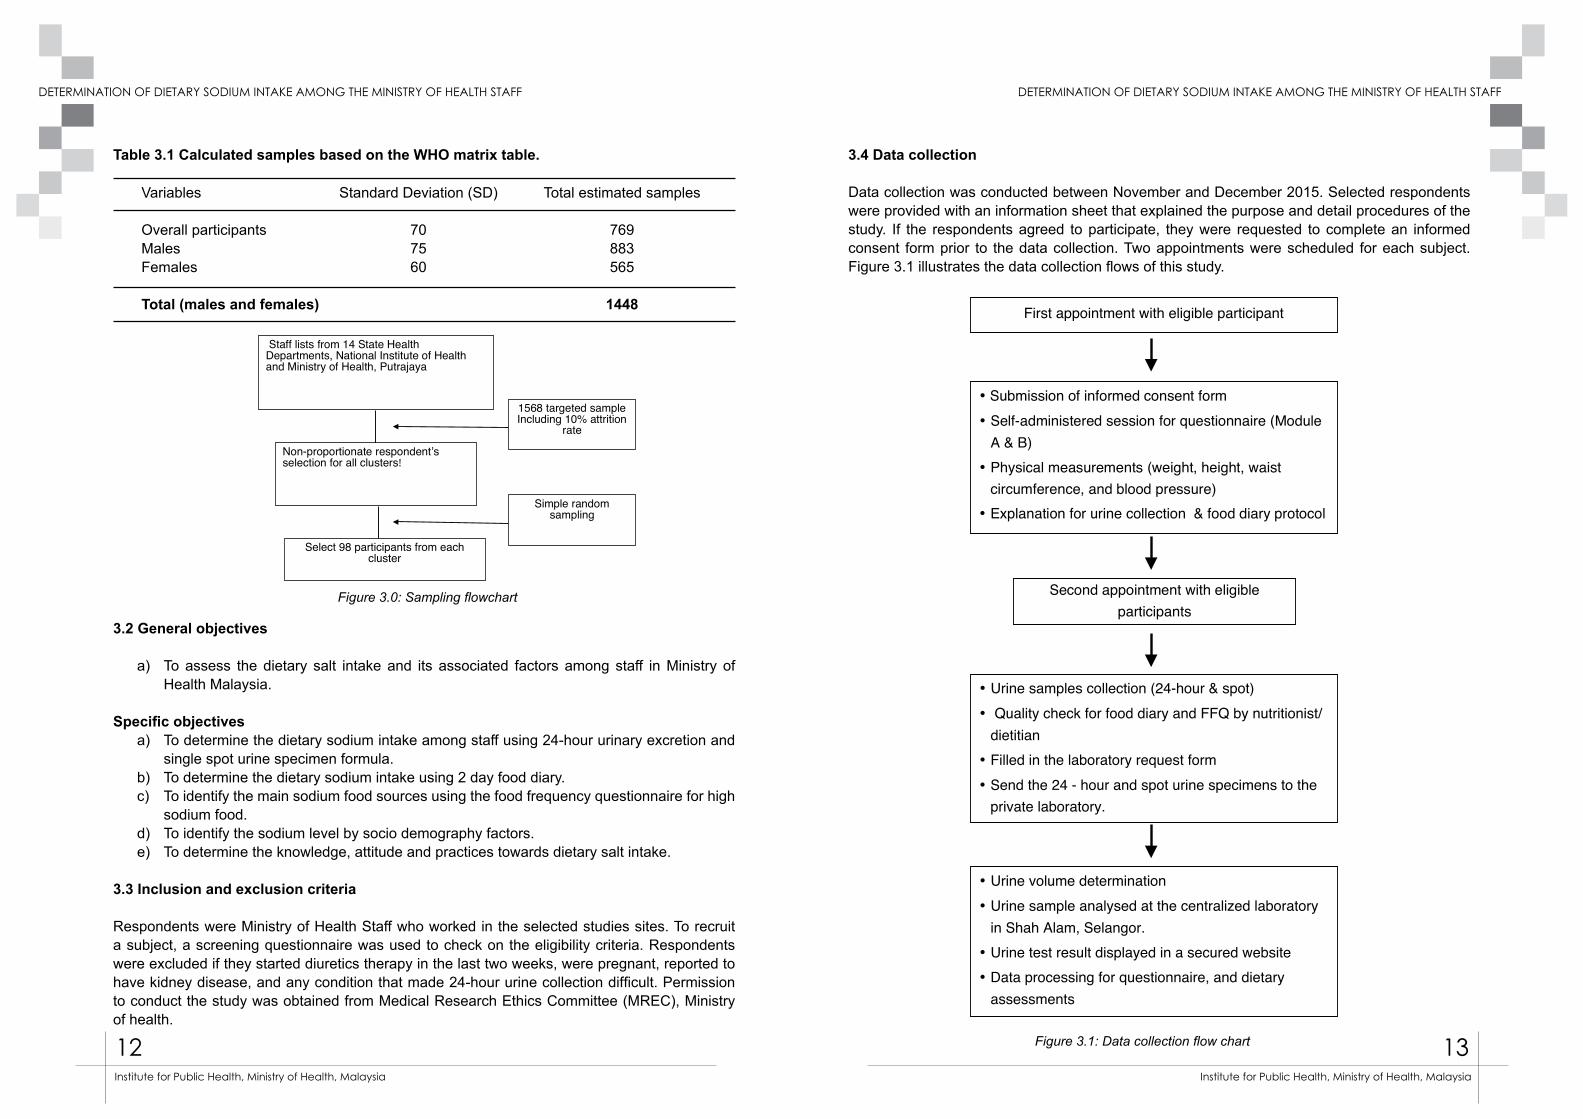
This cross-sectional study was conducted in 16 study sites, comprising 14 state health departments, Ministry of Health Putrajaya, and research institutes. The number of respondents for this study was calculated using the WHO matrix table (Table 3.0). Based on the recent salt study conducted among the Ministry of Health Staff in 2012 [7], the maximum difference in sodium excretion and standard deviation of sodium was 10 mmol and 70 mmol, respectively. Calculated standard deviation according to gender specification was used to determine the sample size. Table 3.1 showed the number of respondents required in this study. Based on the figures, the sample size was 1600 with an attrition rate of 10%.
A list of staff was obtained, and based on a non-proportionate sampling; 98 respondents were randomly selected from each study site. Figure 3.0, illustrates the sampling flow chart for the study.
Maximum difference in sodium excretion to be
detected (mmol/d)
101010101010101010101010101010
Standard deviation s(SD)
101520253035404550556065707580
Sample size n(for each age stratum)
16356398141192251318392475565663769883
1005
Table 3.0 Matrix to determine sample size [30]
12 13
DETERMINATION OF DIETARY SODIUM INTAKE AMONG THE MINISTRY OF HEALTH STAFF DETERMINATION OF DIETARY SODIUM INTAKE AMONG THE MINISTRY OF HEALTH STAFF
Institute for Public Health, Ministry of Health, Malaysia Institute for Public Health, Ministry of Health, Malaysia
Variables
Overall participantsMalesFemales
Total (males and females)
Standard Deviation (SD)
707560
Total estimated samples
769883565
1448
Table 3.1 Calculated samples based on the WHO matrix table.
Figure 3.0: Sampling flowchart
3.2 General objectives
a) To assess the dietary salt intake and its associated factors among staff in Ministry of Health Malaysia.
Specific objectivesa) To determine the dietary sodium intake among staff using 24-hour urinary excretion and
single spot urine specimen formula.b) To determine the dietary sodium intake using 2 day food diary.c) To identify the main sodium food sources using the food frequency questionnaire for high
sodium food.d) To identify the sodium level by socio demography factors.e) To determine the knowledge, attitude and practices towards dietary salt intake.
3.3 Inclusion and exclusion criteria
Respondents were Ministry of Health Staff who worked in the selected studies sites. To recruit a subject, a screening questionnaire was used to check on the eligibility criteria. Respondents were excluded if they started diuretics therapy in the last two weeks, were pregnant, reported to have kidney disease, and any condition that made 24-hour urine collection difficult. Permission to conduct the study was obtained from Medical Research Ethics Committee (MREC), Ministry of health.
Staff lists from 14 State Health
Departments, National Institute of Health
and Ministry of Health, Putrajaya
Non-proportionate respondent’s
selection for all clusters!
1568 targeted sample
Including 10% attrition
rate
Simple random
sampling
Select 98 participants from each
cluster
3.4 Data collection
Data collection was conducted between November and December 2015. Selected respondents were provided with an information sheet that explained the purpose and detail procedures of the study. If the respondents agreed to participate, they were requested to complete an informed consent form prior to the data collection. Two appointments were scheduled for each subject. Figure 3.1 illustrates the data collection flows of this study.
Figure 3.1: Data collection flow chart
First appointment with eligible participant
• Submission of informed consent form
• Self-administered session for questionnaire (Module
A & B)
• Physical measurements (weight, height, waist
circumference, and blood pressure)
• Explanation for urine collection & food diary protocol
Second appointment with eligible
participants
• Urine samples collection (24-hour & spot)
• Quality check for food diary and FFQ by nutritionist/
dietitian
• Filled in the laboratory request form
• Send the 24 - hour and spot urine specimens to the
private laboratory.
• Urine volume determination
• Urine sample analysed at the centralized laboratory
in Shah Alam, Selangor.
• Urine test result displayed in a secured website
• Data processing for questionnaire, and dietary
assessments
14 15
DETERMINATION OF DIETARY SODIUM INTAKE AMONG THE MINISTRY OF HEALTH STAFF DETERMINATION OF DIETARY SODIUM INTAKE AMONG THE MINISTRY OF HEALTH STAFF
Institute for Public Health, Ministry of Health, Malaysia Institute for Public Health, Ministry of Health, Malaysia
Module A and B were self-administered questionnaires. They contained socio – demographic information, such as age, sex, ethnicity, and academic qualification. Medical histories, including any diuretic consumption and pregnancy status among women, were also obtained. Module C assessed the level of knowledge, attitude, and practice towards sodium using a validated questionnaire adapted from WHO.
Module D comprised of physical measurements (body weight, body height, waist circumference and blood pressure. Body weight and height were measured using a calibrated digital weighing scale and SECA stadiometer. Waist circumference was measured using a SECA measuring tape (SECA 201, Germany) Measurements were done in duplicate and a mean reading rounded to the nearest 0.1cm was computed. Weight and height was used to compute the BMI. Blood pressure was measured using a digital automatic blood pressure monitor (Omron HEM-7221) with an appropriate cuff size. Two blood pressure measurements were taken from the right arm of the seated respondents. The mean of the reading will be used for analysis.
Module E consisted a validated FFQ with a list of common high sodium content adapted from a previous study [36]. The questionnaire contained 11 food groups with 102 high sodium food items, self-administered by respondents and subsequently reviewed by the trained nutritionists / dietitians. In this FFQ, respondents filled in the number of food servings taken in day/week/month for the past one month. The estimated sodium intake was then calculated by multiplying the sodium content per serving to number of servings taken on per day basis. The following formula was used to obtain the level of sodium from the diet: (Frequency of food item intake /day) x (portion size in gram) x (sodium content/100 g)/100) [7]
Module F contained two sets of food diaries. Participants were instructed to fill in their food intake during one weekday and one weekend. To measure correlation of sodium in intake and urine, at least one of the selected dates would be the day of 24-hour urine collection. Dietary intake was then analyzed using Nutritionist Pro™ Nutrition Analysis Software (First Data Bank, USA). For
3.5 Study instruments
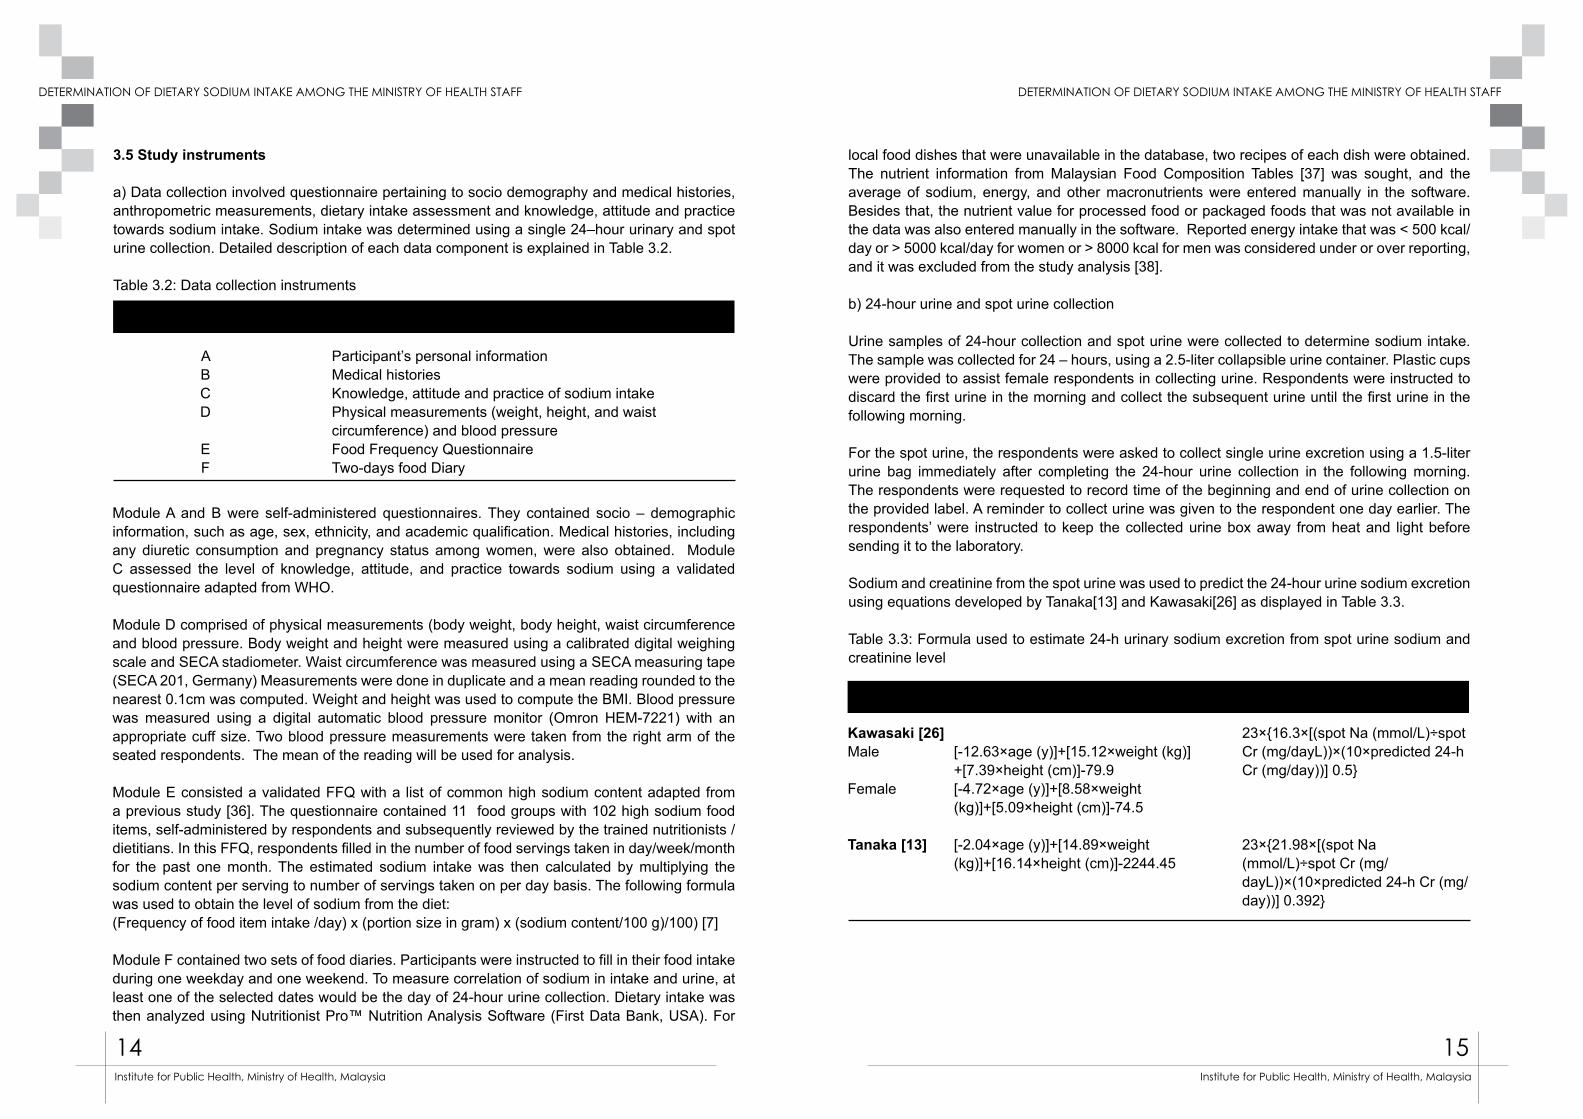
a) Data collection involved questionnaire pertaining to socio demography and medical histories, anthropometric measurements, dietary intake assessment and knowledge, attitude and practice towards sodium intake. Sodium intake was determined using a single 24–hour urinary and spot urine collection. Detailed description of each data component is explained in Table 3.2.
Table 3.2: Data collection instruments
Module
ABCD
EF
Information
Participant’s personal informationMedical historiesKnowledge, attitude and practice of sodium intakePhysical measurements (weight, height, and waist circumference) and blood pressureFood Frequency QuestionnaireTwo-days food Diary
Formulae Predicted 24-h creatinine excretion Predicted 24-h sodium excretion
local food dishes that were unavailable in the database, two recipes of each dish were obtained. The nutrient information from Malaysian Food Composition Tables [37] was sought, and the average of sodium, energy, and other macronutrients were entered manually in the software. Besides that, the nutrient value for processed food or packaged foods that was not available in the data was also entered manually in the software. Reported energy intake that was < 500 kcal/day or > 5000 kcal/day for women or > 8000 kcal for men was considered under or over reporting, and it was excluded from the study analysis [38].
b) 24-hour urine and spot urine collection
Urine samples of 24-hour collection and spot urine were collected to determine sodium intake. The sample was collected for 24 – hours, using a 2.5-liter collapsible urine container. Plastic cups were provided to assist female respondents in collecting urine. Respondents were instructed to discard the first urine in the morning and collect the subsequent urine until the first urine in the following morning.
For the spot urine, the respondents were asked to collect single urine excretion using a 1.5-liter urine bag immediately after completing the 24-hour urine collection in the following morning. The respondents were requested to record time of the beginning and end of urine collection on the provided label. A reminder to collect urine was given to the respondent one day earlier. The respondents’ were instructed to keep the collected urine box away from heat and light before sending it to the laboratory.
Sodium and creatinine from the spot urine was used to predict the 24-hour urine sodium excretion using equations developed by Tanaka[13] and Kawasaki[26] as displayed in Table 3.3.
Table 3.3: Formula used to estimate 24-h urinary sodium excretion from spot urine sodium and creatinine level
23×{16.3×[(spot Na (mmol/L)÷spot Cr (mg/dayL))×(10×predicted 24-h Cr (mg/day))] 0.5}
23×{21.98×[(spot Na (mmol/L)÷spot Cr (mg/dayL))×(10×predicted 24-h Cr (mg/day))] 0.392}
[-12.63×age (y)]+[15.12×weight (kg)]+[7.39×height (cm)]-79.9[-4.72×age (y)]+[8.58×weight (kg)]+[5.09×height (cm)]-74.5
[-2.04×age (y)]+[14.89×weight (kg)]+[16.14×height (cm)]-2244.45
Kawasaki [26]Male
Female
Tanaka [13]
16 17
DETERMINATION OF DIETARY SODIUM INTAKE AMONG THE MINISTRY OF HEALTH STAFF DETERMINATION OF DIETARY SODIUM INTAKE AMONG THE MINISTRY OF HEALTH STAFF
Institute for Public Health, Ministry of Health, Malaysia Institute for Public Health, Ministry of Health, Malaysia
The urine samples were brought to the operational room at each study site. The samples were checked and identified before sending to an identified laboratory in Shah Alam, Selangor. In the laboratory, the urine volume was measured and 30 ml aliquot from each sample was preserved in a 4°c refrigerator before being transported to the centralized laboratory in Shah Alam, Selangor on the same day for analysis. Quality control was applied in order to assure specimens received were safe, adequate and attached with respondents’ identification. A complete 24-hour urine sample was defined as urinary volume more than or equal to 500 ml, no menstruation during the collection period, and reported length of collection over 20 hours.
Sodium was determined by using ion selective electrodes diluted for sodium in Architect C, System Analyzer. An electrical potential (voltage) was developed across the membranes between the reference and measuring electrodes. The voltage is then compared to previously determined calibrator voltages and converted into ion concentration. Creatinine was measured using Kinetic Alkaline Picrate in similar analyzer. At an alkaline pH, creatinine in the sample reacts with picrate to form a creatinine-picrate complex. The rate of increase in absorbance at 500 nm due to formation of this complex is directly proportional to the concentration of creatinine in the sample.The sodium excretion in the 24-hour urine was used to estimate total sodium intake from food. Quantification of daily sodium intake was conducted by multiplying 24 - hour sodium excretion with the factor 100/95, as sodium excretion through urine is, on average, 95 % of the total food intake [39]. The sodium value in mg unit was calculated by multiplying the sodium expressed in mmol with the molecular mass of sodium, 23 g/ mol. Sodium intake was then compared to the Malaysian dietary sodium of 2000 mg/day [40]
3. 6 Data entry and analysis
Statistical analyses were conducted using IBM SPSS version 22. Descriptive statistics was computed in either percentage or mean values with standard deviation (SD). ANOVA analysis was conducted to determine the differences of mean sodium level between several socio-demographic characteristics and the response of knowledge, attitude and practice. Correlation analysis was used to evaluate the association between dietary sodium and 24-hour urinary sodium. The prediction of the 24-hour urinary sodium was determined using equations of Tanaka and Kawasaki. The values were then evaluated for correlation against measured 24-hour urinary sodium. Significance was indicated as two-sided p< 0.05.
3.7 Permission and Grant
This study was reviewed and approved by the National Institute of Health and Medical Research Ethics Committee, Ministry of Health Malaysia with the registration number of NMRR-15-1290-25981 (IIR). Funding for this study was granted from National Institutes for Health (NIH), Ministry of Health Malaysia.
4.0 FINDINGS
4.1 General Findings
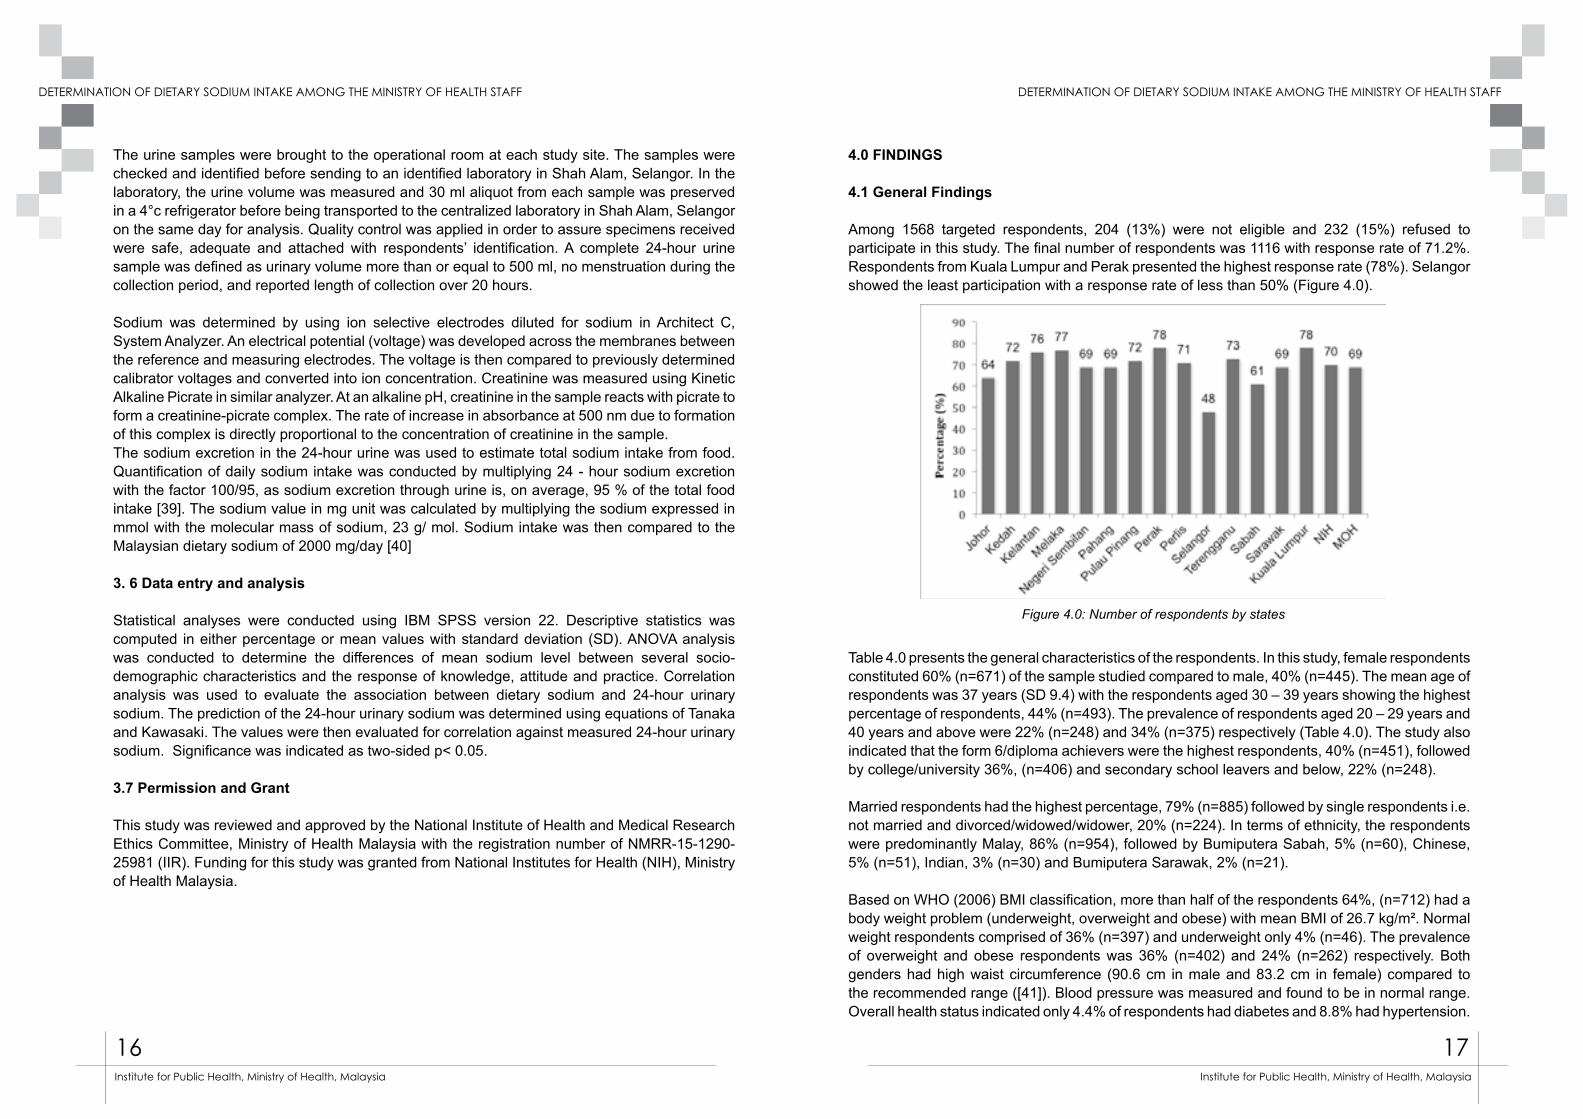
Among 1568 targeted respondents, 204 (13%) were not eligible and 232 (15%) refused to participate in this study. The final number of respondents was 1116 with response rate of 71.2%. Respondents from Kuala Lumpur and Perak presented the highest response rate (78%). Selangor showed the least participation with a response rate of less than 50% (Figure 4.0).
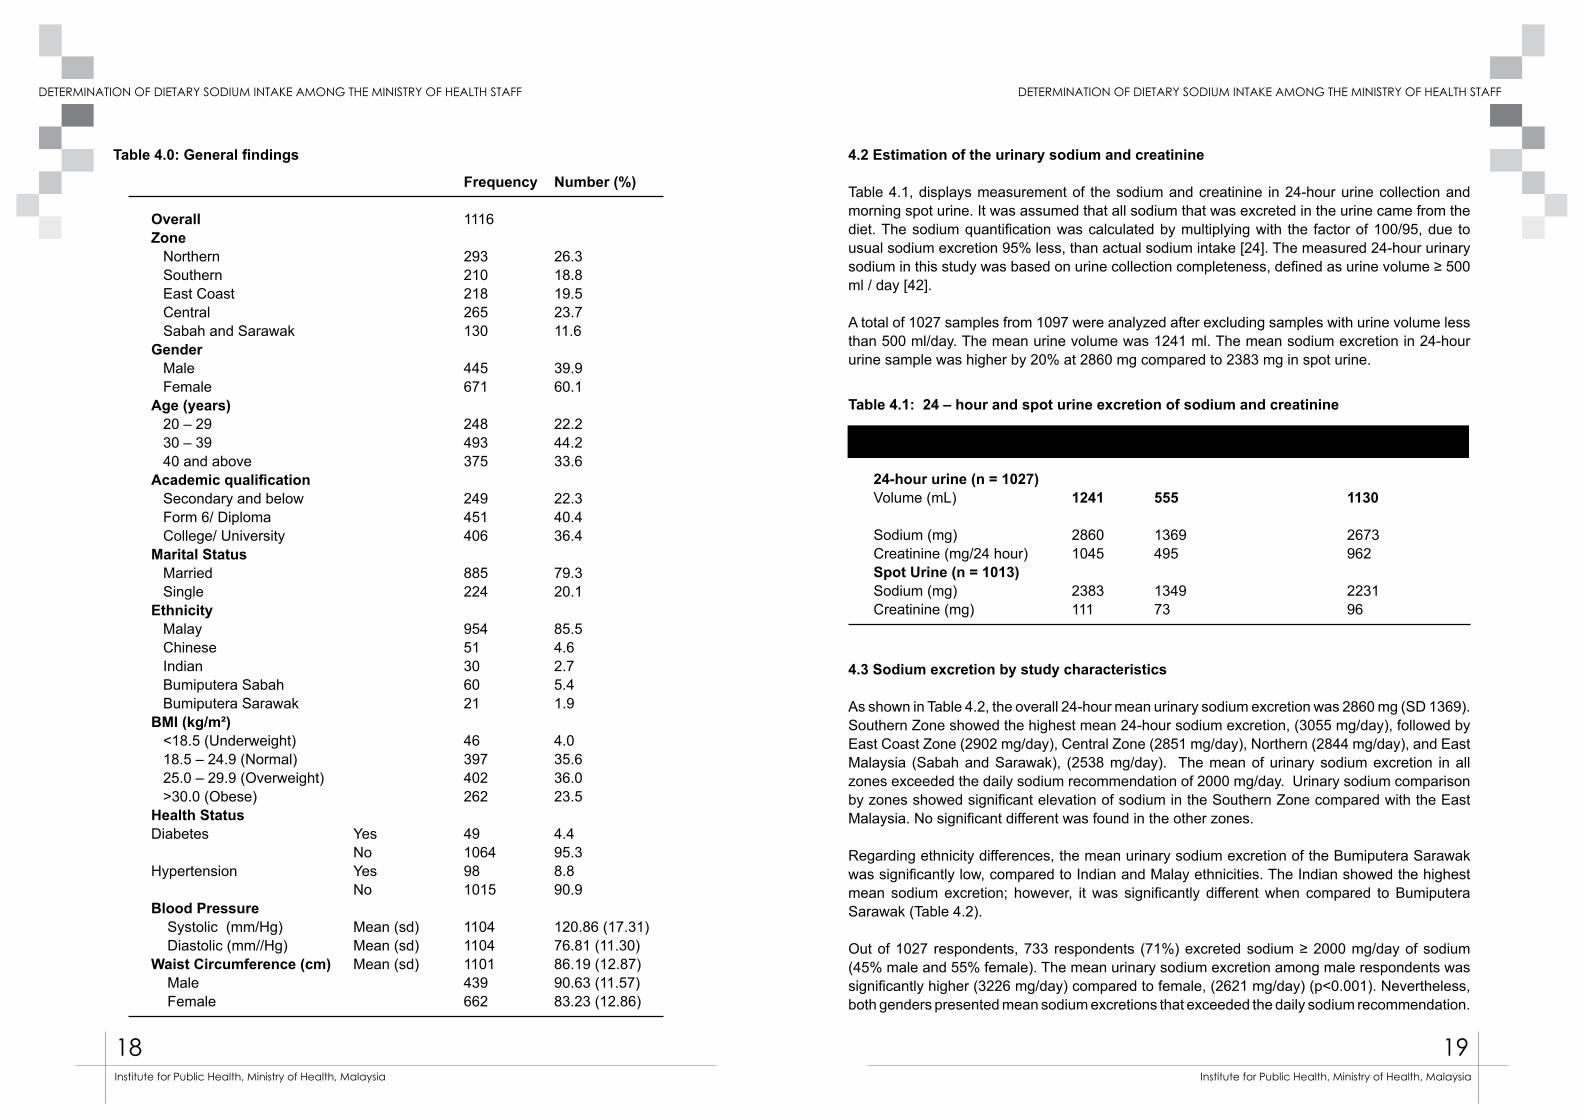
Table 4.0 presents the general characteristics of the respondents. In this study, female respondents constituted 60% (n=671) of the sample studied compared to male, 40% (n=445). The mean age of respondents was 37 years (SD 9.4) with the respondents aged 30 – 39 years showing the highest percentage of respondents, 44% (n=493). The prevalence of respondents aged 20 – 29 years and 40 years and above were 22% (n=248) and 34% (n=375) respectively (Table 4.0). The study also indicated that the form 6/diploma achievers were the highest respondents, 40% (n=451), followed by college/university 36%, (n=406) and secondary school leavers and below, 22% (n=248).
Married respondents had the highest percentage, 79% (n=885) followed by single respondents i.e. not married and divorced/widowed/widower, 20% (n=224). In terms of ethnicity, the respondents were predominantly Malay, 86% (n=954), followed by Bumiputera Sabah, 5% (n=60), Chinese, 5% (n=51), Indian, 3% (n=30) and Bumiputera Sarawak, 2% (n=21).
Based on WHO (2006) BMI classification, more than half of the respondents 64%, (n=712) had a body weight problem (underweight, overweight and obese) with mean BMI of 26.7 kg/m². Normal weight respondents comprised of 36% (n=397) and underweight only 4% (n=46). The prevalence of overweight and obese respondents was 36% (n=402) and 24% (n=262) respectively. Both genders had high waist circumference (90.6 cm in male and 83.2 cm in female) compared to the recommended range ([41]). Blood pressure was measured and found to be in normal range. Overall health status indicated only 4.4% of respondents had diabetes and 8.8% had hypertension.
Figure 4.0: Number of respondents by states
18 19
DETERMINATION OF DIETARY SODIUM INTAKE AMONG THE MINISTRY OF HEALTH STAFF DETERMINATION OF DIETARY SODIUM INTAKE AMONG THE MINISTRY OF HEALTH STAFF
Institute for Public Health, Ministry of Health, Malaysia Institute for Public Health, Ministry of Health, Malaysia
Table 4.0: General findings
Frequency Number (%)
Overall 1116 Zone
Northern 293 26.3Southern 210 18.8East Coast 218 19.5Central 265 23.7Sabah and Sarawak 130 11.6
Gender Male 445 39.9Female 671 60.1
Age (years) 20 – 29 248 22.230 – 39 493 44.240 and above 375 33.6
Academic qualification Secondary and below 249 22.3Form 6/ Diploma 451 40.4College/ University 406 36.4
Marital Status Married 885 79.3Single 224 20.1
Ethnicity Malay 954 85.5Chinese 51 4.6Indian 30 2.7Bumiputera Sabah 60 5.4Bumiputera Sarawak 21 1.9
BMI (kg/m²) <18.5 (Underweight) 46 4.018.5 – 24.9 (Normal) 397 35.625.0 – 29.9 (Overweight) 402 36.0>30.0 (Obese) 262 23.5
Health Status Diabetes Yes 49 4.4 No 1064 95.3Hypertension Yes 98 8.8 No 1015 90.9Blood Pressure Systolic (mm/Hg) Mean (sd) 1104 120.86 (17.31) Diastolic (mm//Hg) Mean (sd) 1104 76.81 (11.30)Waist Circumference (cm) Mean (sd) 1101 86.19 (12.87) Male 439 90.63 (11.57) Female 662 83.23 (12.86)
4.2 Estimation of the urinary sodium and creatinine
Table 4.1, displays measurement of the sodium and creatinine in 24-hour urine collection and morning spot urine. It was assumed that all sodium that was excreted in the urine came from the diet. The sodium quantification was calculated by multiplying with the factor of 100/95, due to usual sodium excretion 95% less, than actual sodium intake [24]. The measured 24-hour urinary sodium in this study was based on urine collection completeness, defined as urine volume ≥ 500 ml / day [42].
A total of 1027 samples from 1097 were analyzed after excluding samples with urine volume less than 500 ml/day. The mean urine volume was 1241 ml. The mean sodium excretion in 24-hour urine sample was higher by 20% at 2860 mg compared to 2383 mg in spot urine.
4.3 Sodium excretion by study characteristics
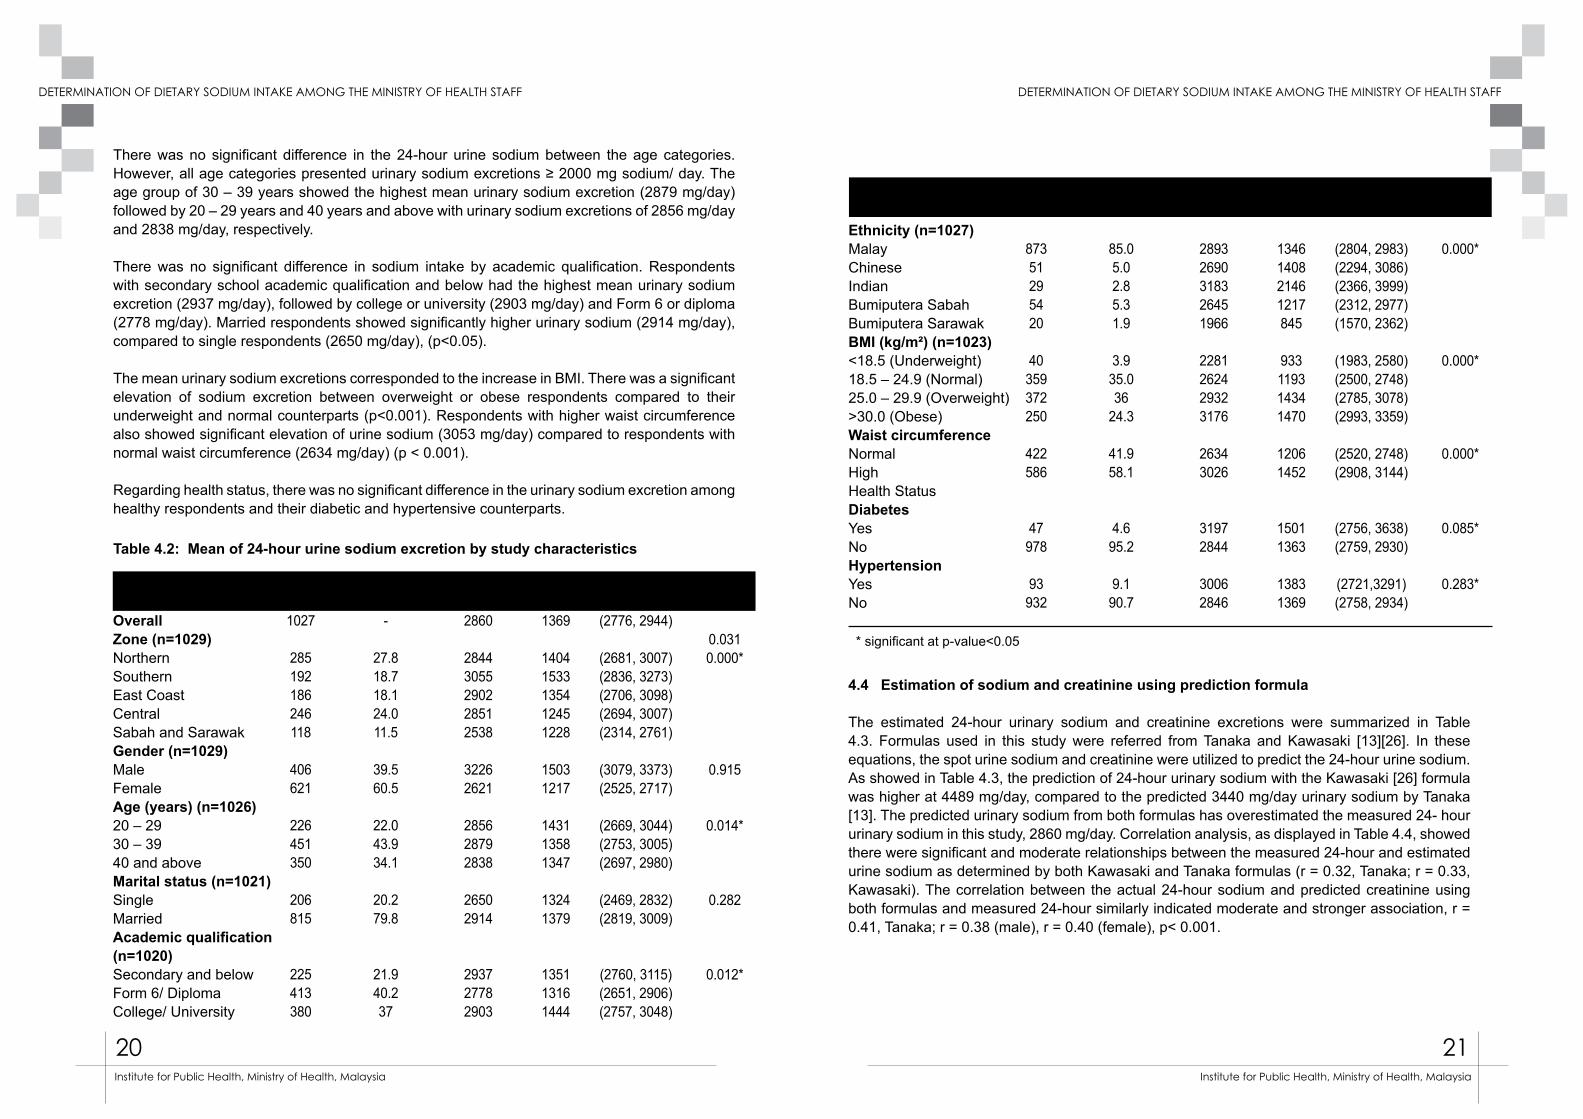
As shown in Table 4.2, the overall 24-hour mean urinary sodium excretion was 2860 mg (SD 1369). Southern Zone showed the highest mean 24-hour sodium excretion, (3055 mg/day), followed by East Coast Zone (2902 mg/day), Central Zone (2851 mg/day), Northern (2844 mg/day), and East Malaysia (Sabah and Sarawak), (2538 mg/day). The mean of urinary sodium excretion in all zones exceeded the daily sodium recommendation of 2000 mg/day. Urinary sodium comparison by zones showed significant elevation of sodium in the Southern Zone compared with the East Malaysia. No significant different was found in the other zones.
Regarding ethnicity differences, the mean urinary sodium excretion of the Bumiputera Sarawak was significantly low, compared to Indian and Malay ethnicities. The Indian showed the highest mean sodium excretion; however, it was significantly different when compared to Bumiputera Sarawak (Table 4.2).
Out of 1027 respondents, 733 respondents (71%) excreted sodium ≥ 2000 mg/day of sodium (45% male and 55% female). The mean urinary sodium excretion among male respondents was significantly higher (3226 mg/day) compared to female, (2621 mg/day) (p<0.001). Nevertheless, both genders presented mean sodium excretions that exceeded the daily sodium recommendation.
Table 4.1: 24 – hour and spot urine excretion of sodium and creatinine
Urine Sample Mean Standard Deviation Median
24-hour urine (n = 1027) Volume (mL) 1241 555 1130 Sodium (mg) 2860 1369 2673Creatinine (mg/24 hour) 1045 495 962Spot Urine (n = 1013)Sodium (mg) 2383 1349 2231Creatinine (mg) 111 73 96
20 21
DETERMINATION OF DIETARY SODIUM INTAKE AMONG THE MINISTRY OF HEALTH STAFF DETERMINATION OF DIETARY SODIUM INTAKE AMONG THE MINISTRY OF HEALTH STAFF
Institute for Public Health, Ministry of Health, Malaysia Institute for Public Health, Ministry of Health, Malaysia
There was no significant difference in the 24-hour urine sodium between the age categories. However, all age categories presented urinary sodium excretions ≥ 2000 mg sodium/ day. The age group of 30 – 39 years showed the highest mean urinary sodium excretion (2879 mg/day) followed by 20 – 29 years and 40 years and above with urinary sodium excretions of 2856 mg/day and 2838 mg/day, respectively.
There was no significant difference in sodium intake by academic qualification. Respondents with secondary school academic qualification and below had the highest mean urinary sodium excretion (2937 mg/day), followed by college or university (2903 mg/day) and Form 6 or diploma (2778 mg/day). Married respondents showed significantly higher urinary sodium (2914 mg/day), compared to single respondents (2650 mg/day), (p<0.05).
The mean urinary sodium excretions corresponded to the increase in BMI. There was a significant elevation of sodium excretion between overweight or obese respondents compared to their underweight and normal counterparts (p<0.001). Respondents with higher waist circumference also showed significant elevation of urine sodium (3053 mg/day) compared to respondents with normal waist circumference (2634 mg/day) (p < 0.001).
Regarding health status, there was no significant difference in the urinary sodium excretion among healthy respondents and their diabetic and hypertensive counterparts.
OverallZone (n=1029)NorthernSouthernEast CoastCentralSabah and SarawakGender (n=1029)MaleFemaleAge (years) (n=1026)20 – 2930 – 3940 and aboveMarital status (n=1021)SingleMarriedAcademic qualification (n=1020)Secondary and belowForm 6/ DiplomaCollege/ University
Ethnicity (n=1027)MalayChineseIndianBumiputera SabahBumiputera SarawakBMI (kg/m²) (n=1023)<18.5 (Underweight)18.5 – 24.9 (Normal)25.0 – 29.9 (Overweight)>30.0 (Obese)Waist circumference NormalHighHealth StatusDiabetesYesNoHypertensionYesNo
Frequency
1027
285192186246118
406621
226451350
206815
225413380
87351295420
40359372250
422586
47978
93932
Percentage(%)
-
27.818.718.124.011.5
39.560.5
22.043.934.1
20.279.8
21.940.237
85.05.02.85.31.9
3.935.036
24.3
41.958.1
4.695.2
9.190.7
Mean sodium(mg)2860
28443055290228512538
32262621
285628792838
26502914
293727782903
28932690318326451966
2281262429323176
26343026
31972844
30062846
SD
1369
14041533135412451228
15031217
143113581347
13241379
135113161444
1346140821461217845
933119314341470
12061452
15011363
13831369
95% CI (Lower, upper)(2776, 2944)
(2681, 3007)(2836, 3273)(2706, 3098)(2694, 3007)(2314, 2761)
(3079, 3373)(2525, 2717)
(2669, 3044)(2753, 3005)(2697, 2980)
(2469, 2832)(2819, 3009)
(2760, 3115)(2651, 2906)(2757, 3048)
(2804, 2983)(2294, 3086)(2366, 3999)(2312, 2977)(1570, 2362)
(1983, 2580)(2500, 2748)(2785, 3078)(2993, 3359)
(2520, 2748)(2908, 3144)
(2756, 3638)(2759, 2930)
(2721,3291)(2758, 2934)
p-value
0.0310.000*
0.915
0.014*
0.282
0.012*
0.000*
0.000*
0.000*
0.085*
0.283*
Table 4.2: Mean of 24-hour urine sodium excretion by study characteristics
4.4 Estimation of sodium and creatinine using prediction formula
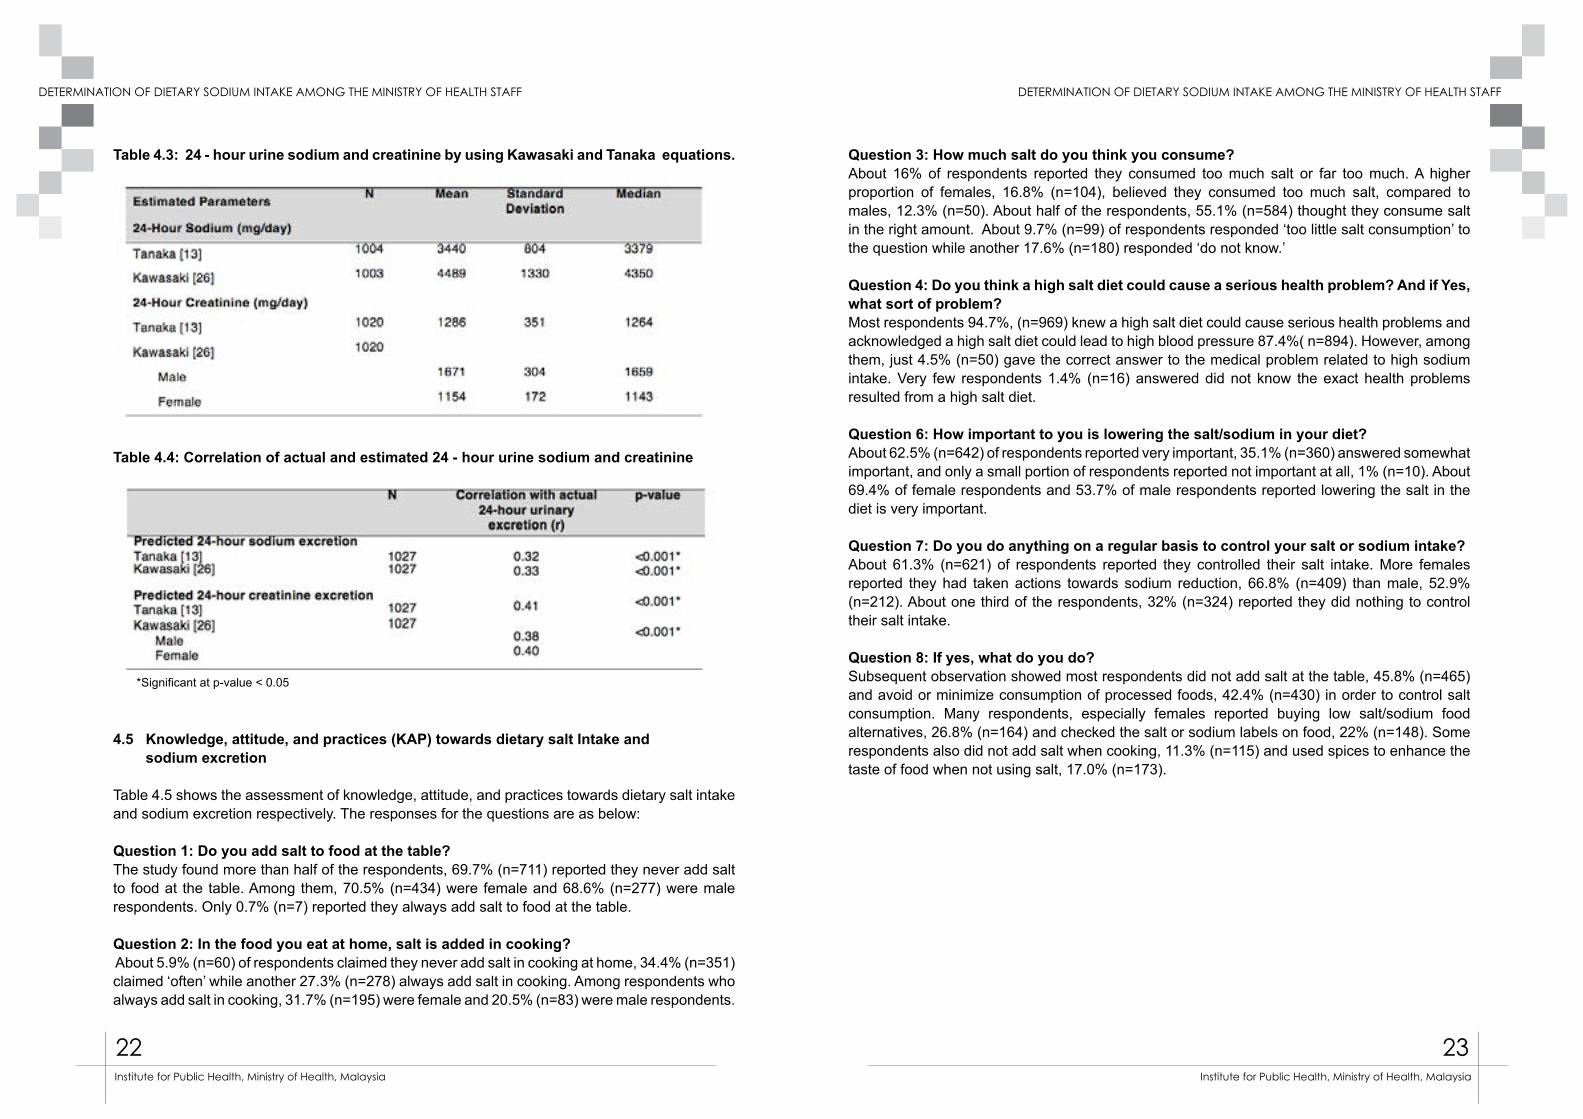
The estimated 24-hour urinary sodium and creatinine excretions were summarized in Table 4.3. Formulas used in this study were referred from Tanaka and Kawasaki [13][26]. In these equations, the spot urine sodium and creatinine were utilized to predict the 24-hour urine sodium. As showed in Table 4.3, the prediction of 24-hour urinary sodium with the Kawasaki [26] formula was higher at 4489 mg/day, compared to the predicted 3440 mg/day urinary sodium by Tanaka [13]. The predicted urinary sodium from both formulas has overestimated the measured 24- hour urinary sodium in this study, 2860 mg/day. Correlation analysis, as displayed in Table 4.4, showed there were significant and moderate relationships between the measured 24-hour and estimated urine sodium as determined by both Kawasaki and Tanaka formulas (r = 0.32, Tanaka; r = 0.33, Kawasaki). The correlation between the actual 24-hour sodium and predicted creatinine using both formulas and measured 24-hour similarly indicated moderate and stronger association, r = 0.41, Tanaka; r = 0.38 (male), r = 0.40 (female), p< 0.001.
Frequency Percentage(%)
Mean sodium(mg)
SD 95% CI (Lower, upper)
p-value
* significant at p-value<0.05
22 23
DETERMINATION OF DIETARY SODIUM INTAKE AMONG THE MINISTRY OF HEALTH STAFF DETERMINATION OF DIETARY SODIUM INTAKE AMONG THE MINISTRY OF HEALTH STAFF
Institute for Public Health, Ministry of Health, Malaysia Institute for Public Health, Ministry of Health, Malaysia
Table 4.3: 24 - hour urine sodium and creatinine by using Kawasaki and Tanaka equations.
Table 4.4: Correlation of actual and estimated 24 - hour urine sodium and creatinine
4.5 Knowledge, attitude, and practices (KAP) towards dietary salt Intake and sodium excretion
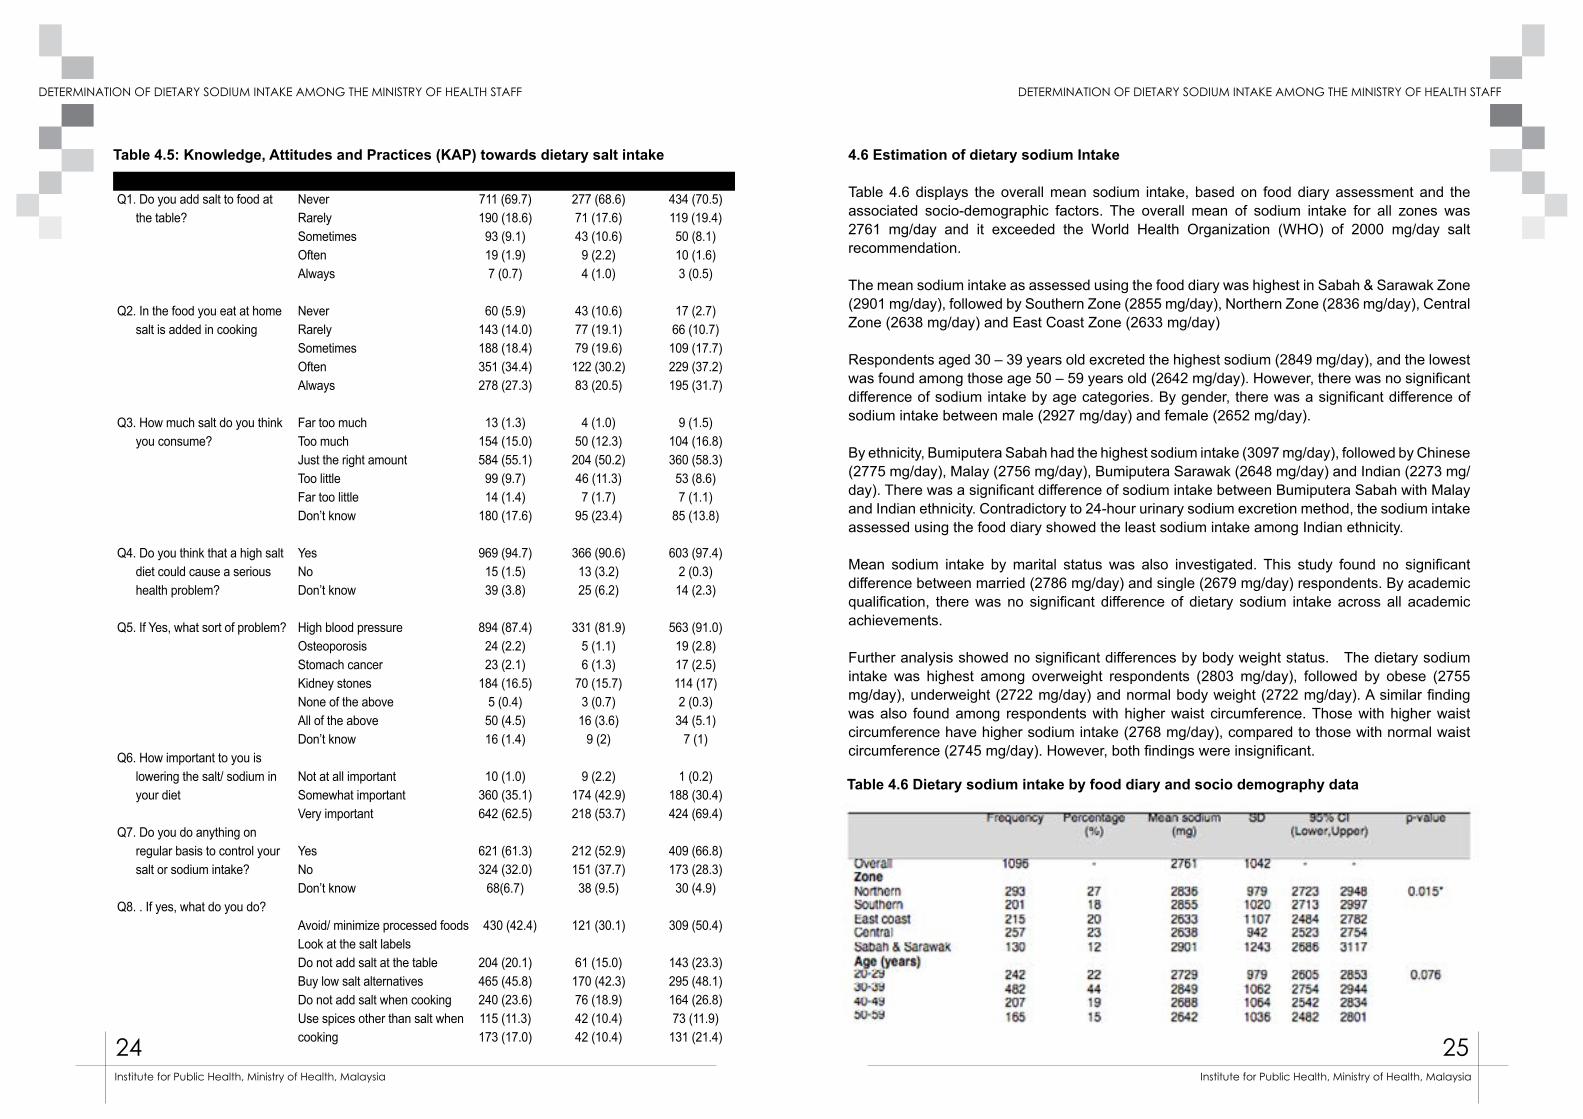
Table 4.5 shows the assessment of knowledge, attitude, and practices towards dietary salt intake and sodium excretion respectively. The responses for the questions are as below:
Question 1: Do you add salt to food at the table?The study found more than half of the respondents, 69.7% (n=711) reported they never add salt to food at the table. Among them, 70.5% (n=434) were female and 68.6% (n=277) were male respondents. Only 0.7% (n=7) reported they always add salt to food at the table.
Question 2: In the food you eat at home, salt is added in cooking? About 5.9% (n=60) of respondents claimed they never add salt in cooking at home, 34.4% (n=351) claimed ‘often’ while another 27.3% (n=278) always add salt in cooking. Among respondents who always add salt in cooking, 31.7% (n=195) were female and 20.5% (n=83) were male respondents.
Question 3: How much salt do you think you consume? About 16% of respondents reported they consumed too much salt or far too much. A higher proportion of females, 16.8% (n=104), believed they consumed too much salt, compared to males, 12.3% (n=50). About half of the respondents, 55.1% (n=584) thought they consume salt in the right amount. About 9.7% (n=99) of respondents responded ‘too little salt consumption’ to the question while another 17.6% (n=180) responded ‘do not know.’ Question 4: Do you think a high salt diet could cause a serious health problem? And if Yes, what sort of problem?Most respondents 94.7%, (n=969) knew a high salt diet could cause serious health problems and acknowledged a high salt diet could lead to high blood pressure 87.4%( n=894). However, among them, just 4.5% (n=50) gave the correct answer to the medical problem related to high sodium intake. Very few respondents 1.4% (n=16) answered did not know the exact health problems resulted from a high salt diet.
Question 6: How important to you is lowering the salt/sodium in your diet?About 62.5% (n=642) of respondents reported very important, 35.1% (n=360) answered somewhat important, and only a small portion of respondents reported not important at all, 1% (n=10). About 69.4% of female respondents and 53.7% of male respondents reported lowering the salt in the diet is very important.
Question 7: Do you do anything on a regular basis to control your salt or sodium intake? About 61.3% (n=621) of respondents reported they controlled their salt intake. More females reported they had taken actions towards sodium reduction, 66.8% (n=409) than male, 52.9% (n=212). About one third of the respondents, 32% (n=324) reported they did nothing to control their salt intake. Question 8: If yes, what do you do? Subsequent observation showed most respondents did not add salt at the table, 45.8% (n=465) and avoid or minimize consumption of processed foods, 42.4% (n=430) in order to control salt consumption. Many respondents, especially females reported buying low salt/sodium food alternatives, 26.8% (n=164) and checked the salt or sodium labels on food, 22% (n=148). Some respondents also did not add salt when cooking, 11.3% (n=115) and used spices to enhance the taste of food when not using salt, 17.0% (n=173).
*Significant at p-value < 0.05
24 25
DETERMINATION OF DIETARY SODIUM INTAKE AMONG THE MINISTRY OF HEALTH STAFF DETERMINATION OF DIETARY SODIUM INTAKE AMONG THE MINISTRY OF HEALTH STAFF
Institute for Public Health, Ministry of Health, Malaysia Institute for Public Health, Ministry of Health, Malaysia
QuestionsQ1. Do you add salt to food at
the table?
Q2. In the food you eat at home salt is added in cooking
Q3. How much salt do you think you consume?
Q4. Do you think that a high salt diet could cause a serious health problem?
Q5. If Yes, what sort of problem?
Q6. How important to you is lowering the salt/ sodium in your diet
Q7. Do you do anything on regular basis to control your salt or sodium intake?
Q8. . If yes, what do you do?
NeverRarelySometimesOftenAlways
NeverRarelySometimesOftenAlways
Far too muchToo muchJust the right amountToo littleFar too littleDon’t know
YesNo Don’t know
High blood pressureOsteoporosisStomach cancerKidney stonesNone of the aboveAll of the aboveDon’t know
Not at all important Somewhat important Very important
YesNoDon’t know
Avoid/ minimize processed foodsLook at the salt labels Do not add salt at the tableBuy low salt alternativesDo not add salt when cooking Use spices other than salt when cooking
Total711 (69.7)190 (18.6)93 (9.1)19 (1.9)7 (0.7)
60 (5.9)143 (14.0)188 (18.4)351 (34.4)278 (27.3)
13 (1.3)154 (15.0)584 (55.1)99 (9.7)14 (1.4)
180 (17.6)
969 (94.7)15 (1.5)39 (3.8)
894 (87.4)24 (2.2)23 (2.1)
184 (16.5)5 (0.4)50 (4.5)16 (1.4)
10 (1.0)360 (35.1)642 (62.5)
621 (61.3)324 (32.0)
68(6.7)
430 (42.4)
204 (20.1)465 (45.8)240 (23.6)115 (11.3)173 (17.0)
Men277 (68.6)71 (17.6)43 (10.6)9 (2.2)4 (1.0)
43 (10.6)77 (19.1)79 (19.6)122 (30.2)83 (20.5)
4 (1.0)50 (12.3)204 (50.2)46 (11.3)7 (1.7)
95 (23.4)
366 (90.6)13 (3.2)25 (6.2)
331 (81.9)5 (1.1)6 (1.3)
70 (15.7)3 (0.7)16 (3.6)
9 (2)
9 (2.2)174 (42.9)218 (53.7)
212 (52.9)151 (37.7)38 (9.5)
121 (30.1)
61 (15.0)170 (42.3)76 (18.9)42 (10.4)42 (10.4)
Women434 (70.5)119 (19.4)50 (8.1)10 (1.6)3 (0.5)
17 (2.7)66 (10.7)109 (17.7)229 (37.2)195 (31.7)
9 (1.5)104 (16.8)360 (58.3)53 (8.6)7 (1.1)
85 (13.8)
603 (97.4)2 (0.3)14 (2.3)
563 (91.0)19 (2.8)17 (2.5)114 (17)2 (0.3)34 (5.1)
7 (1)
1 (0.2)188 (30.4)424 (69.4)
409 (66.8)173 (28.3)30 (4.9)
309 (50.4)
143 (23.3)295 (48.1)164 (26.8)73 (11.9)
131 (21.4)
Table 4.5: Knowledge, Attitudes and Practices (KAP) towards dietary salt intake 4.6 Estimation of dietary sodium Intake
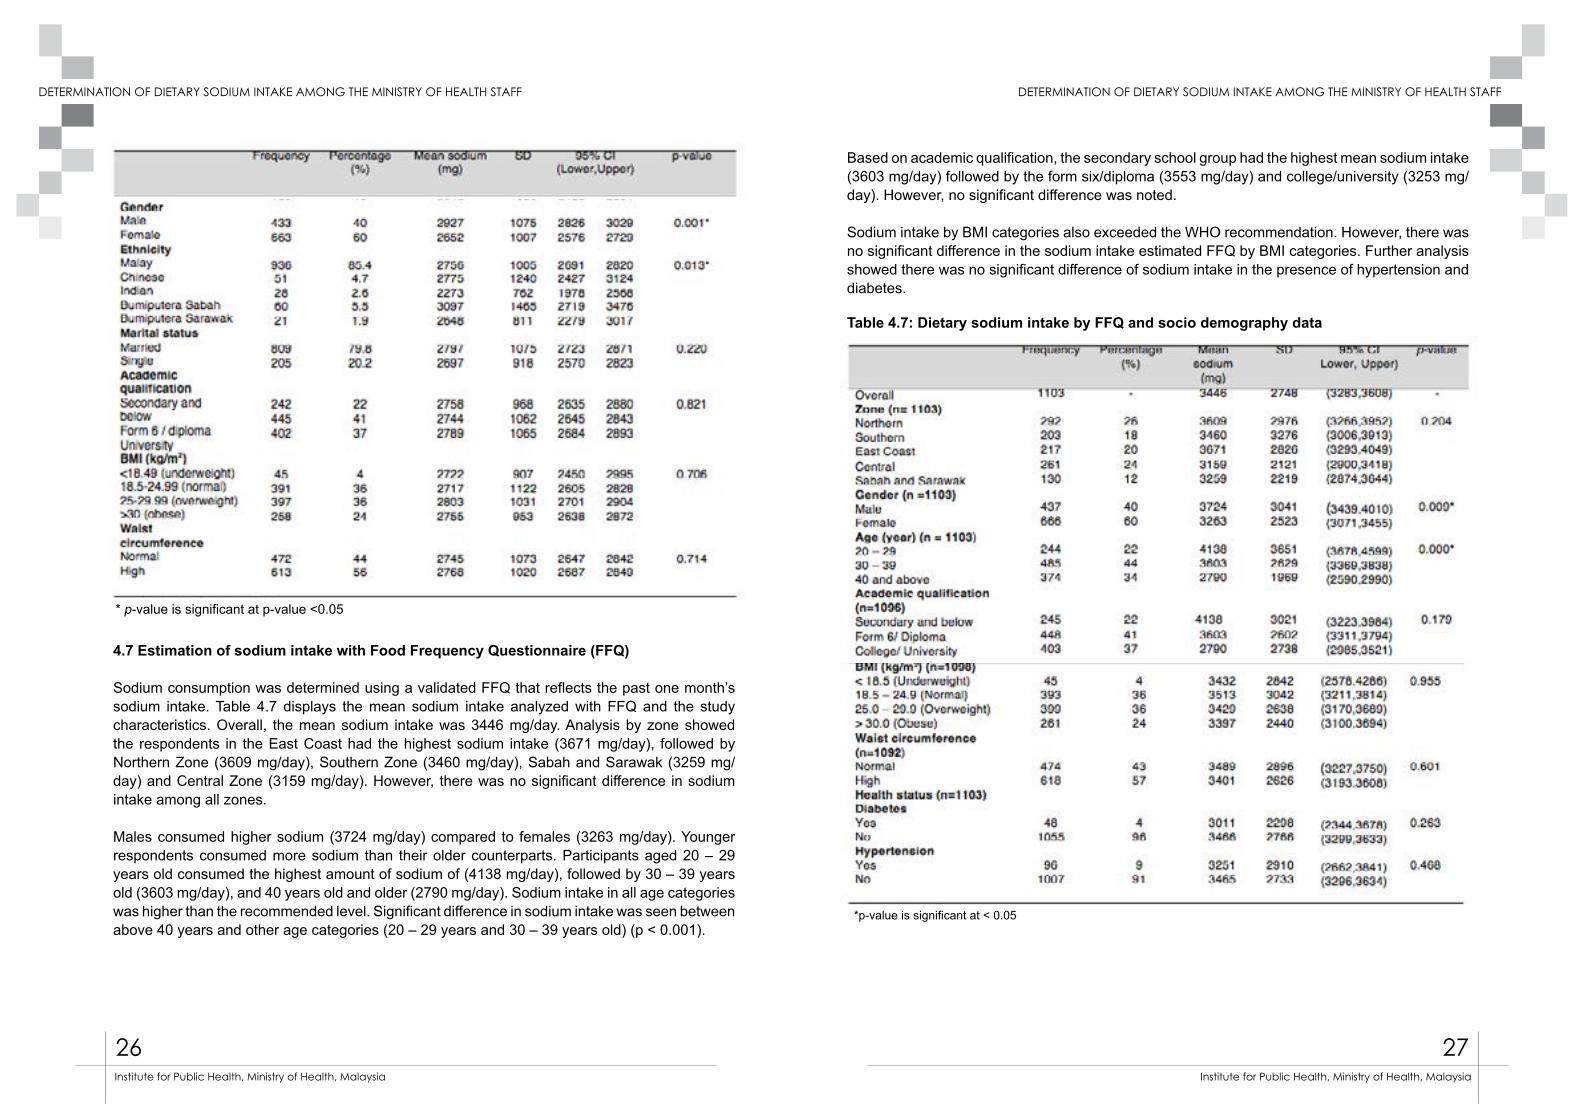
Table 4.6 displays the overall mean sodium intake, based on food diary assessment and the associated socio-demographic factors. The overall mean of sodium intake for all zones was 2761 mg/day and it exceeded the World Health Organization (WHO) of 2000 mg/day salt recommendation.
The mean sodium intake as assessed using the food diary was highest in Sabah & Sarawak Zone (2901 mg/day), followed by Southern Zone (2855 mg/day), Northern Zone (2836 mg/day), Central Zone (2638 mg/day) and East Coast Zone (2633 mg/day)
Respondents aged 30 – 39 years old excreted the highest sodium (2849 mg/day), and the lowest was found among those age 50 – 59 years old (2642 mg/day). However, there was no significant difference of sodium intake by age categories. By gender, there was a significant difference of sodium intake between male (2927 mg/day) and female (2652 mg/day).
By ethnicity, Bumiputera Sabah had the highest sodium intake (3097 mg/day), followed by Chinese (2775 mg/day), Malay (2756 mg/day), Bumiputera Sarawak (2648 mg/day) and Indian (2273 mg/day). There was a significant difference of sodium intake between Bumiputera Sabah with Malay and Indian ethnicity. Contradictory to 24-hour urinary sodium excretion method, the sodium intake assessed using the food diary showed the least sodium intake among Indian ethnicity.
Mean sodium intake by marital status was also investigated. This study found no significant difference between married (2786 mg/day) and single (2679 mg/day) respondents. By academic qualification, there was no significant difference of dietary sodium intake across all academic achievements.
Further analysis showed no significant differences by body weight status. The dietary sodium intake was highest among overweight respondents (2803 mg/day), followed by obese (2755 mg/day), underweight (2722 mg/day) and normal body weight (2722 mg/day). A similar finding was also found among respondents with higher waist circumference. Those with higher waist circumference have higher sodium intake (2768 mg/day), compared to those with normal waist circumference (2745 mg/day). However, both findings were insignificant.
Table 4.6 Dietary sodium intake by food diary and socio demography data
26 27
DETERMINATION OF DIETARY SODIUM INTAKE AMONG THE MINISTRY OF HEALTH STAFF DETERMINATION OF DIETARY SODIUM INTAKE AMONG THE MINISTRY OF HEALTH STAFF
Institute for Public Health, Ministry of Health, Malaysia Institute for Public Health, Ministry of Health, Malaysia
4.7 Estimation of sodium intake with Food Frequency Questionnaire (FFQ)
Sodium consumption was determined using a validated FFQ that reflects the past one month’s sodium intake. Table 4.7 displays the mean sodium intake analyzed with FFQ and the study characteristics. Overall, the mean sodium intake was 3446 mg/day. Analysis by zone showed the respondents in the East Coast had the highest sodium intake (3671 mg/day), followed by Northern Zone (3609 mg/day), Southern Zone (3460 mg/day), Sabah and Sarawak (3259 mg/day) and Central Zone (3159 mg/day). However, there was no significant difference in sodium intake among all zones.
Males consumed higher sodium (3724 mg/day) compared to females (3263 mg/day). Younger respondents consumed more sodium than their older counterparts. Participants aged 20 – 29 years old consumed the highest amount of sodium of (4138 mg/day), followed by 30 – 39 years old (3603 mg/day), and 40 years old and older (2790 mg/day). Sodium intake in all age categories was higher than the recommended level. Significant difference in sodium intake was seen between above 40 years and other age categories (20 – 29 years and 30 – 39 years old) (p < 0.001).
Based on academic qualification, the secondary school group had the highest mean sodium intake (3603 mg/day) followed by the form six/diploma (3553 mg/day) and college/university (3253 mg/day). However, no significant difference was noted.
Sodium intake by BMI categories also exceeded the WHO recommendation. However, there was no significant difference in the sodium intake estimated FFQ by BMI categories. Further analysis showed there was no significant difference of sodium intake in the presence of hypertension and diabetes.
Table 4.7: Dietary sodium intake by FFQ and socio demography data
*p-value is significant at < 0.05
* p-value is significant at p-value <0.05
28 29
DETERMINATION OF DIETARY SODIUM INTAKE AMONG THE MINISTRY OF HEALTH STAFF DETERMINATION OF DIETARY SODIUM INTAKE AMONG THE MINISTRY OF HEALTH STAFF
Institute for Public Health, Ministry of Health, Malaysia Institute for Public Health, Ministry of Health, Malaysia
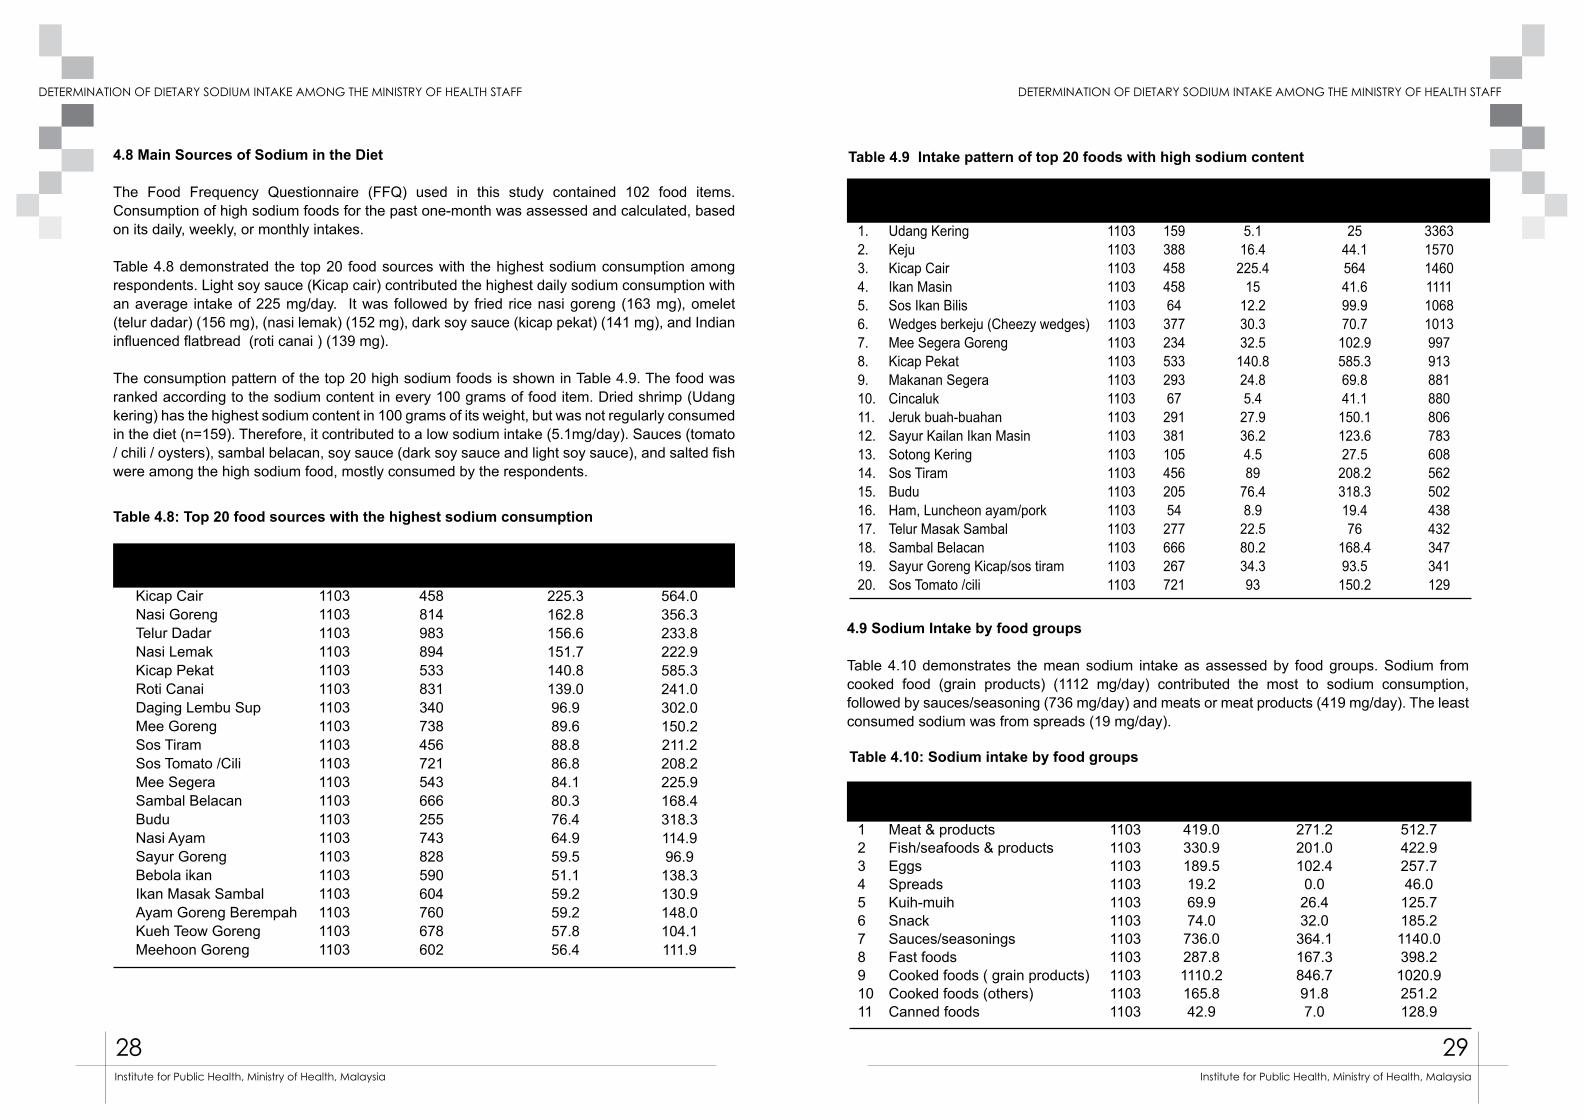
4.8 Main Sources of Sodium in the Diet
The Food Frequency Questionnaire (FFQ) used in this study contained 102 food items. Consumption of high sodium foods for the past one-month was assessed and calculated, based on its daily, weekly, or monthly intakes.
Table 4.8 demonstrated the top 20 food sources with the highest sodium consumption among respondents. Light soy sauce (Kicap cair) contributed the highest daily sodium consumption with an average intake of 225 mg/day. It was followed by fried rice nasi goreng (163 mg), omelet (telur dadar) (156 mg), (nasi lemak) (152 mg), dark soy sauce (kicap pekat) (141 mg), and Indian influenced flatbread (roti canai ) (139 mg).
The consumption pattern of the top 20 high sodium foods is shown in Table 4.9. The food was ranked according to the sodium content in every 100 grams of food item. Dried shrimp (Udang kering) has the highest sodium content in 100 grams of its weight, but was not regularly consumed in the diet (n=159). Therefore, it contributed to a low sodium intake (5.1mg/day). Sauces (tomato / chili / oysters), sambal belacan, soy sauce (dark soy sauce and light soy sauce), and salted fish were among the high sodium food, mostly consumed by the respondents.
4.9 Sodium Intake by food groups
Table 4.10 demonstrates the mean sodium intake as assessed by food groups. Sodium from cooked food (grain products) (1112 mg/day) contributed the most to sodium consumption, followed by sauces/seasoning (736 mg/day) and meats or meat products (419 mg/day). The least consumed sodium was from spreads (19 mg/day).
Table 4.8: Top 20 food sources with the highest sodium consumption
Table 4.10: Sodium intake by food groups
Food item
Kicap CairNasi GorengTelur DadarNasi LemakKicap PekatRoti CanaiDaging Lembu SupMee GorengSos TiramSos Tomato /CiliMee SegeraSambal BelacanBuduNasi AyamSayur GorengBebola ikan Ikan Masak SambalAyam Goreng BerempahKueh Teow GorengMeehoon Goreng
No.
1.2.3.4.5.6.7.8.9.10.11.12. 13.14.15.16.17.18.19. 20.
No
1234567891011
Food item
Udang KeringKejuKicap CairIkan Masin Sos Ikan BilisWedges berkeju (Cheezy wedges)Mee Segera GorengKicap PekatMakanan SegeraCincalukJeruk buah-buahanSayur Kailan Ikan MasinSotong KeringSos TiramBudu Ham, Luncheon ayam/porkTelur Masak SambalSambal BelacanSayur Goreng Kicap/sos tiramSos Tomato /cili
Food groups
Meat & productsFish/seafoods & productsEggsSpreadsKuih-muihSnackSauces/seasoningsFast foodsCooked foods ( grain products)Cooked foods (others)Canned foods
N
11031103110311031103110311031103110311031103110311031103110311031103110311031103
N
11031103110311031103110311031103110311031103
Sum (n)
159388458458643772345332936729138110545620554277666267721
Mean Sodium (mg/d)419.0330.9189.519.269.974.0
736.0287.81110.2165.842.9
Mean Sodium(mg/d)
5.116.4225.4
1512.230.332.5140.824.85.427.936.24.589
76.48.922.580.234.393
Median Sodium (mg/d)271.2201.0102.4
0.026.432.0
364.1167.3846.791.87.0
Standard Deviation
2544.156441.699.970.7
102.9585.369.841.1
150.1123.627.5
208.2318.319.476
168.493.5
150.2
Standard Deviation
512.7422.9257.746.0125.7185.21140.0398.21020.9251.2128.9
Sodium/ Serving (mg)336315701460111110681013997913881880806783608562502438432347341129
N
11031103110311031103110311031103110311031103110311031103110311031103110311031103
Number of participant
458814983894533831340738456721543666255743828590604760678602
Mean Sodium (mg/day)
225.3162.8156.6151.7140.8139.096.989.688.886.884.180.376.464.959.551.159.259.257.856.4
Standard Deviation
564.0356.3233.8222.9585.3241.0302.0150.2211.2208.2225.9168.4318.3114.996.9138.3130.9148.0104.1111.9
Table 4.9 Intake pattern of top 20 foods with high sodium content
30 31
DETERMINATION OF DIETARY SODIUM INTAKE AMONG THE MINISTRY OF HEALTH STAFF DETERMINATION OF DIETARY SODIUM INTAKE AMONG THE MINISTRY OF HEALTH STAFF
Institute for Public Health, Ministry of Health, Malaysia Institute for Public Health, Ministry of Health, Malaysia
Table 4.11: Correlation between dietary sodium intake and urine sodium excretion
5.0: Discussion
5.1 Pattern of sodium excretion
The mean 24-hour urinary sodium excretion among health staff in this study was 2860 mg or 7.15 gm of salt, which exceeded the WHO sodium recommendation of 2000 mg/day [43]. This finding is lower than the previous study conducted among normotensive health staff in Malaysia in 2012 (3429 mg/day) [7]. The current sodium intake was also lower compared to population intake from other parts of the world. In the INTERMAP study, sodium intake in China, Japan, United Kingdom, Northern Ireland, and the USA ranged from 3,702 mg (United Kingdom) to 5,633 mg (China) [44]. In Asian countries, the salt, sauces, and seasonings added in cooking represent the major sources of sodium intake [43]. On the contrary, 75% of sodium consumption in industrialized countries comes from processed foods and food eaten away from home [45].
High sodium intake, as reported in this study, may be partly due to the prevalence of eating outside, as evidenced in the Malaysian Adult Nutrition Survey, (MANS 2014). MANS 2014 found almost half of Malaysian adults obtained food outside home [6]. Limited time to prepare meals at home and more time spent at the workplace are believed to increase the percentage of eating outside, hence increasing sodium consumption [6].
This study showed respondents from Southern Zone (Melaka, Negeri Sembilan and Johor) had the highest urinary sodium excretion, followed by the East Coast, Central, Northern and Sabah and Sarawak. This finding was contrary to an earlier study, where the Northern zone had the highest sodium intake, followed by the Sabah / Sarawak and the Southern zone [7]. This observation may be due to higher consumption of cooked food and the average BMI of the responders, compared to other zones, as observed in this study. Cooked food yielded the highest amount of sodium in this study, and the largest sodium sources were contributed by external sodium, such as table salt and soy sauce that added to it. BMI might play a role of higher sodium excretion, as it was notable as a strong predictor of urinary sodium excretion [46].
About 66.4% (73.9% males and 61.4% females) of the respondents consumed sodium excessively, and this finding was lower, compared to the previous study, which was 79% [7]. Higher sodium intake was observed among males, compared to females (p<0.001) and this finding was consistent with the previous study [7]. Men excrete more sodium possibly due to the higher sodium and energy consumption from the diet[18][47]. Based on the findings from MANS 2014, males consumed more sodium than females [6]. Similar observation was also observed from other studies [48][49].
In this study, there was no significant difference in the 24-hour urinary sodium excretion between age groups. However, the urinary sodium excretion among respondents aged 40 and above appeared to be slightly lower than the other age categories. Another study also reported sodium intake in adults appeared to be slightly lower after the age of 50 years than younger age [43]). In related to academic qualification, there was a higher 24-hour urinary sodium excretion in respondents with the lowest educational qualification (secondary and below) compared to the higher level. Although the finding was not statistically significant, similar findings were obtained from previous studies conducted in Malaysia [7] and in United States [50].
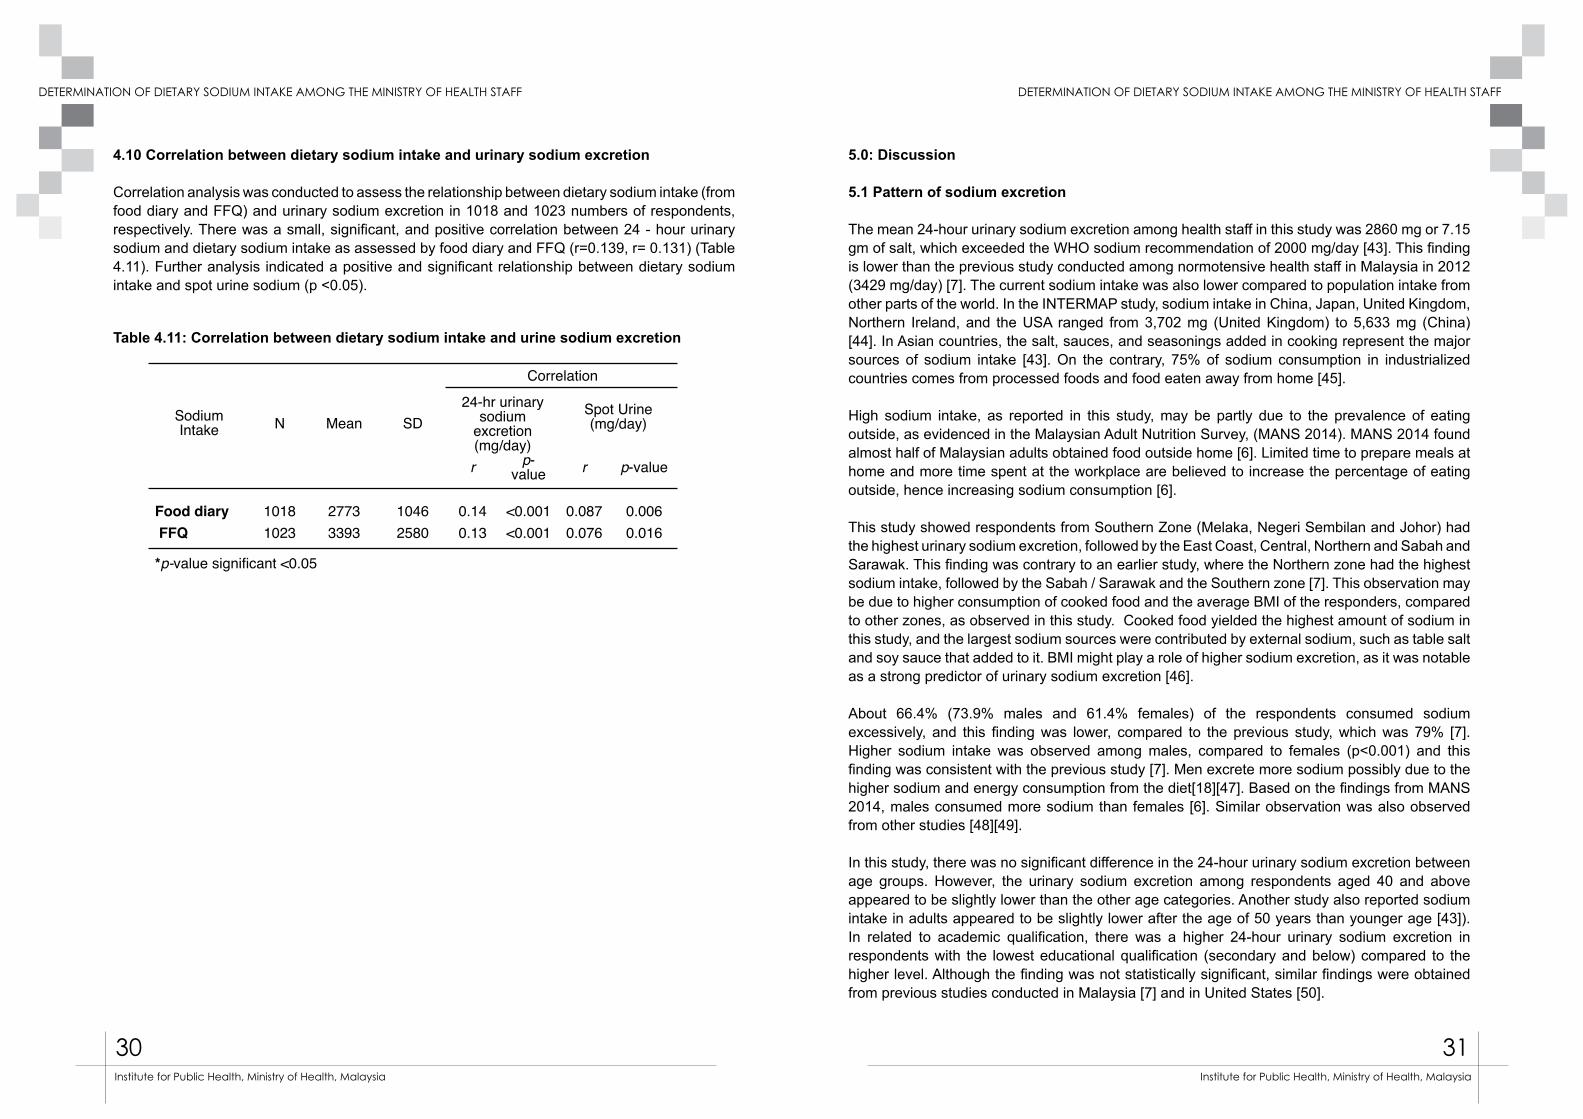
4.10 Correlation between dietary sodium intake and urinary sodium excretion
Correlation analysis was conducted to assess the relationship between dietary sodium intake (from food diary and FFQ) and urinary sodium excretion in 1018 and 1023 numbers of respondents, respectively. There was a small, significant, and positive correlation between 24 - hour urinary sodium and dietary sodium intake as assessed by food diary and FFQ (r=0.139, r= 0.131) (Table 4.11). Further analysis indicated a positive and significant relationship between dietary sodium intake and spot urine sodium (p <0.05).
Sodium
Intake N Mean SD
Correlation
24-hr urinary
sodium
excretion
(mg/day)
Spot Urine
(mg/day)
r p-
valuer p-value
Food diary 1018 2773 1046 0.14 <0.001 0.087 0.006
FFQ 1023 3393 2580 0.13 <0.001 0.076 0.016
*p-value significant <0.05

32 33
DETERMINATION OF DIETARY SODIUM INTAKE AMONG THE MINISTRY OF HEALTH STAFF DETERMINATION OF DIETARY SODIUM INTAKE AMONG THE MINISTRY OF HEALTH STAFF
Institute for Public Health, Ministry of Health, Malaysia Institute for Public Health, Ministry of Health, Malaysia
Besides the socio-demographic characteristics, the findings also indicated the increase of urine sodium excretions corresponded to the increase in BMI and waist circumference. Other studies reported sodium intake was influenced by body size and fatness through higher calorie intake that simultaneously increased sodium consumption [46][51].
5.2 Knowledge, attitude, and practices (KAP) towards dietary sodium Intake
Most respondents added salt in the food they cooked at home, and never added salt to the food at the table. A similar finding was observed in another study [52]. In the Asian cooking, the discreet salt sources used in cooking were mostly table salt and sauces [18].
Most respondents perceived they consumed just the right amount of salt in their daily diet. They also noted that lowering the salt or sodium in their diet is important. Most knew of the serious health problems due to high salt consumption; however, only a few could identify the associated health problems of kidney stones, stomach cancer, and osteoporosis.
Majority of the respondents reported they take regular action to control salt intake by not adding salt at the table and avoiding processed food. Even though more than half of the respondents reported regularly controlling their sodium intake, respondents should be advised on an effective way to reduce salt in cooking. Furthermore, the sodium intake was not solely determined by knowledge, attitude and practice of consumers but the other mediating roles such as cultures [23].
5.3 Sodium estimation using spot urine
In this study, the predictive 24-hour urine sodium equation obtained from Tanaka [13] and Kawasaki [26] formulas demonstrated a significant correlation to actual sodium measures (Tanaka, r = 0.32; Kawasaki, r = 0.33), p < 0.001. However, both Kawasaki and Tanaka estimations were higher by 20% and 50% from the actual sodium excretion. An overestimation of the predictive value was also observed in the other study [54].
We postulated the discrepancy between the 24 - hour urine sodium value and spot urine estimation might be due to the timing of spot urine collection. The urine and sodium excretion rate throughout 24 hours depends on sodium consumption patterns, such as time of day, an individual’s posture, and Neuro-hormonal influences [27]. Variability in the creatinine excretion used for prediction in these formulas was influenced by body weight, age, sex, and respondents’ protein intake [55].
5.4 Estimation of Sodium Intake Analyzed Through 48-Hour Food diary
This current study utilized a two-day food diary that included one weekday and one weekend assessment. Based on the analysis, dietary sodium intake as assessed by the food diary was greater than the World Health Organization (WHO) recommendation and Malaysia Dietary Guideline [43][56]. Mean sodium intake from this study was 2761 mg/day or 6.9 g/d salt, and it was slightly lower than 24-hour urinary sodium measurement.
Excessive sodium intake as assessed by food diary was also observed by other local studies [7] [19]. In most Asian countries, the average sodium intake is over 4.6 g / d [57]. High sodium intake
in this study might be contributed by the usage of table salt or salty sauces in cooking. About 60.7% of the respondents often and always add salt during cooking. Among 1116 respondents, only 20% rarely or never add salt during cooking. The higher prevalence of adding salt during cooking was also observed by a local study conducted among a sample of Chinese adults in an urban area, where 83% always add salt or sauce during cooking [58].
Estimated dietary sodium by food diary was 10% lower than 24-hour urinary sodium measured in this study. The lower estimation was also found by previous studies [49][59]. Dietary intake as assessed by food diary tends to underestimate the sodium intake, possibly to inability of the respondents to record all the food they consumed, specify the high sodium content food items, and difficulty estimating the portion size of consumed food [60].
Although there was a difference of sodium level as determined by urinary test and food diary in this study, a weak but significant correlation between dietary sodium intake and urinary sodium excretion was found (r = 0.139, p< 0.01). This correlation was slightly similar to the Finnish study with r = 0.13 [61]. Low correlations between dietary and urinay sodium may be due to measurement error in one or both estimates [49]. The sodium excretion rate may also vary as it was influenced by other metabolic pathways, such as sweat, faces, and others [31]. On the other hand, dietary measurement error might also reflect potential inaccuracy of the sodium database, misreporting of dietary intake, and difficulties quantifying salt or sauce added in the diet [49] [62].
5.5 Estimation of dietary sodium Intake by Food Frequency Questionnaire
The food frequency questionnaire (FFQ) is one of the most common study tools used in wide scale population based studies, as it is easy to administer and low cost. It is useful to assess intake over a longer period than dietary surveys and potentially reduce day-to-day variability of food intake. The overall mean sodium analyzed by FFQ was found to be higher (3393 mg/day) than urine analysis and food diary. However, there was a significant, small correlation to 24-hour urinary sodium (r= 0.131, p < 0.01). A similar finding was observed in other studies [63] [64] [65].
5.6 Main Sources of Sodium Intake in the Diet
This study identified the main source of sodium intake was from cooked food (grain products), followed by sauces/seasoning and meat products. Soy sauce, fried rice, omelet and nasi lemak were found to be the major sources of sodium consumption. A similar pattern was found in the previous salt study conducted among health staff, where soy sauce, fried rice, and nasi lemak were the major sources of high sodium food most consumed by the respondents [7].
The respondents, however, rarely consumed some foods with high sodium content per serving including dried shrimp, cheese, salted fish and fish sauce. Most Asian countries consume large amounts of dietary sodium from added sodium chloride in cooking and from various sauces, including soy sauce and in Japan (miso) [66], [20]. On the contrary, most sodium in European, Australian, and United States diets were obtained from processed food, spreads and sauces [32] [60].
34 35
DETERMINATION OF DIETARY SODIUM INTAKE AMONG THE MINISTRY OF HEALTH STAFF DETERMINATION OF DIETARY SODIUM INTAKE AMONG THE MINISTRY OF HEALTH STAFF
Institute for Public Health, Ministry of Health, Malaysia Institute for Public Health, Ministry of Health, Malaysia
6.0 Conclusion
Mean sodium intake among Ministry of Health Staff as assessed by 24-hour urine test and food diary were higher than the WHO recommendation (≤ 2000 mg/day). Approximately, 70% of the respondents consumed sodium (≥ 2000 mg/day). In this study, spot urine assessment to estimate the 24- hour urine sodium was moderately correlated to the 24 hour urine sodium excretion. Food items, namely, soy sauce, fried rice, omelet and nasi lemak were the major sodium contributors in the diet. Awareness of the respondents of high sodium diet and its association to serious health problems was satisfactory, but the practices towards low sodium consumption should be further encouraged.
7.0 Suggestion
Continous monitoring on sodium intake is proposed to determine the trend of sodium intake among the health staff. The 24 hour urine sodium test to determine the sodium intake shall be easily asessed by the health staff for them to monitor their sodium consumption. A holistic approach also need to be incorporated to promote a low sodium in order to meet the sodium recommendation of 2000 mg/day. The effects on high sodium consumption to cardiovascular risks, and other clinical markers associated to the diseases shall be highlighted and explored for further understanding on sodium impact to health.
References:
[1] F.P. Cappuccio, Cardiovascular and other effects of salt consumption., Kidney Int. Suppl. 3 (2013) 312–315. doi:10.1038/kisup.2013.65.
[2] N.J. Aburto, A. Ziolkovska, L. Hooper, P. Elliott, F.P. Cappuccio, J.J. Meerpohl, Effect of lower sodium intake on health: systematic review and meta-analyses, Bmj. 346 (2013) f1326. doi:10.1136/bmj.f1326.
[3] W.H. Organization, others, Regional Consultation on Strategies to Reduce Salt Intake, (2010). http://iris.wpro.who.int/handle/10665.1/10631\nhttp://www.wpro.who.int/noncommunicable_diseases/documents/docs/RCStratReduce_Salt_Intake.pdf.
[4] W.H. Organization, Prevention and control of noncommunicable diseases : Formal meeting of Member States to conclude the work on the comprehensive global monitoring framework , including indicators , and a set of voluntary global targets for the prevention and control of non, 8 (2012) 1–7. http://www.who.int/nmh/events/2012/discussion_paper2_20120322.pdf.
[5] J. Powles, S. Fahimi, R. Micha, S. Khatibzadeh, P. Shi, M. Ezzati, et al., Global, regional and national sodium intakes in 1990 and 2010: a systematic analysis of 24 h urinary sodium excretion and dietary surveys worldwide., BMJ Open. 3 (2013) e003733. doi:10.1136/bmjopen-2013-003733.
[6] Institute for Public Health, National Health and Morbidity Survey 2014 : Malaysian Adult Nutrition Survey (MANS) Vol. II, 2014.
[7] A. Rashidah, P. Yeo, A. Noor Ani, M. Muhammad Fadhli, A. Tahir, M. Feisul Idzwan, et al., Sodium intake among normotensive health staff assessed by 24-hour urinary excretion: a cross-sectional study, Malays. J. Nutr. 20 (2014) 317–326.
[8] T. Lallukka, M. Laaksonen, O. Rahkonen, E. Roos, E. Lahelma, Multiple socio-economic circumstances and healthy food habits., Eur. J. Clin. Nutr. 61 (2007) 701–10. doi:10.1038/sj.ejcn.1602583.
[9] R. Sarmugam, A. Worsley, W. Wang, An examination of the mediating role of salt knowledge and beliefs on the relationship between socio-demographic factors and discretionary salt use: a cross-sectional study, Int. J. Behav. Nutr. Phys. Act. 10 (2013) 1–9. doi:10.1186/1479-5868-10-25.
[10] N. Sauvageot, A. Alkerwi, A. Albert, M. Guillaume, Use of food frequency questionnaire to assess relationships between dietary habits and cardiovascular risk factors in NESCAV study: validation with biomarkers., Nutr. J. 12 (2013) 143. doi:10.1186/1475-2891-12-143.
[11] A. Leiba, A. Vald, E. Peleg, A. Shamiss, E. Grossman, Does dietary recall adequately assess sodium, potassium, and calcium intake in hypertensive patients?, Nutrition. 21 (2005) 462–6. doi:10.1016/j.nut.2004.08.021.
[12] M. Land, J. Webster, A. Christoforou, D. Praveen, P. Jeffery, J. Chalmers, et al., Salt intake assessed by 24 h urinary sodium excretion in a random and opportunistic sample in Australia., BMJ Open. 4 (2014) e003720. doi:10.1136/bmjopen-2013-003720.
[13] T. Tanaka, T. Okamura, K. Miura, T. Kadowaki, H. Ueshima, H. Nakagawa, et al., A simple method to estimate populational 24-h urinary sodium and potassium excretion using a casual urine specimen., J. Hum. Hypertens. 16 (2002) 97–103. doi:10.1038/sj.jhh.1001307.
[14] T. Kawasaki, K. Itoh, K. Uezono, H. Sasaki, A simple method for estimating 24 h urinary sodium and potassium excretion from second morning voiding urine specimen in adults., Clin. Exp. Pharmacol. Physiol. 20 (1993) 7–14. doi:10.1038/sj/jhh/1001307.
[15] L. D’Elia, G. Rossi, R. Ippolito, F.P. Cappuccio, P. Strazzullo, Habitual salt intake and risk of gastric cancer: a meta-analysis of prospective studies., Clin. Nutr. 31 (2012) 489–98.
36 37
DETERMINATION OF DIETARY SODIUM INTAKE AMONG THE MINISTRY OF HEALTH STAFF DETERMINATION OF DIETARY SODIUM INTAKE AMONG THE MINISTRY OF HEALTH STAFF
Institute for Public Health, Ministry of Health, Malaysia Institute for Public Health, Ministry of Health, Malaysia
doi:10.1016/j.clnu.2012.01.003.[16] F.P. Cappuccio, R. Kalaitzidis, S. Duneclift, J.B. Eastwood, Unravelling the links between
calcium excretion, salt intake, hypertension, kidney stones and bone metabolism., J. Nephrol. 13 169–77. http://www.ncbi.nlm.nih.gov/pubmed/10928292 (accessed June 20, 2016).
[17] P. Strazzullo, L. D’Elia, N.-B.N.-B.-. B. Kandala, F.P. Cappuccio, Salt intake, stroke, and cardiovascular disease: meta-analysis of prospective studies, BMJ. 339 (2009) b4567–b4567. doi:10.1136/bmj.b4567.
[18] P. Elliott, I. Brown, SODIUM INTAKES AROUND THE WORLD, 2007.[19] K. Mirnalini, M.S. Zalilah, M.Y. Safiah, A. Tahir, H.M.D. Siti, R.D. Siti, et al., Energy and
nutrient intakes: Findings from the Malaysian Adult Nutrition Survey (MANS), Malays. J. Nutr. 14 (2008) 1–24.
[20] A.P.M. Batcagan-Abueg, J.J.M. Lee, P. Chan, S.A. Rebello, M.S. V Amarra, Salt intakes and salt reduction initiatives in Southeast Asia: a review., Asia Pac. J. Clin. Nutr. 22 (2013) 490–504. doi:10.6133/apjcn.2013.22.4.04.
[21] IPH, National Health Morbidity Survey 2015, Non Communicable Diseases, Risk Factors & Other Health Problems, Volume 11, Institute for Public Health, Ministry of Health Malaysia, Kuala Lumpur, 2015.
[22] WHO: World Health Organization, Media centre Salt reduction, Media Cent. Salt Reduct. (2014) 1–6. http://www.who.int/mediacentre/factsheets/fs393/en/.
[23] M.-A. Land, J. Webster, A. Christoforou, C. Johnson, H. Trevena, F. Hodgins, et al., The association of knowledge, attitudes and behaviours related to salt with 24-hour urinary sodium excretion., Int. J. Behav. Nutr. Phys. Act. 11 (2014) 47. doi:10.1186/1479-5868-11-47.
[24] S. Vandevijvere, W. De Keyzer, J. Chapelle, D. Jeanne, G. Mouillet, I. Huybrechts, et al., Estimate of total salt intake in two regions of Belgium through analysis of sodium in 24-h urine samples, Eur. J. Clin. Nutr. 64 (2010) 1260–1265. doi:10.1038/ejcn.2010.148.
[25] S.S. Kang, E.H. Kang, S.O. Kim, M.S. Lee, C.D. Hong, S.B. Kim, Use of mean spot urine sodium concentrations to estimate daily sodium intake in patients with chronic kidney disease, Nutrition. 28 (2012) 256–261. doi:10.1016/j.nut.2011.06.006.
[26] T. Kawasaki, M. Ueno, K. Uezono, N. Kawazoe, S. Nakamuta, K. Ueda, et al., Average urinary excretion of sodium in 24 - hour can be estimated from a spot-urine specimen., Jpn. Circ. J. 46 (1982) 948–53. doi:http://dx.doi.org/10.1253/jcj.46.948.
[27] C. Ji, L. Sykes, C. Paul, O. Dary, B. Legetic, N.R.C. Campbell, et al., Systematic review of studies comparing 24-hour and spot urine collections for estimating population salt intake, … Salud Pública. 32 (2012) 307–315. doi:10.1590/S1020-49892012001000010.
[28] T. Tanaka, T. Okamura, K. Miura, T. Kadowaki, H. Ueshima, H. Nakagawa, ORIGINAL ARTICLE A simple method to estimate populational 24-h urinary sodium and potassium excretion using a casual urine specimen, (2010) 97–103. doi:10.1038/sj/jhh/1001307.
[29] J. Stamler, The INTERSALT Study: background, methods, findings, and implications., Am. J. Clin. Nutr. 65 (1997) 626S–642S. http://www.ncbi.nlm.nih.gov/pubmed/9022559 (accessed April 13, 2016).
[30] N. Campbell, F. Cappuccio, A. Hennis, S. Barquera, R.C. Rotter, O. Dary, et al., Protocol for Population Level Sodium Determination in 24 - hour Urine Samples, (2010).
[31] H. Reinivuo, L.M. Valsta, T. Laatikainen, J. Tuomilehto, P. Pietinen, Sodium in the Finnish diet : II Trends in dietary sodium intake and comparison between intake and 24-h excretion of sodium, Eur. J. Clin. Nutr. 60 (2006) 1160–1167. doi:10.1038/sj.ejcn.1602431.
[32] L. Kloss, J.D. Meyer, L. Graeve, W. Vetter, Sodium intake and its reduction by food reformulation in the European Union - A review, NFS J. 1 (2015) 9–19. doi:10.1016/j.nfs.2015.03.001.
[33] R.M. McLean, Measuring Population Sodium Intake: A Review of Methods, Nutrients. 6 (2014) 4651–4662. doi:10.3390/nu6114651.
[34] M.A. Espeland, S. Kumanyika, A.C. Wilson, D.M. Reboussin, L. Easter, M. Self, et al., Statistical issues in analyzing 24-hour dietary recall and 24-hour urine collection data for sodium and potassium intakes., Am. J. Epidemiol. 153 (2001) 996–1006. http://www.ncbi.nlm.nih.gov/pubmed/11384956 (accessed June 11, 2016).
[35] S. Sasaki, R. Yanagibori, K. Amano, Validity of a self-administered diet history questionnaire for assessment of sodium and potassium: comparison with single 24-hour urinary excretion., Jpn. Circ. J. 62 (1998) 431–5. http://www.ncbi.nlm.nih.gov/pubmed/9652319 (accessed June 11, 2016).
[36] S. Suzana, A. Azlinda, S.L. Hin, W.H. Khor, Z. Zahara, J. Sa’ida Munira, et al., Influence of food intake and eating habits on hypertension control among outpatients at a government health clinic in the Klang Valley, Malaysia, Malays. J. Nutr. 17 (2011) 163–173.
[37] E.S. Tee, S.S. Mizura, A. Anuar, R. Kuladevan, Nutrient Composition of Selected Cooked and Processed Snack Foods, Pertanika. 12 (1989) 15–25.
[38] C.A.M. Anderson, L.J. Appel, N. Okuda, I.J. Brown, Q. Chan, L. Zhao, et al., Dietary sources of sodium in China, Japan, the United Kingdom, and the United States, women and men aged 40 to 59 years: the INTERMAP study., J. Am. Diet. Assoc. 110 (2010) 736–45. doi:10.1016/j.jada.2010.02.007.
[39] M.A. Espeland, Statistical Issues in Analyzing 24-Hour Dietary Recall and 24-Hour Urine Collection Data for Sodium and Potassium Intakes, Am. J. Epidemiol. 153 (2001) 996–1006. doi:10.1093/aje/153.10.996.
[40] NCCFN, Malaysian Dietary Guideline, Putrajaya, 2010.[41] WHO, Waist Circumference and Waist-Hip Ratio Report of a WHO Expert Consultation,
World Health. (2008) 8–11. doi:10.1038/ejcn.2009.139.[42] K. Murakami, S. Sasaki, Y. Takahashi, K. Uenishi, T. Watanabe, T. Kohri, et al., Sensitivity
and specificity of published strategies using urinary creatinine to identify incomplete 24-h urine collection., Nutrition. 24 (2008) 16–22. doi:10.1016/j.nut.2007.09.001.
[43] F. WHO Forum on Reducing Salt Intake in Populations (2006 : Paris, Reducing Salt Intake In Populations Report of a WHO Forum and Technical meeting WHO Library Cataloguing-in-Publication Data WHO Forum on Reducing Salt Intake in Populations (2006 : Paris, France), 2006. http://apps.who.int/iris/bitstream/10665/43653/1/9789241595377_eng.pdf (accessed April 22, 2016).
[44] J. Stamler, P. Elliott, B. Dennis, A.R. Dyer, H. Kesteloot, K. Liu, et al., INTERMAP: background, aims, design, methods, and descriptive statistics (nondietary), J Hum Hypertens. 17 (2003) 591–608.
[45] I.J. Brown, I. Tzoulaki, V. Candeias, P. Elliott, Salt intakes around the world: implications for public health, Int. J. Epidemiol. 38 (2009) 791–813. doi:10.1093/ije/dyp139.
[46] S.S. Yi, M.J. Firestone, J.M. Beasley, Independent associations of sodium intake with measures of body size and predictive body fatness, Obesity. 23 (2015) 20–23. doi:10.1002/oby.20912.
[47] S. Vandevijvere, W. De Keyzer, J.-P. Chapelle, D. Jeanne, G. Mouillet, I. Huybrechts, et al., Estimate of total salt intake in two regions of Belgium through analysis of sodium in 24-h urine samples, Eur. J. Clin. Nutr. 64 (2010) 1260–1265. doi:10.1038/ejcn.2010.148.
38 39
DETERMINATION OF DIETARY SODIUM INTAKE AMONG THE MINISTRY OF HEALTH STAFF DETERMINATION OF DIETARY SODIUM INTAKE AMONG THE MINISTRY OF HEALTH STAFF
Institute for Public Health, Ministry of Health, Malaysia Institute for Public Health, Ministry of Health, Malaysia
[48] A.M. Bernstein, W.C. Willett, Trends in 24-h urinary sodium excretion in the United States, 1957–2003: a systematic review, Am. J. Clin. Nutr. (2010) ajcn–29367.
[49] C.I. Mercado, M.E. Cogswell, A.L. Valderrama, C. Wang, C.M. Loria, A.J. Moshfegh, et al., Difference between 24-h diet recall and urine excretion for assessing population sodium and potassium intake in adults aged 18-39 y., Am. J. Clin. Nutr. 101 (2015) 376–86. doi:10.3945/ajcn.113.081604.
[50] C. Ji, F.P. Cappuccio, Socioeconomic inequality in salt intake in Britain 10 years after a national salt reduction programme, BMJ Open . 4 (2014).
[51] S.C. Larsen, L. Ängquist, T.I. a Sørensen, B.L. Heitmann, 24H Urinary Sodium Excretion and Subsequent Change in Weight, Waist Circumference and Body Composition., PLoS One. 8 (2013) e69689. doi:10.1371/journal.pone.0069689.
[52] G. Marakis, E. Tsigarida, S. Mila, Knowledge , attitudes and behaviour of Greek adults towards salt consumption : a Hellenic Food Authority project, 17 (2013) 1877–1893. doi:10.1017/S1368980013002255.
[53] T. Kawasaki, K. Itoh, K. Uezono, H. Sasaki, A simple method for estimating 24 h urinary sodium and potassium excretion from second morning voiding urine specimen in adults., Clin. Exp. Pharmacol. Physiol. 20 (1993) 7–14. http://www.ncbi.nlm.nih.gov/pubmed/8432042 (accessed April 27, 2016).
[54] E.A. Costa, G. Rose, C.H. Klein, A.C. Achutti, Diastolic pressure as an index of salt sensitivity., J. Hum. Hypertens. 8 (1994) 703–9.
[55] R. McLean, Measuring Population Sodium Intake: A Review of Methods, Nutrients. 6 (2014) 4651–4662. doi:10.3390/nu6114651.
[56] Malaysian Dietary Guidelines - Ministry of Health Malaysia 2010, 1st ed., Jaybees Print Industries Sdn Bhd, Putrajaya, 2010. http://www.moh.gov.my/images/gallery/Garispanduan/diet/introduction.pdf.
[57] I.J. Brown, I. Tzoulaki, V. Candeias, P. Elliott, Salt intakes around the world: implications for public health, Int. J. Epidemiol. 38 (2009) 791–813. doi:10.1093/ije/dyp139.
[58] G.L. Khor, B.H. Hsu‐Hage, M.L. Wahlqvist, Dietary practices in nutritional transition: The case of Malaysian urban Chinese, Ecol. Food Nutr. 36 (1998) 463–489. doi:10.1080/03670244.1998.9991532.
[59] M.J. O’Donnell, A. Mente, A. Smyth, S. Yusuf, Salt intake and cardiovascular disease: Why are the data inconsistent?, Eur. Heart J. 34 (2013) 1034–1040. doi:10.1093/eurheartj/ehs409.
[60] V.E. Hedrick, A.M. Dietrich, P.A. Estabrooks, J. Savla, E. Serrano, B.M. Davy, Dietary biomarkers: advances, limitations and future directions., Nutr. J. 11 (2012) 109. doi:10.1186/1475-2891-11-109.
[61] H. Reinivuo, L.M. Valsta, T. Laatikainen, J. Tuomilehto, P. Pietinen, Sodium in the Finnish diet : II Trends in dietary sodium intake and comparison between intake and 24-h excretion of sodium, (2006) 1160–1167. doi:10.1038/sj.ejcn.1602431.
[62] R.M. Ortega, A.M. López-Sobaler, J.M. Ballesteros, N. Pérez-Farinós, E. Rodríguez-Rodríguez, A. Aparicio, et al., Estimation of salt intake by 24 h urinary sodium excretion in a representative sample of Spanish adults, Br. J. Nutr. 105 (2011) 787–794. doi:10.1017/S000711451000423X.
[63] S.M. Park, J. Jee, J.Y. Joung, Y.Y. Cho, S.Y. Sohn, S.-M. Jin, et al., High Dietary Sodium Intake Assessed by 24-hour Urine Specimen Increase Urinary Calcium Excretion and Bone Resorption Marker., J. Bone Metab. 21 (2014) 189–94. doi:10.11005/jbm.2014.21.3.189.
[64] M.-C.S. Ferreira-Sae, M.-C.B. Gallani, W. Nadruz, R.C. Rodrigues, K.G. Franchini, P.C. Cabral, et al., Reliability and validity of a semi-quantitative FFQ for sodium intake in low-income and low-literacy Brazilian hypertensive subjects., Public Health Nutr. 12 (2009) 2168–73. doi:10.1017/S1368980009005825.
[65] K.E. Charlton, K. Steyn, N.S. Levitt, D. Jonathan, J. V Zulu, J.H. Nel, Development and validation of a short questionnaire to assess sodium intake., Public Health Nutr. 11 (2008) 83–94.
[66] Z. Kamis, R. Yaakub, S.K. Ong, N. Kassim, Sodium Content of Processed Foods in Brunei Darussalam, 29 (2015) 153–164. doi:10.14456/jhr.2015.1.
40 41
DETERMINATION OF DIETARY SODIUM INTAKE AMONG THE MINISTRY OF HEALTH STAFF DETERMINATION OF DIETARY SODIUM INTAKE AMONG THE MINISTRY OF HEALTH STAFF
Institute for Public Health, Ministry of Health, Malaysia Institute for Public Health, Ministry of Health, Malaysia
App
endi
x I:
Bor
ang
Mak
lum
at K
ajia
n da
n K
eben
aran
Res
pond
en
42 43
DETERMINATION OF DIETARY SODIUM INTAKE AMONG THE MINISTRY OF HEALTH STAFF DETERMINATION OF DIETARY SODIUM INTAKE AMONG THE MINISTRY OF HEALTH STAFF
Institute for Public Health, Ministry of Health, Malaysia Institute for Public Health, Ministry of Health, Malaysia
Appendix II: Manual Operasi Kajian Pengambilan Garam Kakitangan Kesihatan Malaysia PENGENALAN
Penggunaan sodium yang tinggi dalam jangka masa yang panjang telah dikaitkan dengan faktor
risiko utama tekanan darah tinggi, strok dan penyakit tidak berjangkit. Kajian di seluruh Negara
(NHMS 1996, 2006 & 2011) mencatatkan kenaikan prevalens tekanan darah tinggi dalam kalangan
warganegara Malaysia daripada 20.7% kepada 32.7% sejak tahun 2006. Kajian terbaru dalam
kalangan staf Kementerian Kesihatan Malaysia (KKM) telah menunjukkan 79% staf mengamalkan
pengambilan dan perkumuhan sodium yang tinggi (Rashidah et al., 2014). Purata pengambilan
sodium yang diukur daripada air kencing adalah 3429 mg sodium/hari bersamaan 8.7g/hari. World
Health Organization (WHO) telah menggalakkan negara-negara untuk mengurangkan purata
pengambilan garam kepada <5g/hari (Campbell et al., 2010). Oleh itu, pengiraan pengambilan
sodium dan pengawasan secara berterusan adalah sangat perlu sebagai strategi pengurangan
garam sekaligus mengurangkan penyakit tidak berjangkit di sesebuah negara.
Manual ini disediakan untuk kegunaan pasukan pengumpul data bagi ‘Kajian Pengambilan Garam
dalam Kalangan Anggota Kementerian Kesihatan Malaysia’. Manual ini mengandungi penjelasan
mengenai borang soal selidik dan aktiviti-aktiviti yang terlibat dalam proses penmgumpulan data.
Manual ini juga memberi panduan kepada responden tentang maklumat yang terdapat dalam
borang dan bagaimana mengisi maklumat yang dikehendaki.
Pengumpulan maklumat dimulakan dengan ucapan salam atau selamat kepada responden di
samping menjelaskan perkara-perkara berikut kepadanya:
a) Tajuk kajian
b) Kajian dijalankan oleh Bahagian Kawalan Penyakit dan Bahagian Pemakanan dengan
kerjasama Institut Kesihatan Umum, Kementerian Kesihatan Malaysia.
c) Tujuan dan maklumat kajian
d) Pengesahan dan persetujuan menyertai kajian
e) Maklumat yang dikehendaki iaitu:
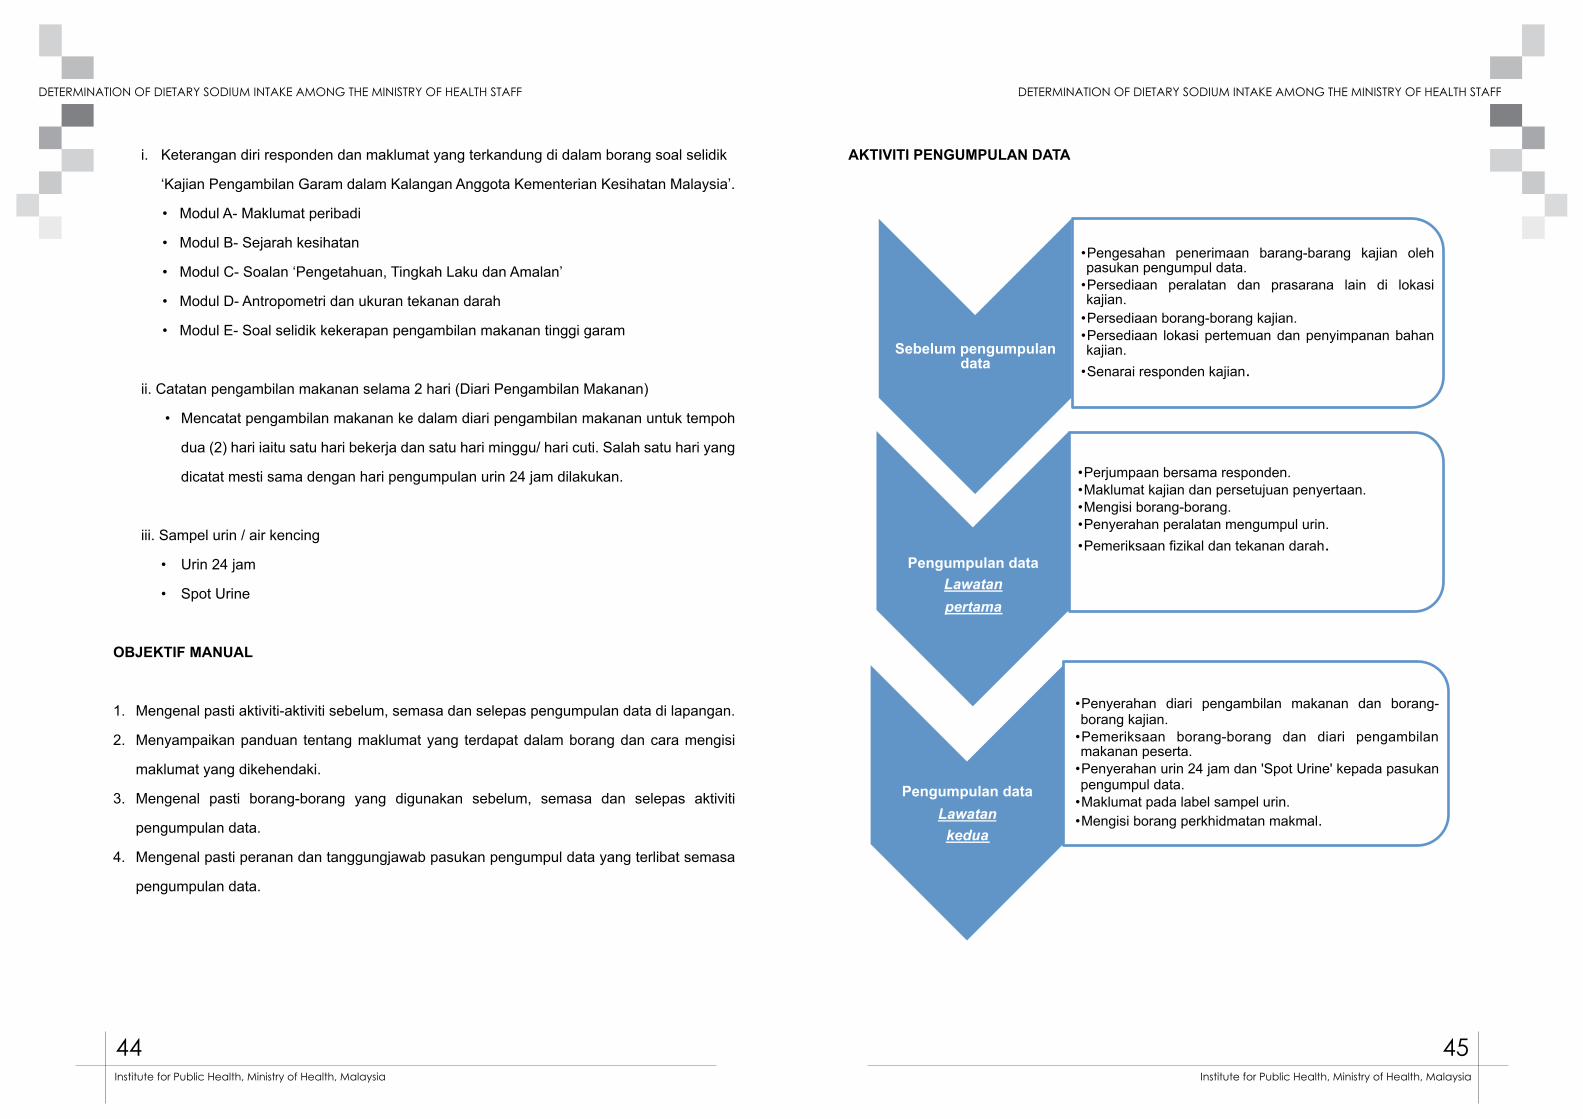
44 45
DETERMINATION OF DIETARY SODIUM INTAKE AMONG THE MINISTRY OF HEALTH STAFF DETERMINATION OF DIETARY SODIUM INTAKE AMONG THE MINISTRY OF HEALTH STAFF
Institute for Public Health, Ministry of Health, Malaysia Institute for Public Health, Ministry of Health, Malaysia
i. Keterangan diri responden dan maklumat yang terkandung di dalam borang soal selidik
‘Kajian Pengambilan Garam dalam Kalangan Anggota Kementerian Kesihatan Malaysia’.
• Modul A- Maklumat peribadi
• Modul B- Sejarah kesihatan
• Modul C- Soalan ‘Pengetahuan, Tingkah Laku dan Amalan’
• Modul D- Antropometri dan ukuran tekanan darah
• Modul E- Soal selidik kekerapan pengambilan makanan tinggi garam
ii. Catatan pengambilan makanan selama 2 hari (Diari Pengambilan Makanan)
• Mencatat pengambilan makanan ke dalam diari pengambilan makanan untuk tempoh
dua (2) hari iaitu satu hari bekerja dan satu hari minggu/ hari cuti. Salah satu hari yang
dicatat mesti sama dengan hari pengumpulan urin 24 jam dilakukan.
iii. Sampel urin / air kencing
• Urin 24 jam
• Spot Urine
OBJEKTIF MANUAL
1. Mengenal pasti aktiviti-aktiviti sebelum, semasa dan selepas pengumpulan data di lapangan.
2. Menyampaikan panduan tentang maklumat yang terdapat dalam borang dan cara mengisi
maklumat yang dikehendaki.
3. Mengenal pasti borang-borang yang digunakan sebelum, semasa dan selepas aktiviti
pengumpulan data.
4. Mengenal pasti peranan dan tanggungjawab pasukan pengumpul data yang terlibat semasa
pengumpulan data.
AKTIVITI PENGUMPULAN DATA
Sebelum pengumpulan data
•Pengesahan penerimaan barang-barang kajian oleh pasukan pengumpul data.
•Persediaan peralatan dan prasarana lain di lokasi kajian.
•Persediaan borang-borang kajian. •Persediaan lokasi pertemuan dan penyimpanan bahan kajian.
•Senarai responden kajian.
Pengumpulan data
Lawatan pertama
•Perjumpaan bersama responden. •Maklumat kajian dan persetujuan penyertaan. •Mengisi borang-borang. •Penyerahan peralatan mengumpul urin. •Pemeriksaan fizikal dan tekanan darah.
Pengumpulan data
Lawatan kedua
•Penyerahan diari pengambilan makanan dan borang-borang kajian.
•Pemeriksaan borang-borang dan diari pengambilan makanan peserta.
•Penyerahan urin 24 jam dan 'Spot Urine' kepada pasukan pengumpul data.
•Maklumat pada label sampel urin. •Mengisi borang perkhidmatan makmal.
Semasa pengumpulan data Lawatan kedua
•Penghantaran sampel urin oleh kenderaan jabatan ke makmal selewat-lewatnya jam 10 pagi.
•Penyerahan dan pengesahan borang perkhidmatan makmal.
Selepas pengumpulan data
•Pemprosesan sampel urin di makmal. •Mengembal ikan borang soal sel id ik, d iar i pengambilan makanan dan salinan borang kebenaran penyertaan responden kajian ke IKU setiap 2 minggu dalam tempoh kajian.
Selepas pengumpulan
data (IKU)
•Pengesahan dan pemprosesan rekod- rekod pengumpulan data
• Penganalisaan data. • Pengesanan keputusan ujian urin. • Makluman keputusan ujian urin kepada responden. • Laporan kajian.

46 47
DETERMINATION OF DIETARY SODIUM INTAKE AMONG THE MINISTRY OF HEALTH STAFF DETERMINATION OF DIETARY SODIUM INTAKE AMONG THE MINISTRY OF HEALTH STAFF
Institute for Public Health, Ministry of Health, Malaysia Institute for Public Health, Ministry of Health, Malaysia
Sebelum pengumpulan data
•Pengesahan penerimaan barang-barang kajian oleh pasukan pengumpul data.
•Persediaan peralatan dan prasarana lain di lokasi kajian.
•Persediaan borang-borang kajian. •Persediaan lokasi pertemuan dan penyimpanan bahan kajian.
•Senarai responden kajian.
Pengumpulan data
Lawatan pertama
•Perjumpaan bersama responden. •Maklumat kajian dan persetujuan penyertaan. •Mengisi borang-borang. •Penyerahan peralatan mengumpul urin. •Pemeriksaan fizikal dan tekanan darah.
Pengumpulan data
Lawatan kedua
•Penyerahan diari pengambilan makanan dan borang-borang kajian.
•Pemeriksaan borang-borang dan diari pengambilan makanan peserta.
•Penyerahan urin 24 jam dan 'Spot Urine' kepada pasukan pengumpul data.
•Maklumat pada label sampel urin. •Mengisi borang perkhidmatan makmal.
Semasa pengumpulan data Lawatan kedua
•Penghantaran sampel urin oleh kenderaan jabatan ke makmal selewat-lewatnya jam 10 pagi.
•Penyerahan dan pengesahan borang perkhidmatan makmal.
Selepas pengumpulan data
•Pemprosesan sampel urin di makmal. •Mengembal ikan borang soal sel id ik, d iar i pengambilan makanan dan salinan borang kebenaran penyertaan responden kajian ke IKU setiap 2 minggu dalam tempoh kajian.
Selepas pengumpulan
data (IKU)
•Pengesahan dan pemprosesan rekod- rekod pengumpulan data
• Penganalisaan data. • Pengesanan keputusan ujian urin. • Makluman keputusan ujian urin kepada responden. • Laporan kajian.
PENERANGAN MODUL
1.MENDAPATKAN PERSETUJUAN DAN MAKLUMAT DIRI RESPONDEN
Memberi penerangan yang lengkap berkaitan kajian ini dengan merujuk kepada maklumat dalam BORANG MAKLUMAT KAJIAN. Persetujuan responden diperolehi dengan menandatangani borang BORANG PERSETUJUAN MENYERTAI KAJIAN dengan persetujuan sendiri tanpa sebarang paksaan.
2.PENGISIAN MAKLUMAT MODUL- MODUL DI DALAM BORANG SOAL SELIDIK
i). MODUL A: MAKLUMAT PERIBADI
a. TujuanUntuk mendapatkan maklumat peribadi responden yang terpilih di Jabatan / Ibu Pejabat KKM / Institusi masing-masing.
Panduan Mengisi BorangID responder ditulis mengikut ruang yang disediakan seperti mana kotak berikut :
Kod Negeri Kod Peserta
Kod Negeri:01- Johor 09- Perlis02- Kedah 10- Selangor03- Kelantan 11- Terengganu04- Melaka 12- Sabah05- Negeri Sembilan 13- Sarawak06- Pahang 14- WP Kuala Lumpur07- Pulau Pinang 15- WP Putrajaya08- Perak
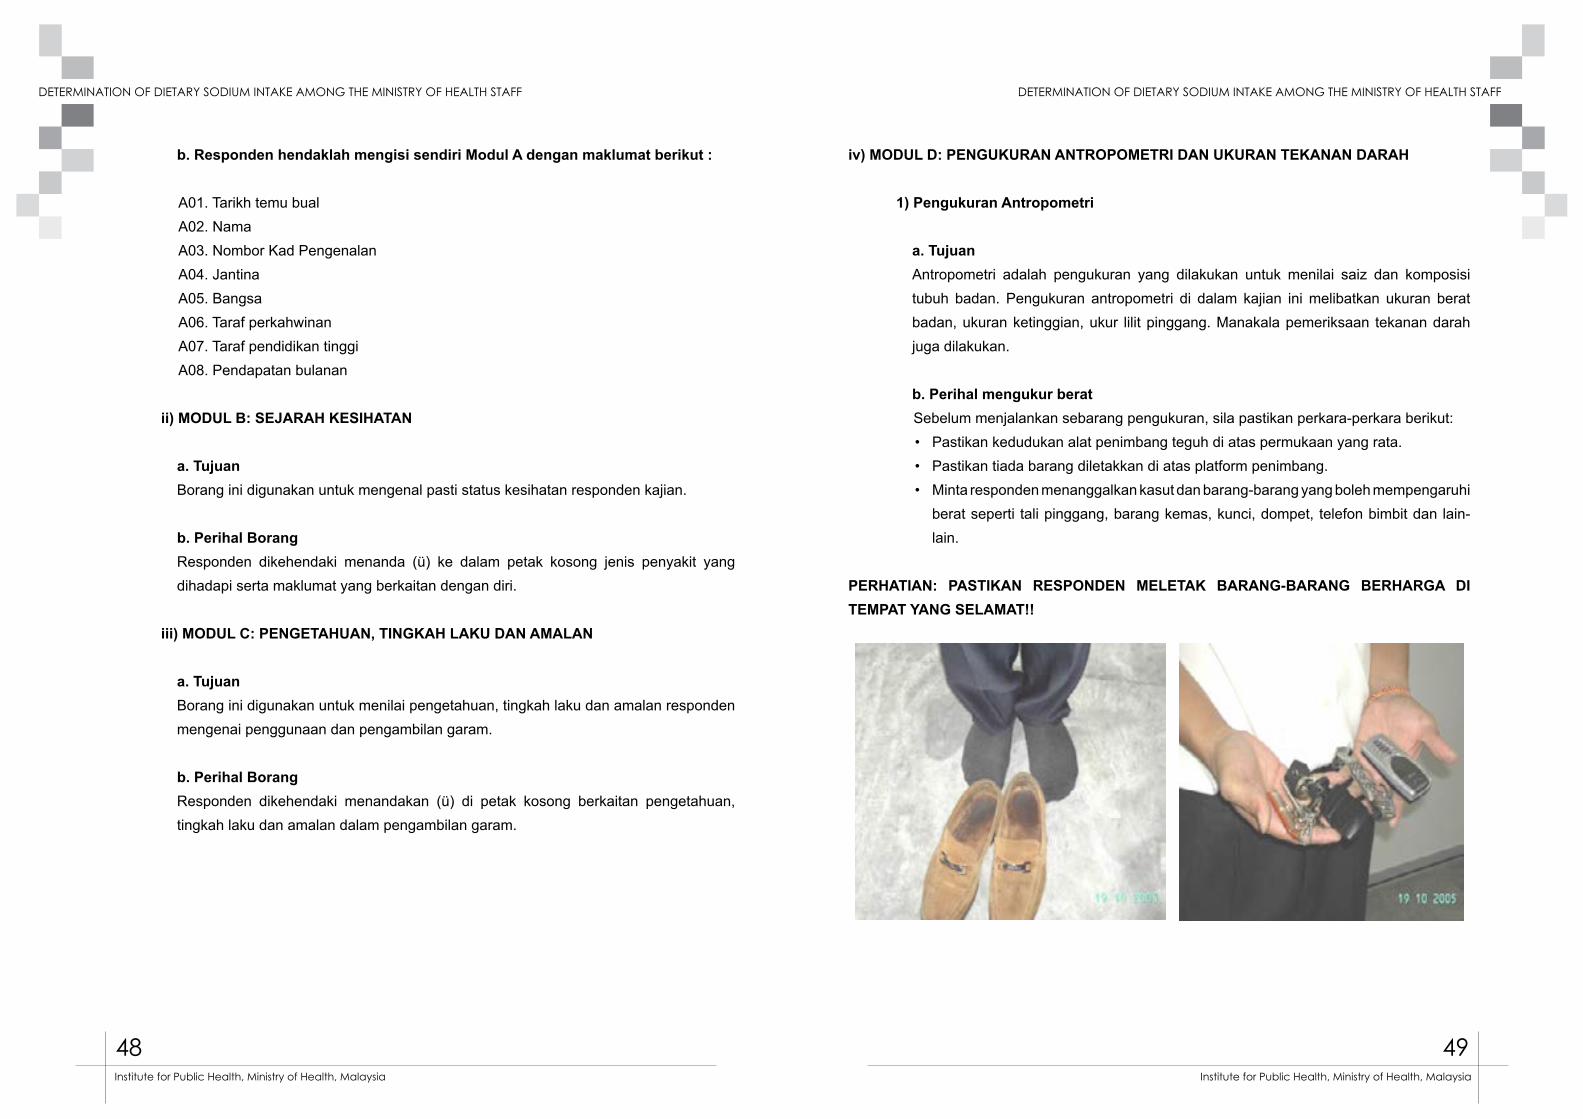
48 49
DETERMINATION OF DIETARY SODIUM INTAKE AMONG THE MINISTRY OF HEALTH STAFF DETERMINATION OF DIETARY SODIUM INTAKE AMONG THE MINISTRY OF HEALTH STAFF
Institute for Public Health, Ministry of Health, Malaysia Institute for Public Health, Ministry of Health, Malaysia
b. Responden hendaklah mengisi sendiri Modul A dengan maklumat berikut :
A01. Tarikh temu bual A02. NamaA03. Nombor Kad PengenalanA04. JantinaA05. BangsaA06. Taraf perkahwinanA07. Taraf pendidikan tinggiA08. Pendapatan bulanan
ii) MODUL B: SEJARAH KESIHATAN
a. TujuanBorang ini digunakan untuk mengenal pasti status kesihatan responden kajian.
b. Perihal BorangResponden dikehendaki menanda (ü) ke dalam petak kosong jenis penyakit yang dihadapi serta maklumat yang berkaitan dengan diri.
iii) MODUL C: PENGETAHUAN, TINGKAH LAKU DAN AMALAN
a. TujuanBorang ini digunakan untuk menilai pengetahuan, tingkah laku dan amalan responden mengenai penggunaan dan pengambilan garam.
b. Perihal BorangResponden dikehendaki menandakan (ü) di petak kosong berkaitan pengetahuan, tingkah laku dan amalan dalam pengambilan garam.
iv) MODUL D: PENGUKURAN ANTROPOMETRI DAN UKURAN TEKANAN DARAH
1) Pengukuran Antropometri
a. TujuanAntropometri adalah pengukuran yang dilakukan untuk menilai saiz dan komposisi tubuh badan. Pengukuran antropometri di dalam kajian ini melibatkan ukuran berat badan, ukuran ketinggian, ukur lilit pinggang. Manakala pemeriksaan tekanan darah juga dilakukan.
b. Perihal mengukur beratSebelum menjalankan sebarang pengukuran, sila pastikan perkara-perkara berikut:• Pastikan kedudukan alat penimbang teguh di atas permukaan yang rata.• Pastikan tiada barang diletakkan di atas platform penimbang.• Minta responden menanggalkan kasut dan barang-barang yang boleh mempengaruhi
berat seperti tali pinggang, barang kemas, kunci, dompet, telefon bimbit dan lain-lain.
PERHATIAN: PASTIKAN RESPONDEN MELETAK BARANG-BARANG BERHARGA DI TEMPAT YANG SELAMAT!!
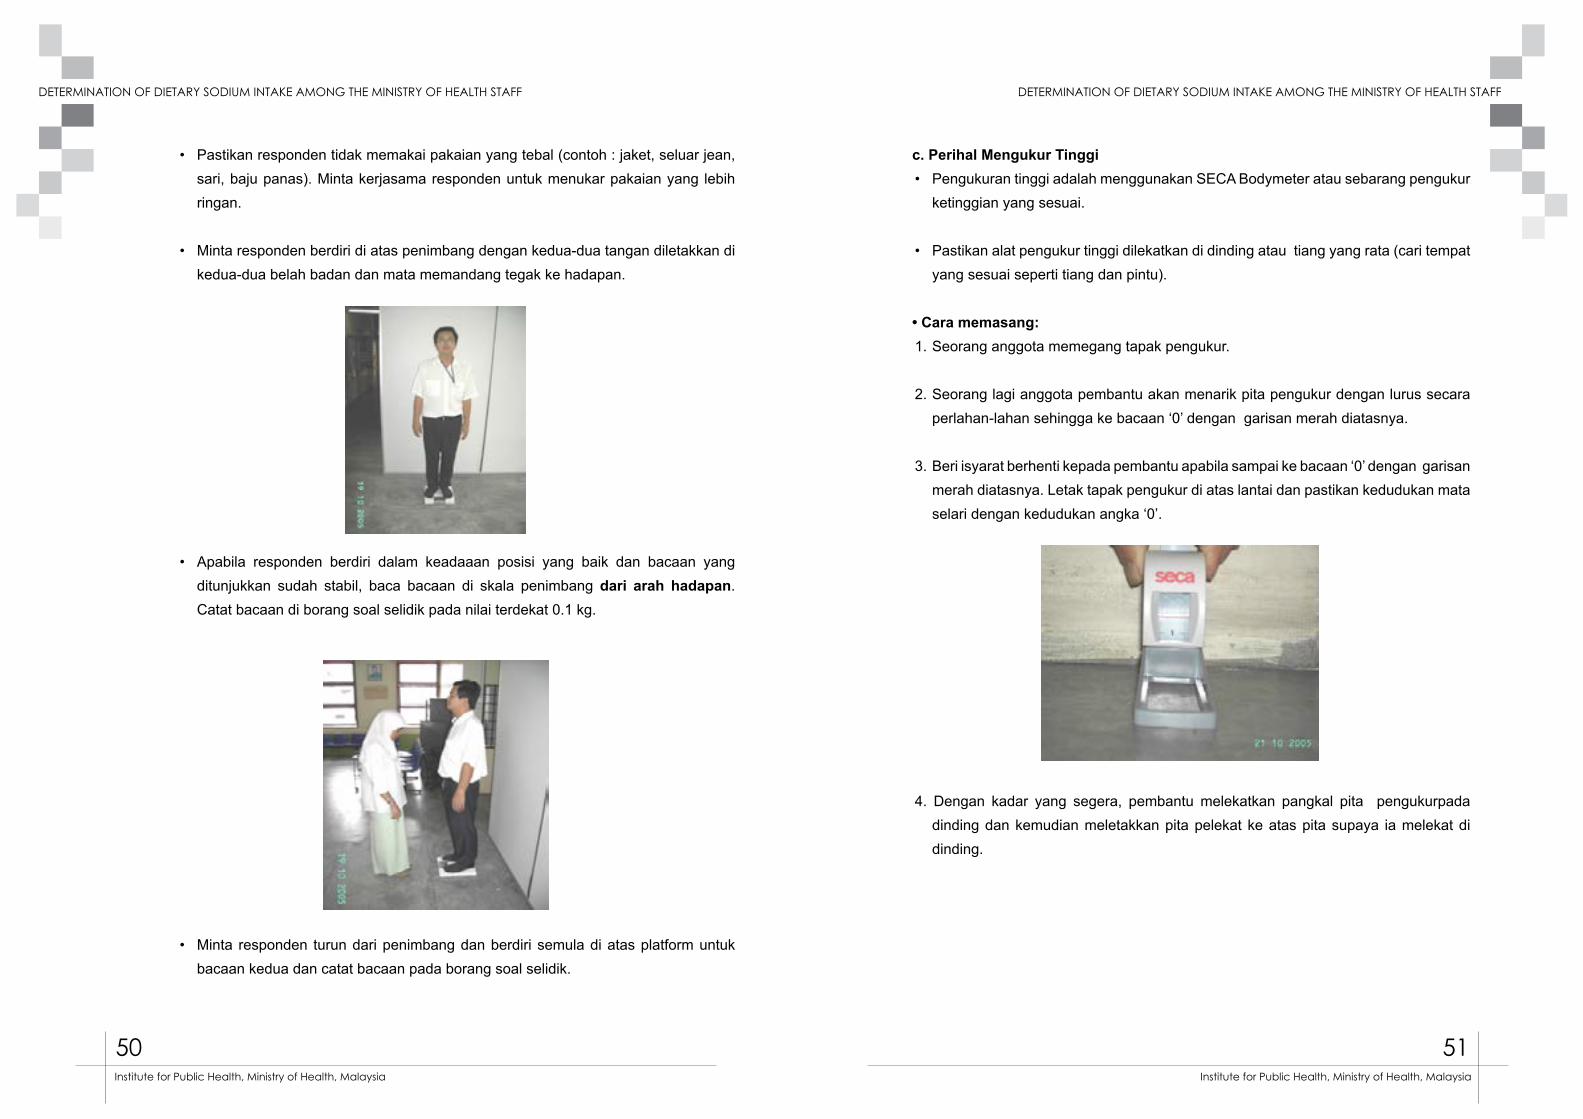
50 51
DETERMINATION OF DIETARY SODIUM INTAKE AMONG THE MINISTRY OF HEALTH STAFF DETERMINATION OF DIETARY SODIUM INTAKE AMONG THE MINISTRY OF HEALTH STAFF
Institute for Public Health, Ministry of Health, Malaysia Institute for Public Health, Ministry of Health, Malaysia
• Pastikan responden tidak memakai pakaian yang tebal (contoh : jaket, seluar jean, sari, baju panas). Minta kerjasama responden untuk menukar pakaian yang lebih ringan.
• Minta responden berdiri di atas penimbang dengan kedua-dua tangan diletakkan di kedua-dua belah badan dan mata memandang tegak ke hadapan.
• Apabila responden berdiri dalam keadaaan posisi yang baik dan bacaan yang
ditunjukkan sudah stabil, baca bacaan di skala penimbang dari arah hadapan. Catat bacaan di borang soal selidik pada nilai terdekat 0.1 kg.
• Minta responden turun dari penimbang dan berdiri semula di atas platform untuk bacaan kedua dan catat bacaan pada borang soal selidik.
c. Perihal Mengukur Tinggi• Pengukuran tinggi adalah menggunakan SECA Bodymeter atau sebarang pengukur
ketinggian yang sesuai.
• Pastikan alat pengukur tinggi dilekatkan di dinding atau tiang yang rata (cari tempat yang sesuai seperti tiang dan pintu).
• Cara memasang:1. Seorang anggota memegang tapak pengukur.
2. Seorang lagi anggota pembantu akan menarik pita pengukur dengan lurus secara perlahan-lahan sehingga ke bacaan ‘0’ dengan garisan merah diatasnya.
3. Beri isyarat berhenti kepada pembantu apabila sampai ke bacaan ‘0’ dengan garisan merah diatasnya. Letak tapak pengukur di atas lantai dan pastikan kedudukan mata selari dengan kedudukan angka ‘0’.
4. Dengan kadar yang segera, pembantu melekatkan pangkal pita pengukurpada dinding dan kemudian meletakkan pita pelekat ke atas pita supaya ia melekat di dinding.
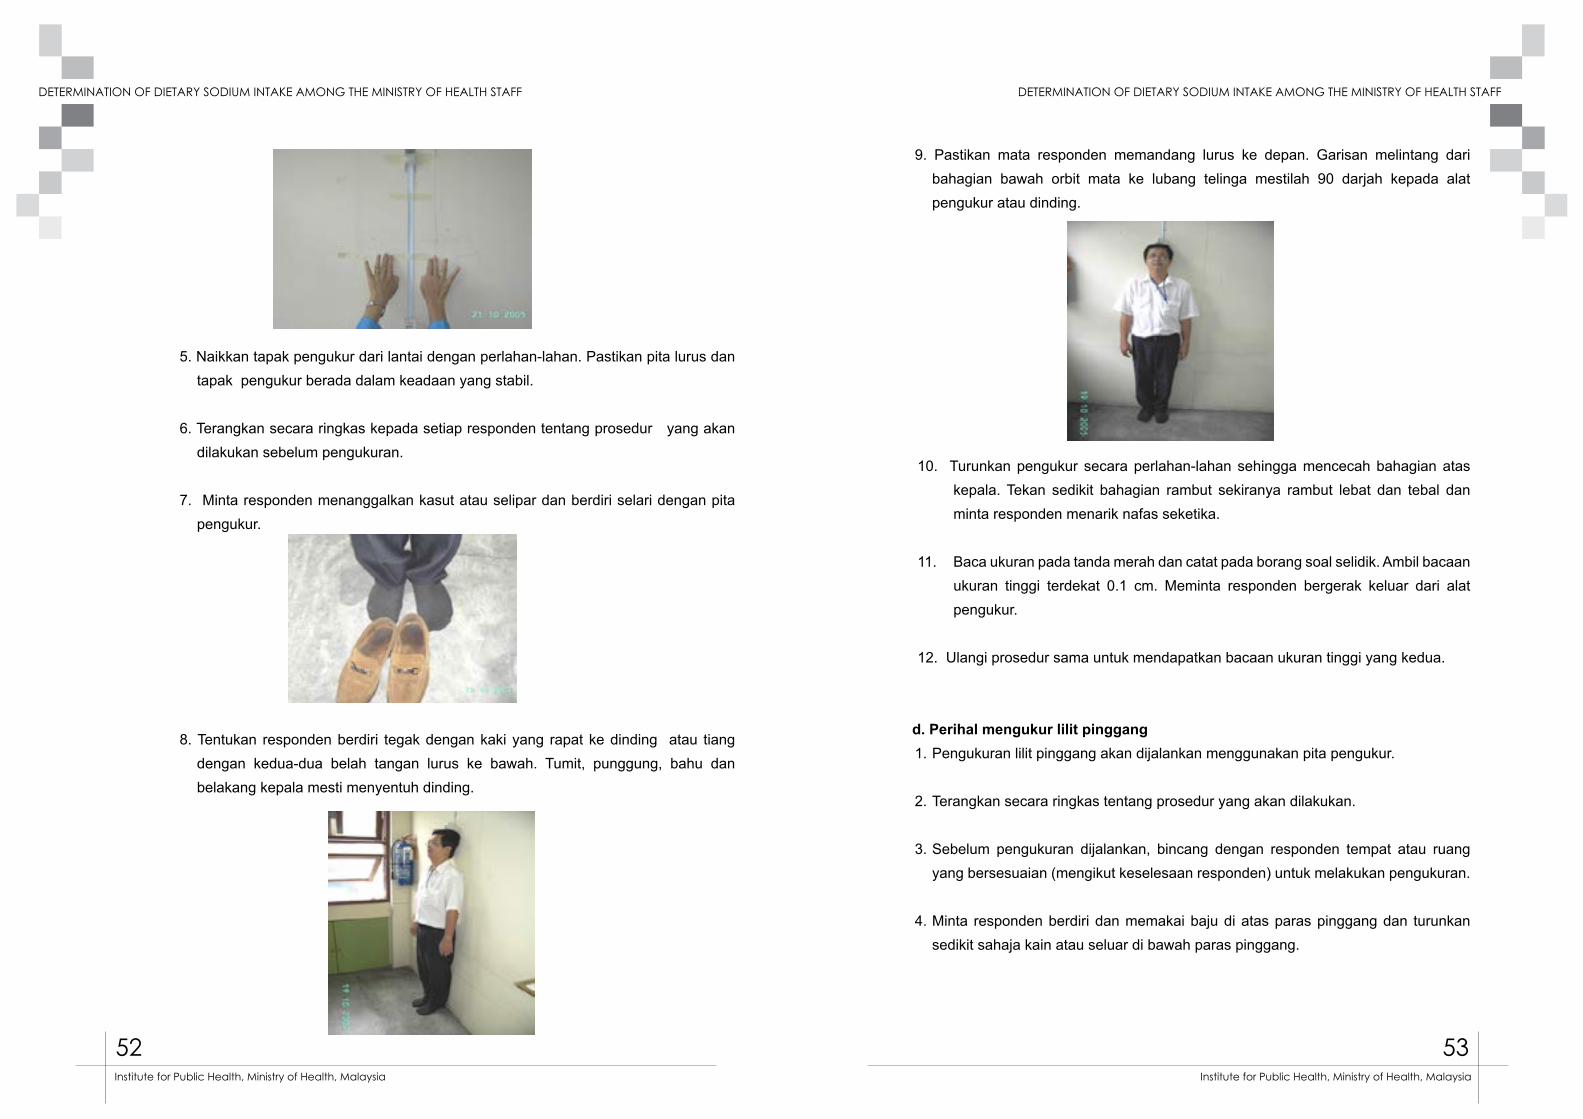
52 53
DETERMINATION OF DIETARY SODIUM INTAKE AMONG THE MINISTRY OF HEALTH STAFF DETERMINATION OF DIETARY SODIUM INTAKE AMONG THE MINISTRY OF HEALTH STAFF
Institute for Public Health, Ministry of Health, Malaysia Institute for Public Health, Ministry of Health, Malaysia
5. Naikkan tapak pengukur dari lantai dengan perlahan-lahan. Pastikan pita lurus dan tapak pengukur berada dalam keadaan yang stabil.
6. Terangkan secara ringkas kepada setiap responden tentang prosedur yang akan dilakukan sebelum pengukuran.
7. Minta responden menanggalkan kasut atau selipar dan berdiri selari dengan pita pengukur.
8. Tentukan responden berdiri tegak dengan kaki yang rapat ke dinding atau tiang dengan kedua-dua belah tangan lurus ke bawah. Tumit, punggung, bahu dan belakang kepala mesti menyentuh dinding.
9. Pastikan mata responden memandang lurus ke depan. Garisan melintang dari bahagian bawah orbit mata ke lubang telinga mestilah 90 darjah kepada alat pengukur atau dinding.
10. Turunkan pengukur secara perlahan-lahan sehingga mencecah bahagian atas kepala. Tekan sedikit bahagian rambut sekiranya rambut lebat dan tebal dan minta responden menarik nafas seketika.
11. Baca ukuran pada tanda merah dan catat pada borang soal selidik. Ambil bacaan ukuran tinggi terdekat 0.1 cm. Meminta responden bergerak keluar dari alat pengukur.
12. Ulangi prosedur sama untuk mendapatkan bacaan ukuran tinggi yang kedua.
d. Perihal mengukur lilit pinggang1. Pengukuran lilit pinggang akan dijalankan menggunakan pita pengukur.
2. Terangkan secara ringkas tentang prosedur yang akan dilakukan.
3. Sebelum pengukuran dijalankan, bincang dengan responden tempat atau ruang yang bersesuaian (mengikut keselesaan responden) untuk melakukan pengukuran.
4. Minta responden berdiri dan memakai baju di atas paras pinggang dan turunkan sedikit sahaja kain atau seluar di bawah paras pinggang.

54 55
DETERMINATION OF DIETARY SODIUM INTAKE AMONG THE MINISTRY OF HEALTH STAFF DETERMINATION OF DIETARY SODIUM INTAKE AMONG THE MINISTRY OF HEALTH STAFF
Institute for Public Health, Ministry of Health, Malaysia Institute for Public Health, Ministry of Health, Malaysia
5. Berdiri di belakang dan sebelah kanan responden, gerakkan jari perlahan-lahan dan rasa (palpate) bahagian tulang rusuk akhir responden. Rasa (palpate) pinggang untuk mengenalpasti puncak tulang ilium.
PERHATIAN : Untuk responden yang gemuk, perlu tekan sedikit untuk mengenal pasti tulang rusuk dan tulang ilium. Terangkan kepada responden prosedur ini.
6. Tandakan titik tengah (midpoint) di antara tulang rusuk akhir dengan puncak tulang ilium.
7. Tarik pita pengukur mengelilingi pinggang berdasarkan titik tengah yang telah diperolehi.
8. Pegang hujung pita yang bermula dengan nilai bacaan ‘0’, semak dan selaraskan agar kedudukan pita pengukur lurus mengelilingi pinggang dari pandangan sisi dan juga hadapan.
9. Tekan butang pada pita pengukur (sekiranya perlu) untuk menyelaras kedudukan dan ketegangan pita pengukur. Elakkan menekan pita pengukur terlalu kuat pada kulit atau pita terlalu longgar. Catat bacaan pertama pada nilai terdekat sehingga 0.1 cm.
10. Ulangi prosedur yang sama untuk mendapatkan bacaan ukur lilit pinggang yang kedua.
2) Pengukuran Tekanan Darah
a) TujuanPengukuran tekanan darah dalam kajian ini menggunakan sphygnomanometer elektronik.
Tekanan darah merujuk kepada tekanan yang dikenakan oleh darah pada pembuluh arteri ketika darah dipam oleh jantung ke seluruh anggota tubuh badan. Tekanan darah diukur dengan mengambil dua bacaan iaitu tekanan sistolik (tekanan ke atas pembuluh arteri semasa denyutan jantung) dan diastolik (tekanan semasa jantung berehat diantara pengepaman).
b) Perihal pengambilan darahi. Masa yang paling sesuai bagi pengukuran tekanan darah adalah semasa rehat
dan tenang.
ii. Pemeriksaan tekanan darah harus dilakukan seperti berikut:• Dengan dua bacaan.• Biarkan responden rehat selama 15 minit bagi setiap bacaan.• Bacaan mesti diambil dengan responden berada dalam keadaan duduk dan
tenang.• Tekanan diambil pada lengan tangan.
iii. Berikan pengenalan ringkas berkaitan prosedur yang akan dilalui oleh responden tersebut.
iv. Pastikan responden berada dalam keadaan tenang, TIDAK menjalankan aktiviti yang tertera dibawah dalam masa 15 minit yang lepas :• Senaman.• Mengambil makanan berat.
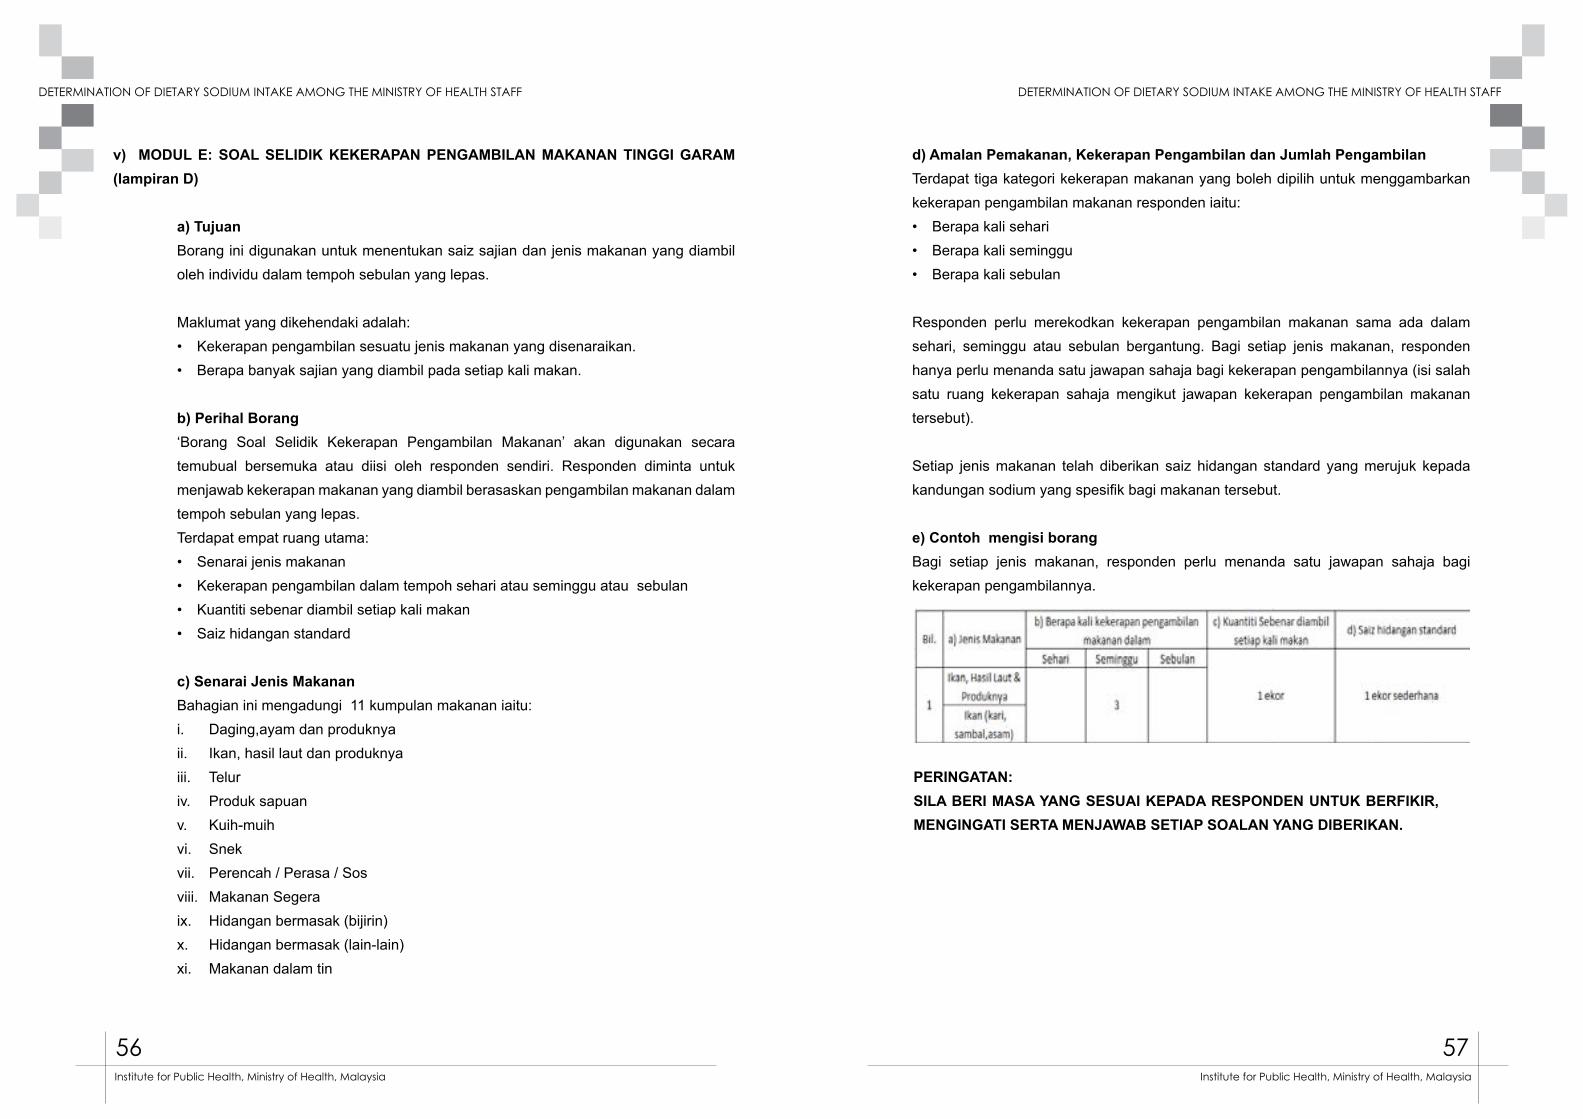
56 57
DETERMINATION OF DIETARY SODIUM INTAKE AMONG THE MINISTRY OF HEALTH STAFF DETERMINATION OF DIETARY SODIUM INTAKE AMONG THE MINISTRY OF HEALTH STAFF
Institute for Public Health, Ministry of Health, Malaysia Institute for Public Health, Ministry of Health, Malaysia
v) MODUL E: SOAL SELIDIK KEKERAPAN PENGAMBILAN MAKANAN TINGGI GARAM (lampiran D)
a) TujuanBorang ini digunakan untuk menentukan saiz sajian dan jenis makanan yang diambil oleh individu dalam tempoh sebulan yang lepas.
Maklumat yang dikehendaki adalah:• Kekerapan pengambilan sesuatu jenis makanan yang disenaraikan.• Berapa banyak sajian yang diambil pada setiap kali makan.
b) Perihal Borang‘Borang Soal Selidik Kekerapan Pengambilan Makanan’ akan digunakan secara temubual bersemuka atau diisi oleh responden sendiri. Responden diminta untuk menjawab kekerapan makanan yang diambil berasaskan pengambilan makanan dalam tempoh sebulan yang lepas.Terdapat empat ruang utama:• Senarai jenis makanan• Kekerapan pengambilan dalam tempoh sehari atau seminggu atau sebulan • Kuantiti sebenar diambil setiap kali makan• Saiz hidangan standard
c) Senarai Jenis MakananBahagian ini mengadungi 11 kumpulan makanan iaitu: i. Daging,ayam dan produknyaii. Ikan, hasil laut dan produknya iii. Teluriv. Produk sapuanv. Kuih-muihvi. Snekvii. Perencah / Perasa / Sosviii. Makanan Segeraix. Hidangan bermasak (bijirin)x. Hidangan bermasak (lain-lain)xi. Makanan dalam tin
d) Amalan Pemakanan, Kekerapan Pengambilan dan Jumlah PengambilanTerdapat tiga kategori kekerapan makanan yang boleh dipilih untuk menggambarkan kekerapan pengambilan makanan responden iaitu:• Berapa kali sehari• Berapa kali seminggu• Berapa kali sebulan
Responden perlu merekodkan kekerapan pengambilan makanan sama ada dalam sehari, seminggu atau sebulan bergantung. Bagi setiap jenis makanan, responden hanya perlu menanda satu jawapan sahaja bagi kekerapan pengambilannya (isi salah satu ruang kekerapan sahaja mengikut jawapan kekerapan pengambilan makanan tersebut).
Setiap jenis makanan telah diberikan saiz hidangan standard yang merujuk kepada kandungan sodium yang spesifik bagi makanan tersebut.
e) Contoh mengisi borangBagi setiap jenis makanan, responden perlu menanda satu jawapan sahaja bagi kekerapan pengambilannya.
PERINGATAN: SILA BERI MASA YANG SESUAI KEPADA RESPONDEN UNTUK BERFIKIR, MENGINGATI SERTA MENJAWAB SETIAP SOALAN YANG DIBERIKAN.
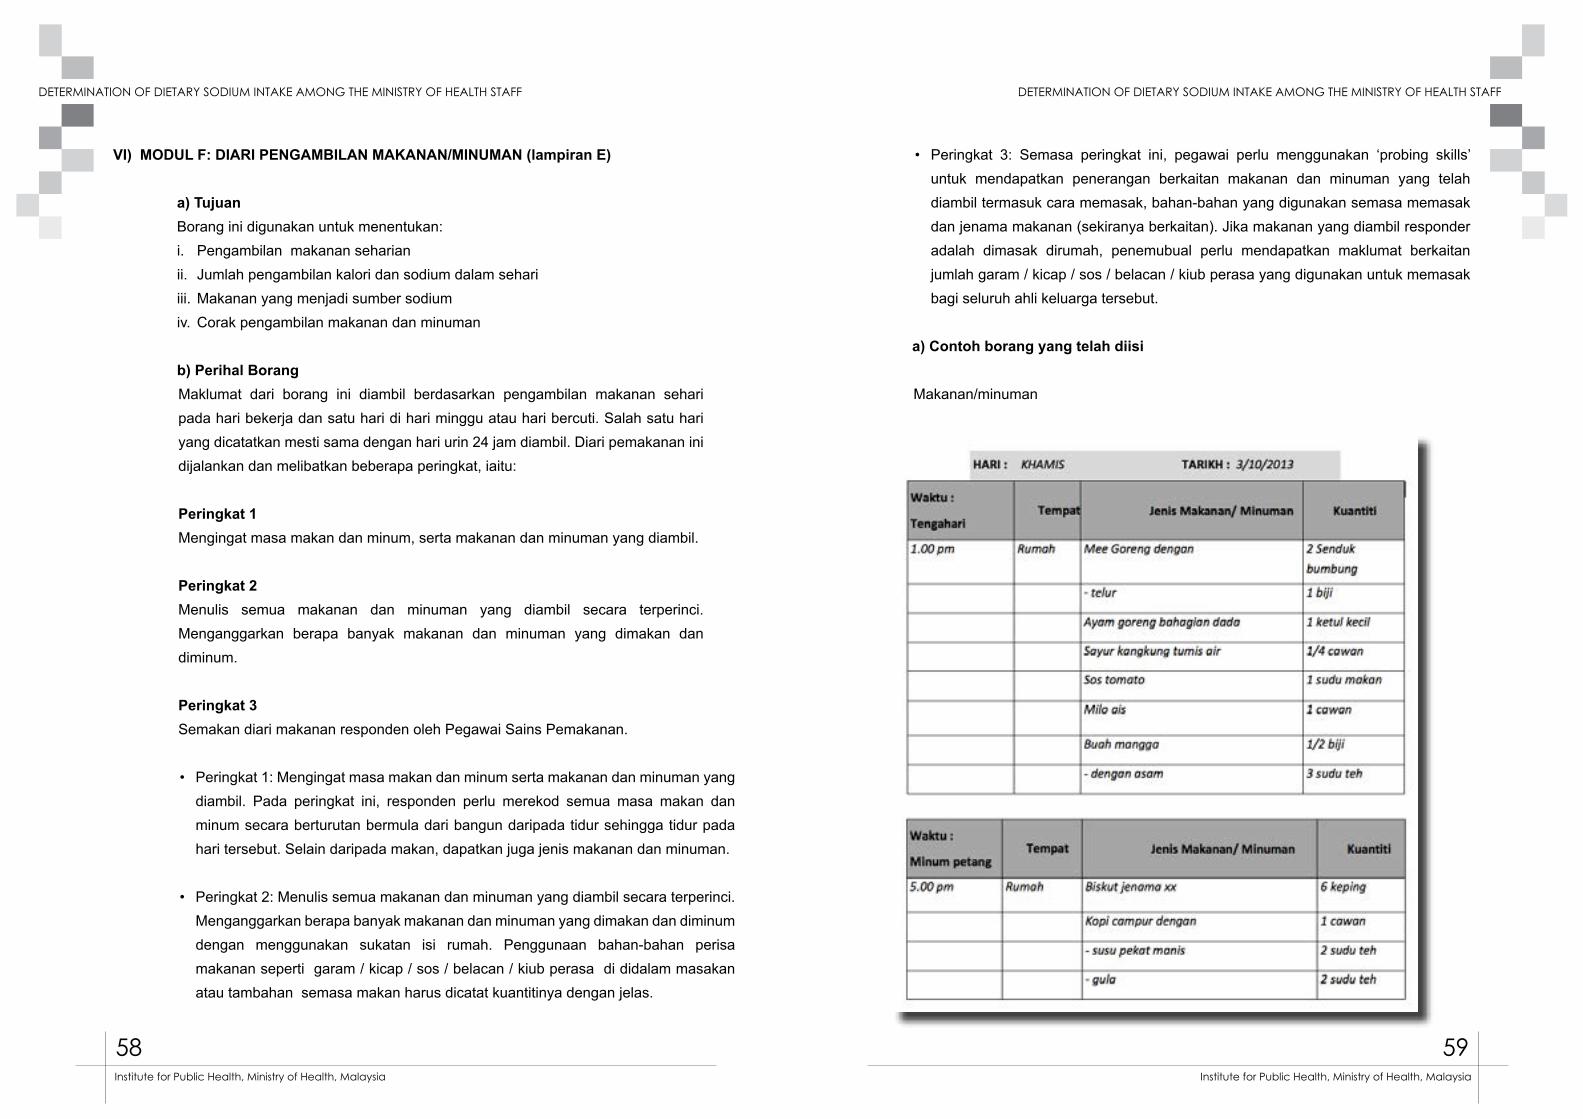
58 59
DETERMINATION OF DIETARY SODIUM INTAKE AMONG THE MINISTRY OF HEALTH STAFF DETERMINATION OF DIETARY SODIUM INTAKE AMONG THE MINISTRY OF HEALTH STAFF
Institute for Public Health, Ministry of Health, Malaysia Institute for Public Health, Ministry of Health, Malaysia
VI) MODUL F: DIARI PENGAMBILAN MAKANAN/MINUMAN (lampiran E)
a) Tujuan Borang ini digunakan untuk menentukan:i. Pengambilan makanan seharianii. Jumlah pengambilan kalori dan sodium dalam sehariiii. Makanan yang menjadi sumber sodiumiv. Corak pengambilan makanan dan minuman
b) Perihal BorangMaklumat dari borang ini diambil berdasarkan pengambilan makanan sehari pada hari bekerja dan satu hari di hari minggu atau hari bercuti. Salah satu hari yang dicatatkan mesti sama dengan hari urin 24 jam diambil. Diari pemakanan ini dijalankan dan melibatkan beberapa peringkat, iaitu:
Peringkat 1 Mengingat masa makan dan minum, serta makanan dan minuman yang diambil.
Peringkat 2 Menulis semua makanan dan minuman yang diambil secara terperinci. Menganggarkan berapa banyak makanan dan minuman yang dimakan dan diminum.
Peringkat 3 Semakan diari makanan responden oleh Pegawai Sains Pemakanan.
• Peringkat 1: Mengingat masa makan dan minum serta makanan dan minuman yang diambil. Pada peringkat ini, responden perlu merekod semua masa makan dan minum secara berturutan bermula dari bangun daripada tidur sehingga tidur pada hari tersebut. Selain daripada makan, dapatkan juga jenis makanan dan minuman.
• Peringkat 2: Menulis semua makanan dan minuman yang diambil secara terperinci. Menganggarkan berapa banyak makanan dan minuman yang dimakan dan diminum dengan menggunakan sukatan isi rumah. Penggunaan bahan-bahan perisa makanan seperti garam / kicap / sos / belacan / kiub perasa di didalam masakan atau tambahan semasa makan harus dicatat kuantitinya dengan jelas.
• Peringkat 3: Semasa peringkat ini, pegawai perlu menggunakan ‘probing skills’ untuk mendapatkan penerangan berkaitan makanan dan minuman yang telah diambil termasuk cara memasak, bahan-bahan yang digunakan semasa memasak dan jenama makanan (sekiranya berkaitan). Jika makanan yang diambil responder adalah dimasak dirumah, penemubual perlu mendapatkan maklumat berkaitan jumlah garam / kicap / sos / belacan / kiub perasa yang digunakan untuk memasak bagi seluruh ahli keluarga tersebut.
a) Contoh borang yang telah diisi
Makanan/minuman
60 61
DETERMINATION OF DIETARY SODIUM INTAKE AMONG THE MINISTRY OF HEALTH STAFF DETERMINATION OF DIETARY SODIUM INTAKE AMONG THE MINISTRY OF HEALTH STAFF
Institute for Public Health, Ministry of Health, Malaysia Institute for Public Health, Ministry of Health, Malaysia
b) Prosedur Pengumpulan Sampel Urin 24 Jam Dan Spot Urine
1. Pra pengumpulan urin
i. Responden perlu memastikan semua perkakas yang digunakan untuk mengumpul urin telah diterima dan dalam keadaan baik. Berikut adalah senarai peralatan yang digunakan untuk mengumpul urin :
ii. Urin 24 jam : Kotak 2.5 liter ( 1 unit), cawan plastik 500 ml (3 unit), beg nylon
iii. ( 1 unit), label urin 24 jam ( 1 keping)
iv. Spot Urine : Beg urin 1 liter (1 unit), cawan plastik (1 unit), label Spot Urine (1 keping).
v. Responden boleh mengumpul urin pada hari yang mana proses pengumpulan urin 24 jam dan Spot Urine mudah dilakukan, sama ada ketika hari bercuti di rumah atau semasa hari bekerja.
vi. Pengumpulan urin 24 jam bermula dari urination ke dua pada hari pertama sehingga urination pertama pada hari kedua. Manakala Spot Urine diambil dari urination ke dua pada hari kedua pengumpulan data.
vii. Sekiranya responden mengalami masalah kesihatan yang menyukarkan pengumpulan urine dilakukan seperti demam dan cirit-birit, sila maklumkan kepada pasukan penyelidik untuk menunda pengumpulan urin pada hari lain.
viii. Responden adalah dilarang berpuasa pada hari pengumpulan urin dijalankan, kerana ini akan menjejaskan jumlah pengeluaran urin.
ix. Responden wanita tidak digalakkan untuk membuat pengumpulan urin pada hari kedatangan haid yang banyak.
2. Semasa pengumpulan urin
i. Responden perlu menulis nama, kad pengenalan dan ID pada label yang disediakan.
ii. Responden juga perlu mencatatkan tarikh serta masa pengumpulan urin bermula dan berakhir pada label bekas urin 24 jam dan masa serta tarikh bagi bekas Spot Urine.
iii. Pengumpulan urin 24 jam bermula dari hari pertama (urin kedua) sehingga hari kedua (urin pertama pada waktu pagi). Manakala Spot Urine dikumpul sekali iaitu pada hari kedua (urin kedua).
iv. Urin 24 jam mesti diumpulkan secara berterusan sepanjang 24 jam pada pada hari tersebut. Pada setiap kali urin dikumpulkan, pastikan masa dan tarikh dicatatkan pada label bekas pengumpul urin. Sekiranya ada sebarang urin yang tertinggal (tertumpah atau terlupa kumpul) sila catatkan masa, tarikh dalam ruang catatan pada label yang disediakan.
v. Gunakan cawan pengumpul urin untuk menadah air kencing sebelum dipindahkan ke bekas pengumpul urin 24 jam atau Spot Urine.
vi. Responden perlu memastikan bekas pengumpul urin tersebut ditutup dengan kemas dan cermat setiap kali pengumpulan dilakukan untuk mengelakkan sebarang tumpahan urin.
vii. Sekiranya responden ingin membuang air besar, pastikan urin dikumpulkan terlebih dahulu ke dalam bekas pengumpul urin.
viii. Pastikan semasa pengumpulan urin dilakukan, tiada bahan-bahan yang mencemari sampel urin seperti tisu di dalam sampel tersebut.
ix. Responden juga perlu memastikan bekas tempat pengumpulan urin disimpan di tempat yang dingin atau tidak melebihi suhu bilik (25°C).
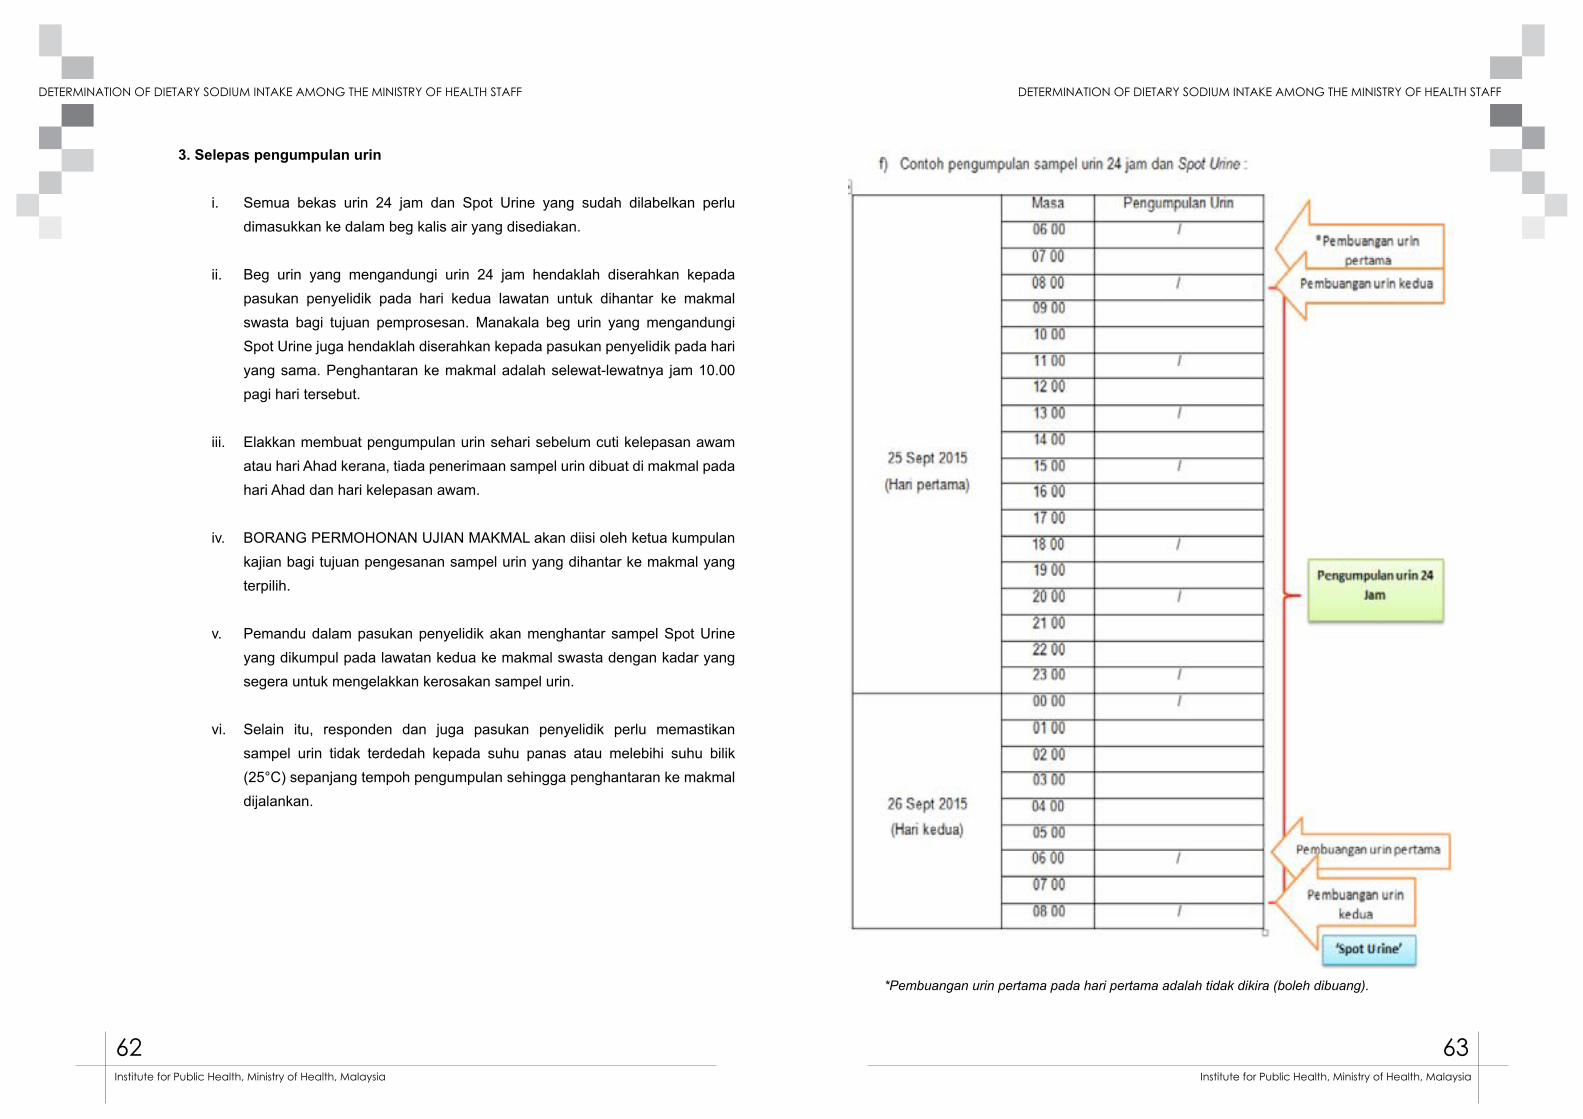
62 63
DETERMINATION OF DIETARY SODIUM INTAKE AMONG THE MINISTRY OF HEALTH STAFF DETERMINATION OF DIETARY SODIUM INTAKE AMONG THE MINISTRY OF HEALTH STAFF
Institute for Public Health, Ministry of Health, Malaysia Institute for Public Health, Ministry of Health, Malaysia
3. Selepas pengumpulan urin
i. Semua bekas urin 24 jam dan Spot Urine yang sudah dilabelkan perlu dimasukkan ke dalam beg kalis air yang disediakan.
ii. Beg urin yang mengandungi urin 24 jam hendaklah diserahkan kepada pasukan penyelidik pada hari kedua lawatan untuk dihantar ke makmal swasta bagi tujuan pemprosesan. Manakala beg urin yang mengandungi Spot Urine juga hendaklah diserahkan kepada pasukan penyelidik pada hari yang sama. Penghantaran ke makmal adalah selewat-lewatnya jam 10.00 pagi hari tersebut.
iii. Elakkan membuat pengumpulan urin sehari sebelum cuti kelepasan awam atau hari Ahad kerana, tiada penerimaan sampel urin dibuat di makmal pada hari Ahad dan hari kelepasan awam.
iv. BORANG PERMOHONAN UJIAN MAKMAL akan diisi oleh ketua kumpulan kajian bagi tujuan pengesanan sampel urin yang dihantar ke makmal yang terpilih.
v. Pemandu dalam pasukan penyelidik akan menghantar sampel Spot Urine yang dikumpul pada lawatan kedua ke makmal swasta dengan kadar yang segera untuk mengelakkan kerosakan sampel urin.
vi. Selain itu, responden dan juga pasukan penyelidik perlu memastikan sampel urin tidak terdedah kepada suhu panas atau melebihi suhu bilik (25°C) sepanjang tempoh pengumpulan sehingga penghantaran ke makmal dijalankan.
*Pembuangan urin pertama pada hari pertama adalah tidak dikira (boleh dibuang).

64 65
DETERMINATION OF DIETARY SODIUM INTAKE AMONG THE MINISTRY OF HEALTH STAFF DETERMINATION OF DIETARY SODIUM INTAKE AMONG THE MINISTRY OF HEALTH STAFF
Institute for Public Health, Ministry of Health, Malaysia Institute for Public Health, Ministry of Health, Malaysia
3. SENARAI SEMAK PERALATAN LAPANGAN a) Alat penimbangb) Bodymeterc) Pita pengukurd) Sphygnomanometer elektronik e) Urin 24 jam : Kotak 2.5 liter (1 unit), cawan plastik 500 ml (3 unit), beg nylon (1 unit), label
urin 24 jam (1 keping)f) Spot Urine : Beg urin 1 liter (1 unit), cawan plastik (1 unit), label Spot Urine (1 keping).
Figura 1 : Kotak 2.5 liter
Figura 3 : Beg nylon
Figura 2 : Cawan plastik 500ml
Figura 4 : Beg urin pakai buang
4. TERMA RUJUKAN ANGGOTA PASUKAN PENGUMPUL DATA
1. Pegawai Perhubungan Negeri (Liaison Officer)Di setiap Jabatan Kesihatan Negeri dan Ibu Pejabat KKM, Pegawai Sains Pemakanan bertindak sebagai Pegawai Perhubungan Negeri (Liaison Officer). Manakala di Institut-institut Penyelidikan Kesihatan, Pegawai Penyelidik akan menggalas tanggungjawab tersebut.
Tugas dan tanggungjawab mereka adalah seperti berikut:i. Bertindak sebagai pegawai yang akan dihubungi berkaitan ‘Kajian MySalt 2015’
di negeri masing-masing.
ii. Membantu proses pengumpulan maklumat dan senarai nama anggota responden kajian yang layak dari Jabatan Kesihatan Negeri/IPKKM/institut masing-masing untuk tujuan persampelan.
iii. Membantu mengenal pasti ahli-ahli pengumpul data yang terdiri dari Pegawai Sains Pemakanan (2), Jururawat / Pembantu Perubatan ( 2),Pemandu (1) serta melantik ketua kumpulan dalam pasukan pengumpul data tersebut.
iv. Memastikan ahli pengumpul data terpilih mendapat surat perlantikan dari Institut Kesihatan Umum dan dan mendapat pelepasan dari ketua jabatan untuk penglibatan dalam kajian MySalt 2015.
v. Mendapatkan peralatan pengukuran fizikal seperi penimbang berat badan, pengukur ketinggian, set pengukur tekanan darah dan pengukur lilit pinggang yang telah dikalibrasi.
vi. Mengenal pasti lokasi yang sesuai untuk memberi taklimat kepada responden kajian, menempatkan peralatan pengumpulan data, menemubual responden, tempat pengumpulan sampel urin sebelum ke makmal dan lokasi penyimpanan borang-borang sebelum dikembalikan ke IKU.
vii. Menghadiri mesyuarat/ bengkel / kursus yang berkaitan dengan kajian MySalt 2015. Membuat penyelarasan waktu penghantaran sampel urin ke makmal.
66 67
DETERMINATION OF DIETARY SODIUM INTAKE AMONG THE MINISTRY OF HEALTH STAFF DETERMINATION OF DIETARY SODIUM INTAKE AMONG THE MINISTRY OF HEALTH STAFF
Institute for Public Health, Ministry of Health, Malaysia Institute for Public Health, Ministry of Health, Malaysia
viii. Membuat hebahan awal dan taklimat kepada pihak terbabit tentang kajian MySalt 2015 diperingkat jabatan masing-masing.
ix. Menyelia proses pengumpulan data supaya berjalan dengan lancar sehingga kajian tamat.
x. Menyelaraskan masa dengan pihak IKU untuk mengembalikan semula borang-borang responden apabila tamat kajian.
2. Ketua Kumpulan Pasukan Pengumpul DataKetua kumpulan pasukan pengumpul data terdiri dari kalangan anggota Bahagian Kawalan Penyakit.
Tugas ketua pasukan pengumpul data adalah:
Pra pengumpulan datai. Memaklumkan dan menerangkan kepada responden yang terpilih tentang kajian
MySalt 2015.
ii. Merancang jadual pengumpulan data untuk kesemua responden yang terpilih sepanjang tempoh pengumpulan data.
iii. Menetapkan tarikh temujanji untuk lawatan pertama dan lawatan kedua responden.
iv. Mengenal pasti tarikh yang sesuai untuk pengambilan urin 24 jam dan Spot Urine para responden.
v. Memastikan peralatan pengukuran antropometri, pengumpulan urin dan borang-borang yang akan digunakan semasa pengumpulan data adalah lengkap dan mencukupi.
vi. Memastikan ahli pasukan pengumpul data mencukupi sepanjang pengumpulan data dijalankan. Sebarang masalah berkenaan ahli pasukan pengumpul data hendaklah dimaklumkan kepada pegawai perhubungan negeri.
Semasa pengumpulan datai. Menerangkan prosedur kajian yang akan dijalankan kepada responden.
ii. Memastikan senarai semak pengumpulan data pada lawatan pertama dan kedua seperti yang dicatat di dalam manual kajian dipatuhi.
iii. Menyelia agihan dan pengisian borang-borang oleh responden dalam kajian.
iv. Memastikan responden memahami dengan jelas cara-cara mengisi borang dan diari yang digunakan dalam kajian.
v. Memastikan peralatan-peralatan untuk pengumpulan urin 24 jam dan Spot Urine diagihkan kepada responden. Berikut adalah peralatan yang diperlukan bagi pengumpulan urin.
vi. Prosedur pengumpulan urin diterangkan dengan jelas kepada responden pada lawatan pertama. Panduan lengkap boleh dirujuk dalam manual kajian.
vii. Memastikan pengukuran antropometri dan tekanan darah tinggi telah diambil menggunakan instrumen yang telah disediakan dan dikalibrasi serta merekodkan keputusan dalam ‘Borang Kaji Selidik Pengambilan Garam’.
viii. Memastikan responden sudah mendapat penjelasan tentang kaedah untuk merekodkan ‘Borang Kekerapan Pegambilan Makanan Tinggi Garam’ dan diari pengambilan makanan/minuman oleh Pegawai Sains Pemakanan.
ix. Memastikan urin yang sudah dikumpul untuk penghantaran ke makmal ditempatkan di tempat yang sesuai bagi mengelakkan kerosakan pada sampel.
x. Memastikan responden melabelkan dengan lengkap setiap bekas urin 24 jam dan Spot Urine dengan label yang disediakan.
xi. Memastikan masa penghantaran sampel urin 24 jam dan Spot Urine ke makmal mengikut masa yang ditetapkan.
xii. Mengesahkan borang penghantaran sampel urin ke makmal untuk tujuan verifikasi.
68 69
DETERMINATION OF DIETARY SODIUM INTAKE AMONG THE MINISTRY OF HEALTH STAFF DETERMINATION OF DIETARY SODIUM INTAKE AMONG THE MINISTRY OF HEALTH STAFF
Institute for Public Health, Ministry of Health, Malaysia Institute for Public Health, Ministry of Health, Malaysia
xiii. Memaklumkan progress pengumpulan data kepada penyelaras kajian di IKU setiap minggu. Mengisi ‘BORANG PENERIMAAN REKOD KAJIAN’ sebagai rekod penerimaan maklumat responden.
xiv. Memastikan borang-borang yang sudah diisi oleh responden dikumpulkan dan disusun mengikut kod ID responden untuk dikembalikan ke IKU bagi tujuan analisa dan proses selanjutnya.
3. Pegawai Sains Pemakanani. Menerangkan kaedah mengisi diari pengambilan makanan dan menjawab
soalan kekerapan pengambilan makanan tinggi garam kepada responden.
ii. Memastikan responden memilih satu hari hujung minggu / bercuti dan satu tarikh bekerja untuk mencatat diari makanan. Salah satu hari tersebut mestilah hari yang sama pengambilan urin 24 jam dilakukan.
iii. Memastikan pengisian ‘Borang Kekerapan Pengambilan Makanan’ adalah merujuk kepada pengambilan makanan dalam tempoh sebulan yang lepas.
iv. Melakukan semakan terhadap diari pengambilan makanan dan ‘Borang Kekerapan Pengambilan Makanan’ semasa penyerahan borang dilakukan pada lawatan kedua.
4. Jururawat atau pembantu perubatan
i. Bertanggungjawab melakukan pengukuran berat, tinggi, ukur lilit pinggang dan tekanan darah responden.
ii. Memastikan peralatan yang digunakan untuk mengukur dalam keadaan baik dan dikalibrasi.
iii. Merekodkan semua bacaan pengukuran di dalam ‘Modul D Borang Kajian Pengambilan Garam’.
iv. Mengagih barang-barang untuk pengumpulan urin dan memasang kotak urin 24 jam untuk diagihkan kepada responden kajian.
v. Mengagihkan borang dan menerangkan kaedah mengisi ‘Borang Kajian Pengambilan Garam’.
vi. Menerima, mengurus dan menyimpan sampel urin 24 jam dan sampel Spot Urine yang diserahkan oleh responden di dalam bilik berhawa dingin atau mana-mana lokasi yang sesuai (tidak panas).
vii. Menerima, menyusun dan menyimpan borang-borang kajian yang diterima oleh responden.
viii. Mencatat ID responden di setiap borang dan label yang diserahkan kepada responden.
ix. Mengisi ‘Borang Penghantaran Sampel Urin’ sebelum dihantar ke makmal untuk analisa.
x. Bersama-sama dengan pemandu untuk menghantar sampel urin ke makmal.
xi. Memaklumkan sebarang masalah berkaitan pengumpulan data dengan ketua kumpulan.
5. Pemandu
i. Bertanggungjawab terus kepada ketua kumpulan kajian.
ii. Menghantar sampel urin 24 jam dan Spot Urine mengikut masa yang telah ditetapkan oleh ketua kumpulan.
iii. Memastikan sampel dalam keadaan baik semasa penghantaran ke makmal.
iv. Tugas-tugas lain yang diarahkan oleh ketua kumpulan dan Liason Officer.

70 71
DETERMINATION OF DIETARY SODIUM INTAKE AMONG THE MINISTRY OF HEALTH STAFF DETERMINATION OF DIETARY SODIUM INTAKE AMONG THE MINISTRY OF HEALTH STAFF
Institute for Public Health, Ministry of Health, Malaysia Institute for Public Health, Ministry of Health, Malaysia
Pengurusan Data MySalt 2015
Pengurusan data MySalt 2015 akan dilakukan di Institut Kesihatan Umum (IKU). Data Perlu dihantar ke IKU pada setiap hari Isnin bermula 2 November 2015 sepanjang tempoh pengumpulan data. Berikut adalah jadual penghantaran soal selidik dan sampel urin.
Jadual 1. Penghantaran soal selidik dan sampel urin dari lapangan
Secara amnya, aktiviti pengurusan data ini akan dibahagikan kepada 4 bahagian iaitu :1. Bahagian A – Pengumpulan dan penghantaran soal selidik dari lapangan2. Bahagian B – Analisis soal selidik individu3. Bahagian C – Analisis diari pengambilan makanan4. Bahagian D – Analisis sampel urin
Berikut adalah carta alir pengurusan data bermula dari pengumpulan data di lapangan hingga kewujudan pengkalan data untuk proses analisis.
No. Tarikh
Zon terlibat Bil.soal selidik
dihantar
Bil.sampel urin
dihantar
Nama penghantar
Catatan
1 2015
2 Nov
2 2015
9 Nov
3 2015
16 Nov
4 2015
23 Nov
5 2015
30 Nov
Carta alir pengurusan data MySalt
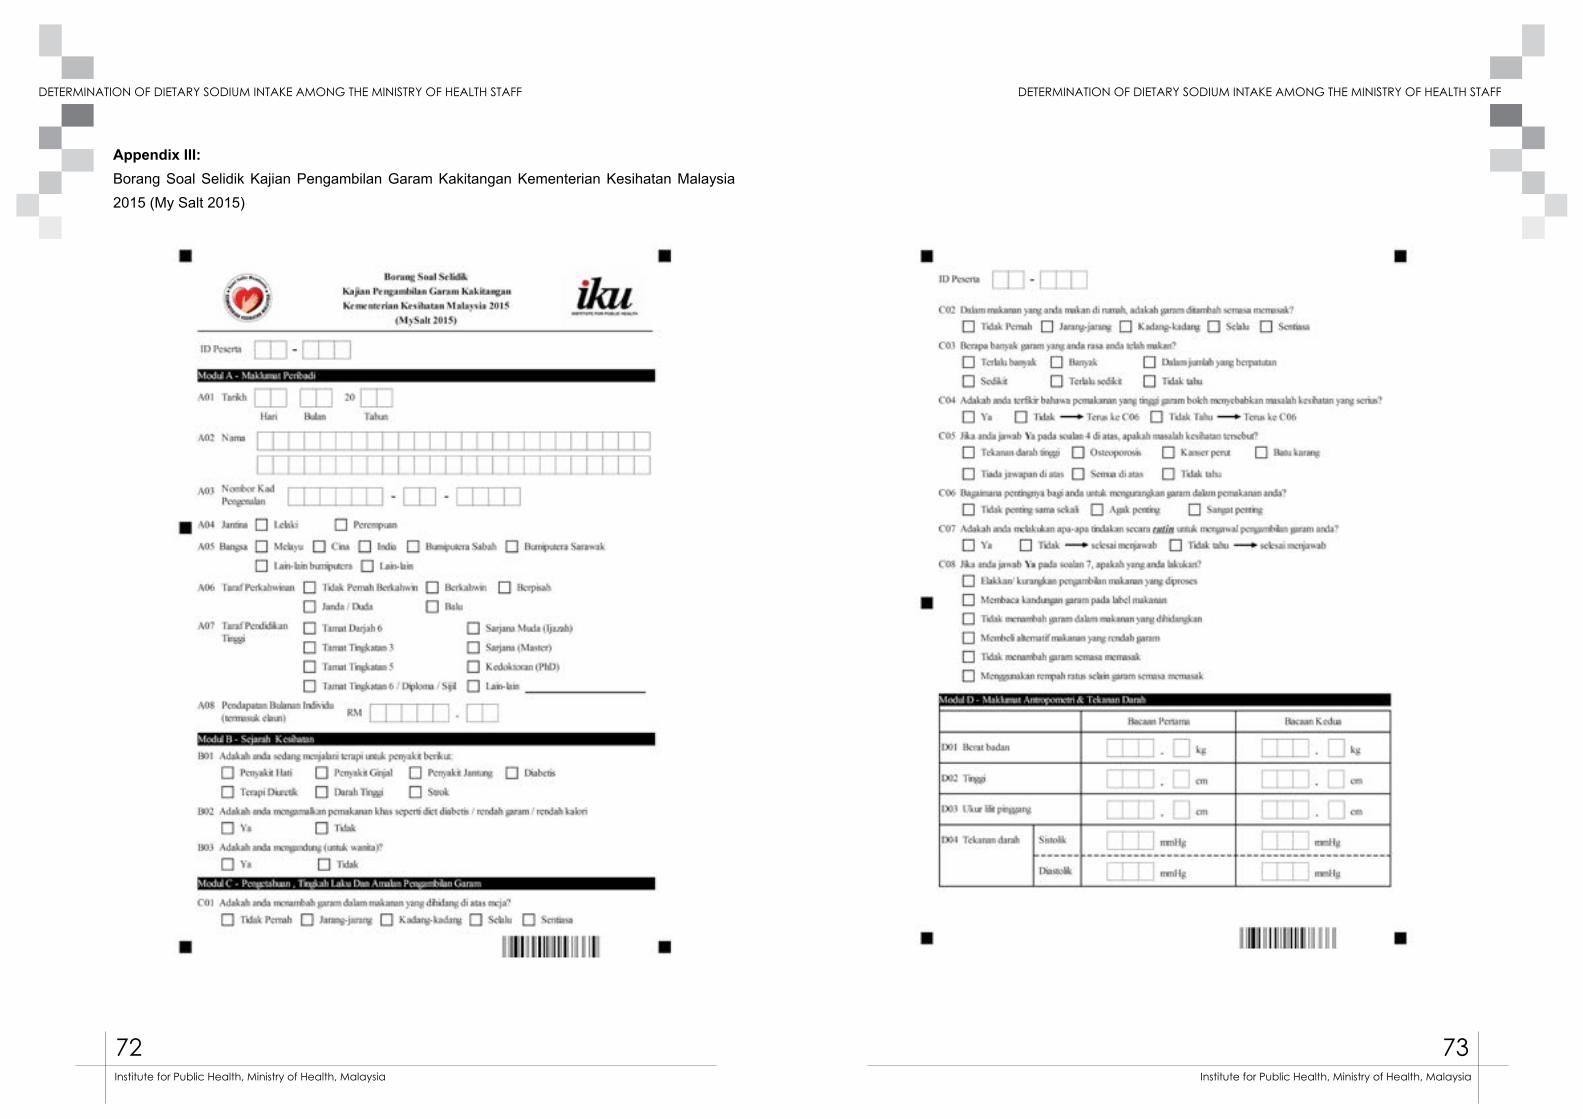
72 73
DETERMINATION OF DIETARY SODIUM INTAKE AMONG THE MINISTRY OF HEALTH STAFF DETERMINATION OF DIETARY SODIUM INTAKE AMONG THE MINISTRY OF HEALTH STAFF
Institute for Public Health, Ministry of Health, Malaysia Institute for Public Health, Ministry of Health, Malaysia
Appendix III:Borang Soal Selidik Kajian Pengambilan Garam Kakitangan Kementerian Kesihatan Malaysia 2015 (My Salt 2015)
Appendix 111: Borang Soal Selidik Kajian Pengambilan Garam Kakitangan
Kementerian Kesihatan Malaysia 2015 (My Salt 2015)
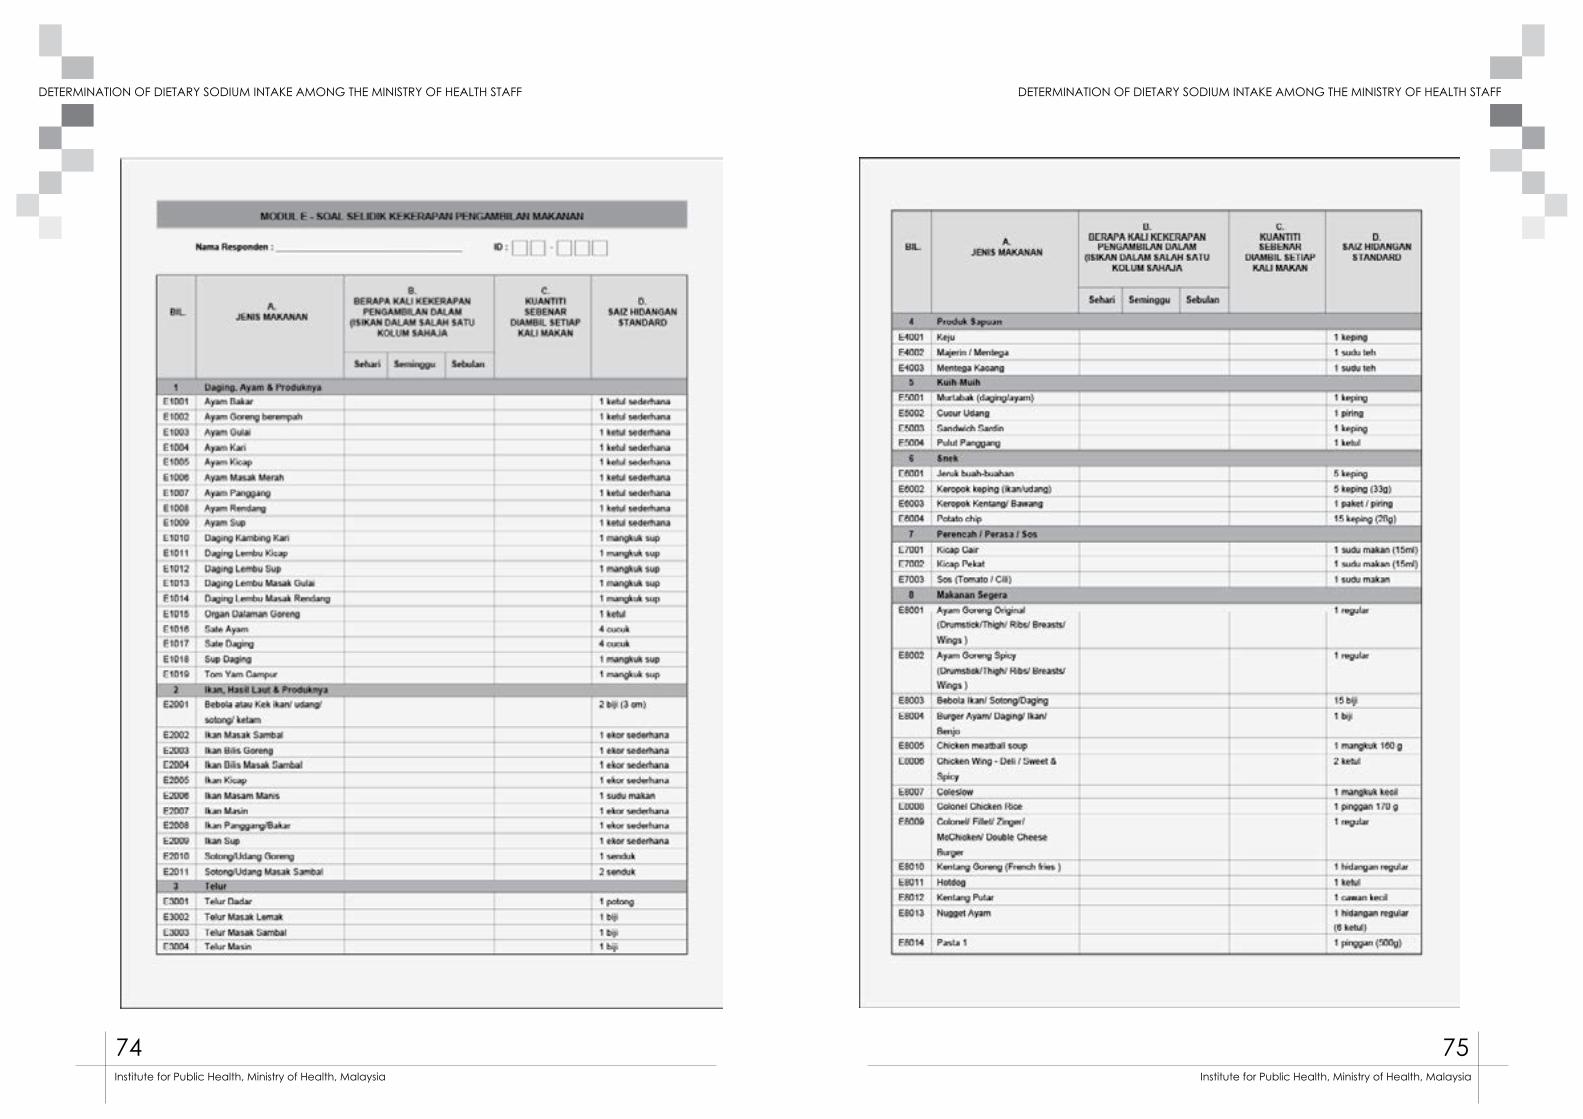
74 75
DETERMINATION OF DIETARY SODIUM INTAKE AMONG THE MINISTRY OF HEALTH STAFF DETERMINATION OF DIETARY SODIUM INTAKE AMONG THE MINISTRY OF HEALTH STAFF
Institute for Public Health, Ministry of Health, Malaysia Institute for Public Health, Ministry of Health, Malaysia
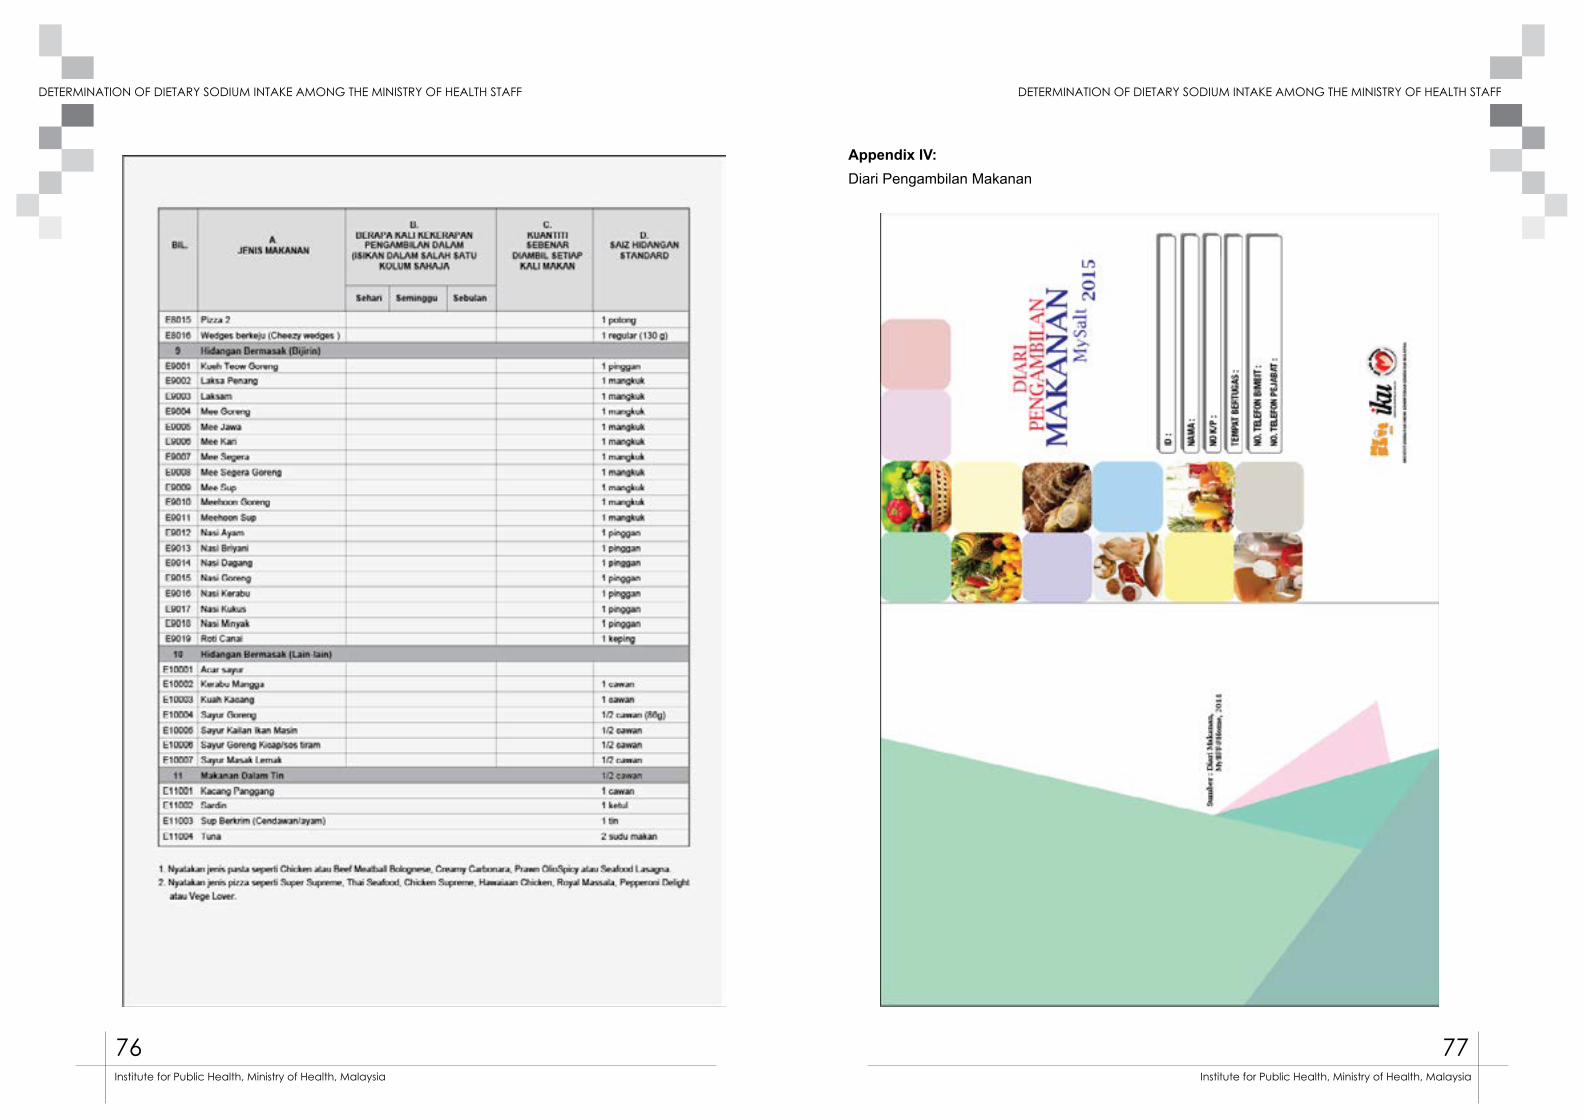
76 77
DETERMINATION OF DIETARY SODIUM INTAKE AMONG THE MINISTRY OF HEALTH STAFF DETERMINATION OF DIETARY SODIUM INTAKE AMONG THE MINISTRY OF HEALTH STAFF
Institute for Public Health, Ministry of Health, Malaysia Institute for Public Health, Ministry of Health, Malaysia
Appendix IV: Diari Pengambilan Makanan
78 79
DETERMINATION OF DIETARY SODIUM INTAKE AMONG THE MINISTRY OF HEALTH STAFF DETERMINATION OF DIETARY SODIUM INTAKE AMONG THE MINISTRY OF HEALTH STAFF
Institute for Public Health, Ministry of Health, Malaysia Institute for Public Health, Ministry of Health, Malaysia
B
OR
AN
G P
ER
MO
HO
NA
N U
JIA
N M
AK
MA
L (
MY
SAL
T 2
015-
IKU
)
No
N
ama
pese
rta
N
o ka
d pe
ngen
alan
ID
Res
pond
en
B
angs
a
Ja
ntin
a
Spes
imen
24
H
Uri
ne
Spot
U
rine
L
P
2
4H U
rine
Spot
Uri
ne
So
dium
&
Cre
atin
ine
So
dium
&
Cre
atin
ine
Tarik
h
Mas
a m
ula
kum
pul
Mas
a
tam
at
kum
pul
Tarik
h M
asa
kum
pul
Dis
ahka
n ol
eh (
ketu
a ku
mpu
lan)
:___
____
____
____
_
Pege
saha
n m
akm
al :_
____
____
____
____
__
Tarik
h
:___
____
____
____
__
T
arik
h
:___
____
____
____
____
Appendix V : Borang permohonan Ujian Makmal (Mysalt 2015)
Appendix VI : List of Liaison officers
No
1
2
3
4
5
6
7
8
9
10
11
12
13
14
15
16
17
18
19
Name
En Khairuinizam Baharum
Pn Suriana Johari
Pn Zuhaida Harun
Pn Zuraini Abdullah
Pn Jamilah Ahmad
Pn Fatimah Sulong
En Ja’afar Mohamed
En Yahya Ahmad
Pn Zahariah Mohd Nordin
Pn Puspawati Mohamed
Pn Ruhaya Salleh
En Tan Beng Chin
Cik Rafidah Yusof
Pn Azah Ahmad
Dr Bariah binti Kadas
En Azhar Yusoff
Pn. Siti Shuhailah Shaikh Abdul Rahim
Pn Siti Farah Zaidah Mohd Yazid
En. Mohammad Fuad b.Mohamad Annuar
State
Perlis
Kedah
Pulau Pinang
Perak
Melaka
Negeri Sembilan
Selangor
Johor
Pahang
Kelantan
Terengganu
Sarawak
Sabah
Wilayah Persekutuan, Kuala Lumpur
Wilayah Persekutuan, Kuala Lumpur
Wilayah Persekutuan, Putrajaya
Wilayah Persekutuan, Putrajaya
Wilayah Persekutuan, Putrajaya
Institut Kesihatan Umum and NIH


![Dietary Intake of Sodium Chloride [3H]Nitrendipine ...dm5migu4zj3pb.cloudfront.net/manuscripts/112000/112223/JCI85112223.pdf · ofthe gland. Aortic tissue in 9 ml ofbuffer anduterine](https://img.dokumen.tips/doc/110x75/5cde75d088c9939e658d030e/dietary-intake-of-sodium-chloride-3hnitrendipine-ofthe-gland-aortic-tissue.jpg)