Embed Size (px)
Citation preview
Copyright © National Academy of Sciences. All rights reserved.
Dietary Reference Intakes for Calcium and Vitamin D
7
Dietary Intake Assessment
Conducting an intake assessment—after the available scientific data have allowed the estimation of reference values (see Chapters 5 and 6)—is one of the hallmarks of nutrient risk assessment. Estimates of population intake (i.e., “exposure”) are obtained, and these are examined in view of the estimated reference values. When information is available, consider-ation of biochemical and clinical measures of nutriture is a useful adjunct to the intake assessment and can provide important information about the adequacy of intake as well as excess intake.
In the case of the United States and Canada, data from national gov-ernment surveys form the basis for the intake assessment. In this chapter, the national surveys are described first. Then information about calcium intake is presented, followed by information about vitamin D intake and serum 25-hydroxyvitamin D (25OHD) concentrations. In this report, the term “dietary intake” includes the intake of foods and supplements and is also referred to as “total intake.”
THE NATIONAL SURVEYS AND APPROACH USED
Nutrient intake data for the intake assessment are available through the websites for the national surveys in each country. The U.S. survey data are reported on the basis of Dietary Reference Intake (DRI) life stage groups and are divided by males and females rather than combined. In the case of intake estimates, Canadian data are reported for children ages 1 to 3 and 4 to 8 years without distinction by gender, but they are reported on the basis of males and females for the older groups. Serum 25OHD
457
Copyright © National Academy of Sciences. All rights reserved.
Dietary Reference Intakes for Calcium and Vitamin D
458 DIETARY REFERENCE INTAKES FOR CALCIUM AND VITAMIN D
levels for Canadians are collected for persons between the ages of 6 and 79 years. However, in arranging these data from survey age/sex groups into the DRI life stage groups, sample sizes did not allow adequate representa-tion for children less than 9 years of age. Therefore, the data were used to construct values for the DRI life stage groups only between ages 9 to 79 years for Canadians. In addition, neither country reports data for infants 0 to 12 months of age or for pregnant and lactating women; sample sizes for these groups are too low in the surveys to provide nationally representative estimates.
United States: The National Health and Nutrition Examination Survey
Information about the U.S. National Health and Nutrition Examina-tion Survey (NHANES) is available from the survey’s main website,1 and is therefore only summarized here. In the 1960s, the U.S. government initi-ated the National Health Examination Survey to assess the health status of individuals ages 6 months through 74 years. Nutritional intake was added as a survey component in the 1970s, beginning with the first NHANES, known as NHANES I (1971 to 1974). NHANES II covered the time period 1976 to 1980, and NHANES IIII encompassed 1988 to 1994. NHANES has reflected a continuous and standardized data collection based on a representative sample of the U.S. population and provides critical diet and health measures for federal program planning and policy making. The survey relies on the gold standard for dietary intake measures, two or more 24-hour dietary recalls per person (IOM, 2000). The U.S. Depart-ment of Agriculture’s (USDA’s) food composition database has provided the sources of information that allow the estimates of food intake collected in the NHANES to be translated into quantitative nutrient intake (Bodner-Montville et al., 2006; Briefel, 2006).
In 1999, the survey became a continuous program that has a changing focus on a variety of health and nutrition measurements to meet emerging needs;2 the survey data are reported on the basis of 2-year periods. The survey now examines a nationally representative sample of about 5,000 per-sons each year. These persons are located in counties across the country, 15 of which are visited each year.3 The NHANES and related food intake surveys conducted by the USDA were integrated in 2002; at that time, the
1Available online at http://www.cdc.gov/nchs/nhanes.htm (accessed July 23, 2010).2Available online at http://www.cdc.gov/nchs/nhanes/about_nhanes.htm (accessed July
23, 2010).3Available online at http://www.cdc.gov/nchs/nhanes/about_nhanes.htm (accessed July
23, 2010).
Copyright © National Academy of Sciences. All rights reserved.
Dietary Reference Intakes for Calcium and Vitamin D
DIETARY INTAKE ASSESSMENT 459
dietary reports from the integrated survey became known as What We Eat in America (WWEIA). For this report data for the 2003 to 2004 and 2005 to 2006 period were used because the data for the 2007 and 2008 period did not become available until after the committee had completed its delib-erations. Calcium intake has been estimated since NHANES I. Intakes for vitamin D were first published in 2009 and currently are available for the 2003–2006 survey period. The NHANES is said to “follow the sun” in that the survey is generally conducted in the southern states during the winter months and in the northern states in the summer months.
The NHANES is unique in that it collects and tracks both total intake and health measures in a national sample of Americans, and provides an important aspect of the nation’s health monitoring system. As would be expected, total intake estimates are limited by survey respondents’ abili-ties to accurately report foods and amounts consumed and by the accu-racy, specificity, and timeliness of the food composition databases linked to foods reported in the survey. Respondents are also prone to under-reporting intake (IOM, 2000). Issues related to estimation of usual intake from WWEIA-NHANES have been reviewed by others (Dwyer et al., 2003), including the challenges of updating food composition tables and address-ing the under-reporting of intake amounts by participants.
In the case of nutrient intake data for the United States, calcium and vitamin D intake estimates from the WWEIA report series4 have formed the basis of an expanded analysis conducted and made available by the National Cancer Institute (NCI) of the National Institutes of Health. The NCI analysis was used in this report, as described below.
Intake Estimates for Calcium and Vitamin D
The USDA has produced the Vitamin D Addendum to the USDA Food and Nutrient Database for Dietary Studies 3.0,5 and in turn WWEIA reported the vitamin D intake from foods as well as calcium intake from foods.6 The expanded analysis carried out by NCI has allowed the incorpo-ration of estimates of intake from dietary supplements collected as part of the NHANES but not included in the WWEIA reports, thereby providing an estimate of total calcium and vitamin D intake. Calcium intake data were available for the entire period 2003 to 2006 for the United States. However, although the USDA released vitamin D intake data for the 2003 to 2006
4Available online at http://www.ars.usda.gov/Services/docs.htm?docid=13793 (accessed July 23, 2010).
5Available online at http://www.ars.usda.gov/Services/docs.htm?docid=18807 (accessed July 23, 2010).
6Available online at http://www.ars.usda.gov/Services/docs.htm?docid=18349 (accessed July 23, 2010).
Copyright © National Academy of Sciences. All rights reserved.
Dietary Reference Intakes for Calcium and Vitamin D
460 DIETARY REFERENCE INTAKES FOR CALCIUM AND VITAMIN D
period in July 2010, vitamin D intake data at the time of the NCI analysis were available only for 2005 to 2006. Therefore, the calcium and vitamin D intake data used in this report reflect overlapping, but not identical, time periods.
Given that there is considerable interest in estimates of total calcium intake and total vitamin D intake from all sources (i.e., foods and supple-ments), and data on total intake provide the best basis for DRI assessments, the committee relied on the expanded analysis of the NHANES data con-ducted by NCI and reported by Bailey et al. (2010).7 Detailed information provided to the committee by NCI staff appears in Appendix H. The re-lated methodologies have been described in detail by Bailey et al. (2010) and provide the opportunity to take into account sources of calcium and vitamin D from supplements.
As described in Bailey et al. (2010), the intake estimates for calcium and vitamin D derived through the NCI method will vary slightly (i.e., by less than 1 percent) from those that appear in the WWEIA. This is because the NCI method uses supplement intake as a covariate in the model for nutrient intake from foods, and because—relative to obtaining usual intake percentiles—a shrinkage estimator approach was incorporated into the analysis rather than a Monte Carlo approach.
Serum 25OHD Concentrations
Measures of serum 25OHD concentrations among survey participants are relevant to the process of a dietary intake assessment in that, whenever possible, the assessment should consider biological parameters thereby basing the assessment on the totality of the evidence and not on intake from foods and supplements alone (IOM, 2000). Also, intake from foods and supplements can often be under-reported by survey participants (IOM, 2000). Analysis of serum 25OHD concentrations has been a component of the NHANES survey since NHANES III. The laboratory methodologies are described on the related website.8 In 2009, the Centers for Disease Control and Prevention (CDC) posted an Analytical Note9 regarding the analysis of serum 25OHD levels. Users were cautioned about making direct com-parisons between values from NHANES 2000 to 2006 and values obtained in NHANES III. Further, it was noted that serum 25OHD data from the 2000 to 2006 surveys were likely affected by drifts in the assay performance
7In addition, the study authors provided tables of intakes arrayed for percentile groupings. These have been made available in the Institute of Medicine public access file available at http://www8.nationalacademies.org/cp/.
8Available online at http://www.cdc.gov/nchs/data/nhanes/nhanes_09_10/labcompf.pdf (accessed July 23, 2010).
9Available online at http://www.cdc.gov/nchs/nhanes.htm (accessed July 23, 2010).
Copyright © National Academy of Sciences. All rights reserved.
Dietary Reference Intakes for Calcium and Vitamin D
DIETARY INTAKE ASSESSMENT 461
(method bias and imprecision) over time. For this reason, the committee used serum 25OHD levels that had been adjusted for this assay drift and posted on the agency’s website. This assay drift was discussed in Chapter 3.
Canada: Canadian Health Measures Survey and Canadian Community Health Survey
Data relevant to the Canadian intake of calcium and vitamin D from foods, as well as measures of serum 25OHD concentrations10 for a repre-sentative sample of Canadians, are available from national surveys con-ducted by the Government of Canada. These are described below.
Intake Estimates for Calcium and Vitamin D
The Canadian Community Health Survey (CCHS) began in 2000, with the goal of providing population-level information on health deter-minants, health status, and health system utilization.11 The survey series is a joint effort among Health Canada, Statistics Canada, and the Canadian Institute for Health Information. The CCHS, a nationally representative cross–sectional survey, that operated on a 2-year data collection cycle from 2000 to 2007, and now operates on an ongoing basis, comprises two types of surveys. The first is a general health survey that takes place in the first year of the cycle (i.e., Cycle 1.1, 2.1, etc.). It samples approximately 130,000 Canadians and provides information at the level of regional health units within each province. The second is a focused topic survey that until 2007 took place in the second year of each cycle (i.e., Cycle 1.2, 2.2, etc.), and now takes place every 3 years. It samples approximately 35,000 Canadians, providing information at the national and provincial levels. The focused topic for CCHS 2004 was a food consumption survey and was designed to estimate the distribution of usual total intake in terms of foods, food groups, dietary supplements, nutrients, and eating patterns among a rep-resentative sample of Canadians at the national and provincial levels using the same 24-hour recall methodology used in the NHANES. The data from CCHS 2004 were disseminated in three separate releases between 2005 and 2008 (and revised February 2009). The data reflect nutrient intakes from foods only; information on the quantitative contributions from supple-ment use is not available at this time, but data on the frequency of general supplement use have been collected. Survey methodologies are described
10 These measures reflect plasma 25OHD concentrations in the case of the Canadian survey data, but for the purposes of this report they are described as serum 25OHD concentrations.
11Available online at http://www.hc-sc.gc.ca/fn-an/surveill/index-eng.php (accessed July 23, 2010).
Copyright © National Academy of Sciences. All rights reserved.
Dietary Reference Intakes for Calcium and Vitamin D
462 DIETARY REFERENCE INTAKES FOR CALCIUM AND VITAMIN D
online.12 The food composition data used to estimate the nutrient values of the foods consumed are provided by the Canadian Nutrient File (CNF). This database reports the average nutritional values for foods available in Canada. According to the CNF documentation,13 many of the data in the CNF have been derived from the USDA data base because these foods are available on the Canadian market. Canadian modifications included in the CNF consist of levels of fortification and regulatory standards specific to Canada and certain foods that are unique to the Canadian food supply.
Serum 25OHD Concentrations
Serum 25OHD concentrations have been measured and reported as part of the Canadian Health Measures Survey (CHMS). The CHMS, which was initiated in 2007, collects blood and urine for analysis and also carries out direct physical measurements of blood pressure, height, and weight. Those surveyed are persons 6 through 79 years of age and reflect approxi-mately 97 percent of the population. Participants are those living in pri-vately occupied dwellings in the 10 provinces and the 3 territories; persons living on Indian (First Nation) reserves or Crown land, as well as residents of institutions are excluded. Descriptions of sampling, data sources, error detection, quality evaluation, and laboratory methods can be found on-line.14 The currently available data are from the 2007 to 2009 time period and can be accessed online.15
Approach Used
An earlier IOM committee addressed applications of the DRIs in di-etary assessment and described statistical approaches to estimating the prevalence of inadequate intakes, specifically the probability approach and a shortcut to the probability approach called the Estimated Average Requirement (EAR) cut-point method (IOM, 2000). These approaches are based on a distribution of usual intakes, and by definition the prevalence of inadequate intakes for a group is the proportion of the group with intakes below the median requirement (or EAR). The 2000 IOM report also points out that it is inappropriate to compare usual nutrient intakes with the
12Available online at http://www.statcan.gc.ca/cgi-bin/imdb/p2SV.pl?Function=getSurvey&SDDS=5049&lang=en&db=imdb&adm=8&dis=2#a2 (accessed July 23, 2010).
13Available online at http://www.hc-sc.gc.ca/fn-an/nutrition/fiche-nutri-data/user_guide_d_utilisation02-eng.php (accessed July 23, 2010).
14Available online at http://www.statcan.gc.ca/cgi-bin/imdb/p2SV.pl?Function=getSurvey&SDDS=5071&lang=en&db=imdb&adm=8&dis=2#b3 (accessed July 23, 2010).
15Available online at http://www.statcan.gc.ca/pub/82-623-x/2010002/part-partie1-eng.htm (accessed July 23, 2010).

Copyright © National Academy of Sciences. All rights reserved.
Dietary Reference Intakes for Calcium and Vitamin D
DIETARY INTAKE ASSESSMENT 463
Recommended Dietary Allowance (RDA), because this approach will lead to estimates of inadequacy that are too large.
Based on the 2000 IOM report cited above (IOM, 2000), whenever pos-sible, the assessment of apparent dietary adequacy should consider relevant biological parameters. In the case of vitamin D, an important biological parameter reflective of dietary exposure—serum 25OHD concentrations—was available and could be compared to values that the committee esti-mated to be approximately equivalent to an EAR or an RDA. However, the existing statistical models provided in the 2000 IOM report (IOM, 2000) address only dietary intake data and do not provide a basis for consider-ing a biological parameter such as serum measures in order to specify the prevalence of inadequate intakes in population groups. Further, the appar-ent discrepancy between the intake data for vitamin D, as described below, and the biological parameter was also concerning and decreased the confi-dence in the appropriateness of estimating prevalence of inadequacy based on a distribution of vitamin D intakes. Therefore, a descriptive rather than an analytical approach is used for the vitamin D intake assessment.
CALCIUM INTAKE
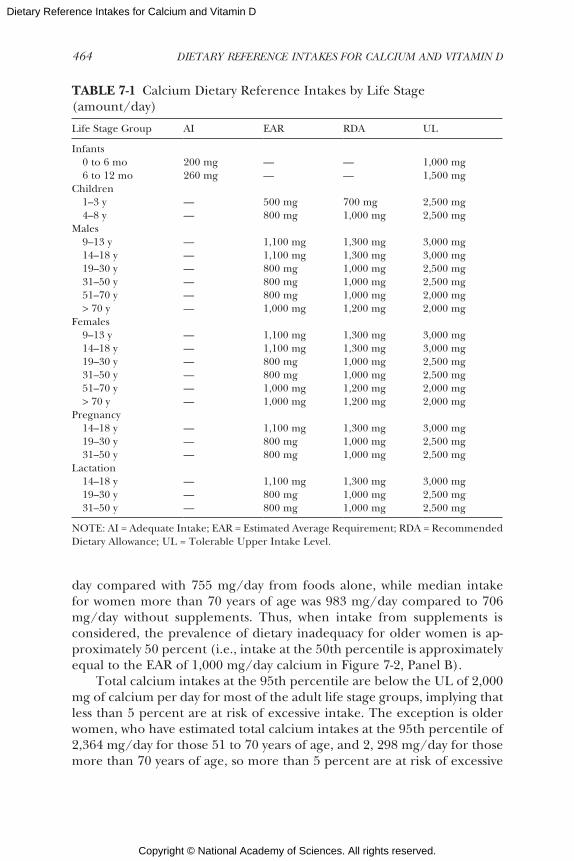
As presented in Chapters 5 and 6, the Estimated Average Require-ments (EARs), Recommended Dietary Allowances (RDAs), Adequate In-takes (AIs), and Tolerable Upper Intake Levels (ULs) for calcium are summarized in Table 7-1. The intake assessment takes into account these reference values.
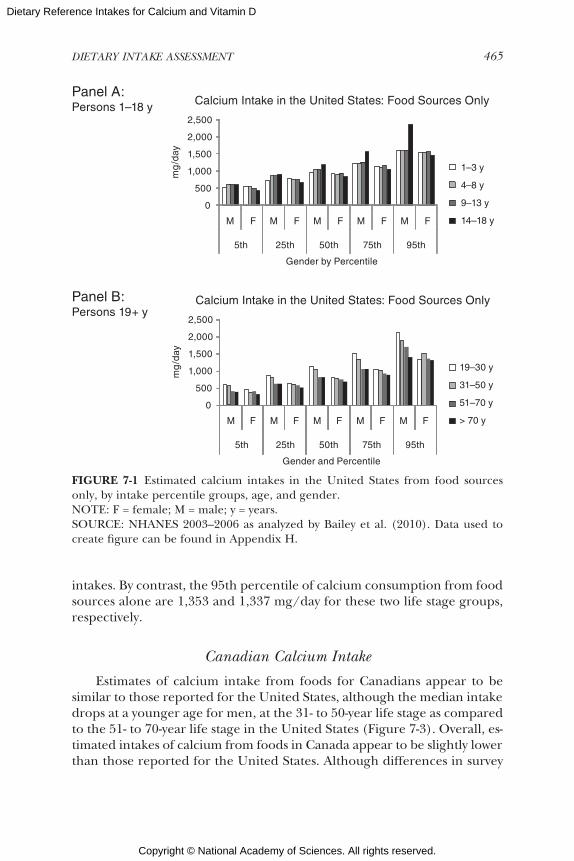
U.S. Calcium Intake
Estimated calcium intakes from food sources only, by intake percentile groups, are shown as bar graphs in Figure 7-1. The prevalence of dietary inadequacy for a group can be estimated by the proportion of the group with intakes less than the EAR (IOM, 2000). The 5th percentile of intake for children 1 to 3 years of age is approximately equal to their EAR of 500 mg/day, implying a low prevalence of inadequacy (less than 5 percent). However, for all other age and gender groups of children, the prevalence is at least 25 percent, because intake at the 25th percentile is below the EAR. For adults, the prevalence of inadequacy from food sources alone is high.
As shown in Figure 7-2, the addition of information about calcium intake from supplements to the data set, thereby allowing an estimate of total intake, appears to impact primarily women over 50 years of age. All life stage groups show a slight increase when supplements are taken into account, but women 51 to 70 years of age demonstrate an estimated me-dian total calcium intake (i.e., from foods plus supplements) of 1,044 mg/
Copyright © National Academy of Sciences. All rights reserved.
Dietary Reference Intakes for Calcium and Vitamin D
464 DIETARY REFERENCE INTAKES FOR CALCIUM AND VITAMIN D
TABLE 7-1 Calcium Dietary Reference Intakes by Life Stage (amount/day)
Life Stage Group AI EAR RDA UL
Infants 0 to 6 mo 200 mg — — 1,000 mg 6 to 12 mo 260 mg — — 1,500 mgChildren 1–3 y — 500 mg 700 mg 2,500 mg 4–8 y — 800 mg 1,000 mg 2,500 mgMales 9–13 y — 1,100 mg 1,300 mg 3,000 mg 14–18 y — 1,100 mg 1,300 mg 3,000 mg 19–30 y — 800 mg 1,000 mg 2,500 mg 31–50 y — 800 mg 1,000 mg 2,500 mg 51–70 y — 800 mg 1,000 mg 2,000 mg > 70 y — 1,000 mg 1,200 mg 2,000 mgFemales 9–13 y — 1,100 mg 1,300 mg 3,000 mg 14–18 y — 1,100 mg 1,300 mg 3,000 mg 19–30 y — 800 mg 1,000 mg 2,500 mg 31–50 y — 800 mg 1,000 mg 2,500 mg 51–70 y — 1,000 mg 1,200 mg 2,000 mg > 70 y — 1,000 mg 1,200 mg 2,000 mgPregnancy 14–18 y — 1,100 mg 1,300 mg 3,000 mg 19–30 y — 800 mg 1,000 mg 2,500 mg 31–50 y — 800 mg 1,000 mg 2,500 mgLactation 14–18 y — 1,100 mg 1,300 mg 3,000 mg 19–30 y — 800 mg 1,000 mg 2,500 mg 31–50 y — 800 mg 1,000 mg 2,500 mg
NOTE: AI = Adequate Intake; EAR = Estimated Average Requirement; RDA = Recommended Dietary Allowance; UL = Tolerable Upper Intake Level.
day compared with 755 mg/day from foods alone, while median intake for women more than 70 years of age was 983 mg/day compared to 706 mg/day without supplements. Thus, when intake from supplements is considered, the prevalence of dietary inadequacy for older women is ap-proximately 50 percent (i.e., intake at the 50th percentile is approximately equal to the EAR of 1,000 mg/day calcium in Figure 7-2, Panel B).
Total calcium intakes at the 95th percentile are below the UL of 2,000 mg of calcium per day for most of the adult life stage groups, implying that less than 5 percent are at risk of excessive intake. The exception is older women, who have estimated total calcium intakes at the 95th percentile of 2,364 mg/day for those 51 to 70 years of age, and 2, 298 mg/day for those more than 70 years of age, so more than 5 percent are at risk of excessive
Copyright © National Academy of Sciences. All rights reserved.
Dietary Reference Intakes for Calcium and Vitamin D
DIETARY INTAKE ASSESSMENT 465
fig 7-1.eps
Panel A: Persons 1–18 y
Panel B: Persons 19+ y
0
500
1,000
1,500
2,000
2,500
M F M F M F M F M F
5th 25th 50th 75th 95th
mg
/day
Gender by Percentile
Calcium Intake in the United States: Food Sources Only
1–3 y
4–8 y
9–13 y
14–18 y
0
500
1,000
1,500
2,000
2,500
M F M F M F M F M F
5th 25th 50th 75th 95th
mg
/day
Gender and Percentile
Calcium Intake in the United States: Food Sources Only
19–30 y
31–50 y
51–70 y
> 70 y
FIGURE 7-1 Estimated calcium intakes in the United States from food sources only, by intake percentile groups, age, and gender.NOTE: F = female; M = male; y = years.SOURCE: NHANES 2003–2006 as analyzed by Bailey et al. (2010). Data used to create figure can be found in Appendix H.
intakes. By contrast, the 95th percentile of calcium consumption from food sources alone are 1,353 and 1,337 mg/day for these two life stage groups, respectively.
Canadian Calcium Intake
Estimates of calcium intake from foods for Canadians appear to be similar to those reported for the United States, although the median intake drops at a younger age for men, at the 31- to 50-year life stage as compared to the 51- to 70-year life stage in the United States (Figure 7-3). Overall, es-timated intakes of calcium from foods in Canada appear to be slightly lower than those reported for the United States. Although differences in survey

Copyright © National Academy of Sciences. All rights reserved.
Dietary Reference Intakes for Calcium and Vitamin D
466 DIETARY REFERENCE INTAKES FOR CALCIUM AND VITAMIN D
methodologies could be responsible for some of the difference, the surveys use very similar methodologies and work to ensure uniformity as much as possible. A more likely possibility is that the differences are attributable to food fortification practices. In Canada, calcium may only be added to a limited number of foods. Flour, cornmeal, plant-based beverages, and orange juice may be fortified with calcium, but not breakfast cereals and bread. However, discretionary fortification with calcium is widespread in the United States and can encompass breakfast cereals, breads, and an ar-ray of beverages.
At the time of this study, only intake data for foods were available for Canadians; estimates of total calcium intake (i.e., foods plus supplements)
fig 7-2.eps
Panel A: Persons 1–18 y
Panel B: Persons 19+ y
0500
1,0001,5002,0002,5003,000
M F M F M F M F M F
5th 25th 50th 75th 95th
mg
/day
Gender and Percentile
Calcium Intake in the United States: Total Intake (Foods + Supplements)
1–3 y
4–8 y
9–13 y
14–18 y
0
500
1,000
1,500
2,000
2,500
M F M F M F M F M F
5th 25th 50th 75th 95th
mg
/day
Gender and Percentile
Calcium Intake in the United States: Total Intake (Foods + Supplements)
19–30 y
31–50 y
51–70 y
> 70 y
FIGURE 7-2 Estimated total calcium intakes in the United States from food and supplements, by intake percentile groups, age, and gender.NOTE: F = female; M = male; y = years.SOURCE: NHANES 2003–2006 as analyzed by Bailey et al. (2010). Data used to create figure can be found in Appendix H.

Copyright © National Academy of Sciences. All rights reserved.
Dietary Reference Intakes for Calcium and Vitamin D
DIETARY INTAKE ASSESSMENT 467
FIGURE 7-3 Estimated calcium intakes in Canada from food sources only, by in-take percentile groups, age, and gender.NOTE: F = female; M = male; y = years.SOURCE: Statistics Canada, Canadian Community Health Survey (CCHS), Cycle 2.2, Nutrition 2004. Data used to create figure can be found in Appendix H.
fig 7-3.eps
Panel A: Persons 1–18 y
Panel B: Persons 19–30 y
Panel C: Persons 31+ y
0
500
1,000
1,500
2,000
5th 25th 50th 75th 95th
mg
/day
Percentile
Calcium Intake in Canada: Food Sources Only
1–3 y
4–8 y
0
500
1,000
1,500
2,000
2,500
M F M F M F M F M F
5th 25th 50th 75th 95th
mg
/day
Gender and Percentile
Calcium Intake in Canada: Food Sources Only
9–13 y
14–18 y
19–30 y
0200400600800
1,0001,2001,4001,6001,800
M F M F M F M F M F
5th 25th 50th 75th 95th
mg
/day
Gender and Percentile
Calcium Intake in Canada: Food Sources Only
31–50 y
51–70 y
> 70 y

Copyright © National Academy of Sciences. All rights reserved.
Dietary Reference Intakes for Calcium and Vitamin D
468 DIETARY REFERENCE INTAKES FOR CALCIUM AND VITAMIN D
had not yet been compiled. After the completion of the study, information on total intake was published (Garriguet, 2010).
VITAMIN D INTAKE AND SERUM 25OHD CONCENTRATIONS
The EARs, RDAs, AIs, and ULs for vitamin D as presented earlier in Chapters 5 and 6 are relevant to the intake assessment discussions and are shown in Table 7-2.
Considerations about the adequacy of vitamin D intake must be in-terpreted in view of the fact that these reference values assume that no vitamin D is contributed to the human body by sun exposure. Given the unknowns concerning the contribution from sunlight as well as the inabil-ity to recommend an acceptable level of sun exposure, this assumption was necessary. However, it confounds interpretation of the intake assessment. If persons are obtaining some vitamin D from sun exposure, they are less likely to be at risk for inadequacy if their intakes are below the reference value. Although the extent to which this may be the case cannot be deter-mined, a concomitant examination of serum 25OHD levels can assist in better describing the assessment. Moreover, as mentioned earlier, it is an appropriate component of the assessment of dietary adequacy (foods and supplements) because, whenever possible, the assessment should consider biological parameters (IOM, 2000).
U.S. Vitamin D Intakes and Serum 25OHD Concentrations
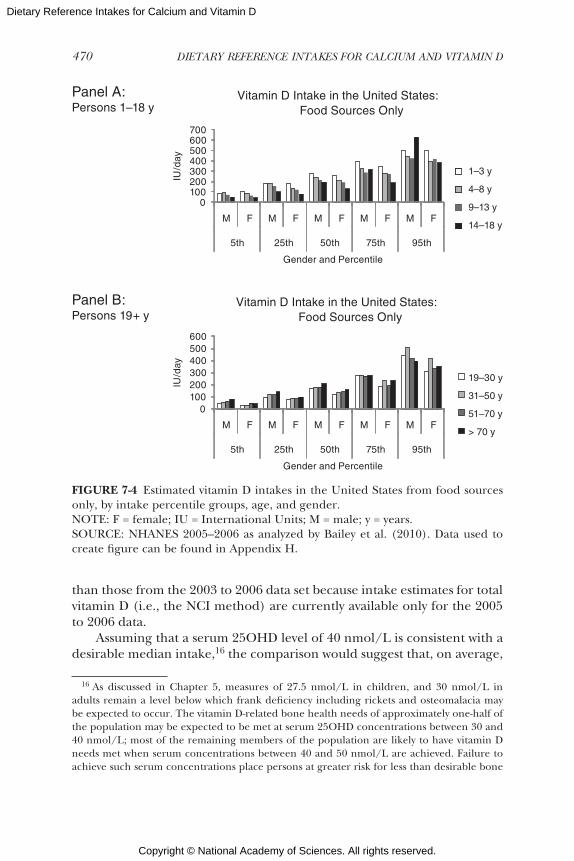
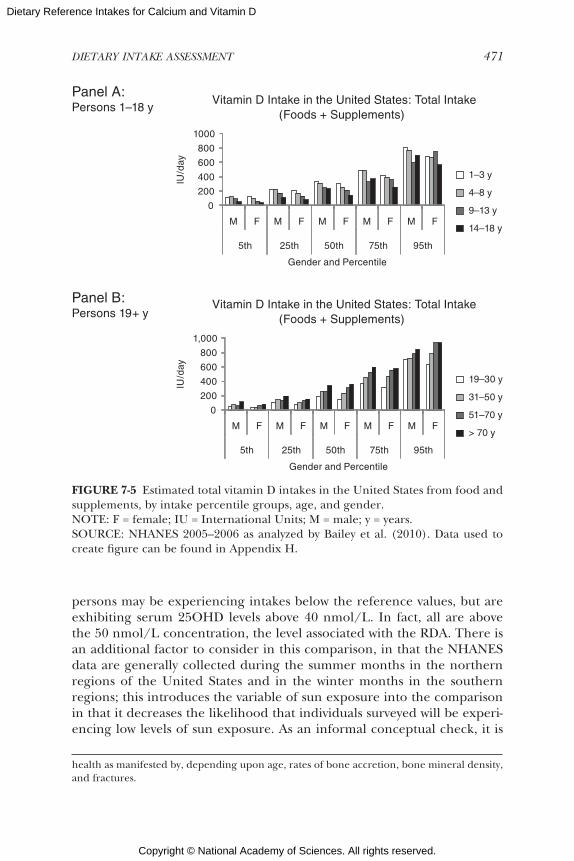
Figure 7-4 shows U.S. vitamin D intake from foods alone. Median vitamin D intake levels for males ranged from 272 to 396 International Units (IU)/day depending upon life stage group. For females, median vi-tamin D intakes spanned between 160 and 260 IU/day. When intake from supplements is considered to provide total intakes (Figure 7-5), all life stage groups for both male and female Americans show a slight increase in values. The most marked increase is among older women, as was the case for calcium. For women 51 to 70 years of age, median intake of vitamin D from both food and supplements increases to 308 IU/day, compared with vitamin D intake from foods alone, at 140 IU/day. For women more than 70 years of age, the increase in median intake associated with supplement use is an additional 196 IU/day (356 IU with supplements vs. 160 IUs from foods alone).
As shown in Figure 7-5, the 95th percentiles for total vitamin D (foods plus supplements) for males and females range between 568 and 940 IU/day, with both this high and low value found among the female life stage

Copyright © National Academy of Sciences. All rights reserved.
Dietary Reference Intakes for Calcium and Vitamin D
DIETARY INTAKE ASSESSMENT 469
TABLE 7-2 Vitamin D Dietary Reference Intakes by Life Stage (amount/day)
Life Stage Group AI EAR RDA UL
Infants 0 to 6 mo 400 IU (10 µg) — — 1,000 IU (25 µg) 6 to 12 mo 400 IU (10 µg) — — 1,500 IU (38 µg)Children 1–3 y — 400 IU (10 µg) 600 IU (15 µg) 2,500 IU (63 µg) 4–8 y — 400 IU (10 µg) 600 IU (15 µg) 3,000 IU (75 µg)Males 9–13 y — 400 IU (10 µg) 600 IU (15 µg) 4,000 IU (100 µg) 14–18 y — 400 IU (10 µg) 600 IU (15 µg) 4,000 IU (100 µg) 19–30 y — 400 IU (10 µg) 600 IU (15 µg) 4,000 IU (100 µg) 31–50 y — 400 IU (10 µg) 600 IU (15 µg) 4,000 IU (100 µg) 51–70 y — 400 IU (10 µg) 600 IU (15 µg) 4,000 IU (100 µg) > 70 y — 400 IU (10 µg) 800 IU (20 µg) 4,000 IU (100 µg)Females 9–13 y — 400 IU (10 µg) 600 IU (15 µg) 4,000 IU (100 µg) 14–18 y — 400 IU (10 µg) 600 IU (15 µg) 4,000 IU (100 µg) 19–30 y — 400 IU (10 µg) 600 IU (15 µg) 4,000 IU (100 µg) 31–50 y — 400 IU (10 µg) 600 IU (15 µg) 4,000 IU (100 µg) 51–70 y — 400 IU (10 µg) 600 IU (15 µg) 4,000 IU (100 µg) > 70 y — 400 IU (10 µg) 800 IU (20 µg) 4,000 IU (100 µg)Pregnancy 14–18 y — 400 IU (10 µg) 600 IU (15 µg) 4,000 IU (100 µg) 19–30 y — 400 IU (10 µg) 600 IU (15 µg) 4,000 IU (100 µg) 31–50 y — 400 IU (10 µg) 600 IU (15 µg) 4,000 IU (100 µg)Lactation 14–18 y — 400 IU (10 µg) 600 IU (15 µg) 4,000 IU (100 µg) 19–30 y — 400 IU (10 µg) 600 IU (15 µg) 4,000 IU (100 µg) 31–50 y — 400 IU (10 µg) 600 IU (15 µg) 4,000 IU (100 µg)
NOTE: AI = Adequate Intake; EAR = Estimated Average Requirement; IU = International Units; RDA = Recommended Dietary Allowance; UL = Tolerable Upper Intake Level.
groups. Persons in the 95th percentile for total intake did not appear to exceed the UL for their group.
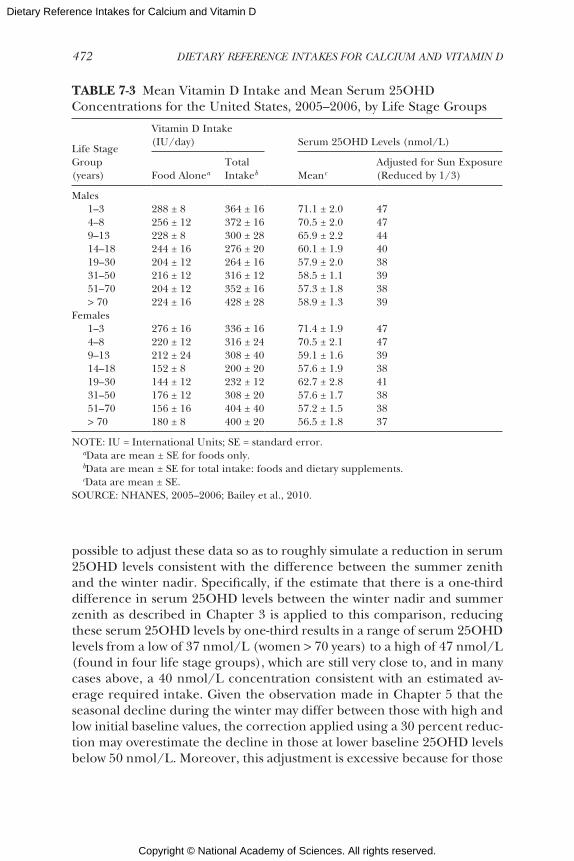
The comparison between vitamin D intake estimates and serum 25OHD concentrations is worthy of note, but it is important to recognize that this comparison, although interesting, is somewhat problematic because the only possible comparison is based on group means, rather than on data linked to individuals. Moreover, as pointed out previously (IOM, 2000; Dwyer et al., 2003), estimates of intake tend to reflect an underestimation. With these caveats, the comparison is presented in Table 7-3. Shown are the average intakes for the various life stage groups, along with the aver-age serum 25OHD levels for those life stage groups. For this table, serum 25OHD concentration data from the 2005 to 2006 surveys were used rather
Copyright © National Academy of Sciences. All rights reserved.
Dietary Reference Intakes for Calcium and Vitamin D
470 DIETARY REFERENCE INTAKES FOR CALCIUM AND VITAMIN D
than those from the 2003 to 2006 data set because intake estimates for total vitamin D (i.e., the NCI method) are currently available only for the 2005 to 2006 data.
Assuming that a serum 25OHD level of 40 nmol/L is consistent with a desirable median intake,16 the comparison would suggest that, on average,
16 As discussed in Chapter 5, measures of 27.5 nmol/L in children, and 30 nmol/L in adults remain a level below which frank deficiency including rickets and osteomalacia may be expected to occur. The vitamin D-related bone health needs of approximately one-half of the population may be expected to be met at serum 25OHD concentrations between 30 and 40 nmol/L; most of the remaining members of the population are likely to have vitamin D needs met when serum concentrations between 40 and 50 nmol/L are achieved. Failure to achieve such serum concentrations place persons at greater risk for less than desirable bone
19
31
51
> 70 y
fig 7-4.eps
Panel A: Persons 1–18 y
Panel B: Persons 19+ y
0100200300400500600700
M F M F M F M F M F
5th 25th 50th 75th 95th
IU/d
ay
Gender and Percentile
Vitamin D Intake in the United States: Food Sources Only
1–3 y
4–8 y
9–13 y
14–18 y
0100200300400500600
M F M F M F M F M F
5th 25th 50th 75th 95th
IU/d
ay
Gender and Percentile
Vitamin D Intake in the United States: Food Sources Only
–30 y
–50 y
–70 y
FIGURE 7-4 Estimated vitamin D intakes in the United States from food sources only, by intake percentile groups, age, and gender.NOTE: F = female; IU = International Units; M = male; y = years.SOURCE: NHANES 2005–2006 as analyzed by Bailey et al. (2010). Data used to create figure can be found in Appendix H.
Copyright © National Academy of Sciences. All rights reserved.
Dietary Reference Intakes for Calcium and Vitamin D
DIETARY INTAKE ASSESSMENT 471
fig 7-5.eps
Panel A: Persons 1–18 y
Panel B: Persons 19+ y
0
200
400
600
800
1000
M F M F M F M F M F
5th 25th 50th 75th 95th
IU/d
ay
Gender and Percentile
Vitamin D Intake in the United States: Total Intake (Foods + Supplements)
1–3 y
4–8 y
9–13 y
14–18 y
0
200
400
600
800
1,000
M F M F M F M F M F
5th 25th 50th 75th 95th
IU/d
ay
Gender and Percentile
Vitamin D Intake in the United States: Total Intake (Foods + Supplements)
19–30 y
31–50 y
51–70 y
> 70 y
FIGURE 7-5 Estimated total vitamin D intakes in the United States from food and supplements, by intake percentile groups, age, and gender.NOTE: F = female; IU = International Units; M = male; y = years.SOURCE: NHANES 2005–2006 as analyzed by Bailey et al. (2010). Data used to create figure can be found in Appendix H.
persons may be experiencing intakes below the reference values, but are exhibiting serum 25OHD levels above 40 nmol/L. In fact, all are above the 50 nmol/L concentration, the level associated with the RDA. There is an additional factor to consider in this comparison, in that the NHANES data are generally collected during the summer months in the northern regions of the United States and in the winter months in the southern regions; this introduces the variable of sun exposure into the comparison in that it decreases the likelihood that individuals surveyed will be experi-encing low levels of sun exposure. As an informal conceptual check, it is
health as manifested by, depending upon age, rates of bone accretion, bone mineral density, and fractures.
Copyright © National Academy of Sciences. All rights reserved.
Dietary Reference Intakes for Calcium and Vitamin D
472 DIETARY REFERENCE INTAKES FOR CALCIUM AND VITAMIN D
TABLE 7-3 Mean Vitamin D Intake and Mean Serum 25OHD Concentrations for the United States, 2005–2006, by Life Stage Groups
Life Stage Group (years)
Vitamin D Intake (IU/day) Serum 25OHD Levels (nmol/L)
Food AloneaTotal Intakeb Meanc
Adjusted for Sun Exposure (Reduced by 1/3)
Males1–3 288 ± 8 364 ± 16 71.1 ± 2.0 474–8 256 ± 12 372 ± 16 70.5 ± 2.0 479–13 228 ± 8 300 ± 28 65.9 ± 2.2 4414–18 244 ± 16 276 ± 20 60.1 ± 1.9 4019–30 204 ± 12 264 ± 16 57.9 ± 2.0 3831–50 216 ± 12 316 ± 12 58.5 ± 1.1 3951–70 204 ± 12 352 ± 16 57.3 ± 1.8 38> 70 224 ± 16 428 ± 28 58.9 ± 1.3 39
Females1–3 276 ± 16 336 ± 16 71.4 ± 1.9 474–8 220 ± 12 316 ± 24 70.5 ± 2.1 479–13 212 ± 24 308 ± 40 59.1 ± 1.6 3914–18 152 ± 8 200 ± 20 57.6 ± 1.9 3819–30 144 ± 12 232 ± 12 62.7 ± 2.8 4131–50 176 ± 12 308 ± 20 57.6 ± 1.7 3851–70 156 ± 16 404 ± 40 57.2 ± 1.5 38> 70 180 ± 8 400 ± 20 56.5 ± 1.8 37
NOTE: IU = International Units; SE = standard error. aData are mean ± SE for foods only. bData are mean ± SE for total intake: foods and dietary supplements. cData are mean ± SE.SOURCE: NHANES, 2005–2006; Bailey et al., 2010.
possible to adjust these data so as to roughly simulate a reduction in serum 25OHD levels consistent with the difference between the summer zenith and the winter nadir. Specifically, if the estimate that there is a one-third difference in serum 25OHD levels between the winter nadir and summer zenith as described in Chapter 3 is applied to this comparison, reducing these serum 25OHD levels by one-third results in a range of serum 25OHD levels from a low of 37 nmol/L (women > 70 years) to a high of 47 nmol/L (found in four life stage groups), which are still very close to, and in many cases above, a 40 nmol/L concentration consistent with an estimated av-erage required intake. Given the observation made in Chapter 5 that the seasonal decline during the winter may differ between those with high and low initial baseline values, the correction applied using a 30 percent reduc-tion may overestimate the decline in those at lower baseline 25OHD levels below 50 nmol/L. Moreover, this adjustment is excessive because for those
Copyright © National Academy of Sciences. All rights reserved.
Dietary Reference Intakes for Calcium and Vitamin D
DIETARY INTAKE ASSESSMENT 473
persons living in the southern United States, their serum 25OHD measures were taken generally during the winter, not summer, months; the one-third reduction is therefore an over-correction in this case. However, because it is not possible using the data available to the committee to distinguish between values taken in the summer in northern areas and in the winter in southern areas, the adjustment cannot be further refined.
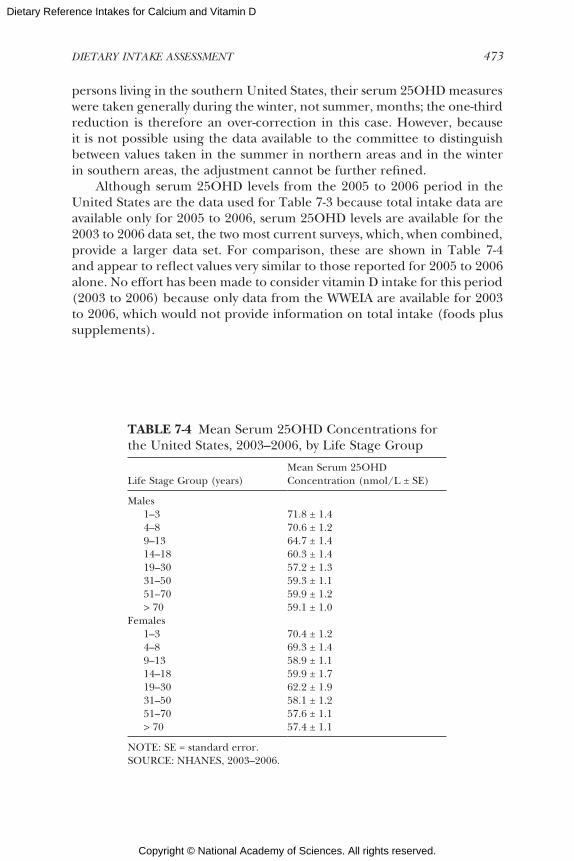
Although serum 25OHD levels from the 2005 to 2006 period in the United States are the data used for Table 7-3 because total intake data are available only for 2005 to 2006, serum 25OHD levels are available for the 2003 to 2006 data set, the two most current surveys, which, when combined, provide a larger data set. For comparison, these are shown in Table 7-4 and appear to reflect values very similar to those reported for 2005 to 2006 alone. No effort has been made to consider vitamin D intake for this period (2003 to 2006) because only data from the WWEIA are available for 2003 to 2006, which would not provide information on total intake (foods plus supplements).
TABLE 7-4 Mean Serum 25OHD Concentrations for the United States, 2003–2006, by Life Stage Group
Life Stage Group (years)Mean Serum 25OHD Concentration (nmol/L ± SE)
Males1–3 71.8 ± 1.44–8 70.6 ± 1.29–13 64.7 ± 1.414–18 60.3 ± 1.419–30 57.2 ± 1.331–50 59.3 ± 1.151–70 59.9 ± 1.2> 70 59.1 ± 1.0
Females1–3 70.4 ± 1.24–8 69.3 ± 1.49–13 58.9 ± 1.114–18 59.9 ± 1.719–30 62.2 ± 1.931–50 58.1 ± 1.251–70 57.6 ± 1.1> 70 57.4 ± 1.1
NOTE: SE = standard error.SOURCE: NHANES, 2003–2006.
Copyright © National Academy of Sciences. All rights reserved.
Dietary Reference Intakes for Calcium and Vitamin D
474 DIETARY REFERENCE INTAKES FOR CALCIUM AND VITAMIN D
Canadian Vitamin D Intakes and Serum 25OHD Concentrations
As previously mentioned, the available Canadian survey data provided information on vitamin D intake from foods alone; quantified informa-tion on vitamin D supplement intake among Canadians, and thus on total intake from foods and supplements, was not available at the time of the study. Figure 7-6 outlines the estimated intakes of vitamin D from foods alone, which overall tend to be slightly higher than those reported for the United States. Median vitamin D intakes ranged from a low of 176 IU/day (women 51 to 70 years) to a high of 264 IU/day (boys 9 to 13 years). Similar to the U.S. population, persons in the 95th percentile of intake of vitamin D from foods would be expected to be considerably below the UL for their life stage.
Comparison between mean intakes of vitamin D and mean serum 25OHD concentrations for Canadians is problematic. For Canada, intake estimates are provided for the survey year 2004 based on the CCHS, whereas the serum 25OHD concentrations available reflect data from the 2007 to 2009 CHMS. The mean serum 25OHD levels for Canadians are shown in Table 7-5, and no effort has been made to compare these with intake esti-mates. As a general matter, average serum 25OHD concentrations of Cana-dians are above both the 40 and 50 nmol/L concentration levels. Although average intakes of vitamin D among Canadians from foods alone (i.e., not taking into account supplements) are less than the EAR, measures of serum 25OHD levels are well above the 40 nmol/L level consistent with the EAR. Again, as described earlier, the ability to interpret the prevalence of inad-equacy based on serum 25OHD concentrations using the methodology as established in the 2000 IOM report (IOM, 2000) is unclear.
DIFFERENCES BETWEEN THE UNITED STATES AND CANADA: NATIONAL SURVEY
DATA FOR CALCIUM AND VITAMIN D
All total intake estimates are subject to uncertainties owing to a variety of factors that affect estimates of food intake, ranging from the depth and nature of the probing carried out to obtain the information on food con-sumption to the ability of persons to accurately recall and estimate their food intake. Overall, the nature and approach of the national surveys in the United States and Canada are notably similar, which suggest that the small differences seen in intake estimates for calcium and vitamin D may reflect true differences in intake.
With respect to vitamin D intake from foods alone, to the extent a comparison is appropriate given that they reflect different periods—2004 for Canada and 2005 to 2006 for the United States—Canadian intakes of

Copyright © National Academy of Sciences. All rights reserved.
Dietary Reference Intakes for Calcium and Vitamin D
DIETARY INTAKE ASSESSMENT 475
fig 7-6.eps
Panel A: Persons 1–18 y
Panel B: Persons 19–30 y
Panel C: Persons 31+ y
0
100
200
300
400
500
600
5th 25th 50th 75th 95th
IU/d
ay
Percentile
Vitamin D Intake in Canada: Food Sources Only
1–3 y
4–8 y
0100200300400500600700
M F M F M F M F M F
5th 25th 50th 75th 95th
IU/d
ay
Gender and Percentile
Vitamin D Intake in Canada: Food Sources Only
9–13 y
14–18 y
19–30 y
0100200300400500600700800
M F M F M F M F M F
5th 25th 50th 75th 95th
IU/d
ay
Gender and Percentile
Vitamin D Intake in Canada: Food Sources Only
31–50 y
51–70 y
> 70 y
FIGURE 7-6 Estimated vitamin D intakes in Canada from food sources only, by intake percentile groups, age, and gender.NOTE: F = female; IU = International Units; M = male; y = years.SOURCE: Statistics Canada, Canadian Community Health Survey (CCHS), Cycle 2.2, Nutrition 2004. Data used to create figure can be found in Appendix H.
Copyright © National Academy of Sciences. All rights reserved.
Dietary Reference Intakes for Calcium and Vitamin D
476 DIETARY REFERENCE INTAKES FOR CALCIUM AND VITAMIN D
TABLE 7-5 Serum 25OHD Levels for Canadians by Percentile Group, Age, and Gender
Life Stage Group (years)Mean Serum 25OHD Level (nmol/L) (Confidence Interval)
Males9–13 73.4 (69.7–77.2)14–18 65.2 (57.2–73.1)19–30 62.5 (53.3–71.7)31–50 61.6 (57.0–66.2)51–70 69.2 (65.4–73.1)71–79 73.7 (67.1–80.3)
Females9–13 69.5 (63.6–75.5)14–18 68.6 (63.0–74.2)19–30 72.5 (67.2–77.9)31–50 67.1 (63.7–70.4)51–70 68.9 (66.3–71.5)71–79 77.8 (72.6–83.0)
SOURCE: Statistics Canada, Canadian Health Measures Survey (CHMS), Cycle 1, 2007–2009.
vitamin D from food sources are somewhat more than those in the United States. This may be due to the Canadian food supply having mandatory for-tification of margarine with vitamin D in addition to fortification of milk.
Further, differences in serum 25OHD concentrations between the United States and Canada are evident. The estimates for Canadians are consistently higher than those for the United States. Although differences in the food supply may account for some of these differences, it is noted that the analyses for the Canadian data are based on the use of the “Liai-son” kit,17 whereas the U.S. data are derived from the “DiaSorin RIA” kit.18 Direct comparison of the two kits within the CHMS laboratory at Health Canada indicates a 6 to 9 percent difference, with the Liaison measuring values higher than the RIA kit.19 Other researchers have also performed comparisons with various outcomes. The differences may be laboratory-specific because Wagner et al. (2009) found no difference, although data from Carter et al. (2010) suggest a 5 percent bias, with the RIA kit giving higher values. It is notable that the serum 25OHD levels in Canada are not lower than those in the United States, as would be predicted if higher latitudes were responsible for reduced serum 25OHD levels.
Finally, Appendix I contains information about the proportion of per-
17DiaSorin Liaison (Stillwater, MN).18DiaSorin Radio-immunoassay (RIA) (Stillwater, MN).19Personal communication, S. Brooks, Health Canada, August 9, 2010.

Copyright © National Academy of Sciences. All rights reserved.
Dietary Reference Intakes for Calcium and Vitamin D
DIETARY INTAKE ASSESSMENT 477
sons in both countries above or below designated levels of serum 25OHD. These data are included as information for the users of this report and have been provided by the U.S. Centers for Disease Control and Preven-tion and by Statistics Canada. However, these data were not reviewed by the committee given that the analyses did not take place until after the close of the committee deliberations.
SUMMARY
The intake assessment conducted in this report suggests that calcium remains a nutrient of public health concern in some population groups. Girls 9 to 18 years of age, who have a fairly high requirement for calcium, are clearly falling below desirable intake estimates in both countries when only food sources of calcium are considered, as are women over the age of 50 years. On the other hand, available data from the United States on the total intake of calcium when dietary supplements are considered, suggests that older women on average, at least in the United States, have added to their calcium intakes through supplement use. For girls, the increase in intake that might be attributable to supplement use is small. No life stage groups exceeded the UL for calcium when foods alone were considered. However, when supplement use was taken into account (United States only), those women consuming at the 95th percentile of calcium intake ap-peared to be at risk for exceeding the UL. This suggests that there may be value in underscoring the need for older girls to modestly increase intake of calcium, and in emphasizing that for older women high intakes from supplements may be concerning.
Due to the desirability of considering biological parameters for intake assessments whenever possible (IOM, 2000), the vitamin D assessment pre-sented some challenges. Although median vitamin D intakes from foods in both countries for all life stage groups were below the EAR of 400 IU/day, these data and any future intake analyses conducted using the IOM meth-odology (IOM, 2000) should be considered in light of the correspond-ing serum 25OHD concentrations. However, specific prevalence estimates based on serum values are not provided here because the appropriate application of the IOM methodology outlined in 2000 (IOM, 2000), which is focused on use of dietary intake estimates, is currently unclear and may not be appropriate for use with serum values.
Average serum 25OHD concentrations from the NHANES were well above the 40 nmol/L established as consistent with an intake equivalent to the EAR, although a number of North Americans have serum values below 40 nmol/L. All average values were above 50 nmol/L, the level consistent with an intake equivalent to the RDA. When the U.S. data were “adjusted” to simulate conditions more consistent with winter months, at

Copyright © National Academy of Sciences. All rights reserved.
Dietary Reference Intakes for Calcium and Vitamin D
478 DIETARY REFERENCE INTAKES FOR CALCIUM AND VITAMIN D
least in the more northern parts of the United States, mean serum 25OHD levels hovered around 40 nmol/L, consistent with an EAR intake. Further, this adjustment over-corrects because for persons living in southern parts of the United States—where NHANES generally is conducted during the winter months—their serum 25OHD levels are already reflective of winter and are not appropriately corrected from a summer level to a winter level. In the case of data for Canada from the CHMS, the mean serum 25OHD levels for all life stage groups are at or above 60 nmol/L. The fact that they are higher than those for the U.S. population may be in part a function of differences in the assay methods used, although this is not clearly estab-lished. If it is assumed that the Canadian values would be 8 percent lower if analyzed using the same methodology that was used in the U.S. survey, then they would then be quite similar to those for the United States, leav-ing open the question of whether the latitude difference between the two countries has a meaningful impact on serum 25OHD levels.
REFERENCESBailey, R. L., K. W. Dodd, J. A. Goldman, J. J. Gahche, J. T. Dwyer, A. J. Moshfegh, C. T.
Sempos and M. F. Picciano. 2010. Estimation of total usual calcium and vitamin D intake in the United States. Journal of Nutrition 140(4): 817-22.
Bodner-Montville, J., J. K. C. Ahuja, L. A. Ingwersen, E. S. Haggerty, C. W. Enns and B. P. Perloff. 2006. USDA Food and Nutrient Database for Dietary Studies: Released on the web. Journal of Food Composition and Analysis 19(Suppl 1): S100-7.
Briefel, R. R. 2006. Nutrition monitoring in the United States. In Present Knowledge in Nu-trition, 9th Edition, Volume II, edited by B. A. Bowman and R. M. Russell. Washington, DC: ILSI. Pp. 838-58.
Carter, G. D., J. L. Berry, E. Gunter, G. Jones, J. C. Jones, H. L. Makin, S. Sufi and M. J. Wheeler. 2010. Proficiency testing of 25-hydroxyvitamin D (25-OHD) assays. Journal of Steroid Biochemistry and Molecular Biology 121(1-2): 176-9.
Dwyer, J., M. F. Picciano and D. J. Raiten. 2003. Estimation of usual intakes: what we eat in America-NHANES. Journal of Nutrition 133(2): 609S-23S.
Garriguet, D. 2010. Combining nutrient intake from food/beverages and vitamin/mineral supplements. Health Reports, Statistics Canada, Catalogue no. 82-003-XPE 21(4): 1-15.
IOM (Institute of Medicine). 2000. Dietary Reference Intakes: Applications in Dietary Assess-ment. Washington, DC: National Academy Press.
Wagner, D., H. E. C. Hanwell and R. Vieth. 2009. An evaluation of automated methods for measurement of serum 25-hydroxyvitamin D. Clinical Biochemistry 42(15): 1549-56.