Embed Size (px)
Citation preview
Dietary assessment and estimation of intakedensities
Michael J� Daniels� �
Alicia Carriquiry� �
�Michael Daniels is corresponding author� ���G Snedecor Hall� Department of Statistics� Iowa State
University� Ames� IA ����������� E�mail� mdanielsiastateedu�Michael Daniels is Assistant Professor� Department of Statistics� Iowa State University�Alicia Carriquiry is Associate Professor� Department of Statistics and Center for Agricultural and
Rural Development� Iowa State University�This work was partially funded through contracts number ����� ���� and ����� � �� between the
National Center for Health Statistics� Center for Disease Control and Prevention� and the Department
of Statistics� Iowa State University� and by Research Grant No ������� from FONDECYT� Chile
Summary
The U�S� government has conducted nationwide food consumption surveys since �����
Information obtained from these surveys is used to design food assistance programs�
guide food and nutrition policy� and monitor the dietary status of the population� The
distribution of usual intakes of a nutrient in the population is of interest to policy makers�
Here� usual intake is de�ned as the longrun average intake of a nutrient by an individual�
Usual intakes are not observable in practice� Instead� we observe daily intakes for
a sample of individuals and a small number of days� and assume that observed intakes
measure usual intakes with error� The distributions of observed intakes� however� are
typically very skewed� and the daytoday variability in intakes tends to be large relative
to the betweenindividual variance� and can be heterogeneous across individuals Nusser�
Carriquiry� Dodd� and Fuller� ������
In this paper� we present a Bayesian approach to estimating the distribution of usual
intakes of a nutrient in a population� Starting with a sample of dietary intakes� we model
a function to map the intakes into the normal scale� This function combines a power
transformation and a cubic spline constrained to be monotonic� with unknown number
and location of knots� and is estimated using reversible jump Markov chain Monte Carlo
methods Green� ������ From each draw� of the transformation function we obtain
a transformed set of intakes which are approximately normally distributed� We then
remove the daytoday variability in daily intakes by �tting a measurement error model
to each set of transformed observations� Each set of estimated individual usual intakes is
then mapped back to the original scale using the inverse of the transformation function�
Posterior distributions of percentiles and other attributes of the density for each nutrient
are estimated accounting for all major sources of uncertainty�
We apply these methods to a subset of the �������� Continuing Survey of Food
Intakes by Individuals CSFII� collected by the USDA USDA� ������
Key words� Dietary data� CSFII� Measurement error models� Splines� Re�
versible jump� Markov chain Monte Carlo
�
� Introduction
The United States government collects dietary intake data since the ����s� Nation
wide food consumption surveys are conducted approximately once a year� where a large
sample of individuals is asked to report their food consumption during the previous ��
hours� Thus� the survey instruments used to collect this information are called ��hour
recalls� Most nationwide food consumption surveys collect replicate ��hour recalls for
at least some of the individuals in the sample� Often� these repeated observations are
not collected on consecutive days� so that multiple observations within an individual can
be considered to be independent�
Other survey instruments� for example food frequency questionnaires FFQs�� can
also be used to collect dietary intake data and to estimate usual nutrient intake distri
butions e�g�� Carroll� Freedman� and Hartman� ������ In this paper� we consider only
the analyses of intake data collected via ��hour recalls�
The information obtained from these dietary surveys is used by policy makers to
design� implement� monitor and evaluate food assistance programs and other nutrition
related policies� For example� policy makers might be interested in comparing the nu
tritional status of children from lowincome households who are enrolled in the School
Lunch program versus that of children who are not� The e�ectiveness of the Food
Stamps program might be evaluated by� for instance� monitoring the proportion of low
income elderly who are consuming enough of some essential nutrient� or the proportion
of teenaged girls who consume adequate amounts of folate or calcium� Since food as
sistance programs managed by the U�S� Department of Agriculture USDA� alone cost
approximately �� billion dollars a year� it is important that information obtained from
dietary data be as accurate as possible� and that measures of uncertainty be available
for all estimates�
�
How do we obtain information about the intake of a nutrient from a dietary intake
survey� Individuals participating in food consumption surveys are asked to recall their
food including beverages� snacks� and meals� consumption for the previous day� A
database managed by the USDA is then used to map� foods into their nutrient com
ponents� This USDA database contains approximately ����� entries� and is updated
periodically� For example� we can obtain the content of about �� di�erent nutrients of a
lunch composed of a slice of pepperoni pizza� an �ounce can of Diet Coke� and an apple�
It is well known e�g�� Schubert� Holden� and Wolf� ����� Haytowitz� Pehrsson� Smith�
Gebhardt� Mathews and Anderson� ����� that this food database is not error free� We
do not� however� address the issue in this work�
The data we obtain for analysis� then� are replicate observations for at least a
subsample of individuals� of daily intakes of a large set of nutrients for individuals in
the sample� We use Yij to denote the observed intake of a nutrient for individual i on
day j� Because these data are costly to collect� the number of replicate observations is
typically no more than two or three for a subsample of the individuals in the survey� We
use di to denote the number of days of intake information available for each individual
in the sample�
The relationship between diet and health underlies much of the government�s goal of
providing the population with the means to consume an adequate diet� Often� the e�ect
of nutrient consumption on healthrelated outcomes is chronic� so that researchers are
interested in the longrun average intake of a nutrient by an individual� This longrun
average intake is known as the usual intake of a nutrient by an individual� and is denoted
by yi� with i � �� ���� n the number of individuals in the sample� Formally� yi � EfYijjig�
Furthermore� populationlevel assessments such as those described earlier� require that
we estimate the distribution of usual intakes F y� in the group of interest� This usual
�
intake distribution concept was set forth in a report by the National Research Council
NRC� ������
The problem of estimating usual nutrient intake distributions from dietary survey
data is a challenging one� Usual intakes are not observable in practice� and observed daily
intakes measure usual intakes with error� Furthermore� various characteristics of dietary
intake data described in the next section� prevent the use of standard normaltheory
methods for analysis� Nusser� Carriquiry� Dodd� and Fuller ������ Eckert� Carroll�
and Wang ������ Chen ����� and Carriquiry ������ among others� have recently
proposed approaches for analyzing dietary intake data� In particular� Nusser et al�
����� propose a measurement error model approach on transformed intake data that
results in estimators of usual intake distributions that perform well in simulation studies�
The Nusser et al� methodology� however� is developed from a frequentist viewpoint�
and consists of several steps� Thus� it is not possible to obtain expressions for standard
errors of various estimates that properly incorporate all uncertainties accumulated along
the way� In fact� the estimators of standard errors for percentiles of the usual intake
distribution given in Nusser et al� ����� are obtained under the assumption that the
function used to transform the data into the normal scale� and the variance components
in the measurement error model� are �xed and known�
We revisit the Nusser et al� ����� approach to estimating usual intake distributions
from dietary intake data� and reformulate it within a Bayesian framework� Our objective
is to derive marginal posterior distributions for parameters of the usual intake distribu
tion of a nutrient that are of interest to policy makers and researchers in nutrition� We
focus on the marginal posterior distributions of percentiles of the usual intake distribu
tion� and argue that the posterior variances we obtain re�ect all uncertainties accrued in
the various steps of the procedure� We use Markov chain Monte Carlo methods MCMC�
�
e�g�� Smith and Roberts� ����� throughout� to perform all computations� As will be
described in Section �� the transformation step involves solving a varyingdimensional
problem� thus� we proceed as in Green ����� and Denison� Mallik� and Smith �����
and use a reversiblejump MCMC algorithm to obtain the transformation function�
The paper is organized as follows� In Section � we brie�y discuss the characteristics
of dietary intake data� and describe a subset of the Continuing Survey of Food Intakes
by Individuals CSFII� USDA� ����� that was used for illustration of the procedure�
The model and proposed estimation strategy are given in Section �� We apply the
methodology to a subset of CSFII and present results in Section �� Finally� Section �
gives a discussion of the approach we propose and of related problems in nutrition that
merit further investigation�
� Characteristics of dietary intake data
We consider dietary intake data obtained via ��hour recalls� by the CSFII carried out in
��������� The CSFII is a nationwide food consumption survey designed as a multistage
strati�ed area probability sample of the �� states and the District of Columbia� and is
intended to be selfweighting� We consider the subset consisting of males and females
aged �� to �� years� who were interviewed between ���� and ����� Two observations
were collected for each individual in the sample� Both observations were obtained by
personal interview if possible� otherwise� the second day interview was done over the
phone� Within an individual� intakes were collected at least a week apart from each
other� thus� we assume that observations within an individual are independent� Because
of nonnegligible attrition rates� regression weights e�g�� Huang and Fuller� ����� were
constructed to adjust for nonresponse� The analyses we present in Section � are per
formed on weighted data� where weights� once computed� are assumed to be �xed and
�
known�
Observed intake data are a�ected not only by individual� but also by nuisance e�ects
such as day of the week� month of the year� interview sequence �rst or later days�
and interview method in person or by phone�� Prior to analysis� we adjust the data
to remove these nuisance e�ects� We proceed as in Nusser et al� ����� and use a
ratio adjustment based on a regression model to partially remove the e�ects of day of
week and interview method from observed intake data� To avoid carrying the survey
weights throughout our analyses� we linearly transform the intake data to obtain a set
of equal weight� observations� as described in Dodd ������ The unweighted analyses
of the equal weight observations are essentially equivalent to the analyses that would be
conducted on the original observations and their weights� In the remainder� Yij denotes
the adjusted� equalweight intake for individual i on day j�
Dietary intake data have attributes that make their analysis challenging� Observed
daily intakes have skewed distributions� and exhibit both between and withinindividual
variability� In fact� the withinindividual variance in observed intakes of most nutrients
is sometimes larger than or of the same order of magnitude as� betweenindividual
variation� and is heterogeneous across individuals� Typically� as the mean intake of
a nutrient increases� so does the variance of those intakes� Since our objective is to
estimate F y�� the distribution of the usual intakes� we must remove the daytoday
variability from the observed intakes�
An additive relationship between observed intake and usual intake in the normal scale
is often adopted to model transformed� observed intakes� A linear measurement error
model approach that allows for the incorporation of heterogeneous withinindividual
measurement error variances is then appropriate for dietary intake data� How to trans
form observed intakes into the normal scale so that transformed intakes are normally
�
distributed and the additive relationship holds is a matter of ongoing discussion Nusser
et al� ����� Stefanski and Bay� ����� Chen� ������ Here� we adopt the Nusser et al�
����� approach� and assume that in the normal scale� a linear measurement error model
is a reasonable choice to describe the relationship between observed and usual intakes�
� Model and estimation strategy
We implement a fully Bayesian approach to the problem of estimating the marginal pos
terior distributions of percentiles of the usual intake distribution of dietary components�
The basic approach uses three nested sampling algorithms to properly account for all
uncertainties� �� Transformation of observed dietary intake data to normality� �� Re
moval of measurement error in the normal scale� �� Backtransformation to the original
scale� We now describe each of these steps in detail�
��� Transformation to normality
As discussed in Nusser et al� ������ standard power transformations fail to properly
transform intake data to normality for most nutrients� We use cubic splines to improve
the transformation� Our data consist of pairs� Y �ij � zij� where Y
�ij is the observed intake
for the ith individual on the jth day raised to the power � which provides the best in
terms of minimizing mean squared error� transformation to normality� and the zij are
the corresponding normal scores� We use Blom�s ����� formula to compute the zij�
Our goal is to compute a function g��z��� such that gY �ij � � Xij � where Xij is
approximately normal� We postulate a cubic spline for g��z���� indexed by a vector of
unknown parameters � and contaminated by normal noise� We use maximum likelihood
ML� to estimate the parameters in the model� The model is�
Y �ij � g��z��� � �ij
�
� �� ��X
p��
�pzpij �
kX
p��
�p��tp � �ij� ��
where tp � zij � rp��Ifzij�rpg and the �ij� j � �� ���� ni� i � �� ���� n� are normal random
variables with mean �� The number of knots in �� is given by k� and their locations are
denoted r�� r�� ���� rk� We de�ne r�k � r�� r�� ���� rk�� and � � k� r�k����
The Y �ij are the sample quantiles of the powertransformed data� and thus cannot be
considered to be iid random variables� As a result� the covariance matrix of � might be
modelled as a scale factor �� times a weight matrix W�� which is proportional to the
asymptotic variance of the sample quantiles see� e�g�� Schervish� ����� pp� ��������
The variance of �ij will take the form ���pij��pij��f�y�pij� where y�pij
is the true sample
quantile and pij corresponds to the pijth percentage point � pij ��� the covariance
between �ij and �kl is given by Cov�ij� �kl� � ���minfpij� pklg�pijpkl��fy�pij�fy�pkl���
To approximate these terms� we use kernel density estimation�
Given the number of knots k and their location r�k� the ML estimate of � is obtained�
via the generalized least squares equations�
Z�W��Z�� � Z�W��Y� �
where Z is an N � k � �� design matrix with N �Pn
i�� di� and Y� is the vector
of powertransformed observations� In the remainder� and to keep notation simple� we
assume that di � d for all individuals� so that N � nd�
In most applications� the weight matrix W is very large equal to the number of
observations N� and therefore computation of its inverse is impractical� To investigate
whether estimates of the parameters in �� are sensitive to a simpli�ed formulation of the
model� we considered an alternative representation forW in our application� a diagonal
matrix obtained by setting all o�diagonal elements of W to ��
We proceed as in Denison et al� ����� and specify prior distributions for the number
�
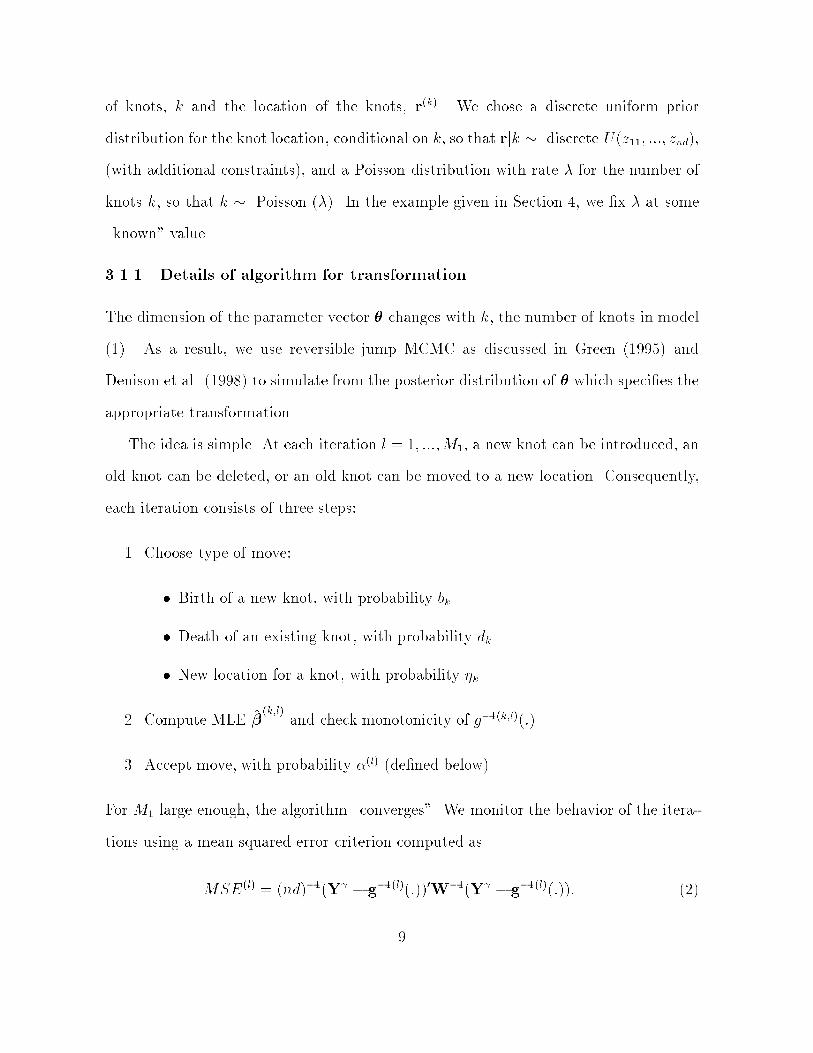
of knots� k and the location of the knots� r�k� We chose a discrete uniform prior
distribution for the knot location� conditional on k� so that rjk � discrete Uz��� ���� znd��
with additional constraints�� and a Poisson distribution with rate for the number of
knots k� so that k � Poisson �� In the example given in Section �� we �x at some
known� value�
����� Details of algorithm for transformation
The dimension of the parameter vector � changes with k� the number of knots in model
��� As a result� we use reversible jump MCMC as discussed in Green ����� and
Denison et al� ����� to simulate from the posterior distribution of � which speci�es the
appropriate transformation�
The idea is simple� At each iteration l � �� ����M�� a new knot can be introduced� an
old knot can be deleted� or an old knot can be moved to a new location� Consequently�
each iteration consists of three steps�
�� Choose type of move�
� Birth of a new knot� with probability bk�
� Death of an existing knot� with probability dk�
� New location for a knot� with probability �k�
�� Compute MLE ���k�l
and check monotonicity of g���k�l���
�� Accept move� with probability ��l de�ned below��
For M� large enough� the algorithm converges�� We monitor the behavior of the itera
tions using a mean squared error criterion computed as
MSE�l � nd���Y� � g���l����W��Y� � g���l���� ��
�
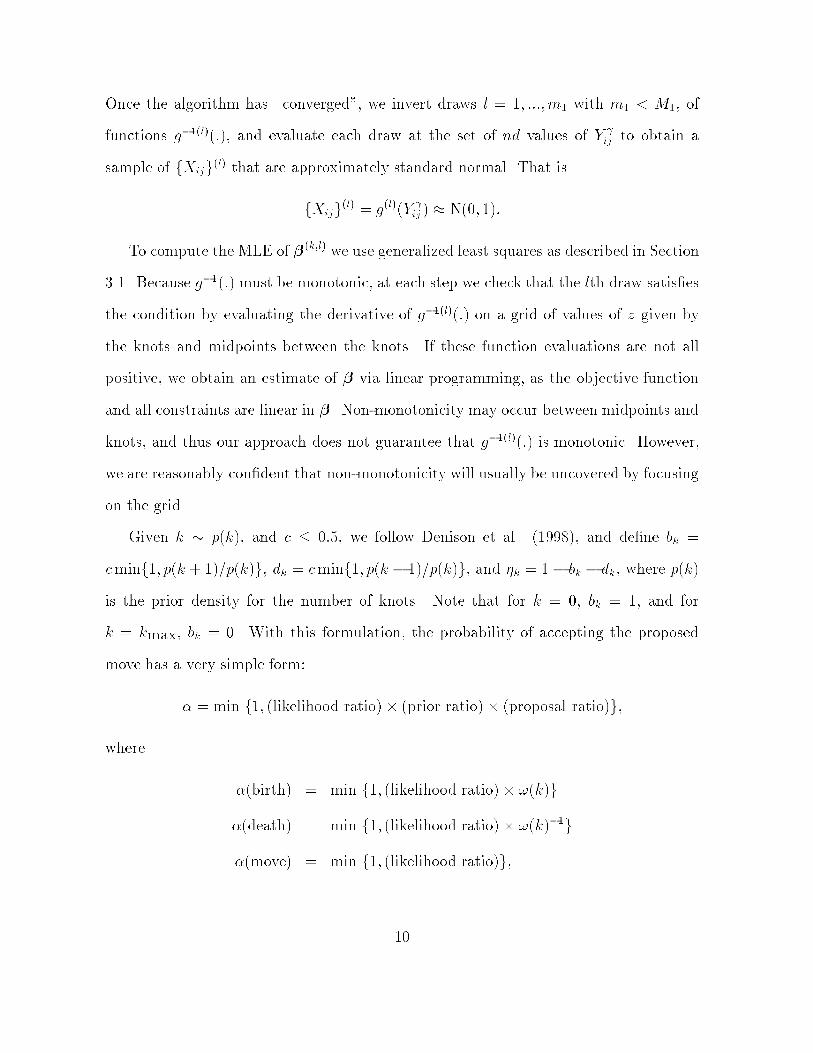
Once the algorithm has converged�� we invert draws l � �� ����m� with m� M�� of
functions g���l��� and evaluate each draw at the set of nd values of Y �ij to obtain a
sample of fXijg�l that are approximately standard normal� That is
fXijg�l � g�lY �
ij � � N�� ���
To compute the MLE of ��k�l we use generalized least squares as described in Section
���� Because g���� must be monotonic� at each step we check that the lth draw satis�es
the condition by evaluating the derivative of g���l�� on a grid of values of z given by
the knots and midpoints between the knots� If these function evaluations are not all
positive� we obtain an estimate of � via linear programming� as the objective function
and all constraints are linear in �� Nonmonotonicity may occur between midpoints and
knots� and thus our approach does not guarantee that g���l�� is monotonic� However�
we are reasonably con�dent that nonmonotonicity will usually be uncovered by focusing
on the grid�
Given k � pk�� and c � ���� we follow Denison et al� ������ and de�ne bk �
cminf�� pk � ���pk�g� dk � cminf�� pk � ���pk�g� and �k � �� bk � dk� where pk�
is the prior density for the number of knots� Note that for k � �� bk � �� and for
k � kmax� bk � �� With this formulation� the probability of accepting the proposed
move has a very simple form�
� � min f�� likelihood ratio�� prior ratio�� proposal ratio�g�
where
�birth� � min f�� likelihood ratio�� k�g
�death� � min f�� likelihood ratio�� k���g
�move� � min f�� likelihood ratio�g�
��
and
k� �nd� �� �k
nd�
The quantity k� is the ratio of the number of locations at which a knot may be
placed to the number of data points� The above result is speci�c to a cubic spline� for
additional details� see Denison et al� ������ p� �����
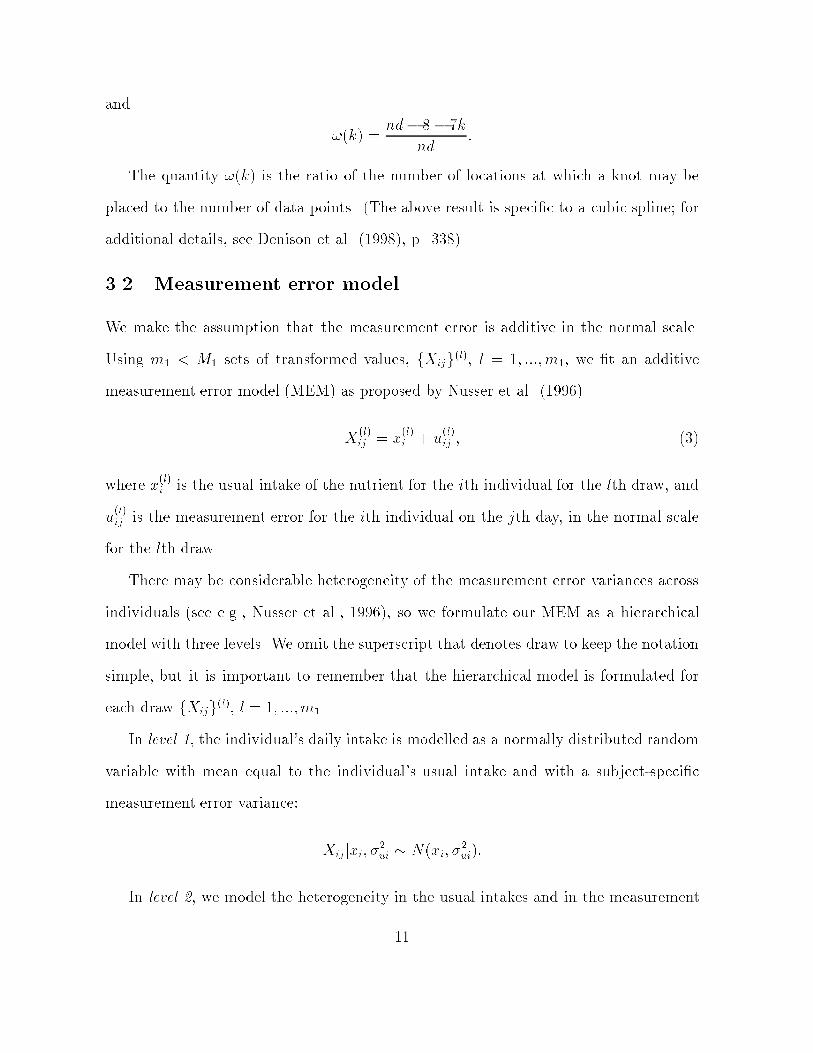
��� Measurement error model
We make the assumption that the measurement error is additive in the normal scale�
Using m� M� sets of transformed values� fXijg�l� l � �� ����m�� we �t an additive
measurement error model MEM� as proposed by Nusser et al� �����
X�lij � x
�li � u
�lij � ��
where x�li is the usual intake of the nutrient for the ith individual for the lth draw� and
u�lij is the measurement error for the ith individual on the jth day� in the normal scale
for the lth draw�
There may be considerable heterogeneity of the measurement error variances across
individuals see e�g�� Nusser et al�� ������ so we formulate our MEM as a hierarchical
model with three levels� We omit the superscript that denotes draw to keep the notation
simple� but it is important to remember that the hierarchical model is formulated for
each draw fXijg�l� l � �� ����m��
In level �� the individual�s daily intake is modelled as a normally distributed random
variable with mean equal to the individual�s usual intake and with a subjectspeci�c
measurement error variance�
Xijjxi� ��ui � Nxi� �
�ui��
In level �� we model the heterogeneity in the usual intakes and in the measurement
��
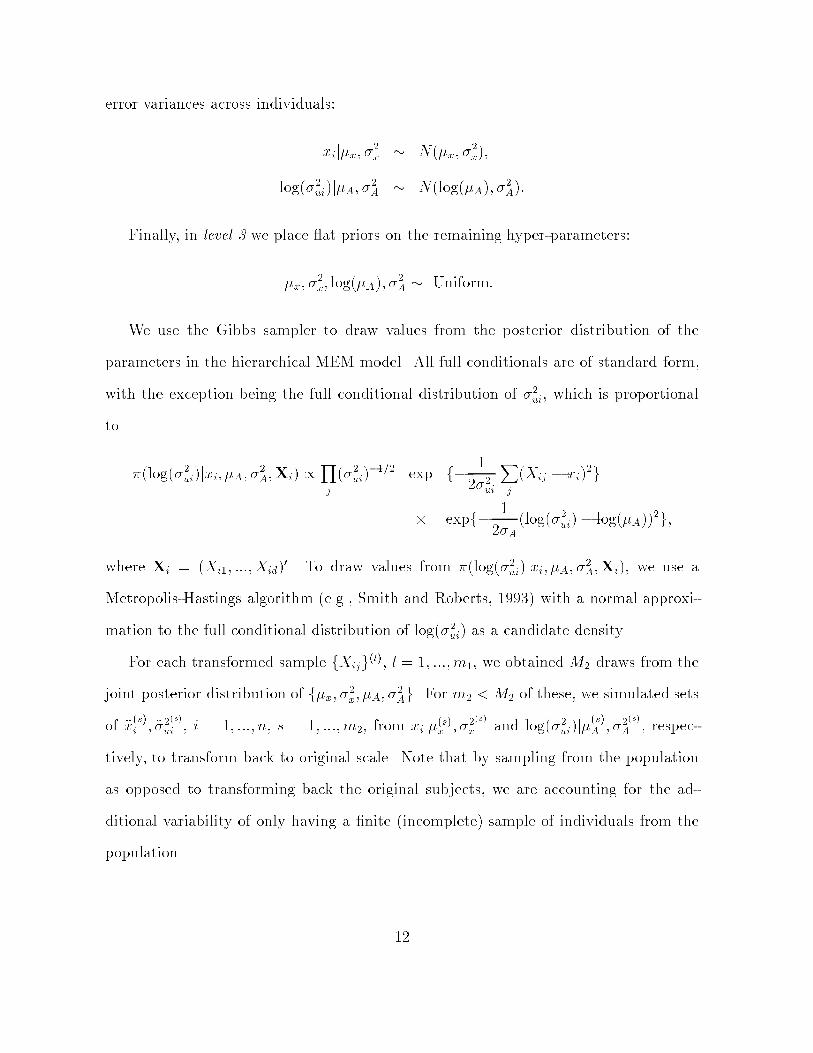
error variances across individuals�
xij�x� ��x � N�x� �
�x��
log��ui�j�A� ��A � Nlog�A�� �
�A��
Finally� in level � we place �at priors on the remaining hyperparameters�
�x� ��x� log�A�� �
�A � Uniform�
We use the Gibbs sampler to draw values from the posterior distribution of the
parameters in the hierarchical MEM model� All full conditionals are of standard form�
with the exception being the full conditional distribution of ��ui� which is proportional
to
�log��ui�jxi� �A� ��A�Xi� �
Y
j
��ui����� exp f�
�
���ui
X
j
Xij � xi��g
� expf��
��Alog��ui�� log�A��
�g�
where Xi � Xi�� ����Xid��� To draw values from �log��ui�jxi� �A� ��A�Xi�� we use a
MetropolisHastings algorithm e�g�� Smith and Roberts� ����� with a normal approxi
mation to the full conditional distribution of log��ui� as a candidate density�
For each transformed sample fXijg�l� l � �� ����m�� we obtained M� draws from the
joint posterior distribution of f�x� ��x� �A� �
�Ag� For m� M� of these� we simulated sets
of �x�si � ���
�s�
ui � i � �� ���� n� s � �� ����m�� from xij��sx � ��
�s�
x and log��ui�j��sA � ��
�s�
A � respec
tively� to transform back to original scale� Note that by sampling from the population
as opposed to transforming back the original subjects� we are accounting for the ad
ditional variability of only having a �nite incomplete� sample of individuals from the
population�
��
��� Transformation back to original scale
As we described earlier� for each of the m� draws� we obtained a sample of n usual
intakes and n measurement error variances �x�si � ���
�s�
ui � in the normal scale� To make
inferences about the quantiles of the intake distribution� we now need to transform the
usual intake draws back to the original scale� By de�nition�
�y � EfY jx � �xg � Efg��x� u�jx � �xg�
To estimate this expectation� for each �xi� ���ui� draw� we generate a large number q of
uij from uij � N�� ���ui� and approximate the expectation using a Monte Carlo mean�
�yi � q��Pq
j�� g���xi � uij�� The number of Monte Carlo replicates q is chosen so as to
obtain the required precision for �yi�
For m� transformations and m� samples of usual intakes from the measurement error
model� we get m� � m� samples of size n� f�yig�t� t � �� ����m� � m�� from which we
can approximate marginal posterior distributions of interest� For example� we derive the
marginal posterior distribution of percentiles of the usual intake distribution of interest�
Pr fy�t � ag � �� for � � ����� ����� � � � � ���� We discuss this further in Section ��
��� Summary of Complete Algorithm
The three stages described in Section � can be summarized as follows�
�� Draw transformations g�lY � � X� l � �� ����M��
�� Obtain transformed intakes X�l�� � ����X
�lnd for l � �� ����m� out of M� draws�
�� Using transformed sample fXijg�l� �t MEM
X�lij � x
�li � u
�lij �
��
via Gibbs� and obtain m� �m� samples m� out of M� draws for MEM�
�x�l�s� � ��
��l�su� �� ���� �x�l�sn � ����l�sun �� l � �� ����m�� s � �� ����m��
�� Backtransform�
y�l�si � E�
qfg���lx� u�jx � �x
�l�si g�
where E�q �� is MC average over draws u�l�sv � N�� ���l�sui �� v � �� ���� q�
�� Obtain marginal posterior distributions of percentiles of f �l�sy� and other relevant
quantities�
� Example
As stated in Section �� we now illustrate the methodology using a cohort of females and
males� ages ���� from CSFII ��������� The female cohort consisted of ��� individuals
each of which had dietary data collected on two noncontiguous days� The male cohort
consisted of ��� individuals also with two nonconsecutive days of dietary intake data
each� We focus on six dietary components� calcium� cholesterol� iron� protein� vitamin
A� and vitamin C� In the case of calcium� iron� protein� vitamin A� and vitamin C� we
are interested in estimating the proportion of teenagers whose usual intakes do not meet
recommendations� In the case of cholesterol� we are concerned with excessive intakes�
and thus focus on the right tail of the distribution�
��� Performance of algorithm
The reversible jump MCMC algorithm worked well� Figures � and � show two realiza
tions l � � and l � �� ���� from the posterior distribution of g�� and the pairs Y �ij � zij�
for females and males respectively� for each dietary component� We see from these �gures
that the WLS procedure places more weight on the center of the distribution and less
��
weight on the tails where there is considerably more variability�� The transformation
draws shown in the �gures correspond to the case where the weight matrixW was taken
to be diagonal� The reversible jump MCMC algorithm converges quickly as monitored
by the MSE �� and to the same value based on multiple starting points not shown in
�gures��
For the prior distribution on the number of knots� we set � �� We chose a small
value for the mean number of knots as the data had already been powertransformed�
and just a few additional knots are likely to be needed to complete the transformation
to normality� Results were not sensitive to changes in the value of � in the range
���� The number of knots drawn from the posterior distribution for the various dietary
components ranged from about two to fourteen�
We monitored the convergence of the Markov chain of the parameters of the measure
ment error model using Gelman and Rubintype statistics Gelman and Rubin� �����
and autocorrelation plots as suggested in Cowles and Carlin� ������ The convergence
again was rather quick within about ��� iterations��
For posterior inference� we sampled m� � �� transformations every ��th iteration
after a burnin of ����� M� � ����� and for each transformation� sampled m� � ��
iterations every ��th iteration after a burnin of ���� M� � ���� from the measurement
error model� for a total of ��� backtransformed samples of size ��� for females ���
for males� of the usual intakes for which we compute posterior medians and ��� cred
ible intervals using the ���th and ����th quantiles of the posterior distribution� of the
quantiles and compute density plots�
��� Choice of weight matrix
As mentioned earlier� the weight matrix W has dimensions N � N � In our example�
N � ��� � � for females� and N � ��� � � for males� As N can be quite large� the
��
inversion of W can be impractical and very time consuming� Thus� we investigated
whether results would be sensitive to using a simpli�ed diagonal� version of W for
computation�
We chose to use the diagonal weight matrix for model�tting as a compromise� since
we can account for the extra variability of the quantiles in the tails and yet keep compu
tations manageable� Because a kernel density estimator is used to estimate the density
at the quantiles� use of the full weight matrix W may result in a procedure that is
not only inconvenient from a computational point of view� but also unstable� as density
estimates at the tails get very small�
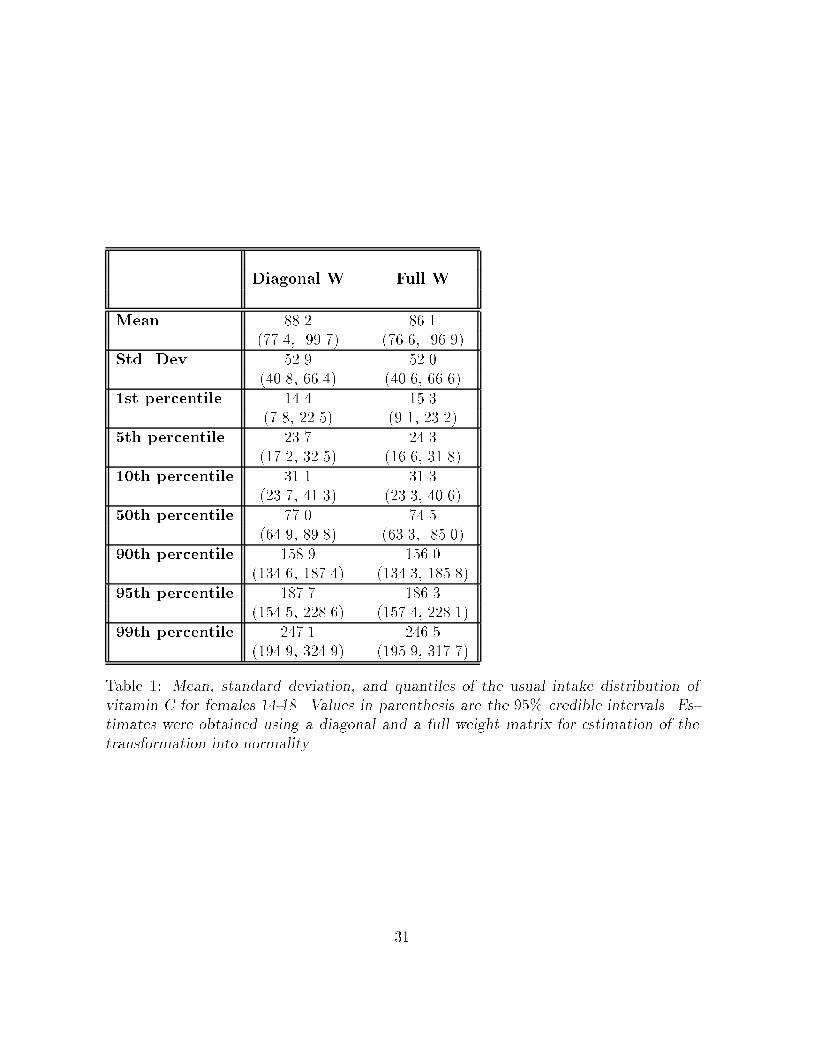
To decide whether results are sensitive to the choice of a diagonal version of W viz
a viz the complete� version� we repeated the analyses using both forms of the weight
matrix� for several of the dietary components under consideration� We only show results
obtained for vitamin C females�� which appear in Table � and Figure ��
The e�ect of ignoring the o�diagonal elements of W in the computations had very
little e�ect on �nal results� Estimates of quantities of interest� such as the mean� the
standard deviation� and the quantiles of usual intakes are very similar� regardless of
the weight matrix chosen� For example� every ��� credible interval obtained using the
diagonal weight matrix covers the corresponding point estimate obtained using the full
weight matrix� and in fact� most point estimates are within a standard deviation of each
other�
��� CSFII ��������
We applied the method we propose to dietary intake data collected in the CSFII during
the period ��������� for the two cohorts described in Section �� Figs� � and � display
two estimates of the usual intake distribution of each dietary component for females
and males� respectively� The density estimates drawn in dotted lines correspond to
��
the distribution of individual twoday means� These observed mean� distributions are
skewed for all dietary components except protein� whose empirical mean distribution is
almost symmetric but leptokurtic� As a result� it would not be appropriate to �t a normal
measurement error model to intake data to remove the withinindividual variance� Thus�
a di�erent parametric form must be chosen for the distribution of observed intake means�
or dietary intake data should be transformed into normality prior to variance estimation�
Following the approach described in Section �� we obtained the usual intake density
estimates shown in solid lines in Figs� � and �� The �gures show� as expected� that after
removal of measurement error� the estimated distributions of usual intakes have smaller
variability than the distributions of twoday means�
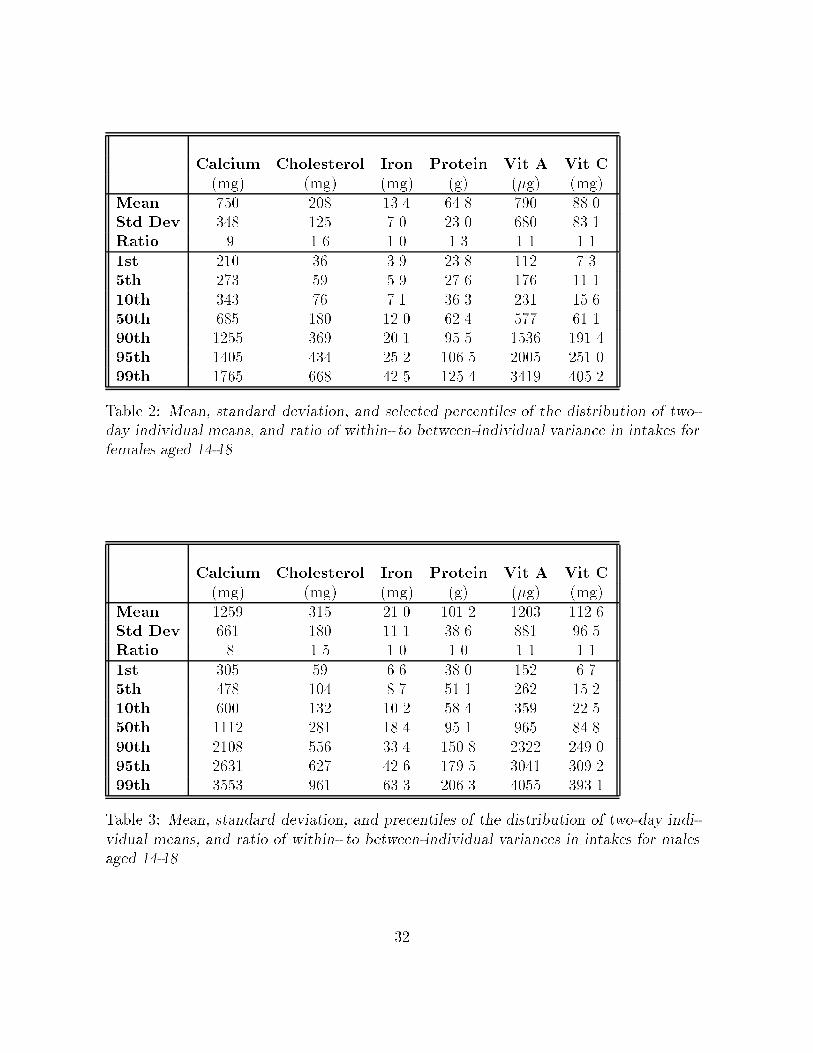
Tables � and � show the mean� standard deviation� and selected percentiles of the
distribution of observed individual means for each dietary component� for females and
males� respectively� In addition� tables also show the ratio of within to between
individual variances for each dietary component� These variance ratios are all close
to one� indicating that the measurement error variances are of about the same order
of magnitude as the betweenindividual variances� Therefore� these withinindividual
variance components cannot be ignored�
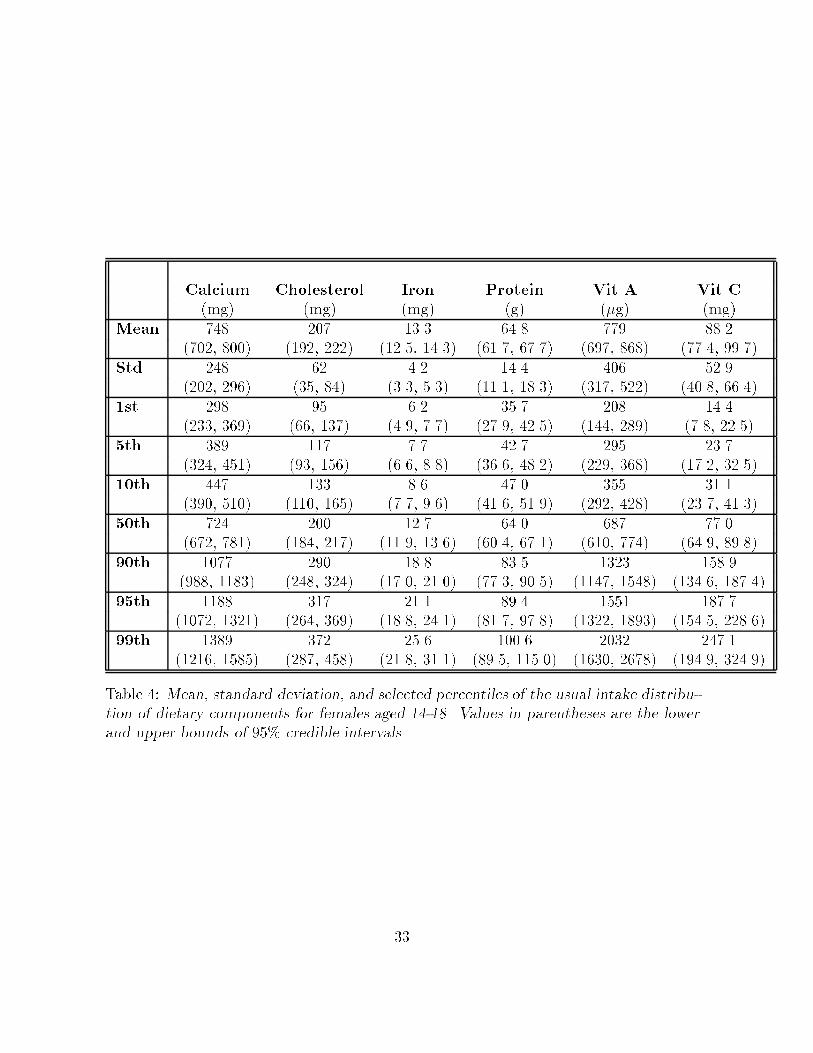
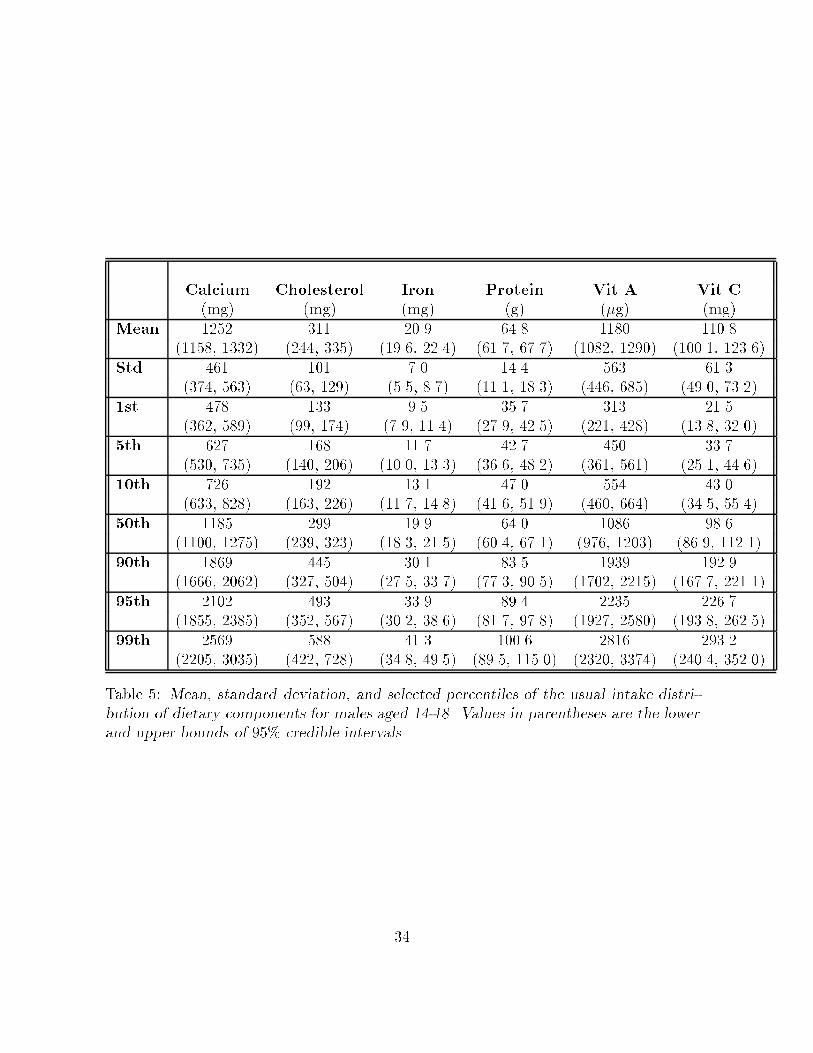
Tables � and � show the mean and the ���th and ����th percentiles of the poste
rior distribution of the mean� standard deviation� and selected percentiles of the usual
intake distribution for each dietary component� for females and males� respectively� A
comparison of the entries in Tables � and � to those in tables � and � con�rmed what
Figs� � and � show� intake distributions have less variability and lighter tails that result
from the model�s removal of the measurement error in the observed daily intakes� The
di�erences between the two estimated densities can be large� ��� credible intervals in
tables � and � often do not contain the corresponding quantile of the observed individual
��
mean distributions� This is particularly noticeable in the upper tail of the distributions�
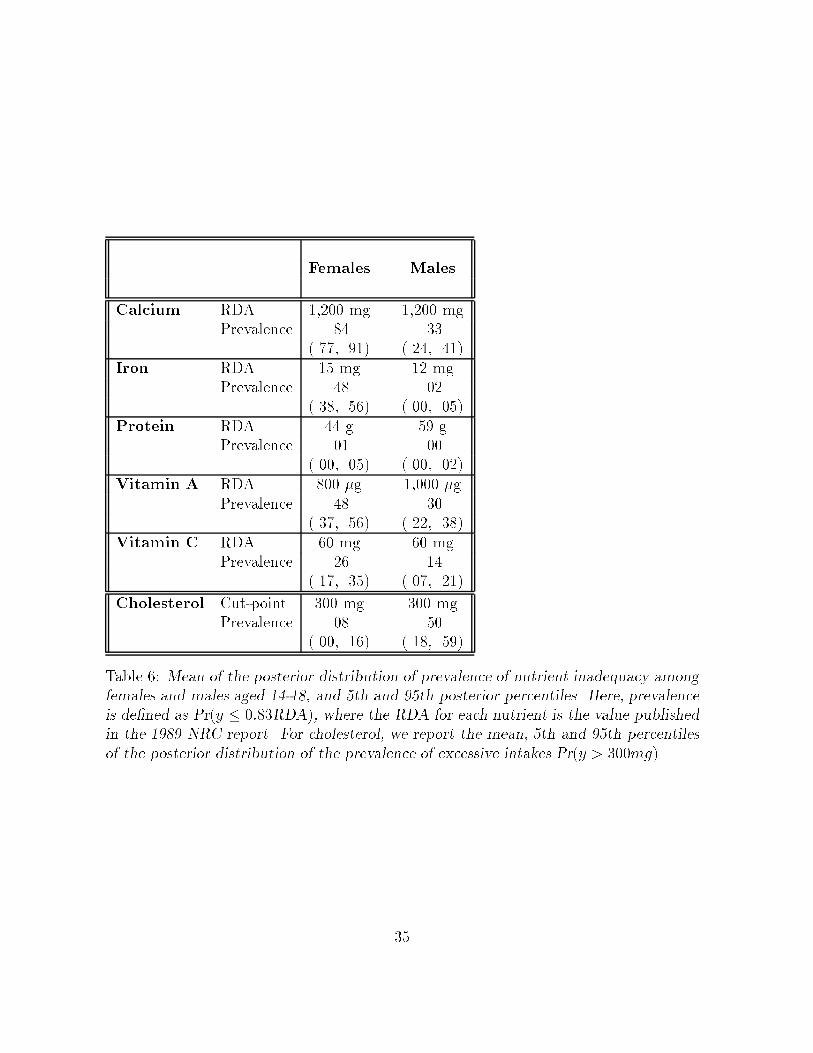
Table � shows the mean and the ���th and ����th percentiles of the posterior distribu
tion of the prevalence of nutrient inadequacy or� in the case of cholesterol� the prevalence
of excessive intake� for females and males� Here� we estimate the prevalence of nutrient
inadequacy as the proportion of individuals whose usual intake of the dietary component
is less than ��� of the Recommended Dietary Allowance RDA� e�g�� NRC� ����� page
���� for the nutrient see� e�g�� Carriquiry� ����� IOM� ������ For calcium� iron� protein�
vitamin A� and vitamin C� table � shows selected attributes of the posterior distribution
of Pry � �����RDA� for females and males� respectively� In the case of cholesterol� we
show the mean� �th and ��th percentiles of the posterior distribution of Pry � ���mg��
The interpretation of the entries in the table is the usual one� For example� for females�
the point estimate of the prevalence of nutrient inadequacy for calcium is ���� and a
posteriori� the probability that prevalence is between ��� and ��� is ����
� Discussion
The analysis of dietary intake data is challenging� even if we do not take into account
the various sources of biases and errors that are often present in this type of data� It is
recognized see� e�g�� IOM� ����� that individuals tend to underreport the amount of
food they consume� The extent of the underreporting is known to vary by nutrient� and
by genderageethnic group� but little additional information about the direction and
size of the biases is available� Attempts have been made to calibrate reported intake
using various biochemical markers see� e�g�� IOM� ������ These methods� however� are
still in the experimental stage� are very costly� and are useful to adjust energy intakes
at best� Nothing is known about the underreporting of� for example� trace minerals�
It is also known that the USDA databases used to map foods into nutrients are not
��
always errorfree Schubert et al� ����� Haytowitz et al� ������ For example� the USDA
databases lack precise information on folate content of foods� as a national forti�cation
e�ort that adds folate to various food items was implemented only in ���� IOM� ������
In this work� we do not take into account these potential sources of biases in dietary
intake data� Rather� we focus on the problem of developing appropriate methods to
analyze the data�
Estimating usual intake distributions of nutrients from dietary intake data can be
di�cult� as was argued in Section �� The approach we have chosen consists in trans
forming the observed intakes into the normal scale� removing the measurement error in
the normal scale� and then transforming individual estimated usual intakes back into
the original scale� An alternative approach consists in using a parametric model other
than the normal to represent the relationship between observed and usual intakes� For
example� a Weibull or a Gamma distribution might be an appropriate representation
for the distribution of intakes in the population� This approach has the drawback that
each new dietary component would require the identi�cation of the most suitable model�
thereby limiting the usefulness of the method for researchers in nutrition and areas other
than statistics�
The normalscale measurement error model we propose in Section ��� makes an as
sumption that is not necessarily satis�ed� that once observed individual intake means
are transformed into normality� both the usual intake and the measurement error com
ponents are also normally distributed� This is not necessarily so� although informal tests
suggest that for all the dietary components we investigated� the assumptions of model ��
appear to hold� A deconvolution approach that guarantees that both the usual intakes
and the measurement errors are normally distributed has also been proposed Stefan
ski and Carroll� ����� Stefanski and Carroll� ����� Chen� ������ For the speci�c case
��
of dietary intake data� Chen ����� argues that results obtained using a deconvolution
approach are not noticeably di�erent from those obtained by Nusser et al� ����� using
a frequentist version of the method we discuss in this manuscript�
We argue in Section � that a Bayesian framework is the most appropriate in this
estimation problem� as the method for estimating usual nutrient intake distributions
consists of several steps� Because the estimated transformation into normality and the
estimated variance components in the measurement error model are used as if they were
true values� the standard errors for estimators of the parameters of the usual intake dis
tribution in the Nusser et al� ����� approach underestimate the true uncertainty about
the value of those parameters� An advantage of the Bayesian paradigm is that it permits
proper accounting of all uncertainties� so that the posterior variance of� for example� the
prevalence of nutrient inadequacy� re�ects the uncertainty about all parameters in the
model� Thus� we expect that the ��� credible intervals obtained from the marginal
posterior distributions will be wider than the ��� con�dence intervals obtained from a
frequentist analysis such as that presented by Nusser et al� ������ Direct comparison
of the Bayesian and frequentist approaches is not possible as the model used for the
transformation function in this paper is di�erent from the one used in the Nusser et
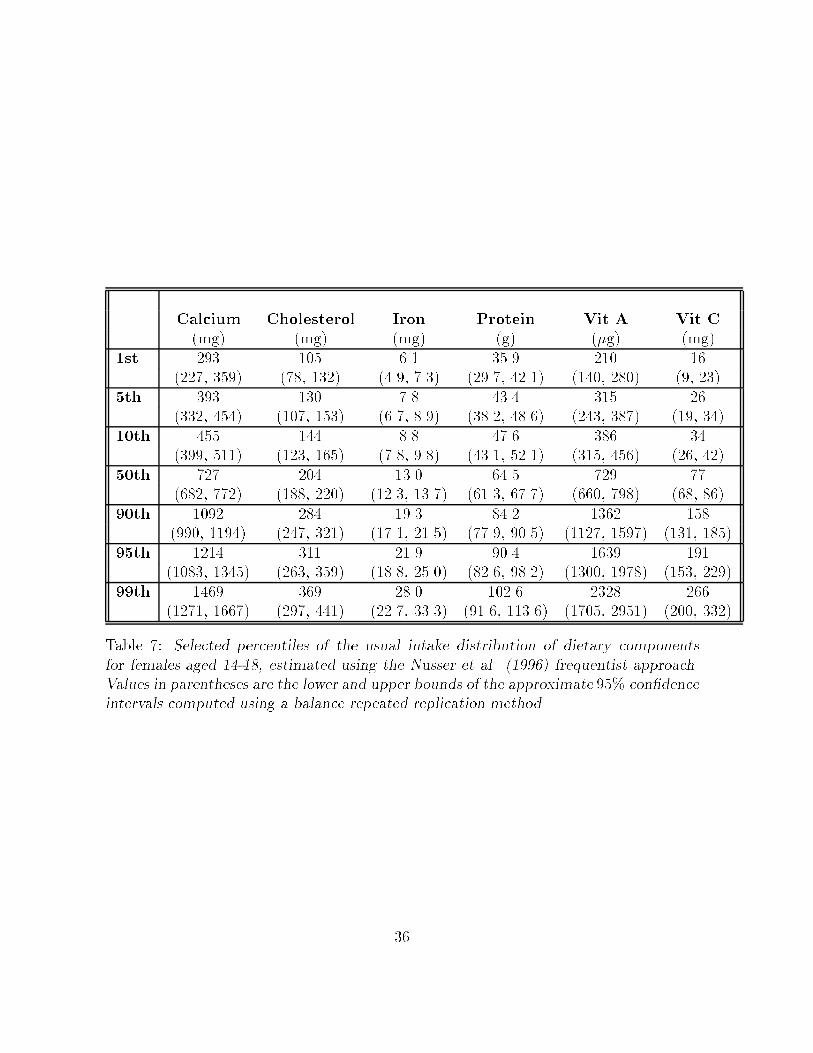
al� ����� manuscript� Nonetheless� we carried out the analysis using the frequentist
version of the method� Computations were done using C�SIDE Iowa State University�
������ a software developed to implement the Nusser et al� ����� method� Results
obtained from a frequentist viewpoint are presented in Tables � and �� for females and
males� respectively� Point estimates of percentiles are somewhat similar when comparing
both approaches� The ��� credible sets� however� tend to be wider� and need not be
symmetric around the posterior means of the percentiles�
In our example� we estimated the prevalence of nutrient inadequacy in the popula
��
tion as the proportion of individuals with usual intakes below ��� of the RDA NRC�
����� for the nutrient� It has been argued e�g�� Beaton� ����� Carriquiry� ����� that the
appropriate cuto� is the median of the distribution of requirements in the population�
rather than the RDA� The National Academy of Sciences� however� has not yet pub
lished the value of the median requirement for any genderage group� The exception is
calcium� for which the Academy of Sciences has concluded that the median requirement
for any group cannot be determined with the information that is currently available
about calcium intakes and requirements IOM� ����b�� Under simple assumptions� ���
of the RDA is approximately equal to the median requirement of the nutrient�
In Section ���� we used a generalized least squares approach to estimate the parame
ters of the function that transforms daily intakes into normality� An alternative approach
is as follows� de�ne g to be the function g��z� �� such that P Y �ij � y� � P Z � g��y���
where Z is distributed as a standard normal random variable� Again consider a cubic
spline form for the function g� In this case� an iterative procedure is needed to obtain
maximum likelihood estimates of the parameters in the model� If we let � � k� r�k���
as before� the likelihood for this model isQn
i��
Qdij�� fg
��yij� ���� where f denotes a
standard normal density� To estimate the parameters in this model� we obtain an initial
value for the parameters using GLS� and then carry out a single NewtonRaphson step
to approach the MLE using analytic derivatives�
We have discussed the speci�c problem of estimating usual nutrient intake distribu
tions� and presented an application consisting of estimating the prevalence of nutrient
inadequacy among teenagers using dietary intake data collected between ���� and �����
Several related problems still require investigation� An extension of the methods pre
sented here to the case where the usual intake distributions of food intakes is of interest
is not straightforward� Di�culties arise because in the case of foods� it is important
��
to consider not only the amount of a food consumed� but also the probability that the
individual would have consumed the food on the day when the interview was conducted�
For many food items� the probability of consumption is not independent of the amount
consumed� so estimating the marginal distribution of usual intake of foods can be chal
lenging� Yet� the problem is an important one� as the distribution of usual food intakes
is required to assess exposure rates to toxicants found in the food supply in a group�
Ratios of dietary components are also of importance� For example� researchers may
be interested in assessing the proportion of individuals in a group who consume� on the
average� more than ��� of calories from fat� or more than ��� of calories from saturated
fat� The methods presented in this paper for estimating the usual intake distribution for
a nutrient cannot be directly applied to ratios of dietary components as those described
above� Typically� both the numerator and the denominator in the ratio are observed
subject to measurement error� and cannot be assumed to be independent�
References
Beaton� G�H� ����� Criteria of an adequate diet� In� Shils� R�E�� Olson� J�A�� Shike�
M� eds� Modern Nutrition in Health and Disease� Lea and Febiger� Philadelphia�
Blom� G� ����� Statistical Estimates and Transformed Beta Variables� Wiley� New
York�
Carriquiry� A�L� ������ Assessing the prevalence of nutrient inadequacy� Public Health
Nutrition� In press�
Carroll� R�J�� Freedman� L�S�� and Hartman� A�M� ����� Use of semiquantitative food
frequency questionnaires to estimate the distribution of usual intake� American
Journal of Epidemiology� �����������
��
Chen� C� ����� Spline estimators of the distribution function of a variable measured
with error� Doctoral Thesis� Department of Statistics� Iowa State University�
Cowles� K�� and Carlin� B�S� ����� Markov chainMonte Carlo convergence diagnostics�
A comparative review� Journal of the American Statistical Association� ��������
Denison� D�G�T�� Mallik� B�K�� and Smith� A�F�M� ����� Automatic Bayesian curve
�tting� Applied Statistics� ����������
Dodd� K� ����� A Technical Guide to C�SIDE� Technical Report ��TR ��� Dietary
Assessment Research Series Report �� Department of Statistics and Center for Agri
cultural and Rural Development CARD�� Iowa State University� Ames�
Eckert� R�S�� Carroll� R�J�� and Wang� N� ����� Transformations to additivity in
measurement error models� Biometrics� ����������
Gelman� A�� and Rubin� D�B� ����� Inference from iterative simulation using multiple
sequences� Statistical Science� ���������
Green� P�J� ����� Reversible jumpMarkov chainMonte Carlo computation and Bayesian
model determination� Biometrika� ����������
Haytowitz� D�B� Pehrsson� P�R� Smith� J�� Gebhardt� S�E�� Mathews R�H� and Ander
son� B�A� ����� Key foods� setting priorities for nutrient analysis� Journal of Food
Composition and Analysis� ���������
Huang� E�T�� Fuller� W�A� ����� Nonnegative regression estimation for sample survey
data� ASA Proceedings of the Social Statistics Section� �������
Institute of Medicine ����a� Dietary Reference Intakes� Thiamin� Riboavin� Niacin�
Vitamin B� Folate� Vitamin B��� Pantothenic Acid� Biotin� and Choline� Preprint�
��
National Academy Press� Washington� DC�
Institute of Medicine ����b� Dietary Reference Intakes� Calcium� Phosphorus� Mag�
nesium� Vitamin D� and Fluoride� Preprint� National Academy Press� Washington�
DC�
Department of Statistics and Center for Agricultural and Rural Development� Iowa
State University� ����� A Users Guide to C�SIDE� Software for Intake Distribu�
tion� Version ���� Technical Report ��TR ��� Center for Agricultural and Rural
Development� Iowa State University� Ames�
National Research Council ����� Nutrient Adequacy� National Academy Press� Wash
ington� DC�
National Research Council ����� Recommended Dietary Allowances� ��th ed� Na
tional Academy Press� Washington� DC�
Nusser� S�M�� Carriquiry� A�L�� Dodd� K�W�� and Fuller� W�A� ����� A semiparametric
transformation approach to estimating usual daily intake distributions� Journal of
the American Statistical Association� ������������
Schubert� A�� Holden� J�M�� and Wolf� W�R� ����� Selenium content of a core group
of fooods based on a critical evaluation of published analytical data� Journal of the
American Dietetics Association� ����������
Smith� A�F�M�� Roberts� G�O� ����� Bayesian computation via the Gibbs sampler and
related Markov chain Monte Carlo methods� Journal of Royal Statistical Society B�
�������
Schervish� M� ����� Theory of Statistics� SpringerVerlag� New York�
��
Spiegelhalter� D�J� Best� N�G� Gilks� W�R� and Inskip� H� ������ Hepatitis B� a case
study in MCMC methods� in Markov Chain Monte Carlo in Practice� eds� Gilks
WR� Richardson S� Spiegelhalter DJ� Chapman and Hall� pp� �������
Stefanski� L�A�� and Bay� J�M� ����� Simulation extrapolation deconvolution of �nite
population cumulative distribution function estimators� Biometrika ����������
Stefanski� L�A�� and Carroll� R�J� ����� Deconvoluting kernel density estimators�
Statistics� ����������
Stefanski� L�A�� and Carroll� R�J� ����� Deconvolutionbased score tests in measure
ment error models� The Annals of Statistics� ����������
U�S� Department of Agriculture� Agricultural Research Service ������ Continuing
Survey of Food Intakes by Individuals� ��� ������ CSFII Report� Washington� DC�
U�S� Government Printing O�ce�
��
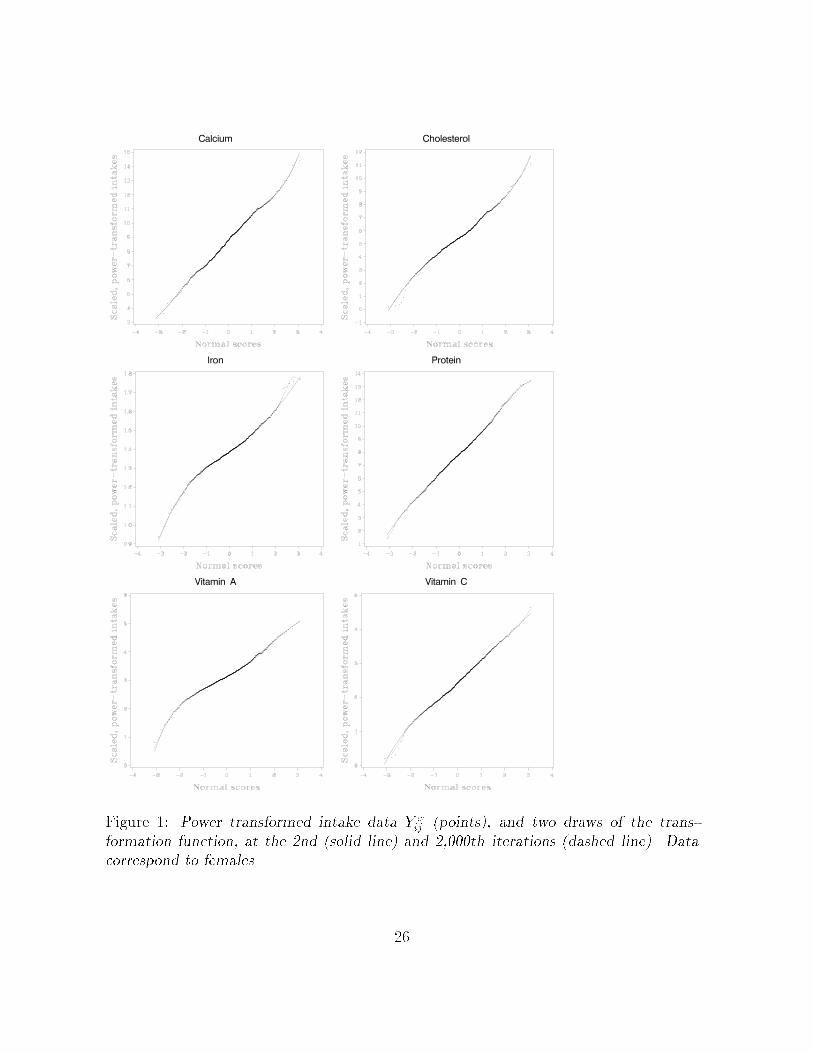
Figure �� Power transformed intake data Y �ij �points�� and two draws of the trans�
formation function� at the �nd �solid line� and �����th iterations �dashed line�� Datacorrespond to females�
��
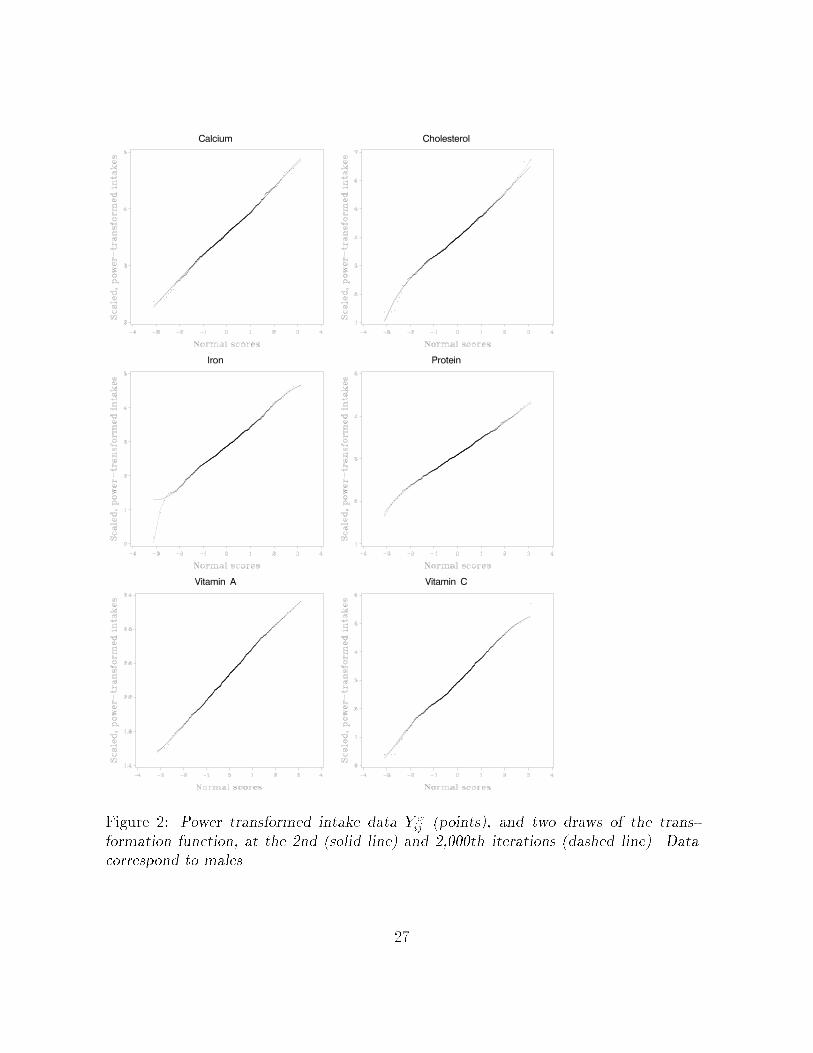
Figure �� Power transformed intake data Y �ij �points�� and two draws of the trans�
formation function� at the �nd �solid line� and �����th iterations �dashed line�� Datacorrespond to males�
��
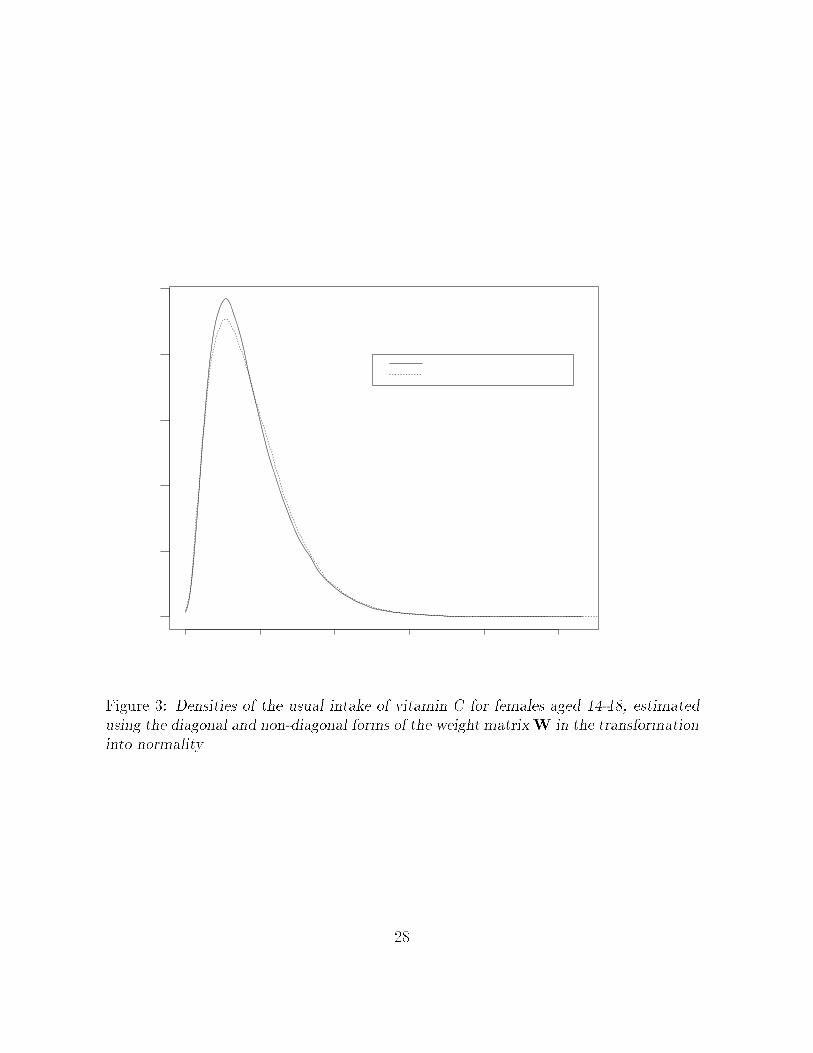
Figure �� Densities of the usual intake of vitamin C for females aged ��� estimatedusing the diagonal and non�diagonal forms of the weight matrixW in the transformationinto normality�
��
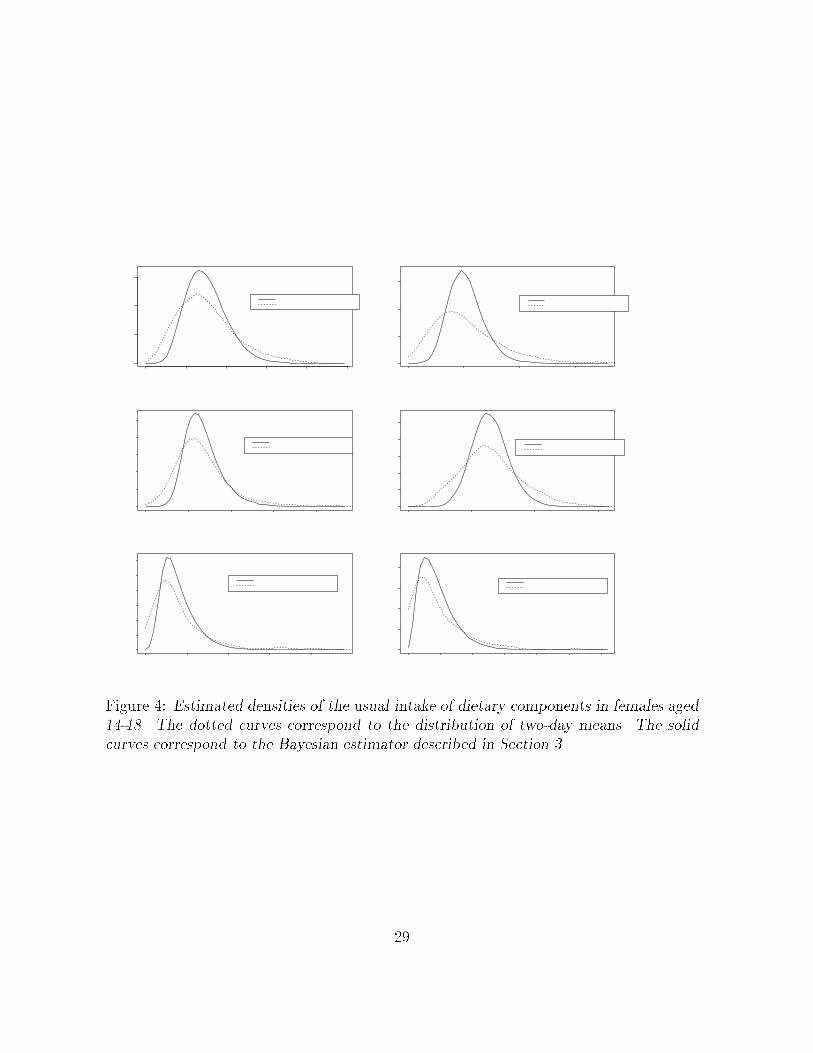
Figure �� Estimated densities of the usual intake of dietary components in females aged��� The dotted curves correspond to the distribution of two�day means� The solidcurves correspond to the Bayesian estimator described in Section ��
��
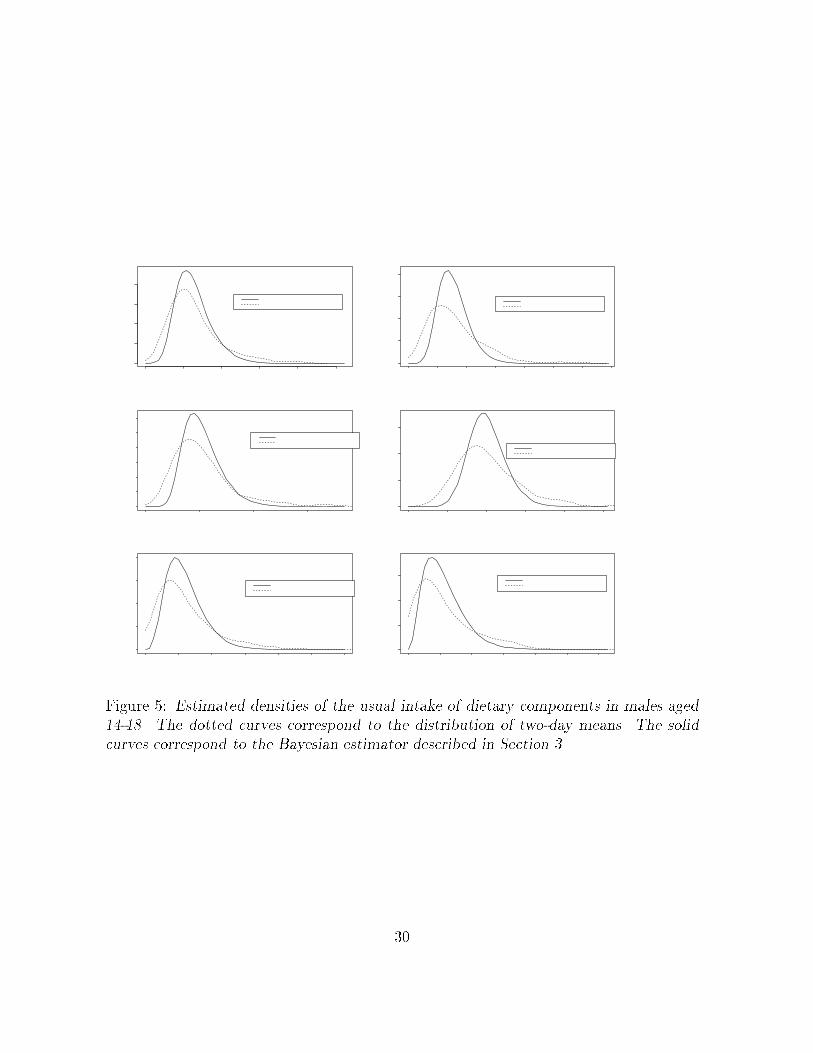
Figure �� Estimated densities of the usual intake of dietary components in males aged��� The dotted curves correspond to the distribution of two�day means� The solidcurves correspond to the Bayesian estimator described in Section ��
��
Diagonal W Full W
Mean ���� ��������� ����� ����� �����
Std� Dev� ���� ��������� ����� ����� �����
�st percentile ���� �������� ����� ���� �����
�th percentile ���� ��������� ����� ����� �����
�th percentile ���� ��������� ����� ����� �����
�th percentile ���� ��������� ����� ����� �����
th percentile ����� ����������� ������ ������ ������
�th percentile ����� ����������� ������ ������ ������
th percentile ����� ����������� ������ ������ ������
Table �� Mean� standard deviation� and quantiles of the usual intake distribution ofvitamin C for females ��� Values in parenthesis are the ��� credible intervals� Es�timates were obtained using a diagonal and a full weight matrix for estimation of thetransformation into normality�
��
Calcium Cholesterol Iron Protein Vit A Vit C
mg� mg� mg� g� �g� mg�Mean ��� ��� ���� ���� ��� ����Std Dev ��� ��� ��� ���� ��� ����Ratio �� ��� ��� ��� ��� ����st ��� �� ��� ���� ��� ����th ��� �� ��� ���� ��� �����th ��� �� ��� ���� ��� �����th ��� ��� ���� ���� ��� ����th ���� ��� ���� ���� ���� ������th ���� ��� ���� ����� ���� �����th ���� ��� ���� ����� ���� �����
Table �� Mean� standard deviation� and selected percentiles of the distribution of two�day individual means� and ratio of within� to between�individual variance in intakes forfemales aged ���
Calcium Cholesterol Iron Protein Vit A Vit C
mg� mg� mg� g� �g� mg�Mean ���� ��� ���� ����� ���� �����Std Dev ��� ��� ���� ���� ��� ����Ratio �� ��� ��� ��� ��� ����st ��� �� ��� ���� ��� ����th ��� ��� ��� ���� ��� �����th ��� ��� ���� ���� ��� �����th ���� ��� ���� ���� ��� ����th ���� ��� ���� ����� ���� ������th ���� ��� ���� ����� ���� �����th ���� ��� ���� ����� ���� �����
Table �� Mean� standard deviation� and precentiles of the distribution of two�day indi�vidual means� and ratio of within� to between�individual variances in intakes for malesaged ���
��
Calcium Cholesterol Iron Protein Vit A Vit C
mg� mg� mg� g� �g� mg�Mean ��� ��� ���� ���� ��� ����
���� ���� ���� ���� ����� ����� ����� ����� ���� ���� ����� �����Std� ��� �� ��� ���� ��� ����
���� ���� ��� ��� ���� ���� ����� ����� ���� ���� ����� ������st ��� �� ��� ���� ��� ����
���� ���� ��� ���� ���� ���� ����� ����� ���� ���� ���� ������th ��� ��� ��� ���� ��� ����
���� ���� ��� ���� ���� ���� ����� ����� ���� ���� ����� ������th ��� ��� ��� ���� ��� ����
���� ���� ���� ���� ���� ���� ����� ����� ���� ���� ����� ������th ��� ��� ���� ���� ��� ����
���� ���� ���� ���� ����� ����� ����� ����� ���� ���� ����� �����th ���� ��� ���� ���� ���� �����
���� ����� ���� ���� ����� ����� ����� ����� ����� ����� ������ �������th ���� ��� ���� ���� ���� �����
����� ����� ���� ���� ����� ����� ����� ����� ����� ����� ������ ������th ���� ��� ���� ����� ���� �����
����� ����� ���� ���� ����� ����� ����� ������ ����� ����� ������ ������
Table �� Mean� standard deviation� and selected percentiles of the usual intake distribu�tion of dietary components for females aged ��� Values in parentheses are the lowerand upper bounds of ��� credible intervals�
��
Calcium Cholesterol Iron Protein Vit A Vit C
mg� mg� mg� g� �g� mg�Mean ���� ��� ���� ���� ���� �����
����� ����� ���� ���� ����� ����� ����� ����� ����� ����� ������ ������Std� ��� ��� ��� ���� ��� ����
���� ���� ��� ���� ���� ���� ����� ����� ���� ���� ����� ������st ��� ��� ��� ���� ��� ����
���� ���� ��� ���� ���� ����� ����� ����� ���� ���� ����� ������th ��� ��� ���� ���� ��� ����
���� ���� ���� ���� ����� ����� ����� ����� ���� ���� ����� ������th ��� ��� ���� ���� ��� ����
���� ���� ���� ���� ����� ����� ����� ����� ���� ���� ����� ������th ���� ��� ���� ���� ���� ����
����� ����� ���� ���� ����� ����� ����� ����� ���� ����� ����� ������th ���� ��� ���� ���� ���� �����
����� ����� ���� ���� ����� ����� ����� ����� ����� ����� ������ �������th ���� ��� ���� ���� ���� �����
����� ����� ���� ���� ����� ����� ����� ����� ����� ����� ������ ������th ���� ��� ���� ����� ���� �����
����� ����� ���� ���� ����� ����� ����� ������ ����� ����� ������ ������
Table �� Mean� standard deviation� and selected percentiles of the usual intake distri�bution of dietary components for males aged ��� Values in parentheses are the lowerand upper bounds of ��� credible intervals�
��
Females Males
Calcium RDA ����� mg ����� mgPrevalence ��� ���
���� ���� ���� ����Iron RDA �� mg �� mg
Prevalence ��� ������� ���� ���� ����
Protein RDA �� g �� gPrevalence ��� ���
���� ���� ���� ����Vitamin A RDA ��� �g ����� �g
Prevalence ��� ������� ���� ���� ����
Vitamin C RDA �� mg �� mgPrevalence ��� ���
���� ���� ���� ����
Cholesterol Cutpoint ��� mg ��� mgPrevalence ��� ���
���� ���� ���� ����
Table �� Mean of the posterior distribution of prevalence of nutrient inadequacy amongfemales and males aged ��� and th and � th posterior percentiles� Here� prevalenceis de�ned as Pry � ����RDA�� where the RDA for each nutrient is the value publishedin the ��� NRC report� For cholesterol� we report the mean� th and � th percentilesof the posterior distribution of the prevalence of excessive intakes Pry � ���mg��
��
Calcium Cholesterol Iron Protein Vit A Vit C
mg� mg� mg� g� �g� mg��st ��� ��� ��� ���� ��� ��
���� ���� ��� ���� ���� ���� ����� ����� ���� ���� �� ����th ��� ��� ��� ���� ��� ��
���� ���� ���� ���� ���� ���� ����� ����� ���� ���� ��� ����th ��� ��� ��� ���� ��� ��
���� ���� ���� ���� ���� ���� ����� ����� ���� ���� ��� ����th ��� ��� ���� ���� ��� ��
���� ���� ���� ���� ����� ����� ����� ����� ���� ���� ��� ���th ���� ��� ���� ���� ���� ���
���� ����� ���� ���� ����� ����� ����� ����� ����� ����� ���� �����th ���� ��� ���� ���� ���� ���
����� ����� ���� ���� ����� ����� ����� ����� ����� ����� ���� ����th ���� ��� ���� ����� ���� ���
����� ����� ���� ���� ����� ����� ����� ������ ����� ����� ���� ����
Table �� Selected percentiles of the usual intake distribution of dietary componentsfor females aged ��� estimated using the Nusser et al� ����� frequentist approach�Values in parentheses are the lower and upper bounds of the approximate ��� con�denceintervals computed using a balance repeated replication method�
��
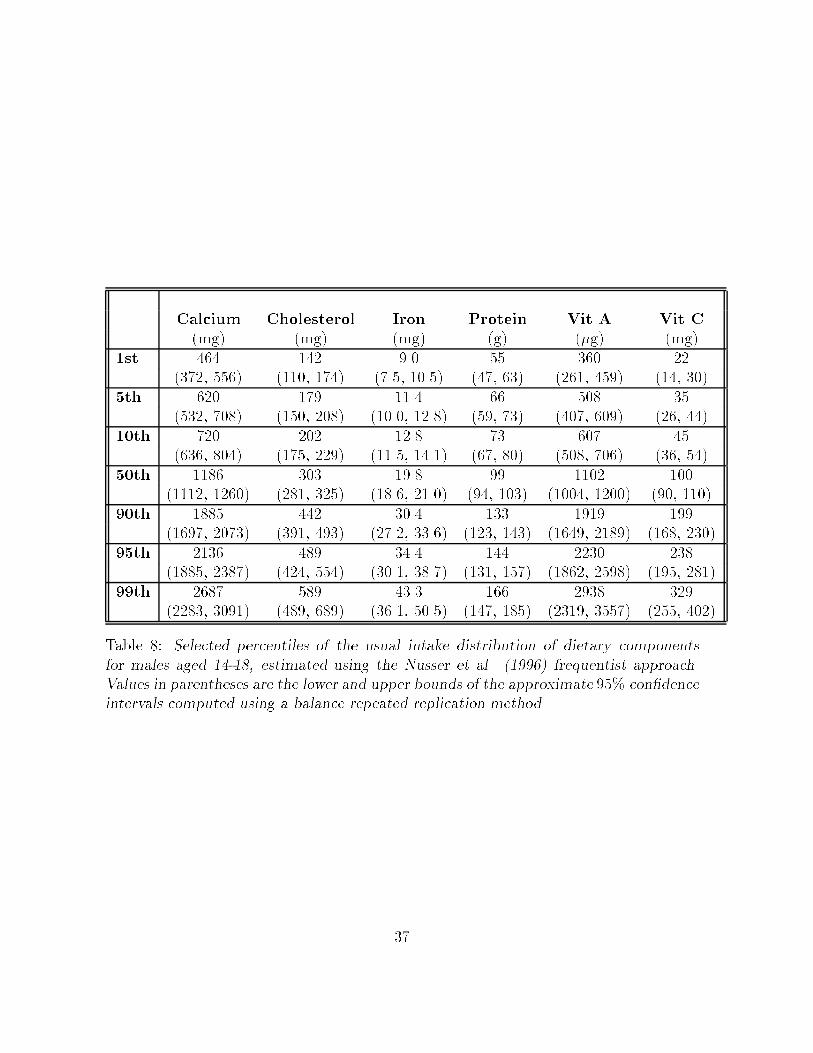
Calcium Cholesterol Iron Protein Vit A Vit C
mg� mg� mg� g� �g� mg��st ��� ��� ��� �� ��� ��
���� ���� ���� ���� ���� ����� ��� ��� ���� ���� ��� ����th ��� ��� ���� �� ��� ��
���� ���� ���� ���� ����� ����� ��� ��� ���� ���� ��� ����th ��� ��� ���� �� ��� ��
���� ���� ���� ���� ����� ����� ��� ��� ���� ���� ��� ����th ���� ��� ���� �� ���� ���
����� ����� ���� ���� ����� ����� ��� ���� ����� ����� ��� ����th ���� ��� ���� ��� ���� ���
����� ����� ���� ���� ����� ����� ���� ���� ����� ����� ���� �����th ���� ��� ���� ��� ���� ���
����� ����� ���� ���� ����� ����� ���� ���� ����� ����� ���� ����th ���� ��� ���� ��� ���� ���
����� ����� ���� ���� ����� ����� ���� ���� ����� ����� ���� ����
Table �� Selected percentiles of the usual intake distribution of dietary componentsfor males aged ��� estimated using the Nusser et al� ����� frequentist approach�Values in parentheses are the lower and upper bounds of the approximate ��� con�denceintervals computed using a balance repeated replication method�
��