Embed Size (px)
Citation preview

DIETARY POLYPHENOLIC INTAKE FROM ACORNS AND ACORN MEAL
by
LISA KOBS
(Under the Direction of James Hargrove)
ABSTRACT
Antioxidant consumption can increase through strategic food choices. Acorns could
contribute to those strategic choices. We surveyed antioxidant content in a variety of acorns
from the southeastern United States. The phenolic content of Quercus velutina prior to leaching
was 39.4±3.6 mg GAE/g and of Quercus alba was 27.4±.3 mg GAE/g. After 5 leaching stages,
the phenolic content of Q. velutina was 12.3±.8 mg GAE/g and of Q. alba was 10.8±.7 mg
GAE/g. After milling, the phenolic value for Q. velutina was 39.9±4.5 mg GAE/g and for Q.
alba was 6.6±.1 mg GAE/g. A spice cookie made with all-purpose wheat flour contained 2.7±.1
mg GAE/g. When red oak acorn meal was substituted, the cookie contained 9.6±3.3 mg GAE/g,
and when substituted with white oak acorn meal contained 4.2±.4 mg GAE/g. Ingredient
interactions influenced the phenolic content. Acorns and acorn products can be a strategic
method of increasing polyphenolic intake.
INDEX WORDS: Polyphenols, Acorns, DASH Diet

DIETARY POLYPHENOLIC INTAKE FROM ACORNS AND ACORN MEAL
by
LISA KOBS
B.A., College of Saint Benedict, 2005
A Thesis Submitted to the Graduate Faculty of The University of Georgia in Partial Fulfillment
of the Requirements for the Degree
MASTER OF SCIENCE
ATHENS, GEORGIA
2008

© 2008
Lisa Kobs
All Rights Reserved

DIETARY POLYPHENOLIC INTAKE FROM ACORNS AND ACORN MEAL
by
LISA KOBS
Major Professor: James Hargrove
Committee: Diane Hartle Arthur Grider
Electronic Version Approved: Maureen Grasso Dean of the Graduate School The University of Georgia May 2008

ACKNOWLEDGEMENTS
I would like to thank my major advisor and committee members, Dr. James Hargrove,
Dr. Diane Hartle, and Dr. Arthur Grider for all of their help and input. I would also like to thank
Dr. Ruthann Swanson for her expertise in food processing and recipe development, and Joyce
Power who played an integral role in the project. If it wasn’t for her, we would not have had any
acorn samples to test. I would also like to thank Linda Duncan for her assistance in running the
assays. And lastly I would like to thank my fellow graduate students for their support during the
development of the acorn project.
iv

TABLE OF CONTENTS
Page
ACKNOWLEDGEMENTS........................................................................................................... iv
LIST OF TABLES........................................................................................................................ vii
LIST OF FIGURES ..................................................................................................................... viii
CHAPTER
I INTRODUCTION .........................................................................................................1
II LITERATURE REVIEW ..............................................................................................5
DIET RECOMMENDATIONS ................................................................................5
REACTIVE OXYGEN SPECIES.............................................................................8
ANTIOXIDANTS ...................................................................................................11
POLYPHENOLS.....................................................................................................14
CURRENT CONSUMPTION ................................................................................19
ANTIOXIDANT EVALUATION METHODS......................................................20
PRESENCE OF ANTIOXIDANTS IN FOOD.......................................................23
PROCESSING OF POLYPHENOL FOODS .........................................................25
ANTIOXIDANT ACTIVITY IN VIVO .................................................................26
POTENTIAL HEALTH BENEFITS OF PROANTHOCYANIDINS
(CONDENSED TANNINS)..............................................................................29
DOSE DEPENDENT BIOACTIVITIES OF POLYPHENOLS.............................31
POTENTIAL FOR POLYPHENOL TOXICITY ...................................................32
v

ACORNS AND POLYPHENOLS..........................................................................35
PHYTOCHEMICAL DATA AVAILABLE...........................................................37
GENERAL HYPOTHESIS.....................................................................................41
BIBLIOGRAPHY ...................................................................................................42
III DIETARY POLYPHENOLIC INTAKE FROM ACORNS AND ACORN MEAL ..54
ABSTRACT ............................................................................................................55
INTRODUCTION...................................................................................................56
MATERIALS AND METHODS ............................................................................58
RESULTS................................................................................................................62
DISCUSSION .........................................................................................................65
BIBLIOGRAPHY ...................................................................................................74
IV IMPROVEMENT TO DASH DIET............................................................................76
BIBLIOGRAPHY ...................................................................................................82
V CONCLUSIONS..........................................................................................................83
LIMITATIONS .......................................................................................................83
IMPLICATIONS.....................................................................................................83
FUTURE RESEARCH............................................................................................84
vi

LIST OF TABLES
Page
Table 2.1: Proanthocyanidin content of various foods ..................................................................37
Table 2.2: Antioxidant capacity of 50 foods highest in antioxidants ............................................39
Table 2.3: Antioxidant capacity for select nuts .............................................................................40
Table 3.1: Total phenols of ingredients used in cookie made with red oak acorn meal ................69
Table 3.2: Total phenols in ingredients used to make red oak acorn meal cookie ........................69
Table 3.3: Comparison of Total Phenolics and Antioxidant Capacity (FRAP values) in Red and
White oak Acorns..........................................................................................................70
Table 4.1: Beverages......................................................................................................................78
Table 4.2: Fruit...............................................................................................................................78
Table 4.3: Grains............................................................................................................................79
Table 4.4: Nuts and Seeds..............................................................................................................80
Table 4.5: Spices............................................................................................................................80
Table 4.6: Vegetables.....................................................................................................................81
Table 4.7: DASH Diet Day 6 lunch menu and replacement foods to increase polyphenol intake 81
vii

viii
LIST OF FIGURES
Page
Figure 2.1: Phytochemical classifications including phenolic subgroup classifications ...............15
Figure 2.2: Structures of typical tannins and proanthocyanidins...................................................17
Figure 3.1: The total phenolic content of Q. velutina and Q. alba at the pre-leaching stage and
after the 5 stages of leaching .........................................................................................71
Figure 3.2: The effect of baking time and baking temperature on the phenol content of acorn
meal cookies and batter .................................................................................................71
Figure 3.3: The total phenol content of acorn meal, albumin, and sucrose with water, and the
effect on total phenol content of acorn meal in solution with albumin and sucrose .....72
Figure 3.4: The total phenol content of cinnamon, albumin, and sucrose with water, and the
effect on total phenol content of cinnamon in solution with albumin and sucrose. ......72
Figure 3.5: A comparison of several different varieties of nuts in calories per serving and
polyphenol content per serving .....................................................................................73

CHAPTER I
INTRODUCTION
The occurrence of chronic disease in the United States is increasing due to several
possible factors. One factor includes changes in eating habits compared to historical norms. The
highly refined and processed diets of today are far different from diets of the past (Cordain,
2002). The refining and processing that occurs eliminates possible disease-fighting compounds
found in unrefined foods, an example being polyphenols. Polyphenols are antioxidants that may
help prevent negative effects of oxidative stress. Oxidative stress has been associated with
various degenerative diseases including obesity (Erdeve and others 2007), aging (Kregel and
Zhang, 2007), (Beckman and Ames, 1998), cardiovascular disease (CVD) (Ignarro and others
2007), hypertension (Harrison and others 2007) and diabetes (Devangelio and others 2007), (Han
and others 2007), (Valko and others 2007), (Ames and others 1993).
Because free radicals are produced during normal metabolism of nutrients and drugs, the
oxidation that occurs within biological systems cannot be avoided entirely. However, the extent
of the oxidation and associated damage can be lessened by taking certain actions. Because
humans are exposed to multiple sources of potential oxidation, the methods to decrease the
consequences of oxidation vary. For example, exercise causes oxidative damage; however,
exercise has many beneficial effects (Ji, 1999). Therefore decreasing exercise may not be as
beneficial as making other changes, such as dietary changes, that protect and support the body
during exercise.
1

Dietary efforts to decrease oxidation include increasing the consumption of nutrient
antioxidants such as vitamins A, C and E (Scalbert and others 2005b). Although not considered
nutrients, dietary constituents such as phytochemicals can also decrease oxidation.
Phytochemicals encompass thousands of compounds varying in structure, and the oxidation
prevention potential is based primarily on the structure of the compound. Categories of
phytochemicals include carotenoids, phenolics, alkaloids, nitrogen-containing compounds, and
organosulfur compounds. Several thousand compounds containing phenolic structures have
been identified, with several hundred existing in edible plants (Manach and others 2004).
Specific classes of polyphenols have structures with better antioxidant potential compared to
other classes of polyphenols (Bors and Michel, 2002). The structure of polyphenols has been
shown to be even more effective in free radical scavenging than vitamins C and E (Rice-Evans
and others 1997), (Yan and others 2002). Because of the ability of polyphenols to scavenge free
radicals, increasing polyphenol consumption in the diet should have beneficial effects on damage
due to oxidation in the tissues and bloodstream.
Phenolics are found in several different types of foods including beverages, fruits,
vegetables, grains, and spices. The most concentrated source of polyphenols is possibly from the
spices category because most spices have been dried and contain little food energy (kcal).
Increasing the consumption of spices could have many beneficial effects without increasing
calorie consumption due to the high polyphenol density and low energy content in spices (Wu
and others 2004), (Ninfali and others 2005).
Multiple recommendations have been made in terms of making healthy dietary choices,
one being the Dietary Reference Intakes (Food and Nutrition Board Institute of Medicine, 2005).
Dietary recommendations have also been made for those individuals who need to treat an
2

existing disease. Two examples are carbohydrate counting and use of the Exchange System for
individuals with diabetes and the Dietary Approaches to Stop Hypertension (DASH) diet for
individuals with hypertension. These recommendations are comprehensive in terms of dealing
with the specific nutrients that are associated with the disease such as fats and carbohydrates in
the case of diabetes and sodium and potassium with hypertension. However, these guidelines do
not yet include specific recommendations for non-nutritive phytochemicals. The DASH diet
encourages fresh fruit and vegetable consumption because of the naturally low sodium content
and abundant potassium and magnesium in these foods. Fruits, vegetables, legumes, and nuts are
also high in phytochemicals. If the recommendations were to include foods based on the
antioxidant capacity, in addition to the nutrient content, the recommendations could provide
more benefit in terms of disease prevention. More specifically, foods could be included in the
recommendations to increase polyphenol content, such as berries or adding spices such as
cinnamon to foods already recommended.
Nuts also can be a good source of polyphenols in the American diet. Several varieties of
nuts that are easily accessible in grocery stores are high in polyphenols including pecans,
pistachios, and walnuts (Wu et al., 2004). Other nuts not typically thought of in terms of human
consumption, and not as widely available, are also high in polyphenols, such as acorns. There is
evidence that acorns have served as dietary staples in many parts of the world where oak trees
grow, and may provide up to 25%-50% of calories. This suggests that certain traditional diets
may have provided much higher levels of polyphenolics than are found in modern diets based
largely on refined ingredients (Bainbridge, 1986).
3

The objectives of this study include:
1. To show the wide range of antioxidant intake that can be obtained by combining
different foods and ingredients suggested by the DASH diet plan
2. To determine the total phenolic content of acorns from selected oak species
during various stages of processing and in a finished cookie product.
3. To evaluate the effect of baking and the interactions of different ingredients on
the total phenolic content of cookies made with acorn meal.
4

CHAPTER II
LITERATURE REVIEW
DIET RECOMMENDATIONS
Dietary Reference Intakes
The Dietary Reference Intakes (DRIs) are the reference values established for individuals
to ensure adequate intake of nutrients, based on age, gender, and life stage. The DRIs consist of
the Recommended Dietary Allowance (RDA), Estimated Average Requirement (EAR),
Adequate Intake (AI), and Tolerable Upper Intake Level (UL). Values have not been established
for all nutrients due to limited information in the published literature about specific effects of the
particular nutrient. In some instances if the literature supports a nutrient functioning as an
antioxidant, the DRIs will be established at levels where that nutrient can optimally function as
an antioxidant (Food and Nutrition Board Institute of Medicine, 2000).
The RDA for vitamin C is 75 mg/d for females and 90 mg/d for males and is set at those
amounts to provide antioxidant protection. Because of the oxidative stress that smokers
experience, the RDA for vitamin C for smokers is increased by 35 mg/d. The suspected main
function of vitamin E is to prevent lipid peroxidation. The RDA for α-tocopherol for males and
females is 15 mg/d. Selenium is also described as an antioxidant, and the RDA for males and
females is 55 μg/d. The DRIs address carotenoids, but because the functions of carotenoids,
other than preventing vitamin A deficiency, have not been identified, no DRI has been
established for any of the carotenoids except retinol (Food and Nutrition Board Institute of
Medicine, 2000).
5

A definition for dietary antioxidant is provided as: “a substance in foods that significantly
decreases the adverse effects of reactive species, such as reactive oxygen and nitrogen species,
on normal physiological function in humans” (Food and Nutrition Board Institute of Medicine,
2000). Vitamins C, E, and selenium meet this definition. β-carotene and the other carotenoids,
however, do not (Food and Nutrition Board Institute of Medicine, 2000). DRI values for non-
nutrients, such as polyphenols, have not currently been established due to a lack of scientific data
(Food and Nutrition Board Institute of Medicine, 1998).
Dietary Guidelines for Americans 2005
The Dietary Guidelines for Americans 2005 were developed to promote adequate intake
of nutrients to support growth and health. They also emphasize the desirability of consuming
those nutrients in adequate amounts from food sources, not supplements. This is because of the
additional compounds present in food such as carotenoids, flavonoids, isoflavones, and protease
inhibitors, which are not present in nutrient-specific supplements. The compounds found in
whole foods, and not always in supplements, may provide the benefit of preventing chronic
disease (U.S. Department of Health and Human Services and U.S. Department of Agriculture,
2005).
The dietary guidelines encourage consuming a variety of fruits and vegetables within
estimated daily calorie needs. Vegetable intake should be from all 5 vegetable subgroups,
including dark green kinds, orange types, legumes, starchy varieties, and other vegetables. The
consumption of a variety of vegetables ensures adequate intake of all of the nutrients provided in
the various groups. Whole grains are also encouraged because of the increased fiber compared to
refined grains; however, the bran fraction of whole grains such as wheat, oats, barley and flax
also provides a rich source of non-nutrient compounds. Phenolic compounds are only mentioned
6

in reference to their removal during the refining of grains (U.S. Department of Health and
Human Services and U.S. Department of Agriculture, 2005).
The dietary guidelines state that the dietary approaches to stop hypertension (DASH) diet
and USDA Food Guide are both good examples of eating patterns to adopt to follow the dietary
guidelines. They promote the intake of green leafy vegetables, orange vegetables, and fruit at
higher levels than current consumption patterns in the US. These guides also recommend a
lower intake of refined sugars and refined grain products than current consumption. The DASH
Diet Plan specifies the nutrients provided in each food group, however, it does not specify the
non-nutrient compounds provided in the food groups. The USDA Food Guide provided in the
dietary guidelines does not explain the benefits of choosing foods from the different food groups.
Both food plans provide recommendations based on various calorie levels to provide
recommendations for the majority of the population. Neither plan describes the non-nutrient
compounds present in food that can provide multiple additional benefits besides promoting
growth and health while preventing nutrient deficiencies (U.S. Department of Health and Human
Services and U.S. Department of Agriculture, 2005).
The DASH Diet was developed to help individuals decrease blood pressure. The diet
emphasizes controlling sodium intake in order to control blood pressure. The research the plan is
based on shows a decrease in blood pressure by decreasing intake of saturated fat, cholesterol,
and total fat. The research also shows a diet high in fruits, vegetables, and low-fat or fat-free
milk products can positively influence blood pressure(U.S. Department of Health and Human
Services and others 2006). The DASH Diet makes recommendations concerning some specific
nutrients, such as fat, carbohydrate, sodium, potassium, calcium, and magnesium. It also
provides information concerning maintaining a healthy weight, including physical activity into a
7

healthy lifestyle, and if drinking alcohol, doing so in moderation. The DASH Diet does suggest
using cinnamon as a substitution, however this is a strategy suggested to lower the sodium
content of the meal. It is not suggested due to the antioxidant properties of cinnamon (U.S.
Department of Health and Human Services et al., 2006).
The dietary guidelines discuss the fact that several of the vitamins that act as
antioxidants, vitamin A (carotenoids), vitamin C, and vitamin E, are possibly not being
consumed in high enough amounts. This recommendation is based on their ability to prevent
deficiency symptoms rather than other vital functions the vitamins may provide (U.S.
Department of Health and Human Services and U.S. Department of Agriculture, 2005).
In conclusion, the recommendations currently do encourage foods containing
antioxidants. In addition, the current recommendations have been established taking into
account the antioxidant properties that some of the nutrients have. However, recommendations
for the non-nutrient antioxidants have not yet been established. Until further data is gathered
concerning what amounts provide optimal function of the non-nutrient antioxidants,
recommendations cannot be made. If the recommendations are followed concerning fruits and
vegetables, non-nutrient antioxidants will be consumed. However, the consumer should know
that additional sources of antioxidants exist, and more of an effort can be put in place to consume
those foods once the optimal amount for promoting health is determined.
REACTIVE OXYGEN SPECIES
The damage that occurs to cells and cellular components that antioxidants can prevent
occurs due to the process of oxidation. The damage arises from the actions of free radicals,
where free radicals are compounds with an unpaired electron that can exist independently.
Because they contain an unpaired electron, they are highly reactive and have a short half-life.
8

Free radicals can either donate or accept one electron acting as an oxidant or a reductant (Young
and Woodside, 2001).
The most damaging free radicals come from compounds involving oxygen that are called
reactive oxygen species (ROS). ROS and free radicals when reacting with other biomolecules
are capable of starting a chain reaction where additional free radicals may form. In order for this
chain reaction to be stopped, one free radical must react with another free radical or an
antioxidant to eliminate the unpaired electron (Nordberg and Arner, 2001).
Some examples of ROS that are formed in living organisms include superoxide and
hydroxyl radicals. Superoxide is formed from the leakage of electrons from the electron
transport chain, cytochrome p450 oxidase in the liver, and enzymes utilized in the synthesis of
adrenal hormones (Young and Woodside, 2001). According to in vitro experiments, an estimated
1-2% of all electrons traveling in the electron transport chain leak out and form ROS (Frei,
1994). Whenever superoxide is formed, hydrogen peroxide is also formed due to a dismutation
reaction (Young and Woodside, 2001). Superoxide is not terribly active however, because it
cannot cross lipid membranes, and therefore must act within the space in which it was produced
(Nordberg and Arner, 2001). Hydrogen peroxide, however, can cross cell membranes.
Therefore, hydrogen peroxide can cause damage in multiple cell and tissue types (Young and
Woodside, 2001). Another ROS that does not readily react with other biomolecules is nitric
oxide (NO). NO does, however, react with other free radicals resulting in the production of less
reactive molecules. The role NO plays in a cellular system can vary depending on pH,
temperature, and the characteristics of other compounds present (Nordberg and Arner, 2001).
ROS perform both harmful and beneficial functions in living organisms. ROS can
damage organisms by altering DNA, lipids, proteins, and other compounds. ROS can cause
9

cleavage of DNA, cross-link proteins, and oxidize purines. If these alterations are not repaired,
mutations in DNA may result. This DNA damage may be related to cancer development and the
process of aging. Lipids, especially polyunsaturated fatty acids, make excellent targets for ROS
damage because of multiple double bonds. Lipid oxidation can result in the formation of
harmful atherosclerotic plaques. ROS can alter proteins resulting in less active or inactive
enzymes or denatured proteins. Proteins containing sulfur or selenium residues are most
susceptible (Nordberg and Arner, 2001).
A beneficial function in which ROS are involved is intracellular signaling. NO,
hydrogen peroxide, and superoxide all are involved in transcription and gene expression. The
antioxidant response element, for example, is a sequence of genetic code that is transcriptionally
activated in response to the presence of oxidants (Rushmore and others 1991). Other compounds
that use ROS in signaling include cytokines, growth factors, hormones, and neurotransmitters.
ROS are also utilized in defending organisms against infections. ROS are produced by
phagocytic neutrophils (a kind of white blood cell) in high enough amounts to kill invading
bacteria (Nordberg and Arner, 2001).
Antioxidants work against ROS via two methods, hydrogen atom transfer (HAT) and
single electron transfer (SET) methods. HAT methods involve the transfer of a hydrogen atom.
The reactions occur rapidly, but reducing agents such as metals can inaccurately inflate
reactivity. SET methods quantify the ability of antioxidants to transfer one electron reducing the
other compound. Both types of reactions occur simultaneously within one sample, but the
proportion of reactions that occur depends on pH and the structure of the antioxidant (Prior and
others 2005).
10

ANTIOXIDANTS
Antioxidants are protective to living organisms because they can decrease the negative
effects of ROS. Enzymatic antioxidants are intrinsic to an organism and include superoxide
dismutase, superoxide reductase, catalases, peroxiredoxins, glutathione peroxidases, and
glutathione systems (Nordberg and Arner, 2001). Peroxisomes contain over 50 different
enzymes that participate in various cellular functions. Some of the functions of peroxisomes
include lipid biosynthesis, β-oxidation of fatty acids, α-oxidation of fatty acids, catabolism of
amino acids, polyamines, purines, as well as the metabolism of peroxides and other ROS. The
enzymes involved in ROS degradation include catalase, glutathione peroxidase, manganese
superoxide dismutase (MnSOD), copper-zinc superoxide dismutase (CuZnSOD), epoxide
hydrolase, and peroxiredoxin (Schrader and Fahimi, 2004). Chain breaking antioxidants include
lipid phase and aqueous phase antioxidants. Lipid phase antioxidants include tocopherols,
ubiquinol, carotenoids, and flavonoids. Aqueous phase antioxidants include ascorbate, urate, and
glutathione and other thiols. Chain breaking antioxidants act as electron donors. Transition
metal binding protein antioxidants include ferritin, transferrin, and ceruloplasmin. These
compounds act on iron and copper and aid in preventing the formation of the hydroxyl radical
(Young and Woodside, 2001). Metallothionine, another free radical scavenger, is better at
scavenging superoxide radicals compared to other sulfhydryl-containing molecules, such as
cysteine (Hussain and others 1996). Due to the interaction of trace metals such as zinc and
cadmium with flavonoids, metallothionine levels in intestinal cells may be affected (Le Nest and
others 2004).
All aerobic organisms experience oxidative damage. Antioxidants prevent and help fix
that damage. ROS only cause damage when they are formed in excess. Specific amounts are
11

needed for normal physiological function. Maintaining a balance between what is necessary for
survival and what is in excess is difficult to determine (Nordberg and Arner, 2001).
Effect of Antioxidants on Disease
An increased intake of fruits and vegetables may decrease risk for certain diseases such
as cancer and heart disease (Williams, 1995). It is still unknown what specific compounds in
fruits and vegetables are providing the protective effects, and current research is exploring
possible mechanism of risk reduction (Duthie and others 2003). Antioxidants from whole foods
are suspected of providing protective effects, but when given in supplement form, the expected
protective effect is often not seen (Prieme and others 1997). This was demonstrated by the α–
tocopherol, β-carotene cancer prevention (ATBC) trial, which showed no decrease in coronary
heart disease (CHD) morbidity or mortality during treatment with vitamin E or β-carotene. β-
carotene in fact showed a 75% increase in risk of fatal ischemic heart disease in those subjects
who had a previous myocardial infarction (MI). The β-carotene and retinol efficacy (CARET)
trial involved subjects who were cigarette smokers and exposed to asbestos. No beneficial effect
was demonstrated on cardiovascular disease (CVD) mortality, and the mortality risk from lung
cancer increased in those subjects taking β-carotene. The Cambridge heart antioxidant (CHAOS)
study involving vitamin E supplementation in patients with angiographic evidence of CHD,
showed a benefit in CHD morbidity. However, no benefit was demonstrated in terms of CVD
mortality (Young and Woodside, 2001). It is possible that no protection occurs unless the
antioxidants are provided in a food matrix, or that other compounds in whole foods are needed to
observe the protection.
Unlike vitamin E, vitamin C, and β-carotene, polyphenols are non-enzymatic, non-
nutrient antioxidants and have also demonstrated some of the protective effects against certain
12

diseases. Polyphenols have shown several beneficial properties in terms of protecting cellular
function. Polyphenols appear to influence cellular signaling cascades and influence gene
transcription. For example, polyphenols may down-regulate pro-inflammatory enzymes such as
COX 2 and I NOS, influence the activation of mitogen-activated protein kinase, and inhibit
apoptosis occurring due to ROS presence (Soobrattee and others 2005), (Han et al., 2007).
Perhaps because of these effects, polyphenols may also play a role in cancer prevention. Current
consumption may not be adequate to prevent the development of cancer, but increased intakes of
polyphenols may have beneficial effects (Mouria and others 2002), (Fresco and others 2006).
Antioxidants have been implicated as having positive effects on preventing the
development of cardiovascular disease (CVD) (Huang and others 2005), (Arts and Hollman,
2005), (Tsang and others 2005). Juices containing polyphenols can have very positive effects in
vivo. Polyphenol-rich beverages, including red grape juice, tea, and wine have been shown to
decrease LDL oxidation (Serafini and others 2000), decrease LDL concentration, and in some
cases increase HDL concentration (Castilla and others 2006). The consumption of polyphenol-
rich berries has also shown to have beneficial effects on platelet function, HDL cholesterol, and
blood pressure (Erlund and others 2008). Olive oil has demonstrated beneficial effects in lipid
profiles. It has been shown to increase HDL, decrease triglycerides, and decrease oxidative
stress markers (Covas and others 2006). One possible reason for this benefit is the content of
hydroxytyrosol and tyrosol, which are among the antioxidants that give virgin olive oil its
characteristic taste and color (Salvini and others 2006).
Flavonoids have demonstrated beneficial effects on improving blood vessel health and
endothelial cell function (endothelial cells line all blood vessel walls and contribute to relaxation
of the vessels). Flavonoids have also been shown to decrease blood pressure and oxidative
13

14
stress, both improving CVD risk (Perez-Vizcaino and others 2006). A beverage high in
antioxidants, green tea, has demonstrated an inverse relationship between its consumption and
all-cause mortality as well as CVD (Kuriyama and others 2006).
In subjects who were HIV+, a condition where oxidative stress may be increased,
consuming an increase in fruit juice (blackcurrant, apple, red grape, pear, and green tea-apple) or
fruit-vegetable concentrate was shown to increase antioxidant capacity in blood (Arendt and
others 2001). A mixture of apple, mango, and orange juices containing additional blueberries
and boysenberries showed a statistically significant improvement in antioxidant status and
immune function and a reduction in damage to DNA (Bub and others 2003). In rat studies,
fruits, such as blueberries and strawberries, have been found to be beneficial in cognitive
function. Balance and memory have been shown to improve with specific polyphenol-rich foods
(Lau and others 2005). Metabolites of pomegranate have been found to be bioavailable and to
exert antioxidant effects in plasma after absorption (Mertens-Talcott and others 2006).
POLYPHENOLS
Polyphenols exist in multiple colors including yellow, orange, red, and blue, and
contribute to the taste and odor characteristics of foods (Cheynier, 2005). There are a number of
subclasses of polyphenols, indicated in Figure 2.1.
Figure 2.1 Phytochemical classifications including phenolic subgroup classifications (Liu, 2004).
15
15

They are divided into groups based on their chemical structure. Polyphenols are defined as
having hydroxyl groups on two or more aromatic rings. Thousands of compounds have been
identified as fitting this definition. They are divided into different groups based on the number of
phenol rings they contain, and on the method in which these rings are bound (Manach et al.,
2004). These major groups include phenolic acids, flavonoids, stilbenes, coumarins, and tannins
(Liu, 2004).
Phenolic acids consist of two subgroups including derivatives of hyroxybenzoic and
hydroxycinnamic acids. Blueberries, kiwis, plums, cherries, and apples contain the most
hydroxycinnamic acid derivatives. Caffeic acid is the most abundant phenolic acid, comprising
75 to 100% of the hydroxycinnamic acid present in fruits. Ferulic acid is the most common
phenolic acid in grains (Manach et al., 2004).
There are six subclasses of flavonoids, including flavonols, flavones, flavanols,
flavanones, anthocyanidins, and isoflavones. Flavonols are the most common in foods that
humans consume. Some foods high in flavonols include onions, broccoli, and blueberries. The
concentration of flavonols from the fruit on one tree varies from fruit to fruit because the
synthesis of flavonols is stimulated by sunlight. Because of this the leaves and skin of plants (or
peels of fruit) contain the most flavonols. Flavones are only present in two vegetables that
humans consume, parsley and celery. Flavanones are only present in high concentrations in
citrus fruits. Flavanols exist in two forms proanthocyanidins, an example of the structure is
shown in Figure 2.2, and catechins, of which the richest sources are chocolate and green tea.
Proanthocyanidins are common in several fruits, some of which include peaches, berries, and
apples. Anthocyanins are the compounds present in flowers and fruit that give them their color,
ranging from pink, red, or blue to purple (Manach et al., 2004).
16

Figure 2.2 Structures of typical tannins and proanthocyanidins (Meyers and others 2006).
17

Flavonoids consist of a nucleus with two phenolic rings and an oxygenated heterocycle.
More than 4,000 flavonoids have been identified being differentiated based on the oxidation state
of the heterocyclic pyran ring. Flavonols exist as oligomers or polymers, called condensed
tannins or proanthocyanidins because they discharge anthocyanidins when heated in acidic
environments (Cheynier, 2005).
Isoflavones are flavonoids with structures similar to estrogens, classified as
phytoestrogens. They are found mostly in foods containing or made from soybeans. Depending
on the method and amount of processing that the food undergoes, the isoflavone content may be
altered. The environment in which the soybeans are grown can also influence the isoflavone
content. In addition, the Eastern tradition of consuming soy in the form of fermented products
such as miso or tempeh alters the isoflavone content compared to Western traditions of
consuming soy products (Cassidy and others 2000).
Stilbenes are not very prevalent in the human diet. Resveratrol, found in wine, has been
studied the most for its anticarcinogenic effect and for prevention of heart disease. However it is
present in such low concentrations, that at normal intake levels, it is unlikely to have much of a
protective effect (Manach et al., 2004).
Lignans are found in the highest amounts in linseed (flax seed), however traces are also
found in cereals, grains, fruit, certain vegetables, but don’t contribute as significantly as linseed.
Lignans are metabolized to enterodiol and enterolactone by bacteria in the gut (Manach et al.,
2004).
Polyphenols have been identified as superior antioxidants, compared to vitamins C and E
in in vitro studies due to the structure of polyphenols. The structure of polyphenols is ideal for
hydrogen or electron donating, predicting their free-radical scavenging ability. Polyphenols also
18

possess the ability to chelate metals acting as preventative antioxidants by preventing the
formation of metal-catalyzed free radicals (Rice-Evans et al., 1997).
CURRENT CONSUMPTION
Of all the antioxidants currently being consumed, polyphenols are being consumed in the
greatest amounts (Scalbert and Williamson, 2000). Polyphenol intake is estimated to range from
20 mg for individual compounds to about 1000 mg per day for intake of total polyphenolic
compounds. This estimated range is higher than the intake of vitamins C and E (Soobrattee et
al., 2005), (Scalbert and Williamson, 2000). One reason for the wide range of reported
consumption is that, in polyphenol analysis of foods, recovery of polyphenols from foods
depends on the method of extraction. In the Spanish diet, polyphenol intake has been estimated
at 2590 to 3016 mg per person per day when foods were digested with enzymes before the
polyphenols were extracted (Saura-Calixto and others 2007). This method is similar to digestion
in the human gastrointestinal tract, and gives a higher recovery of polyphenols from the food
matrix than simple blending and chemical extraction. Polyphenols are being consumed from
foods such as fruits, vegetables, and various beverages (Scalbert and others 2005a). Data
concerning specific polyphenol intake have not been extensive up to now. As of 1976 it was
estimated that dietary flavonoid intake was approximately 1 g/day. Since then, flavonols have
been researched the most with estimated intakes of 20 to 25 mg/day for specific compounds in
the US (Manach et al., 2004), (Sampson and others 2002). Among men and women in the US,
quercetin makes up the largest percentage of flavonoid intake (Sampson et al., 2002). The most
abundant food sources include onions, tea and apples. Proanthocyanidins are considered to
contribute the most significantly to polyphenol intake among Americans due to the high degree
in which they are present in food (Cheynier, 2005), (Gu and others 2004). The estimated
19

average intake per person per day of proanthocyanidins is 57.7 mg (Gu et al., 2004). Because
some antioxidant compounds are only found in specific foods, an individual’s intake of that
specific compound can significantly increase with the specific food consumption, an example
being the polyphenol caffeic acid in the cinnamic acid group. When coffee is consumed, caffeic
acid consumption increases. Therefore an individual who does not drink coffee would not have
as high of an intake of caffeic acid as an individual who does drink coffee (Clifford, 2000).
Another example is epicatechins in tea, where consumption of tea greatly increases consumption
of epicatechins (Manach et al., 2004).
In addition to specific food choice, human consumption of phytochemicals varies
depending on geographic location due to variability in food production around the world. In
areas where a large amount of citrus fruits are grown, flavanone consumption is increased
because of its high content in citrus fruits. In locations where a large amount of berries are
grown, anthocyanin consumption is increased. Isoflavone consumption is higher among Asian
cultures due to their high consumption of soya products (Manach et al., 2004).
ANTIOXIDANT EVALUATION METHODS
In terms of quantifying antioxidant capacity there is no single standardized method.
Because of this, using certain methods to evaluate some foods may be inappropriate and
comparing results using different methods may be inappropriate. Developing a standardized
method for analysis would be beneficial in terms of marketing products with nutraceutical
benefits in terms of keeping data consistent and reliable (Prior et al., 2005).
Antioxidant assays can be divided into two groups. The first involving hydrogen atom
transfer and the second involving single electron transfer. Examples of hydrogen atom transfer
(HAT) assays include the total radical trapping antioxidant parameter (TRAP) assay, the oxygen
20

radical absorbance capacity (ORAC) assay, and the crocin bleaching assay. The single electron
transfer (SET) assays include the total phenols by Folin-Ciocalteu reagent, the Trolox equivalent
antioxidant capacity (TEAC) assay, the ferric ion reducing antioxidant power (FRAP) assay, the
N,N-demethyl-p-phenylenediamine (DMPD) assay, and the Cu(II) reduction capacity assay
(Huang et al., 2005).
Before the amount of antioxidants present in a food can be evaluated, the polyphenols
must first be extracted. The success of the extraction can depend on a number of factors
including the extraction method, storage, interfering compounds, chemical attributes, and particle
size. Polyphenols can be chemically very simple monomers or highly complicated polymers.
Polyphenols can be attached to other carbohydrate or protein molecules as well as other
compounds present in the plant. The solubility of the polyphenol also can widely vary. There is
no uniform method of polyphenol extraction. Several variables exist which can affect the level
of extracting including the solvent used, the ratio of solvent to the sample, and the time the
sample is left in the extraction solvent. The times that have been used range from 1 minute to 24
hours. The solvents that have been used include methanol, water, acidic methanol, ethyl acetate,
70% acetone, and 50% ethanol (Naczk and Shahidi, 2004). The alcohol based methods (ethanol
and methanol) have resulted in the highest total polyphenol extraction (Bonoli and others 2004a),
(Bonoli and others 2004b). In addition to the method of extraction used, the temperature at
which the extraction is made can alter the degree to which polyphenols are extracted (Kalt and
others 2000).
Two methods that have been used to determine total phenolics (distinct from antioxidant
capacity of these phenolics) without differentiating among specific phenolic compounds are the
Folin-Denis assay and the Folin-Ciocalteau assay. A disadvantage of using these 2 reagents is
21

that they do not take into account reducing substances such as vitamin C which may also be
present in the sample being tested. The vanillin HCl method is used to assess proanthocyanidins
(condensed tannins). Catechin is often used as a standard in this assay and as a result may lead
to the over-estimation of proanthocyanidins. The 4-dimethylamino-cinnamaldehyde (DMCA)
assay has also been used to quantify proanthocyanidins with questionable accuracy (Naczk and
Shahidi, 2004). The Folin-Ciocalteau method utilizes both HAT and SET mechanisms to
eliminate ROS (Prior et al., 2005). The amount of polyphenols present in food can often be seen
by the color of the food, with the more colorful the food, the higher the polyphenol content. It
has been found that colorless polyphenols also substantially contribute to antioxidant capacity.
Therefore color may be one indicator used to evaluate antioxidant capacity, but it should not be
the only indicator used (Kalt, 2005).
The FRAP method was originally developed to measure antioxidant potential in blood
plasma and tissue extracts, but it also provides a reliable and reproducible method for
determining antioxidant capacity of food extracts and dietary antioxidants. The results of
multiple methods of determining antioxidant capacity are comparable, including the FRAP,
TEAC, and DPPH methods. The values are often not exactly the same but correlate well with
one another (Stratil and others 2006), (Pulido and others 2000). In comparing the FRAP and
Folin-reagent method specifically, the assays do not produce the exact same values, but do
demonstrate a highly significant correlation. Although the assays can not be directly compared,
the results can relatively indicate foods that are higher or lower in antioxidants (Agbor and others
2005).
The relationship between the total phenols assay and total antioxidant capacity is not
entirely clear. Some research indicates a linear relationship between the phenolic content and the
22

antioxidant capacity. However other research indicates that the degree of the linear relationship
depends on the food group being examined. Fruits and vegetables may be strongly correlated,
but not all groups follow that same trend (Wu et al., 2004). The possible lack of association may
be due to the lack of an oxygen radical in the total phenols assay (Huang et al., 2005).
In examining specific foods, such as wine and guava fruit extracts, a strong correlation
was found between the total phenolic content and the total antioxidant capacity. The total
antioxidant capacity of the tested wines could be determined from the total phenolic content
expressed as gallic-acid equivalents (GAE). The following equation explains how the total
antioxidant capacity can be derived:
TAA = 0.0064GAE – 0.2508
Total antioxidant activity (TAA) can be derived using the gallic-acid equivalent (GAE) value
obtained from the total phenols using Folin-Ciocalteu assay (Lopez-Velez and others 2003).
In the guava fruit extracts the correlation between the total phenolic content and
antioxidant capacity was positively high, especially between the total phenols and the FRAP. A
high association between total phenols and antioxidant capacity has also been found in other
fruits (Thaipong and others 2006).
PRESENCE OF ANTIOXIDANTS IN FOOD
Foods contain antioxidants such as ascorbic acid, vitamin A, and vitamin E which are
essential nutrients. However, many foods, fruits and vegetables in particular, contain a wide
variety of non-nutrient antioxidants. The antioxidant capacity of certain foods may not be the
sum of all the specific antioxidants in that food, however. This could be due to the different
23

interactions that occur between the nutrients, oxidants, and antioxidants present in the food.
From the available literature with testing foods from several categories, it appears that spices
have the highest antioxidant capacity (Saxena and others 2007).
The amount and type of polyphenols found in food varies greatly from food to food and
within species, an example being that anthocyanins only exist in red grapes and apples. This
variation may be due to the environmental conditions in which the food is grown such as sun
exposure, rainfall, soil type, field or greenhouse environment, biological culture, and fruit yield
per bush or tree. Other factors that may influence polyphenol content include genetics and the
growth or maturation stage of the fruit when tested. In addition, flavanols are the major
polyphenol in apples, and the amount present differs between different kinds and colors of apples
such as dessert and cider varieties. Dessert varieties contain about 1g/kg fresh weight, whereas
cider varieties contain about 5 g/kg (Cheynier, 2005) fresh weight and possibly even as high as
10 g/kg (Manach et al., 2004).
The variability in polyphenol content may be attributed to the role polyphenols play in
repairing damage. Polyphenols contribute to the lignification process helping cells to heal, and
they may possess antimicrobial characteristics. It appears that vegetables grown under
conditions of increased stress have an increased concentration of polyphenols, such as vegetables
grown organically. More research is needed to state this conclusively (Manach et al., 2004). Sun
exposure and the growing environment appear to affect only specific polyphenols in certain
types of food (Kalt, 2005). Exposure to disease may also affect polyphenol content. Plants
synthesize and accumulate antimicrobial compounds called phytoalexins, which are produced as
a result of exposure to infection or stress such as drought or heat. Phytoalexins are considered to
be only one of multiple mechanisms in place to protect plants from disease (Kuc, 1995). In
24

addition, certain types of mold have been shown to increase or decrease the resveratrol content
of grapes depending on the degree of exposure to the mold (Kalt, 2005).
PROCESSING OF POLYPHENOL FOODS
Cooking and storage may also significantly alter polyphenolic content depending on the
storage conditions and the cooking method (Manach et al., 2004). The presence of polyphenols
in processed food products depends on which part of the food was used during processing and
the length of time the processing took. An example includes grape processing, where white
grape juice does not contain all of the polyphenols present in the grape because the skin is not
used in processing. The amount of polyphenols also depends on the amount of time in which
foods are processed. Wine produced using longer maceration times, allows increased extraction
of polyphenols increasing the amount in the final product (Cheynier, 2005).
Polyphenol loss is quite variable during the heating process depending on the method of
heating, the length of heating, and the pH during the heating process. In addition, the specific
type of polyphenols lost during heating is quite variable and in some cases depends on the source
of the polyphenols (Brenes and others 2002), (Takenaka and others 2006). Vegetables fried in
virgin olive oil demonstrate a polyphenolic retention rate of 25% to 70%. Frying in virgin olive
oil provides an increase in polyphenols in the form of tyrosol and chlorogenic acid
(Kalogeropoulos and others 2007). Heating in water may also affect polyphenol content because
polyphenols are water soluble. They can leach out during certain cooking processes. Fruit
ripening can also play a role in the type of polyphenol present in fruit. As fruit ripens the
anthocyanin content increases as indicated by the change in fruit color. Although the
anthocyanin content may change as fruit ripens, anthocyanins only make up one part of total
25

polyphenol content. The change in total polyphenol content during the ripening process varies
between different kinds of fruit (Kalt, 2005).
The storage of fruit can alter polyphenol content depending on the storage conditions and
the length of storage (Kalt, 2005). The storage of berries has been shown to have no effect and
in some cases be beneficial in terms of increasing anthocyanin content during storage at ambient
temperatures (Kalt and others 1999). However, a beneficial effect has not always been found
with storage. Rice stored at 4°C lost more polyphenol compounds compared to rice stored at
37°C (Zhou and others 2004). The temperature at the time of extraction can also influence the
polyphenol retention during storage even when storage conditions remain constant (Kalt et al.,
2000).
When fresh foods are processed and incorporated into new food products, polyphenols
can decrease depending on the processing method used. The simple procedure of peeling fruits
may decrease polyphenolic content due to the large amount of polyphenols found in the skins of
some fruits (Manach et al., 2004). Blueberries exposed to heat processing, such as the baking of
blueberry muffins, decrease in polyphenol content compared to products not exposed to heat
processing (Schmidt and others 2005). Therefore, using high-polyphenol content foods before
exposure to processing, such as raw or unpeeled, would maintain the polyphenol content and
allow the high-polyphenol foods to exert the postulated benefits.
ANTIOXIDANT ACTIVITY IN VIVO
It is difficult to ascertain the exact effect that polyphenols have in the body. This is due
primarily to the lack of research involving bioavailability and polyphenolic action in the body.
In vivo research is difficult to conduct due to the variability of polyphenols in the diet and the
variability in polyphenol bioavailability. Plasma concentrations of polyphenols vary greatly
26

depending on the polyphenol. This could be due to the bioavailability of the intact polyphenol or
the bioavailability of metabolites of the polyphenol (Manach et al., 2004). Polyphenols are
subject to extensive metabolism at multiple points along the digestive tract. The presence of free
polyphenols cannot be detected in blood after the consumption of many foods containing
polyphenols. Pharmacologic doses must be consumed for the free forms to be detected.
Metabolic processes also alter phenolic structure so as to resemble other compounds which
inhibit the use of the metabolites for use as biomarkers (Spencer and others 2007). Polyphenol
absorption also depends on the dose of polyphenols consumed (Han et al., 2007). In addition to
the dose of polyphenol absorbed, methylation of the compound may also influence its
absorption. Methylated flavones have demonstrated increased cellular flux compared to
unmethylated flavones(Wen and Walle, 2006), (Walle, 2004).
Although not all ingested polyphenols are absorbed into general blood flow, the
polyphenols that are absorbed increase the antioxidant capacity (Ninfali et al., 2005). The
original purpose of the FRAP assay was to measure changes in antioxidant activity in the blood.
The exact mechanism by which polyphenols are absorbed is unknown (Cao and others 1998).
The bioavailability of polyphenols varies among the different varieties of polyphenols and
largely depends on the size of the polyphenol. The larger polyphenols such as
proanthocyanidins, tea catechins, and anthocyanins are the least absorbed. The best absorbed
polyphenols include isoflavones and phenolic acids such as caffeic and gallic acids. In the small
intestine, flavonoid glucosides may be absorbed as free aglycones and not as intact glycosides
(Han et al., 2007). It has been demonstrated that the consumption of strawberries, spinach, and
red wine can increase the antioxidant content of urine in elderly women, suggesting antioxidant
absorption (Cao et al., 1998). The consumption of several fruits, including blueberries, plums,
27

cherries, grapes, and strawberries, has been shown to increase the antioxidant capacity of plasma
in healthy human subjects (Prior and others 2007). The consumption of polyphenol-rich berry
juice has demonstrated an increase in antioxidant capacity of plasma (Netzel and others 2002).
The transporters identified as playing a role in flavonoid absorption include sodium-dependent
glucose transporter 1 (SGLT1), monocarboxylate transporter (MCT), and multidrug resistance-
associated proteins 2 and 3 (MRP2, MRP3) (Walle, 2004). It has yet to be determined the role
salivary proteins play in intestinal absorption of flavonoids (Cai and others 2006). Certain
flavonols, specifically quercetin, inhibit the carbohydrate transporter GLUT2, but not other sugar
transporters. The flavonol itself is not absorbed via GLUT2 however (Kwon and others 2007).
Select flavonoids have demonstrated the ability to be absorbed via the stomach in rat
models. It appears that certain polyphenols can resist gastric acidity and remain intact until
reaching the small intestine. Not all polyphenols can be absorbed in the small intestine; some
must be absorbed in the large intestine (Manach et al., 2004). The microflora present in the gut
metabolize the polyphenols into a wide range of low molecular weight phenolic acids. The
benefits of polyphenols can be observed before the compounds are even absorbed, through
actions in the lumen of the large intestine (Han et al., 2007). The foods in which the polyphenols
are consumed may also influence the bioaccessibility of polyphenols depending on the
composition of the food, such as fiber or protein content (Manach et al., 2004). Polyphenol
absorption is not affected by the consumption of cocoa with added milk protein (Keogh and
others 2007) or black tea with added milk (Reddy and others 2005), (Hollman and others 2001),
(Richelle and others 2001). Protein may, however, affect the antioxidant efficacy of flavonoids
found in tea when β-casein is added (Arts and others 2002). In addition to the other food
consumed with polyphenols, polyphenols may interact with other polyphenols affecting
28

absorption. In a rat model looking at 3 specific polyphenols, genistein, hesperetin, and ferulic
acid, genistein and hesperetin were less available peripherally compared to ferulic acid. This
could be due to a high intestinal and biliary secretion of their conjugates. This model also
indicates an increased absorption when intestinal secretion of conjugates is saturated (Silberberg
and others 2006).
After subjecting food to the digestive conditions experienced in vivo, such as exposure to
digestive enzymes, the bioaccessibility can be measured in vitro. However, this measurement is
not exactly representative of in vivo conditions due to variations in gut flora. Proanthocyanidins
or condensed tannins demonstrate low bioaccessibility in the small intestine. Complete
bioaccessibility of polyphenols in the small intestine is estimated at 48%, while in the large
intestine it is estimated at 42% (Saura-Calixto et al., 2007).
Biologic absorption of polyphenols also depends on the polyphenolic structure.
Differences between individual person’s absorption have been found. The majority of ingested
polyphenols are not detected in urine. This could be due to a lack of absorption across the
intestinal wall, absorption and excretion via bile, or metabolism by gut flora or other tissues.
Plasma concentrations of flavonoids rarely go above 1 M after consuming 10 to 100 mg of a
single compound. The length of time to reach optimal concentration in plasma is variable
between different polyphenols. Whenever the optimal concentration is reached, it is not
maintained, meaning in order for optimal concentration to be maintained, consumption would
also have to be maintained (Scalbert and Williamson, 2000).
POTENTIAL HEALTH BENEFITS OF PROANTHOCYANIDINS (CONDENSED TANNINS)
Proanthocyanidins have demonstrated many positive effects in several disease processes,
including infection, cardiovascular disease (CVD), diabetes, and others. The proanthocyanidins
29

present in cranberries have demonstrated the ability to prevent the adhesion of bacteria to the
urinary tract cell walls, promoting urinary tract health (Prior and Gu, 2005), (Leahy and others
2002). The same anti-adhesion characteristic of bacteria in the urinary tract has been associated
with preventing H. pylori from attaching to the stomach and preventing peptic ulcers (Leahy et
al., 2002), (Prior and Gu, 2005). In addition to the prevention of bacteria adhesion,
proanthocyanidins have demonstrated antibacterial properties. Cinnamon stick contains two
compounds, cinnamaldehydes and proanthocyanidins, which have demonstrated in vitro
antibacterial properties. The antibacterial properties have implications in the use of cinnamon
sticks as a natural food preservative (Shan and others 2007).
Proanthocyanidins can positively influence the oxidative state in plasma. Following a
meal containing 300 mg grape seed proanthocyanidin extract (GSPE), the antioxidant capacity of
plasma increased by decreasing the presence of oxidants and increasing antioxidant levels which
increased LDL resistance to oxidation (Prior and Gu, 2005), (Yamakoshi and others 1999).
Consuming 110 mg of proanthocyanidins from grapes for 30 days appeared to decrease DNA
oxidation and increase vitamin E levels in red blood cell membranes. The consumption of
flavanols from a cocoa beverage appeared to decrease F-2-isoprostanes, a marker of lipid
peroxidation (Prior and Gu, 2005). Cocoa can decrease inflammatory cytokines while at the
same time increase anti-inflammatory cytokines (Kris-Etherton and Keen, 2002), and along with
cranberries in in vitro studies has demonstrated the ability to decrease LDL oxidation (Kris-
Etherton and Keen, 2002), (Leahy et al., 2002), (Porter and others 2001).
In studies investigating the specific effect of cocoa flavonoids on CVD, plasma
concentrations of proanthocyanidins increase, endothelial function and vascular function have
been shown to improve, as well as platelet adhesion has been shown to decrease (Prior and Gu,
30

2005), (Flammer and others 2007). Proanthocyanidins have demonstrated positive effects in
terms of cataract formation. They have also demonstrated beneficial effects in lipid profiles and
glucose levels in individuals with type 2 diabetes (Prior and Gu, 2005).
GSPE has been shown to be protective against the negative effects that oxidative stress
can have on various tissues. Some of the beneficial effects have demonstrated cytotoxicity
towards various cancers including breast, lung, and gastric adenocarcinoma. Beneficial effects
have also been seen in protection against myocardial infarction in rats. Chronic supplementation
of GSPE also has been used to treat pancreatitis in humans (Bagchi and others 2000).
Research indicates that proanthocyanidin absorption across the intestinal cell wall is best
for dimers and trimers, and limited for polymers greater than 6. In rat models in instances where
only a small percentage of dimers cross to the serosal side of enterocytes, the presence of
monomers increase suggesting cleavage of the dimer during transport (Prior and Gu, 2005).
DOSE DEPENDENT BIOACTIVITIES OF POLYPHENOLS
Polyphenols have been shown to have a positive effect on plasma LDL and HDL levels,
with the effect varying depending on the amount of polyphenols consumed. Slightly
hypercholesterolemic subjects showed a decrease in plasma LDL cholesterol and oxidized LDL,
and an increase in plasma HDL compared to baseline after consuming varying levels of cocoa.
In the low-cocoa group 13 g was consumed, in the middle group 19.5 g of cocoa was consumed,
and in the high cocoa group 26 g was consumed during a 4 week period. The polyphenols
present in cocoa thought to provide these beneficial effects include catechin, epicatechin,
procyanidin B2, procyanidin C1, and cinnamtannin A2 (Baba and others 2007).
Polyphenols present in red wine have demonstrated a dose-dependent response in terms
of angiogenesis triggered by ischemia. A high dose (20 mg/kg/day) of polyphenols present in
31

red wine showed anti-angiogenic properties in a rat model, while a low dose (.2 mg/kg/day)
promoted angiogenesis (Baron-Menguy and others 2007). Consuming juices containing
different amounts of polyphenols, such as apple versus pomegranate juice, have demonstrated
differences in antioxidant function and reducing damage from oxidative stress. The pomegranate
juice, higher in polyphenols, demonstrated a superior ability to provide protective effects
compared to the lower phenol juice, apple juice (Guo and others 2008).
The bioavailability of the flavonoids present in cocoa has been shown to be dose
responsive. As the amount of consumption of epicatechin increased, the plasma concentration of
epicatechin also increased. This also demonstrated a dose response in terms of serum
antioxidant capacity (Wang and others 2000).
POTENTIAL FOR POLYPHENOL TOXICITY
The possible benefits of polyphenols in terms of health have been well documented and
reported. The ingestion of polyphenols may have some negative side effects however.
Polyphenols in tea have demonstrated the ability to precipitate protein, meaning that those
proteins are denatured. Tea polyphenols demonstrated an inhibitory ability of α-amylase,
pepsin, trypsin, and lipase ranging from 32% to 61% for the 4 enzymes. The inhibition of these
enzymes means there may be decreased digestion of protein, carbohydrates, and lipids,
indicating possible anti-nutritional effects (He and others 2006). One specific kind of
polyphenol has been associated with anti-nutritional effects. Tannins, more specifically
condensed tannins or proanthocyanidins have been associated with demonstrating antinutritional
effects (Mennen and others 2005). Proanthocyanidins can exist as simple monomers or highly
polymerized compounds. The effect that proanthocyanidins have in the body depends on the
degree of polymerization due to absorption constraints. It appears that dimers and perhaps
32

monomers are the only proanthocyanidins that can be absorbed. Therefore the occurrence of any
negative effects from large polymers may be limited to the intestinal tract (Beecher, 2004).
The ability of tannins to precipitate protein has been utilized in cultures throughout
history. The process of converting animal hide to leather is called tanning. Because tannins
were utilized in this process, the compounds were called tannins. The exact effect that the
protein binding ability of tannins have in the body remains to be seen (Beecher, 2004).
As with any potential toxicity, the amount of consumption plays a key role in toxicity
occurrence. Polyphenol intake at supplemental levels may cause more harm than good. Also
important is the specific type of polyphenol consumed. Specific flavonoids have demonstrated
the ability to impede thyroid hormone synthesis. The intake of isoflavones at increased intake
levels may affect sexual maturation and male and female fertility (Mennen et al., 2005),
(Scalbert et al., 2005b). Contrary to much of the published beneficial research regarding
polyphenols and CVD, polyphenols may increase homocysteinemia, increasing risk for the
development of CVD (Scalbert et al., 2005b). Polyphenols may also influence medication
bioavailability, affecting the degree to which intended drug function occurs. It is important to
keep in mind the dosing of polyphenol supplements and polyphenol food intake because dietary
polyphenol intake is much less than the level of supplemental polyphenol intake. In addition to
polyphenol intake amounts, it is important to consider the risk that certain populations may have
of consuming increased amounts of polyphenols, such as pregnant women, children, and
individuals with specific conditions (Mennen et al., 2005). The testing of one polyphenol
supplement called Applephenon, produced from polyphenols present in apples and consumed in
Japan, found no adverse effects from consumption at the level of 2000 mg/kg (Shoji and others
2004).
33

Certain metals including copper and zinc are chelated by polyphenols. The chelation of
those metals may be affected by the types of polyphenols present in the foods in which the
metals are consumed. Red wine has been found to not affect copper and zinc absorption or tissue
levels in rat models (Coudray and others 2000). Due to the possible metal chelation with
polyphenols, in certain populations there could be an increase in risk for developing deficiencies.
In the Western general population, where individuals have adequate iron stores, tea containing
polyphenols has not been shown to be problematic. Only in populations who have marginal iron
status does the consumption of tea and the chelation of polyphenols present in tea cause iron
deficiency (Temme and Van Hoydonck, 2002). Certain population groups are at risk for
developing iron-deficiency anemia due to increased needs. These groups include menstruating
women, pregnant women, growing children, and individuals experiencing massive blood loss. If
these individuals do not consume adequate amounts of iron, and consume foods high in
polyphenols which can chelate the iron, they may not absorb iron in amounts sufficient enough
to prevent iron-deficiency anemia (Charlton and Bothwell, 1983). Contrary to not absorbing
enough iron, individuals with hemochromatosis, a genetic disease where the body absorbs and
stores too much iron, may benefit from the chelation of iron by polyphenols. Polyphenols
chelate iron preventing absorption and decreasing the need for other forms of treatment
(Kaltwasser and others 1998). Iron chelation may also be beneficial in those individuals
developing Alzheimer’s and Parkinson's diseases due to the decreased iron available to the
neuronal cell tissue (Weinreb and others 2004).
Polyphenol toxicity has only been reported involving animals consuming large amounts
of tannin-rich plants. In some animal models, certain polyphenols have demonstrated pro-
34

oxidant effects, but because of the lack of research regarding the toxicity of polyphenols, the
applicability of that research to humans in questionable (Scalbert et al., 2005b).
ACORNS AND POLYPHENOLS
Acorns have been historically consumed all around the world, including North America,
Europe, Asia, Africa, and the Middle-East. In California, half of the diet consumed by Native
Californians consisted of acorns (Bainbridge, 1986). Among the poorer classes of people in Italy
and Spain, acorns contributed up to 25% of calories consumed (Rakic and others 2006). Acorns
have a slightly lower protein content compared to cereal grains. The red and black varieties can
contain rather high levels of lipid, some as high as 34.3% dry weight. This indicates the benefits
acorns may have in terms of providing a calorically dense food option (Ofcarcik and Burns,
1971).
Acorns are edible with certain varieties requiring processing to become palatable, while
other varieties among the genus Quercus are considered sweet. The processing required to make
acorns palatable includes leaching the bitter-tasting tannins from the nut using hot water.
Tannins have been shown to decrease from 9% to .18% after leaching without altering essential
amino acid content. In the past to reduce bitterness, Native Americans sweetened acorns with
iron-rich red earth, wood ashes, and other ingredients (Bainbridge, 1986). Acorns from the
genus Quercus contain 300 µg of hydrolysable tannins per gram. Tanoak (Lithocarpus
densiflorus) acorns have been determined to contain 464 mg condensed tannins per 100 g acorn
pericarp (Meyers et al., 2006).
Acorns have been used in a variety of manners in cooking. Acorn meal has been used in
place of corn meal in baked products. Acorn pieces and acorn meal can be used in soups and
35

stews. Acorns can be used as a replacement of other nuts in recipes. Acorns have also been used
in various beverages, such as coffee drinks (Bainbridge, 1986).
One benefit of consuming acorns can be attributed to the high polyphenol content,
although acorns are also good sources of protein, carbohydrate and fats. The different varieties
of acorns contain differing amounts of polyphenols. The polyphenol content of Q. robur ranges
from 11.76% to 14.93% (Rakic et al., 2006). Total phenols for Lithocarpus densiflorus using the
Folin-reagent method have been measured at 71 mg/g dry weight (Meyers and others 2007).
Using the same method total phenols for two acorn varieties, Q. robur and Q. cerris were
respectively determined to be .223 and .229 mg gallic acid equivalents per mg dry weight extract
(Rakic and others 2007). 32 phenolic compounds have been identified in three different species
of the genus Quercus (Cantos and others 2003).
Acorns are widely consumed by many animals and birds without apparent harm. For
example, Iberian pigs have been identified as large consumers of acorns. They have been
observed eating amounts as high as 7 to 10 kg per day. Iberian pig meat is also considered to be
of superior quality compared to other pig meat. This may be due to the high consumption of
acorns. In testing phenolic content related to Iberian pig consumption, of the 3 varieties tested,
Q. ilex contained the highest amount of polyphenols at greater than 2 g/kg ingested acorn.
Because of the large amount of acorns that Iberian pigs can consume per day, it is estimated that
they can consume between 14 and 20 g of polyphenols per day, solely from acorns. It is this
high amount of polyphenol consumption which is suspected of creating superior meat due to
decreased lipid peroxidation (Cantos et al., 2003). However, certain varieties of acorns that have
been used to feed livestock in large percentages have shown to be poisonous (Bainbridge, 1986).
36

Quercetin, part of flavonol group of phytochemicals, is derived from quercitron bark and
used as a dye. The term quercitron comes from the inner bark of the Bark Oak, Quercus
discolor. The prefix 'querc-' comes from the oak genus, Quercus, which is the kind of tree that
acorns grow on ("quercitrin", 2008).
PHYTOCHEMICAL DATA AVAILABLE
Several databases exist specifying the phytochemical content of certain foods. The
USDA Database for the Proanthocyanidin Content of Selected Foods contains the
proanthocyanidin content of various fruits, vegetables, nuts, spices, and beverages. High-
performance liquid chromatography (HPLC) was used to determine the proanthocyanidins
present in the food samples. The monomer, dimer, and trimer forms are reported individually.
The tetramers, pentamers, and hexamers are reported as one group, as well as the heptamers,
octamers, nonamers, and decamers. Polymers greater than 10 were reported as the last group.
The complexity of reporting the phytochemical contents of foods is demonstrated by the
variation of proanthocyanidins, which is only one class of flavonoids present in food. Table 2.1
contains values for select food items. The following spices contained no detectable
proanthocyanidins: dried basil, chili powder, ground cloves, garlic powder, ground ginger,
yellow mustard seeds, onion powder, dried oregano, paprika, dried parsley, black pepper, poppy
seed, and ground turmeric (Nutrient Data Laboratory and Agriculture, 2004).
Table 2.1 Proanthocyanidin content of various foods Food mg/100 g edible portiona
Nuts Almonds Monomers 7.8 Dimers 9.5 Trimers 8.8 4-6mers 40.0 7-10mers 37.7
37

Polymers 80.3 Pecans Monomers 17.2 Dimers 42.1 Trimers 26.0 4-6mers 101.4 7-10mers 84.2 Polymers 223.0 Walnuts Monomers 6.9 Dimers 5.7 Trimers 7.2 4-6mers 22.1 7-10mers 5.41 Polymers 20.0 Spices Cinnamon, ground Monomers 23.9 Dimers 256.3 Trimers 1252.2 4-6mers 2608.6 7-10mers 1458.3 Polymers 2508.8 Curry powder Monomers 0.0 Dimers 9.5 Trimers 22.9 4-6mers 41.78 7-10mers 0.0 Polymers 0.0 a (Nutrient Data Laboratory and Agriculture, 2004)
Data concerning antioxidant content of a large variety of common foods has already been
published using FRAP analysis. 1113 food samples were analyzed for antioxidant capacity and
ranked according to the resulting values. The 50 foods with the highest antioxidant capacity are
displayed in Table 2.2. Also in Table 2.2 is a conversion of the FRAP values to total phenol
values in mg GAE/g. This was done using previously calculated FRAP values and multiplying
by 1.019 to calculate the total phenolic value. The factor 1.019 was determined from calculating
the correlation between the FRAP and total phenol values in previously analyzed food samples
(Rice-Evans and others 1997). Also calculated is the amount of phenols per calorie. This was
38

calculated using the calorie content per g of food product. This may be a more useful value to
maximize phenol consumption while controlling caloric intake so as to maintain weight
(Halvorsen and others 2006).
Table 2.2 Antioxidant capacity of 50 foods highest in antioxidants – The ferric antioxidant reducing power (FRAP) values, total phenol (TP) values, and mg of phenols per calorie for the 50 foods highest in antioxidant capacity determined from 1113 foods sampled. Food FRAP mmol/ 100 ga TP mg GAE/g mg phenol/kcalb
Cloves, ground 125.6 127.9 38.4 Oregano leaf, dried 40.3 41.1 13.7 Ginger, ground 21.6 22.0 6.6 Cinnamon, ground 17.7 18.0 6.9 Turmeric powder 15.7 16.0 16.0 Walnuts 13.1 13.4 2.1 Basil leaf, dried 12.3 12.5 8.8 Mustard seed, yellow, ground 10.5 10.7 2.4 Curry powder 10.0 10.2 2.9 Pecans 9.7 9.9 1.4 Chocolate, baking, unsweetened 8.9 9.1 1.8 Paprika 8.6 8.8 3.1 Chili powder 8.4 8.5 2.8 Parsley, dried 7.4 7.6 2.3 Molasses, dark 4.9 5.0 1.2 Pepper, black 4.4 4.5 1.9 Artichokes, prepared 4.2 4.3 8.6 Chocolate, dark 4.2 4.3 0.2 Blackberries 4.0 4.1 9.4 Whole-grain cereal 3.4 3.5 1.0 Cranberries 3.3 3.4 7.2 Pudding mix, chocolate, cook-and-serve 3.0 3.1 0.3 Bran cereal 2.9 3.0 1.1 Power bar, chocolate flavor 2.8 2.8 0.8 Chocolates, sugar-free 2.6 2.6 0.5 Raspberries 2.3 2.4 4.6 Strawberries 2.2 2.2 6.9 Blueberries 2.2 2.2 5.1 Cabbage, red, cooked 2.2 2.2 7.5 Wine, red 2.1 2.2 2.6 Barley malt syrup, organic 2.1 2.2 2.1 Prunes 2.0 2.1 0.6 Cherries, sour 1.8 1.9 1.2 Peppers, red, cooked 1.6 1.7 1.3 Chocolate cookies w/ vanilla crème filling 1.6 1.6 0.4 Cocoa Krispies cereal 1.6 1.6 0.4
39

Chocolate chip cookies 1.5 1.6 0.2 Mustard, yellow, prepared 1.5 1.5 14.3 Milk-chocolate candy 1.5 1.5 0.3 Pistachios 1.4 1.5 0.3 Plums 1.3 1.4 3.0 Kiwi Fruit 1.3 1.4 2.2 Corn Flakes 1.3 1.3 0.4 Coffee 1.3 1.3 150.8 Spinach, frozen 1.2 1.3 4.1 Flaxseed, ground or milled 1.1 1.2 0.2 Rice and corn cereals 1.1 1.1 0.4 Toasty peanut crackers 1.1 1.1 0.1 Cupcakes, chocolate 1.1 1.1 0.4 Grape juice 1.0 1.0 0.6
a (Halvorsen et al., 2006) b (U.S. Department of Agriculture, 2007)
The total phenolic content and total antioxidant capacity for several kinds of nuts has also
been gathered, shown in Table 2.3. The total antioxidant capacity in addition to being expressed
as µmol of TE/g, has been expressed as TAC per serving (Wu et al., 2004).
Table 2.3 Antioxidant capacity for select nuts – Total antioxidant capacity (TAC), total phenols (TP), and TAC per serving for select nuts.
Nut serving size
(g)a TAC μmol of
TEb/gc phenol mg/gb mg phenol/serving
Almonds 28.4 44.5 4.1 1262 Brazil nuts 28.4 14.2 3.1 403 Cashews 28.4 20.0 0.2 567 Hazelnuts 28.4 96.5 8.4 2736 Macadamia nuts 28.4 17.0 1.6 482 Peanuts 28.4 31.7 4.0 899 Pecans 28.4 179.4 20.1 5086 Pine nuts 28.4 7.2 0.7 204 Pistachios 28.4 79.8 16.6 2262 Walnuts 28.4 135.4 15.6 3839
a (U.S. Department of Agriculture, 2007) b TE = Trolox Equivalents c (Wu et al., 2004)
40

In addition to water, protein, fat, carbohydrate, vitamins, and minerals, the
USDA National Nutrient Database for Standard Reference also contains information concerning
non-nutrients. The phytochemicals included in the database are β-carotene, α-carotene, β-
cryptoxanthin, lycopene, lutein, and zeaxanthin. Data for these phytochemicals although
available is not presented here.
GENERAL HYPOTHESIS
Typical U.S. diets that rely on relatively refined foods may provide less than 500-1000
mg of polyphenolic phytochemicals per day.
Specific Hypothesis
The phenolic content of a diet can be increased more than two-fold through the use of
acorns and leached acorn products.
41

BIBLIOGRAPHY "quercitrin". 2008. Oxford English Dictionary. Oxford University Press.
Agbor GA, Oben JE, Ngogang JY, Xinxing C & Vinson JA. 2005. Antioxidant capacity of some herbs/spices from cameroon: a comparative study of two methods. J Agric Food Chem 53(17):6819-6824.
Ames BN, Shigenaga MK & Hagen TM. 1993. Oxidants, antioxidants, and the degenerative diseases of aging. Proceedings of the National Academy of Sciences of the United States of America 90(17):7915-7922.
Arendt BM, Boetzer AM, Lemoch H, Winkler P, Rockstroh JK, Berthold HK, Spengler U & Goerlich R. 2001. Plasma antioxidant capacity of HIV-seropositive and healthy subjects during long-term ingestion of fruit juices or a fruit-vegetable-concentrate containing antioxidant polyphenols. Eur J Clin Nutr 55(9):786-792.
Arts IC & Hollman PC. 2005. Polyphenols and disease risk in epidemiologic studies. Am J Clin Nutr 81(1 Suppl):317S-325S.
Arts MJ, Haenen GR, Wilms LC, Beetstra SA, Heijnen CG, Voss HP & Bast A. 2002. Interactions between flavonoids and proteins: effect on the total antioxidant capacity. J Agric Food Chem 50(5):1184-1187.
Baba S, Natsume M, Yasuda A, Nakamura Y, Tamura T, Osakabe N, Kanegae M & Kondo K. 2007. Plasma LDL and HDL Cholesterol and Oxidized LDL Concentrations Are Altered in Normo- and Hypercholesterolemic Humans after Intake of Different Levels of Cocoa Powder. The Journal of Nutrition 137:1436-1441.
Bagchi D, Bagchi M, Stohs S, Das D, Ray S, Kuszynski C, Joshi S & Pruess H. 2000. Free radicals and grape seed proanthocyanidin extract: importance in human health and disease prevention. Toxicology 148:187-197.
Bainbridge DA. 1986. Use of Acorns for Food in California: Past, Present, Future. Symposium on Multiple-use Management of California's Hardwoods. San Luis Obispo, California.
42

Baron-Menguy C, Bocquet A, Guihot A-L, Chappard D, Amiot M-J, Andriantsitohaina R, Loufrani L & Henrion D. 2007. Effects of red wine polyphenols on postischemic neovascularization model in rats: low doses are proangiogenic, high doses anti-angiogenic. The FASEB Journal 21:3511-3521.
Beckman KB & Ames BN. 1998. The Free Radical Theory of Aging Matures. Physiological Reviews 78(2):547-581.
Beecher G. 2004. Proanthocyanidins: Biological Activities Associated with Human Health. Pharmaceutical Biology 42:2-20.
Bonoli M, Marconi E & Caboni MF. 2004a. Free and bound phenolic compounds in barley (Hordeum vulgare L.) flours. evaluation of the extraction capability of different solvent mixtures and pressurized liquid methods by micellar electrokinetic chromatography and spectrophotometry. Journal of chromatography 1057(1-2):1-12.
Bonoli M, Verardo V, Marconi E & Caboni MF. 2004b. Antioxidant phenols in barley (Hordeum vulgare L.) flour: comparative spectrophotometric study among extraction methods of free and bound phenolic compounds. J Agric Food Chem 52(16):5195-5200.
Bors W & Michel C. 2002. Chemistry of the Antioxidant Effect of polyphenols. Annals of the New York Academy of Sciences 957:57-69.
Brenes M, Garcia A, Dobarganes MC, Velasco J & Romero C. 2002. Influence of Thermal Treatments Simulating Cooking Processes on the Polyphenol Content in Virgin Olive Oil. J. Agric. Food Chem. 50(21):5962-5967.
Bub A, Watzl B, Blockhaus M, Briviba K, Liegibel U, Muller H, Pool-Zobel BL & Rechkemmer G. 2003. Fruit juice consumption modulates antioxidative status, immune status and DNA damage. J Nutr Biochem 14(2):90-98.
Cai K, Hagerman AE, Minto RE & Bennick A. 2006. Decreased polyphenol transport across cultured intestinal cells by a salivary proline-rich protein. Biochemical pharmacology 71(11):1570-1580.
Cantos E, Espin JC, Lopez-Bote C, de la Hoz L, Ordonez JA & Tomas-Barberan FA. 2003. Phenolic compounds and fatty acids from acorns (Quercus spp.), the main dietary constituent of free-ranged Iberian pigs. J Agric Food Chem 51(21):6248-6255.
43

Cao G, Russell RM, Lischner N & Prior RL. 1998. Serum antioxidant capacity is increased by consumption of strawberries, spinach, red wine or vitamin C in elderly women. J Nutr 128(12):2383-2390.
Cassidy A, Hanley B & Lamuela-Raventos RM. 2000. Isoflavones, lignans and stilbenes - origins, metabolism and potential importance to human health. Journal of the Science of Food and Agriculture 80(7):1044-1062.
Castilla P, Echarri R, Davalos A, Cerrato F, Ortega H, Teruel JL, Lucas MF, Gomez-Coronado D, Ortuno J & Lasuncion MA. 2006. Concentrated red grape juice exerts antioxidant, hypolipidemic, and antiinflammatory effects in both hemodialysis patients and healthy subjects. Am J Clin Nutr 84(1):252-262.
Charlton R & Bothwell T. 1983. Iron Absorption. Annual Review of Medicine 34:55-68.
Cheynier V. 2005. Polyphenols in foods are more complex than often thought. Am J Clin Nutr 81(1):223S-229.
Clifford MN. 2000. Chlorogenic acids and other cinnamates - nature, occurrence, dietary burden, absorption and metabolism. Journal of the Science of Food and Agriculture 80(7):1033-1043.
Cordain L. 2002. The Nutritional Characteristics of a Contemporary Diet Based Upon Paleolithic Food Groups. Journal of the American Nutraceutical Association 5(3):15-24.
Coudray C, Tressol J, Feillet-Coudray C, Bellanger J, Pepin D & Mazur A. 2000. Long-Term Consumption of Red Wine Does Not Modify Intestinal Absorption or Status of Zinc and Copper in Rats1. Journal of Nutrition 130:1309-1313.
Covas MI, Nyyssonen K, Poulsen HE, Kaikkonen J, Zunft HJ, Kiesewetter H, Gaddi A, de la Torre R, Mursu J, Baumler H, Nascetti S, Salonen JT, Fito M, Virtanen J, Marrugat J & Group ES. 2006. The effect of polyphenols in olive oil on heart disease risk factors: a randomized trial. Ann Intern Med 145(5):333-341.
Devangelio E, Santilli F, Formoso G, Ferroni P, Bucciarelli L, Michetti N, Clissa C, Ciabattoni G, Consoli A & Davi G. 2007. Soluble RAGE in type 2 diabetes: association with oxidative stress. Free Radic Biol Med 43(4):511-518.
44

Duthie GG, Gardner PT & Kyle JA. 2003. Plant polyphenols: are they the new magic bullet? Proc Nutr Soc 62(3):599-603.
Erdeve SS, Dallar Y, Yilmaz FM & Topkaya C. 2007. Increased Oxidative Stress in Obese Children. Journal of Ankara University Faculty of Medicine 60(1):26-30.
Erlund I, Koli R, Alfthan G, Marniemi J, Puukka P, Mustonene P, Mattila P & Jula A. 2008. Favorable effects of berry consumption on platelet function, blood pressure, and HDL cholesterol. Am J Clin Nutr 87:323-331.
Flammer A, Hermann F, Sudano I, Spieker L, Hermann M, Cooper K, Serafini M, Luscher T, Ruschitzka F, Noll G & Corti R. 2007. Dark Chocolate Improves Coronary Vasomotion and Reduces Platelet Reactivity. Circulation 116:2376-2382.
Food and Nutrition Board Institute of Medicine. 1998. Dietary Reference Intakes. Proposed Definition and Plan for Review of Dietary Antioxidants and Related Compounds. Washington DC: Standing Committee on the Scientific Evaluation of Dietary Reference Intakes and Its Panel on Dietary Antioxidants and Related Compounds.
Food and Nutrition Board Institute of Medicine. 2000. Dietary Reference Intakes. Vitamin C, Vitamin E, Selenium, and Carotenoids. Washington DC: Panel on Dietary Antioxidants and Related Compounds, Subcommittees on Upper Reference Levels of Nutrients and Interpretation and Uses of Dietary Reference Intakes, and the Standing Committee on the Scientific Evaluation of Dietary Reference Intakes.
Food and Nutrition Board Institute of Medicine. 2005. Dietary Reference Intakes. Energy, Carbohydrates, Fiber, Fat, Fatty Acids, Cholesterol, Protein, and Amino Acids. Washington DC: Panel on Macronutrients, Panel on the Definition of Dietary Fiber, Subcommittee on Upper Reference Levels of Nutrients, Subcommittee on Interpretation and Uses of Dietary Reference Intakes, and the Standing Committee on teh Scientific Evaluation of Dietary Reference Intakes.
Frei B. 1994. Reactive oxygen species and antioxidant vitamins: mechanisms of action. Am J Med 97(3A):5S-13S; discussion 22S-28S.
Fresco P, Borges F, Diniz C & Marques MP. 2006. New insights on the anticancer properties of dietary polyphenols. Med Res Rev 26(6):747-766.
45

Gu L, Kelm MA, Hammerstone JF, Beecher G, Holden J, Haytowitz D, Gebhardt S & Prior RL. 2004. Concentrations of Proanthocyanidins in Common Foods and Estimations of Normal Consumption. J. Nutr. 134(3):613-617.
Guo C, Wei J, Yang J, Xu J, Pang W & Jiang Y. 2008. Pomegranate juice is potentially better than apple juice in improving antioxidant function in elderly subjects. Nutrition Research 28:72-77.
Halvorsen BL, Carlsen MH, Phillips KM, Bohn SK, Holte K, Jacobs DR, Jr. & Blomhoff R. 2006. Content of redox-active compounds (ie, antioxidants) in foods consumed in the United States. Am J Clin Nutr 84(1):95-135.
Han X, Shen T & Lou H. 2007. Dietary Polyphenols and Their Biological Significance. International Journal of Molecular Science 8:950-988.
Harrison DG, Gongora MC, Guzik TJ & Widder J. 2007. Oxidative stress and hypertension. 1(1):30-44.
He Q, Lv Y & Yao K. 2006. Effects of tea polyphenols on the activities of [alpha]-amylase, pepsin, trypsin and lipase. Food Chemistry 101(3):1178-1182.
Hollman PC, Van Het Hof KH, Tijburg LB & Katan MB. 2001. Addition of milk does not affect the absorption of flavonols from tea in man. Free Radic Res 34(3):297-300.
Huang D, Ou B & Prior RL. 2005. The chemistry behind antioxidant capacity assays. J Agric Food Chem 53(6):1841-1856.
Hussain S, Slikker Jr W & Ali S. 1996. Role of metallothionein and other antioxidants in scavenging superoxide radicals and their possible role in neuroprotection. Neurochem Int 29:145-152.
Ignarro LJ, Balestrieri ML & Napoli C. 2007. Nutrition, physical activity, and cardiovascular disease: an update. Cardiovasc Res 73(2):326-340.
Ji LL. 1999. Antioxidants and Oxidative Stress in Exercise. Proc Soc Exp Biol Med 222(3):283-292.
46

Kalogeropoulos N, Mylona A, Chiou A, Ioannou MS & Andrikopoulos NK. 2007. Retention and distribution of natural antioxidants (a-tocopherol, polyphenols and terpenic acids) after shallow frying of vegetables in virgin olive oil. LWT- FOOD SCIENCE AND TECHNOLOGY 40:1008-1017.
Kalt W. 2005. Effects of Production and Processing Factors on Major Fruit and Vegetable Antioxidants. Journal of Food Science 70(1):R11-R19.
Kalt W, Forney CF, Martin A & Prior RL. 1999. Antioxidant Capacity, Vitamin C, Phenolics, and Anthocyanins after Fresh Storage of Small Fruits. J. Agric. Food Chem. 47(11):4638-4644.
Kalt W, McDonald JE & Donner H. 2000. Anthocyanins, Phenolics, and Antioxidant Capacity of Processed Lowbush Blueberry Products. Journal of Food Science 65(3):390-393.
Kaltwasser JP, Werner E, Schalk K, Hansen C, Gottschalk R & Seidl C. 1998. Clinical trial on the effect of regular tea drinking on iron accumulation in genetic haemochromatosis. GUT 43:699-704.
Keogh JB, McInerney J & Clifton PM. 2007. The effect of milk protein on the bioavailability of cocoa polyphenols. J Food Sci 72(3):S230-233.
Kregel KC & Zhang HJ. 2007. An integrated view of oxidative stress in aging: basic mechanisms, functional effects, and pathological considerations. Am J Physiol Regul Integr Comp Physiol 292(1):R18-36.
Kris-Etherton P & Keen C. 2002. Evidence that the antioxidant flavonoids in tea and cocoa are beneficial for cardiovascular health. Current Opinion in Lipidology 13:41-49.
Kuc J. 1995. Phytoalexins, Stress Metabolism, and Disease Resistance in Plants. Annual Review of Phytopathology 33:275-297.
Kuriyama S, Shimazu T, Ohmori K, Kikuchi N, Nakaya N, Nishino Y, Tsubono Y & Tsuji I. 2006. Green tea consumption and mortality due to cardiovascular disease, cancer, and all causes in Japan: the Ohsaki study. JAMA 296(10):1255-1265.
Kwon O, Eck P, Chen S, Corpe CP, Lee JH, Kruhlak M & Levine M. 2007. Inhibition of the intestinal glucose transporter GLUT2 by flavonoids. Faseb J 21(2):366-377.
47

Lau FC, Shukitt-Hale B & Joseph JA. 2005. The beneficial effects of fruit polyphenols on brain aging. Neurobiol Aging 26 Suppl 1:128-132.
Le Nest G, Caille O, Woudstra M, Roche S, Burlat B, Belle V, Guigliarelli B & Lexa D. 2004. Zn-polyphenol chelation: complexes with quercetin, (+)-catechin, and derivatives: II Electrochemical and EPR studies. The International Inorganic Chemistry Journal 357(7):2027-2037.
Leahy M, Speroni J & Starr M. 2002. Latest Developments in Cranberry Health Research. Pharmaceutical Biology 40:50-54.
Liu RH. 2004. Potential synergy of phytochemicals in cancer prevention: mechanism of action. J Nutr 134(12 Suppl):3479S-3485S.
Lopez-Velez M, Martinez-Martinez F & Del Valle-Ribes C. 2003. The Study of Phenolic Compounds as Natural Antioxidants in Wine. Critical Reviews in Food Science and Nutrition 43(3):233-244.
Manach C, Scalbert A, Morand C, Remesy C & Jimenez L. 2004. Polyphenols: food sources and bioavailability. Am J Clin Nutr 79(5):727-747.
Mennen LI, Walker R, Bennetau-Pelissero C & Scalbert A. 2005. Risks and safety of polyphenol consumption. Am J Clin Nutr 81(1 Suppl):326S-329S.
Mertens-Talcott SU, Jilma-Stohlawetz P, Rios J, Hingorani L & Derendorf H. 2006. Absorption, metabolism, and antioxidant effects of pomegranate (Punica granatum l.) polyphenols after ingestion of a standardized extract in healthy human volunteers. J Agric Food Chem 54(23):8956-8961.
Meyers KJ, Swiecki TJ & Mitchell AE. 2006. Understanding the native Californian diet: Identification of condensed and hydrolyzable tannins in tanoak acorns (Lithocarpus densiflorus). J Agric Food Chem 54(20):7686-7691.
Meyers KJ, Swiecki TJ & Mitchell AE. 2007. An exploratory study of the nutritional composition of Tanoak (Lithocarpus densiflorus) acorns after potassium phosphonate treatment. J Agric Food Chem 55(15):6186-6190.
48

Mouria M, Gukovskaya AS, Jung Y, Buechler P, Hines OJ, Reber HA & Pandol SJ. 2002. Food-derived polyphenols inhibit pancreatic cancer growth through mitochondrial cytochrome C release and apoptosis. Int J Cancer 98(5):761-769.
Naczk M & Shahidi F. 2004. Extraction and analysis of phenolics in food. Journal of Chromatography A 1054(1-2):95-111.
Netzel M, Strass G, Kaul C, Bitsch I, Dietrich H & Bitsch R. 2002. In vivo antioxidative capacity of a composite berry juice. Food Research International 35(2-3):213-216.
Ninfali P, Mea G, Giorgini S, Rocchi M & Bacchiocca M. 2005. Antioxidant capacity of vegetables, spices and dressings relevant to nutrition. Br J Nutr 93(2):257-266.
Nordberg J & Arner ES. 2001. Reactive oxygen species, antioxidants, and the mammalian thioredoxin system. Free Radic Biol Med 31(11):1287-1312.
Nutrient Data Laboratory & Agriculture USDo. 2004. USDA Database for the Proanthocyanidin Content of Selected Foods. In: Agriculture, U. S. D. o., editor). Beltsville.
Ofcarcik RP & Burns EE. 1971. CHEMICAL AND PHYSICAL PROPERTIES OF SELECTED ACORNS. Journal of Food Science 36(4):576-578.
Perez-Vizcaino F, Duarte J & Andriantsitohaina R. 2006. Endothelial function and cardiovascular disease: effects of quercetin and wine polyphenols. Free Radic Res 40(10):1054-1065.
Porter M, Krueger C, Wiebe D, Cunningham D & Reed J. 2001. Cranberry proanthocyanidins associate with low-density lipoprotein and inhibit �� �����Cu2�-induced oxidation. Journal of the Science of Food and Agriculture 81:1306-1313.
Prieme H, Loft S, Nyyssonen K, Salonen JT & Poulsen HE. 1997. No effect of supplementation with vitamin E, ascorbic acid, or coenzyme Q10 on oxidative DNA damage estimated by 8-oxo-7,8-dihydro-2'-deoxyguanosine excretion in smokers. Am J Clin Nutr 65(2):503-507.
Prior RL & Gu L. 2005. Occurrence and biological significance of proanthocyanidins in the American diet. Phytochemistry 66:2264-2280.
49

Prior RL, Gu L, Wu X, Jacob RA, Sotoudeh G, Kader AA & Cook RA. 2007. Plasma Antioxidant Capacity Changes Following a Meal as a Measure of the Ability of a Food to Alter In Vivo Antioxidant Status. J Am Coll Nutr 26(2):170-181.
Prior RL, Wu X & Schaich K. 2005. Standardized Methods for the Determination of Antioxidant Capacity and Phenolics in Foods and Dietary Supplements. J. Agric. Food Chem. 53(10):4290-4302.
Pulido R, Bravo L & Saura-Calixto F. 2000. Antioxidant Activity of Dietary Polyphenols As Determined by a Modified Ferric Reducing/Antioxidant Power Assay. J. Agric. Food Chem. 48(8):3396-3402.
Rakic S, Petrovic S, Kukic J, Jadranin M, Tesevic V, Povrenovic D & Siler-Marinkovic S. 2007. Influence of thermal treatment on phenolic compounds and antioxidant properties of oak acorns from Serbia. Food Chemistry 104(2):830-834.
Rakic S, Povrenovic D, Tesevic V, Simic M & Maletic R. 2006. Oak acorn, polyphenols and antioxidant activity in functional food. Journal of Food Engineering 74(3):416-423.
Reddy VC, Sagar GV, Sreeramulu D & Venu L. 2005. Addition of Milk Does Not Alter the Antioxidant Activity of Black Tea. Annals of Nutrition and Metabolism 49:189-195.
Rice-Evans C, Miller N & Paganga G. 1997. Antioxidant properties of phenolic compounds. Trends in Plant Science 2(4):152-159.
Richelle M, Tavazzi I & Offord E. 2001. Comparison of the antioxidant activity of commonly consumed polyphenolic beverages (coffee, cocoa, and tea) prepared per cup serving. J Agric Food Chem 49(7):3438-3442.
Rushmore TH, Morton MR & Pickett CB. 1991. The Antioxidant Responsive Element. The Journal of Biological Chemistry 266(18):11632-11639.
Salvini S, Sera F, Caruso D, Giovannelli L, Visioli F, Saieva C, Masala G, Ceroti M, Giovacchini V, Pitozzi V, Galli C, Romani A, Mulinacci N, Bortolomeazzi R, Dolara P & Palli D. 2006. Daily consumption of a high-phenol extra-virgin olive oil reduces oxidative DNA damage in postmenopausal women. Br J Nutr 95(4):742-751.
Sampson L, Rimm E, Hollman PC, de Vries JH & Katan MB. 2002. Flavonol and flavone intakes in US health professionals. J Am Diet Assoc 102(10):1414-1420.
50

Saura-Calixto F, Serrano J & Goni I. 2007. Intake and bioaccessibility of total polyphenols in a whole diet. Food Chemistry 101(2):492-501.
Saxena R, Venkaiah K, Anitha P, Venu L & Raghunath M. 2007. Antioxidant activity of commonly consumed plant foods of India: contribution of their phenolic content. Int J Food Sci Nutr 58(4):250-260.
Scalbert A, Johnson IT & Saltmarsh M. 2005a. Polyphenols: antioxidants and beyond. Am J Clin Nutr 81(1 Suppl):215S-217S.
Scalbert A, Manach C, Morand C, Remesy C & Jimenez L. 2005b. Dietary polyphenols and the prevention of diseases. Crit Rev Food Sci Nutr 45(4):287-306.
Scalbert A & Williamson G. 2000. Dietary Intake and Bioavailability of Polyphenols. J. Nutr. 130(8):2073S-2085.
Schmidt BM, Erdman JW & Lila MA. 2005. Effects of Food Processing on Blueberry Antiproliferation and Antioxidant Activity. Journal of Food Science 70(6):s389-s394.
Schrader M & Fahimi HD. 2004. Mammalian peroxisomes and reactive oxygen species. Histochemistry and Cell Biology 122:383-393.
Serafini M, Laranjinha JA, Almeida LM & Maiani G. 2000. Inhibition of human LDL lipid peroxidation by phenol-rich beverages and their impact on plasma total antioxidant capacity in humans. J Nutr Biochem 11(11-12):585-590.
Shan B, Cai Y-Z, Brooks J & Corke H. 2007. Antibacterial Properties and Major Bioactive Components of Cinnamon Stick (Cinnamomum burmannii): Activity against Foodborne Pathogenic Bacteria. J Agric Food Chem 55:5484-5490.
Shoji T, Akazome Y, Kanda T & Ikeda M. 2004. The toxicology and safety of apple polyphenol extract. Food Chem Toxicol 42(6):959-967.
Silberberg M, Morand C, Mathevon T, Besson C, Manach C, Scalbert A & Remesy C. 2006. The bioavailability of polyphenols is highly governed by the capacity of the intestine and of the liver to secrete conjugated metabolites. Eur J Nutr 45(2):88-96.
51

Soobrattee MA, Neergheen VS, Luximon-Ramma A, Aruoma OI & Bahorun T. 2005. Phenolics as potential antioxidant therapeutic agents: mechanism and actions. Mutat Res 579(1-2):200-213.
Spencer JP, Abd El Mohsen MM, Minihane AM & Mathers JC. 2007. Biomarkers of the intake of dietary polyphenols: strengths, limitations and application in nutrition research. Br J Nutr 99(1):12-22.
Stratil P, Klejdus B & Kuban V. 2006. Determination of total content of phenolic compounds and their antioxidant activity in vegetables--evaluation of spectrophotometric methods. J Agric Food Chem 54(3):607-616.
Takenaka M, Nanayama K, Isobe S & Murata M. 2006. Changes in caffeic acid derivatives in sweet potato (Ipomoea batatas L.) during cooking and processing. Biosci Biotechnol Biochem 70(1):172-177.
Temme E & Van Hoydonck P. 2002. Tea consumption and iron status. Eur J Clin Nutr 56(5):379-386.
Thaipong K, Boonprakob U, Crosby K, Cisneros-Zevallos L & Byrne D. 2006. Comparison of ABTS, DPPH, FRAP, and ORAC assays for estimating antioxidant activity from guava fruit extracts. Journal of Food Composition and Analysis 19:669-675.
Tsang C, Higgins S, Duthie GG, Duthie SJ, Howie M, Mullen W, Lean ME & Crozier A. 2005. The influence of moderate red wine consumption on antioxidant status and indices of oxidative stress associated with CHD in healthy volunteers. Br J Nutr 93(2):233-240.
U.S. Department of Agriculture. 2007. USDA National Nutrient Database for Standard Reference. Nutrient Data Laboratory Home Page http://www.ars.usda.gov/ba/bhnrc/ndl
U.S. Department of Health and Human Services, Health NIo & National Heart L, and Blood Institute 2006. Your Guide to Lowering Your Blood Pressure with DASH: DASH Eating Plan Lower Your Blood Pressure. In: Health, N. I. o., editor).
U.S. Department of Health and Human Services and U.S. Department of Agriculture. 2005. Dietary Guidelines for Americans, 2005. 6th Edition ed.: Washington, DC: U.S. Government Printing Office.
52

Valko M, Leibfritz D, Moncol J, Cronin MT, Mazur M & Telser J. 2007. Free radicals and antioxidants in normal physiological functions and human disease. The international journal of biochemistry & cell biology 39(1):44-84.
Walle T. 2004. Absorption and metabolism of flavonoids. Free Radic Biol Med 36(7):829-837.
Wang J, Schramm D, Holt R, Ensunsa J, Fraga C, Schmitz H & Keen C. 2000. A Dose-Response Effect from Chocolate Consumption on Plasma Epicatechin and Oxidative Damage1,2. Journal of Nutrition 130:2115S-2119S.
Weinreb O, Mandel S, Amit T & Youdim M. 2004. Neurological mechanisms of green tea polyphenols in Alzheimer’s and Parkinson’s diseases. The Journal of Nutritional Biochemistry 15(9):506-516.
Wen X & Walle T. 2006. Methylated flavonoids have greatly improved intestinal absorption and metabolic stability. Drug metabolism and disposition: the biological fate of chemicals 34(10):1786-1792.
Williams C. 1995. Healthy eating: clarifying advice about fruit and vegetables. BMJ 310(6992):1453-1455.
Wu X, Beecher G, Holden J, Haytowitz D, Gebhardt S & Prior R. 2004. Lipophilic and Hydrophilic Antioxidant Capacities of Common Foods in the United States. Journal of Agricultural and Food Chemistry 52:4026-4037.
Yamakoshi J, Kataoka S, Koga T & Ariga T. 1999. Proanthocyanidin-rich extract from grape seeds attenuates the development of aortic atherosclerosis in cholesterol-fed rabbits. Atherosclerosis 142:139-149.
Yan X, Murphy B, Hammond G, Vinson J & Neto C. 2002. Antioxidant Activities and Antitumor Screening of Extracts from Cranberry Fruit (Vaccinium macrocarpon). Journal of Agricultural and Food Chemistry 50:5844-5849.
Young IS & Woodside JV. 2001. Antioxidants in health and disease. J Clin Pathol 54(3):176-186.
Zhou Z, Robards K, Helliwell S & Blanchard C. 2004. The distribution of phenolic acids in rice. Food Chemistry 87:401-406.
53

CHAPTER III
DIETARY POLYPHENOLIC INTAKE FROM ACORNS AND ACORN MEAL1, 2
1Kobs LM, Power J, Swanson RS, Hartle DK and Hargrove JL. To be submitted to The Journal
of Food Science.
2An abstract of this work has been presented at the Institute of Food Technologists annual
meeting, New Orleans, LA (June, 2008).
54

ABSTRACT
Antioxidant consumption can increase through strategic food choices. Acorns could
contribute to those strategic choices. We surveyed antioxidant content in a variety of acorns
from the southeastern United States. The phenolic content of Quercus velutina prior to leaching
was 39.4±3.6 mg GAE/g and of Quercus alba was 27.4±.3 mg GAE/g. After 5 leaching stages,
the phenolic content of Q. velutina was 12.3±.8 mg GAE/g and of Q. alba was 10.8±.7 mg
GAE/g. After milling, the phenolic value for Q. velutina was 39.9±4.5 mg GAE/g and for Q.
alba was 6.6±.1 mg GAE/g. A spice cookie made with all-purpose wheat flour contained 2.7±.1
mg GAE/g. When red oak acorn meal was substituted, the cookie contained 9.6±3.3 mg GAE/g,
and when substituted with white oak acorn meal contained 4.2±.4 mg GAE/g. Ingredient
interactions influenced the phenolic content. Acorns and acorn products can be a strategic
method of increasing polyphenolic intake.
55

INTRODUCTION
Historically, human diets were probably higher in fruits, vegetables, and unrefined or
unprocessed grains and root crops than current diet trends. Populations were hunter/gatherers
and consumed diets high in lean protein, omega-3 fatty acids, fiber, and other beneficial
phytochemicals. The health of the hunter/gatherer populations was very different from the health
of populations today. Hunter/gatherers were generally considered fit and healthy with little
incidence of the chronic diseases commonly seen today, such as cardiovascular disease (CVD).
Due to the fact that the human genome has basically not changed in the last 10,000 years, some
other factor must explain the observed change in disease occurrence. The change in diet patterns
could very well explain the change in disease occurrence (O'Keefe and Cordain, 2004). All
Paleolithic diets contained animal-based protein, and may have contained amounts of fat the
same or even higher than amounts of fat consumed today. Because of other diet characteristics
such as low salt, omega-6 to omega-3 fatty acid ratio, and phytochemical intake, historically the
occurrence of CVD would not have been as high as it is today (Cordain, 2002).
Polyphenols have been found to have many beneficial properties in terms of improving
human health. The consumption of polyphenols is different among different geographical
regions and while some consumption trends have changed, some have not. Tea is second to only
water in beverage consumption worldwide, and the high tea consumption in Chinese cultures has
been associated with reduced hypertension and CVD risk (Yang and others 2004).
Another culture with a possible association between a disease process and dietary intake
is the East Indian culture. India practices a wide variety of food habits resulting from religious
56

and cultural traditions. One of their dietary practices is a high consumption of a variety of
spices. The effect that this high consumption of spices has on Indian health is largely unknown;
however, the occurrence of cancer in India is less than the occurrence seen in Western countries.
Their high consumption of spices is hypothesized to influence cancer occurrences (Sinha and
others 2003). Spices have been found to be beneficial in several disease processes including the
inflammatory process, cancer, atherosclerosis, diabetes, and digestive stimulation (Srinivasan,
2005).
In addition to tea and spices, historically acorn nuts have been consumed by humans
virtually everywhere oak trees existed. In several parts of the world, including North America,
Europe, Asia, and Mid-East, acorns were a staple food. Acorns were possibly the most
important to natives of California, where up to half of their caloric intake came from acorns.
Acorns have many positive attributes including ample content of major nutrients, relative ease of
collection, long length of storage, ease of use in food products, and high yields (6,000
pounds/acre). In addition acorns can be grown in hilly land areas, where growth of other crops
may cause soil erosion (Bainbridge, 1986). In addition to all of these positive characteristics,
acorns may also provide health benefits due to their high polyphenol content.
Whereas the polyphenolic content for fruits (Han and others 2007), beverages (Manach
and others 2004), and nuts (Wu and others 2004) has been reported, acorns have not been as
extensively researched. Acorns, once properly processed, can be a delicious addition to a diet,
and if processed beyond simply a nut, can serve many roles in a diet. This research is concerned
with testing the phenolic values of whole acorns, meal made from acorns, and a cookie made
using acorn meal.
57

MATERIALS AND METHODS
Chemicals and Materials
Bovine serum albumin and the Folin-Ciocalteu reagent were purchased from Sigma
Chemical Company, (St. Louis, MO). Acorns were collected, along with appropriate specimens
for identification purposes, on the campus of the University of Georgia in October 2007. After
collection, the trees were identified by Dr. Tim Smalley, a horticulturist at the University of
Georgia. After an initial survey of acorns for polyphenol content and suitability for processing,
two species were chosen for our study. These were Quercus velutina from a black oak tree in the
red oak family and Quercus alba from the white oak family. All other food ingredients used in
the preparation of the cookies were obtained at a major supermarket in Athens, Georgia.
Acorn Leaching and Processing
After the acorns were collected they were dried in a rotary oven for 3.5 hours at 150°F.
The acorns were stored at 4°C after drying. The acorns were shelled using a pecan sheller,
pliers, hammers, and nut pick. The shelled acorns were divided into 500 g proportions and
stored at 4°C until leaching could take place.
Due to the high tannin content of acorns, leaching was necessary to ensure palatability of
the prepared products. The acorns were placed on a magnetic stirring plate with a 10:1 volume
of water to acorns. The water was heated initially to 80°C and the acorns and water were stirred
for 30 minutes. The acorns were then strained and the process was repeated for a total of 4
times. The acorns were then placed in a Cuisanart® food processor and coarsely chopped. Each
batch of acorns was chopped using 24 pulses where each pulse consisted of 1 second of
58
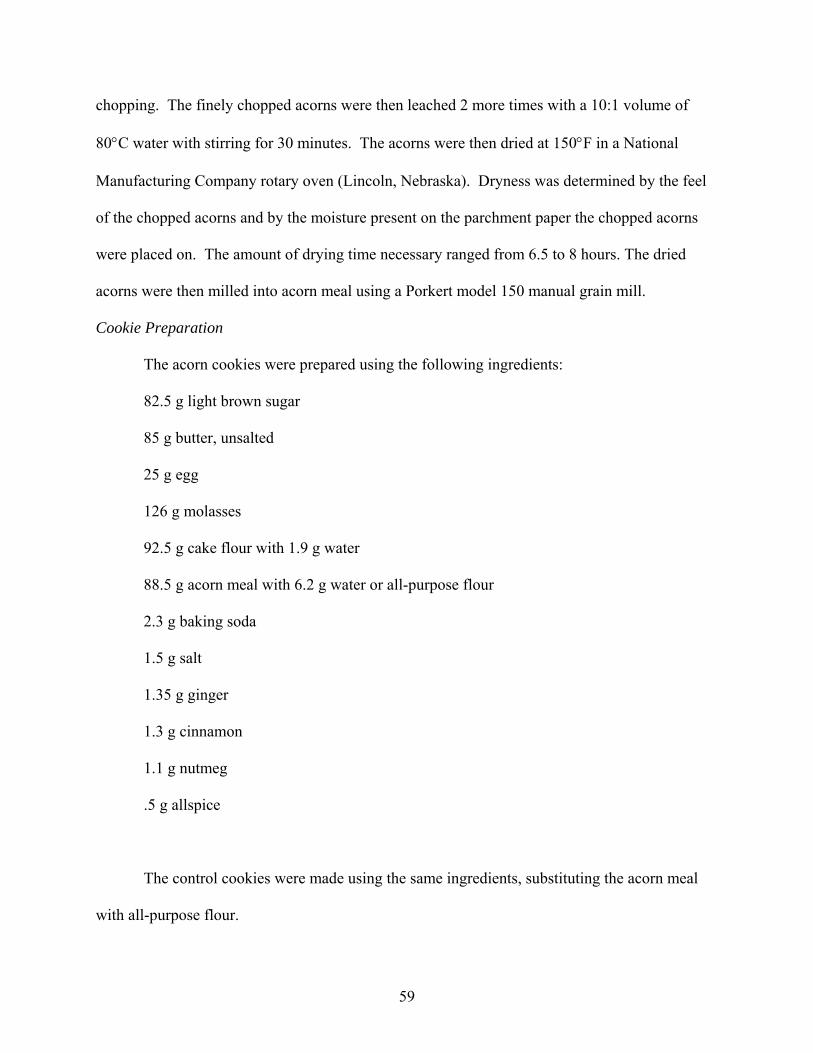
chopping. The finely chopped acorns were then leached 2 more times with a 10:1 volume of
80°C water with stirring for 30 minutes. The acorns were then dried at 150°F in a National
Manufacturing Company rotary oven (Lincoln, Nebraska). Dryness was determined by the feel
of the chopped acorns and by the moisture present on the parchment paper the chopped acorns
were placed on. The amount of drying time necessary ranged from 6.5 to 8 hours. The dried
acorns were then milled into acorn meal using a Porkert model 150 manual grain mill.
Cookie Preparation
The acorn cookies were prepared using the following ingredients:
82.5 g light brown sugar
85 g butter, unsalted
25 g egg
126 g molasses
92.5 g cake flour with 1.9 g water
88.5 g acorn meal with 6.2 g water or all-purpose flour
2.3 g baking soda
1.5 g salt
1.35 g ginger
1.3 g cinnamon
1.1 g nutmeg
.5 g allspice
The control cookies were made using the same ingredients, substituting the acorn meal
with all-purpose flour.
59

The control and acorn cookies were prepared using the following method: The butter and
eggs were held at room temperature for 45 minutes prior to mixing. The dry ingredients were
blended with a Kitchen Aid (K5SS) mixer at speed 1 for 2 minutes, and then held at room temp
until needed. The brown sugar and butter were creamed using the same mixer at speed 2 for 2
minutes. The egg and molasses were incorporated in the sugar/butter mixture at speed 2 for 2
minutes. The previously combined dry ingredients were incorporated over a 3 minute period at
speed 2. The cookies were deposited with a # 60 scoop on a 41.9 x 30.5 cm sheet pan lined with
parchment paper and lightly sprayed with cooking spray in 6 rows 3 across. The cookies were
flattened to .6 cm high using a single back and forth stroke of a rolling pin (AACC, 1999).
Extraction Method
The samples were extracted using 50% ethanol. 1 g of edible portion of the food to be
extracted was combined with 9 mL of 50% ethanol and homogenized using a homogenizer for
60 seconds. The 50% ethanol solution was shaken for 2 hours at 300 RPM. The sample was
centrifuged at 1100 RPM (430 g) for 10 minutes at 10° C. The samples were stored at 0°C until
assayed.
Ingredient Interactions
Ingredient interactions were tested in a total volume of 40 mL of distilled water that
contained 1 g of the sample being tested and 2 g of the ingredient being tested for interaction
(either albumin or sucrose). The 40 mL solution was then shaken for 2 hours at 300 RPM in a
rotary shaker, and centrifuged at 1100 RPM (430 g) for 10 minutes at 10° C . Supernatants were
stored at 0°C until assay.
60

Total Phenols
Total phenolic content was measured using a modified Folin-Ciocalteu reagent method.
The sample absorbance was determined at 765 mµ, and the total phenolic content was expressed
in gallic acid equivalents (GAE) and determined by comparison with a standard curve (Singleton
and Rossi Jr, 1965).
Calorie Content
The caloric content of the different acorn meals and cookies made with acorn meal was
calculated based on the macronutrient profiles of the different samples. The fat and protein
content were measured at Medallion Labs in Minneapolis, MN using the Kjeldahl method for
protein determination and a gravimetric method for fat determination. The moisture and ash
content were determined, and the carbohydrate content was calculated as the difference. The
calorie content was then determined using 4 calories/g of carbohydrates, 4 calories/g of protein,
and 9 calories/g of fat.
Statistical Analysis
For total phenols analysis, simple linear regression analysis was used to determine the
relationship between a standard curve and correlation coefficients (R2). Microsoft Excel
software was used for statistical analysis. The total phenolic means and standard deviations for
the cookie ingredients were analyzed using statistical analysis software (SAS). The Student-
Newman-Keuls Test was also conducted using SAS.
61

RESULTS
Acorn Nuts
The total phenolic content of the black oak (Quercus velutina) and white oak (Quercus
alba) acorns were tested at each of the 5 leaching stages. The total phenolic content decreased at
practically each stage of leaching process. The dry, unleached acorns contained the most phenols
at 39.4 ± 3.6 mg GAE/g for Q. velutina and 27.4 ± .3 mg GAE/g for Q. alba. The acorn after the
fifth stage of leaching contained 12.3 ± .8 mg GAE/g for Q. velutina and 10.8 ± .7 mg GAE/g for
Q. alba. The comparison in decrease of total phenolic content between the 2 species of acorns is
shown in Figure 3.1. The caloric content of Q. velutina is 81.1 calories/serving, where a serving
of acorns is 28.4 g. The total antioxidant capacity expressed as gallic acid equivalents and FRAP
values for various species of acorns from the red oak and white oak trees is presented in Table
3.3.
Acorn Meal
After milling the leached acorns into acorn meal, the phenolic content of the Q velutina
meal was 39.9 ± 4.5 mg GAE/g. The phenolic content of the Q alba meal was 6.6 ± 0.1mg
GAE/g. The caloric content of the acorn meal made from Q velutina is 117.2 calories per
serving, where a serving is 31.3 g.
Acorn Cookie
The phenolic content of the ingredients in the acorn meal cookie expressed as mg GAE/g
and the standard deviations are in Table 3.1.
62

The Student-Newman-Keuls Test evaluating the difference in total phenols resulted in the
cinnamon and allspice being significantly similar to one another, but not to the other ingredients.
The red oak acorn meal was not significantly similar to any of the other ingredients. The
nutmeg, ginger, molasses, cake flour, light brown sugar, and salt were all significantly similar to
each other but not to the other ingredients. Although nutmeg contains more total phenols than
salt, the significant similarity between the nutmeg, ginger, molasses, cake flour, light brown
sugar, and salt may be due to the large range of total phenolic content among all of the
ingredients.
The ingredients in the acorn cookies were assayed separately to see the influence that
each ingredient would have on the total phenolic capacity of the finished cookie. The total
phenolic content present in the cookie for each individual ingredient are listed in Table 3.2. The
control cookie contained 2.7 ±.1 mg GAE/g. The cookie made with red oak acorn meal
contained 9.6 ± 3.3 mg GAE/g, and the cookie made with white oak acorn meal contained 4.2 ±
.4 mg GAE/g.
Effect of Baking
An additive effect is not seen in the total phenolic values of the ingredients compared to
the finished product. This is demonstrated by the fact that the total phenols present in the sum of
the ingredients for 1 serving of cookie dough equals 160 mg GAE, and the acorn meal cookie
analyzed equals 128.6 mg GAE/cookie. Because the individual ingredients do not add up to the
value in the cookie, other interactions are taking place altering the total phenolic content. An
explanation for this occurrence could be the cooking temperature or cooking time. However in
testing the phenolic content of the cookie at various stages of baking, the cookie cooked at the
time and temperature recommended in the recipe (325°F for 13 minutes) resulted in the cookie
63

with the highest phenol content, demonstrated in Figure 3.2. This suggests that the heat and
baking time do not decrease the total phenolic content in the cookie.
Ingredient Interactions
Another possible explanation for why an additive effect is not seen in the total phenolic
content of the cookie is interaction between the ingredients. To test the effect that carbohydrate
and protein have on the phenolic content of the acorn meal, the total phenols assay was run with
acorn meal and sucrose and another sample with acorn meal and albumin, the results are
demonstrated in Figure 3.3. The results at first glance appear to indicate that albumin is high in
polyphenols because of the results of albumin and water. However when taking into account that
the Folin reagent used in the total phenols assay was first developed to detect protein, it is not
surprising that albumin appears to be high in polyphenols. However albumin is not high in
polyphenols, the reagent is reacts with the protein making it appear as though polyphenols are
present in protein. As comparison to see the effect that carbohydrate and protein has on another
high phenolic food, cinnamon was also combined with sucrose and albumin to see the effect, the
results are shown in Figure 3.4. The results indicate that sucrose has little effect on the total
phenolic content of the sample, whereas added albumin decreases the total phenolic content.
Color
In order to ensure that the color of the sample being tested was not influencing the results
of the assay, the assays were run with the samples containing added sucrose and albumin where
the reagent was added and where the reagent was not added. The difference in results between
the samples with the reagent and without the reagent indicates that color is not influencing the
results of the assay (data not presented here).
64

DISCUSSION
The present study shows that acorns contain relatively high levels of polyphenolic
compounds, and that a substantial amount remains after leaching and drying. When substituted
for a portion of the wheat flour in a recipe for spice cookies, products containing meal from
either white or black oak acorns had substantially elevated polyphenol content. The recipe used
was specifically chosen to have high initial content of polyphenolics from blackstrap molasses,
cinnamon, and nutmeg, and acorn meal greatly increased the amount of extractable
polyphenolics in the batter and finished product. Although acorn polyphenolics do interact with
protein in ingredients, approximately 40% of the amount present in starting ingredients is
recovered after baking. Recovery of polyphenolics by extraction with 10 parts of 50% ethanol
was not affected by baking. Preliminary studies have shown that baked goods prepared with
acorn meal are well accepted by a sensory evaluation panel (unpublished data). Furthermore, the
present work substantiates the idea that traditional diets that included leached acorn products
provided a higher intake of polyphenolics than do modern US diets.
Research pertaining to the antioxidant capacity and total phenolic content of foods is
increasing, and numeric values for many food sources have been compiled (Halvorsen and others
2006), (Wu et al., 2004). Research pertaining to the antioxidant contribution that acorns could
contribute in the diet has not been as comprehensive. Although today acorns are not always
associated with human consumption, acorns have played a substantial role in diets historically
(Bainbridge, 1986). The high antioxidant capacity of diets historically may help explain the low
occurrence of many of the chronic diseases so common today (Cordain, 2002).
65

The phenolic content of other varieties of acorns have been determined. Q. suber, Q.
rotundifolia, and were collected and analyzed. The extraction solvent used was methanol. The
phenolic quantification method used was HPLC, and determined 32 different phenolic
compounds present, all being gallic acid derivatives. This analysis was performed in relation to
Iberian pig consumption of acorns and so did not involve any acorn leaching procedure (Cantos
and others 2003).
Tanoak (Lithocarpus densiflorus) acorns were widely consumed by the original
inhabitants of California, and have also been analyzed for polyphenolic content. The extraction
method used included acetone, water, and acetic acid. The total condensed tannin content was
determined to be 464 mg/100 g acorn pericarp where monomers through tetramers were
identified (Meyers and others 2006).
Acorns can also be processed so that the beneficial phenolic content would be more likely
to be consumed without requiring consumption of the intact meat of the nut. Although nuts are a
healthy source for multiple nutrients including mono- and polyunsaturated fats, vitamin E, and
fiber, only about 1 in 10 consumers ate tree nuts on any given day between 1994 and 1996 (Lin
and others 2001). More recent data for 2006 shows that household nut penetration sits at 73%,
where penetration consists of using nuts as snacks or in cooking in the past 30 days of when the
survey was conducted (Mintel, 2007). About 60% of the tree nuts consumed in the United States
are consumed in multi-ingredient foods such as cereals, cakes, and candies (Lin et al., 2001).
Therefore, a product containing acorns would be more likely to be consumed than whole acorn
nuts alone. Although some of the beneficial properties in acorns are lost in the processing of the
nuts, if a product containing acorn meal as an ingredient is more likely to be consumed than the
plain nut, the benefits would still be achieved.
66

In order to make the acorns and acorn meal palatable, the nuts must be leached.
Historical methods of leaching involved placing the acorns in a stream and allowing the current
to wash over the acorns removing the tannins (Harris, 2000). The leaching process removes the
tannins that give the acorns a bitter taste. Tannins are part of the polyphenol classification, so
leaching removes some of the beneficial compounds present in the acorns. However, the
removal of those compounds is necessary to make consumption of the acorns a more enjoyable
experience. Even with the removal of some of the tannins, the acorns remain a good source of
polyphenols.
The acorn meal recipe is high in polyphenols without the acorn meal added because of
the spices used. Replacing the all-purpose flour with the acorn meal adds more polyphenols to
the cookie without drastically changing the taste of the cookie. Therefore if a cookie is going to
be consumed, even with the high calorie content usually associated with cookies, choosing a
cookie with increased polyphenol content would be the more strategic choice to increasing
antioxidant potential in the diet.
We calculated expected values for polyphenolic content of the ingredients used for
comparison with the polyphenol content of the finished cookies. The results showed a
significant decrease in total phenolic value in the finished cookie. The time and temperature of
baking did not reduce the phenolic content of cookies made with acorn meal. This indicates that
heat is not having a negative effect on the total phenolic content.
The other ingredients thought to influence the total phenolic content include protein and
sucrose. This was tested by combining a food with a known high phenolic value such as
cinnamon or acorn meal with albumin or sucrose. The results demonstrate that the acorn meal
combined with albumin showed a decrease in phenolic content indicating that the protein binds
67

with the polyphenols preventing the antioxidant activity of polyphenols. The proteins bind to the
hydroxyl groups present in the polyphenols masking the effect of those hydroxyl groups
(Hagerman and Butler, 1981), (Siebert, 1999). The binding that occurs between polyphenols and
protein is variable between different polyphenols and different proteins. This binding has been
demonstrated in vitro, and binding that occurs in vivo can also influence polyphenol antioxidant
activity. Bioavailability can be affected by binding with other compounds, and the extent of
binding with other compounds is dependent on several factors including pH, temperature, and
the concentrations of proteins and other polyphenols present (Arts and others 2002).
Because nuts are so calorically dense, eating some types of nuts for their phenol content
would substantially increase caloric intake. On a per serving basis, most nuts are relatively
similar in terms of their calorie content. Their phenol content, however, on a per serving basis
varies greatly between different types of nuts. Walnuts, pistachios, acorns, and pecans provide in
some cases more than double the phenolic content per serving, demonstrated in Figure 3.5.
These results indicate that for the typical American diet, which is high in calories,
choosing walnuts, pistachios, acorns, or pecans would be more strategic choices because of the
high phenolic content per serving in relation to the calorie content per serving. In addition to
consuming these nuts whole, incorporating these nuts into other food products would also
contribute to polyphenol intake, such as grinding into a flour or meal. Although through
processing some polyphenols may be lost, using the nuts high in polyphenols would still provide
many of the benefits associated with consuming foods high in antioxidants. Through more
strategic food choices, polyphenol intake can be increased, and acorns can be a large contributor
to that increased polyphenol intake.
68

Table 3.1 Total phenols of ingredients used in cookie made with red oak acorn meal – The ingredients used to make acorn meal cookies and the total phenolic content of each ingredient expressed as a mean value with standard deviation (n=3).
Ingredient Total Phenols mg GAE/g
Red Oak Acorn Meal 60.2 ± 17.2 Allspice 95.2 ± 9.5 Baking Soda 0 ± 0 Butter, unsalted 0 ± 0 Cake Flour 2.45 ± 0.24 Cinnamon 106.6 ± 12.9 Egg 0 ± 0 Ginger 15.7 ± 2.2 Light Brown Sugar 1.35 ± 0.07 Molasses 9.39 ± 0.32 Nutmeg 17.58 ± 0.23 Salt 0 ± 0
Table 3.2 Total phenols in ingredients used to make red oak acorn meal cookie – The ingredients and amounts used to make the acorn meal cookie, as well as the total phenolic content for each ingredient included in the cookie.
Ingredient Amount (g) Total Phenols mg GAE/g ingredient
Light brown sugar 165.0 223 Butter, unsalted 170.0 0 Egg 50.0 0 Molasses 252.0 2366 Cake Flour 188 453 Red Oak Acorn Meal 189.4 7062 Baking soda 4.6 0 Salt 3.0 0 Ginger 2.7 42.4 Cinnamon 2.6 277 Nutmeg 2.2 38.7 Allspice 1.0 95.2
69
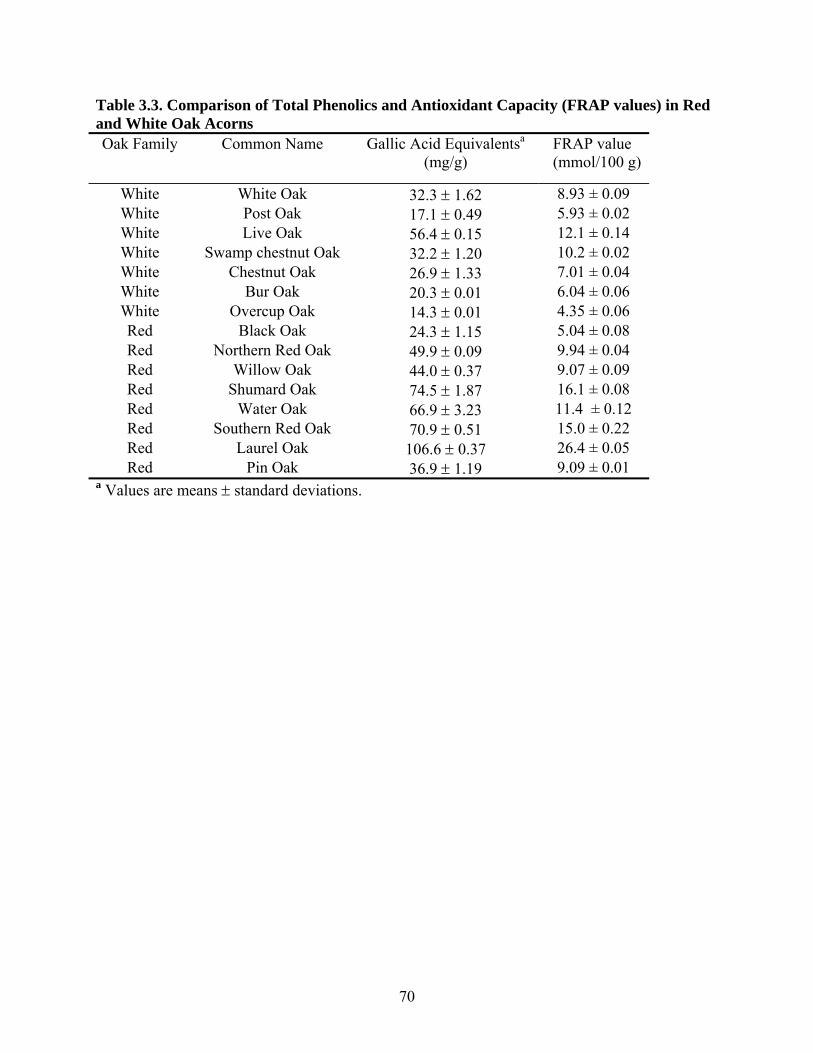
Table 3.3. Comparison of Total Phenolics and Antioxidant Capacity (FRAP values) in Red and White Oak Acorns Oak Family Common Name Gallic Acid Equivalentsa
(mg/g) FRAP value (mmol/100 g)
White White Oak 32.3 ± 1.62 8.93 ± 0.09 White Post Oak 17.1 ± 0.49 5.93 ± 0.02 White Live Oak 56.4 ± 0.15 12.1 ± 0.14 White Swamp chestnut Oak 32.2 ± 1.20 10.2 ± 0.02 White Chestnut Oak 26.9 ± 1.33 7.01 ± 0.04 White Bur Oak 20.3 ± 0.01 6.04 ± 0.06 White Overcup Oak 14.3 ± 0.01 4.35 ± 0.06 Red Black Oak 24.3 ± 1.15 5.04 ± 0.08 Red Northern Red Oak 49.9 ± 0.09 9.94 ± 0.04 Red Willow Oak 44.0 ± 0.37 9.07 ± 0.09 Red Shumard Oak 74.5 ± 1.87 16.1 ± 0.08 Red Water Oak 66.9 ± 3.23 11.4 ± 0.12 Red Southern Red Oak 70.9 ± 0.51 15.0 ± 0.22 Red Laurel Oak 106.6 ± 0.37 26.4 ± 0.05 Red Pin Oak 36.9 ± 1.19 9.09 ± 0.01
a Values are means ± standard deviations.
70

0
10
20
30
40
50
Pre-leaching 1 2 3 4 5Leaching Stage
Quercus velutina
Quercus alba
Figure 3.1 The total phenolic content of Q. velutina and Q. alba at the pre-leaching stage and after the 5 stages of leaching. Data shown are the average of 3 independent samples with standard deviations. (11-30 nuts)
0
2
4
6
8
10
12
14
16
Batter 325, 6.5 225, 13 325, 13Baking Temperature (F), Baking Time (min)
Figure 3.2 The effect of baking time and baking temperature on the phenol content of acorn meal cookies and batter. Baking temperature is expressed in degrees Fahrenheit, and baking time is expressed in minutes. The batter was not exposed to heat for any length of time.
71

-10
0
10
20
30
40
50
60
Acorn Meal &H2O
Albumin &H2O
Sucrose &H2O
Acorn Meal &Albumin
Acorn Meal &Sucrose
Ingredients
Figure 3.3 The total phenol content of acorn meal, albumin, and sucrose with water, and the effect on total phenol content of acorn meal in solution with albumin and sucrose
-50
0
50
100
150
200
250
Cinnamon &H2O
Albumin & H2O Sucrose & H2O Cinnamon &Sucrose
Cinnamon &Albumin
Ingredients
Figure 3.4 The total phenol content of cinnamon, albumin, and sucrose with water, and the effect on total phenol content of cinnamon in solution with albumin and sucrose.
72

0
100
200
300
400
500
600
Pine
Macad
amia
Cashe
wsBraz
il
Peanu
ts
Almon
ds
Hazeln
uts
Acorns
Waln
uts
Pistac
hios
Pecan
s
Type of Nut
kcal/serving
mg phenol/serving
Figure 3.5 A comparison of several different varieties of nuts in calories per serving and polyphenol content per serving. 1 serving of nuts is 28.35 g (Wu et al., 2004).
73

BIBLIOGRAPHY
AACC. 1999. Approved Methods of the American Association of Cereal Chemists Baking Quality of Cookie Flour. Method 10-50D. American Association of Chemists, Inc. St.
Paul, MN.
Arts MJ, Haenen GR, Wilms LC, Beetstra SA, Heijnen CG, Voss HP & Bast A. 2002. Interactions between flavonoids and proteins: effect on the total antioxidant capacity. J Agric Food Chem 50(5):1184-1187.
Bainbridge DA. 1986. Use of Acorns for Food in California: Past, Present, Future. Symposium on Multiple-use Management of California's Hardwoods. San Luis Obispo, California.
Cantos E, Espin JC, Lopez-Bote C, de la Hoz L, Ordonez JA & Tomas-Barberan FA. 2003. Phenolic compounds and fatty acids from acorns (Quercus spp.), the main dietary constituent of free-ranged Iberian pigs. J Agric Food Chem 51(21):6248-6255.
Cordain L. 2002. The Nutritional Characteristics of a Contemporary Diet Based Upon Paleolithic Food Groups. Journal of the American Nutraceutical Association 5(3):15-24.
Hagerman AE & Butler LG. 1981. The Specificity of Proanthocyanidin-Protein Interactions. The Journal of Biological Chemistry 256(9):4494-4497.
Halvorsen BL, Carlsen MH, Phillips KM, Bohn SK, Holte K, Jacobs DR, Jr. & Blomhoff R. 2006. Content of redox-active compounds (ie, antioxidants) in foods consumed in the United States. Am J Clin Nutr 84(1):95-135.
Han X, Shen T & Lou H. 2007. Dietary Polyphenols and Their Biological Significance. International Journal of Molecular Science 8:950-988.
Harris MA. 2000. Acorns. AAOOB Storable Foods.
Lin B-H, Frazao E & Allshouse J. 2001. Food Review. U.S. Consumption Patterns of Tree Nuts. United States Department of Agriculture. p. 54-58.
74

Manach C, Scalbert A, Morand C, Remesy C & Jimenez L. 2004. Polyphenols: food sources and bioavailability. Am J Clin Nutr 79(5):727-747.
Meyers KJ, Swiecki TJ & Mitchell AE. 2006. Understanding the native Californian diet: Identification of condensed and hydrolyzable tannins in tanoak acorns (Lithocarpus densiflorus). J Agric Food Chem 54(20):7686-7691.
Mintel. 2007. Nuts and Dried Fruits - US - July 2007. The Consumer - Purchasing of Nuts; Frequency; and Favorite Brands. Mintel International Group Limited.
O'Keefe J & Cordain L. 2004. Cardiovascular Disease Resulting From a Diet and Lifestyle at Odds With Our Paleolithic Genome: How to Become a 21st-Century Hunter-Gatherer. Mayo Clinic Proceedings 79:101-108.
Siebert KJ. 1999. Effects of Protein-Polyphenol Interactions on Beverage Haze, Stabilization, and Analysis. Journal of Agricultural and Food Chemistry 47(2):353-362.
Singleton VL & Rossi Jr JA. 1965. Colorimetry of Total Phenolics with Phosphomolybdic-Phosphotungstic Acid Reagents. American Journal of Enology and Viticulture 16(3):144-158.
Sinha R, Anderson D, McDonald S & Greenwald P. 2003. Cancer Risk and Diet in India. J Postgrad Med 49:222-228.
Srinivasan K. 2005. Role of Spices Beyond Food Flavoring: Nutraceuticals with Multiple Health Effects. Food Reviews International 21(2):167-188.
Wu X, Beecher G, Holden J, Haytowitz D, Gebhardt S & Prior R. 2004. Lipophilic and Hydrophilic Antioxidant Capacities of Common Foods in the United States. Journal of Agricultural and Food Chemistry 52:4026-4037.
Yang Y-C, Lu F-H, Wu J-S, Wu C-H & Chang C-J. 2004. The Protective Effect of Habitual Tea Consumption on Hypertension. Arch Intern Med 164:1534-1540.
75

CHAPTER IV
IMPROVEMENT TO DASH DIET
Increasing the polyphenolic content of a diet could be easily achieved through the use of
strategic food choices. One strategy that could be used to increase polyphenol consumption
would be to separate high-phenol foods into different categories, and replace the foods already
being consumed in each category with higher containing polyphenol foods. The categories
should include fruits, beverages, grains, vegetables, spices, and nuts and seeds. Foods in these
categories range in their phenolic content, however strategically choosing a fruit, that is higher in
polyphenols would increase overall polyphenol intake. Examples of foods in these categories
and their polyphenol values and energy content are shown in Tables 4.1 through 4.6.
The dietary approaches to stop hypertension (DASH) diet is a guide to healthy eating,
however improvements in terms of antioxidant capacity can still be made in the diet. Simply by
making alternate choices within categories currently provided in the DASH diet, polyphenol
intake could be increased. As an example, the lunch menu for Day 6 of the DASH diet meal
plan is presented in Table 4.7. With a few simple strategic choices of higher antioxidant
containing foods, the antioxidant capacity of that meal can be increased. The changes and
additions to the meal are also presented in Table 4.7.
Foods high in antioxidants have also been associated with improved endothelial cell
function which has been associated with decreasing blood pressure. Therefore, making
adjustments in antioxidant content of the DASH diet may also influence other biological
76

processes associated with increased blood pressure making the already healthy DASH diet even
healthier.
77

Table 4.1 Beverages Food Serving Sizea
(g) kcal/servinga Phenol
mg/gb Phenol mg/kcal
Phenol mg/serving
Wine, red 103 87.0 2.2 2.6 224.1 Juice, Cranberry 180 98.0 1.5 2.7 261.0 Juice, Prune 180 135.0 2.2 2.9 387.0 Juice, Pomegranate & Black Cherry
180 113.0 2.2 3.5 396.0
Juice, Grape 180 128.0 2.3 3.2 409.6 Juice, 100% Prune 240 180.0 2.5 3.3 595.6 Green Tea, Brewed Steeped 240 0.0 3.2 0.0 772.8 Coffee (brewed) 237 2.4 8.2 806.8 1936.3 a (U.S. Department of Agriculture, 2007) b adapted from(Halvorsen and others 2006)
Table 4.2 Fruit Food Serving
Size (g)a kcal/servinga Phenol
mg/gb Phenol mg/kcal
Phenol mg/serving
Banana 118.0 105.0 0.2 0.0 0.0 Apple, red delicious w/ peel
138.0 72.0 0.4 0.0 0.0
Orange 140.0 69.0 0.9 0.0 0.0 Raisins 82.0 245.0 0.9 0.3 0.2 Prunes, Pitted 44.0 104.0 1.5 0.6 0.9 Kiwi fruit 76.0 46.0 1.4 2.2 3.0 Plums 66.0 30.0 1.4 3.0 4.0 Cranberries 95.0 44.0 3.4 7.2 24.3 Blackberries 144.0 62.0 4.1 9.4 38.4 Strawberries 152.0 49.0 4.8 14.8 70.9 Blackberries, Frozen 75.5 48.0 10.1 15.8 159.5 Blueberries 74.0 42.0 11.8 20.8 246.2 Raspberries 62.0 32.0 12.4 24.0 297.9 Cherries, Dark 117.0 74.0 4.8 7.6 561.6 Chokeberries 72.0 42.0 25.6 43.9 1123.5 a (U.S. Department of Agriculture, 2007) b adapted from(Halvorsen et al., 2006)
78

Table 4.3 Grains
a (U.S. Department of Agriculture, 2007)
Food Serving Size (g)a
kcal/servinga Phenol mg/gb
Phenol mg/kcal
Phenol mg/serving
Cereal, Shredded Wheat 49.0 167 0.4 0.1 20.1 Toasty peanut crackers 18.0 210 1.1 0.1 20.2 Grits 37.0 140 0.6 0.2 21.1 Bread, White 26.0 70 0.9 0.3 24.2 Oyster crackers 30.0 140 1.0 0.2 30.4 Wafers 17.0 70 1.9 0.5 33.1 Cereals, rice & corn 29.0 82.5 1.1 0.4 33.1 Wheat Bran 15.0 30 2.3 1.1 34.1 Cereal, Corn Flakes 28.0 101 1.3 0.4 35.8 Pancake Mix, Buckwheat
40.0 140 1.2 0.3 48.8
Cereal, Cocoa Krispies 31.0 118 1.6 0.4 49.2 Wasa rye krisp, hearty 25.0 92 2.0 0.5 49.6 Cereal, Multi-grain Hot 40.0 160 1.3 0.3 52.8 Cereal, Oat flakes 33.0 180 2.1 0.6 68.7 Bread, Whole Grains 43.0 110 1.6 0.6 68.8 Wheat Germ 15.0 55 4.9 1.3 73.7 Blue corn chips 28.0 170 2.7 0.5 76.7 Bread, German Dark Wheat
43.0 100 1.9 0.8 80.8
Cereal, Bran 30.0 81 3.0 1.1 89.4 Lentils 32.0 70 3.0 1.4 97.4 Cereal, whole-grain 30.0 100 3.5 1.0 104.3 Cereal, Oat flakes 50.0 110 2.2 0.6 109.3 Cereal, Oat Bran Hot 40.0 120 3.7 1.2 147.2 Cereal, Grape Nuts 58.0 208 2.8 0.8 160.1
b adapted from(Halvorsen et al., 2006)
79

Table 4.4 Nuts and Seeds
Food Serving Size (g)a
kcal/servinga Phenol mg/gb
Phenol mg/kcal
Phenol mg/Serving
Poppy seeds 2.8 15.0 0.0 0.0 0.1 Brazil nuts 28.4 184.0 0.3 0.1 9.2 Peanuts 28.4 164.0 0.4 0.1 10.1 Macadamia nuts 28.4 201.0 0.6 0.1 17.0 Almonds 28.4 163.0 0.5 0.1 15.5 Pine nuts 28.4 188.0 0.7 0.1 20.7 Cashews 28.4 155.0 0.7 0.1 18.5 Hazelnuts 28.4 176.0 1.0 0.2 27.0 Flaxseed, whole brown 28.4 150.0 0.8 0.2 23.2 Flaxseed, ground or milled 28.4 150.0 1.1 0.2 32.5 Pistachios 28.4 162.0 1.6 0.3 44.1 Pecans 28.4 196.0 9.9 1.4 279.3 Walnuts 28.4 185.0 13.3 2.0 378.4 Pumpkin seeds 28.4 153.0 12.8 2.4 362.9 a (U.S. Department of Agriculture, 2007) b (Wu and others 2004)
Table 4.5 Spices Food Serving
Size (g)a kcal/servinga Phenol
mg/gb Phenol mg/kcal
Phenol mg/serving
Pepper, black 2.1 5.0 4.5 1.9 9.5 Parsley, dried 0.3 1.0 7.6 2.3 2.3 Mustard Seed, yellow, ground 3.3 15.0 10.7 2.4 35.4 Chili Powder 2.6 8.0 8.5 2.8 22.2 Curry Powder 2.0 7.0 10.2 2.9 20.3 Paprika 2.1 6.0 8.8 3.1 18.4 Ginger, ground 1.8 6.0 22.0 6.6 39.6 Cinnamon, ground 2.3 6.0 18.0 6.9 41.4 Basil leaf, dried 0.7 1.0 12.5 8.8 8.8 Oregano leaf 1.0 3.0 41.1 13.7 41.1 Tumeric powder 2.2 8.0 16.0 16.0 35.1 Cloves, ground 2.1 7.0 127.9 38.4 268.7 a (U.S. Department of Agriculture, 2007) b adapted from(Halvorsen et al., 2006)
80

Table 4.6 Vegetables
a (U.S. Department of Agriculture, 2007)
Food Serving Size (g)a
kcal/servinga Phenol mg/gb
Phenol mg/kcal
Phenol mg/serving
Carrot 61.0 24.0 0.0 0.1 2.1 Cucumber, with peel 52.0 8.0 0.0 0.2 2.0 Celery 60.0 10.0 0.1 0.4 3.8 Potatoes, white, cooked 213.0 182.0 0.4 0.5 93.5 Broccoli 44.0 15.0 0.3 0.7 11.1 Tomatoes 123.0 22.0 0.2 0.9 19.4 Garlic clove 3.0 4.0 1.4 1.1 4.2 Spinach, frozen 78.0 16.0 1.2 6.1 97.4 Broccoli 44.0 15.0 2.3 6.7 101.2 Red Bell Pepper 92.0 24.0 1.9 7.3 174.8 Cabbage, red, cooked 75.0 22.0 2.2 7.5 164.5 Artichokes, prepared 84.0 42.0 4.3 8.6 362.7
b adapted from(Halvorsen et al., 2006)
Table 4.7 DASH Diet Day 6 lunch menu and replacement foods to increase polyphenol intake
Lowa TP mg GAE/serving High TP mg GAE/serving Turkey Sandwich Turkey Sandwich 3 oz turkey 0.0 3 oz turkey 0 2 slices whole wheat bread 0.3
2 slices whole wheat bread 0.3
1 large leaf romaine lettuce 0.1
1 large leaf romaine lettuce 0.1
2 slices tomato 0.1 1/2 c cooked artichoke hearts 726
2 tsp low-fat mayonnaise 0.0
1/2 c sliced red bell pepper 88
1 Tbsp Dijon mustard 0.2 1 c red cabbage slaw 330 1 c steamed broccoli 1.6 1 tsp mustard seed 0.4 1 med orange 1.3 1 tsp tarragon 83.6 1 tsp olive oil 0.0 1c berries 40 1 tsp cinnamon 476 Total 3.7 Total 1743.9
a (U.S. Department of Health and Human Services and others 2006)
81

BIBLIOGRAPHY Halvorsen BL, Carlsen MH, Phillips KM, Bohn SK, Holte K, Jacobs DR, Jr. & Blomhoff R.
2006. Content of redox-active compounds (ie, antioxidants) in foods consumed in the United States. Am J Clin Nutr 84(1):95-135.
U.S. Department of Agriculture. 2007. USDA National Nutrient Database for Standard Reference. Nutrient Data Laboratory Home Page http://www.ars.usda.gov/ba/bhnrc/ndl
U.S. Department of Health and Human Services, Health NIo & National Heart L, and Blood Institute 2006. Your Guide to Lowering Your Blood Pressure with DASH: DASH Eating Plan Lower Your Blood Pressure. In: Health, N. I. o., editor).
Wu X, Beecher G, Holden J, Haytowitz D, Gebhardt S & Prior R. 2004. Lipophilic and Hydrophilic Antioxidant Capacities of Common Foods in the United States. Journal of Agricultural and Food Chemistry 52:4026-4037.
82

CHAPTER V
CONCLUSIONS
LIMITATIONS
The information obtained concerning the polyphenolic content of acorn nuts, acorn meal,
and a cookie made with acorn meal is valuable for comparison with foods that high in
polyphenols which can provide beneficial properties in treating and preventing disease. The
information is limited in that the values obtained pertain only to the food products tested, and do
not reflect the activity of the polyphenolics after being absorbed in the body. The results contain
information regarding different ingredient interactions among the ingredients in the acorn meal
cookie, however many more interactions may take place between the food products and
compounds present in the body. The data gathered here does not reflect the effect acorns or
acorn products can have in vivo.
The total phenols assay provides information about all of the polyphenols present in the
food sample being tested. However the total phenols assay does not provide information about
the total antioxidant capacity of the food sample. Polyphenols may be a significant contributor
to the antioxidant properties provided in the sample being tested, but other antioxidants may be
present in the food sample and contribute to the antioxidant capacity. The total phenols assay
cannot detect those other antioxidants.
IMPLICATIONS
Acorns are a traditional, relatively unrefined food. This research demonstrates that a
particular traditional food does contain a higher level of polyphenolics than most contemporary
83

staples. Per gram of dried product, acorn meal places among the highest 50 sources of dietary
antioxidants. It appears to be true that some traditional diets included more polyphenols than
modern diets, and acorn meal could be used to increase antioxidant intake, and specifically
polyphenol intake. Not only can eating whole acorns contribute to polyphenol consumption, but
consuming products made from acorns, such as baked goods prepared from acorn meal, can
contribute to polyphenol intake. It is a reasonable hypothesis that increased polyphenol intake
may improve the oxidative state of individuals consuming a higher polyphenol diet, ultimately
providing a beneficial effect in terms of reduced risk for diseases associated with oxidative
processes.
FUTURE RESEARCH
In order for the postulated benefits of consuming a diet high in polyphenols and more
broadly, antioxidants, to be proven, more must be learned about polyphenols once they enter the
body. A large body of evidence exists regarding the polyphenols and antioxidants present in
foods, but more information must be gathered regarding the mechanism of absorption and the
fate of the antioxidant compounds once absorbed. Foods high in antioxidants may be very
beneficial in treating and preventing diseases, but the exact mechanisms and specific antioxidant
compounds providing that beneficial effect is still unknown. Thousands of antioxidant
compounds exist in foods, and it is still unclear the specific effect each of those compounds has
in the body, in which disease processes those compounds can play the largest beneficial role, and
whether those compounds provide their beneficial effects individually or work together.
If polyphenols and antioxidants actually do provide the beneficial effects research thus
far is indicating, more information needs to be gathered as to how polyphenol and antioxidant
intake can be significantly increased in the typical American diet. Diets that utilize various
84

85
strategies to improve food choices, such as the DASH diet with lower salt intake, should be
developed to strategize and optimize polyphenol and more broadly antioxidant intake. Even with
strategic food choices, supplements could provide high levels of polyphenols and antioxidants
and could provide health benefits without adding calories. More research must be done to
determine whether different polyphenols contribute different health benefits, whether dietary
supplements could provide the most benefit, and what serving size and frequency of
consumption should be used to provide the most benefit without causing harm.


![Acorn storage alternatives tested on Oregon white oak. · treatments for white oak acorn storage, using Oregon white oak (Quercus gar ryana Douglas ex Hook. [Fagaceae]) acorns from](https://img.dokumen.tips/doc/110x75/5f752d7173d3db710e731f73/acorn-storage-alternatives-tested-on-oregon-white-oak-treatments-for-white-oak.jpg)