Embed Size (px)
Citation preview

Reproduced with the kind permission of the Journal of the Royal AstronomicalSociety of Canada and the authors of this paper. Reformatted for viewing on theweb by Chip Wiest. (best viewed at 800x600 resolution).
Frank Roy and Ken Tapping
A BRIEF HISTORY OFTHE INDIAN RIVEROBSERVATORYRADIOINTERFEROMETER
Reprinted from
JOURNAL OFTHE ROYAL ASTRONOMICAL SOCIETY OFCANADAVol. 84, No.4,pp. 260-274August 1990

A BRIEF HISTORY OF THE INDIAN RIVER OBSERVATORYRADIO INTERFEROMETER
BY FRANK ROY AND KEN TAPPINGOttawa Centre, R.A.S.C.
(Received March 26, 1990)
ABSTRACTWe describe the construction and evolution of a large amateur-built radiotelescope over the past 14 years. Toillustrate the improvements in sensitivity achieved during the project, we include examples of observations madewith the instrument.
RÉSUMÉNous décrivons la construction et 1'évolution d'un grand radiotéIescope fabriqué par des amateurs pendant les 14dernières années. Pour illustrer les améliorations de la sensibility réalisées pendant ce projet, nous incluons desexemples d'observations effectuées avec cet instrument.
Introduction. Technical progress is bringing the construction of highly sensitiveradiotelescopes within the reach of private individuals. Amateur radioastronomers need nolonger be limited to making observations of the Sun, Milky Way and the four strongest discreteradio sources. Components, which only a few years ago could be found only in large researchfacilities, can now be bought over-the-counter. However, building the large antennas andsensitive receivers, and the signal processing needed for some of the more ambitious projects,such as detecting quasars and other faint radio sources, may require the resources of a group. Inthis paper we summarize the planning and construction of the R. A. S. C. Ottawa Centre's"Indian River Observatory Radio Interferometer". We do not intend it to be a designdescription, but more an account of the way this project was carried out.
The IRO Radio Interferometer. The Indian River Observatory Radio Interferometer (IRORI) isthe result of a number of factors which came together at the right time. The first was the needto move an observatory. For several years the Ottawa Centre had been operating its "NorthMountain Observatory" (NMO), located near the town of South Mountain, to the south ofOttawa. The main instrument at the Observatory was a 40-cm Newtonian telescope. Thesouthward spread of the city, together with the increasing number of neighbours, made itobvious that the observatory would have to be relocated. After a long search a suitable site wasfound, near Almonte, roughly 50 kilometres to the south-west of Ottawa. About two acres ofland were generously offered to the Centre by the Mississippi Valley Conservation Authority.This was more than was needed for an observatory building, club house and car park; there wasroom for other projects, such as a radiotelescope.
The second ingredient was the appearance in, the Ottawa Centre of a new member (KT), whohad been heavily involved in amateur radioastronomy in the United Kingdom, with members ofthe British Astronomical Association, and wanted to get involved in similar activities inCanada. The third ingredient was the mood in the Ottawa Centre. The successful completionof the observatory relocation was in sight, and there was a lot of enthusiasm for new challenges.
In early 1976, a meeting of seven interested Centre members was held at KT's apartment inOttawa, and the possibilities were discussed in more detail. An important consideration washow the wide range of skills and expertise in the Centre could be harnessed effectively in such alarge project. An extract from the original introduction to the project manual (to be) reads:
"In a recent meeting, the Radio Telescope Group held preliminary discussions concerning theconstruction of a radio interferometer at the new location, now renamed the Indian RiverObservatory. At the meeting there was considerable interest in this project. It was decided that

the construction of this instrument would be a joint effort, with the electronics being in the formof modules which could be built by members and incorporated into the final device."
Following this meeting KT gave several talks on radio astronomy at the monthly meetings ofthe Centre's Observers' Group (the active members of the Centre), describing the project andinviting members to participate. Since the "Great Observatory Move" of 1977 was reaching itsclimax, and was tying up all the Centre's resources, it was decided that major constructionwould be started in 1978. Work on the electronic modules for the telescope began in the falland winter of 1977-78.
Since radio waves are much longer than light waves, very large antennas are required ifreasonable angular solution is to be obtained. A radiotelescope, operating at a wavelength of 1m, in order to achieve the same angular resolution as a 7.5 cm (3 inch) optical refractingtelescope needs an antenna about 150 kilometres in diameter!
Our new observatory site was about 200 m wide. However, constructing a 200 m dish was outof the question. We could, however, build an interferometer (the operation of radiointerferometers and other types of radiotelescope is discussed by Steinberg and Lequeux, 1963).In this way we could obtain some of the performance of a large radiotelescope, while actuallybuilding two much smaller antennas. Our initial design (13th July, 1977) consisted ofbroadside arrays1, each 5 m square, separated by about 155 m in an East-West line. This wouldgive us the angular resolution of an antenna 155 m across! However, the sensitivity would bedictated by the actual size of the antennas.
This relatively modest design did not last. In 1977 Larry Schweizer joined the group. Thisbrought not only his practical expertise in engineering, but also a well-equipped workshop inAlmonte, only a few minutes from the observatory. In addition, Larry donated $500 to theproject. Our plans then became more ambitious.
The best general-purpose antenna design is the paraboloidal dish, which, like the paraboloidalmirror in an optical telescope, brings the received energy to a single focus. A single dipole2 canthen be used to collect the radio waves. However, building large dishes can be difficult andexpensive, and so a compromise was made: a pair of 15 X 5 metre parabolic cylinders wasdecided upon. John Smith (a British friend of KT) had previously built an antenna of this kind,based upon the parabolic cylinders used in the interferometers at Cambridge University in theU.K. Robert Dick, together with other group members, made many significant improvements,and reinterpreted the design in terms of available materials. The final configuration gave alarge surface collecting area while keeping the structure light and manageable, and not too highabove the ground.
In the fall of 1977, group members surveyed the site, setting up the 155 m East-Westinterferometer baseline and marking the sites for the antenna support posts. Eight posts areused, four for each antenna. Mounting the posts (which are hydro poles cut in half), requiredeight holes to be dug, each about two metres deep. In late November 1977, Oliver Toop ofAlmonte dug the holes using a front-end loader, charging only a nominal fee. On several
1 Broadside Array: An array of dipoles mounted in front of a large, planar reflector, which increases thesensitivity of the array to waves arriving from the front.2 Dipole: A section of metal rod of length chosen to resonate with radio waves of a particular wavelength. Itextracts energy from the waves and converts it into an electric current which can be transmitted through cables toamplifiers and other devices.

occasions large boulders wereencountered, requiring the holes to beresited and the baseline to be resurveyed.
The rate of construction peaked in 1978.The antennas were prefabricated in LarrySchweizer's workshop. The eightparabolic sections were constructed from 1X 1/4-inch mild steel strips. The sectionswere shaped and assembled using aplywood jig and then electrically welded.The preassembled and painted units werethen transported to the observatory (inLarry's van) for final assembly. Figure 1shows the assembly of one of the antennason-site. The project required a lot of hardphysical labour, such as digging (and thenfilling) holes, removing rust with wirebrushes, and painting steel strip. This wasdone by Centre members, usually withLarry's tools.
The antennas were designed to operate at awavelength in the 1-2 m range. The
structure was designed using Finite Element Analysis, and the cylinders were theoreticallycapable of supporting the mesh required for studies of cold, interstellar hydrogen, at awavelength of 21 cm. We found this prospect very inviting, and decided that if possible theantennas should be modified so that when a suitable receiver could be built we could extend ourobservations to mapping neutral hydrogen in our Galaxy.
During the construction of the parabolic sections, tests were carried out (at Larry's) to check thestress model, and our workmanship. One of the segments was supported on a couple ofwooden stakes and then loaded with four barrels, which were gradually filled with water. Weneeded to know at what point the structure would bend or if the welds would give beforehand.
We added water until a failure occurred.When the barrels were within inches ofbeing full the truss collapsed. It proved thewelding was of high quality and the trussescould indeed support the mesh needed foroperation at 21 cm wavelength. However,as we began to appreciate the scale of theproject as originally conceived, proposalsfor hydrogen line observations wereshelved, and finally dropped. We decidedto stick with the original design, forantennas working in the 1-2 m wavelengthrange. One of the completed antennas isshown in figure 2.
FIG. 2--One of the completed 5 X 15-metre antennas(autumn, 1986). The operating frequency is 238 MHz.(Photograph by Frank Roy).
FIG. 1 -One of the parabolic cylinders being assembled(summer, 1978). From to left to right, Jim Zillinsky,Frank Roy, Pierre Lemay, Priscilla Muir (Photograph byRob Dick).

The IRORI was officially opened on 28th October 1978 by Arthur E. Covington, Canada'spioneer radioastronomer (figure 3). Accompanied by many muttered prayers and crossedfingers, with CBC-TV looking on, he switched on the instrument, and it worked!
However the antenna sensitivity was only a smallfraction of what we had hoped. We were not collectingall the energy it was intercepting. For practicalconsiderations we had decided upon parabolic cylinderantennas. The disadvantage of this design comparedwith the paraboloidal dish is that, instead of bringingthe received energy to a point focus, it brings it to a"focal line". To collect the signal a row of dipoles isneeded, distributed along the focal line. We did notthen appreciate how difficult it is to collect efficientlythe signal from a cylindrical focus; it took almost twoyears to get a satisfactorily-shaped antenna beam!
Additional work was needed on the electronics in thereceiver. The system was built when the group hadbeen relatively inexperienced in constructiontechniques, and (obviously) had no knowledge of theproblems of getting a radiotelescope operating at that
site. Optical astronomers select sites for a dark sky. The radioastronomer's equivalent of a darksky is the absence of interference from electrical equipment, and from radio and TVtransmitters. It turned out that the site was quite poor (at 180 MHz, our observing frequency atthat time), with strong TV interference and "spikes" and "buzz" from local hydro lines. It is nottherefore surprising that initially the sensitivity was quite mediocre. Of course, being a verypowerful radio source, the Sun was easily detected. In addition to the Sun, only four otherdiscrete sources could be identified, the radio galaxies Cygnus A and Virgo A, and thesupernova remnants Cassiopeia A and Taurus A. From these early fringes the estimatedsensitivity was of the order of several hundred janskys (1 jansky = 10-26 W. m-2 .Hz-1). The firstdipole array was designed for 180 MHz, the idea being eventually to try Very Long BaselineInterferometry with John Smith in the United Kingdom, who was operating at that frequency.Unfortunately the interference was overwhelming, and the antenna performance wasunacceptable. The antenna beam-profile had a pronounced resemblance to a two-humpedcamel, certainly nothing like the single, sharp beam we needed.
Having obtained some initial results, we began work to increase the sensitivity. By now thelevel of expertise in the group (which had diminished to about four) had reached a point wherethe initial versions of the electronics that were used to obtain the first observations could bereplaced with improved designs. The receiver's local oscillator and intermediate frequencyamplifier were rebuilt and laboratory-tested to fairly rigid specifications. There then began asteady evolution of the system, which produced improvements, sometimes slight andsometimes major. The dipole arrays used to collect the signal from the focal lines of theparabolic cylinder antennas had to be improved. Since they are responsible for collecting thesignal intercepted by the antennas, increasing their efficiency became the highest priority assoon as the receiver was performing adequately.
In addition to participating in this project, Jim Zillinsky, one of the group, had built a smallradiotelescope of his own, operating at a frequency of about 235 MHz. He discovered that thelevel of interference was low in that frequency range. So in 1980, two new 240 MHz dipole
FIG. 3-Canadian pioneer radioastronomerArthur E. Covington makes the firstobservation, 28th October, 1978(Photograph by Jacqui Tapping).

feed arrays were built; they consisted of eight dipoles for each antenna. Each dipole had a"bazooka" balun3
for adapting the signal to the coaxial cable. A "Christmas tree" was built ofRG 59 cable and commercially-availablesignal combiners4 intended for use in cableTV. (These were bifilar transformers woundon ferrite beads. Types using resistors formatching are not usable for thisapplication.) In each antenna, groups of fourdipoles fed 4:1 combiners. The two outputsfrom these were then added in a 2:1combiner, which then passed the signal tolow-noise amplifiers attached to eachantenna. At that time the noise temperatureof the amplifiers was about 500 K.
These improvements significantly increasedthe sensitivity. The antenna beam was nowbetter shaped and the interference problemwas much reduced. In early 1981 wedetected the radio source Hercules A, at 236janskys the weakest source yet! Figure 4shows the original record, along with laterrecords obtained as the telescope wasimproved.
During the next five years the process ofrebuilding and improvement continued.Recurrence of the interference problem ledto extensive changes in the design of thereceiver. In 1982 a new 30 MHzintermediate frequency amplifier was built,which includes 10 double-tuned stages, plus6-pole and 4-pole passive filters. The wholedevice has a bandwidth of 900 kHz, withextremely steep skirts. An important part ofovercoming the interference problem was tomake the local oscillator stable and pure,and carefully to filter the signals coming infrom the antennas so that spurious signalsare not generated in the first stages of thereceiver. Nevertheless, further smallchanges in operating frequency were
3 Balun: A concatenation of BALanced to UNbalanced transformers, an electrical device to transform balancedcurrents, such as those produced by dipoles, to an unbalanced current suitable for transmission through coaxialcable. The "bazooka" is a form of balun in which a coaxial sleeve 1/4 wavelength long is connected to the outsideof the coaxial cable. It prevents currents from flowing in the outside of the cable.
4 Combiner: A electrical device used to combine a number of input signals into a single output. For ourapplication it must have as little insertion loss and phase distortion as possible.
Observations of Hercules A
25th May, 1981
17Th April, 1987
26th April. 1988
FIG. 4-Records of the radio source Hercules A, showingthe improvements made over the years (Observationsby Frank Roy). Top trace: installation of the second, 8dipole array produced a better-shaped antenna beamand made it possible for the first time to detectHercules A. Middle trace: The spacing of the reflectormesh was reduced to 3 inches, and low-noise (50 K)GaAsFET amplifiers were installed. These changespermitted the detection of the quasar 3C298, ourfaintest source up to that time. Bottom trace: New,broader-band dipoles were constructed, and the numberof dipoles on each antenna increased to 12. Thesignals were collected using lower loss cables and new12:1 coaxial combiners. Sensitivity increased fourfold,and 10-jansky sources could now be detected.

required. It was found that the best compromise of good antenna performance and lowinterference occurred at an operating frequency of 238 MHz.
At that time an Esterline Angus strip-chart recorder was used as the main data-logginginstrument. In 1984, in order to avoid unnecessary wastage of chart, and to facilitateunattended operation, a sidereal timer was installed. Over this period, myriads of new problemsappeared: chart recorder ink froze, woodchucks ate the cable feeding power to the antennas, andlightning blew up amplifiers. On one occasion a wind storm blew both antennas partially offtheir mounting poles. Fortunately, they were still supported at both ends (15 metres apart), butwere sagging more than one-and-a-half metres in the middle. The damage was minor. Metalstraps were added to hold the antenna in place. On one occasion, one of us (FR) returned to theobservatory after an absence of several days to find an enormous pile of chart paper on thefloor. Instead of leaving the chart speed set to 1.5 inches per hour, it had been set to 1. 5 inchesper minute.
In 1985 another programme of antenna improvements was started. This work continued into1987. In order to obtain better performance at the new operating frequency, the number ofwires making up the reflecting mesh surface of the parabolic cylinders was doubled, bringingthe wire spacing to a twentieth of a wavelength. In April 1986 the 500 K noise temperatureantenna amplifiers were replaced with GaAsFET amplifiers having noise temperature of about50 K. Besides enhancing the sensitivity, the large, linear dynamic range of these amplifierssubstantially improved the system's resistance to interference.
Early results with the improved antennas and lower-noise amplifiers were very promising; thesensitivity had increased dramatically. On 29th April 1986, FR used the telescope to detect theradio quasar 3C298, which is located in Virgo. As far as we know, this is the first amateurdetection of a radio quasar. This source has a flux density of about 39 janskys at 238 MHz.The observation was reported in the August 1986 issue of the R. A. S. C. National Newsletter.The magazine Sky and Telescope mentioned this report in their section on international news inDecember 1986. The chart record of the quasar showed a signal-to-noise ratio of about 4: 1,indicating that it should be possible to detect sources as weak as 10 janskys. The detectionrecord is shown in figure 6.
Quasar 3C298: 28th April, 1986
FIG. 6—First chart observation of the quasar 3C298 (observation by Frank Roy)

In 1987 a new set of dipoles were made using 5/8-inch outside diameter copper tubing, eachagain with a "bazooka" balun. The new dipoles had a broader bandwidth, making them moreimmune to mismatches in the cabling system. In order to improve the signal collectingefficiency, the number of dipoles was increased to twelve. The cable system for collecting thesignals from the antennas was replaced. This time the dipoles were fitted with identical lengthsof lower loss RG 8U cable. The signals from twelve dipoles were combined in a specially-
made 12:1 quarter-wave coaxial combiner (figure 5).The bottom trace in figure 4 shows the results of theseimprovements.
Since the detection of 3C298, surveys of small parts ofthe sky have revealed many other sources, including afurther six quasars. To date, some 100 sources havebeen identified; most are radio galaxies.
With the sensitivity now reaching the anticipatedlevels, attention was directed to the methods used torecord the data. The strip chart recorder did not recorddata in a form amenable to easy analysis. For someyears experimental use was made of an Apple II+computer as part of a data acquisition system. An 8-bit analogue-to-digital converter5 was used. Althoughsomewhat limited by current standards, it amplydemonstrated the usefulness of digital data logging asan analysis aid in amateur radio astronomy.
During the early days of the IRORI, three main goalswere set: detection of a radio quasar, a map of the sky, showing discrete sources and thegalactic continuum emission, and the detection of a radio pulsar. In late 1987 FR got together agroup to undertake a detailed sky survey. They pooled their resources to purchase a morepowerful, IBM PC-XT compatible computer for use with a 12-bit analogue-to-digital converter.The data are stored on a 30 megabyte hard disc drive. It is now installed on the telescope, andis being used to make unattended observations. The improvement obtained through digital datarecording and signal processing compared with chart records is very visible in the recording ofHercules A shown in figure 7.
Each antenna has a fan beam 5 degrees in hour angle times 15 degrees in declination. At 238MHz, the 155 m baseline gives a fringe spacing of about 0.5 degrees. At any one time, theantennas are observing all the sources in a patch of sky having an area of about 75 squaredegrees. As fainter sources are observed, the number per unit area of sky increases. At thecurrent sensitivity of the IRORI, more than one source per 75 square degrees of sky is observed.This condition is termed as being "resolution limited". Further increases in sensitivity throughusing lower-noise amplifiers will not yield more sources. It would be more useful to make theantennas larger, which would make the antenna beam smaller.
5 Analogue to digital converter: An integrated circuit that converts analogue signals to binary numbers suitablefor processing by computers. Generally AID converters are specified by their resolution, which is set by thenumber of bits.
FIG. 5-"Medusa", one of the two 12-waysignal combiners. These are quarter-wavesections of coaxial line which match 1250-ohm lines in parallel (an impedance of4 ohms) to the 50-ohm cable transferringthe combined signals to the GaAsFETamplifiers. They are constructed fromcopper tube and have an effectivebandwidth of at least 10 MHz(Photograph by Frank Roy)
In order to use the radiotelescope simultaneously as a total power receiver, addinginterferometer and as a phase-switched interferometer, further signal processing electronicswere added to the receiver. It is now possible to map the galactic continuum, and using the datafrom the two interferometer configurations, estimate the sizes of some of the larger sourcestructures.
This article may convey the impression that the work proceeded steadily from start to finish,punctuated with minor technical difficulties. This could not be farther from the truth. Weencountered a wide range of difficulties, some of which took a long time to solve. Lookingback we see that many of the problems were based upon trivial errors, although they didn't seemthat way at the time. One important conclusion we draw from the experience is that successcannot be guaranteed; it has to be worked for.
As the rate of progress and type of work changed, the size of the group varied. In the early partof the project, when earth, steel and wood were being moved, the work parties often numbereda dozen people. As progress slowed, and the work became more technical, the group shrankdown to one or two. This brings us to our second important conclusion: there must be a coreperson or two who have unlimited enthusiasm for the project, and keep it moving, despite theproblems.
The IRORI project has taken more than ten years and has been a learning experience for all ofus. One of us (FR) was a teenager at the beginning of the project, and knew little aboutradioastronomy and the technology that goes with it. Through experience gained while
FIG. 7-A recording of Hercules-A and other fainter sources made using the digital data acquisition and signalprocessing system developed for the sky survey. The bottom trace is the original raw data with a bandwidthof 68 X 10-3
Hz. The top trace has been filtered with a Finite Impulse Response (FIR) digital filter with anequivalent bandwidth of 3 X 10⁻³ Hz with a centre frequency of 7.5 X 10⁻³ Hz. The sampling interval is 2seconds. The sources were identified using Sky Catalogue 2000.0 (1985) as the reference. This record wellillustrates that the limiting factor with the radiotelescope is now confusion rather than sensitivity (plot byFrank Roy).
building and using the radiotelescope, he is now employed as an electronics technologist by amajor electronics firm.
Another important conclusion is that the temptation to make a complex, sophisticated systemmust be resisted. Keep things simple but make them reliable. Under routine observingconditions it is not unusual to leave the instrument unattended for several days or weeks,recording data as part of a project. It is necessary that the data be consistent and uninterruptedby failures.
We did not find this an easy project. We soon learned that we had to make use of all theresources available, people and materials. Our ideas matured with the project, and consideringthe technology available today in the way of sensitive radio receivers and computer technology,the only fundamental limit is imagination.
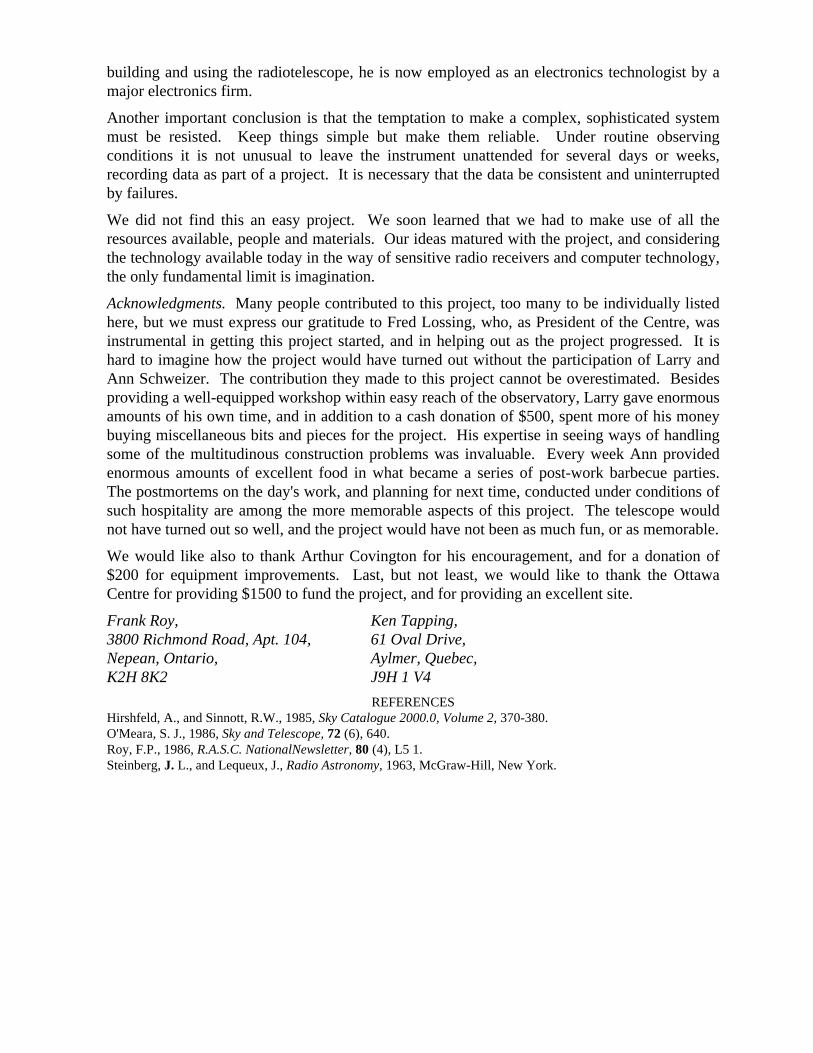
Acknowledgments. Many people contributed to this project, too many to be individually listedhere, but we must express our gratitude to Fred Lossing, who, as President of the Centre, wasinstrumental in getting this project started, and in helping out as the project progressed. It ishard to imagine how the project would have turned out without the participation of Larry andAnn Schweizer. The contribution they made to this project cannot be overestimated. Besidesproviding a well-equipped workshop within easy reach of the observatory, Larry gave enormousamounts of his own time, and in addition to a cash donation of $500, spent more of his moneybuying miscellaneous bits and pieces for the project. His expertise in seeing ways of handlingsome of the multitudinous construction problems was invaluable. Every week Ann providedenormous amounts of excellent food in what became a series of post-work barbecue parties.The postmortems on the day's work, and planning for next time, conducted under conditions ofsuch hospitality are among the more memorable aspects of this project. The telescope wouldnot have turned out so well, and the project would have not been as much fun, or as memorable.
We would like also to thank Arthur Covington for his encouragement, and for a donation of$200 for equipment improvements. Last, but not least, we would like to thank the OttawaCentre for providing $1500 to fund the project, and for providing an excellent site.
Frank Roy, Ken Tapping,3800 Richmond Road, Apt. 104, 61 Oval Drive,Nepean, Ontario, Aylmer, Quebec,K2H 8K2 J9H 1 V4
REFERENCESHirshfeld, A., and Sinnott, R.W., 1985, Sky Catalogue 2000.0, Volume 2, 370-380.O'Meara, S. J., 1986, Sky and Telescope, 72 (6), 640.Roy, F.P., 1986, R.A.S.C. NationalNewsletter, 80 (4), L5 1.Steinberg, J. L., and Lequeux, J., Radio Astronomy, 1963, McGraw-Hill, New York.


![LIGO- India Project By Indian Astrophysicist Mr. Karan ... Report of... · LIGO [Laser Interferometer Gravitational-wave Observatory] ... General Relativity. The strongest sources](https://img.dokumen.tips/doc/110x75/5ec6840389bf784f122a09dc/ligo-india-project-by-indian-astrophysicist-mr-karan-report-of-ligo-laser.jpg)