Embed Size (px)
Citation preview

CDM-SSC-PDD (version 02)
CDM – Executive Board page 1
Small Scale Project Design Document Biomass Power Plant (Tamilnadu Energy
Development Agencies, TEDA)
Prathyusha 10 MW Biomass Power Plant in Tirunelveli District, Tamil Nadu

CDM-SSC-PDD (version 02)
CDM – Executive Board page 1
CLEAN DEVELOPMENT MECHANISM
SIMPLIFIED PROJECT DESIGN DOCUMENT
FOR SMALL-SCALE PROJECT ACTIVITIES (SSC-CDM-PDD)
Version 02
CONTENTS
A. General description of the small-scale project activity
B. Baseline methodology
C. Duration of the project activity / Crediting period
D. Monitoring methodology and plan
E. Calculation of GHG emission reductions by sources
F. Environmental impacts
G. Stakeholders comments
Annexes
Annex 1: Information on participants in the project activity
Annex 2: Information regarding public funding
Annex 3: Fuel Assessment Study Report

CDM-SSC-PDD (version 02)
CDM – Executive Board page 2
Revision history of this document
Version Number
Date Description and reason of revision
01 21 January
2003
Initial adoption
02 8 July 2005 The Board agreed to revise the CDM SSC PDD to reflect
guidance and clarifications provided by the Board since version
01 of this document.
As a consequence, the guidelines for completing CDM SSC
PDD have been revised accordingly to version 2. The latest
version can be found at
<http://cdm.unfccc.int/Reference/Documents>.
CDM-SSC-PDD (version 02)
CDM – Executive Board page 3
SECTION A. General description of the small-scale project activity
A.1. Title of the small-scale project activity:
Prathyusha 10 MW Biomass Power Plant in Tirunelveli District, Tamil Nadu
Version 1
June 15, 2006
A.2. Description of the small-scale project activity:
The project implementers plan to build and operate one 10 MW exclusively biomass electricity
generation plant in Tamil Nadu. The project will involve construction of the generation plant and
development of a fuel source network. The project developers are looking to utilize a wide variety of
organic waste products that will require developing brand new collection, distribution, and purchase
markets for various crop residues. These atypical biomass feedstocks include Prosopis juliflora, rice
husk, cotton stalk and coconut leaves. Biomass generation is relatively new in the State of Tamil Nadu.
Biomass will be burned in a boiler with steam generated at high pressure to turn a turbine for the
generation of power. This electricity will be supplied to main grid.
The purpose of the project therefore is to take a renewable energy source – agricultural waste products –
and convert that into electricity to supply in a more sustainable manner the growing demand for
electricity in southern India.
The project makes several critical contributions to sustainable development. Development of renewable
energy resources was clearly presented at the World Summit on Sustainable Development in
Johannesburg as a critical building block for sustainable development. Currently, India suffers from
periodic shortages of electricity which forces many people and businesses to either go without this vital
resource or to purchase and operate inefficient diesel back-up generators. The Indian Government and
specifically, the Ministry of Non-Conventional Energy Sources, have made it very clear that renewable
energy resources such as biomass are critical to promoting sustainable development. This project creates
a source of electricity generation based on a renewable energy resource – local biomass from agricultural
waste.
A detailed biomass procurement plan is ready. In addition several suppliers have already been contacted
as necessary to ensure biomass supply to the plant. The arrangements so far include:
a. Prosopis juliflora is to be collected within a 40 km radius of the plan in Thirunelveli area.
Prosopis juliflora grows on wastelands. In addition, the company is planning to establish a
2000 acre plantation of Prosopis juliflora. With an estimated requirement of 175 tonnes of
Prosopis juliflora per day will be collected from the wastelands where 20,000 ha of the
biomass grows in the 40 km vicinity of the plant
b. Rice husk: will be procured from the Rice Mill at Thirunelveli town and over 25 small rice
mills in the 40 km radius of the plant.
c. Cotton Stalk: is available between of April to June of the year.
d. Coconut thatches: are available periodically
The project will employ 50 employees directly from the local area around the plant and train them for
operations and maintenance. The project will also employ an additional 150 persons for indirect
employment. Finally, the agricultural sector in India often harbours some of India’s poorest people. This

CDM-SSC-PDD (version 02)
CDM – Executive Board page 4
project will create the demand for waste agricultural products that previously had little or no value and
result in a collection network with additional jobs. With the additional revenue generated, the standard of
living of the people of these areas will improve enhancing their ability to provide food and education for
their children. With the additional revenue generated the standard of living of the people of these areas
will improve, thus helping to feed and educate their families.
A.3. Project participants:
Name of Party Involved Private and or Public
Entity(ies) project
participants
Indicate if the Party wishes
to be considered a project
participant (Yes/No)
India (host) Prathyusha Power Private
Limited
Tamil Nadu Energy
Development Agency
No
A.4. Technical description of the small-scale project activity:
The small-scale project activity will include the construction of one 10 MW biomass generator and
creation of agricultural waste collection and transport system. The proposed biomass based power plant
will consist of one number of biomass stoker fired, bi-drum, natural circulation boiler of 35 Tonnes Per
Hour (TPH), 66 ata1, 490
oC and 1 condensing steam turbine of nominal capacity 10 MW. The steam
pressure at the inlet of the turbine will be 65 ata at 485oC.
The power plant cycle is designed with one deaerator for feed water heating. The steam requirements of
the deareator shall be met with the extraction from the turbine. The complete plant instrumentation and
control system is based on distributed control system (DCS), covering the total functioning requirements
of measuring, monitoring, alarming and controlling, logging, sequence interlocks and equipment
protection.
The design and guarantee fuel for the biomass power plant will be woody biomass namely Prospis Juli
flora and auxiliary fuel will be rice husk.
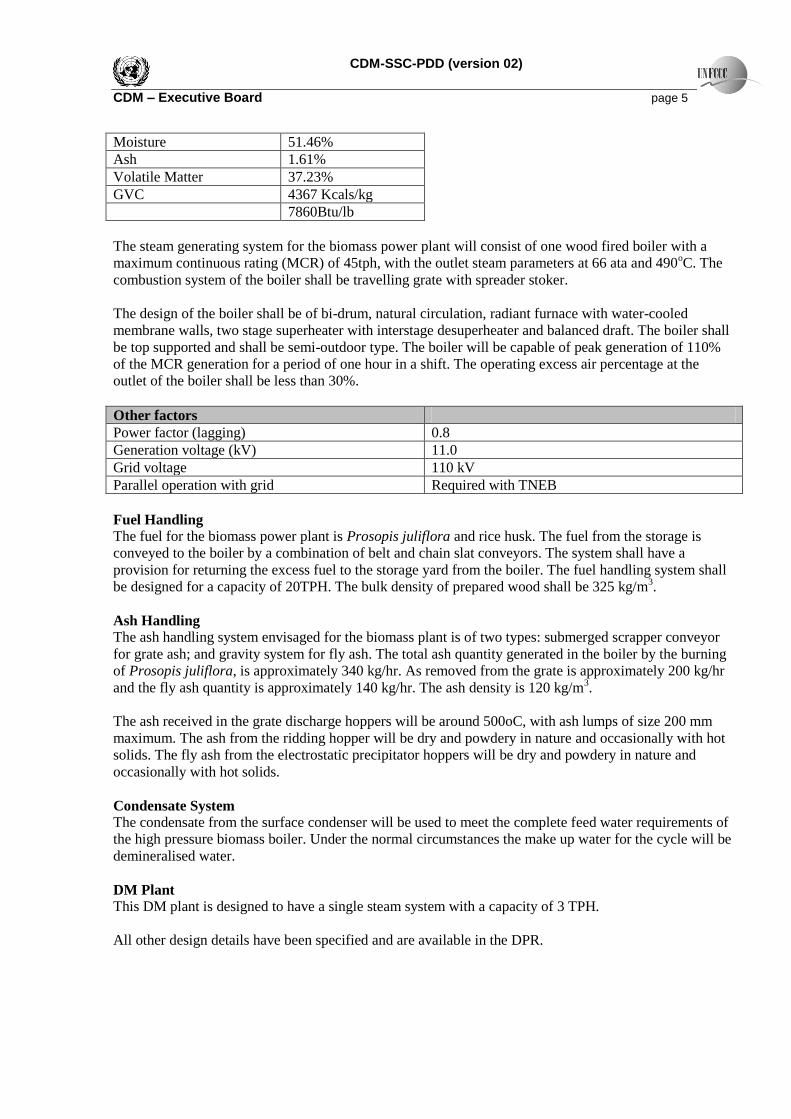
Parameter Unit
Ultimate Analysis (Rice Husk)
Carbon 36.7%
Hydrogen 3.0%
Oxygen 31.2%
Moisture 10.0%
Ash 18.0%
GVC with 50% moisture 3150kcal/kg
Analysis of Wood (Prosopis juliflora)
Carbon 9.7%
1 Atmospheric absolute; 1 ata is the atmospheric pressure at sea level; is measured with a barometer.
CDM-SSC-PDD (version 02)
CDM – Executive Board page 5
Moisture 51.46%
Ash 1.61%
Volatile Matter 37.23%
GVC 4367 Kcals/kg
7860Btu/lb
The steam generating system for the biomass power plant will consist of one wood fired boiler with a
maximum continuous rating (MCR) of 45tph, with the outlet steam parameters at 66 ata and 490oC. The
combustion system of the boiler shall be travelling grate with spreader stoker.
The design of the boiler shall be of bi-drum, natural circulation, radiant furnace with water-cooled
membrane walls, two stage superheater with interstage desuperheater and balanced draft. The boiler shall
be top supported and shall be semi-outdoor type. The boiler will be capable of peak generation of 110%
of the MCR generation for a period of one hour in a shift. The operating excess air percentage at the
outlet of the boiler shall be less than 30%.
Other factors
Power factor (lagging) 0.8
Generation voltage (kV) 11.0
Grid voltage 110 kV
Parallel operation with grid Required with TNEB
Fuel Handling
The fuel for the biomass power plant is Prosopis juliflora and rice husk. The fuel from the storage is
conveyed to the boiler by a combination of belt and chain slat conveyors. The system shall have a
provision for returning the excess fuel to the storage yard from the boiler. The fuel handling system shall
be designed for a capacity of 20TPH. The bulk density of prepared wood shall be 325 kg/m3.
Ash Handling
The ash handling system envisaged for the biomass plant is of two types: submerged scrapper conveyor
for grate ash; and gravity system for fly ash. The total ash quantity generated in the boiler by the burning
of Prosopis juliflora, is approximately 340 kg/hr. As removed from the grate is approximately 200 kg/hr
and the fly ash quantity is approximately 140 kg/hr. The ash density is 120 kg/m3.
The ash received in the grate discharge hoppers will be around 500oC, with ash lumps of size 200 mm
maximum. The ash from the ridding hopper will be dry and powdery in nature and occasionally with hot
solids. The fly ash from the electrostatic precipitator hoppers will be dry and powdery in nature and
occasionally with hot solids.
Condensate System
The condensate from the surface condenser will be used to meet the complete feed water requirements of
the high pressure biomass boiler. Under the normal circumstances the make up water for the cycle will be
demineralised water.
DM Plant
This DM plant is designed to have a single steam system with a capacity of 3 TPH.
All other design details have been specified and are available in the DPR.

CDM-SSC-PDD (version 02)
CDM – Executive Board page 6
Although the use of coal as a fuel for co-firing is not being considered, to account for biomass variance,
pestilence that may case the disruption of biomass supply, about 5% of the co-firing with coal is being
considered. The emissions from coal co-firing are considered as project emissions.
A.4.1. Location of the small-scale project activity:
The 10 MW biomass plant will be located at Tuvarasi Village in Thirunelveli District in Tamil
Nadu. The sites were located based on access to fuel sources (agricultural wastes).
A.4.1.1. Host Party (ies):
India
A.4.1.2. Region/State/Province etc.:
Tamil Nadu
A.4.1.3. City/Town/Community etc:
Tuvarasi Village in Thirunelveli District in State of Tamil Nadu, INDIA
A.4.1.4. Detail of physical location, including information allowing the unique identification of this
small-scale project activity(ies):
The physical location of the plant was chosen based on the proximity to reasonable fuel supplies near the
Tuvarasi District. Detailed maps showing the Districts of Tamil Nadu and the location of the village in
the District is shown below.

CDM-SSC-PDD (version 02)
CDM – Executive Board page 7
A.4.2. Type and category(ies) and technology of the small-scale project activity:
Project Type 1 Renewable Energy Projects (15MW or less)
Project Category I.D. Renewable Electricity Generation for a Grid
Justification for Project Type and Category:
The proposed CDM project involves construction and operation of one 10 MW biomass plant that will
rely on renewable sources of biomass for power generation. The source of biomass will be agricultural
waste materials making the fuel and the project renewable electricity generation project.
The total capacity of 10 MW fits within the rules governing Type 1 projects. The size of units will not
increase during the course of the project. The developers have no plans to increase the rated output of the
unit and construction approvals and power purchase agreements in place all indicate 10 MW of capacity.
Any changes to this would require significant and time-consuming bureaucratic processes. As part of
annual verifications, the project developers will confirm the generation size has remained static.
This electricity will be completely supplied to the state electricity grid, which necessitates the use of
project category 1.D.
While the final bids for specific vendors supplying the generation technology are yet to be determined,
the general technology of biomass generation is considered to be safe, sound and readily transferable
technology. Burning biomass presents fewer potential environmental hazards versus fossil fuels.
Handling and spillage from fossil fuels can create dangerous environmental situations. Agricultural waste
is relatively benign if spilled. In fact, proper drying and handling of agricultural waste can reduce
potential methane emissions from biomass decomposition (not being claimed for credit here). This
project being an early entrant in Tamil Nadu and using a blend of agricultural waste will help the region
and country further develop expertise that can help open up addition replication opportunities for similar
technologies. The key project developer is Indian and will retain the know-how to replicate the efforts
and demonstrate success locally.
A.4.3. Brief explanation of how the anthropogenic emissions of anthropogenic greenhouse gas
(GHGs) by sources are to be reduced by the proposed small-scale project activity, including why
the emission reductions would not occur in the absence of the proposed small-scale project activity,
taking into account national and/or sectoral policies and circumstances:
The project developer estimates that over a period of 10 years 521915 tonnes of CO2 will be avoided as a
result of this project. By using renewable biomass fuel to generate electricity for the power grid, the
project will help offset other electricity sources using fossil fuels. This will reduce the combustion of
fossil fuels thereby lowering CO2 emissions. India has long relied on fossil fuels to meet the vast
majority of its electricity needs. Renewable fuels have played only a very small role.
This project will be among the first few biomass generation activities in the state of Tamil Nadu. It will
rely on an eclectic array of biomass fuels together in a generation plant. The inherent technical risks
associated with this approach as well as several other barriers described in section (B.3.) more or less
ensure that in the absence of the proposed CDM project, the electricity would continue to be met by fossil
fuels which would continue to create CO2 emissions.

CDM-SSC-PDD (version 02)
CDM – Executive Board page 8
A.4.3.1 Estimated amount of emission reductions over the chosen crediting period:
Please indicate the chosen crediting period and provide the total estimation of emission reductions
as well as annual estimates for the chosen crediting period. Information on the emission reductions
shall be in indicated using the following tabular format.
Year Annual estimation of emission reductions in
tonnes of CO2 e
2007 47179
2008 50127
2009 53076
2010 53076
2011 53076
2012 53076
2013 53076
2014 53076
2015 53076
2016 53076
Total estimated reductions
(tonnes of CO2 e) 521915
Total number of crediting years 10
Annual average over the crediting period of
estimated reductions (tonnes of CO2 e)
52190
A.4.4. Public funding of the small-scale project activity:
No public funding from an Annex 1 country is involved.
A.4.5. Confirmation that the small-scale project activity is not a debundled component of a larger
project activity:
As per the guidance in appendix C, the proposed project is actually one self-contained project with a total
installed capacity of only 10 MW. This power plant involves no other construction and is in no way part
of a larger facility or project.
SECTION B. Application of a baseline methodology:
B.1. Title and reference of the approved baseline methodology applied to the small-scale project
activity:
Project Category I.D. - Renewable Electricity Generation for a Grid
B.2 Project category applicable to the small-scale project activity:
As per the guidance given by project category I.D., this project uses renewable biomass and supplies
electricity to the grid that is currently supplied by more than one generating unit using fossil fuels.

CDM-SSC-PDD (version 02)
CDM – Executive Board page 9
The project uses renewable biomass that fits into the requirements of all Type 1 projects. While the EB
has yet to define renewable biomass in Appendix B of the simplified modalities and procedures for small-
scale CDM project activities (see General Guidance Section A. Bullet 8), the agricultural waste to be used
in this project clearly fits under the EB’s definition of Biomass.
Biomass means non-fossilized and biodegradable organic material originating from plants,
animals and micro-organisms. This shall also include products, by-products, residues and waste
from agriculture, forestry and related activities as well as the non-fossilized and biodegradable
organic fractions of industrial and municipal wastes. EB 20 Annex 8 Section A
Since the agricultural products being used for this project are cultivated continuously yielding similar
amounts of products and waste each year, they are likely to be deemed renewable under any eventual
definition the EB provides.
All Type 1 projects must be 15 MW or less of installed capacity. This one time 10 MW power generation
project fits that criterion.
The project which is based on a renewable energy technology supplying electricity to a grid, fits within
category D because as it states in Appendix B ‘Categories I.A, I.B and I.C involve renewable energy
technologies that supply electricity, mechanical and thermal energy, respectively, to the user directly.
Renewable energy technologies that supply electricity to a grid fall into category I.D.’
The Southern Grid of India has multiple fossil fuel generation sources that would have otherwise
provided the electricity generated by these plants. The renewable component as mentioned above is
15MW total as per the requirements of the methodology. This is not a biomass co-generating unit.
As per the baseline methodology outlined in Appendix B, the baseline is simply the kWh generated by the
plant using renewable fuel multiplied by a carbon emission factor calculated using a weighted average
emission of the Southern Grid of India.
Variable/Parameter Data Source
Kwh produced using renewable fuel Generating plant
Carbon emission factor for Southern Grid Indian Government
Kwh using non-renewable fuel (not anticipated) –
amount of biomass and fossil fuel used
Plant fuel purchase records
B.3. Description of how the anthropogenic emissions of GHG by sources are reduced below those
that would have occurred in the absence of the registered small-scale CDM project activity:
Step 0. Preliminary screening of projects started
after 1 January 2000 and prior to 31 December 2005
The Marrakech Accords and COP 9 decisions provide guidance on the eligibility of proposed CDM project
activities started before registration1. If the starting date of the project activity falls between
1 January 2000 and the date of registration of a first CDM project activity and prior to 31 December 2005,
evidence should be publicly provided that the incentive provided by the CDM was seriously considered in the
decision to proceed with the project activity. This evidence shall be based on (preferably official)
documentation clearly showing that the CDM incentive played a role at or before the moment of decision
making. Without any such evidence, the authenticity of which can be verified by the DOE, the project is not
additional. If the project participants can provide adequate evidence, the project activity shall proceed through
the steps below.

CDM-SSC-PDD (version 02)
CDM – Executive Board page 10
The project construction is underway and the expected date of commissioning is 30th
October, 2006. Great
consideration was given to the benefit of CERs in the decision making process to proceed with this project. As
characterized below, CDM has played a large role in over coming barriers to project implementation and to
mitigate the risks associated with them.
Step 1. Identification of alternatives to the project activity consistent with current laws and
regulations
(Note: In accordance with guidance by the Executive Board, consistency should be ensured between “baseline scenario” and “baseline emissions”
2)
Define realistic and credible alternatives3
to the project activity(s) that can be (part of) the baseline scenario
through the following sub-steps:
Sub-step 1a. Define alternatives to the project activity:
1. Identify realistic and credible alternative(s) available to the project participants that provide outputs or
services comparable with the proposed CDM project activity4. These alternatives should include:
The proposed project activity not undertaken as a CDM project activity;
All other plausible and credible alternatives to the project that deliver similar outputs and services in a
comparable service area; and,
If relevant, continuation of the current situation (no project activity or other alternatives undertaken)
If this project were not undertaken, there are a few likely alternative scenarios, which include the following:
1. The plant would be constructed but would use coal & other fossil fuels. This project activity could be
undertaken, but not as a CDM activity. This option would mean that the project developers would
either do nothing (see option 2) or be largely reliant on fossil fuels for the vast majority of the calorific
input in this new 10 MW boiler, instead of using biomass. The only other really cost effective option
would be coal or lignite.
2. The current situation would continue with a predominantly fossil electricity generation base likely
leading to the construction of additional large fossil fuel units to meet growing demand. The demand
for this electricity would come from existing fossil fuel plants. In addition, the last three generation
plants in Tamil Nadu have been fossil fuel (not by the project developer but some other company or
the State Electricity Board), indicating the future generation is most likely to be fossil fuels too5. In
2 Please refer to paragraph 2 of Annex 3 of report of the Executive Board at its ninth meeting, see:
http://cdm.unfccc.int/EB/Meetings/009/eb09repa3.pdf. 3 When referring to alternatives throughout this text it is meant alternative scenarios.
4 For example, the outputs of a cogeneration project could include heat for on-site use, electricity for on-site use, and
excess electricity for export to the grid. In the case of a proposed landfill gas capture project, the service provided by the
projects includes operation of a capped landfill.
5 During the year 2006-07, the increase in generating capacity from State, Central and Private Sector will be 749.3 MW (State
Sector- 130.3 MW, Share from Central Sector – 566 MW and Private sector - 53 MW). The above addition includes the
following: In the State Sector, Valuthur Gas Turbine Power Project (Additional) with a capacity of 95 MW at a cost of Rs.385
crores will be commissioned in Ramanathapuram District and Bhavani Kattalai Barrage-I Hydro Electric Project with a capacity
of 30 MW will be commissioned in Erode District at a cost of Rs.195 Crores. In the Private Sector, 53 MW gas based project by
M/s. Arkay Energy Limited will be commissioned at Valantharavi in Ramanathapuram District. Under Central Sector, the first
unit of 1000 MW capacity of Kudangulam Atomic Power Project will be commissioned during 2006-07 and a share of 463 MW
is entitled for Tamil Nadu. Also, the Kaiga Atomic Power Project, Stage-II with a capacity of 2x220 MW will be commissioned
during 2006-07 and a share of 103 MW is allocated to Tamil Nadu.
CDM-SSC-PDD (version 02)
CDM – Executive Board page 11
addition, the Tamil Nadu Government is planning further capacity addition in the form of nuclear
power and lignite based power generation.
3. This project could be undertaken, using biomass, but without CDM. As described below, the barriers
make this option very unlikely.
Sub-step 1b. Enforcement with applicable laws and regulations:
2. The alternative(s) should be in compliance with all applicable legal and regulatory requirements, even if
these laws and regulations have objectives other than GHG reductions, e.g. to mitigate local air
pollution.6 (This sub-step does not consider national and local policies that do not have legally-binding status.).
All of these alternatives could be designed to meet with local and national policies.
3. If an alternative does not comply with all applicable regulations and legislation, then show, based on an
examination of current practice in the country or region in which the law or regulation applies, that the non-
complying element of the alternative is currently widespread. If it cannot be shown that the noncompliance is
widespread, then eliminate the alternative from further consideration;
N/A
4. If the proposed project activity is the only alternative amongst the ones considered by the project
participants that is in compliance with all regulations with which there is general compliance, then the
proposed CDM project activity is not additional.
N/A
Proceed to Step 2 (Investment Analysis) or Step 3 (Barrier Analysis). (Project participants may also select to
complete both Steps 2 and 3.)
Step 2. Investment Analysis. This step is not selected.
Step 3. Barrier Analysis
If this step is used, determine whether the proposed project activity faces barriers that:
(a) Prevent a wide spread implementation of this activity and thus preventing the baseline scenarios from
occurring; and
(b) Do not prevent a wide spread implementation of at least one of the alternatives.
Use the following sub-steps:
Sub-step 3a. Identify barriers that would prevent a wide spread implementation of the proposed project
activity:
1. Establish that there are barriers that would prevent the proposed project activity from being carried out if the
project were not registered as a CDM activity. Such barriers may include, among others:
-Investment barriers, other than the economic/financial barriers in Step 2 above, e.g.:
o Real and/or perceived risks associated with the unfamiliar technology or process is too high
to attract investment…
6 For example, an alternative consisting of an open, uncapped landfill would be non-complying in a country where this
scenario would imply violations of safety or environmental regulations pertaining to landfills.

CDM-SSC-PDD (version 02)
CDM – Executive Board page 12
o Skilled and/or properly trained labour to operate and maintain the technology is not available,
leading to equipment disrepair and malfunctioning.
Barrier #1: This project will utilize several different kinds of biomass and will thus require the creation
of an elaborate system for biomass collection, storage and distribution from the ground up. Utilization
of a wide variety of biomass sources required to fulfil the fuel needs of this project from local biomass sources
carries a significant investment risk. First, no network presently exists to gather, prepare, purchase, and
transport biomass resources. Creating and managing this system which is dependent on the cooperation of
multiple small farmers and middle-men carries a significant financial risk. Second, if certain biomass stocks
that are currently projected to serve as fuel stocks are unavailable due to drought, pestilence, etc., the investors
will be forced to go further a field, look at more expensive biomass alternatives to fuel their boilers or more
likely shut down the plant. Thus, the key risks of this new system, including:
Delivery system will fail to produce adequate supply
Cost of delivery system will cause fuel prices to exceed expectations
Biomass stocks will not be successfully dried and stored to provide year round generation
Drought or pestilence will reduce biomass levels and force the plant to close
Project developers building a large fossil fuel based plant would not have this problem since the collection and
distribution system of fossil fuels already exists with years of experience delivering a quality fuel product at
somewhat stable prices. CDM revenues will help offset the cost of setting up and operating widely dispersed
biomass collection centers. Other requirements that the CDM revenues will help overcome include the
additional costs of increasing bulk density of fuels to transport, as well as the cost of transporting low bulk
density fuel.
Tamil Nadu does not have a trained transportation network to prepare and deliver the biomass products to the
power producer. Without a skilled network to produce, dry, store and deliver biomass, the plant will not be
able to operate. Fossil fuel plants and even to some degree other biomass plants that rely on bagasse, wood
waste, or rice husk already have access to an advance distribution network run by a highly-trained labour
force. The operators of this plant using biomass sources that have heretofore not been used for power
generation or other high end commercial uses have to develop fuel purchasing network, delivery and storage
system from the ground up. There will be additional costs and risks associated with this approach.
Barrier#2: Power Purchase Agreements (PPA) in India offered to independent power producers is
strongly biased in favour of the state power purchasing company. Thus, the purchaser can decide to lower
the price, despite having an agreement to the contrary in place. Not only does the language in the PPAs give
the power purchaser almost total decision-making control over price, but also in practice, power purchasers
have flatly ignored the terms of contract numerous times to the detriment of independent power producers.
While this adds a large uncertainty factor to any independent power producer, biomass producers with the new
and risky fuel-collection schemes – with prices that can fluctuate wildly depending on harvest levels – are
much more susceptible to the risk than fossil fuel producers. This can be seen graphically with biomass
producers in Andhra Pradesh where rice husk prices have more than doubled leaving many biomass producers
in difficult financial positions. Producers who rely on fossil fuels typically have more stable prices to deal with
and even when fossil fuels have price spikes, they are the same price spikes felt by many public utilities
making wholesale power price increases more likely.
While a power purchase agreement signed by an independent fossil fuel based generator may also lead to
similar problems dealing with the government power purchaser, the bandwidth for change in price will not
likely have as much impact on a fossil fuel producer. This is the case because most of the generation capacity
in the Southern India grid is fossil fuel based. A price spike in fuel will likely affect all plants using that fossil
fuel in a similar manner. This will likely force the state utilities to deal more leniently in changing tariffs since
the government cannot afford to have large number of power plants shut down or lose too much money. These

CDM-SSC-PDD (version 02)
CDM – Executive Board page 13
interests are likely to employ far more effective lobbyists for their cause with the government. There is
strength in size, economic clout and numbers.
Barrier #3: The wide variety of biomass fuels will create technical problems in maintaining and
operation of the power plant. The varied feedstocks will force maintenance shutdowns, fewer operating
hours and added costs for maintenance. The main fuels that will be used include Prosopis juliflora, rice husk,
coconut leaves and coconut shells.
Biomass fuels contain generally larger amounts of inherent moisture. The boiler furnace absorbs large amounts
of latent heat from the heat liberated in the furnace and finally leaves the boiler as water vapour causing a
substantial heat loss. Every 10% of moisture in the biomass leads to 3% loss in efficiency of the boiler.
Likewise higher hydrogen content in dry biomass also leads to increased moisture loss.
The only way to overcome the technical barriers from using such biomass fuels is to frequently shut down the
plant, change parts and restart after cleaning up slag deposition. This means that the project developers will
have fewer operating days and lower capacity factor compared to fossil fuel plants. With fewer operating
hours, less power can be sold to the grid and less income will be generated. The CDM revenues would
mitigate revenue losses from reduced production and increased maintenance costs, thus maintaining the rate of
return closer to that of a fossil fuel plant.
In contrast, the fuel sources needed for fossil fuel plants are more homogenous, dependable, and the technical
problems of their use have been worked out in thousands of fossil fuel plants world wide that operate under
similar conditions.
The developers lack both the experience and any body of previous knowledge to draw from to ensure
continuous operation without significant maintenance problems. The developer is likely often to be forced to
shut down operations and replace corroded parts and components encrusted with slag.
Though there are biomass plants already in operation in India, the technical know-how in using plants that
work on Prosopis juliflora is limited. The combustion characteristics of each combination of fuels are
different and indeed it is difficult to predict the outcome of particular mix that this plant is going to use. In
every sense, this plant is “one of a kind”.
Since the current financial analysis of the proposed project is based on the best estimates of downtime and
O&M costs without any experimental evidence backing it up, the increased risks of this first of its kind project
would hinder its implementation without the risk mitigation of CDM revenues.
The identified barriers are sufficient grounds for additionality only if they would prevent potential project
proponents from carrying out the proposed project activity were it not registered as a CDM activity.
Provide transparent and documented evidence, and offer conservative interpretations of this documented
evidence, as to how it demonstrates the existence and significance of the identified barriers. Anecdotal
evidence can be included, but alone is not sufficient proof of barriers.
Some of this evidence includes the following:
There are reports from Thermax and some AP & Rajasthan Biomass Plant Operators of corrosion
and slag formation in boilers from using various biomass fuels. (Please see PDD of the Rajasthan

CDM-SSC-PDD (version 02)
CDM – Executive Board page 14
Biomass Plant – available on request). As for availability, the project developers have completed
a demand-supply report of the specific area of the proposed biomass plant7.
No. Biomass Generation
(tonnes/annum)
Consumption
(tonnes/annum)
Surplus
(tonnes/annum)
1 Prosopis Juliflora 240,120 63,200 1,76,920
2 Acacia 23,000 11,000 12,000
3 Field Level Residues 43,000 3,000 40,000
4 Plantation residues 15,000 8,000 7,000
5 Industrial level residues 77,000 67,000 10,000
3,98,120 1,52,200 2,45,920
The company has identified the Prosopis juliflora, rice husk, cotton stalk and coconut within 50 km
radius of the plant. Prosopis juliflora is available on the eastern side (Santhankullam) and northeastern
side (Maniyachi) of the plant. The company is planning to establish stock depots for collection of
Prosopis juliflora from 10 km radius for transport to the plant.
Another key issue is to demonstrate that the most recent plants built in Tamil Nadu were fossil
fuel plants8. Public records of the most recent power plant construction in Tamil Nadu
demonstrate the predominant installation of fossil fuel plants. See Annexure 3C of http://mnes.nic.in/baselinerpt.htm
There are reports to show that AP biomass plant operators are not doing much to develop long
term sustainable sources like energy plantations or systematically developing a crop waste market.
Sub-step 3 b. Show that the identified barriers would not prevent a wide spread implementation of at least
one of the alternatives (excepted the proposed project activity already considered in step 3a):
3. If the identified barriers also affect other alternatives, explain how they are affected less strongly than they
affect the proposed CDM project activity. In other words, explain how the identified barriers are not
preventing a wide spread implementation of at least one of the alternatives. Any alternative that would be
prevented by the barriers identified in Sub-step 3a is not a viable alternative, and should be eliminated from
consideration. At least one viable alternative shall be identified.
7 The Fuel Assessment Study Report, prepared by Pulse India Advisory & Business Services Pvt. Ltd., Chennai, for
M/s Prathyusha Power Pvt. Ltd., indicates that there exists good potential for tapping Prosopis Julioflora for energy
generation purposes. The assessment study was conducted in 4 taluks in Tirunelveli District and included issues
related to topography, geomorphic features, land area classification, agricultural activity, etc. The assessment shows
that the indicated availability of Prosopis juliflora is about 3-4 tonnes per annum per hectare. More details are
available in the Fuel Assessment Report included in Annex 3. The generation in the study area has been estimated as
2,40,320 tonnes/annum, the consumption has been computed as 63,200 tonnes/annum, leaving the surplus
availability to be about 1,77,120 tonnes/annum. Apart from Prosopis juliflora an additional quantity of coconut
trashes, cotton stalk of 70,000 tonnes is available after local consumption. While the plant needs about 80,000
tonnes of biomass per annum, the gross availability is about 2,40,320 tonnes/annum.
8 During the year 2005-06, under the Central Sector, the fourth 500 MW unit was commissioned at Talcher Super
Thermal Power Station, Stage-II, by National Thermal Power Corporation (NTPC), from which TNEB is availing a
share of 136 MW. Under Private Sector M/s. Aban Power Company Ltd., have commissioned a gas based project
with a capacity of 113 MW in Karuppur in Thanjavur District. Under State Sector the Pykara Ultimate Stage Hydro
Electric Project with a capacity of 150 MW was commissioned in Nilgiris District.

CDM-SSC-PDD (version 02)
CDM – Executive Board page 15
The main barriers to the project involve the technical, investment, institutional and climatic risks associated
with procuring, delivering, and utilizing a wide variety of biomass in the region that will enable the plants to
run predominantly on biomass fuel from a specific region in Tamil Nadu. The alternative of providing power
by adding traditional fossil fuel plants rely on traditional, homogenous fossil fuels and their mature distribution
networks. These barriers therefore do not hinder their implementation.
If both Sub-steps 3a – 3b are satisfied, proceed to Step 4(Common Practice Analysis)
If one of the Sub-steps 3a – 3b is not satisfied, the project is not additional.
Step 4. Common Practice Analysis The above generic additionality tests shall be complemented with an analysis of the extent to which the
proposed project type (e.g. technology or practice) has already diffused in the relevant sector and region. This
test is a credibility check to complement the investment analysis (Step 2) or barrier analysis (Step 3). Identify
and discuss the existing common practice through the following sub-steps:
Sub-step 4a. Analyse other activities similar to the proposed project:
1. Provide an analysis of any other activity implemented previously or currently underway that is similar to the
proposed project activity. Projects are considered similar if they are in the same country and/or rely on a
broadly similar technology, are of a similar scale, and take place in a comparable environment with respect to
regulatory framework, investment climate, access to technology, access to financing, etc. provide quantitative
information where relevant.
The majority of biomass plants in India are sugar co-generation plants that rely on bagasse9. With a total
installed capacity of 315 MW as on 31.03.2006, (with exportable surplus of 183-MW) Tamil Nadu is leading in the
country. The present installed capacity under biomass power is only 37.5 MW (3 units) as on 31.3.2006. Source:
Policy Note – 2006 – 2007, TEDA.
Sub-step 4b. Discuss any similar options that are occurring:
There are other biomass plants in India, but they still are a small percentage of total installed capacity and
estimated biomass potential. These facilities have not gained clear common-practice status with investors, and
this proposed project is clearly different enough in design and scope to almost every other existing plant to
make its existence ‘uncommon practice’.
Sugar-Cogeneration is not comparable to the proposed project. The vast majority of biomass generation
comes from the sugar industry. Sugar cogeneration is a significantly different application of technology and is
not similar enough to compare with the project for the common-practice test. Unlike the technology employed
in the proposed project, sugar cogeneration:
Has a clear and easy link to its fuel supply main product line and the use of boiler heat, which also is
its main product line;
Generates electricity from the waste heat from its internal processes dedicated to producing sugar;
and
Uses considerable amount of its generation to operate its own facilities to produce sugar.
The proposed project plant differs for the following reasons.
It has no fuel supply under its direct control
Its fuel supply line needs to be developed from scratch
9 The scheme for producing steam from bagasse high pressure boilers in sugar mills and generating electricity for
export of surplus power to TNEB and using the low pressure steam after power generation for process has been
successfully implemented in Tamil Nadu. http://www.tn.gov.in/policynotes/energy.htm

CDM-SSC-PDD (version 02)
CDM – Executive Board page 16
The fuel sources it plans to use lack the global body of expertise that bagasse based generation can
benefit from
Its sole purpose is to provide electricity
It uses only a small amount of its electricity to run the generation facility
Other Biomass Plants- Homogenous Fuel Sources: There are other non-sugar cogeneration biomass plants,
but these too have significant differences with the plant proposed for this project. Most of the existing biomass
plants have one or two clear fuel sources: rice husks, waste wood, etc. These fuels are more homogenous in
make up and create fewer technical difficulties in boiler operations. In addition, most of these resources have
pre-existing networks of skilled labourers to produce, prepare and deliver the resources. In fact, a recent TERI
study on biomass potential in India cited lack of versatile technologies and expertise able to utilize a variety of
fuels as one of the key barriers to additional biomass generation in India.
Newly Realized Investment Risks Make Additional Investments Uncommon: Additional uncertainties in
the reliability of the investment in biomass plants have created a major impediment to biomass projects
attaining the status of common practice. For example, the State of Andhra Pradesh – one of the most advanced
non-sugar biomass states – has more than 40 units with over 266MW of capacity that rely predominately on
rice husks (and to a lesser extent, coconut logs, felled neem (only deadwood not harvested) and mango trees).
At least 30 of those plants have recently (March 2004) petitioned the government to take over the generation
facilities and repay the investors. The price of rice husks has increased several fold, and government
commitments concerning the price of power purchases have not been fulfilled according to the investors.
The track record set by these firms in AP and elsewhere does not bode well for other investors – making it
more difficult to finance the biomass projects. Large price fluctuations and unreliable partners in government
run power purchase, transmission and distribution companies make investing in biomass generation
uncommon for private investors. The existence of other biomass plants by themselves does not prove common
practice. Instead the existence of successful plants that provide reasonable returns on investment would
demonstrate common practice, and these conditions clearly are not common in India.
Finally, in Tamil Nadu, unique local factors have limited the investment in biomass (outside of sugar
cogeneration) in Tamil Nadu. The vast majority of biomass generation in Tamil Nadu comes from sugar
cogeneration.
2. If similar activities are widely observed and commonly carried out, it calls into question the claim that the
proposed project activity is financially unattractive (as contended in Step 2) or faces barriers (as contended in
Step 3). Therefore, if similar activities are identified above, then it is necessary to demonstrate why the
existence of these activities does not contradict the claim that the proposed project activity is financially
unattractive or subject to barriers. This can be done by comparing the proposed project to the other similar
activities, and pointing out and explaining essential distinctions between them that explain why the similar
activities enjoyed certain benefits that rendered it financially attractive (e.g., subsidies or other financial flows)
or did not face the barriers to which the proposed project is subject.
3. Essential distinctions may include a serious change in circumstances under which the proposed CDM
project will be implemented when compared to circumstances under which similar projects were carried out.
For example, new barriers may have arisen, or promotional policies may have ended, leading to a situation in
which the proposed CDM project would not be implemented without the incentive provided by the CDM. The
change must be fundamental and verifiable.
If Sub-steps 4.a and 4.b are satisfied, please go to step 5.
If Sub-steps 4.a and 4.b are not satisfied, the proposed CDM project activity is not additional.
Step 5. Impact of CDM Registration

CDM-SSC-PDD (version 02)
CDM – Executive Board page 17
Explain how the approval and registration of the project as a CDM activity, and the attendant benefits and
incentives derived from the project activity, will alleviate the economic and financial hurdles (Step 2) or other
identified barriers (Step 3) and thus enable the project to be undertaken. The benefits and incentives can be of
various types, such as:
Anthropogenic greenhouse gas emission reductions;
The financial benefit of the revenue obtained by selling the CO2-equiv emissions reductions,
Attracting new players who are not exposed to the same barriers, or can accept a lower IRR (for
instance because they have access to cheaper capital),
Attracting new players who bring the capacity to implement a new technology, and
Reducing inflation /exchange rate risk affecting expected revenues and attractiveness for investors.
The added revenue that CDM provides mitigates various risks associated with the barriers to implementation.
For example, the CDM revenue would partially compensate the risk of repairs or equipment changes required
by the high alkalinity or chloride in various crop feedstocks. The CDM credits also reduce the risk from
fluctuating prices and availability of local biomass sources by allowing the project developers more financial
flexibility in cases where biomass resources are unavailable. The CDM revenue also reduces the risk to the
project developer of creating the market and transportation system for fuels.
The financial analysis of how CDM can overcome/mitigate the unique risks associated with this project can be
seen in Appendix 2.
If Step 5 is satisfied, the proposed CDM project activity is not the baseline scenario.
If Step 5 is not satisfied, the proposed CDM project activity is not additional.
B.4. Description of how the definition of the project boundary related to the baseline methodology
selected is applied to the small-scale project activity:
As per the guidance in Appendix B, The project boundary encompasses the physical, geographical site of
the renewable generation source, the project boundary consists of the site encompassing the renewable
electricity generation source in Tuvarasi Village in Thirunelveli District, Tamil Nadu.
B.5. Details of the baseline and its development:
1.D Renewable Electricity Generation for the Grid
* Baseline Emissions = (kWh produced by renewable biomass * grid electricity emissions factor) - (kWh
produced by co-firing coal * (coal emission factor - electricity grid emission factor)
Year1 Year 2 Year 3 Year 4 Year 5 Year 6 Year 7 Year 8 Year 9 Year 10
Kwh Produced by renewable biomass
64,320,000 68,340,000 72,360,000 72,360,000 72,360,000 72,360,000 72,360,000 72,360,000 72,360,000 72,360,000
Carbon Emissions factor (kgCO2/kwh)
0.75
0.75
0.75
0.75
0.75
0.75
0.75
0.75
0.75
0.75
Kwh Produced by Coal
3,216,000
3,417,000
3,618,000
3,618,000
3,618,000
3,618,000
3,618,000
3,618,000
3,618,000
3,618,000

CDM-SSC-PDD (version 02)
CDM – Executive Board page 18
CO2 Emissions from Coal
1.08
1.08
1.08
1.08
1.08
1.08
1.08
1.08
1.08
1.08
Baseline Emissions (Tonnes CO2) *
47179 50127 53076 53076 53076 53076 53076 53076 53076 53076
Where the carbon emissions factor is the weighted average of the current generation mix in Tonnes of
CO2equiv per kwh based on the best current data (see below) and will be recalculated each year to
provide a more accurate calculation. The weighted average is used as opposed to the average of the
“approximate operating margin” and the “build margin” because publicly available data on the build
margin could not be found. The project developers checked various key websites and other similar
project efforts and could not find the appropriate data. For example, a TERI report funded by the
Ministry of Non-Conventional Energy Sources to help CDM project developers also lacked data on the
build margin as plant heat rate data and other key factors was apparently not available to them either.
(http://mnes.nic.in/baselinerpt.htm). If better data becomes available the project developer will work with
its DOE to ensure the most accurate and appropriate method is used.
Southern Grid Generation State Total GWH from all Sources Total CO2 Emissions in Tonnes
Andhra Pradesh 47388 41681637
Karnataka 22297 9496540
Kerala 8706 947046
Tamil Nadu 41985 38470625
Pondicherry 232 112687
120608 90708535
kg CO2 /kwh 0.752094
Source: http://mnes.nic.in/baselinerpt.htm
Carbon Emission Factor = total kgCO2 / Total kWh = 38,470,625,000/41,985,000,000 = 0.7521
Date of completing the final draft of this baseline section: 28/08/06
Name of person/entity determining the baseline:
Ms. Manvel Alur
India Director – Quality Tonnes, USA and
Founder, Environmental Synergies in Development (EnSYDE)
298, 5th Main, 1
st Block, Koramangala
Bangalore 560034
Tel: +9845176883
Email: [email protected]
SECTION C. Duration of the project activity / Crediting period:
C.1. Duration of the small-scale project activity:

CDM-SSC-PDD (version 02)
CDM – Executive Board page 19
C.1.1. Starting date of the small-scale project activity:
30th
October 2006
C.1.2. Expected operational lifetime of the small-scale project activity:
15 y-0m
C.2. Choice of crediting period and related information:
Fixed
C.2.1. Renewable crediting period:
NA
C.2.1.1. Starting date of the first crediting period:
NA
C.2.1.2. Length of the first crediting period:
NA
C.2.2. Fixed crediting period:
10 years
C.2.2.1. Starting date:
November 15th
, 2006
C.2.2.2. Length:
10y-0m
SECTION D. Application of a monitoring methodology and plan:
D.1. Name and reference of approved monitoring methodology applied to the small-scale project
activity:
1D. Renewable Electricity Generation For a Grid
D.2. Justification of the choice of the methodology and why it is applicable to the small-scale
project activity:
As per the guidance given by project category I.D., this project uses renewable biomass and supplies
electricity to the grid that is currently supplied by more than one generating unit using fossil fuels.
CDM-SSC-PDD (version 02)
CDM – Executive Board page 20
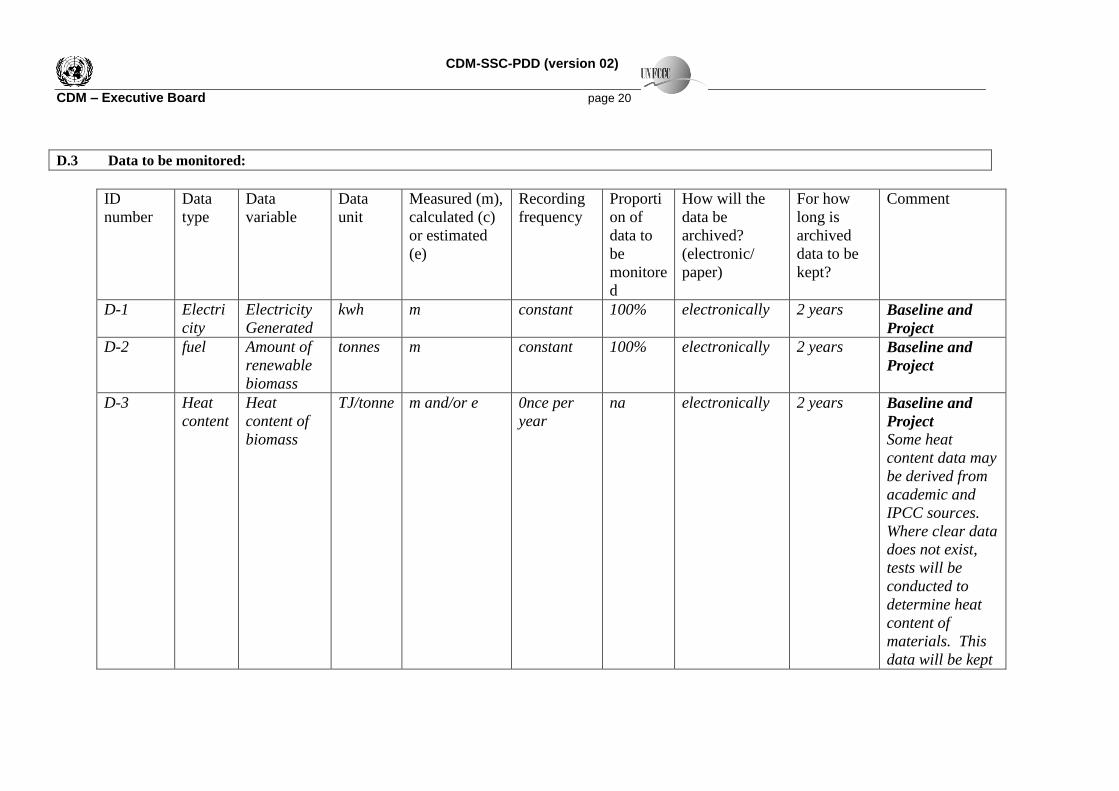
D.3 Data to be monitored:
ID
number
Data
type
Data
variable
Data
unit
Measured (m),
calculated (c)
or estimated
(e)
Recording
frequency
Proporti
on of
data to
be
monitore
d
How will the
data be
archived?
(electronic/
paper)
For how
long is
archived
data to be
kept?
Comment
D-1 Electri
city
Electricity
Generated
kwh m constant 100% electronically 2 years Baseline and
Project
D-2 fuel Amount of
renewable
biomass
tonnes m constant 100% electronically 2 years Baseline and
Project
D-3 Heat
content
Heat
content of
biomass
TJ/tonne m and/or e 0nce per
year
na electronically 2 years Baseline and
Project
Some heat
content data may
be derived from
academic and
IPCC sources.
Where clear data
does not exist,
tests will be
conducted to
determine heat
content of
materials. This
data will be kept

CDM-SSC-PDD (version 02)
CDM – Executive Board page 21
in case fossil fuel
back-ups are
used even though
this is not
planned for this
project.
D-4* fuel Amount of
fossil
fuel(s)
Tonnes
coal, m3
gas, etc.
m constant 100% electronically 2 years Baseline and
Project
The project
developer is not
planning to use
any fossil fuels in
the plant, but if
for some reason
(drought, fuel
shortage, etc.)
Emission
coefficients for
fossil fuels will
be taken from
IPCC defaults
unless better
data exists.
D-5* Heat
content
Heat
content of
fossil fuel
TJ/ unit
specifie
d in D-4
e Once per
year
na electronically 2 years Baseline and
Project
The project
developer is not
planning to use
any fossil fuels in
CDM-SSC-PDD (version 02)
CDM – Executive Board page 22
the plant, but if
for some reason
(drought, fuel
shortage, etc.)
The heat content
of fossil fuel will
be taken from
purchase records
and other data
provided by the
fossil fuel
supplier. In rare
cases where data
is not available,
IPCC defaults
will be used.
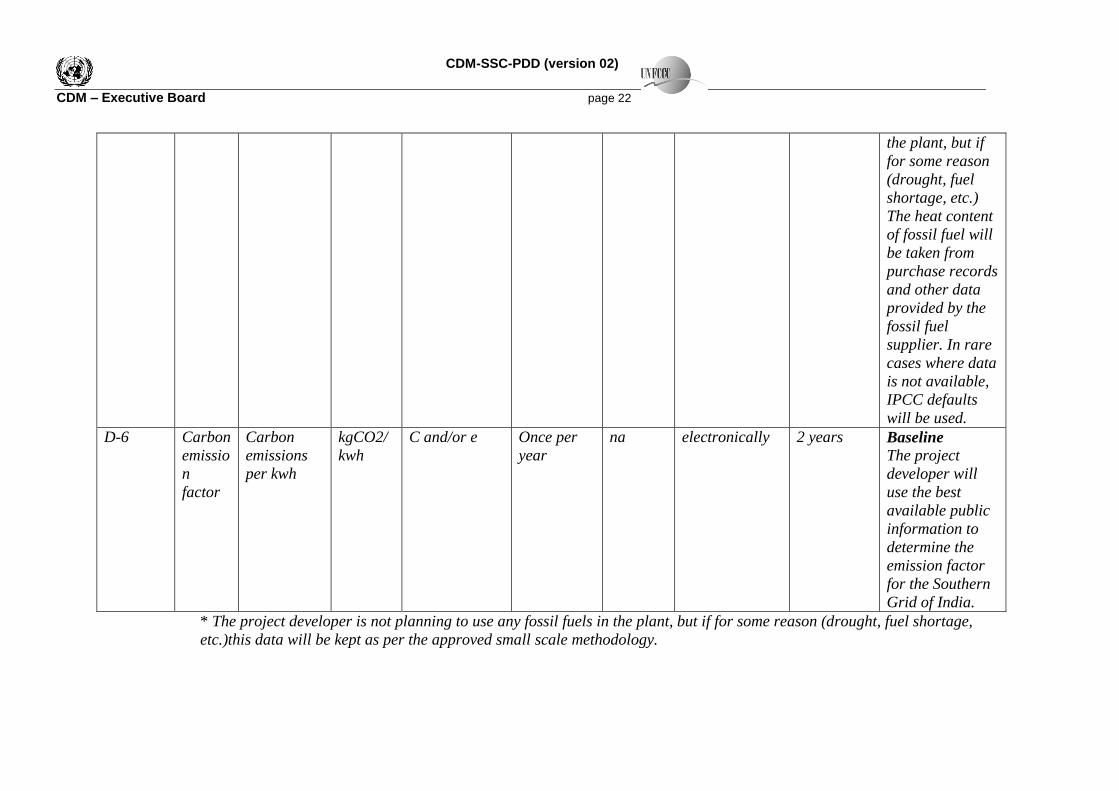
D-6 Carbon
emissio
n
factor
Carbon
emissions
per kwh
kgCO2/
kwh
C and/or e Once per
year
na electronically 2 years Baseline
The project
developer will
use the best
available public
information to
determine the
emission factor
for the Southern
Grid of India.
* The project developer is not planning to use any fossil fuels in the plant, but if for some reason (drought, fuel shortage,
etc.)this data will be kept as per the approved small scale methodology.

CDM-SSC-PDD (version 02)
CDM – Executive Board page 23
D.4. Qualitative explanation of how quality control (QC) and quality assurance (QA) procedures
are undertaken:
Quality Assurance Measures for data
D-1 Electricity Generation will be measured by advanced, tamperproof and sealed meters. These
will include back up meters and will be checked and verified under the rules set out by
TNEB. The meters will be checked continuously for operability and will be checked and
calibrated as per the manufacturers specification or TNEB requirements. The electricity sales
data to TNEB will be officially invoiced and these records will be kept for verification.
D-2 Tonnage of biomass will be measured and recorded on official invoices at point of
transaction with farmers and middlemen. These records will be kept and made available as
needed.
D-3 In case fossil fuel is used, the heat content of the biomass used will be measured using
internationally accepted methods and the results will be recorded electronically for two years.
The results would be used only in the unlikely event that some fossil fuels are used to
determine the share of electricity generation from the biomass.
D-4 Would be derived from purchase receipts provided in accordance with appropriate Indian
law.
D-5 Would be derived from purchase receipts. The fossil fuels at the time of purchase are clearly
identified by heat content (grade system used for coal, etc.)
D-6 Will use most recent publicly available sources and provide citations of sources.
D.5. Please describe briefly the operational and management structure that the project
participant(s) will implement in order to monitor emission reductions and any leakage effects
generated by the project activity:
The monitoring program will be relatively straight forward. The generation output of the plant will be
closely metered and monitored. These data will be maintained as part of the contractual arrangement with
the power purchaser. This data will be placed in an electronic database along with pertinent calculations
of carbon emission factors for easy review for verification. All fuel entering the system will be weighed
as part of normal operations so any unforeseen fossil fuel requirements will be measured at point of
purchase as well. There should be no leakage since the equipment will be purchased new and since this is
a new plant there is no existing equipment.
D.6. Name of person/entity determining the monitoring methodology:
Ms. Manvel Alur
India Director – Quality Tonnes, USA and
Founder, Environmental Synergies in Development (EnSYDE)
298, 5th Main, 1
st Block, Koramangala
Bangalore 560034
Tel: +9845176883
Email: [email protected]

CDM-SSC-PDD (version 02)
CDM – Executive Board page 24
SECTION E.: Estimation of GHG emissions by sources:
E.1. Formulae used:
Only reductions of CO2 are being claimed from avoided fossil fuels combusted in electricity generation.
The formula used to determine the greenhouse gas emission reductions for each project year is simply the
Baseline emissions minus the emissions from the renewable electricity source, which equal zero.
Baseline Emissions year x – 0 = greenhouse gas emission reductions in kg of CO2eqiv in year x
Baseline emissions in project year x = kWh produced by the renewable generating unit (in a given year)
multiplied by an emission coefficient (measured in kg CO2equ/kWh) (for that same year)
Or
Baselinex= kwhx * CECx
Where
Year X=project year
CEC = carbon emission coefficient (kg CO2/kwh)
Where
CEC= the weighted average emissions (in kg CO2equ/kWh) of the current generation mix.
E.1.1 Selected formulae as provided in appendix B:
Only CO2 emissions will be calculated based on the reduction of fossil fuel combustion resulting from
the introduction of renewable electricity generated on the electricity grids. The project developer will
measure the kWh produced using renewable biomass fuels each project year. The project developer will
record this data and also use the best available public data to calculate the carbon emission coefficient
(CEC). The project developer will then multiply the total kWh generated by the CEC to get the total
baseline emissions for the project year. The generation of renewable electricity constitutes zero
emissions. Based on the definitions in this methodology, there will be no leakage since the equipment
will be new and no existing equipment will be moved. Therefore, the emission reductions will simply be
the baseline emissions minus zero.
E.1.2 Description of formulae when not provided in Appendix B:
In cases where co-firing of fossil fuels is required (this is not planned by the project developer, but could
be necessary under certain circumstances), the project developer will measure the weight and heat content
of all fuels. In order to ensure that only electricity from renewable sources is being counted for emission
credits, the project developer will then determine what percentage of the heat content being used to
produce electricity is from renewable sources. Only the percentage of electricity generated using
renewable fuel will be counted as renewable electricity.
(Renewable fuel mass * renewable fuel heat content)
(Renewable fuel mass * renewable fuel heat content) + (fossil fuel mass * fossil fuel heat content)

CDM-SSC-PDD (version 02)
CDM – Executive Board page 25
Note in cases where more than one renewable fuel or fossil fuel is used, the calculation for the pertinent
section will be a summation of the total mass of each fuel multiplied by its heat content.
E.1.2.1 Describe the formulae used to estimate anthropogenic emissions by sources of GHGs due to
the project activity within the project boundary:
The project activity involves generating electricity from a renewable energy source (renewable biomass),
which will have zero project emissions.
E.1.2.2 Describe the formulae used to estimate leakage due to the project activity, where required,
for the applicable project category in Appendix B of the simplified modalities and procedures for
small-scale CDM project activities
The methodology calls for the calculation of leakage only where the equipment is transferred from
another activity or if the existing equipment is transferred to another activity. Neither of these is the case
for this project so no leakage will occur as per the approved methodology
E.1.2.3 The sum of E.1.2.1 and E.1.2.2 represents the small-scale project activity emissions:
There will be no project activity emissions for this renewable electricity generation project.
E.1.2.4 Describe the formulae used to estimate the anthropogenic emissions by sources of GHGs in
the baseline using the baseline methodology for the applicable project category in appendix B of the
simplified modalities and procedures for small-scale CDM project activities:
Baseline emissions = kWh produced by renewable biomass * carbon emissions factor (kgCO2equiv/kwh)
And
Where the carbon emissions factor is the weighted average of the current generation mix in Tonnes of
CO2equiv per kwh based on the best current data (see below) and will be recalculated each year to
provide a more accurate calculation.
Southern Grid Generation Southern Grid Total GWH from all Sources Total CO2 Emissions in Tonnes Andhra Pradesh 47388 41681637
Karnataka 22297 9496540
Kerala 8706 947046
Tamil Nadu 41985 38470625
Pondicherry 232 112687
120608 90708535
kg CO2 /kwh 0.752094
Source: http://mnes.nic.in/baselinerpt.htm
Carbon Emission Factor = total kgCO2 / Total kWh = 38,470,625,000/41,985,000,000 = 0.7521

CDM-SSC-PDD (version 02)
CDM – Executive Board page 26
E.1.2.5 Difference between E.1.2.4 and E.1.2.3 represents the emission reductions due to the project
activity during a given period:
The formula used to determine the greenhouse gas emission reductions is simply the Baseline emissions
minus the emissions from the renewable electricity source, which equal zero.
Baseline Emissions – 0 = greenhouse gas emission reductions in Tonnes of CO2eqiv
E.2 Table providing values obtained when applying formulae above:
Year1 Year 2 Year 3 Year 4 Year 5 Year 6 Year 7 Year 8 Year 9 Year 10
Kwh Produced by renewable biomass
64,320,000 68,340,000 72,360,000 72,360,000 72,360,000 72,360,000 72,360,000 72,360,000 72,360,000 72,360,000
Carbon Emissions factor (kgCO2/kwh)
0.75
0.75
0.75
0.75
0.75
0.75
0.75
0.75
0.75
0.75
Kwh Produced by Coal
3,216,000
3,417,000
3,618,000
3,618,000
3,618,000
3,618,000
3,618,000
3,618,000
3,618,000
3,618,000
CO2 Emissions from Coal
1.08
1.08
1.08
1.08
1.08
1.08
1.08
1.08
1.08
1.08
Baseline Emissions (Tonnes CO2) *
47179 50127 53076 53076 53076 53076 53076 53076 53076 53076
SECTION F.: Environmental impacts:
F.1. If required by the host Party, documentation on the analysis of the environmental impacts of
the project activity:
Biomass generation had been identified by the Indian Government as a desirable source of electricity.
For much of country, coal is the predominant source of electricity. Burning coal for electricity has many
negative environmental air and water quality impacts- from mercury, SO2, NOx, and particulates that
affect local air quality and water quality to CO2, which India as a signatory of the Kyoto Protocol
recognizes as a contributor to global climate change. Biomass is considered a more benign fuel on air
quality and a climate neutral fuel since the fuel stock absorbs the same amount of carbon that was
released in the previous year.
While an environmental impact assessment is not necessary for this project, M/s Prathyusha Power
commissioned M/s Sainath Envirotech to conduct an Environmental management Plan for the Biomass
Plant. The company has received the following statutory clearances:
Environmental clearance by the Tamil Nadu Pollution Control Board
Permission to start generation of power from Tamil Nadu Electricity Board

CDM-SSC-PDD (version 02)
CDM – Executive Board page 27
Building plan approved from Local Development Authority of Thirunelveli headed by the
District collector
Inspector of Factories approval
Ground water usage clearance from State Government
Boiler inspectorate approval
Fire services approval to be obtained
Power Purchase Agreement with TNEB
The highlights of the EMP include:
The boiler is equipped with an Electrostatic Precipitator (ESP) which will remove the dust and
ash particles from the flue gas
The combustion air to the grate is supplied from the bottom plenum hoppers. The air is controlled
by the air dampers.
The discharge end of the grate discharges the ash into a water impounded hopper. Ash collected
from the air heaters and ESP Hoppers are transported through separate screw conveyors and fed
to the common belt conveyor. The belt conveyor dumps the ash into the ash silo.
Effluents are generated from following sources in the plant:
No. Source of Effluent Quantity (KLD)
1 DM Plant 12.0
2 Blowdown from boiler 25.2
3 Blowdown from cooling towers 290.4
Total effluent 327.6
4 Sewage 4
The plant will:
DM rejects after neutralization is highly concentrated and TDS level is enormous
Boiler blowdown water has high temperature and alkaline in nature
Cooling tower blowdown water is alkaline
From the above observations, it is intended that the different streams of effluent can be treated to
acceptable standards by adopting flow equalization and neutralization.
Environmental aspects, which will have impact on air pollution, are:
Boiler emissions
Dust in fuel handling and feeding zones
Fly ash and bottom ash disposal
The plant will provide one stack to its boiler, of 50 m high for effective dispersion and dilution of the
emission in the ambient atmosphere.
Biomass fuel does not have any sulphur in it and hence no Sox will be produced. NOx also will not be
produced. The ESP provided will remove dust and ash particles from the flue gas.
The fuel handling and feeding zones are other avenues of dust generation. These are filled with cyclone
separators with dust collectors.

CDM-SSC-PDD (version 02)
CDM – Executive Board page 28
The ash (fly and bottom) generated in the plant will be managed within the plant site in engineered
landfills.
India has a large agricultural sector that has many waste products that often are unused and can
decompose creating methane emissions. Biomass electricity generation can utilize these waste products
and effectively use them as feedstock. Since these resources are the unused portion of the agricultural
sector, they are self-sustaining and should not place any additional burden on the existing resource base of
the country.
Specifically, the Designated National Authority for CDM activities in India has stipulated the following
criteria for sustainable development projects that should be meet for project approval in India. Following
aspects should be considered while designing CDM project activity:
Social well being: The CDM project activity should lead to alleviation of poverty by generating
additional employment, removal of social disparities and contribution to provision of basic amenities to
people leading to improvement in quality of life of people.
This project provides opportunities for local employment and revenue generation, which will help in
alleviating poverty. Many of the farmers from which the raw material will be procured are small farmers,
thereby providing an opportunity over a long period of time to assist in increasing their income levels.
Economic well being: The CDM project activity should bring in additional investment consistent with the
needs of the people.
The project will help alleviate the current power deficit situation thereby adding to the economic
wellbeing of the community. With the increase in the need for biomass raw material, local farmers will
have a more secure revenue stream to help reduce rural poverty. In addition, local employment will be
generated by the generation plants themselves.
Environmental well being: This should include a discussion on impact of the project activity on resource
sustainability and resource degradation, if any, due to proposed activity; bio-diversity friendliness;
impact on human health; reduction of levels of pollution in general.
The power plants will only be using biomass as a fuel and appropriate combustion technologies greatly
reducing their contribution to atmospheric pollution vis-à-vis fossil fuel generation. In addition, the
project will encourage the use of biomass wastes, which may have generated methane emissions as they
decayed. The project helps convert the waste into a resource, adding to the sustainability of the project
and the local environment.
Technological well being: The CDM project activity should lead to transfer of environmentally safe and
sound technologies that are comparable to best practices in order to assist in upgradation of the
technological base.
Biomass based power generation is not common in India. This project which uses tested technology with
seldom used biomass feed stocks. If successful, it will help to establish the feasibility and reliability of the
project throughout the country.

CDM-SSC-PDD (version 02)
CDM – Executive Board page 29
SECTION G. Stakeholders’ comments:
G.1. Brief description of how comments by local stakeholders have been invited and compiled:
The key stakeholders in this project will be the suppliers and transporters of biomass. M/s Prathyusha
Power has already begun developing supply network links surveying their interest and identifying any
concerns. The local farmers will be the key set of stakeholders as the neighbours to plants and the main
fuel source. The project also has been presented, discussed and accepted by local and state government
stakeholders.
The process for inviting comments has basically been part of an outreach effort to develop the supply
network. Groups of potential biomass suppliers have been approached about potential cooperation.
Issues such as types of biomass, quality, quantity, transportation, sales, and compensation have been
discussed and M/s Prathyusha Power solicited feedback. The initial feedback process has been
completed, but the company plans on continually garner additional comments and suggestions as the
project moves toward completion and operation.
M/s Prathyusha has approached the locally formed associations for parting with the biomass and the
negotiations are on-going for supply of materials such as coconut branches, fronds, etc. directly.
The company is going to send more information on this
G.2. Summary of the comments received:
The potential participants in the proposed biomass collection scheme have voiced exclusively positive
feedback and approval in this initial process and were mainly looking for more detail on how the business
transaction would take place.
The company is going to send more information on this
G.3. Report on how due account was taken of any comments received:
The main comments were based on how the business transaction would take place for the biomass fuels
and steps were taken to inform pertinent stakeholders to set up the network based on locally acceptable
business practices.

CDM-SSC-PDD (version 02)
CDM – Executive Board page 30
Annex 1
CONTACT INFORMATION ON PARTICIPANTS IN THE PROJECT ACTIVITY
Organization: M/s. Prathyusha Power Private Limited
Street/P.O.Box: # 10 Sarangapani Street, T Nagar
Building: # 5 Archana Apartments,
City: Chennai
State/Region: Tamil Nadu
Postcode/ZIP: 600017
Country: India
Telephone: + 044 28344882
FAX: + 044 28340220
E-Mail: [email protected]
URL:
Title:
Salutation:
Last Name:
Middle Name:
First Name:
Department:
Mobile:
Direct FAX:
Direct tel:
Personal E-Mail:
Annex 2
INFORMATION REGARDING PUBLIC FUNDING
No Public Funding was used for this project
- - - - -