Embed Size (px)
Citation preview

Sippy Downs Off-Ramp –Surface Friction Learnings

2
Background

3
Background
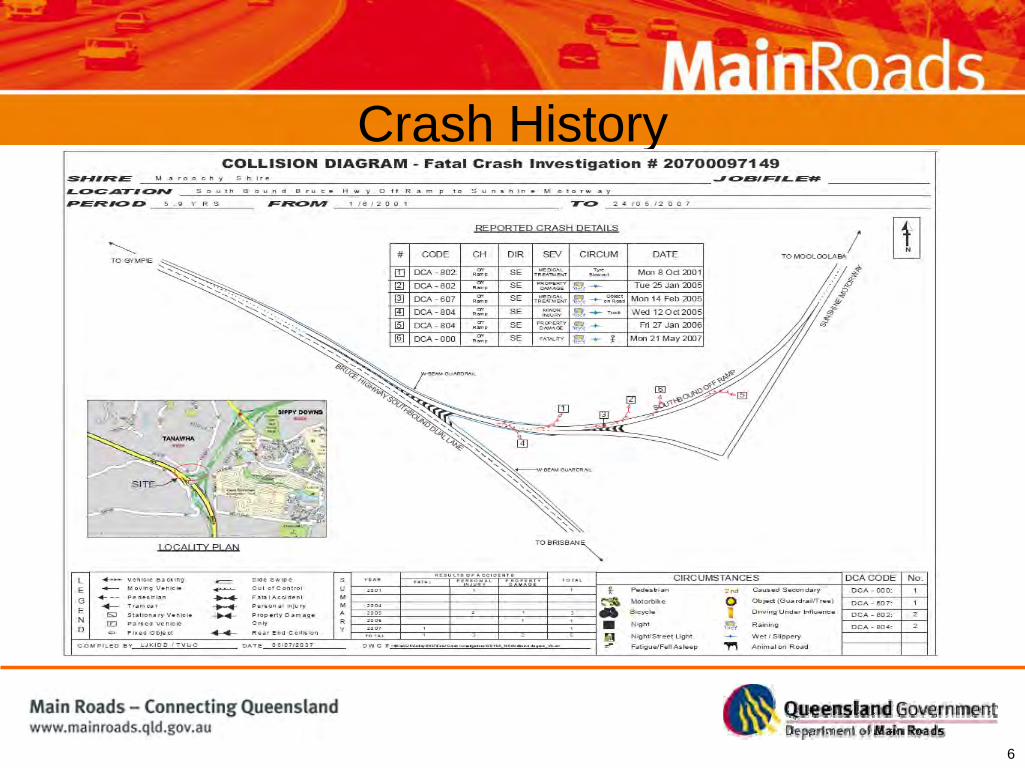
• 21 May 2007 - two sequential south-bound vehicles lost control on off-ramp in light rain
• Ramp surfaced with SMA in October 2000 (over spray seal)
SITE
N

4
Main Roads Investigation
• the standard crash investigation report carried out by North Coast-Hinterland District (undertaken following every fatal crash);
• a specialist investigation into the roadway geometry where the crash occurred undertaken by Road Planning and Design Branch;
• a specialist investigation into the ramp surface skid resistance characteristics undertaken by Pavements and Materials Branch; and
• in-vehicle skid tests conducted by QPS
Report (published on Main Roads web-site), draws conclusions from a number of Main Roads investigations:

5
Design and Construction History• The Sunshine Motorway was constructed in 1990 (the
interchange was designed in 1987 and constructed in 1989).
• At the time, the posted speed limit on the Bruce Highway was 100 km/h.
• Speed limit increased to 110 km/h in 1993.
• Off-ramp lengthened in May 2000.
6
Crash History

7
Ramp Geometry• 3% ramp cross-fall adopted (instead of 6% which would
have generally been used at the time), due to secondary diverge roadway and the cross-fall on the highway leading to the off-ramp.
• Based on the 3% cross-fall, and ramp design speed of 80 km/h, a curve radius of 204m was adopted.
• Ramp gradient - maximum down-grade of 7% (av. 5%)• The horizontal and vertical geometry limits the distance
ahead to which an approaching driver, in a sedan, can view the roadway of the ramp, to 84m.
• An 80 km/hr advisory exit sign was installed (tests concluded it should have been signed as 70 km/h).

8
Ramp Geometry - Conclusions• The design was largely consistent with common design
practice of the era.• No geometric issues were of a type that could be
deemed to be a design error and experience shows that none are of a type that would significantly increase crash rates.
• It was noted that the ramp configuration requires drivers to pay attention and, in some circumstances, to brake and corner heavily. This would be a significant contributor to differential polishing of the aggregate (which became evident in the surface friction tests).

9
Crash - Eye-witness Account• An eye-witness to the crash reported (to QPS) the
appearance of an oil-like film in the outer wheel path on the road surface where the second vehicle lost control.
• The outer wheel path is significant because there is weight transfer to the outer wheels when cornering and therefore greater reliance on the friction available there.

10
Surface Characteristics and Testing• SMA aggregate sourced from Moy Pocket quarry.
Quarry PAFV results ranged from 45-46 (MR specifies a minimum value of 45).
• The asphalt mix was manufactured using Boral’s mobile plant.
• The pavement surface was tested with:–the network level ROAR skid tester; and–the Multi-Laser Profilometer.
• Selected sections were also assessed with:–the Sand Patch texture depth test; and–the British Pendulum test.

11
Sand Patch Texture Depth Test Results
Conclusion: Results significantly greater than the typical texture depths for SMA and the investigation levels in Austroads "Guide to the Selection of Road Surfacings". (The one low result was only 0.01 mm less than the worst interpretation of Austroads requirements).

12
Laser Texture Depth Test Results
Conclusion: All results significantly greater than the typical texture depths for SMA and exceed Austroads investigation levels.

13
ROAR Skid Tester Results
Conclusion: skid resistance exceeds investigation levels (more detailed investigation notwarranted)
14
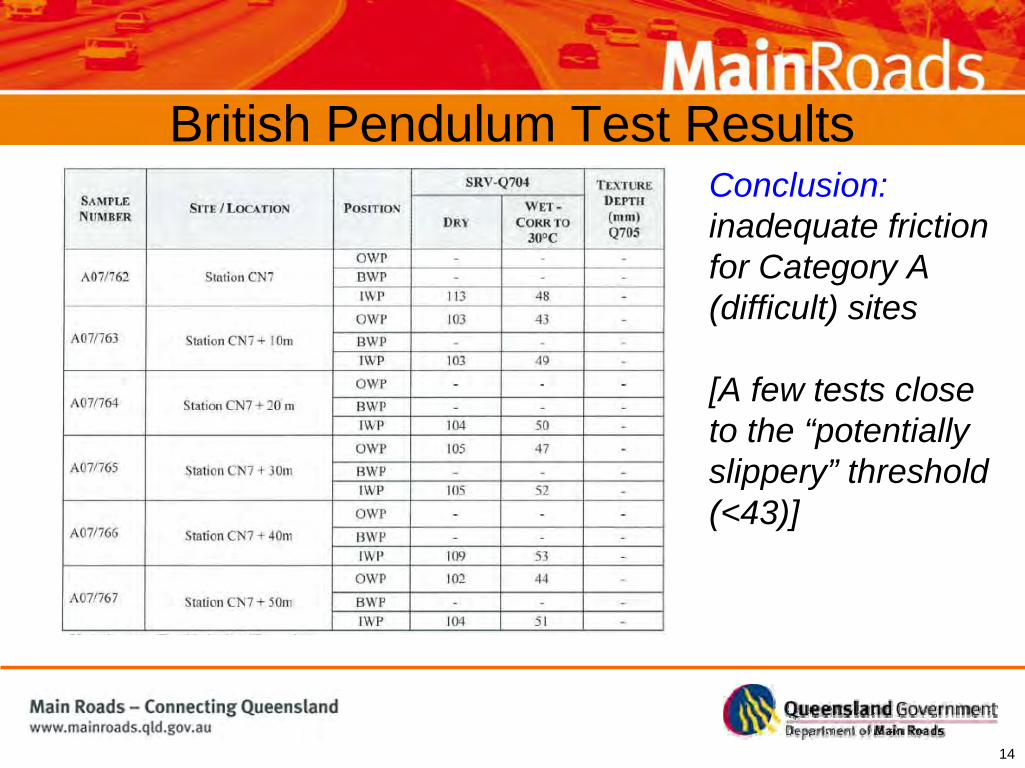
British Pendulum Test ResultsConclusion:inadequate friction for Category A (difficult) sites
[A few tests close to the “potentially slippery” threshold (<43)]

15
QPS Friction Tests - Procedure• Officers from the Forensic Crash Unit conducted skid
resistance tests using a standard Holden sedan patrol vehicle fitted with a Vericom VC3000, which records lateral and longitudinal acceleration (as a function of ‘g’). These ‘g factor’ coefficients can be shown to equate to the coefficient of friction (f), which is used in geometric design.
• The vehicle's anti-skid braking system was disconnected during the tests to allow the tyres to lock and slide. Skid testing on the ramp was undertaken as follows:
• 5 dry surface tests (at various points along the ramp)• 10 wet surface tests

16
QPS Friction Tests - Curve Considerations• On a curve, both lateral and longitudinal friction
demands need to be considered (particularly where braking is likely). The resultant total friction demand is the vector sum of lateral and longitudinal friction demands.

17
QPS Friction Supply Tests - Interpretation

18
QPS Friction Tests - Supply vs Demand
Conclusion: There is not a significant margin of safety for a vehicle travelling at 70km/h in the wet and applying its brakes whilst negotiating the curve. Factor of safety = 0.49/0.44 = 1.11

19
Surface Characteristic Test SummaryFriction tests:• Network level ROAR skid tester - OK• British Pendulum test - lower than UK requirement for
Category A (difficult) sites, some locations approaching “potentially slippery”
• QPS accelerometer tests - small margin of safety (11%) for a vehicle travelling at 70km/h in the wet and applying its brakes
Other tests:• Sand Patch texture depth test - OK• Laser Texture Depth, Rut Depth and Roughness - OK

20
Main Roads Conclusions• The ramp design is satisfactory for the requirements placed
upon it (crash history shows the vast majority of motorists havebeen able to negotiate the ramp without incident).
• Speed monitoring indicates that 225,000 vehicles/yr safely traverse the ramp at speeds in excess of 80 km/h – strongly suggesting that there may have been some unusual factor present at the time of the crash for two vehicles to lose control in close succession.
• The ramp configuration does require drivers to brake on the approach to (or within) the curve, with resultant differential polishing of the aggregate. Consequently, the surface friction,while adequate in dry conditions, is now marginal in the wet.
• The available friction factor of safety (1.11) was ‘lost’ with the introduction of a surface contaminant.
21
‘Learnings’ of relevance to surfacing - 1• Interpretation guidelines/investigatory levels for the existing
suite of friction testing methods need review (or other testing devices need to be considered).
• Vericom dual-axis acceleration measuring equipment used by QPS provides (for the 1st time) a meaningful ‘connection’ between geometric design considerations (friction demand) and pavement surface characteristics (friction supply). Given it is now used for crash investigation/reconstruction purposes by enforcement agencies, MR may also need to adopt it (particularly in more demanding road environments, which are not represented by ‘broad’ investigatory friction levels).

22
‘Learnings’ of relevance to surfacing - 2• A review of pavement design specifications is required to
ensure, in areas of roadway with increased surface friction demand, that better performing aggregates (with higher polished aggregate friction values) are specified.