Embed Size (px)
Citation preview

Single Cell Proteomics:A Challenge of Knowing Too Much.
Garry P. Nolan, Ph.D.Stanford University
Dept. of Microbiology & Immunology
The complexSignaling Phenotypes
of Individual Cells

Early Single Cell Proteomics Innovators
Len Herzenberg - - Argon laser flow sorter 1972 - placed an argon laser onto their sorter and successfully did high speed sorting - Coined the term Fluorescence Activated Cell Sorting (FACS)
Photo ©2000 – J.P. Robinson
Mack Fulwyler - Coulter Electronics manufactured the TPS-1 (Two parameter sorter) in 1975 which could measure forward scatter and fluorescence using a 35mW argon laser.
Howard Shapiro: Block instruments (1973-76) -a series of multibeam flow cytometers that did differentials and multiple fluorescence excitation and emission.

Multi-Color Flow Cytometry
• Multiple independent measurements per cell Down to 50-200 molecules per cell. Dynamic range 4-5 log.
100,000 cells per second (sorting as well)
Current ‘standard’ (8-13 parameters); Mario Roederer (17-19)
Data Standards for file format since 1984. Current is FCS 3.0
• Combines complex immunophenotypic analysis with functional analysis (intracellular biochemical events)
Detailed characterization of rare subsets (e.g., antigen-specific T cells)
Identify new subsets more specifically associated with mechanism and clinical parameters
• Largely unappreciated in much of molecular biology– 11 parallel assays (classic) is NOT the same as 11 simultaneous measurements.

Single Cell Analysis in Drug Discovery
TargetID/Validation
HitDiscovery
Pre-ClinicalLead Development
Clinical TrialsPh1 Ph2 Ph3
Drugs
•Pathway mapping•Target Validation
•Primary screening assays
•cell-based•primary cells
•Secondary Assays•Specificity Assays•Animal models
•Novel biomarkers•Patient stratification

From phospho-molecular profiling to Signaling pathways
High throughput dataRa
fEr
kp3
8
PKA
PKC
Jnk
PIP2
PIP3
Plcγ
Akt
...
Cell x
Cell1
Cell2
Cell3
Cell4
Signaling Pathways
Flow Measurments

Single Cell Standards Issues to consider
• # of simultaneous parameters to measure• Absolute vs relative (qualitative vs quantitative)• Baseline fluorescence standards (quantitative)
• How does one FIND an informational ‘blob’ in n-space (feature extraction)?
• How does one represent such a 20-dimensional object?
• How does one apply such knowledge from flow cytometry to 3D imaging (confocal, other cytometry)?
• How does one deal with solid tissue slice (tissue biopsies)
• SOPs for sample handling?

Why use Single Cells to Measure Cell events?• Traditional
Population analysisHomogeneous cell type: sorting, depletionRequire relatively large numbers of cells• In vitro derived
cultures• Cell lines
Time consuming, not easily scaled up
• Flow Cytometry
Single cell analysisHeterogeneous populations can be separated via surface markersCan analyze rare cell subsets in native form• Primary cells sufficient• DC = <1% of splenocytes
Rapid, scalable to hundreds of samples

Pulses to Numbers
14 bit ADC10 MHz
Continuous
4-log data
To HostComputer
Source: Linear Signal
∫ −=β
α
bxarea
α β
x = value, b = background
Onboard Digital Processing
32 bit floats
• Advantages of new digital processing over Analog:• Highly accurate (acquisition time enhanced)• Can correct for dye spillover (matrix algebra for n colors)• Obtain pulse geometry metrics and time• Perform statistics on raw linear data

Stuff that impacts sensitivity
Instrument
Sample
QOptical design efficiencyLaser power intensityPMT quantum efficiencySheath flow rate
BComponent autofluorescenceComponent scatterRaman scatter
Cell autofluorescence
Laser power intensity
Unbound dye/fluorochrome
Laser power intensitySample flow rate
Spectral overlap
Laser power intensityFilter design

Multi-color FACS: Spectral Overlap
300 400 500 600 700 800
Alexa 594
APC
Cy5.5APC
Cy7APC
CascadeBlue
Alexa 430
300 400 500 600 700 800
Cy5PE
Cy5.5PE
Cy7PE
Fluorescein
PE
TRPE
Wavelength (nm) Wavelength (nm)
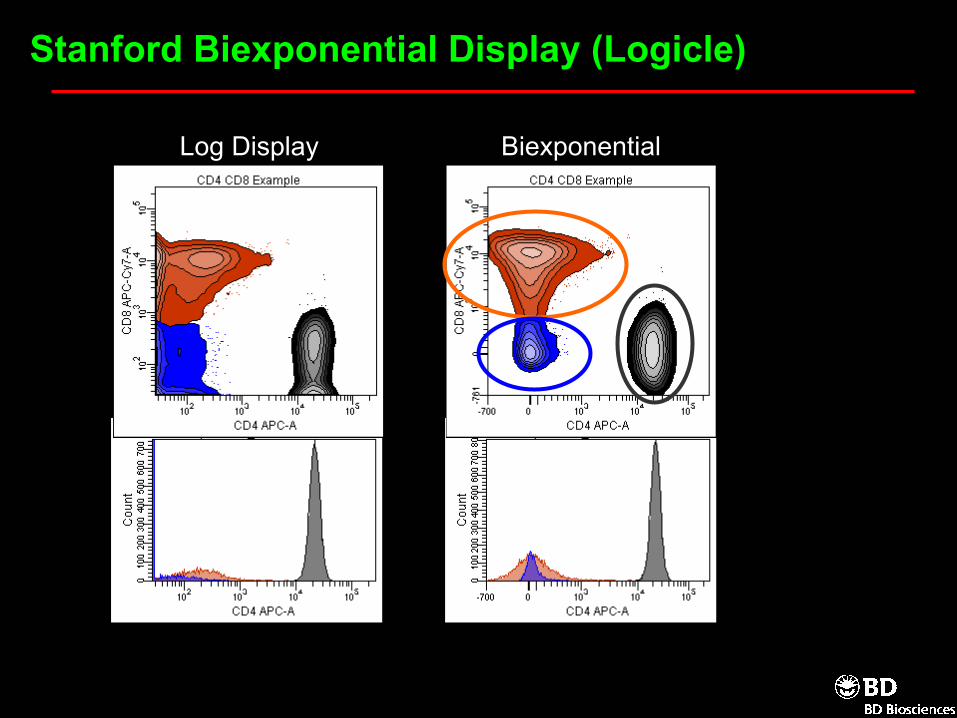
Stanford Biexponential Display (Logicle)
Log Display Biexponential

Intracellular Flow Cytometry TechniqueStain with antibodies to surface proteins
2% paraformaldehyde for 10-15 min.
95% MeOH or Saponin for 5-10 min (cell type dependent).
Primary conjugated antibodies to phospho-epitopes in PBS + 1% BSA.
Fix
Permeabilize
IntracellularStain
↑ fluorescence intensity
Cell Sorter
Cell1
Cell2
Cell3
Cell4

PkgRBNFATNFKBCaveolinPaxillin
Phospho Antibodies• EGFR• PDGFR• cKit• VEGFR• PKA
• Phospho Antibodies• p38 MAPK• JNK, cJun• AKT, PIP2, PIP3,• PKCα/β/θ/δ, Rsk• Raf, Mek, ERK, ELK• Rsk, Creb,• STAT1,3,5,6, c-Src• CREB, cJUN, IKKα• p53 s15, s20 s37, s392• Pyk2, Shc, Fak, src• Slp76, Zap70, Syk, Lat, Vav,• Lck, PLCγ• Beta-integrins
Increasing Phospho Ab Repertoire
• BD-Pharmingen has in process under our suggestion over 400 more different activities.
Every new antibody increases the potential of discovering
entirely new correlations fordisease processes (targets and
diagnostics) as well as utility in drugdesign and development

B220 CD11c
Stat1
CD
8
Collect Splenic cells 10 Minutes post-injection of IFNγ (in vivo)
Read out Stat1 transcription factor activation via its phosphorylation
Stimulation of Murine SplenocytesDendritic Cell Subpopulation Analysis (B220- CD8- CD11c+ )

Murine Splenocytes - Gating
FSC
SSC
CD11b
SSC
B220
TCR-B
B cells
T cells
monocytes
Matt Hale, Nolan Lab

Phospho-FACS allows for Pharmacodymics in Vivo
Cell Subset Specific IFNγ Sensitivity across a titration

Leukemia (AML) Classification by Differentiation
• M0 – undifferentiated AML
• M1 – myeloblastic, immature
• M2 – myeloblastic, mature
• M3 – promyelocytic
• M4 – myelomonocytic
• M5 – monocytic
CD34 marker can be found on AMLs from all FAB classes
(lymphohematopoietic stem/progenitor cell marker)

Could provoking cells to respond to external stimuli, such as cytokines,
differentiate AML blasts with altered signal transduction networks?

Jonathan Irish © 2004 | Nolan Lab, Stanford
Model: Cytokine Response of U937 Cells
Irish et al, Cell, 2004

Jonathan Irish © 2004 | Nolan Lab, Stanford
Cytokine Responses of Normal and Tumor Cells
Irish et al, Cell, 2004

Jonathan Irish © 2004 | Nolan Lab, Stanford
Clustering of Biosignature, Clinical Significance
Irish et al, Cell, 2004

SC-NP (standard chemotherapy responses)

SC-P2 (Flt3 mutant, chemotherapy insensitive)

Array Overview of Lymphoma Signaling
J. Irish
+2.5 fold
- no change
-2.5 foldlog2 scale
Stimulated / Control
83% B
17% T

New ApproachesTo RepresentingSingle Cell Data
Present New Problems, but suggest
Interesting possibilities
Classic
HeatmapKina
se 1
Kina
se 2
Kina
se 3
Kina
seTa
rg1
Kina
seTa
rg2
CD4
B220
Surf
Mar
ker X
Macrophage
B cells
CD4+ T cells
Multi-DSingle Cell

A
B
C D
E
Phos
pho
APhospho B
What is a Bayesian Network?
+ A Mathematical (probabilistic) description of the connections in the
graph ...

Datasets of cells
• condition ‘a’• condition ‘b’•condition…‘n’
Raf
Mek
1/2
Erk
p38
PKA
PKC
Jnk
PIP2
PIP3
Plcγ
Akt
11 Color Flow Cytometry
perturbation a
perturbation n
perturbation b
Conditions (96 well format)
T-Lymphocyte Data
• Primary human T-Cells• 9 conditions
(6 Specific interventions)
• 9 phosphoproteins, 2 phospolipids• 600 cells per condition
5400 data-points

T-Lymphocyte Data
Influence diagram of measured variables
Bayesian Network Analysis
Datasets of cells
• condition ‘a’• condition ‘b’•condition…‘n’
Raf
Mek
1/2
Erk
p38
PKA
PKC
Jnk
PIP2
PIP3
Plcγ
Akt
11 Color Flow Cytometry
perturbation a
perturbation n
perturbation b
Conditions (96 well format)

PKC
Raf
Erk
Mek
Plcγ
PKA
Akt
Jnk P38
PIP2
PIP3
Expected PathwayReportedUnexplained
Missed
• 14/17 Classic• 16/17 Reported• 1 Unexplained• 4 Missed
Reversed
Phospho-ProteinsPhospho-LipidsPerturbed in data
A T cell signaling map ab initio from multiparameter data by Bayesian Inference.

Interventions are Required for Directionality
PKC
Raf
Erk
Mek
Plcγ
PKA
Akt
Jnk P38
PIP2
PIP3
N/AReversed
11Missed
2Unexplained
1/10Reported
7/10Expected
Lacking Intervention
data
1
Complete Dataset
4
1
2/17
14/17
Dataset: 1200 samples:
• 2 conditions
• no interventions

Simulated Westerns Diminish Network Integrity
3Reversed
12Missed
8Unexplained
1/16Reported
6/16Expected
“Western blot”
1
Complete Dataset
4
1
2/17
14/17
PKC
Raf
Erk
Mek
Plcγ
PKA
Akt
Jnk P38
PIP2
PIP3
Simulated western blot: 420 samples:
• 14 conditions
• Each point average of 20 random cells

FacsXpert* and the Libris DataStoreDesigned to help researchers:
• Cope with this complexity when designing and executing FACS experiments
• Comply and with demanding requirements for long-term recoverability of FACS and other large data sets (Collaborative Electronic Notebook standards Association (CENSA)), US 21 CFAR part 11
*a knowledge-based system, Herzenberg laboratory (sold by ScienceXperts, Inc.)
Huge Problem with complex instrumentation
• Setting up the machine to ensure valid output.• Setting up complex experiments in an automated fashion.• ‘Forcing’ students/technical staff to conform.

Start by choosing a new/existing protocol, specify• Study and experiment name, Subject species, Cell source (tissue)
Take the individual through the experimental planning
Carry out experiment, collect data, store, analyze

Important to validate instrument setup in an automated manner
0 103 104 105
0
103
104
105
101 102 103 104 105
101
102
103
104
105
101 102 103 104 105
101
102
103
104
105
Uncompensated Compensated
Log
Biexp
0 103 104 105
0
103
104
105
A B
C D
APC Area
APC
-Cy7
Are
a
Antibody capture beadsstained with 3 levels ofan APC reagent
The transformed displayshows aligned populationsIn the APC-Cy7 dimension
All populationsalign correctly

Single Cells are an Unparalleled Information Resource… but…
Common standards needed for instrument setup, runs.Automated experiment setup/protocols • intelligent notebooks
Standards for representation of multi-D populations.• what is a population and what is the biological inference?• Cluster analysis
Support (i.e. $$) for new visualization of multi-D

Nolan Lab / Stanford UniversityNHLBI: National Proteomics Center
Kinase Signaling and IC FACS Group
Jonathan Irish Peter Krutzik Omar Perez Matt Hale
Acknowledgements
Bjørn Tore Gjertsen Nina ÅnensenRandi Hovland Øystein Bruserud
Collaborators in Bergen, Norway
Karen Sachs Dana Pe’er (Harvard)Douglas Lauffenberger
MIT
• Bob Hoffman• Dave Parks• Marty Bigos• Wayne Moore• Diether Recktenwald• Joe Trotter
• BD-BioSciences

Publications• Perez O.D. et al. (2002). Immunity. 16:51-65.
• Perez O.D. and Nolan G.P. (2002) Nature Biotechnology 20:155-162.
• Krutzik PO, Irish J, Nolan GP, and Perez OD, Analysis of Phospho-Proteins by Flow Cytometry: Techniques and Clinical Applications. Clinical Immunology Reviews, 2003, December.
• Perez OD and Nolan GP. Flow cytometric analysis of kinase signaling cascades. Methods in Flow Cytometry. Humana Press. Editor: Howard Shapiro, 2004, March.
• Krutzik PO and Nolan GP. Intracellular phospho-protein staining techniques for flow cytometry: monitoring single cell signaling events. Cytometry, 2003, September
• Perez, OD and Nolan et al. LFA-1 lowers of T-cell activation thresholds and signaling through cytohesin-1 and JAB-1. Nature Immunology, 2003, November.
• Irish, J. and Nolan et al. Single cell profiling of potentiated phospho-protein networks in cancer cells. Cell, August, 2004.
http://proteomics.stanford.eduhttp://www.stanford.edu/group/nolan