Embed Size (px)
Citation preview
Zhan and Desiderio BMC Medical Genomics 2010, 3:13http://www.biomedcentral.com/1755-8794/3/13
Open AccessR E S E A R C H A R T I C L E
Research articleSignaling pathway networks mined from human pituitary adenoma proteomics dataXianquan Zhan*1,2,3 and Dominic M Desiderio1,2,3,4,5
AbstractBackground: We obtained a series of pituitary adenoma proteomic expression data, including protein-mapping data (111 proteins), comparative proteomic data (56 differentially expressed proteins), and nitroproteomic data (17 nitroproteins). There is a pressing need to clarify the significant signaling pathway networks that derive from those proteins in order to clarify and to better understand the molecular basis of pituitary adenoma pathogenesis and to discover biomarkers. Here, we describe the significant signaling pathway networks that were mined from human pituitary adenoma proteomic data with the Ingenuity pathway analysis system.
Methods: The Ingenuity pathway analysis system was used to analyze signal pathway networks and canonical pathways from protein-mapping data, comparative proteomic data, adenoma nitroproteomic data, and control nitroproteomic data. A Fisher's exact test was used to test the statistical significance with a significance level of 0.05. Statistical significant results were rationalized within the pituitary adenoma biological system with literature-based bioinformatics analyses.
Results: For the protein-mapping data, the top pathway networks were related to cancer, cell death, and lipid metabolism; the top canonical toxicity pathways included acute-phase response, oxidative-stress response, oxidative stress, and cell-cycle G2/M transition regulation. For the comparative proteomic data, top pathway networks were related to cancer, endocrine system development and function, and lipid metabolism; the top canonical toxicity pathways included mitochondrial dysfunction, oxidative phosphorylation, oxidative-stress response, and ERK/MAPK signaling. The nitroproteomic data from a pituitary adenoma were related to cancer, cell death, lipid metabolism, and reproductive system disease, and the top canonical toxicity pathways mainly related to p38 MAPK signaling and cell-cycle G2/M transition regulation. Nitroproteins from a pituitary control related to gene expression and cellular development, and no canonical toxicity pathways were identified.
Conclusions: This pathway network analysis demonstrated that mitochondrial dysfunction, oxidative stress, cell-cycle dysregulation, and the MAPK-signaling abnormality are significantly associated with a pituitary adenoma. These pathway-network data provide new insights into the molecular mechanisms of human pituitary adenoma pathogenesis, and new clues for an in-depth investigation of pituitary adenoma and biomarker discovery.
BackgroundOur long-term goals for this human pituitary study are toclarify the molecular mechanisms that are involved inpituitary adenoma pathogenesis and to discover tumorbiomarkers. Towards those ends, a series of pituitary ade-noma proteomic expression data, which include 111 pro-teins identified from a human pituitary non-functionaladenoma tissue [1], 56 differentially expressed proteins
(DEP's) from human pituitary nonfunctional adenomatissues and from prolactinoma tissues [2,3], nine nitrop-roteins and three nitroprotein-protein complexes from ahuman pituitary nonfunctional adenoma tissue [4], andeight nitroproteins from a pituitary control tissue [5,6],were analyzed. There is a pressing need to clarify the sig-nificant signaling pathway networks that involve thosepituitary adenoma proteins, DEP's, and nitroproteins inorder to clarify and to better understand - on a molecularlevel - pituitary adenoma pathogenesis. Knowledge of sig-nificant signaling pathway networks will provide impor-tant clues and clear directions for an in-depth
* Correspondence: [email protected] Charles B. Stout Neuroscience Mass Spectrometry Laboratory, University of Tennessee Health Science Center, Memphis, Tennessee, USAFull list of author information is available at the end of the article
BioMed Central© 2010 Zhan and Desiderio; licensee BioMed Central Ltd. This is an Open Access article distributed under the terms of the Creative Com-mons Attribution License (http://creativecommons.org/licenses/by/2.0), which permits unrestricted use, distribution, and reproduc-tion in any medium, provided the original work is properly cited.

Zhan and Desiderio BMC Medical Genomics 2010, 3:13http://www.biomedcentral.com/1755-8794/3/13
Page 2 of 26
investigation of pituitary adenomas, for the discovery oftumor biomarkers, and for the development of efficacioustherapeutic agents.
Over the past decades, high-throughput "-omic" tech-nologies (genomics, transcriptomics, and proteomics)have been used in many fields, including biology andhuman diseases. Relative to the traditional molecularbiology methods that had been used to study the role of asingle gene, single protein, or single small-moleculemodel, those "-omic" data have driven the rapid develop-ment of systems biology to study a multiple-factor modelof disease and to address the network of interaction andregulatory events that contribute to a disease. Pathwaybiology, as one important component of systems biology,has been extensively developed. Omic data-based path-way biology relies on an accurate and effective pathwayanalysis system. The Ingenuity Pathway Analysis (IPA)system is an extensively used (>1,300 peer-reviewed pub-lications citing IPA; February 13, 2009) pathway analysissystem that includes a large-scale knowledge base (~2.2million scientific findings and 235 canonical pathways;February 13, 2009). IPA can identify statistically signifi-cant signaling pathway networks by analyzing the -omicdata in those numerous canonical-pathway databases.
Proteomic data obtained from pituitary adenoma tis-sues [1-6] were analyzed with IPA software to definewhich well-characterized cell-signaling and metabolicpathways could be the most relevant during pituitary ade-noma pathogenesis. This present study used the IPA sys-tem to reveal the significant signaling pathway networksthat involve pituitary adenoma proteins, DEP's, andnitroproteins in an attempt to better understand themolecular mechanisms that are involved in pituitary ade-noma pathogenesis, to discover potential biomarkers, andto develop efficacious therapeutic agents.
ResultsPathway networks derived from protein-mapping dataAmong the 154 identifiers that represented the 111 pro-teins that were identified from human pituitary adenomatissue, 147 identifiers were mapped to the correspondingmolecules (genes; proteins), except for 7 identifiers(Additional file 1, Table S1). A total of 106 identifierswere eligible to proceed into pathway analysis after 41duplicate identifiers were removed from those 147mapped identifiers. Each identifier was annotated with aSwiss-Prot accession number, gene name, protein name,subcellular location, biofunction, and potential targets ofdrugs (Additional file 1, Table S1).
The IPA analysis of those 106 network-eligible identifi-ers revealed 6 statistically significant pathway networks(Table 1 and Figure 1). Each network summarized inTable 1 includes all of the molecules (genes, proteins) that
correspond to the nodes in Figure 1, the proteomics-identified molecules, and the statistical score.
Network 1 functions in cancer, cell-to-cell signaling andinteraction, and small-molecule biochemistry (Figure1A), and includes 35 nodes (genes; proteins); 27 of theproteins (77% of the total nodes) were identified withmass spectrometry (MS). GH1 and ERK play key roles inNetwork 1.
Network 2 functions in post-translational modifica-tions, protein-folding, and hematological disease (Figure1B), and includes 34 nodes (genes; proteins); 25 of theproteins (74% of the total nodes) were identified with MS.NF-kB, HSPA, and G-protein play key roles in Network 2.
Network 3 functions in organ morphology, reproduc-tive-system development and function, and moleculartransport (Figure 1C), and include 35 nodes (genes; pro-teins); 17 proteins (49% of the total nodes) were identifiedwith MS. MAPK, Pkc, Ras, PI3K, Akt, and Calmodulinplay key roles in Network 3.
Network 4 functions in lipid metabolism, moleculartransport, and small-molecule biochemistry (Figure 1D),and includes 35 nodes (genes; proteins); 13 proteins (37%of the total nodes) were identified with MS. HNF4A,ERBB2, and FSH play key roles in Network 4.
Network 5 functions in cell death, hematological dis-ease, and cellular development (Figure 1E), and includes36 nodes (genes; proteins); 11 proteins (31% of the totalnodes) were identified with MS. TGFB1, Jnk, P38 MAPK,and insulin play key roles in Network 5.
Network 6 functions in lipid metabolism, small-mole-cule biochemistry, and carbohydrate metabolism (Figure1F), and includes 35 nodes (genes; proteins); 11 proteins(31% of the total nodes) were identified with MS. INS1,MYC, and HNF1A play key roles in Network 6.
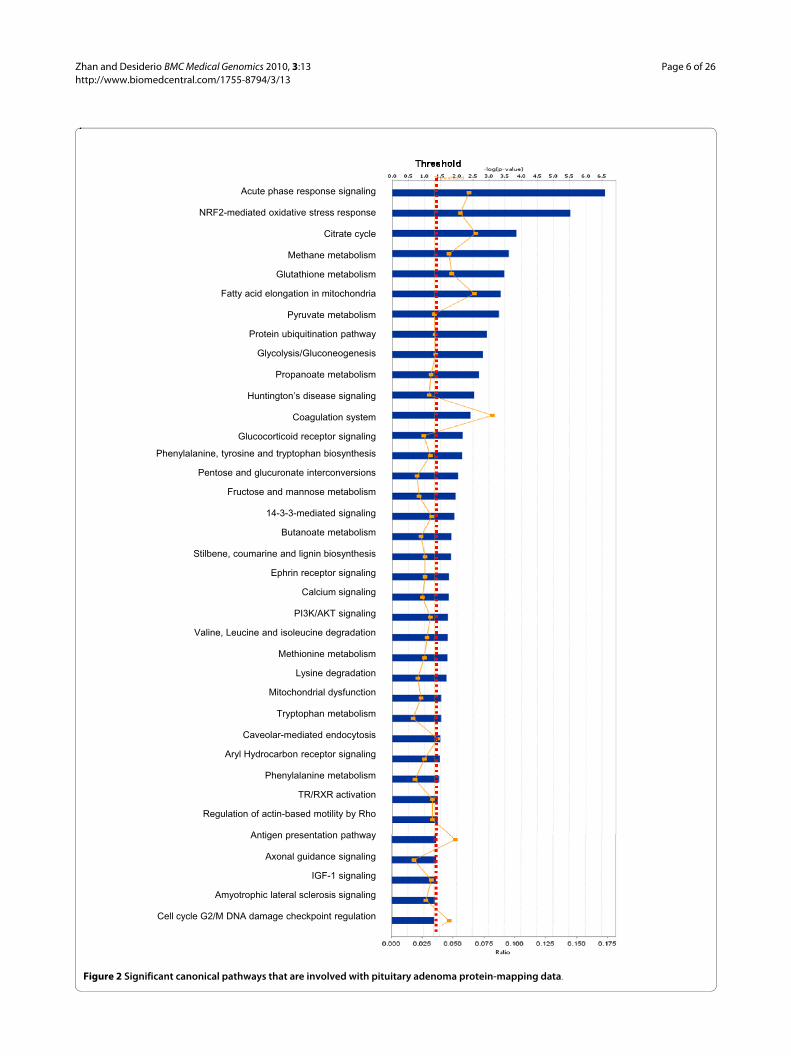
Among those pituitary adenoma protein-mapping data,a total of 37 statistically significant canonical pathwayswere identified that involve the identified proteins (Figure2). The top ten canonical pathways include acute-phaseresponse signaling, NRF2-medicated oxidative-stressresponse, citrate cycle, methane metabolism, glutathionemetabolism, fatty-acid elongation in mitochondria, pyru-vate metabolism, the protein ubiquitination pathway, gly-colysis/gluconeogenesis, and propanoate metabolism.Seven statistically significant toxicity pathways out of atotal of 20 were mined from those mapping proteomicdata, and include positive acute-phase response proteins,oxidative stress-response mediated by Nrf2, negativeacute-phase response proteins, oxidative stress, TR/RXRactivation, cell-cycle G2/M transition, and aryl hydrocar-bon receptor signaling (Figure 3). The identified proteinsin the linkage of each canonical pathway are labeled (Fig-ure 4; Additional file 2, Figure S1).
Figure 4 shows the scheme of a representative canoni-cal pathway - the NRF2-mediated oxidative stress

Zhan and Desiderio BMC Medical Genomics 2010, 3:13http://www.biomedcentral.com/1755-8794/3/13
Page 3 of 26
response. The extracellular oxidative stress-related fac-tors induce intracellular electophile ROS formation toactivate the NRF2 via MAPK-signaling pathways such asthe Ras/Raf-ERK, JNK, p38MAPK, and PI3K/AKT path-ways. The activated NRF2 is translocated into the nucleusto initiate antioxidative gene/protein expression such asantioxidant proteins (SOD, GPX2, CAT, FTH1, FTL, etc.)to reduce oxidative damage, chaperone/stress-responseproteins, and ubiquitination and proteasonal degradationproteins to repair and remove damaged proteins. Also,NRF2 involves the regulation of expression of detoxifyingproteins for cell survival. However, the dysregulation ofthis NFR2 pathway will cause the formation of more reac-tive metabolites, which in turn could promote tumori-genesis. Some components in this pathway have beenidentified with our proteomics study, and include FTL,FTH1, CAT, SOD, AFAR, FKBP5, and ERP29. Thedetailed components of the other canonical pathways
that are derived from the pituitary adenoma protein-mapping data are shown in Additional file 2, Figures S1.1-S1.36.
Pathway networks derived from comparative proteomics dataAmong the 86 identifiers that represent the 56 DEP's thatwere identified from human pituitary adenoma tissues,75 identifiers were mapped to the corresponding mole-cules (genes; proteins) except for 11 identifiers (Addi-tional file 1, Table S2). The 75 identifiers are significantbecause they derive from a comparison of adenomas andcontrols. A total of 47 identifiers were eligible to proceedinto pathway analysis after 28 duplicate identifiers wereremoved from those 75 mapped identifiers. Each identi-fier was annotated with a Swiss-Prot accession number,gene name, fold-change, protein name, subcellular loca-
Figure 1 Significant signaling pathway networks mined from pituitary adenoma protein-mapping dataset. Significant signaling pathway net-works that are involved in human pituitary adenoma mapping proteins and that function in (A) cancer, cell-to-cell signaling and interaction, small molecule biochemistry (Network 1); (B) post-translational modifications, protein-folding, hematological disease (Network 2); (C) organ morphology, reproductive-system development and function, molecular transport (Network 3); (D) lipid metabolism, molecular transport, smallmolecule biochem-istry (Network 4); (E) cell death, hematological disease, cellular development (Network 5); and (F) lipid metabolism, small-molecule biochemistry, car-bohydrate metabolism (Network 6). An orange solid edge denotes a direct relationship between two nodes (molecules: proteins; genes). A black unsolid edge denotes an indirect relationship between two nodes (molecules: proteins; genes). A gray node denotes an identified protein in our study [1]. The various shapes of nodes denote the different functions (Additional file 1, Table S1). A duplicated shape means this node contains multiple components. A curved line means intracellular translocation; A curved arrow means extracellular translocation.
A. Network 1 B. Network 2 C. Network 3
D. Network 4 E. Network 5 F. Network 6
Enzyme Peptidase Kinase Phosphatase
Cytokine or regulator
Metabolite
Transporter Ion channel Others
Note:

Zhan and Desiderio BMC Medical Genomics 2010, 3:13http://www.biomedcentral.com/1755-8794/3/13
Page 4 of 26
Table 1: Signaling Pathway Networks that Involve Pituitary Adenoma Mapping Proteins.
Networks Nodes (genes; proteins) in Network Score Nodes Identified Nodes (Proteins)
Top Functions
1 AKR1B1, ANXA1, ANXA2, ANXA5, APCS, C3, CAT, Complement component 1, ECHS1, ENO1, ERK, F10, FGG, FTH1, FTL, FYN, GDI2, GH1, Glutathione transferase, GST, GSTM2, GSTO1, GSTP1, HADHB, Nfat, PCBP1 (includes EG:5093), PHB (includes EG:5245), PLC, PPIA, PRDX2, PRDX6, SERPINE1, Stat3-Stat3, T3-TR-RXR, UCHL1
58 35 27 Cancer, Cell-To-Cell Signaling and Interaction, Small Molecule-Biochemistry
2 ADCY, ATP5B, CALR, CAPNS1, CCNH, CRABP2, ERP29, FHL2, FKBP5, G-protein beta, GNAO1, GNB2, GNB3, HLA-A, HSF1, HSP, Hsp27, Hsp70, Hsp90, HSPA5, HSPA8, HSPB1, KRT19, MHC Class I, NFkB, NME2, P4HB, PAFAH1B2, PDIA3, Rbp, RBP1, SOD1, Tap, YWHAE, YWHAQ (includes EG:10971)
52 34 25 Post-Translational Modification, Protein Folding, Hematological Disease
3 14-3-3, Actin, Akt, ALB, APOA1, Calmodulin, Calpain, CBS, Dynamin, E2f, F Actin, GSN, HNRNPC, HPX, IMMT, Integrin, KRT9, LDL, MAP3K8, Mapk, NAPA, PI3K, PITPNA, Pkc(s), Pld, Proteasome, PSMC1, PSME1, PSME2, Ras, TF, Tgf beta, TPM3, TPM4, Tropomyosin
31 35 17 Organ Morphology, Reproductive System Development and Function, Molecular Transport
4 A1BG, ADSL, ARHGEF5, BLVRB, C22ORF28, C4ORF27, CREBL2, Cytochrome c, EIF6, ENO2, ERBB2, FGF7, FSH, HNF4A, IDH1, IDH3A, IL6, KLHDC3, LEP, MCCC1, MYL6, MYL9 (includes EG:10398), NDUFS3, NPNT, OFD1, PPARGC1A, RIOK1, SLC25A20, STK17A, SUCLA2, THSD1, TIMD2, TLN1, VAT1, YWHAB
22 35 13 Lipid Metabolism, Molecular Transport, Small-Molecule Biochemistry
5 ACTR3, AKR7A2, BMP3, Ck2, DUSP8, EBAG9, EEF1A1, ELP3, ERAF, Histone h3, HSD17B10, Insulin, Jnk, KITLG (includes EG:4254), KLK11, MAGED2, MAS1, MDH2, OVOL1, P38 MAPK, PDGF BB, PGLS, PPM1L, PRKRIR, RNA polymerase II, SF3B2, SLC25A11, SLC25A12, STARD10, STK4, TGFB1, UGDH, VAPB, WASF3, WDR1
18 36 11 Cell Death, Hematological Disease, Cellular Development
6 3-hydroxybutyric acid, ABCC9, AK1, ANXA4, AQP9, BPGM, CA14, CA1 (includes EG:759), CCT3, EEF1G, EIF4EBP2, FADS2, FBXO8, FH, GNPAT, HNF1A, ILF2 (includes EG:3608), INS1, KCNJ8, KCNJ11, L-triiodothyronine, LDHB, MGST3, MYC, PAX4, PGAM1, PRDX3, SCD2, SLC37A4, SRI, SRM, TPI1, UMPS, VDAC2, XRCC6
18 35 11 Lipid Metabolism, Small-Molecule Biochemistry, Carbohydrate Metabolism
tion, biofunction, and potential targets of drugs (Addi-tional file 1, Table S2).
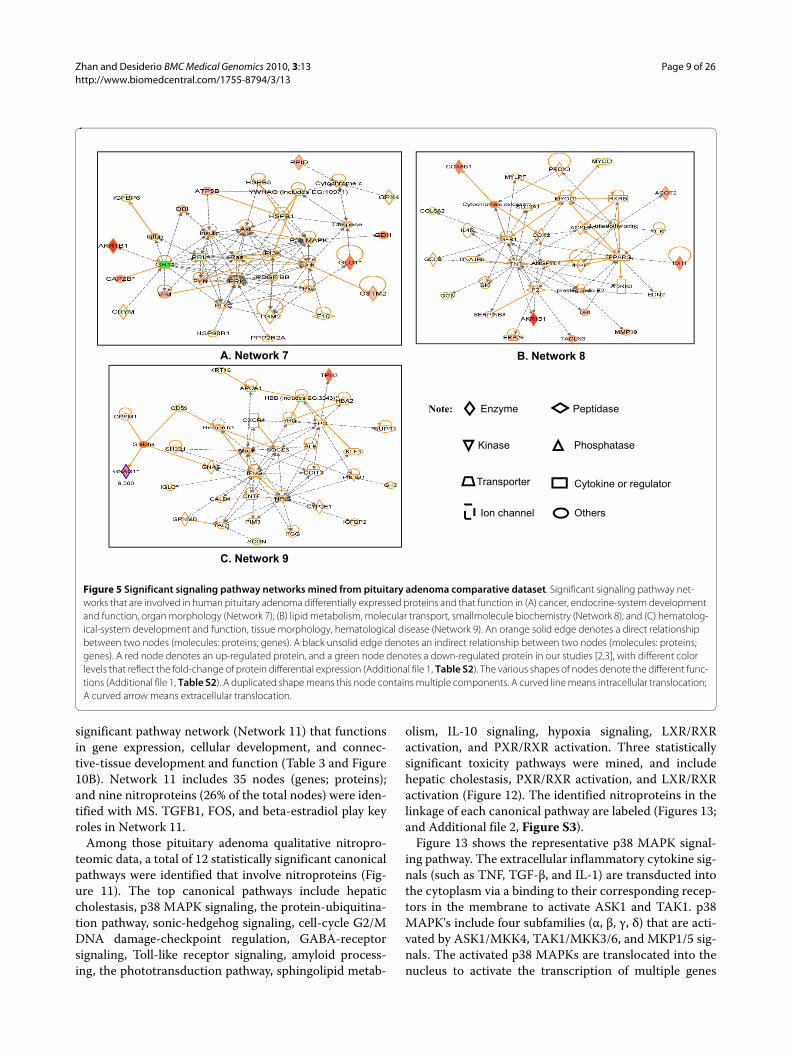
The IPA analysis of those 47 network-eligible identifiersrevealed three statistically significant pathway networks(Table 2 and Figure 5). Each network summarized inTable 2 includes all of those molecules (genes; proteins)that correspond to the nodes in Figure 5 the DEP's, andthe statistical score.
Network 7 functions in cancer, endocrine-systemdevelopment and function, and organ morphology (Fig-ure 5A) and includes 35 nodes (genes; proteins); among
those 35 nodes, 22 DEPs (63% of the total nodes) wereidentified with MS. GH1, ERK, P38 MAPK, PRL, Insulin,Akt, Ras, and Jnk play key roles in Network 7.
Network 8 functions in lipid metabolism, moleculartransport, and small-molecule biochemistry (Figure 5B),and include 35 nodes (genes; proteins); 11 DEP's (31% ofthe total nodes) were identified with MS. TGFB1, TNF,PPARG, and MYOD1 play key roles in Network 8.
Network 9 functions in tissue morphology, and hema-tological-system development, function, and disease (Fig-ure 5C), and include 35 nodes (genes; proteins); 10 DEP's

Zhan and Desiderio BMC Medical Genomics 2010, 3:13http://www.biomedcentral.com/1755-8794/3/13
Page 5 of 26
(29% of the total nodes) were identified with MS. MAPK,IFNG, NFkB, and EPO play key roles in Network 9.
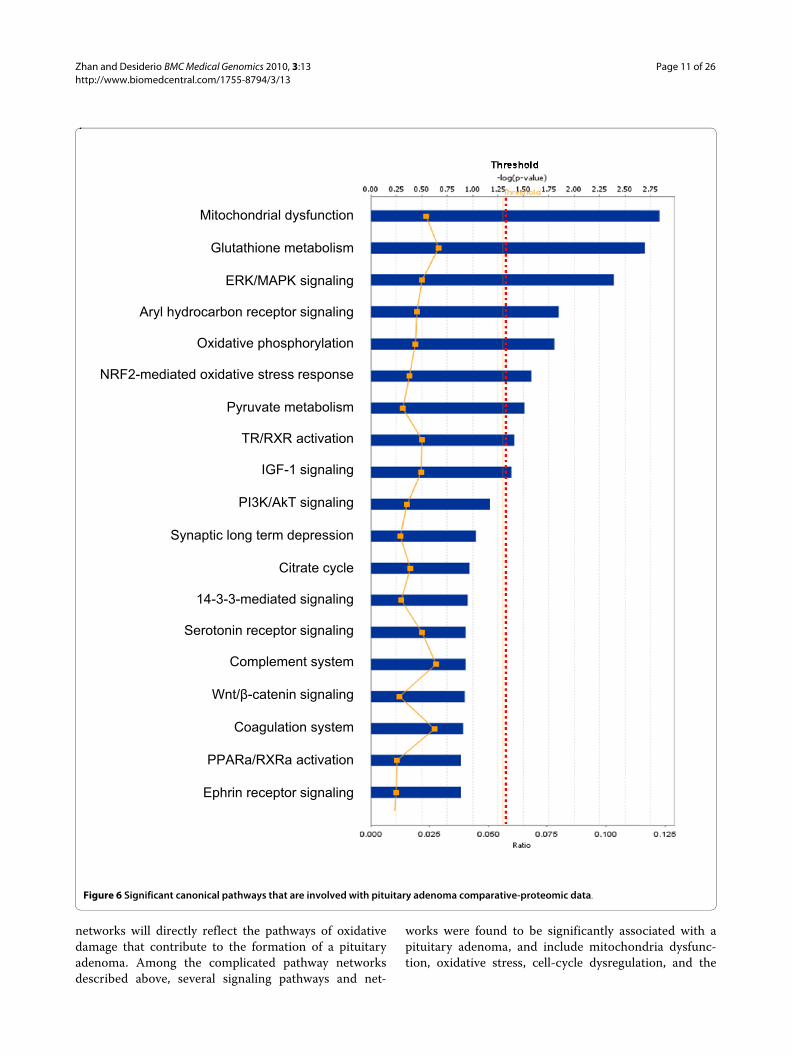
Among those pituitary adenoma comparative pro-teomic data, a total of nine statistically significant canon-ical pathways out of 19 pathways were identified thatinvolve those DEP's (Figure 6). The top nine canonicalpathways include mitochondrial dysfunction, glutathi-one metabolism, ERK/MAPK signaling, aryl hydrocar-bon-receptor signaling, oxidative phosphorylation,NRF2-mediated oxidative-stress response, pyruvatemetabolism, TR/RXR activation, and IGF-1 signaling. Sixstatistically significant toxicity pathways out of a total of16 were mined from those comparative proteomic data,and include mitochondrial dysfunction, aryl hydrocar-bon-receptor signaling, oxidative stress, negative acute-phase response proteins, TR/RXR activation, and oxida-tive-stress response mediated by Nrf2 (Figure 7). Theidentified proteins in the linkage of each canonical path-way are labeled (Figures 8 and 9; and Additional file 2,Figure S2).
Figure 8 shows, as an example, the complicated mito-chondrial dysfunctional pathway. The mitochondrial dys-functional pathway was distributed within five regions ofa cell - cytoplasm, outer mitochondrial membrane, inter-membrane space, inner mitochondrial membrane, andmitochondrial matrix. The mitochondrial complexes I -V locate in the inner mitochondrial membrane. Genemutations that cause mitochondrial dysfunction includeComplex I (NADH dehydrogenesase) (NDUFV1,NDUFV2, NDUFS1, NDUFS2, NDUFS3, NDUFS6,NDUFS7, NDUFS8, ND1, ND4, ND5, NDUFA1,NDUFA8, NDUF13, NDUFAF1, and NDUFB9), ComplexII (succinate dehydrogenase) (SDHA, SDHB, SDHC, andSDHD), Complex III (cytochrome bc 1) (UQCRB,CYTB), Complex IV (cytochrome c oxidase) [COX3(cyclooxygenase 3)], and other genes (APP, amyloid β,presenin-1, and α-synuclein). Our comparative proteom-ics data demonstrate that some components of mito-chondrial complexes are significantly up-regulated inpituitary adenomas relative to controls; for example,ATP5B (ATP synthase, H+-transporting, mitochondrialF1 complex, beta polypeptide; 5-fold), COX6B1 (cyto-chrome c oxidase subunit Vib polypeptide 1; 9-fold), andNDUFS8 (NADH dehydrogenase ubiquinone Fe-S pro-tein 8; 5-fold). Moreover, GPX4 (glutathione peroxidase4) was significantly down-regulated (26-fold) in pituitaryadenomas relative to controls. GPX4 plays importantroles in the cytochrome c - apoptosis pathway.
Figure 9 shows the ERK/MAPK signaling pathway. Theextracellular signals are transducted into the cytoplasmvia the receptor tyrosine kinase (RTK) and the integrinreceptor to activate the Ras/Raf pathway. Ras is regulatedby PKC and SOS that is regulated by Src and FYN signals.Raf includes three subfamilies A, B, and C. A-Raf is acti-
vated by the Ras signal. B-Raf is activated by Rap1, PKA,and 14-3-3 signals. C-Raf is activated by Ras, PKA, and14-3-3 signals. ERK1/2 are activated by Rafs-MEK1/2 sig-nals. The activated ERK1/2's will perform their biologicalroles in the cytoplasm such as phosphorylation ofcytoskeletal proteins, ion channels and receptors, andregulation of apoptosis and translation; or will translocateinto the nucleus to regulate the transcription of multiplegenes such as Stat1/3, Myc, CREB, histone H3, etc. Com-pared to human pituitary controls, in pituitary adenomas,the FYN (FYN oncogene related to SRC, FGR, YES) wasup-regulated (4-fold), 14-3-3 protein down-regulated(44-fold), HSPB1 (heat shock 27 kDa protein 1) down-regulated (5-fold), and PPP2R2A (protein phosphatase 2regulatory subunit B alpha isoform) down-regulated (8-fold), within the ERK/MAPK signaling pathway system.Also, the PKA regulatory subunit type I beta was nitrated(Additional file 1, Table S3) to most probably interferewith PKA functions; that nitration suggests that oxida-tive/nitrative stress signals are also involved in the regula-tion of the ERK/MAPK signaling system. The detailedcomponents of the other canonical pathways that arederived from pituitary adenoma comparative proteomicdata are shown in the Additional file 2, Figures S2.1-S2.7.
Pathway networks derived from nitroproteomic dataA total of 12 identifiers that represent nine nitroproteins,and three non-nitrated proteins, from a human pituitaryadenoma tissue were mapped to their correspondinggenes/proteins (Additional file 1, Table S3). A total of 10identifiers were eligible to proceed into pathway analysis,except for LILRA4 and ZNF432. Each identifier wasannotated with a Swiss-Prot accession number, genename, nitration status, protein name, subcellular loca-tion, biofunction, and potential targets of drugs (Addi-tional file 1, Table S3). Twelve identifiers that representnine nitroproteins from human pituitary control tissuewere also mapped to nine genes. Nine network-eligibleidentifiers proceeded to pathway analysis (Additional file1, Table S4). Nitration usually decreases the activity of aprotein.
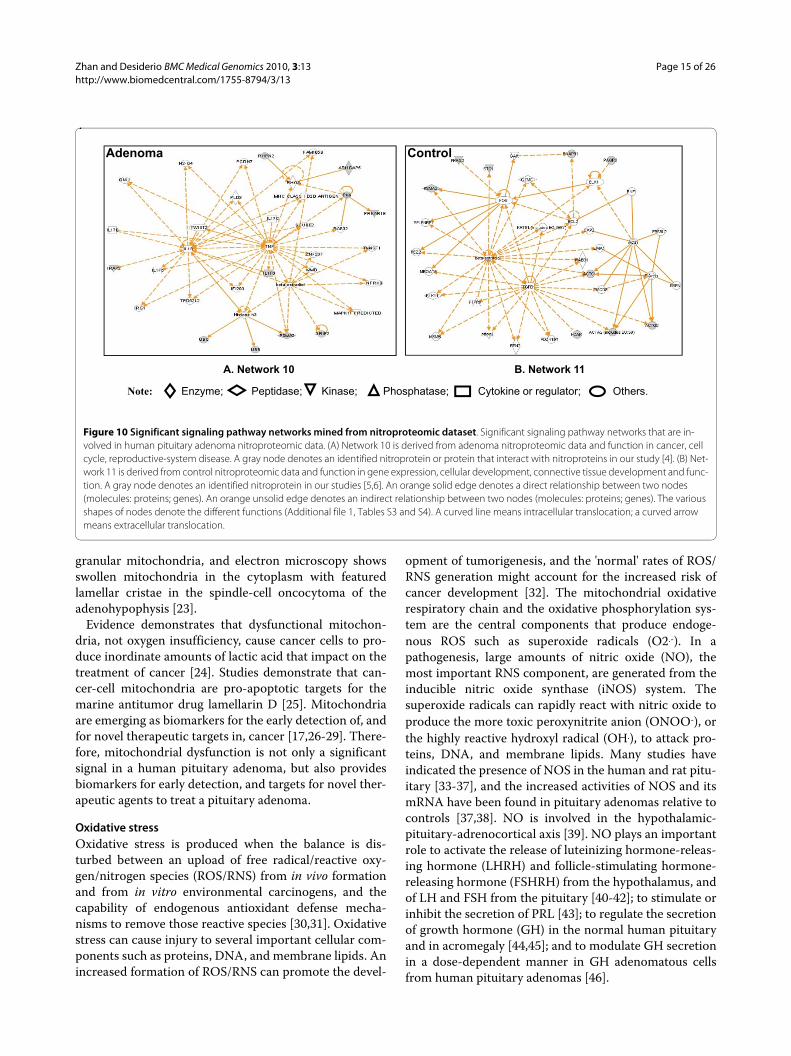
The IPA analysis of those 10 network-eligible identifiersfrom human pituitary adenoma tissue revealed one statis-tically significant pathway network (Table 3 and Figure10A). That network (Table 3) includes all molecules(genes; proteins) that correspond to the nodes in Figure10A, the MS-identified nitroproteins, and the statisticalscore. Network 10 functions in cancer, cell cycle, andreproductive-system disease (Figure 10A), and includes35 nodes (genes; proteins); nine nitroproteins (26% of thetotal nodes) were identified with MS. TNF, IL1B, andbeta-estradiol play key roles in Network 10. For thosenine network-eligible identifiers from human pituitarycontrol tissue, the IPA analysis revealed one statistically
Zhan and Desiderio BMC Medical Genomics 2010, 3:13http://www.biomedcentral.com/1755-8794/3/13
Page 6 of 26
Figure 2 Significant canonical pathways that are involved with pituitary adenoma protein-mapping data.
Acute phase response signaling
NRF2-mediated oxidative stress response
Citrate cycle
Methane metabolism
Glutathione metabolism
Fatty acid elongation in mitochondria
Pyruvate metabolism
Protein ubiquitination pathway
Glycolysis/Gluconeogenesis
Propanoate metabolism
Huntington’s disease signaling
Coagulation system
Glucocorticoid receptor signaling
Phenylalanine, tyrosine and tryptophan biosynthesis
Pentose and glucuronate interconversions
Fructose and mannose metabolism
14-3-3-mediated signaling
Butanoate metabolism
Stilbene, coumarine and lignin biosynthesis
Ephrin receptor signaling
Calcium signaling
PI3K/AKT signaling
Valine, Leucine and isoleucine degradation
Methionine metabolism
Lysine degradation
Mitochondrial dysfunction
Tryptophan metabolism
Caveolar-mediated endocytosis
Aryl Hydrocarbon receptor signaling
Phenylalanine metabolism
TR/RXR activation
Regulation of actin-based motility by Rho
Antigen presentation pathway
Axonal guidance signaling
IGF-1 signaling
Amyotrophic lateral sclerosis signaling
Cell cycle G2/M DNA damage checkpoint regulation

Zhan and Desiderio BMC Medical Genomics 2010, 3:13http://www.biomedcentral.com/1755-8794/3/13
Page 7 of 26
Figure 3 Significant toxicological events that are involved with pituitary adenoma protein-mapping data.
Threshold
Positive acute phase response proteins
Oxidative stress response mediated by Nrf2
Negative acute phase response proteins
Oxidative stress
TR/RXR activation
G2/M transition of the cell cycle
Aryl hydrocarbon receptor signaling
LPS/IL-1 mediated inhibition of RXR function
Mitochondrial dysfunction
Xenobiotic metabolism
Fatty acid metabolism
RAR activation
LXR/RXR activation
PPARa/RXR activation
NF�B signaling pathway
PXR/RXR activation
Hypoxia-inducible factor signaling
TGF-� signaling
FXR/RXR activation
Mechanism of gene regulation by peroxisome proliferators vis PPARa

Zhan and Desiderio BMC Medical Genomics 2010, 3:13http://www.biomedcentral.com/1755-8794/3/13
Page 8 of 26
Figure 4 NRF2-mediated oxidative-stress response pathway that is involved with pituitary adenoma protein-mapping data. A gray label de-notes an identified protein. The various shapes of nodes denote the different functions. A duplicated shape means this node contains multiple com-ponents. An arrow denotes the pathway direction. A line with a small circle denotes a biological result.
NRF2-mediated oxidative stress response
Enzyme Peptidase
Kinase Transporter
Others
Note:
Zhan and Desiderio BMC Medical Genomics 2010, 3:13http://www.biomedcentral.com/1755-8794/3/13
Page 9 of 26
significant pathway network (Network 11) that functionsin gene expression, cellular development, and connec-tive-tissue development and function (Table 3 and Figure10B). Network 11 includes 35 nodes (genes; proteins);and nine nitroproteins (26% of the total nodes) were iden-tified with MS. TGFB1, FOS, and beta-estradiol play keyroles in Network 11.
Among those pituitary adenoma qualitative nitropro-teomic data, a total of 12 statistically significant canonicalpathways were identified that involve nitroproteins (Fig-ure 11). The top canonical pathways include hepaticcholestasis, p38 MAPK signaling, the protein-ubiquitina-tion pathway, sonic-hedgehog signaling, cell-cycle G2/MDNA damage-checkpoint regulation, GABA-receptorsignaling, Toll-like receptor signaling, amyloid process-ing, the phototransduction pathway, sphingolipid metab-
olism, IL-10 signaling, hypoxia signaling, LXR/RXRactivation, and PXR/RXR activation. Three statisticallysignificant toxicity pathways were mined, and includehepatic cholestasis, PXR/RXR activation, and LXR/RXRactivation (Figure 12). The identified nitroproteins in thelinkage of each canonical pathway are labeled (Figures 13;and Additional file 2, Figure S3).
Figure 13 shows the representative p38 MAPK signal-ing pathway. The extracellular inflammatory cytokine sig-nals (such as TNF, TGF-β, and IL-1) are transducted intothe cytoplasm via a binding to their corresponding recep-tors in the membrane to activate ASK1 and TAK1. p38MAPK's include four subfamilies (α, β, γ, δ) that are acti-vated by ASK1/MKK4, TAK1/MKK3/6, and MKP1/5 sig-nals. The activated p38 MAPKs are translocated into thenucleus to activate the transcription of multiple genes
Figure 5 Significant signaling pathway networks mined from pituitary adenoma comparative dataset. Significant signaling pathway net-works that are involved in human pituitary adenoma differentially expressed proteins and that function in (A) cancer, endocrine-system development and function, organ morphology (Network 7); (B) lipid metabolism, molecular transport, smallmolecule biochemistry (Network 8); and (C) hematolog-ical-system development and function, tissue morphology, hematological disease (Network 9). An orange solid edge denotes a direct relationship between two nodes (molecules: proteins; genes). A black unsolid edge denotes an indirect relationship between two nodes (molecules: proteins; genes). A red node denotes an up-regulated protein, and a green node denotes a down-regulated protein in our studies [2,3], with different color levels that reflect the fold-change of protein differential expression (Additional file 1, Table S2). The various shapes of nodes denote the different func-tions (Additional file 1, Table S2). A duplicated shape means this node contains multiple components. A curved line means intracellular translocation; A curved arrow means extracellular translocation.
A. Network 7 B. Network 8
C. Network 9
Enzyme Peptidase
Kinase Phosphatase
Cytokine or regulatorTransporter
Ion channel Others
Note:

Zhan and Desiderio BMC Medical Genomics 2010, 3:13http://www.biomedcentral.com/1755-8794/3/13
Page 10 of 26
Table 2: Signaling Pathway Networks that Involve Human Pituitary Adenoma Differentially Expressed Proteins (DEPs).
Networks Nodes (genes; proteins) in Network Score Nodes Identified Nodes (DEPs)
Top Functions
7 AKR1B1, Akt, ATP5B, CAPZB, Caspase, CRYM, Cytochrome c, DBI, ERK, F10, FYN, GDI1, GH1, GLO1, GPX4, GSTM2, HSP90B1, HSPB1, HSPB8, Igfbp, IGFBP6, Insulin, Jnk, P38 MAPK, PDGF BB, PI3K, Pka, PLC, PPID, PPP2R2A, PRL, Ras, TGM2, VIM, YWHAQ (includes EG:10971)
53 35 22 Cancer, Endocrine System Development and Function, Organ Morphology
8 ACOT2, ACSL1, ADRB3, AKR1B1, ANGPTL4, COL6A2, COX2, COX6B1, Cytochrome c oxidase, DBI, DLK1, DNAJB6, EDN2, ERP29, F2, GCLC, IDH1, IL4R, L-triiodothyronine, LIPE, MMP19, MYCL1, MYLPF, MYOD1, OGN, PPARG, PRDX3, prostaglandin E2, RXRB, SERPINB8, SKI, SLC2A1, TAGLN3, TGFB1, TNF
22 35 11 Lipid Metabolism, Molecular Transport, Small Molecule Biochemistry
9 ALB, APOA1, CALB1, CD59, CNTF, CXCR4, CYP2E1, DDIT3, EPO, FGG, G alpha, GH2, GNAO1, GNAS, GPNMB, GPSM1, HBA2, HBB (includes EG:3043), HBD, Histone h3, IFNG, IGFBP2, IGLC1, KLF3, KRT16, Mapk, NFkB, NUPR1, PIK3R1, PIM3, SCGN, SH2B1, SOCS3, TAC1, TPH2
19 35 10 Hematological System Development and Function, Tissue Morphology, Hematological Disease
such as CREB, c-Myc, Stat1, histone H3, Elk-1, etc., andto regulate apoptosis. Our pituitary adenoma nitropro-teomic study has discovered the IL1-IL1R-IRAK2 com-plex in a human pituitary adenoma tissue; IL-1 wasnitrated, and IRAK2 (interleukin-1 receptor-interactingprotein 2) was identified to associate with IL1R.
Additional file 2, Figure S3.4 shows the cell-cycle G2/M DNA damage checkpoint-regulation pathway. p53 andcdc25 B/C play important roles in this oxidative damage-induced pathway. The 14-3-3 proteins (down-regulated44-fold in pituitary adenomas compared to controls;Additional file 1, Table S2) are the important regulatorsin this pathway - they couple with Cdc25 B/C to partici-pate in the nuclear export of Cdc25, and couple withCdc2 and Cyclin B to participate in the cytoplasmicsequestration of cdc2 and cyclin B. The detailed compo-nents of the other canonical pathways that are derivedfrom the pituitary adenoma nitroproteomic data areshown in Additional file 2, Figures S3.1-S3.10.
Among those control pituitary adenoma qualitativenitroproteomic data, a total of 12 statistically significantcanonical pathways were identified that involve nitropro-teins (Figure 14), and include clatrin-mediated endocyto-sis, caveolar-mediated endocytosis, VEGF signaling,regulation of actin-based motility by Rho, Fcy receptor-mediated phagocytosis in macrophages and monocytes,tight-junction signaling, NRF2-mediated oxidative-stressresponse, leukocyte extravasation signaling, integrin sig-naling, actin-cytoskeleton signaling, and calcium signal-ing. No statistically significant toxicity pathways weremined. The identified nitroproteins in the linkage of each
canonical pathway are labeled (Additional file 2, FigureS4). The detailed components of the other canonicalpathways that are derived from pituitary control nitrop-roteomic data are shown in Additional file 2, FiguresS4.1-S4.12.
DiscussionThe present study, for the first time, used bioinformaticspathway analysis to reveal the significant signaling path-ways and networks that are associated with pituitary ade-nomas; three types of proteomic data were used -pituitary adenoma protein-mapping [1], comparativeproteomic [2,3], and nitroproteomic [4-6]. Protein-map-ping data were obtained with a 2DGE-arrayed pituitaryadenoma proteome, followed by MS characterization ofthe proteins. The protein-mapping data-derived path-ways and networks could reflect each potential pathwaynetwork that exists in a human pituitary adenoma pro-teome, and that associates with its pathophysiology.Those pathway networks are the baseline for the discov-ery of adenoma-related pathway networks. Comparativeproteomic data were obtained from 2DGE-arrayed ade-noma and control proteome images, followed by MScharacterization of DEP's. Those DEP data-derived path-way networks will reflect significant adenoma-relatedpathway networks. Nitroproteomic data include thoseendogenous proteins that were nitrated at a tyrosine resi-due. Tyrosine nitration, a chemically stable marker of oxi-dative stress, alters protein function, and is extensivelyassociated with tumor inflammation and neurodegenera-tive disease. The nitroproteomic data-derived pathway
Zhan and Desiderio BMC Medical Genomics 2010, 3:13http://www.biomedcentral.com/1755-8794/3/13
Page 11 of 26
networks will directly reflect the pathways of oxidativedamage that contribute to the formation of a pituitaryadenoma. Among the complicated pathway networksdescribed above, several signaling pathways and net-
works were found to be significantly associated with apituitary adenoma, and include mitochondria dysfunc-tion, oxidative stress, cell-cycle dysregulation, and the
Figure 6 Significant canonical pathways that are involved with pituitary adenoma comparative-proteomic data.
Mitochondrial dysfunction
Glutathione metabolism
ERK/MAPK signaling
Aryl hydrocarbon receptor signaling
Oxidative phosphorylation
NRF2-mediated oxidative stress response
Pyruvate metabolism
TR/RXR activation
IGF-1 signaling
PI3K/AkT signaling
Synaptic long term depression
Citrate cycle
14-3-3-mediated signaling
Serotonin receptor signaling
Complement system
Wnt/�-catenin signaling
Coagulation system
PPARa/RXRa activation
Ephrin receptor signaling

Zhan and Desiderio BMC Medical Genomics 2010, 3:13http://www.biomedcentral.com/1755-8794/3/13
Page 12 of 26
MAPK-signaling system. Those four systems will bedescribed below.
Mitochondria dysfunctionMitochondria are dynamic intracellular organelles thatare essential for cellular life, death, and differentiation,and play a central role in oxidative metabolism and apop-tosis. Mitochondrial dysfunctions underlie a broad spec-trum of human diseases [7,8] that include cancer [9,10],neurodegenerative diseases [11], cardiovascular diseases[12], diabetes mellitus [13], and inflammatory diseases[14,15]. Notable differences in the structure and functionof mitochondria appear between cancer and normal cells,and include differences in mtDNA sequence, molecularcomposition, and metabolic activity [9,10]. Mitochondriainvolve multiple metabolic functions that include oxida-
tive phosphorylation - an energy-generating process thatcouples the oxidation of respiratory substances to thesynthesis of ATP, oxidative decarboxylation of pyruvate,the tricarboxylic acid cycle, fatty-acid oxidation, glycoly-sis, intracellular homeostasis of inorganic ions such ascalcium and phosphate, and intracellular apoptosis [10].Mitochondrial dysfunction in cancer includes anincreased gluconeogenesis, reduced pyruvate oxidationand increased lactic acid production, increased glutamin-olytic activity, and reduced fatty-acid oxidation. Theactivity of certain mitochondrial enzymes that are inte-gral to the process of oxidative phosphorylation isdecreased in cancer compared to normal cells; thoseenzymes include ATPase, cytochrome c oxidase, and ade-nine nucleotide translocase. The additional alterations of
Figure 7 Significant toxicological events that are involved with pituitary adenoma comparative-proteomic data. Green bar = downregulat-ed, red bar = upregulated, grey bar = no change, white bar = no overlap with dataset.
Mitochondrial dysfunction
Aryl hydrocarbon receptor signaling
Oxidative stress
Negative acute phase response proteins
TR/RXR activation
Oxidative stress response mediated by Nrf2
PPARa/RXR activation
PXR/RXR activation
LXR/RXR activation
VDR/RXR activation
FXR/RXR activation
Hepatic fibrosis
Mechanism of gene regulation by peroxisome proliferators via PPARa
NF�B signaling pathway
Xenobiotic metabolism
LPS/IL-1 mediated inhibition of RXR function
Threshold Percentage
Ratio ( ) -log(p-value) ( )

Zhan and Desiderio BMC Medical Genomics 2010, 3:13http://www.biomedcentral.com/1755-8794/3/13
Page 13 of 26
gene expression between cancer and normal cells includethe anti-apoptotic oncogenes that encode Bcl-2 and Bcl-XL, and genes that encode the peripheral benzodiazepinreceptor (PBR), the PBR-associated protein Prax-1, andmitochondrial creatine kinase. The expression of BAX, apro-apoptotic, inner mitochondrial membrane protein, isalso reduced in some cancer cell-lines. The metabolicimbalances and the enhanced resistance to mitochondrialapoptosis are the prominent features of cancer cells, andtumors rely heavily on glycolysis to meet their metabolicdemands [16]. Mitochondrial dysfunctions have beenproposed as a cause of cancer, and the citrate inhibitionof glycosis has been proposed as a cancer treatment [17].Mitochondria play crucial roles in this cancer-cell biol-ogy. Mitochrondrial dysfunction is a biomarker for theearly detection of cancer, and is a therapeutic target forcancer.
Pituitary adenoma protein-mapping data clearly revealthe mitochondria-related signaling pathways that includefatty-acid elongation in mitochondria, glycolysis/gluco-neogenesis, and oxidative stress that function in humanpituitary adenoma cells (Figures 2 and 3). The DEP dataalso clearly reveal the significant signaling pathways thatinclude mitochondrial dysfunction, oxidative phosphory-
lation, and oxidative-stress response in a human pituitaryadenoma (Figures 6 and 7). Figure 8 shows the canonicalpathway of mitochondrial dysfunctions.
Mitochondrial dysfunction could be confirmed with amitochondrial morphological change in a human pitu-itary tumor. Studies found an increased number of mito-chondria, and ultrastructurally abnormal mitochondriawere present in pituitary oncocytomas [18]. Large mito-chondria and mitochondrial swelling were present in apituitary adenoma with hyperprolactinemia; those find-ings could be attributable to the prolonged intake of ste-roids and/or ischemia [19]. Characteristic vesicularmitochondria are present in adrenocortical-pituitaryhybrid tumor cells that cause Cushing's syndrome [20].Moreover, melatonin as an apoptotic inducer of tumorcells significantly inhibited prolactinoma cell prolifera-tion, increased prolactinoma cell apoptosis, inducedmRNA expression of Bax and cytochrome c proteinexpression, and, conversely, inhibited the mRNA expres-sion of Bcl-2 and the mitochondrial membrane potential.Those data suggest that melatonin inhibits proliferationand induces apoptosis of a rat pituitary prolactin-secret-ing tumor via a perturbation of mitochondria physiology[21]. The ultrastructure of cells shows giant mitochondria
Figure 8 Mitochondrial dysfunctional pathway that is involved with pituitary adenoma comparative-proteomic data. Red label = upregulat-ed, green label = down regulated. The various shapes of nodes denote the different functions. A duplicated shape means this node contains multiple components. An arrow denotes the pathway direction. A line with a small circle denotes a biological result.
Mitochondrial dysfunction
Phosphatase
Enzyme Peptidase Kinase
Cytokine or regulator
Transporter
Others
Note:

Zhan and Desiderio BMC Medical Genomics 2010, 3:13http://www.biomedcentral.com/1755-8794/3/13
Page 14 of 26
and an increased number of mitochondria comparable tooncocytic adenomas in human pituitary adenomas thatsecrete growth hormone and prolactin, and electron
microscopy shows many, in part densely arranged, mito-chondria in human non-functioning pituitary adenomas[22]. Anti-mitochondrial staining shows intense and
Figure 9 ERK/MAPK signaling pathway that is involved with pituitary adenoma comparative-proteomic data. Red label = upregulated, green label = downregulated. The various shapes of nodes denote the different functions. A duplicated shape means this node contains multiple compo-nents. An arrow denotes the pathway direction. A line with a small circle denotes a biological result.
ERK/MAPK signaling
Cytokine or
regulator
Phosphatase
Enzyme
Peptidase
Kinase
Transporter
Others
Note:
Zhan and Desiderio BMC Medical Genomics 2010, 3:13http://www.biomedcentral.com/1755-8794/3/13
Page 15 of 26
granular mitochondria, and electron microscopy showsswollen mitochondria in the cytoplasm with featuredlamellar cristae in the spindle-cell oncocytoma of theadenohypophysis [23].
Evidence demonstrates that dysfunctional mitochon-dria, not oxygen insufficiency, cause cancer cells to pro-duce inordinate amounts of lactic acid that impact on thetreatment of cancer [24]. Studies demonstrate that can-cer-cell mitochondria are pro-apoptotic targets for themarine antitumor drug lamellarin D [25]. Mitochondriaare emerging as biomarkers for the early detection of, andfor novel therapeutic targets in, cancer [17,26-29]. There-fore, mitochondrial dysfunction is not only a significantsignal in a human pituitary adenoma, but also providesbiomarkers for early detection, and targets for novel ther-apeutic agents to treat a pituitary adenoma.
Oxidative stressOxidative stress is produced when the balance is dis-turbed between an upload of free radical/reactive oxy-gen/nitrogen species (ROS/RNS) from in vivo formationand from in vitro environmental carcinogens, and thecapability of endogenous antioxidant defense mecha-nisms to remove those reactive species [30,31]. Oxidativestress can cause injury to several important cellular com-ponents such as proteins, DNA, and membrane lipids. Anincreased formation of ROS/RNS can promote the devel-
opment of tumorigenesis, and the 'normal' rates of ROS/RNS generation might account for the increased risk ofcancer development [32]. The mitochondrial oxidativerespiratory chain and the oxidative phosphorylation sys-tem are the central components that produce endoge-nous ROS such as superoxide radicals (O2.-). In apathogenesis, large amounts of nitric oxide (NO), themost important RNS component, are generated from theinducible nitric oxide synthase (iNOS) system. Thesuperoxide radicals can rapidly react with nitric oxide toproduce the more toxic peroxynitrite anion (ONOO-), orthe highly reactive hydroxyl radical (OH.), to attack pro-teins, DNA, and membrane lipids. Many studies haveindicated the presence of NOS in the human and rat pitu-itary [33-37], and the increased activities of NOS and itsmRNA have been found in pituitary adenomas relative tocontrols [37,38]. NO is involved in the hypothalamic-pituitary-adrenocortical axis [39]. NO plays an importantrole to activate the release of luteinizing hormone-releas-ing hormone (LHRH) and follicle-stimulating hormone-releasing hormone (FSHRH) from the hypothalamus, andof LH and FSH from the pituitary [40-42]; to stimulate orinhibit the secretion of PRL [43]; to regulate the secretionof growth hormone (GH) in the normal human pituitaryand in acromegaly [44,45]; and to modulate GH secretionin a dose-dependent manner in GH adenomatous cellsfrom human pituitary adenomas [46].
Figure 10 Significant signaling pathway networks mined from nitroproteomic dataset. Significant signaling pathway networks that are in-volved in human pituitary adenoma nitroproteomic data. (A) Network 10 is derived from adenoma nitroproteomic data and function in cancer, cell cycle, reproductive-system disease. A gray node denotes an identified nitroprotein or protein that interact with nitroproteins in our study [4]. (B) Net-work 11 is derived from control nitroproteomic data and function in gene expression, cellular development, connective tissue development and func-tion. A gray node denotes an identified nitroprotein in our studies [5,6]. An orange solid edge denotes a direct relationship between two nodes (molecules: proteins; genes). An orange unsolid edge denotes an indirect relationship between two nodes (molecules: proteins; genes). The various shapes of nodes denote the different functions (Additional file 1, Tables S3 and S4). A curved line means intracellular translocation; a curved arrow means extracellular translocation.
A. Network 10 B. Network 11
Adenoma Control
Enzyme; Peptidase; Kinase; Phosphatase; Cytokine or regulator; Others.Note:

Zhan and Desiderio BMC Medical Genomics 2010, 3:13http://www.biomedcentral.com/1755-8794/3/13
Page 16 of 26
Our nitroproteomics study [4] discovered ninetyrosine-nitrated proteins in human pituitary adenomatissues, and that each tyrosine nitration site is locatedwithin an important protein domain to alter protein func-tions. However, with the formation of ROS and RNS, thein vivo antioxidative mechanism is also initiated againstROS/RNS [47]. The anti-oxidative system includes enzy-matic [superoxide dismutase (CuZnSOD, MnSOD), cata-lase, glutathione peroxidase] and non-enzymatic[Vitamin C, Vitamin E, carotenoids, thiol antioxidants(glutathione, thioredoxin, and lipoic acid), flavonoids,selenium, and others] antioxidants, as well as the antioxi-dant interactions with various regulatory factors such asNF-κB, AP-1, and Nrf2 [47]. Copper- and zinc-containingsuperoxide dismutase (CuZnSOD) in most parts of cellsand manganese-containing superoxide dismutase(MnSOD) in the mitochondrial matrix can effectivelyscavenge the superoxide radicals to generate H2O2 [48-50], which is removed by peroxiredoxins (thioredoxin-dependent peroxidase enzymes) and GPX's (glutathioneperoxidases) [51,52]. The decrease or deficiency of theactivities of those antioxidative enzymes could contributeto tumorigenesis [52,53]. Studies show that the content ofCuZnMOD is markedly higher in normal cells than inpituitary adenoma cells [54]. Pivotal to the antioxidantresponse is the transcription factor Nrf2 (nuclear factor-E2-related factor-2) that is mainly located in the cyto-plasm under basal conditions [55]. Under oxidative stressderived from the accumulation of ROS [56,57] and RNS[58,59], Nrf2 can quickly translocate into the nucleus andelicit an antioxidant response. Nrf2 signaling is regulatedby multiple components [55,60]. At least four compo-nents in combination [Nrf2, Keap1 (Kelch-like ECH-associated protein 1), a group of small musculoaponeu-
rotic fibrosarcoma (Maf) proteins, and a cis-actingenhancer called antioxidant response element (ARE) orelectrophile responsive element (EpRE)] are essential forthe antioxidant response. The Nrf2 signaling pathway notonly regulates the expression of antioxidative genes, butalso regulates the anti-inflammatory response, the molec-ular chaperone/stress-response system, and the ubiq-uitin/proteasome system [61]. Any decrease in thecapability of this antioxidant protective system couldincrease the susceptibility to oxidative stress, tumorinflammation, carcinogen toxicity, and tumorigenesis.
Our pathway analysis of pituitary adenoma protein-mapping data and DEP's has clearly revealed the oxida-tive stress and Nrf2-mediated oxidative stress-responsepathway (Figures 2, 3, 6, and 7) in pituitary adenomas.Figure 4 presents the canonical pathway of the Nrf2-mediated oxidative-stress response. Therefore, the oxida-tive stress-antioxidative stress-response system is notonly a significant signaling pathway of pituitary adenomaformation, but also those components in this pathwaycould be the novel targets to develop effective therapeuticagents that could be used for human pituitary adenomas[61,62].
Cell-cycle dysregulationThe basic biological characteristics of tumor cells are theunrestricted proliferation and growth compared to nor-mal cells; the latter are in a state of balance betweenrestricted proliferation and apoptosis. This proliferationprocess is controlled by the cell cycle. The cell cycleincludes four phases (G0) G1 T S T G2 T M T G1 (G0)that will make the cell grow, replicate their genome, anddivide; this cycle is regulated by a cyclically operating bio-chemical system that includes cyclins, cyclin-dependent
Table 3: Signaling Pathway Networks that Involve Nitroproteomic Data From Pituitary Adenoma and Control.
Networks Nodes (genes; proteins) in Network Score Nodes Identified Nodes (Nitroproteins)
Top Functions
10 (Adenoma) ARHGAP5, beta-estradiol, FAM105B, GNL1, GRIP2, H2-Q4, Histone h3, IFI203, IL17B, IL17C, IL1B, IL1F5, IL1F6, IRAK2, IRG1, MAPK11 PREDICTED, MHC CLASS I D2D ANTIGEN, MMD, NFRKB, PCDH7, Pka, PLD3, PRKAR1B, PSMA2, RAB32, RHOA, RHPN2, SCUBE2, TM4SF1, TNF, TPD52L2, TWIST2, UBB, UBC, ZNF267
24 35 9 Cancer, Cell Cycle, Reproductive System Disease
11 (Control) ACTA2 (includes EG:59), ACTC1, ACTG2, Actin, BCL2, beta-estradiol, BMF, CAP2, ELK1, EPS8L2, ESPN, F Actin, FCAR, FEZ2, FOS, GAK, GZMC, KLK11, KRT81 (includes EG:3887), LIMA1, MBOAT5, MSMB, PAQR3, PDZK1IP1, PRKG2, PRPS1, PSMA2, PTPRK, RAB31, RPN2, SELENBP1, SNAP91, STC1, TGFB1, TMOD3
26 35 9 Gene Expression, Cellular Development, Connective Tissue Development and Function

Zhan and Desiderio BMC Medical Genomics 2010, 3:13http://www.biomedcentral.com/1755-8794/3/13
Page 17 of 26
kinases (CDK), and their inhibitors (CDKI) [63]. TheCDKI families mainly include the INK family (INK4a/p16, INK4b/p15, INK4c/p18, and INK4d/p19) and theWAF/KIP family (WAF1/p21, KIP1/p27, and KIP2/p57).The progression through a cell cycle is mainly regulatedby the fluctuations in the concentration of cyclins and
CDKI that is achieved through the programmed degrada-tion of these proteins by the proteolysis within the ubiq-uitin-proteasome system [64]. Cyclin D1 is expressed atthe G0/G1 transition, and is involved in the regulation ofprogression through G1 into the S phase. Cyclin E expres-sion occurs at the beginning of G1, maximizes at the G1/
Figure 11 Significant canonical pathways that are involved with pituitary adenoma nitroproteins.
Hepatic cholestasis
p38 MAPK signaling
Protein ubiquitination pathway
Sonic Hedgehog signaling
Cell cycle G2/M DNA damage checkpoint regulation
GABA receptor signaling
Toll-like receptor signaling
Amyloid processing
Phototransduction pathway
Sphingolipid metabolism
IL-10 signaling
Hypoxia signaling in the cardiovascular system
LXR/RXR activation
PXR/RXR activation
Nitric oxide signaling in the cardiovascular system
Dopamine receptor signaling
BMP signaling pathway
TGF-� signaling

Zhan and Desiderio BMC Medical Genomics 2010, 3:13http://www.biomedcentral.com/1755-8794/3/13
Page 18 of 26
S transition, is degraded at the beginning of the S phase,and is involved in DNA replication. Cyclins D and E, incombination with CDKs/CDKI, regulate the G1 and Sphases to prepare for cell division. Cyclin A accumulatesin late G1, maximizes during the S phase, and is degradedin the M phase. Cylin B is necessary for the transitionfrom G2 to mitosis. Studies have demonstrated that theectopic expression of cyclin D and the overexpresion ofCyclins A, B, and E occur in a pituitary adenoma to regu-late different phases of the cell cycle, and to accelerate theprogression of the cell-cycle [63]. The overexpressedpituitary tumor-transforming gene (PTTG), as an earlychange in pituitary tumorigenesis, is also dependent onthe cell cycle; PTTG expression is low at the G1/S border,gradually increases during the S phase, peaks at the G2/M, and is attenuated as the cells enter G1 [65]. The detailson cell-cycle dysregulation in a human pituitary adenomahave been reviewed [64,66-68].
The pathway analysis of our pituitary adenoma nitrop-roteomic data clearly revealed the cell-cycle G2/M DNAdamage checkpoint-regulation pathway in human pitu-itary adenomas (Figure 11). Additional file 2, Figure S3.4shows the canonical pathway of the cell-cycle G2/M DNAdamage checkpoint regulation. DEP data clearly demon-strate that the important cell-cycle regulator 14-3-3 pro-tein was down-regulated (44-fold) in pituitary adenomas
compared to controls (Additional file 1, Table S2). More-over, our nitroproteomic data demonstrate that a nitratedproteasome could interfere with the functions of theubiquitin-proteasome system in the regulation of the cellcycle. Thus, oxidative/nitrative stress is also involved inthe cell-cycle dyregulation in human pituitary adenomas.Furthermore, those components that regulate the cellcycle could be the novel targets for the development of aneffective pituitary adenoma therapy; for example, the pro-teasome inhibitors can induce apoptosis in growth hor-mone-and prolactin-secreting rat pituitary tumor cellsthrough a blocking of the cell cycle at the G2/M transi-tion [69].
MAPK signaling abnormalityMitogen-activated protein kinase (MAPK) signalingpathways play prominent roles in the between- andwithin-cell communications in normal cells and cancercells [70]. Those pathways link the extracelluar signals(stimuli such as growth hormone, growth factor, mito-gens, cytokines, stress, etc.) to the functional cellular pro-cesses such as growth, profliferation, migration, andapoptosis. The basic MAPK pathway is stimulus (mito-gens, growth factors, cytokines, stress, etc.) T G-protein(Ras, Rac, Cdc42, Rho) T MAPKKK (Raf, Tpl2, MEKK,MLK, TAK, ASK, TAO) T MAPKK (MEK) T MAPK
Figure 12 Significant toxicological events that are involved with pituitary adenoma nitroproteins. Red bar = nitrated proteins, green bar = unnitrated proteins, grey bar = no change, white bar = no overlap with dataset.
Ratio ( ) -log(p-value) ( )
Hepatic cholestasis
PXR/RXR activation
LXR/RXR activation
TGF-� signaling
FXR/RXR activation
Mechanism of gene regulation by peroxisome proliferators via PPARa
RAR activation
PPARa/RXR activation
Oxidative stress response mediated by Nrf2

Zhan and Desiderio BMC Medical Genomics 2010, 3:13http://www.biomedcentral.com/1755-8794/3/13
Page 19 of 26
(ERK, JNK, P38) to generate responses (proliferation, dif-ferentiation, apoptosis, and migration). ERKs (extracellu-lar signal-regulated kinases), JNKs (c-Jun N-terminalkinases), and p38-MAPKs are the three main subfamiliesof MAPKs. ERK 1/2 are activated by MEK1/2, which areactivated by Raf, Ras, and growth factors or mitogens; Raf
activity, as the main effector of Ras, is suppressed bycyclic AMP-dependent kinase (PKA) in a normal cell[71]. JNKs are activated by MEK4/7, and p38-MAPKs areactivated by MEK3/4/6. The upstream signal of MEK3/4/6/7 is from Rac, Rho, cdc42, cytokines, or stresses. ERKsfunction in the control of cell division. JNKs are critical
Figure 13 p38 MAPK signaling pathway that is involved with pituitary adenoma nitroproteins. A gray label denotes an identified protein. The various shapes of nodes denote the different functions. A duplicated shape means this node contains multiple components. An arrow denotes the pathway direction. A line with a small circle denotes a biological result.
p38 MAPK signaling
Enzyme Kinase Phosphatase
Cytokine or regulator Others
Note:

Zhan and Desiderio BMC Medical Genomics 2010, 3:13http://www.biomedcentral.com/1755-8794/3/13
Page 20 of 26
regulators of transcription, and have the ability to pro-mote apoptosis; however, the activation of nuclear factorkappa B (NF-κB) signaling can lead to the suppression ofapoptosis. JNK and NF-κB signaling often play opposingroles in cancer. The activation of NF-κB is required tosuppress JNK-activated apoptosis during tumorigenesis[72,73]. The p38-MAPKs are strongly activated by
inflammatory cytokines and environmental stresses, andp38 is required for the expression of TNFα and interleu-kin-1 during tumor inflammatory responses. p38 canfunction as a tumor suppressor; a decrease of p38 activitysignificantly contributes to tumorigenesis [74]. Recentfindings show that the cancerous mutations in MAPKpathways frequently affect Ras and B-raf. Ras/Raf muta-
Figure 14 Significant canonical pathways that are involved with control pituitary nitroproteins.
Clatrin-mediated endocytosis
Caveolar-mediated endocytosis
VEGF-signaling
Regulation of actin-based motility by Rho
Fcy receptor-mediated phagocytosis in
macrophages and monocytes
Tight junction signaling
NRF2-mediated oxidative stress response
Leukocyte extravasation signaling
Integrin signaling
Actin cytoskeleton signaling
Calcium signaling
Nitric oxide signaling in the cardiovascular
system
Hepatic Fibrosis / Hepatic stellate cell activation
Synaptic long term depression
Protein ubiquitination pathway

Zhan and Desiderio BMC Medical Genomics 2010, 3:13http://www.biomedcentral.com/1755-8794/3/13
Page 21 of 26
tion-activated pathways are important for cell survivaland proliferation, whereas stress-activated pathways suchas JNK and p38 largely seem to counteract malignanttransformation. The balance and integration amongthose signal pathways could significantly contribute totumorigenesis and to any response to drug therapy. Thedetails of MAPK signaling pathways in cancer arereviewed [70,75,76]. The MAPK pathways are emergingas potential therapeutic targets for cancer [77,78], and thedevelopment of inhibitors of MAPK pathways has agrowing importance in cancer therapy.
The pathway analyses of our pituitary adenoma pro-teomic data clearly demonstrate that MAPK signalingpathways are involved in pituitary tumorigenesis. Theprotein-mapping data of pituitary adenomas show thatERK (Figure 1A), NFkB and F-protein (Figure 1B),MAPK, Ras, PKC and PI3K (Figure 1C), and JNK andp38-MAPK (Figure 1E) are the key nodes in their path-way networks. The comparative proteomic data showthat Ras, ERK, JNK, p38-MAPK and Akt (Figure 5A),TNF and TGFb1 (Figure 5B), and MAPK and NFkB (Fig-ure 5C) are the key nodes in their pathway networks; andthat ERK/MAPK signaling (Figure 6) is the significantcanonical pathway in adenomas.
The nitroproteomic data of human pituitary adenomasshow that TNF and IL1B (Figure 10A) are the key nodesin their pathway networks; and that p38-MAPK signaling(Figure 11) is the significant canonical pathway that par-ticipates in an oxidative-stress response in an adenoma.The nitroproteomic data of human pituitary controlsshow that TGFb1 (Figure 10B) is the key node in its path-way network. Moreover, the PKA type I beta regulatorysubunit is nitrated in human pituitary adenomas (Figure10A; Additional file 1, Table S3), and that tyrosine nitra-tion occurs within the dimerization region [4]; thosenitrations could interfere with dimerization and affectPKA activity to suppress Raf activity. Figure 9 shows thecanonical pathway of ERK/MAPK signaling, and Figure13 the canonical pathway of p38 MAPK signaling. Studieshave demonstrated the altered Gs and adenylate cyclaseactivity in human GH-secreting pituitary adenomas [79],Gsα and Giα mutations in clinically nonfunctioning pitu-itary adenomas [80], and an H-ras mutation in a singleaggressive prolactinoma or metastases from pituitary car-cinomas [81]. Recent studies demonstrate that an overex-pression of B-Raf mRNA and protein is a feature ofnonfunctional pituitary adenomas; that overactivity high-lights an overactivity of the Ras-B-Raf-MAP kinase path-way to promote pituitary tumorigenesis [82], and that thelow levels of Raf kinase inhibitory protein (RKIP) in aGH-pituitary adenoma correlate with poor clinicalresponse to somatostatin analog therapy because RKIPcan bind to and inhibit Raf1 kinase to attenuate MAPKsignaling [83]. The antiproliferative effect of somatostatin
analogs involves the upregulation of p27 and downregu-lation of the MAPK pathway in human somatotrophino-mas [84]. Furthermore, studies demonstrate thatdopamine induces an anti-proliferative effect and celldeath via the dopamine D2 receptors, by means of thep38 MAPK and ERK pathways that involve oxidativestress, in pituitary tumor cells [85]. Those data confirmthat ERK-MAPK and p38-MAPK signaling pathways sig-nificantly function in human pituitary adenomas.Strength and limitationThe strength of this study is (i) that, towards our long-term goals to clarify the molecular mechanism that areinvolved in pituitary adenoma pathogenesis and to dis-cover tumor biomarkers, a series of human pituitary pro-teomic expression data (protein-mapping data,comparative proteomic data, and nitroprotemic data)were established; four important significant signal path-way networks that were derived from those proteomicexpression data were discovered, including mitochondrialdysfunction, oxidative stress, cell-cycle dysregulation,and the MAPK signaling system; knowledge of those sig-nal pathway networks will provide important clues andclear directions for our next step, an in-depth investiga-tion of pituitary adenomas, for the discovery of tumorbiomarkers, and for the development of efficacious thera-peutic targets and drugs; (ii) that all protein data wereconfirmed with a "gold standard" tandem mass spectrom-etry-based amino acid sequence; and comparative pro-teomic data were confirmed with comparativetranscriptomic data [2,3]; (iii) that signal pathway net-works derived from protein-mapping data provide thebaseline data; comparative proteomic data that areinvolved in pathway networks reveal the protein expres-sion change in the pathway networks to clarify the role ofpathway networks in the pituitary pathogenesis; andnitroproteomic data reveal the role of oxidative stress insignal pathways that are related to pituitary pathogenesis.
We realize a potential limitation of this study - a normalpituitary is an admixture of at least six pituitary cell types,whereas pituitary adenomas are generally an expandedclone of a single cell type, as described in our previouspublication [86]. This factor is a common problem withany human post-surgical tissue study. Enrichment of asingle cell type of pituitary cells (such as with laser-cap-ture microdissection, LCM) in our next in-depth investi-gation would be an effective method to resolve thatpotential limitation when the LCM-sensitivity problem isovercome for pituitary protein analysis.Statistical consideration and biological significanceThe objective of this study is to discover significant signalpathways or pathway networks from pituitary adenomaprotein-mapping data, comparative proteomic data, andnitroproteomic data. The Fisher's exact test that is con-tained in the IPA program was used to uncover any statis-

Zhan and Desiderio BMC Medical Genomics 2010, 3:13http://www.biomedcentral.com/1755-8794/3/13
Page 22 of 26
tically significant pathways or networks with asignificance level of 0.05. For those four protein datasetsin this study: we identified 37 significant canonical path-ways and 6 pathway networks derived from our protein-mapping dataset, 9 significant canonical pathways and 3pathway networks derived from our comparative pro-teomic dataset, 12 significant canonical pathways and 1pathway network derived from our qualitative nitropro-teomic dataset in adenomas, and 12 significant canonicalpathways and 1 pathway network derived from our quali-tative nitroproteomic dataset in controls.
No multiple-test correlation and significance level of0.01 or 0.001 was used for this study based on two rea-sons: (1) a multiple-test correlation and significance levelof 0.01 or 0.001 are more stringent criteria. Althoughthose two parameters can reduce the probability of falsepositives, they also result in the loss of any biologicallymeaningful information. For example, if we use the sig-nificance level of 0.001 [or -log (0.001) = 3], then therewill be 7 statistically significant canonical pathways (Fig-ure 2) and 4 significant toxicological events (Figure 3)that derived from protein-mapping data; no significantcanonical pathways (Figure 6) and no significant toxico-logical events (Figure 7) from comparative proteomicsdata; 1 significant canonical pathway (Figure 11) and 1significant toxicological event (Figure 12) from adenomanitroproteomic data; and 10 significant canonical path-ways (Figure 14) from normal pituitary nitroproteomicdata. In fact, many biologically significant DEPs (Addi-tional file 1, Table S2) are derived from important path-ways. Also, in Figure 11, more stringent criteria simplyresult in a significant canonical pathway - hepaticcholestasis; however, this pathway does not have muchbiologically meaning for pituitary adenomas. On theother hand, the canonical pathways p38 MAPK signaling,cell-cycle G2/M DNA damage-checkpoint regulation,and protein-ubiquitination pathways (Figure 11) wererecognized as statistically significant with a significancelevel of 0.05, which can be reasonably linked to the realpituitary adenoma biological processes (describedabove). (2) Any statistical result is only a reference forbiological significance. A statistically significant resultmust be reasonably interpreted with corresponding bio-logical processes to decide its biological significance.Some statistically significant results would not have anyreal biological meaning. A typical example is that hemo-globin is often identified as statistically significantbetween tumor and control tissues; however, it cannot beconcluded as biologically meaningful for a pituitary ade-noma because its statistical significance probably derivedfrom blood contamination. The canonical pathwayhepatic cholestasis described above is another example.Moreover, for some cases, there might not be any statisti-cal significance, but those proteins still have biological
significance. For example, some genes have only a smallchange without any significant difference at the genelevel; however, that small change at the gene level couldlead to an amplified change on the protein level. As abiologist, this finding is still an interesting result. There-fore, when one uses a statistically significant pathway andnetwork, one must carefully determine whether it is bio-logically relevant or whether the result really just occursonly by chance.
Based on those statistical considerations, those statisti-cally significant pathways and networks that were gener-ated from the Fisher's exact test with a significance levelof 0.05 were reasonably explained within the pituitaryadenoma biological system. Therefore, four importantbiological systems were discovered for pituitary ade-nomas, including mitochondrial dysfunction, oxidativestress, cell-cycle dysregulation, and the MAPK signalingabnormality. These four biological systems provideimportant clues and a clear direction for our next in-depth studies of pituitary adenomas.
ConclusionsThis present study clarifies pathway networks that func-tion in pituitary adenomas. The results demonstrate thatmitochondria dysfunctions, oxidative stress, cell-cycledysregulation, and the MAPK-signaling system are signif-icantly associated with pituitary adenoma pathogenesis.Further experimental investigation is required to eluci-date the biological consequences of those pathway net-works and their relevance to the pathogenic mechanismsof pituitary adenoma. Those data could provide biomark-ers, and could lead to the development of novel effica-cious targets to treat pituitary adenomas.
MethodsPatients and tumor characterizationFor protein-mapping analysis [1], the pituitary adenomatissue (n = 1; from a black male 54-year-old) from theMemphis Regional Medical Center was used. During sur-gery, the tissue was removed, frozen immediately in liq-uid nitrogen, and stored (-80°C) until analysis.
For comparative proteomics analysis [2,3], 15 pituitarytumors and 8 normal pituitary glands were used (Addi-tional file 1, Table S5). Pituitary tumors (n = 15) wereobtained from patients at the Emory University Hospitalduring transsphenoidal surgery. All tumors were micro-dissected and removed with a surgical microscope, rinsedin sterile saline, snap-frozen in liquid nitrogen, and stored(-80°C) until analysis. Each tumor fragment was con-firmed independently by a neuropathologist as beinghomogenous and unadulterated by histology and immu-nohistochemistry prior to proteomics analysis. Eight con-trol pituitary glands were obtained from the Memphis

Zhan and Desiderio BMC Medical Genomics 2010, 3:13http://www.biomedcentral.com/1755-8794/3/13
Page 23 of 26
regional Medical Center (n = 7) and the National DiseaseResearch Interchange (n = 1).
For nitroproteomics analysis [4-6], the clinically non-functional human pituitary adenoma tissue (n = 1) [4]and the normal pituitary post-mortem tissue (n = 1) [5,6]were used. The pituitary adenoma tissue (n = 1; from awhite male 39-year-old) was obtained from the Universityof Tennessee Baptist Hospital (Memphis, TN, USA);immunohistochemical studies showed that tumor cellswere negative for the expression of FSH, LH, GH, PRL,TSH, or ACTH. During surgery, the tumor tissue wasremoved, frozen immediately in liquid nitrogen, andstored (-80°C) until analysis. The control pituitary tissue(n = 1; from a male 45-year-old, drowning) was obtainedfrom the Memphis Regional Medical Center.
Experimental datasetsThe experimental datasets that were analyzed in thisstudy derived from our published human pituitary ade-noma proteomic data: (i) a protein-mapping dataset thatincludes 111 proteins that were identified with two-dimensional gel electrophoresis (2DGE) and MS [1](Additional file 1, Table S1), (ii) a comparative proteomicdataset that includes 56 DEP's that were identified with2D gel-based comparative proteomics [2,3] (Additionalfile 1, Table S2), (iii) a nitroproteomic dataset thatincludes nine nitroproteins, and three non-nitrated pro-teins that interacted with nitroproteins from a pituitaryadenoma [4], that were identified with nitrotyrosineimmunoaffinity enrichment and tandem mass spectrom-etry (MS/MS) (Additional file 1, Table S3), and eightnitroproteins from a pituitary control that were identifiedwith 2DGE-based nitrotyrosine Western blots and MS/MS [5,6] (Additional file 1, Table S4).
Ingenuity pathway analysisThe SwissProt accession number and gene name wereused as the identifiers of each proteomic dataset. Eachdataset was saved as an Excel file. Each proteomic datasetwith identifier (.xls file) was input into the IPA analysissystem http://www.ingenuity.com with the Core analysisplatform. For the pituitary adenoma protein-mappingdata and nitroprotein data, their Swiss-Prot accessionnumbers in the Excel format were input to the IPA dataupload workflow. For the pituitary adenoma comparativeproteomic data, the Swiss-Prot Accession numbers andthe corresponding fold-change data in the Excel formatwere input to the IPA data upload workflow. The IPA sys-tem will automatically search the matched Gene/mole-cules, and will generate a two-dimensional table-styleformat to show which protein was mapped in the systemfor next-step analysis, and to show the unmapped pro-teins. The unmapped protein's Swiss-Prot accessionnumber will be converted to the corresponding gene
name by searching the ExPASy (Expert Protein AnalysisSystem) proteomics server http://www.expasy.org. AllSwiss-Prot accession numbers in combination with genenames were input to the IPA data upload workflow togenerate the final mapped list for next-step analysis.
The dataset, including mapped IDs (protein and gene),was saved, and automatically generated five subdatasets,including the All IDs (= all input IDs), Unmapped IDs(without the matched molecules in the IPA system,unmapped IDs will not enter the next-step pathway anal-ysis), Mapped IDs (match the corresponding molecules,and recognize the duplicate IDs), Network-eligible IDs (=Mapped IDs - Duplicated IDs), and Functions/Pathways/List-eligible IDs. For the duplicate IDs for the same pro-tein/gene, the identifier with the highest fold-change wasused in the pathway analysis; or, the first instance of theprotein/gene was used in the pathway analysis in theabsence of an expression value such as mapping pro-teomic data and nitroprotein data. Each subdataset con-tained ID, notes, molecules, description, location, type ofbiofunction, and drugs (Additional file 1, Table S1-S4);and the fold-change (Additional file 1, Table S2). Thename of each molecule (gene; protein) appears in thepathway network nodes.
The Network-eligible IDs proceeded into the pathwaynetwork analysis by comparing the network-eligible mol-ecules (genes; proteins) with the Ingenuity PathwaysAnalysis Knowledge Base (IPAKB). IPAKB is a curateddatabase that contains (i) numerous scientific findings (n= ~2.2 million; February 13, 2009) that are extracted fromhundreds of thousands of journal articles, textbooks, andother data sources, and (ii) many canonical pathways (n =235; February 13, 2009) that are constructed from thosescientific findings [87]. The significance (p-values) of theassociation between the dataset and the canonical path-way was measured by comparing the number of use-spe-cific proteins of interest that participate in a givenpathway to the total number of occurrences of thesegenes in all pathway annotations that are stored in theIPAKB. A Fisher's exact test was used to calculate the p-value to determine the probability that the associationbetween the genes in the dataset and the canonical path-way is explained only by chance. The level of statisticalsignificance was set to p < 0.05. Each Pathway analysisgenerated the top networks, biofunctions/Tox functions,and top canonical pathways with a statistical significance(p < 0.05). A toxicity pathway is defined as a canonicalpathway that is significantly associated with toxicity liststhat are functional gene groupings based on critical bio-logical processes and key toxicological responses; andthose toxicity lists describe adaptive, defensive, or repara-tive responses to xenobiotic insult, and could be used tounderstand biological responses.

Zhan and Desiderio BMC Medical Genomics 2010, 3:13http://www.biomedcentral.com/1755-8794/3/13
Page 24 of 26
Additional material
AbbreviationsACTH: adrenocorticotropic hormone; ARE: antioxidant-response element; CDK:cyclin-dependent kinase; CDKI: cyclin-dependent kinase inhibitor; DEP's: differ-entially expressed proteins; 2DGE: two-dimensional gel electrophoresis; EpRE:electrophile-responsive element; ERK: extracellular signal-regulated kinase;FSH: follicle-stimulating hormone, or follitropin; FSHRH: follicle-stimulating hor-mone-releasing hormone; GH: growth hormone; IPA: Ingenuity Pathways Anal-ysis; IPAKB: Ingenuity Pathways Analysis Knowledge Base; JNK: c-Jun N-terminalkinase; Keap1: Kelch-like ECH-associated protein 1; LH: luteinizing hormone, orlutropin; LHRH: luteinizing hormone-releasing hormone; Maf: musculoaponeu-rotic fibrosarcoma; MAPK: mitogen-activated protein kinase; MAPKK: MAPKkinase; MAPKKK: MAPKK kinase; MS: mass spectrometry; MS/MS: tandem massspectrometry; NF-κB: nuclear factor kappa B; NO: nitric oxide; Nrf2: nuclear fac-tor E2-related factor-2; PKA: cyclic AMP-dependent kinase; PRL: prolactin; PTTG:pituitary tumor-transforming gene; RKIP: raf kinase inhibitory protein; RNS:reactive nitrogen species; ROS: reactive oxygen species; SOD: superoxide dis-mutase; TSH: thyrotropin-stimulating hormone, or thyrotropin.
Competing interestsThe authors declare that they have no competing interests.
Authors' contributionsXZ conceived the study design, performed experiments, analyzed the data,and wrote the manuscript. DMD oversaw the experimental results, andreviewed and modified the manuscript. All the authors have read andapproved the final manuscript.
AcknowledgementsThe authors acknowledge the financial support from NIH (RR016679 to DMD), Shainberg Neuroscience Foundation (XZ), and William Webster Endowment Fund (XZ); and Ingenuity for the Ingenuity Pathway Analysis free-trial program, and the constructed canonical pathways.
Author Details1Charles B. Stout Neuroscience Mass Spectrometry Laboratory, University of Tennessee Health Science Center, Memphis, Tennessee, USA, 2Department of Neurology, University of Tennessee Health Science Center, Memphis, Tennessee, USA, 3Clinical and Translational Science Institute, University of Tennessee Health Science Center, Memphis, Tennessee, USA, 4Department of Molecular Science, University of Tennessee Health Science Center, Memphis, Tennessee, USA and 5University of Tennessee Cancer Institute, University of Tennessee Health Science Center, Memphis, Tennessee, USA
References1. Zhan X, Desiderio DM: A reference map of a human pituitary adenoma
proteome. Proteomics 2003, 3(5):699-713.2. Moreno CS, Evans CO, Zhan X, Okor M, Desiderio DM, Oyesiku NM: Novel
molecular signaling and classification of human clinically nonfunctional pituitary adenomas identified by gene expression profiling and proteomic analyses. Cancer Res 2005, 65(22):10214-10222.
3. Evans CO, Moreno CS, Zhan X, McCabe MT, Vertino PM, Desiderio DM, Oyesiku NM: Molecular pathogenesis of human prolactinomas identified by gene expression profiling, RT-qPCR, and proteomic analyses. Pituitary 2008, 11(3):231-245.
4. Zhan X, Desiderio DM: Nitroproteins from a human pituitary adenoma tissue discovered with a nitrotyrosine affinity column and tandem mass spectrometry. Anal Biochem 2006, 354(2):279-289.
5. Zhan X, Desiderio DM: The human pituitary nitroproteome: detection of nitrotyrosylproteins with two-dimensional Western blotting, and amino acid sequence determination with mass spectrometry. Biochem Biophys Res Commun 2004, 325(4):1180-1186.
6. Zhan X, Desiderio DM: Linear ion-trap mass spectrometric characterization of human pituitary nitrotyrosine-containing proteins. Int J Mass Spectrom 2007, 259(1-3):96-104.
7. Pagliarini DJ, Calvo SE, Chang B, Sheth SA, Vafai SB, Ong SE, Walford GA, Sugiana C, Boneh A, Chen WK, Hill DE, Vidal M, Evans JG, Thorburn DR, Carr SA, Mootha VK: A mitochondrial protein compendium elucidates complex I disease biology. Cell 2008, 134(1):112-123.
8. Koene S, Smeitink J: Mitochondrial medicine: entering the era of treatment. J Intern Med 2009, 265(2):193-209.
9. Modica-Napolitano JS, Singh KK: Mitochondria as targets for detection and treatment of cancer. Expert Rev Mol Med 2002, 4(9):1-19.
10. Modica-Napolitano JS, Singh KK: Mitochondrial dysfunction in cancer. Mitochondrion 2004, 4(5-6):755-762.
11. Schapira AH: Mitochondrial dysfunction in neurodegenerative diseases. Neurochem Res 2008, 33(12):2502-2509.
12. Ballinger SW: Mitochondrial dysfunction in cardiovascular disease. Free Radic Biol Med 2005, 38(10):1278-1295.
13. Anderson CM: Mitochondrial dysfunction in diabetes mellitus. Drug Dev Res 1999, 46(1):67-79.
14. Rabinovich RA, Bastos R, Ardite E, Llinas L, Orozco-Levi M, Gea J, Vilaro J, Barbera JA, Rodriguez-Roisin R, Fernandez-checa JC, Roca J: Mitochondrial dysfunction in COPD patients with low body mass index. Eur Respir J 2007, 29(4):643-650.
15. Mabaliraja U, Dinda AK, Kumar S, Roshan R, Gupta P, Sharma SK, Ghosh B: Mitochondrial structural changes and dysfunction are associated with experimental allergic asthma. J Immunol 2008, 181(5):3540-3548.
16. Kroemer G: Mitochondria in cancer. Oncogene 2006, 25(34):4630-4632.17. Halabe Bucay A: The biological significance of cancer: Mitochondria as
a cause of cancer and the inhibition of glycolysis with citrate as a cancer treatment. Med Hypotheses 2007, 69(4):826-828.
18. Goebel HH, Schulz F, Rama B: Ultrastructurally abnormal mitochondria in the pituitary oncocytoma. Acta Neurochir 1980, 51(3-4):195-201.
19. Horoupian DS: Large mitochondria in a pituitary adenoma with hyperprolactinemia. Cancer 1980, 46(3):537-542.
20. Niroi N, Chrousos GP, Kohn B, Lafferty A, Abu-Asab M, Bonat S, White A, Bornstein SR: Adrenocortical-pitutiary hybrid tumor causing Cushing's syndrome. J Clin Endocrinol Metab 2001, 86(6):2631-2637.
21. Yang QH, Xu JN, Xu RK, Pang SF: Inhibitory effects of melatonin on the growth of pituitary prolactin-secreting tumor in rats. J Pineal Res 2006, 40(3):230-235.
22. Saeger W, Ludecke DK, Buchfelder M, Fahlbusch R, Quabbe HJ, Petersenn S: Pathohistological classification of pituitary tumors: 10 years of experience with the German pituitary tumor registry. Eur J Endocrinol 2007, 156(2):203-216.
23. Roncaroli F, Scheithauer BW, Cenacchi G, Horvath E, Kovacs K, Lloyd RV, Abell-Aleff P, Santi M, Yates AJ: 'Spindle cell oncotytoma' of the adenohypophysis: a tumor of folliculostellate cells? Am J Surg Pathol 2002, 26:1048-1055.
Additional file 1 Supplementary Tables. This file contains supplemen-tary tables S1-S5. Supplementary Table S1 shows the protein-mapping data identified from a pituitary adenoma tissue with two-dimensional gel electrophoresis (2DGE) and mass spectrometry. Supplementary Table S2 shows comparative proteomic data identified from human pituitary ade-noma tissues with 2DGE-based comparative proteomics. Supplementary Table S3 shows nitroproteins, and proteins that interact with nitroproteins, identified from a human pituitary adenoma tissue with nitrotyrosine affinity enrichment and tandem mass spectrometry. Supplementary Table S4 shows nitroproteins identified from human pituitary post-mortem control tissue with 2DGE-based nitrotyrosine Western Blot and tandem mass spec-trometry. Supplementary Table S5 shows clinical and pathological char-acteristics of pituitary adenomas and controls used in comparative proteomics study.Additional file 2 Supplementary Figures. This file contains supplemen-tary figures S1-S4. Supplementary Figure S1 shows significant canonical pathways that are involved in human pituitary adenoma mapping pro-teomic data. Supplementary Figure S2 shows significant canonical path-ways that are involved in human pituitary adenoma comparative proteomic data. Supplementary Figure S3 shows significant canonical pathways that are involved in human pituitary adenoma nitroproteomics data. Supplementary Figure S4 shows significant canonical pathways that are involved in human pituitary control nitroproteomics data.
Received: 9 March 2009 Accepted: 28 April 2010 Published: 28 April 2010This article is available from: http://www.biomedcentral.com/1755-8794/3/13© 2010 Zhan and Desiderio; licensee BioMed Central Ltd. This is an Open Access article distributed under the terms of the Creative Commons Attribution License (http://creativecommons.org/licenses/by/2.0), which permits unrestricted use, distribution, and reproduction in any medium, provided the original work is properly cited.BMC Medical Genomics 2010, 3:13

Zhan and Desiderio BMC Medical Genomics 2010, 3:13http://www.biomedcentral.com/1755-8794/3/13
Page 25 of 26
24. John AP: Dysfunctional mitochondria, not oxygen insufficiency, cause cancer cells to produce inordinate amounts of lactic acid: the impact of this on the treatment of cancer. Med Hypotheses 2001, 57(4):429-431.
25. Kluza J, Gallego MA, Loyens A, Beauvillain JC, Sousa-Faro JMF, Cuevas C, Marchetti P, Bailly C: Cancer cell mitochondria are direct proapoptotic targests for the marine antitumor drug lamellarin D. Cancer Res 2006, 66(6):3177-3187.
26. Garber K: Targeting mitochondria emerges as therapeutic strategy. J Natl Cancer Inst 2005, 97(24):1800-1801.
27. Galluzzi L, Larochette N, Zamzami N, Kroemer G: Mitochondria as therapeutic targets for cancer chemotherapy. Oncogene 2006, 25(34):4812-4830.
28. Modica-Napolitano JS, Kulawiec M, Singh KK: Mitochondria and human cancer. Cur Mol Med 2007, 7(1):121-131.
29. Bell EL, Klimova T, Chandel NS: Targeting the mitochondria for cancer therapy: regulation of hypoxia-inducible factor by mitochondria. Antioxid Redox Signal 2008, 10(3):635-640.
30. Tandon VR, Sharma S, Mahajan A, Bardi GH: Oxidative stress: A novel strategy in cancer treatment. J K Science 2005, 7(1):1-3.
31. Toyokuni S: Molecular mechanisms of oxidative stress-induced carcinogenesis: from epidemiology to oxygenomics. IUBMB Life 2008, 60(7):441-447.
32. Halliwell B: Oxidative stress and cancer: have we moved forward? Biochem J 2007, 401(1):1-11.
33. Ceccatelli S, Hulting AL, Zhang X, Gustafsson L, Villar M, Hokfelt T: Nitric oxide synthase in the rat anterior pituitary gland and the role of nitric oxide in regulation of LH secretion. Proc Natl Acad Sci USA 1993, 90(23):11292-11296.
34. Ueta Y, Levy A, Powell MP, Lightaman SL, Kinoshita Y, Yokota A, Shibuya I, Yamashita H: Neuronal nitric oxide synthase gene expression in human pituitary tumours: a possible association with somatotroph adenomas and growth hormone-releasing hormone gene expression. Clin Endocrinol (Oxf ) 1998, 49(1):29-38.
35. Lloyd RV, Jin L, Qian X, Zhang S, Scheithauer BW: Nitric oxide synthase in the human pituitary gland. Am J Pathol 1995, 146(1):86-94.
36. Pawlikowshi M, Winczyk K, Jaranowska M: Immunohistochemical demonstration of nitric oxide synthase (NOS) in the normal rat pituitary gland, estrogen-induced rat pituitary tumor and human pituitary adenomas. Folia Histochem Cytobiol 2003, 41(2):87-90.
37. Kruse A, Broholm H, Rubin I, Schmidt K, Lauritzen M: Nitric oxide synthase activity in human pituitary adenomas. Acta Neurol Scand 2002, 106(6):361-366.
38. Vankelecom H, Matthys P, Denef C: Inducible nitric oxide synthase in the anterior pituitary gland: induction by interferon-r in a subpopulation of folliculostellate cells and in an unidentifiable population of nonhormone-secreting cells. J Histochem Cytochem 1997, 45(6):847-857.
39. Riedel W: Role of nitric oxide in the control of the hypothalamic-pituitary-adrenocortical axis. Z Rheumatol 2002, 59(suppl 2):II-36-II-42.
40. McCann SM, Haens G, Mastronardi C, Walczewska A, Karanth S, Rettori V, Yu WH: The role of nitric oxide (NO) in control of LHRH release that mediates gonadotropin release and sexual behavior. Curr Pharm Des 2003, 9(5):381-390.
41. McCann SM, Karanth S, Mastronardi CA, Dees WL, Childs G, Miller B, Sower S, Yu WH: Control of gonadotropin secretion by follicle-stimulating hormone-releasing factor, luteinizing hormone-releasing hormone, and leptin. Arch Med Res 2001, 32(6):476-485.
42. Pinilla L, Gonzalez LC, Tena-Sempere M, Bellido C, Aguilar E: Effects of systemic blockade of nitric oxide synthases on pulsatile LH, prolactin, and GH secretion in adult male rats. Horm Res 2001, 55(5):229-235.
43. Duvilanski BH, Zambruno C, Seilicovich A, Pisera D, Lasaga M, Diaz MC, Belova N, Rettori V, McCann SM: Role of nitric oxide in control of prolactin release by the adenohypophysis. Proc Natl Acad Sci USA 1995, 92(1):170-174.
44. Pinilla L, Tena-Sempere M, Aguilar E: Nitric oxide stimulates growth hormone secretion in vitro through a calcium- and cyclic guanosine monophosphate-independent mechanism. Horm Res 1999, 51(5):242-247.
45. Cuttica CM, Giusti M, Bocca L, Sessarego P, De Martini D, Valenti S, Spaziante R, Giordano G: Nitric oxide modulates in vivo and in vitro growth hormone release in acromegaly. Neuroendocrinology 1997, 66(6):426-431.
46. Bocca L, Valenti S, Cuttica CM, Spaziante R, Giordano G, Giusti M: Nitric oxide biphasically modulates GH secretion in cultured cells of GH-secreting human pituitary adenomas. Minerva Endocrinol 2000, 25(3-4):55-59.
47. Valko M, Rhodes CJ, Moncol J, Izakovic M, Mazur M: Free radicals, metals and antioxidants in oxidative stress-induced cancer. Chem Biol Interact 2006, 160(1):1-40.
48. Li Y, Huang TT, Carlson EJ, Melov S, Ursell PC, Olson JL, Noble LJ, Yoshimura MP, Berger C, Chan PH, Wallace DC, Epstein CJ: Dilated cardiomyopathy and neonatal lethality in mutant mice lacking mangese superoxide dismutase. Nat Genet 1995, 11(4):376-381.
49. Elchuri S, Oberley TD, Qi W, Eisenstein RS, Jackson RL, Van Remmen H, Epstein CJ, Huang TT: CuZnSOD deficiency leads to persistent and widespread oxidative damage and hepatocarcinogenesis later in life. Oncogene 2005, 24(3):367-380.
50. Melov S, Doctrow SR, Schneider JA, Haberson J, Patel M, Coskun PE, Huffman K, Wallace DC, Malfroy B: Lifepan extension and rescue of spongiform encephalopathy in superoxide dismutase 2 nullizygous mice treated with superoxide dismutasecatalase mimetics. J Neurosci 2001, 21(21):8348-8353.
51. Kang SW, Rhee SG, Chang TS, Jeong W, Choi MH: 2-Cys peroxiredoxin function in intracellular signal transduction: therapeutic implications. Trends Mol Med 2005, 11(12):571-578.
52. Chu FF, Esworthy RS, Chu PG, Longmate JA, Huycke MM, Wilczynski S, Doroshow JH: Bacteria-induced intestinal cancer in mice with disrupted GPx1 and Gpx2 genes. Cancer Res 2004, 64(3):962-968.
53. Neumann CA, Krause DS, Carman CV, Das S, Dubey DP, Abraham JL, Bronson RT, Fujiwara Y, Orkin SH, Van Etten RA: Essential role for the peroxiredoxin Prdx1 in erythrocyte antioxidant defence and tumour suppression. Nature 2003, 424(6948):561-565.
54. Kurisaka M, Nakajo T, Mori K: Immunohistochemical study on the expression of copper and zinc-superoxide dismutase (Cu, Zn-SOD) in human adenohypophysis and pituitary adenomas. No To Shinkei 2004, 46(10):948-954.
55. Li W, Kong AN: Molecular mechanisms of Nrf2-mediated antioxidant response. Mol Carcinog 2009, 48(2):91-104.
56. Osburn WO, Wakabayashi N, Misra V, Nilles T, Biswal S, Trush MA, Kensler TW: Nrf2 regulates an adaptive response protecting against oxidative damage following diquat-mediated formation of superoxide anion. Arch Biochem Biophys 2006, 454(1):7-15.
57. Pi J, Zhang Q, Woods CG, Wong V, Collins S, Anderson ME: Activation of Nrf2-mediated oxidative stress response in macrophages by hypochlorous acid. Toxicol Appl Pharmacol 2008, 226(3):236-243.
58. Dhakshinamoorthy S, Porter AG: Nitric oxide-induced transcriptional up-regulation of protective genes by Nrf2 via the antioxidant response element counteracts apoptosis of neuroblastoma cells. J Biol Chem 2004, 279(19):20096-20107.
59. Mann GE, Rowlands DJ, Li FYL, de Winter P, Siow RCM: Activation of endothelial nitric oxide synthase by dietary isoflavones: Role of NO in Nrf2-mediated antioxidant gene expression. Cardiovasc Res 2007, 75(2):261-274.
60. Dinkova-Kostova AT, Holtzclaw WD, Kensler TW: The role of Keap1 in cellular protective responses. Chem Res Toxicol 2005, 18(12):1779-1791.
61. Yates MS, Kensler TW: Chemopreventive promise of targeting the Nrf2 pathway. Drug News Perspect 2007, 20(2):109-117.
62. Lim JH, Kim KM, Kim SW, Hwang O, Choi HJ: Bromocriptine activates NQO1 via Nrf2-PI3K/Akt signaling: Novel cytoprotective mechanism against oxidative damage. Pharmacol Res 2008, 57(5):325-331.
63. Turner HE, Nagy ZS, Nullivan N, Esiri MM, Wass JAH: Expression analysis of cyclins in pituitary adenomas and the normal pituitary gland. Clin Endocrinol 2000, 53(3):337-344.
64. Musat M, Vax VV, Borboli N, Gueorguiev M, Bonner S, Korbonits M, Grossman AB: Cell cycle dysregulation in pituitary oncogenesis. Front Horm Res 2004, 32:34-62.
65. Yu R, Ren SG, Horwitz GA, Wang Z, Melmed S: Pituitary tumor transforming gene (PTTG) regulates placental JEG-3 cell division and survival: evidence from live cell imaging. Mol Endocrinol 2000, 14(8):1137-1146.
66. Saeger W: Proliferation markers and cell cycle inhibitors in pituitary adenomas. Front Horm Res 2004, 32:110-126.
67. Heaney AP: Pituitary tumour pathogenesis. Br Med Bull 2006, 75-76:81-97.

Zhan and Desiderio BMC Medical Genomics 2010, 3:13http://www.biomedcentral.com/1755-8794/3/13
Page 26 of 26
68. Farrell WE, Clayton RN: Molecular pathogenesis of pituitary tumors. Front Neuroendocrinol 2000, 21(3):174-198.
69. Yu R, Ren SG, Melmed S: Proteasome inhibitors induce apoptosis in growth hormone- and prolactin-secreting rat pituitary tumor cells. J Endocrinol 2002, 174(3):379-386.
70. Dhillon AS, Hagan S, Rath O, Kolch W: MAP kinase signaling pathways in cancer. Oncogene 2007, 26(22):3279-3290.
71. Dumaz N, Hayward R, Martin J, Ogilvie L, Hedley D, Curtin JA, Bastian BC, Springer C, Marais R: In melanoma, Ras mutations are accompanied by switching signaling from BRAF to CRAF and discrupted cyclin AMP signaling. Cancer Res 2006, 66(19):9483-9491.
72. Bubici C, Papa S, Pham CG, Zazzeroni F, Franzoso G: NF-kappa B and JNK: an intricate affair. Cell Cycle 2004, 3(12):1524-1529.
73. Davis RJ: Signal transduction by the JNK group of MAP kinases. Cell 2000, 103(2):239-252.
74. Bulavin DV, Fornace AJ Jr: p38 MAP kinase's emerging role as a tumor suppressor. Adv Cancer Res 2004, 92:95-118.
75. Wada T, Penninger JM: Mitogen-activated protein kinases in apoptosis regulation. Oncogene 2004, 23(16):2838-2849.
76. Johnson GL, Lpadat R: Mitogen-activated protein kinase pathways mediated by ERK, JNK, and p38 protein kinases. Science 2002, 298(5600):1911-1912.
77. English JM, Cobb MH: Pharmcological inhibitors of MAPK pathways. Trends Pharmacol Sci 2002, 23(1):40-45.
78. Olson JM, Hallahan AR: p38 MAP kinase: a convergence point in cancer therapy. Trends Mol Med 2004, 10(3):125-129.
79. Vallar L, Spada A, Giannattasio G: Altered Gs and adenylate cyclase activity in human GH-secreting pituitary adenomas. Nature 1987, 330(6148):566-568.
80. Willamson EA, Daniels M, Foster S, Kelly WF, Kendall-Taylor P, Harris PE: Gsα and Gi2α mutations in clinically nonfunctioning pituitary tumors. Clin Endocrinol (Oxf ) 1994, 41(5):815-820.
81. Karga HJ, Alexander JM, Hedley-Whyte ET, Klibanski A, Jamesom LJ: Ras mutations in human pituitary tumors. J Clin Endocrinol Metab 1992, 74(4):914-919.
82. Ewing I, Pedder-Smith S, Franchi G, Ruscica M, Emery M, Vax V, Garcia E, Czirjak S, Hanzely Z, Kola B, Korbonits M, Grossman AB: A mutation and expression analysis of the oncogene BRAF in pituitary adenomas. Clin Endocrinol (Oxf ) 2007, 66(3):348-352.
83. Fougner SL, Bollerslev J, Latif F, Hald JK, Lund T, Ramm-Pettersen J, Berg JP: Low levels of raf kinase inhibitory protein in growth hormone-secreting pituitary adenomas correlate with poor response to octreotide treatment. J Clin Endocrinol Metab 2008, 93(4):1211-1216.
84. Hubina E, Ruscica M, Nanzer AM, Czirjak S, Goth MI, Grossman AB, Korbonits M: Novel molecular aspects of pituitary adenomas. J Endocrinol Invest 2005, 28(11 Suppl International):87-92.
85. An JJ, Cho SR, Jeong DW, Park KW, Ahn YS, Baik JH: Anti-proliferative effects and cell death mediated by two isoforms of dopamine D2 receptors in pituitary tumor cells. Mol Cell Endocrinol 2003, 206(1-2):49-62.
86. Zhan X, Desiderio DM: Comparative proteomics analysis of human pituitary adenomas: current status and future perspectives. Mass Spectrom Rev 2005, 24(6):783-813.
87. Bordignon J, Probst CM, Mosimann ALP, Pavoni DP, Stella V, Buck GA, Satproedprai N, Fawcett P, Zanata SM, de Noronha L, Krieger MA: Expression profile of interferon stimulated genes in central nervous system of mice infected with dengue virus type-1. Virology 2008, 377(2):319-329.
Pre-publication historyThe pre-publication history for this paper can be accessed here:http://www.biomedcentral.com/1755-8794/3/13/prepub
doi: 10.1186/1755-8794-3-13Cite this article as: Zhan and Desiderio, Signaling pathway networks mined from human pituitary adenoma proteomics data BMC Medical Genomics 2010, 3:13


![MR Imaging of Cavernous Sinus Involvement by Pituitary ...€¦ · abnormal pituitary gland and sellar region [13-16], only a few anecdotal cases of CSI by a pituitary adenoma have](https://img.dokumen.tips/doc/110x75/5ed565c51d25941f923a987c/mr-imaging-of-cavernous-sinus-involvement-by-pituitary-abnormal-pituitary-gland.jpg)